fiscal year 2020 report to congress u.s. government non
TRANSCRIPT

U.S. Government Non-Tax U.S. Government Non-Tax Receivables and Debt Collection Receivables and Debt Collection Activities of Federal Agencies Activities of Federal Agencies
DDepepaarrttmmeenntt ooff tthhe e TTrreeaassuurryy
FISCAL YEAR FISCAL YEAR 20202020 REPORT TO CONGRESSREPORT TO CONGRESS
August 2021
washington, dcwashington, dc
I am pleased to present the Fiscal Year 2020 Report to Congress on United States Government Receivables and Debt Collection Activities of Federal Agencies. This annual report provides important information to the American public on the status and collection of the federal government’s non-tax receivables (current and delinquent).
At the end of fi scal year (FY) 2020, the outstanding amount of non-tax receivables owed to the United States was $2.0 trillion. These receivables included loans to students, small business owners, homeowners, farmers, and veterans. They also included administrative non-tax receivables, including fi nes and penalties, overpayments, and fees.
Federal agencies normally face many challenges collecting and resolving debts, but FY 2020 was especially challenging due to the COVID-19 pandemic and federal actions taken to provide relief to the Americans aff ected. Congress authorized new lending programs that signifi cantly increased the government’s outstanding receivables, and many federal and state agencies took the unprecedented step of implementing wide-spread and long-term suspensions of collection activity. In addition, the Department of the Treasury’s Bureau of the Fiscal Service (Fiscal Service) exempted Social Security benefi t payments from off set to collect delinquent federal non-tax debts from March 2020 through September 2020.
Most citizens pay their debts on time. However, at the end of FY 2020, delinquent non-tax debt owed to the federal government totaled $207.6 billion, a decrease of $12.1 billion (6 percent) from FY 2019. The collection of delinquent debts helps fund government operations, maintain key programs, and reduce the federal defi cit. So, it is very important to continually fi nd ways to cost-eff ectively collect the delinquent debt owed to the government while, at the same time, providing debtors with due process and the opportunity to repay debt in accordance with their fi nancial ability.
In FY 2020, federal creditor agencies collected $23.0 billion of delinquent non-tax debt, a 15 percent decline compared to FY 2019. Of this amount, Fiscal Service collected $4.3 billion in delinquent federal non-tax debt on behalf of federal agencies through its delinquent debt collection programs. Additionally, Fiscal Service collected $6.4 billion in delinquent tax and non-tax debts on behalf of state agencies and federal tax debts on behalf of the Internal Revenue Service. Fiscal Service continues to collaborate with federal and state agencies to maximize collections and resolve those debts for which collection is not possible because of a debtor’s circumstances.
David A. Lebryk

CONTENTSCONTENTS
A Message from the Fiscal Assistant Secretary
I. INTRODUCTION ..............................................................................................................................................................1 II. FEDERAL NON-TAX RECEIVABLES OWED TO THE UNITED STATES ........................................................2 A. Total Federal Non-Tax Receivables ...........................................................................................................................2 B. By Creditor Agency .....................................................................................................................................................4 C. By Receivable Type .....................................................................................................................................................5 D. Interest, Penalties, and Administrative Costs ..........................................................................................................5
III. DELINQUENT FEDERAL NON-TAX DEBT OWED TO THE UNITED STATES .............................................6 A. Total Delinquent Federal Non-Tax Debt ...................................................................................................................6 B. By Age ...........................................................................................................................................................................7 C. By Creditor Agency .....................................................................................................................................................8 D. By Debt Type ................................................................................................................................................................9
IV. DELINQUENT FEDERAL NON-TAX DEBT COLLECTION ACTIVITIES .....................................................10 A. Total Delinquent Federal Non-Tax Debt Collection ................................................................................................10 B. By Creditor Agency ...................................................................................................................................................10 1. Administrative Wage Garnishment .....................................................................................................................11 2. Private Collection Agencies ..................................................................................................................................11 C. Centralized Government-Wide Debt Collection Programs ..................................................................................12 1. Treasury’s Cross-Servicing Program Collections ..............................................................................................12 2. Treasury Off set Program Collections .................................................................................................................12 3. Enforced Collection by the Department of Justice ............................................................................................13 4. Department of Health and Human Services’ Program Support Center .........................................................14
V. WRITE-OFFS OF DELINQUENT FEDERAL NON-TAX DEBT ...........................................................................15 APPENDICES Appendix I: Total Federal Non-Tax Receivables by Creditor Agency ......................................................................16 Appendix II: Total FY 2020 Collection of Delinquent Federal Non-Tax Debt by Creditor Agency ......................17 Appendix III: Total FY 2020 Write-Off s and Close Outs by Creditor Agency .......................................................18 Appendix IV: TOP Collections Including Debts Owed to the Internal Revenue Service and State Agencies ......19 Appendix V: Compliance with 120-Day Delinquent Debt Referral Requirement ...................................................21 Appendix VI: Payments Exempted from Centralized Administrative Off set by the Secretary of the Treasury .24 Appendix VII: Sources of Data .....................................................................................................................................25
ENDNOTES .........................................................................................................................................................................27
FISCAL YEAR 2020 REPORT TO CONGRESS:U.S. GOVERNMENT NON-TAX RECEIVABLES AND
DEBT COLLECTION ACTIVITIES OF FEDERAL AGENCIES

1 FY 2020 REPORT TO CONGRESS: U.S. GOVERNMENT NON-TAX RECEIVABLES AND DEBT COLLECTION ACTIVITIES OF FEDERAL AGENCIES
I. I. IntroductionIntroduction
The Secretary of the Treasury (Secretary) reports to Congress annually on the federal government’s non-tax receivables and debt collection activities. As required by federal law, this report includes information that federal creditor agencies provide to the Secretary on the status of their accounts receivable, as reported in the Treasury Report on Receivables and Debt Collection Activities (TROR).1 Information about the federal government’s management of receivables is available to the public on the Fiscal Data website. This website provides the public with easy-to-understand data about the federal government’s fi nances.
Based on policies from Congress and the President, federal creditor agencies make loans to borrowers, guarantee loans made by private lending institutions, and impose fi nes and penalties. These activities result in the creation of accounts receivable as assets of the government. In addition, federal creditor agencies award grants, make payments, and provide other services. These activities, in certain circumstances, also can result in the creation of accounts receivable.
At the end of FY 2020, the federal government’s outstanding non-tax receivables totaled $2.0 trillion, an increase of $245.9 billion (14 percent) from FY 2019. A receivable is current when it is not yet due for payment or is being repaid as agreed. When the government’s receivables are not paid by the due date, they generally become delinquent debt. At the end of FY 2020, delinquent non-tax debt owed to the United States totaled $207.6 billion, a decrease of $12.1 billion (6 percent) from FY 2019.
Each federal creditor agency is required to make every reasonable eff ort to collect its receivables. At the end of FY 2020, collections of federal non-tax receivables totaled $331.5 billion, a decrease of $8.3 billion (2 percent).2 Fiscal Service and the Department of Justice (DOJ) share the responsibility for setting government-wide policy on non-tax debt collection, and each plays a major role in the centralized collection of delinquent non-tax debt. In FY 2020, federal creditor agencies collected $23.0 billion of delinquent non-tax debt, a decrease of $4.1 billion (15 percent) from FY 2019.
This report provides summary data on the value of receivables owed to the federal government, the portion of those receivables that are delinquent, and eff orts to collect or write-off delinquent debt. The report provides comparative information from previous fi scal years to FY 2020, and information on specifi c aspects of government-wide non-tax receivables and debt collection activities.3
Note: Delinquencies and collections result from various events and conditions that can occur over multiple reporting periods. For example, depending on the structure of repayment terms, the date that a receivable is due may be in the same fi scal year that it is recorded or it may be due in a future fi scal year. Similarly, collections during FY 2020 may be associated with non-tax debt that became delinquent either in FY 2020 or in a prior year. Therefore, use caution when comparing annual totals and year-over-year changes of receivables, delinquencies, and collections. Dollar fi gures in this report have been rounded to the tenth decimal point. Percentage changes are calculated based on the rounded dollar fi gures.

2FY 2020 REPORT TO CONGRESS: U.S. GOVERNMENT NON-TAX RECEIVABLES AND DEBT COLLECTION ACTIVITIES OF FEDERAL AGENCIES
II. II. Federal Non-Tax Receivables Owed to the United StatesFederal Non-Tax Receivables Owed to the United States
A. Total Federal Non-Tax ReceivablesFederal non-tax receivables are amounts owed to the federal government by a person (e.g., an individual, organization, or other entity). Receivables are categorized as being current or delinquent. Delinquent receivables are also referred to as delinquent debts.
At the end of FY 2020, total federal non-tax receivables owed to the United States totaled $2.0 trillion, an increase of $245.9 billion (14 percent) from FY 2019. The total outstanding receivable balance at the end of a fi scal year is the net of receivables that remained unpaid from prior fi scal years and new receivables recorded during that fi scal year, less collections, adjustments, and amounts written off and closed out.
New federal non-tax receivables recorded as of the end of FY 2020 totaled $578.0 billion, an increase of $168.4 billion (41 percent)4 from FY 2019. Collection of federal non-tax receivables in FY 2020 was $331.5 billion, a decrease of $8.2 billion (2 percent) from FY 2019.
2016 2017 2018 2019 2020$ 1,100
$ 1,200
$ 1,300
$ 1,400
$ 1,500
$ 1,600
$ 1,700
$ 1,800
$ 1,900
$ 2,000
$1,519.6
$1,412.2
Outstanding Federal Non-Tax Receivables: FY 2016–2020(Dollars in Billions)
Fiscal Year
Dol
lars
in
Bi
llion
s
$1,722.9
$1,616.3
$1,968.8
figure 1
: — 2016—2020

3 FY 2020 REPORT TO CONGRESS: U.S. GOVERNMENT NON-TAX RECEIVABLES AND DEBT COLLECTION ACTIVITIES OF FEDERAL AGENCIES
: D D ( )— 2016–2020
: — 2016–2020
2016 2017 2018 2019 2020$ 0
$ 50
$ 100
$ 150
$ 200
$ 250
$ 300
$ 350
$ 400
$ 450
$337.4$310.4
Total Collection on Federal Non-Tax Receivables: FY 2016–2020 (Dollars in Billions)
Fiscal Year
Dol
lars
in
Bi
llion
s
$337.8 $339.7$331.5
figure 3
figure 2
2016 2017 2018 2019 2020$ 150
$ 200
$ 250
$ 300
$ 350
$ 400
$ 450
$ 500
$ 550
$ 600
$421.1
$531.9
New Federal Non-Tax Receivables: FY 2016–2020(Dollars in Billions)
Fiscal Year
Dol
lars
in
Bi
llion
s
$395.1 $409.7
$578.0

4FY 2020 REPORT TO CONGRESS: U.S. GOVERNMENT NON-TAX RECEIVABLES AND DEBT COLLECTION ACTIVITIES OF FEDERAL AGENCIES
B. By Creditor AgencyAt the end of FY 2020, receivables owed to the Department of Education (Education)5, Small Business Administration (SBA), and the Department of Agriculture (USDA) accounted for $1.8 trillion (93 percent) of the government’s total outstanding federal non-tax receivables.
In FY 2020, Education, the Department of Health and Human Services (HHS), USDA, the Department of Housing and Urban Development (HUD), and the Department of Defense (DoD), collected a combined $216.6 billion (65 percent) in federal non-tax receivables.
: — 2019–2020
: - 2019–2020
4
FY 2020
Total Government
All Others
Department of Health and Human Services
Department of Housing and Urban Development
Department of Education
Department of Agriculture
Agency
FY 2019 to FY 2020 Percentage Change in Outstanding Federal Non-Tax Receivables:6 FY 2020 Top Five Federal Creditor Agencies
(Dollars in Billions)
% Change from FY 2019 to FY 2020
$1,365.0 4.8%
$13.4 1,324.6%
$115.2 4.7%
$55.6 14.2%
$31.9 -6.3%
$141.8 -5.8%
$1,722.9
FY 2019
$1,430.3
$190.9
$120.6
$63.5
$29.9
$133.6
$1,968.8 14.3%
Small Business Administration
FY 2020Agency
Department of EducationDepartment of Health and
Human Services
Department of Defense
Department of Agriculture
Department of Housing and Urban Development
FY 2019 to FY 2020 Percentage Change in Collection of Federal Non-Tax Receivables: FY 2020 Top Five Federal Creditor Agencies
(Dollars in Billions)
% Change from FY 2019 to FY 2020
$81.5 -23.5%
$80.4 4.4%
$28.8 18.5%
$14.7 1.4%
$11.2 -26.3%
All Others
Total Government
$114.9 12.4%
$331.5
FY 2019
$106.5
$77.0
$24.3
$14.5
$15.2
$102.2
$339.7 -2.4%
5

5 FY 2020 REPORT TO CONGRESS: U.S. GOVERNMENT NON-TAX RECEIVABLES AND DEBT COLLECTION ACTIVITIES OF FEDERAL AGENCIES
C. By Receivable TypeOf the $2.0 trillion in federal non-tax receivables outstanding (both current and delinquent) in FY 2020, federal loan receivables (direct loans and defaulted guaranteed loans) represented $1.9 trillion (95 percent) of total outstanding receivables. Receivables attributable to direct loans and defaulted guaranteed loans increased by $250.5 billion (16 percent) from FY 2019 to FY 2020. Administrative receivables (all non-loan receivables)10
represented $103.3 billion of the total outstanding receivables at the end of FY 2020, a decrease of $4.6 billion (4 percent) from FY 2019.
D. Interest, Penalties, and Administrative CostsGenerally, federal creditor agencies assess interest on outstanding loan receivables. Federal creditor agencies also are generally required to assess interest, penalties, and administrative costs when receivables become delinquent. Of the $2.0 trillion in outstanding current and delinquent receivables at the end of FY 2020, $139.7 billion (7 percent) represented unpaid interest, penalties, and administrative costs.
$ 0$ 200
$ 400
$ 600
$ 800
$ 1,000
$ 1,200
$ 1,400
$ 1,600
$ 1,800
$ 2,000
$ 2,200
Outstanding Federal Non-Tax Receivables, By Type: FY 2016–2020(Dollars in Billions)
Fiscal Year
Dolla
rs i
n B
illion
s
Loans (Direct and Guaranteed) Administrative (Non-Loan)
$105.0
$1,307.1
$110.5
$1,409.1
$106.0 $107.9
$1,615.0$1,510.3
2016 2017 2018 2019 2020$103.3
$1,865.5
: — 2016–2020
figure 6

6FY 2020 REPORT TO CONGRESS: U.S. GOVERNMENT NON-TAX RECEIVABLES AND DEBT COLLECTION ACTIVITIES OF FEDERAL AGENCIES
A. Total Delinquent Federal Non-Tax DebtA non-tax debt is considered delinquent if it has not been paid by the date specifi ed in an agency’s initial written demand for payment or applicable agreement. A non-tax debt may become delinquent during the same fi scal year that it was recorded as a receivable or during a subsequent fi scal year.
At the end of FY 2020, outstanding delinquent non-tax debt owed to the United States totaled $207.6 billion, a decrease of $12.1 billion (6 percent) from FY 2019. The total outstanding delinquent non-tax debt balance at the end of a fi scal year is the net of debt that remained delinquent from previous fi scal years and debt that became delinquent during that fi scal year, less collections, adjustments, and amounts written off .
III. III. Delinquent Federal Non-Tax Debt Owed to the United StatesDelinquent Federal Non-Tax Debt Owed to the United States
2016 2017 2018 20202019$ 0
$ 25
$ 50
$ 75
$ 100
$ 125
$ 150
$ 175
$ 200
$ 225
$ 250
Delinquent Federal Non-Tax Debt:12 FY 2016–2020(Dollars in Billions)
Fiscal Year
Dolla
rs i
n B
illion
s
Outstanding Debt < 365 Days Delinquent
$32.8
$147.9
$180.7$203.0
$171.3
$31.7
$185.0
$149.6
$35.4
$207.6
$191.8
$15.8
$30.8
$219.7
$188.9
$15.8
: — 2016–2020
figure 7
7 FY 2020 REPORT TO CONGRESS: U.S. GOVERNMENT NON-TAX RECEIVABLES AND DEBT COLLECTION ACTIVITIES OF FEDERAL AGENCIES
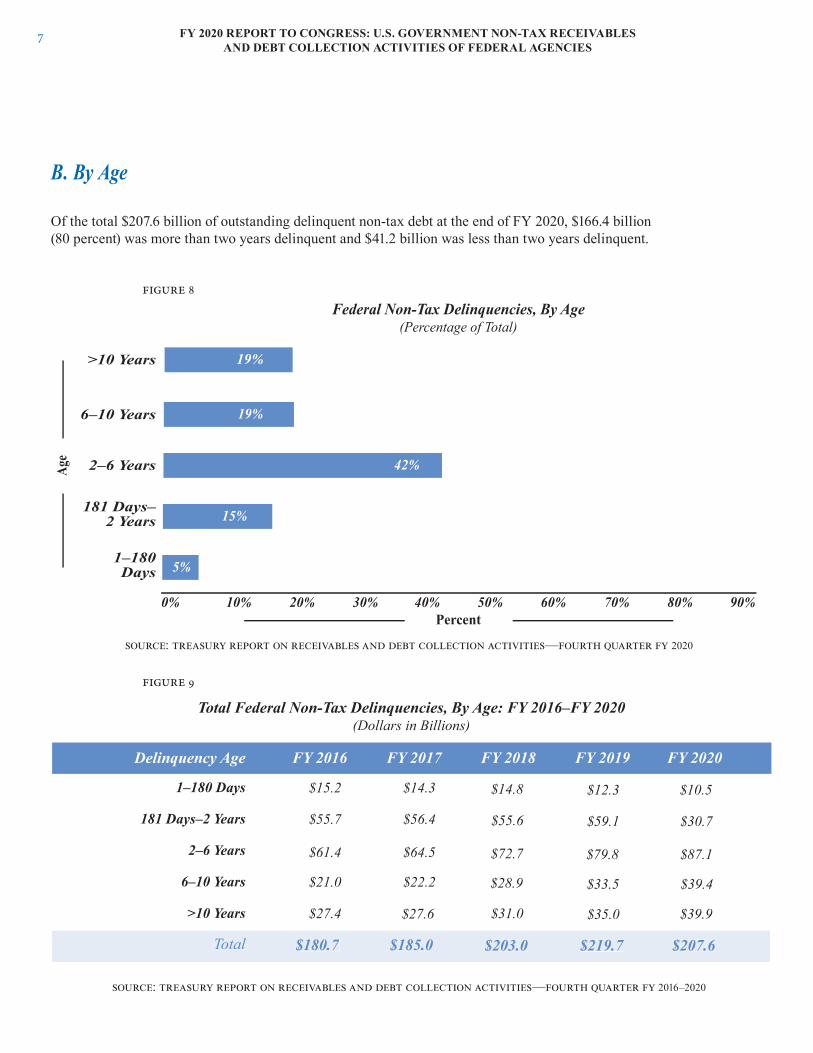
Of the total $207.6 billion of outstanding delinquent non-tax debt at the end of FY 2020, $166.4 billion (80 percent) was more than two years delinquent and $41.2 billion was less than two years delinquent.
B. By Age
0% 10% 20% 30% 40% 50% 60% 70% 80% 90%
1–180 Days
181 Days–2 Years
2–6 Years
6–10 Years
>10 Years
Federal Non-Tax Delinquencies, By Age(Percentage of Total)
Percent
Age
19%
42%
15%
5%
19%
Delinquency Age
1–180 Days
181 Days–2 Years
2–6 Years
6–10 Years
>10 Years
Total Federal Non-Tax Delinquencies, By Age: FY 2016–FY 2020(Dollars in Billions)
Total
FY 2016 FY 2017 FY 2018
$15.2
$55.7
$61.4
$21.0
$27.4
$180.7
FY 2019
$14.3
$56.4
$64.5
$22.2
$27.6
$185.0 $203.0 $219.7
$14.8
$55.6
$72.7
$28.9
$31.0
$12.3
$59.1
$79.8
$33.5
$35.0
FY 2020
$207.6
$10.5
$30.7
$87.1
$39.4
$39.9
: — 2020
: — 2016–2020
figure 8
figure 9

8FY 2020 REPORT TO CONGRESS: U.S. GOVERNMENT NON-TAX RECEIVABLES AND DEBT COLLECTION ACTIVITIES OF FEDERAL AGENCIES
C. By Creditor Agency
At the end of FY 2020, $191.3 billion in delinquent non-tax debt was owed to fi ve federal creditor agencies: Education, Social Security Administration (SSA), Department of Veterans Aff airs (VA), SBA, and Funds Appropriated to the President (FAP).
0% 10% 20% 30% 40% 50% 60% 70% 80% 90%
SBA
FAP
All Others
VA
SSA
Federal Non-Tax Delinquencies: Top Five Federal Creditor Agencies(Percentage of Total)
Percent
Agen
cy
5%
Education 84%
1%
1%
1%
8%
: — 2020
: — 2019–2020
figure 10
FY 2020Agency
Department of Education
Social Security Administration
Department of Veterans Affairs
Small Business Administration
Funds Appropriated to the
FY 2019 to FY 2020 Percentage Change in Federal Non-Tax Delinquencies: FY 2020 Top Five Federal Creditor Agencies
(Dollars in Billions)
% Change from FY 2019 to FY 2020
$185.1 -6.5%
$11.4 -11.4%
$2.8 0.0%
$2.7 0.0%
$2.5 4.0%
All Others
Total Government
$15.2
$173.1
$10.1
$2.8
$2.7
$2.6
$16.3 7.2%
$207.6$219.7
FY 2019
-5.5%
President
figure 11
9 FY 2020 REPORT TO CONGRESS: U.S. GOVERNMENT NON-TAX RECEIVABLES AND DEBT COLLECTION ACTIVITIES OF FEDERAL AGENCIES
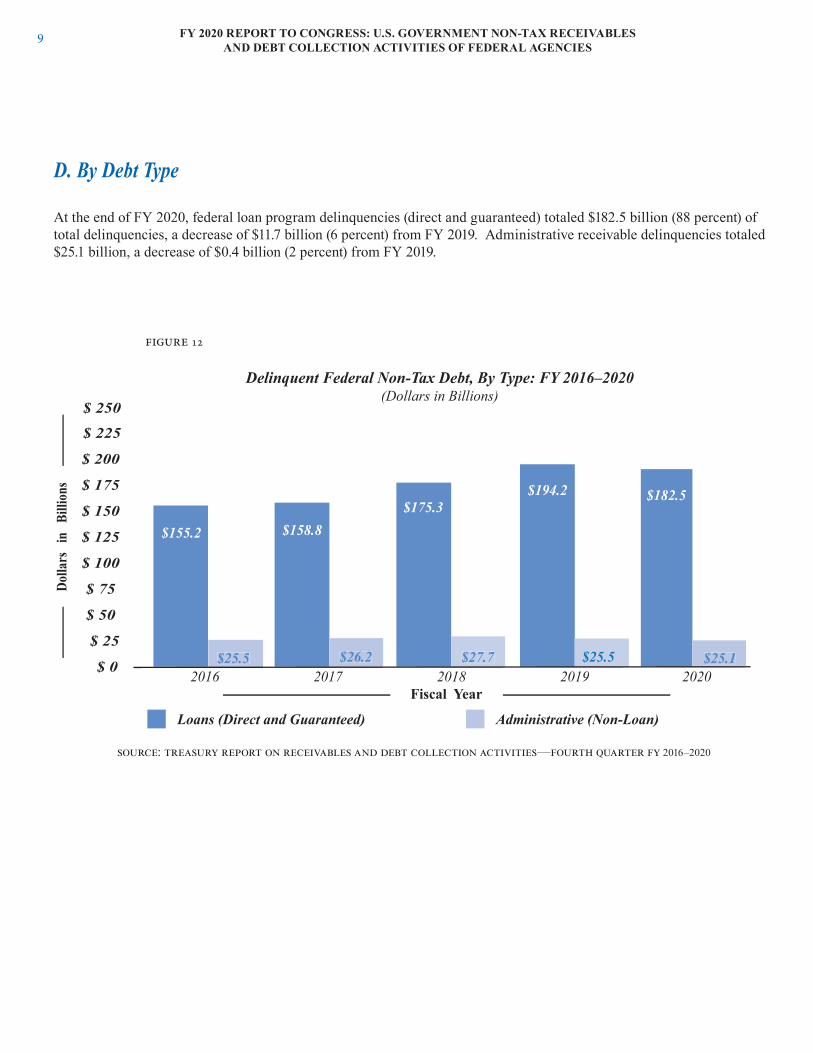
D. By Debt Type
At the end of FY 2020, federal loan program delinquencies (direct and guaranteed) totaled $182.5 billion (88 percent) of total delinquencies, a decrease of $11.7 billion (6 percent) from FY 2019. Administrative receivable delinquencies totaled $25.1 billion, a decrease of $0.4 billion (2 percent) from FY 2019.
2016 2017 2018 2019 2020$ 0
$ 25
$ 50
$ 75
$ 100
$ 125
$ 150
$ 175
$ 200
$ 225
$ 250
Delinquent Federal Non-Tax Debt, By Type: FY 2016–2020(Dollars in Billions)
Fiscal Year
Dolla
rs i
n B
illion
s
Loans (Direct and Guaranteed) Administrative (Non-Loan)
$182.5
$25.1
$155.2
$25.5
$158.8
$26.2
$175.3
$25.5
$194.2
$27.7
: — 2016–2020
figure 12

10FY 2020 REPORT TO CONGRESS: U.S. GOVERNMENT NON-TAX RECEIVABLES AND DEBT COLLECTION ACTIVITIES OF FEDERAL AGENCIES
IV. IV. Delinquent Federal Non-Tax Debt Collection ActivitiesDelinquent Federal Non-Tax Debt Collection Activities
A. Total Delinquent Federal Non-Tax Debt CollectionIn FY 2020, federal creditor agencies collected $23.0 billion in delinquent non-tax federal debt, a decrease of $4.0 billion (15 percent) from FY 2019.
B. By Creditor AgencyDuring FY 2020, $18.1 billion of the delinquent non-tax debt collected was owed to fi ve federal creditor agencies: Education (37 percent), Federal Trade Commission (24 percent), VA (6 percent), USDA (6 percent), and HHS (6 percent).
: — 2016–2020
: — 2019–2020
2016 2017 2018 2019 2020$ 0
$ 5
$ 10
$ 15
$ 20
$ 25
$ 30
$ 35
$ 40
$ 45
$32.8$30.7
$27.9 $27.0$23.0
Collection of Delinquent Federal Non-Tax Debt: FY 2016–2020(Dollars in Billions)
Fiscal Year
Dolla
rs
in
Billi
ons
FY 2020Agency
Department of Education
Federal Trade Commission
Department of Veterans Affairs
FY 2019 to FY 2020 Percentage Change in Collection of Federal Non-Tax Delinquencies: FY 2020 Top Five Federal Creditor Agencies
(Dollars in Billions)
% Change from FY 2019 to FY 2020
$14.5 -42.1%
$0.4 1,250.0%
$1.5 0.0%
14
13
$1.4 0.0%
$1.2 16.7%
All Others
Total Government
$8.0
$8.4
$5.4
$1.5
$1.4
$1.4
$4.9 - 38.8%
$23.0
FY 2019
$27.0 - 14.8%
Department of Agriculture
Department of Health and Human Services
figure 13
figure 14

11 FY 2020 REPORT TO CONGRESS: U.S. GOVERNMENT NON-TAX RECEIVABLES AND DEBT COLLECTION ACTIVITIES OF FEDERAL AGENCIES
Federal creditor agencies utilize a combination of debt collection tools. Among these collection tools are administrative wage garnishment (AWG), private collection agencies (PCAs), off set of federal and state15 payments through the Treasury Off set Program (TOP), the Cross-Servicing Program, and litigation. Before using most collection tools, federal creditor agencies must fi rst provide debtors with due process. This includes providing notice and opportunity to enter into a repayment agreement based on the debtor’s fi nancial circumstances, dispute the debt, or object to the intended collection action.
1. Administrative Wage GarnishmentFederal law authorizes federal creditor agencies to garnish a delinquent debtor’s wages without obtaining a court order by ordering a non-federal employer to withhold up to 15 percent of an employee’s disposable income to collect a delinquent federal non-tax debt owed to the agency. AWG serves as an eff ective tool in collecting delinquent non-tax debt from those debtors who are able but unwilling to voluntarily pay their obligations. In FY 2020, federal creditor agencies collected $930.1 million through the use of AWG, a decrease of $536.5 (37 percent) from FY 2019.16
2. Private Collection AgenciesPCAs assist federal creditor agencies in many ways, including locating debtors; establishing repayment agreements; and resolving debt administratively when a debtor is deceased, unable to pay, bankrupt, or out of business. In FY 2020, PCAs assisted federal creditor agencies by collecting $387.8 million, a decrease of approximately $65.0 million (14 percent) from FY 2019.18
figure 15
figure 16
AWG
AWG Collections: FY 2016–2020 (Dollars in Millions)
$1,149.9
FY 2016
$1,137.0
FY 2017
$1,299.5
FY 2018
$1,466.6
FY 2019
$930.1
FY 202017
$1,508.2
FY 2016
PCAs
PCA Collections: FY 2016–2020 (Dollars in Millions)
$214.6
FY 2017
$443.0
FY 2018
$452.8
FY 2019
$387.8
FY 202016 19 20
: — 2016–2020
: — 2016–2020

12FY 2020 REPORT TO CONGRESS: U.S. GOVERNMENT NON-TAX RECEIVABLES AND DEBT COLLECTION ACTIVITIES OF FEDERAL AGENCIES
C. Centralized Government-Wide Debt Collection ProgramsGenerally, federal creditor agencies are required to refer delinquent federal non-tax debt to Fiscal Service for collection through its delinquent debt collection programs, known as the Cross-Servicing Program and TOP. Federal creditor agencies are required to refer debt that is more than 120 days delinquent to the Cross-Servicing Program and TOP. Before referring a debt to Fiscal Service for collection, federal creditor agencies must provide debtors with notice and opportunity to enter into a repayment agreement based on the debtor’s fi nancial circumstances, dispute the debt, or object to the intended collection action. While federal creditor agencies are responsible for providing this required due process, Fiscal Service also provides debtors with additional opportunities to resolve their debts prior to the initiation of adverse collection action. For example, prior to initiating a collection action, the Cross-Servicing Program generally sends a demand letter to each debtor, and TOP sends a warning letter to payees before off setting recurring payments.
1. Treasury’s Cross-Servicing Program CollectionsTreasury’s Cross-Servicing Program collects delinquent non-tax debts through various means. Fiscal Service does this on behalf of federal creditor agencies by contacting debtors through demand letters and telephone calls, negotiating payment agreements, submitting delinquent debt to TOP, referring delinquent debt to PCAs, referring delinquent debt to DOJ for litigation, reporting debt to credit bureaus, and initiating AWG. In FY 2020, Fiscal Service collected $523.3 million of delinquent federal non-tax debt through its Cross-Servicing Program, which includes debt collected through TOP, a decrease of $79.8 million (13 percent) from FY 2019.
2. Treasury Off set Program CollectionsFor non-tax debt submitted to TOP, Fiscal Service intercepts eligible federal and state payments and applies them to a payee’s delinquent non-tax debt. Eligible payments include federal tax refunds; federal non-tax payments (e.g., Social Security benefi ts, civil service and military retirement, salary, vendor); state tax refunds; and other payments made by the states participating in TOP’s State Reciprocal Program.21 For more information about collections through TOP, see Appendix IV. For more information about the types of payments for which exemptions from centralized administrative off set have been approved, see Appendix VI.

13 FY 2020 REPORT TO CONGRESS: U.S. GOVERNMENT NON-TAX RECEIVABLES AND DEBT COLLECTION ACTIVITIES OF FEDERAL AGENCIES
3. Enforced Collection by the Department of JusticeIn FY 2020, the DOJ collected a total of $13.6 billion in cash on behalf of federal creditor agencies, an increase of $3.7 billion (37 percent)22 from FY 2019. When a federal creditor agency cannot collect a non-tax debt administratively; or believes that enforced collection action is otherwise more appropriate, the agency may refer the debt to DOJ to pursue enforced collection23 through the judicial process.
In FY 2020, Fiscal Service collected $10.4 billion through TOP for federal and state agencies. Of the $10.4 billion collected, $4.0 billion was from debtors who owed delinquent federal non-tax debt, $507.2 million was from debtors who owed delinquent federal tax debt, and $5.9 billion was from debtors who owed state debts, including delinquent child support obligations. Figure 17 shows a breakdown of TOP off sets by payment type for the collection of federal non-tax debt.
: ,
2016 2017 2018 2019 2020$ 0
$ 2
$ 4
$ 6
$ 8
$ 10
$ 12
$ 14
$ 16
$ 18
$14.3
$9.9
$13.6$13.5$12.1
Civil Litigation Cash Collection: FY 2016–2020(Dollars in Billions)
Fiscal Year
Dol
lars
in
Bi
llion
s
figure 18
figure 17
FY 2016Payment Type
Federal Tax Refund Payments
Total
TOP Collection of Federal Non-Tax Debt by Payment Type: FY 2016–2020(Dollars in Millions)
$2,994.1
$3,524.7
FY 2017
$3,213.2
$3,724.3
FY 2018
$3,256.4
$3,805.4
FY 2019
$5,198.5
$5,949.6
FY 2020
$3,505.0
State Payments $46.8 $53.2 $63.6 $103.3 $65.7
Federal Non-Tax Payments $483.8 $457.9 $485.4 $647.8 $469.6
$4,040.3
: ,
14FY 2020 REPORT TO CONGRESS: U.S. GOVERNMENT NON-TAX RECEIVABLES AND DEBT COLLECTION ACTIVITIES OF FEDERAL AGENCIES
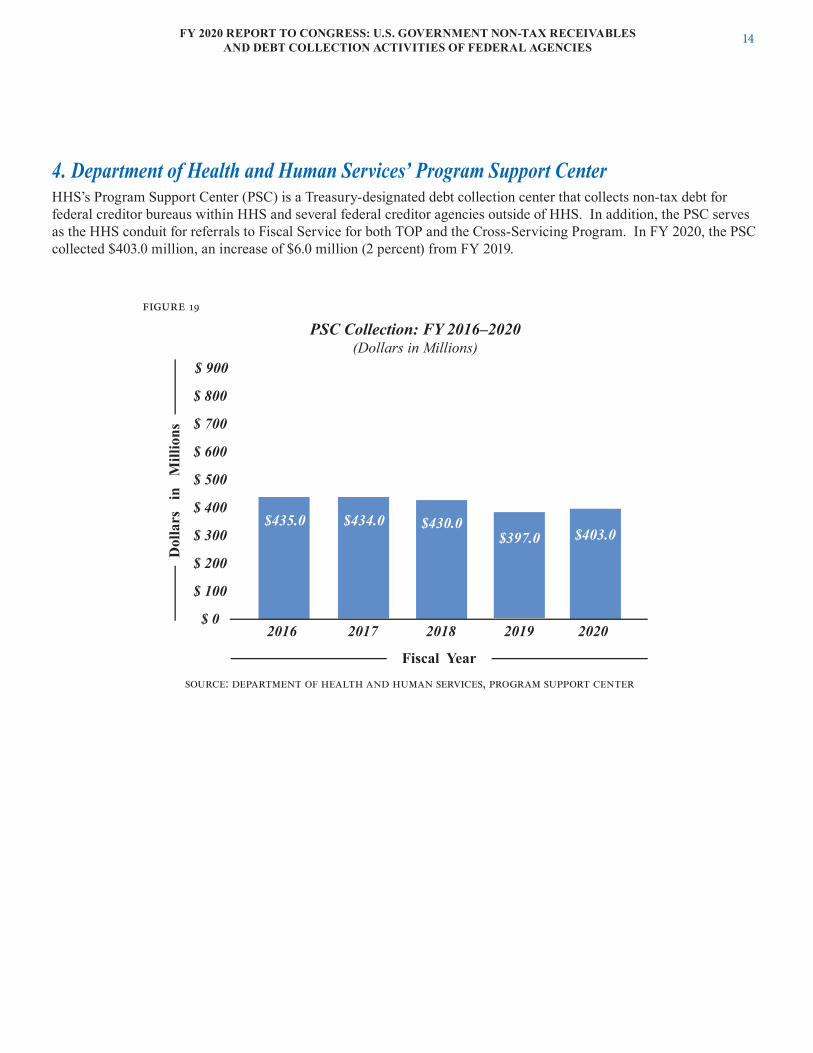
4. Department of Health and Human Services’ Program Support CenterHHS’s Program Support Center (PSC) is a Treasury-designated debt collection center that collects non-tax debt for federal creditor bureaus within HHS and several federal creditor agencies outside of HHS. In addition, the PSC serves as the HHS conduit for referrals to Fiscal Service for both TOP and the Cross-Servicing Program. In FY 2020, the PSC collected $403.0 million, an increase of $6.0 million (2 percent) from FY 2019.
: ,
$435.0 $434.0 $430.0$397.0 $403.0
2016 2017 2018 2019 2020$ 0
$ 100
$ 200
$ 300
$ 400
$ 500
$ 600
$ 700
$ 800
$ 900
PSC Collection: FY 2016–2020(Dollars in Millions)
Fiscal Year
Dol
lars
in
M
illio
ns
figure 19

15 FY 2020 REPORT TO CONGRESS: U.S. GOVERNMENT NON-TAX RECEIVABLES AND DEBT COLLECTION ACTIVITIES OF FEDERAL AGENCIES
V. V. Write-Off s of Delinquent Federal Non-Tax DebtWrite-Off s of Delinquent Federal Non-Tax Debt
Federal creditor agencies are generally required to write off non-tax debt that is two years delinquent (see Offi ce of Management and Budget Circular A-129).24 By writing off delinquent federal non-tax debt as uncollectible, federal creditor agencies more accurately refl ect the value of their receivables on the books of the United States. Certain write-off s are categorized as “currently not collectible”, which means that collection eff orts continue until the agency determines it should terminate those eff orts.
Other write-off s are categorized as “closed out,” which means that a federal creditor agency has terminated all debt collection action. Consequently, a federal creditor agency may be required to report such write-off s to the Internal Revenue Service (IRS) as potential income to the debtor.
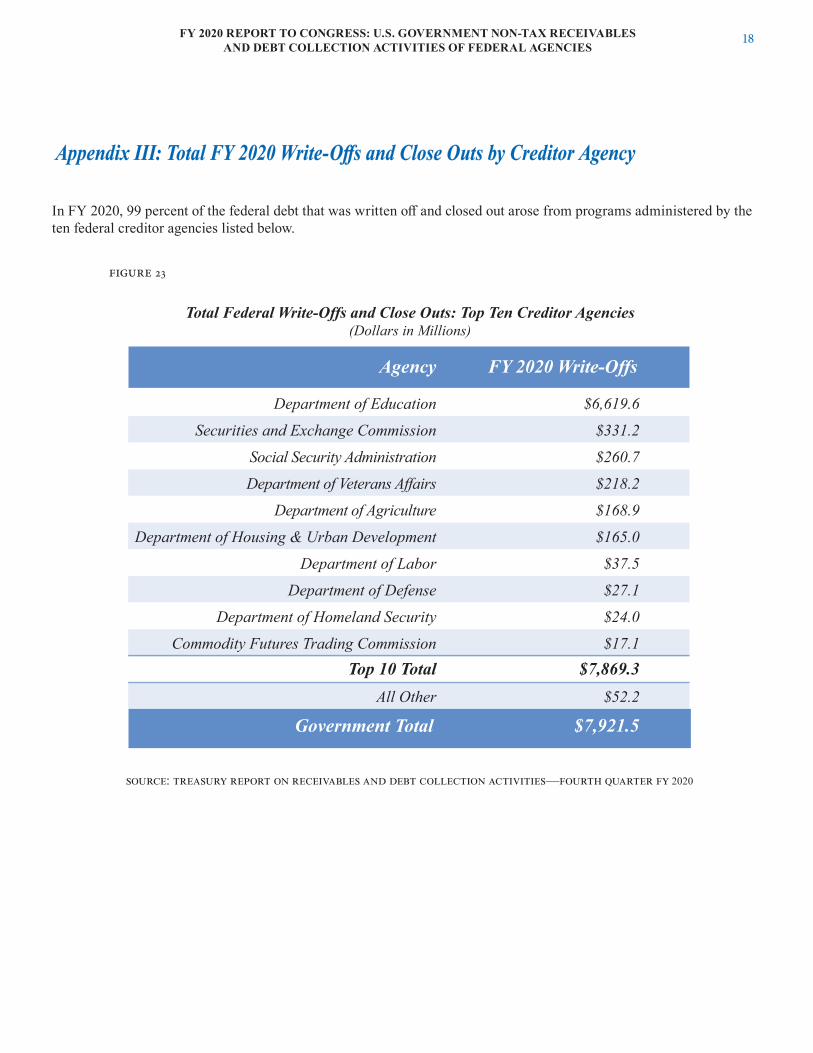
In FY 2020, federal non-tax debt that was written off and categorized as “closed out” totaled $7.9 billion, a decrease of $2.3 billion (23 percent) from FY 2019. The federal creditor agencies with the largest write-off amounts in FY 2020 included Education ($6.6 billion), Securities and Exchange Commission ($331.2 million), and SSA ($260.7 million).
: — 2016–2020
$8.3$8.8 $8.7
$10.2
$7.9
2016 2017 2018 2019 2020$ 2
$ 3
$ 4
$ 5
$ 6
$ 7
$ 8
$ 9
$ 10
$ 11
Annual Write-Offs and Closed Out Debts: FY 2016–2020(Dollars in Billions)
Fiscal Year
Dol
lars
in
Bi
llion
s
figure 20

16FY 2020 REPORT TO CONGRESS: U.S. GOVERNMENT NON-TAX RECEIVABLES AND DEBT COLLECTION ACTIVITIES OF FEDERAL AGENCIES
Appendix I: Total Federal Non-Tax Receivables by Creditor AgencyAppendix I: Total Federal Non-Tax Receivables by Creditor Agency
At the end of FY 2020, 97 percent of federal receivables were from programs administered by the ten federal creditor agencies listed below.
AppendicesAppendices
figure 21
: — 2020
Agency Receivables Balance (FY 2020)
Delinquent Debt Balance(FY 2020)
Department of Education $1,430,281.8 $173,146.3
Small Business Administration $190,944.0 $2,699.3
$120,591.2 $1,764.2
$63,451.4
Department of Health and Human Services
$24,398.4
$441.2
$10,134.8Social Security Administration
$29,860.7 $1,786.6
Department of Energy $19,185.5 $30.5
Department of Transportation $17,127.2 $37.8
Export-Import Bank $14,269.8 $1,522.9
Department of Defense $7,782.1 $1,257.8
Top 10 Total $1,917,892.1 $192,821.4All Others $50,904.7 $14,757.7
Government Total $1,968,796.8 $207,579.1
Total Federal Non-Tax Receivables and Delinquent Federal Non-Tax Debt: Top Ten Creditor Agencies
(Dollars in Millions)
Department of Housing and Urban Development
Department of Agriculture

17 FY 2020 REPORT TO CONGRESS: U.S. GOVERNMENT NON-TAX RECEIVABLES AND DEBT COLLECTION ACTIVITIES OF FEDERAL AGENCIES
Appendix II: Total FY 2020 Collection of Delinquent Federal Non-Tax Debt by Appendix II: Total FY 2020 Collection of Delinquent Federal Non-Tax Debt by Creditor AgencyCreditor Agency
In FY 2020, 91 percent of the collection of delinquent federal non-tax debt was associated with debt administered by the ten federal creditor agencies listed below.
Agency FY 2020 Collections
Department of Education
Federal Trade Commission
Department of Veterans Affairs
Department of Agriculture
Department of Health and Human Services
Total Collection of Delinquent Federal Non-Tax Debt: Top Ten Creditor Agencies(Dollars in Millions)
$8,351.5
$5,409.4
$1,453.9
$1,387.4
$1,354.1
General Services Administration $1,214.0
Department of Housing and Urban Development $566.0
Department of Defense $422.8
Environmental Protection Agency $415.9
Small Business Administration
Government Total $22,951.5
$382.5Top 10 Total $20,957.5
All Other $1,994.0
figure 22
: — 2020
18FY 2020 REPORT TO CONGRESS: U.S. GOVERNMENT NON-TAX RECEIVABLES AND DEBT COLLECTION ACTIVITIES OF FEDERAL AGENCIES
Appendix III: Total FY 2020 Write-Off s and Close Outs by Creditor AgencyAppendix III: Total FY 2020 Write-Off s and Close Outs by Creditor Agency
In FY 2020, 99 percent of the federal debt that was written off and closed out arose from programs administered by the ten federal creditor agencies listed below.
Agency FY 2020 Write-Offs
Department of Education
Securities and Exchange Commission
Social Security Administration
Department of Veterans Affairs
Department of Agriculture
Total Federal Write-Offs and Close Outs: Top Ten Creditor Agencies(Dollars in Millions)
$6,619.6
$331.2
$260.7
$218.2
$168.9
Department of Housing & Urban Development $165.0
Department of Labor $37.5
Department of Defense $27.1
Department of Homeland Security $24.0
Commodity Futures Trading Commission
Government Total $7,921.5
$17.1Top 10 Total $7,869.3
All Other $52.2
figure 23
: — 2020

19 FY 2020 REPORT TO CONGRESS: U.S. GOVERNMENT NON-TAX RECEIVABLES AND DEBT COLLECTION ACTIVITIES OF FEDERAL AGENCIES
Appendix IV: TOP Collections Including Debts Owed to the Internal Revenue Service and Appendix IV: TOP Collections Including Debts Owed to the Internal Revenue Service and State AgenciesState Agencies
Type of Payment Offset / Levy
Type ofDebt FY 2016 FY 2017 FY 2019 FY 2020
Tax Refund Offset
Total
Federal Non-tax Debt
Federal Non-tax Debt
Federal Non-tax Debt
$2,994.1 $3,213.2 $3,256.4 $5,198.5 $3,505.0
Administrative Offset
State Payments Offset
$483.8 $457.9 $485.4 $647.8
$46.8 $53.2 $63.6 $103.3
$4,217.1 $4,406.9 $4,484.3 $6,751.1
$469.6
$65.7
Federal Tax Debt
Tax Levy(Federal Payments) $692.4 $682.6 $678.9 $801.5 $507.2
$4,547.5
TOP Collection - Federal Debt: FY 2016–2020(Dollars in Millions)
FY 2018
TOP is the centralized program through which federal and state disbursing agencies intercept, or off set, eligible federal and state payments to satisfy delinquent debts owed to federal and state agencies. Delinquent non-tax debts owed to federal agencies include loans, overpayments, fi nes, and penalties. In addition, the Federal Payment Levy Program, processed through TOP, allows the IRS to continuously levy federal payments due to delinquent federal taxpayers.25 Delinquent debts owed to state agencies include child support and unemployment insurance obligations.
In FY 2020, Fiscal Service collected $10.4 billion through TOP for federal and state agencies, of which $4.5 billion was for debts owed to federal agencies and $5.9 billion for debts owed to state agencies. Highlights include:
• $5.1 billion26 was collected for delinquent child support obligations submitted to TOP by HHS’s Offi ce of Child Support Enforcement on behalf of states.
• $528.4 million was collected for 41 states and the District of Columbia that participated in TOP’s State Income Tax Program, whereby federal tax refunds and federal vendor payments are off set to collect delinquent state income tax obligations.
• $226.9 million was collected for the 50 states and the District of Columbia that participated TOP’s Unemployment Insurance Compensation Program, whereby federal tax refunds and federal vendor payments are off set to collect delinquent unemployment insurance benefi t and employer tax obligations.
• $53.4 million was collected for the 11 states and the District of Columbia that participated in TOP’s State Reciprocal Program for other state debts, whereby eligible federal vendor payments are off set to collect debt owed to states. In return, states off set $65.7 million from state payments to collect delinquent federal non-tax debt.
• $507.2 million delinquent Federal taxes was collected through the Federal Payment Levy Program.
24
: ,

20FY 2020 REPORT TO CONGRESS: U.S. GOVERNMENT NON-TAX RECEIVABLES AND DEBT COLLECTION ACTIVITIES OF FEDERAL AGENCIES
figure 25
: ,
Type of Payment Offset
Type ofDebt FY 2016 FY 2017 FY 2018 FY 2019 FY 2020
Total
$1,872.0 $1,796.4 $1,751.9 $1,723.3Tax Refund Offset
Tax Refund Offset
Tax Refund Offset
Administrative Offset
Administrative Offset
Administrative Offset
Child Support
State Income Tax Debt
State Unemployment Compensation Debt
Other State Debt(Reciprocal Program)
State Unemployment Compensation Debt
(Reciprocal Program)
$582.2 $607.7 $563.5 $493.2
$403.2 $353.8 $300.3 $270.9
$2,926.5 $2,850.3 $2,711.5 $2,592.2
$5,044.6
$503.4
$224.8
$22.7 $36.9 $36.9 $39.1 $25.0
Administrative OffsetChild Support $7.6 $7.1 $7.6 $8.6 $7.9
$38.8 $48.4 $46.7 $54.6 $53.4
N/A N/A $4.6 $2.5 $2.1
$5,861.2
TOP Collection - State Debt as of September 30: FY 2016–2020(Dollars in Millions)
State Income Tax Debt (Reciprocal Program)
27

21 FY 2020 REPORT TO CONGRESS: U.S. GOVERNMENT NON-TAX RECEIVABLES AND DEBT COLLECTION ACTIVITIES OF FEDERAL AGENCIES
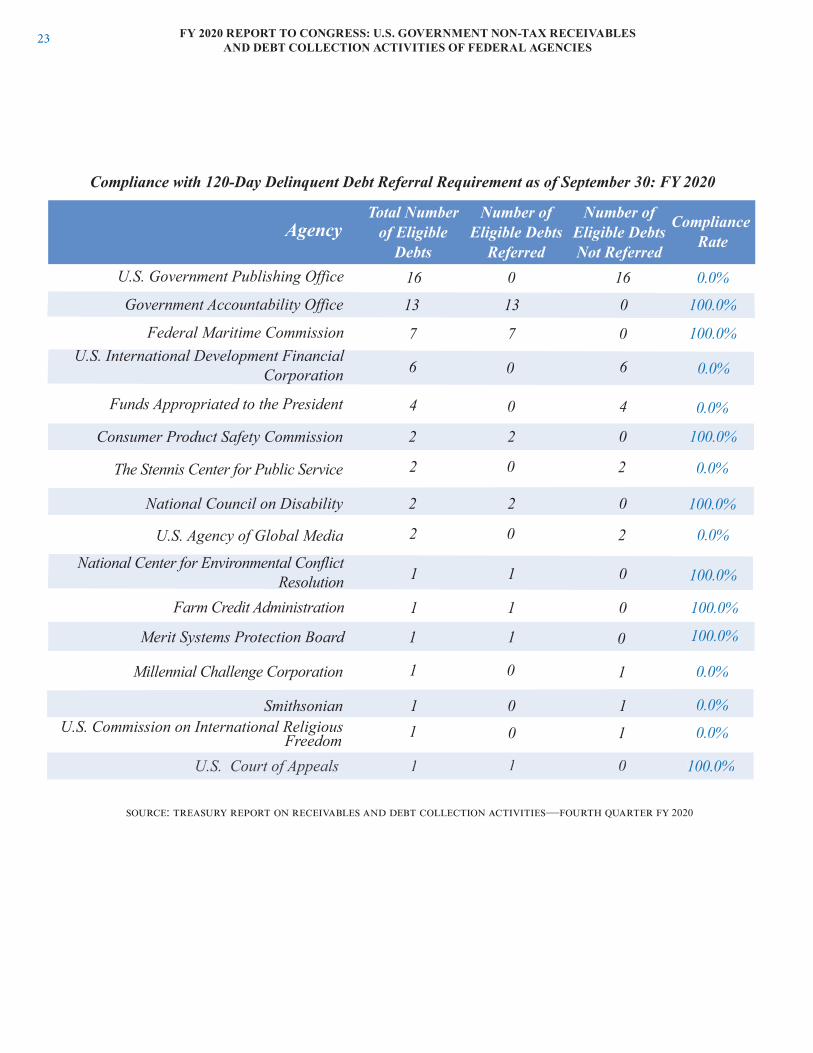
Appendix V: Compliance with 120–Day Delinquent Debt Referral RequirementAppendix V: Compliance with 120–Day Delinquent Debt Referral Requirement
Federal agencies are required to notify Treasury of legally enforceable, non-tax debts that are more than 120 days delinquent for purposes of administrative off set, and Treasury is required to report to Congress when debts are not timely referred.
The fi gure below shows the extent to which each federal agency satisfi ed this referral requirement for FY 2020. The fi gure only includes agencies that had eligible debts to refer to Fiscal Service. Agencies that did not have eligible debts to refer are not listed.
Note: The data used in this fi gure, as with the data for much of this report, are based on data that agencies reported on the TROR at the close of FY 2020. When agencies report information on the TROR, they certify to its accuracy.
Compliance Rate
Number of Eligible Debts Not Referred
Number of Eligible Debts
Referred
Total Number of Eligible
DebtsAgency
Department of Education 27,110,432 2,797,795 89.7%24,312,6371,700,085 1,197,283 29.6%502,802
1,218,327 18,938 98.5%1,199,389120,252 0 100.0%120,252
65,755 57,124 13.1%8,631
63,212 4 99.9%63,20853,985 9,041 83.3%44,944
49,851 7,404 85.1%42,44748,236 3,362 93.0%44,874
33,095 18 99.9%33,077
22,879 650 97.2%22,2297,629 0 100.0%7,629
7,554 52 99.3%7,502
6,548 7 99.9%6,541
5,856 36 99.4%5,820
Social Security Administration
Department of Health and Human Services
1,313,767 1,026,992 21.8%286,775Department of Defense
Compliance with 120–Day Delinquent Debt Referral Requirement as of September 30: FY 2020
Small Business Administration
Department of Veterans Affairs
Department of Homeland Security
Department of Labor
U.S. Postal Service
Department of AgricultureDepartment of Justice 37,724 362 99.0%37,362
Department of Interior
Department of State
Federal Communications CommissionDepartment of Transportation
Department of Housing & Urban
Department of the TreasuryDevelopment
: — 2020
figure 26

22FY 2020 REPORT TO CONGRESS: U.S. GOVERNMENT NON-TAX RECEIVABLES AND DEBT COLLECTION ACTIVITIES OF FEDERAL AGENCIES
: — 2020
Agency Compliance Rate
Number of Eligible Debts Not Referred
Number of Eligible Debts
Referred
Total Number of Eligible
Debts
Office of Personnel Management 1,651 286 82.7%1,3651,611 466 71.1%1,145
1,483 0 100.0%1,4831,325 1,173 11.5%152
317 127 59.9%190275 4 98.5%271
230 0 100.0%230
136 0 100.0%136
109 5 95.4%104108 6 94.4%102
105 0 100.0%10593 1 98.9%92
General Services Administration
Pension Benefit Guaranty Corporation
Compliance with 120–Day Delinquent Debt Referral Requirement as of September 30: FY 2020
Corp. for National and Community Service
Securities and Exchange Commission
The Judiciary
Nuclear Regulatory Commission
Environmental Protection Agency
U.S. Senate 177 132 25.4%45National Aeronautics and Space
AdministrationArmed Forces Retirement Home
National Archives & Records AdministrationFederal Election Commission
Department of Energy
84 0 100.0%8483 4 95.2%7968 68 0.0%060 1 98.3%59
56 0 100.0%56
National Science Foundation
Presidio Trust
57 57 0.0%0Architect of the Capitol
18 18 0.0%0Library of Congress
Consumer Financial Protection Bureau
Agency for International Development
Federal Trade Commission
1,792 0 100.0%1,792Department of Commerce
4,411 0 100.0%4,411Railroad Retirement Board
25 25 0.0%0
20 0 100.0%20
James Madison Memorial Fellowship
Equal Employment Opportunity Commission
983 0 100.0%983
366 0 100.0%366Commodity Futures Trading Commission
23 FY 2020 REPORT TO CONGRESS: U.S. GOVERNMENT NON-TAX RECEIVABLES AND DEBT COLLECTION ACTIVITIES OF FEDERAL AGENCIES
: — 2020
Agency Compliance Rate
Number of Eligible Debts Not Referred
Number of Eligible Debts
Referred
Total Number of Eligible
Debts
Compliance with 120-Day Delinquent Debt Referral Requirement as of September 30: FY 2020
4 4 0.0%0
2 0 100.0%2
2 2 0.0%0
Funds Appropriated to the President
Consumer Product Safety Commission
The Stennis Center for Public Service
6 6 0.0%U.S. International Development Financial
Corporation
2 0
0.0%
2National Council on Disability
2 2
100.0%
1 1 0.0%0Millennial Challenge Corporation
1 10Smithsonian 0.0%
0
1 0 100.0%1
U.S. Agency of Global Media
National Center for Environmental Conflict Resolution
1 0 100.0%1
7 0 100.0%7Federal Maritime Commission
13 0 100.0%13Government Accountability Office
Farm Credit Administration
16 16 0.0%0U.S. Government Publishing Office
Merit Systems Protection Board 1 0 100.0%1
0.0%1 10U.S. Commission on International Religious
0
U.S. Court of Appeals 100.0%1 01U.S. Court of Appeals 100.0%1 01Freedom

24FY 2020 REPORT TO CONGRESS: U.S. GOVERNMENT NON-TAX RECEIVABLES AND DEBT COLLECTION ACTIVITIES OF FEDERAL AGENCIES
Appendix VI: Payments Exempted from Centralized Administrative Off set by the Appendix VI: Payments Exempted from Centralized Administrative Off set by the Secretary of the TreasurySecretary of the Treasury
As authorized by federal law, 31 U.S.C. § 3716(c)(3)(B), the Secretary, at the request of a paying agency, may exempt certain classes of federal payments from the requirement that they be off set for the purpose of collecting non-tax debt owed to the United States. A complete list of payment classes exempt from centralized administrative off set is available on Treasury’s website.
Loan payments issued under section 1112 of the Coronavirus Aid, Relief, and Economic Security Act. Approved June 9, 2020.
Small Business Administration
Economic Injury Disaster Loan payments issued under section 1110 of the Coronavirus Aid, Relief, and Economic Security Act. Approved June 9, 2020.
Small Business Administration
Payments paid to states, Tribal governments, and units of local government under Title V of the Coronavirus Aid, Relief, and Eco-nomic Security Act. Approved April 14, 2020.
Department of the Treasury
Payments made under Title V of Division B of the Coronavirus Aid, Relief, and Economic Security Act through its COVID-19 Telehealth Program. Approved April 10, 2020.
Federal Communications Commission
Payroll assistance payments to air carriers and their contractors for pandemic relief under the Coronavirus Aid, Relief, and Economic Security Act. Approved March 31, 2020.
Department of the Treasury
Payments made between March 26, 2020 & September 21, 2020 to individuals under the Social Security Act. Approved March 25,
Social Security Administration
Payments representing refunds of funds collected in violation of an order issued in Mariquez v. DeVos, No. 17-cv-07210 (N.D. Cal.). Approved October 13, 2019.
Department of Education
Type of PaymentPayment Agency
New Exemptions from Administrative Offset in FY 2020
2020.
: ,
Figure 27

25 FY 2020 REPORT TO CONGRESS: U.S. GOVERNMENT NON-TAX RECEIVABLES AND DEBT COLLECTION ACTIVITIES OF FEDERAL AGENCIES
Appendix VII: Sources of DataAppendix VII: Sources of DataData in this report were obtained from the following sources and reported as of September 30, 2020:
Sources
Treasury Report on Receivables and Debt Collection Activities — Fourth Quarter 2020, as reported by federal creditor agencies to the Department of the Treasury
Department of the Treasury, Bureau of the Fiscal Service
Department of Health and Human Services, Program Support Center
Department of Justice, Offi ce of Debt Collection Management.

26FY 2020 REPORT TO CONGRESS: U.S. GOVERNMENT NON-TAX RECEIVABLES AND DEBT COLLECTION ACTIVITIES OF FEDERAL AGENCIES
The Page Intentionally Left Blank

FY 2020 REPORT TO CONGRESS: U.S. GOVERNMENT RECEIVABLES AND DEBT COLLECTION ACTIVITIES OF FEDERAL AGENCIES
EndnotesEndnotes1 This report is provided in accordance with 31 U.S.C. § 3719(b) (requiring the Secretary to report annually to Congress on the status of loans and accounts receivables managed by Federal agencies during the previous year); and fulfi ls other reporting requirements under 31 U.S.C. § 3716(c)(3)(B) (requiring the Secretary to report annually to Congress regarding payments exempted from off set) and 31 U.S.C. § 3716(c)(6)(B) (requiring the Secretary to report to Congress on agency failure to refer debts for administrative off set). Although this report incorporates some information about federal tax and state debt collections, information on the management and collection of federal tax receivables and state debts is generally outside the scope of this report. 2 Collections on receivables includes loan consolidations from the Department of Education. A loan consolidation is the process of combining one or more eligible loans into a single new loan.
3 Information on the management and collection of federal tax receivables is outside the scope of this report.
4 New receivables increased by 41 percent due, in part, to the Small Business Administration’s Coronavirus Aid, Relief, and Economic Security (CARES) Act fi nancial assistance programs, which provided loans to small businesses due to the COVID-19 pandemic.
5 More information on the Department of Education’s Student Aid programs can be found in the Feederral SStuudennt AAid AAAAnnnnnnuuaaaal RReeeppoortt.
6 All year-over-year changes were calculated based on the exact value in whole dollars and may diff er from the change calculated based on the rounded values expressed in millions or billions of dollars.
7 SBA’s 1,324 percent increase in receivables was due, in part, to the temporary programs authorized by the CARES Act to address the COVID-19 pandemic.
8 Education’s 23 percent decrease in collections was due primarily to the emergency relief measures, including those authorized by the CARES Act, that suspended certain required loan payments and halted collections on certain defaulted loans.
9 Department of Defense’s (DoD) 26 percent decrease in collections was primarily due to the impact of the COVID-19 pandemic on DoD’s overall business with public entities and foreign country customers.
10 Non-loan receivables include, among other items, fi nes, penalties, and overpayments.
11 The rate of interest is generally governed by 31 U.S.C. § 3717 and published by the DDepaartmmennt of thhe TTreaasurry. 12 The calculation of the amount that became delinquent during FY 2020 was based on debt that was between 1 and 365 days delinquent as of September 30, 2020.
13 Education’s 42 percent decrease in delinquent collections was due to the CARES Act emergency relief measures that halted collections on certain defaulted loans.
14 The Federal Trade Commission’s 1,250 percent increase in delinquent collections was primarily due to a $4.9 billion collection from a social networking site for a civil violation.
15 The term “state” includes the several states of the United States, the District of Columbia, American Samoa, Guam, the U.S. Virgin Islands, the Commonwealth of the Northern Mariana Islands, and the Commonwealth of Puerto Rico.
16 This amount does not include collections resulting from the use of AWG by Fiscal Service’s Cross-Servicing Program or from judicial garnishment actions.
27

FY 2020 REPORT TO CONGRESS: U.S. GOVERNMENT RECEIVABLES AND DEBT COLLECTION ACTIVITIES OF FEDERAL AGENCIES
EndnotesEndnotes17 Education’s Offi ce of Federal Student Aid revised a segment of its reporting process, which led to the increase in its AWG and PCA collections.
18 This amount does not include collections resulting from the use of PCAs by Fiscal Service’s Cross-Servicing Program or from the use of private counsel by DOJ. This amount also does not include collections from AWG.
19 The decrease in PCA collections was a result of a change to Education’s delinquent debt aging methodology for its Federal Student Aid (student loan) programs.
20 The increase in Federal Student Aid’s PCA collections is primarily due to 1) a general increase in PCA collections and 2) a correction to the aging methodology implemented by its default servicer. Federal Student Aid’s default servicer implemented the revised aging methodology in December 2018 but had to make additional system changes during July 2018 to correctly apply the revised aging methodology.
21 Generally, one-time payments (tax refunds and vendor payments) may be off set up to 100 percent of the payment amount. For recurring payments (Social Security, retirement, and salary), the off set amount is generally limited to a percentage of the payment.
22 The Department of Justice received a settlement payment from a social media networking site in the amount of $5 billion in FY 2020.
23 An “enforced” collection action refers to an action taken by DOJ (or by another federal creditor agency with independent litigation authority) to obtain a judgment against the debtor or to pursue available post-judgment remedies (including wage and bank garnishment and liens fi led against property).
24 “Write-off ” of a delinquent debt is an accounting action. Federal creditor agencies may pursue collection of a delinquent federal non-tax debt, however, without regard to whether it has been written off .
25 “Levy” is legally distinct from “off set.” While off set involves the netting out of mutual obligations between two parties, a levy is a legal seizure of property, usually in the hands of a third party, to satisfy a tax debt.
26 The $5.1 billion in TOP collections includes $3.40 billion in off sets from economic impact payments under the CARES Act, $1.64 billion from federal tax refund off sets and $7.9 million from off sets of other non-tax payments.
27 Revised and updated from FY 2017 Annual Report.
28