fiscal year 2021 approved budget
TRANSCRIPT

FISCAL YEAR 2021 Approved Budget
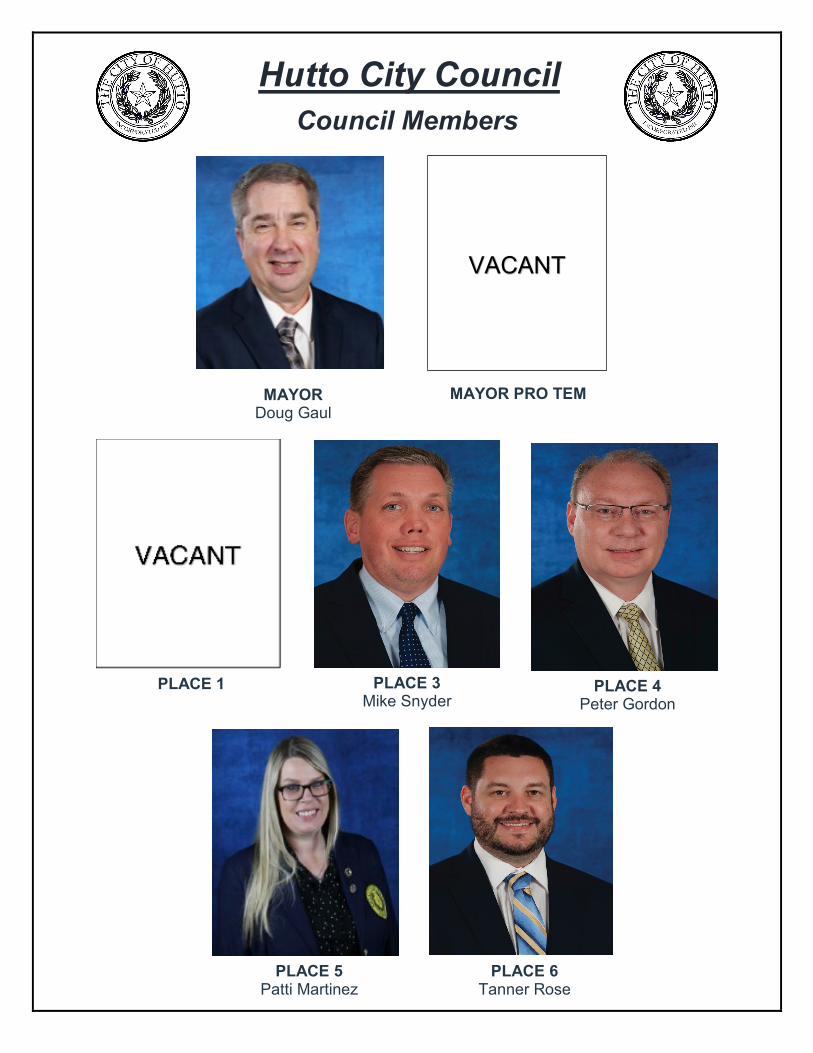
Hutto City Council
MAYOR Doug Gaul
MAYOR PRO TEM
Council Members
PLACE 1
PLACE 3
Mike Snyder
PLACE 4
Peter Gordon
PLACE 5 Patti Martinez
PLACE 6 Tanner Rose
VACANT

Charles Daniels
Interim City Manager Byron Frankland Assistant City Manager Bojorquez Law Firm City Attorney Paul Hall Chief of Police Stacy Schmitt Public Information Officer Ashley Lumpkin Executive Director, Development Services Anthony Host Executive Director, Community Services Misti Hancock Interim Chief Financial Officer
City Administration

City of Hutto Annual Budget
Fiscal Year - October 1, 2020 through September 30, 2021 This coversheet is submitted in compliance with Chapter 102 of the Local Government Code and Senate Bill 656 of the 83rd Texas Legislature.
This budget will raise less total property taxes than last year’s budget by an amount of $128,874, which is a -0.975 percent decrease, and of that amount $817,677 is tax revenue to be raised from new property added to the tax roll this year.
Property Taxes Previous Year Rate $0.631351
2020-21 Adopted Rate $0.600000 No-New-Revenue Tax Rate $0.644231
Voter-Approval Tax Rate $0.613817
Debt Rate (Interest & Sinking) $0.194449
Total Municipal Debt Obligations As of September 30, 2020, the City of Hutto has an outstanding principal balance of $190,605,000.
Record Vote on Adoption of The Budget The Hutto City Council read and approved the 2020-21 Budget on September 3, 2020 and September 17, 2020, through a record vote of the Hutto City Council.
Doug Gaul, Mayor “Ayes”
Robin Sutton, Place 1 “Ayes”
Dan Thornton, Place 2 “Ayes”
Mike Snyder, Place 3 “Ayes”
Peter Gordon, Place 4 “Ayes”
Patti Martinez, Place 5 Absent
Tanner Rose, Place 6 “Ayes”
The City of Hutto has been awarded the Distinguished Budget Presentation Award from the Government Finance Officers Association (GFOA) since Fiscal Year 2007.
The award is given for budgets that meet specific criteria as a policy document, financial plan, operations guide, and a communications device.
The Adopted Fiscal Year 2020-2021 Budget has been created according to the guidelines set forth by the Government Finance Officers Association.

Table of Contents
Letter from the City Manager .................................................................................................. 1
Our Vision, Values, Strategic Focus and Objectives .......................................................... 2 Budget Process .................................................................................................................... 5
Budget Overview .................................................................................................................. 8
Organizational Structure & Performance Objectives ...........................................................10 Organizational Structure .....................................................................................................11
Personnel Summary ............................................................................................................14
Performance Metrics ...........................................................................................................15
Fund Structure & Basis of Budgeting....................................................................................25 Governmental Funds ...........................................................................................................26
Proprietary Funds ................................................................................................................27
Fund/Department Matrix ......................................................................................................27
Basis of Budgeting ..............................................................................................................28
Funds .......................................................................................................................................29 Public Improvement District Funds .......................................................................................43 Local Government Corporation Funds ..................................................................................47 Tax Increment Reinvestment Zone Fund ..............................................................................51 Community Development Corporation ..................................................................................53 Divisional Budgets ..................................................................................................................55 Planning for the Future ...........................................................................................................62
Fiscal and Budgetary Policy ..................................................................................................64
Glossary of Terms & Acronyms .............................................................................................78
Letter from the City Manager
Rdosdl adq�0+�1/ 1/
Gnmnq akd�L ` xnq�` mc�L dl adqr �ne�sgd�Bhsx�Bnt mbhk+
@r �qdpt hqdc�ax�sgd�Bhsx�Bg` qsdq+�sgd�Oqnonr dc�At cf ds�enq�sgd�1/ 1/ ,1/ 10�ehr b` k�xd` q�hr �oqdr dmsdc�enq�qduhdv �` mc�bnmr hcdq shnm-�Sghr �at cf ds�v ` r �sgnt f gset kkx�bnmr sqt bsdc�v hsg�xnt q�f t hc` mbd�` mc�r s ee� hmot s� sn� ` ccqdr r � sgd� mddcr � ne� sgd� Gt ssn� bnl l t mhsx� ` r � v dkk� ` r � sgd� Bhsx┴r � nodq shnm k�naidbshudr -�
Sgdqd�` qd�sv n�oqhl ` qhkx�at cf ds�oqhnqhshdr �enq�EX�1/ 1/ ,10-��Sgd�ehqr s�hr �v d` sgdqhmf �sgd�hl o` bsr �ne�sgd�o` mcdl hb�r v ddohmf �sgqnt f g�nt q�bnl l t mhsx+�sgd�Rs sd�` mc�nt q�M` shnm-�Hm�sgdr d�shl dr +�sgd�gd` ksg�` mc�r ` edsx�ne�nt q�qdr hcdmsr �` mc�dl oknxddr �qdl ` hm�sgd�sno�oqhnqhsx:�gnv dudq+�` r �kd` cdqr �v d�b` mmns�knr d�r hf gs�ne�sgd�ehm mbh k�hl o` bs�sgd�o` mcdl hb�g` r �nm�nt q�knb` k�dbnmnl x�` mc�sgd�Bhsx┴r �nodq shnmr -��Nt q�r dbnmc�oqhnqhsx�hr �qdr dsshmf �nt q�nodq shnmr �` mc�enbt r hmf �qdr nt qbdr �nm�sgd�bnqd�r dquhbdr �sn�r t oonqs�sgd�mddcr �ne�nt q�f qnv hmf �qdr hcdmsh k�` mc�bnl l dqbh k�bnl l t mhshdr -���
Sgd�EX�1/ 1/ ,10�At cf ds�hr �a` r dc�nm� �bnmr dqu` shud� ooqn` bg-��V ghkd�sgd�Bhsx┴r �r ` kdr �s w�qdudmt dr �` mc�qdr hcdmsh k�cdudknol dms�g` ud�qdl ` hmdc�r sqnmf +�sgd�t mbdqs hmsx�ne�sgd�dbnmnl x�` mc�v g` s�sgd�═mdv �mnql ` k║�v hkk�knnj �khj d�g` r �dkdu` sdc�sgd�mddc�sn�enbt r �nm�sgd�a` r hbr -�Sgd�oqnonr dc�EX�1/ 1/ ,10� At cf ds� hmbkt cdr � #14+270+270� hm� nodq shmf � dwodmr dr � ` mc� #00+803+/ 53� enq� cdas� r dquhbdr �` r r nbh sdc�v hsg�o` r s�` mc�nmf nhmf �b` ohs k�oqnidbsr -��Sgd�bhsx�hr �dwodbshmf �sn�qdbdhud�l nqd�oqnodqsx�s w�qdudmt d�sg` m�k r s�xd` q�dudm�sgnt f g�sgd�s w�q sd�nm�sgd�oqnodqsx�s w�ahkkhmf �hr �kdr r �sg` m�k r s�xd` q┴r -��Sgd�Bhsx�g` r �` kr n�at cf dsdc�` �bnmr dqu` shud�0/ $ �f qnv sg�enq�r ` kdr �s w�qdudmt dr �nudq�k r s�xd` q:�at s+�he�r ` kdr �s w�qdudmt dr �bnmshmt d�sn�bnl d�hm�` s�sgd�kdudkr �dwodqhdmbdc�hm�EX�1/ 1/ +�sgd�Bhsx�b` m�dwodbs�sn�hl oqnud�hsr �F dmdq k�Et mc�a` k mbd�r hf mhehb` mskx-�Sgd�Bhsx�g` r �et mcdc�012-4�ESDr �hm�sgd�oqnonr dc�at cf ds-
We believe this conservative approach will meet the needs of our residents and improve the financial position of the City, not only for this year, but for the years to come.
Sincerely,
Charles W. Daniels Interim City Manager

Our Vision, Values, Strategic Focus and Objectives The City has embraced a results-oriented philosophy and entrepreneurial business philosophy in fulfillment of the vision set forth by City Council. The Co-Op District exemplifies the commitment to maintaining the City Council’s vision and utilization of innovative planning and financing structures to make the vision a reality. �
Like Hutto, the Strategic Plan & Execution Guide combines the old with the new. At the direction of the City Council, the 2017 Strategic Plan & Execution Guide started with future planning documents and work that the community had already completed. The 2040 Comprehensive Plan and the 2035 Strategic Guide included 198 different statements, principles, and goals. Each of which has been incorporated into the guide, in some form. One of the guiding principles in the development of the Strategic Plan & Execution Guide was to honor and utilize the significant work that has already been accomplished.
Hutto, Texas is a family-friendly community that provides superior public safety, outstanding fiscal responsibility, diversified economy, and an exceptional quality of life.
V d�dwodbs�sgnr d�` bshmf �nm�adg` ke�ne�sgd�Bhsx�sn�bnmr hr sdmskx�r gnv �qdr onmr hahkhsx-� Adhmf � qdr onmr hakd� dms hkr � adhmf � sqt r sv nqsgx� sn� cn�v g` s� hr � hm� sgd� adr s� hmsdqdr s� ne� sgd� bnl l t mhsx� ` mc� sgd� Bhsx�nqf ` mhy` shnm�` mc�adhmf �` bbnt ms akd�enq�nt q�nv m�hmchuhct ` k�` bshnmr -
V d�dwodbs�sgnr d�` bshmf �nm�adg` ke�ne�sgd�nqf ` mhy` shnm�sn�bnmr hr sdmskx�g` ud� ` � ghf g� qdf ` qc� enq� sgd� r ` edsx� ne� ` kk� hmunkudc+� hmbkt chmf � nt q�qdr hcdmsr +�uhr hsnqr +�unkt msddqr +�dl oknxddr +�` mc�sgdhq�oqnodqsx-�Sgd�u` kt d�ne�r ` edsx�hmbkt cdr �` bshnmr �s j dm�sn�oqnl nsd�sgd�r ` edsx�ne�sgd�ot akhb� ' h-d-+� onkhbd� r dquhbdr +� ehqd� r dquhbdr +� dl dqf dmbx� l dchb` k�r dquhbdr � ` mc� sgd� khj d(� ` r � v dkk� ` r � cdr hf m� ne� nt q� hmeq r sqt bst qd+�nodq shnm k� onkhbhdr +� ` mc� sgd� v nqj hmf � bnmchshnmr � oqnuhcdc� sn� nt q�dl oknxddr -�Qdbnf mhyhmf �sg` s�r nl d�dkdl dmsr �ne�sgd�v nqj �ne�sgd�Bhsx�ne�Gt ssn�bnl d�v hsg�` �kdudk�ne�hmgdqdms�c` mf dq+�nt q�f n` k�hr �sn�l hshf ` sd�sg` s�c` mf dq�sn�sgd�dwsdms�qd` r nm akd-
V d�dwodbs�sgnr d� ` bshmf �nm�adg` ke�ne� sgd�nqf ` mhy` shnm�sn� ` bs� v hsg�` t sgdmshbhsx-�Gt ssn�hr �` �t mhpt d�bnl l t mhsx�v hsg�` �o` qshbt k q�ghr snqx+�bt kst qd+�` mc�bg` q bsdq+�` mc�adhmf �` t sgdmshb�dms hkr �adhmf �f dmt hmd�hm�ansg� v nqcr � ` mc� cddcr � sn� ansg� sgd� hmchuhct ` k� bg` q bsdq� ` mc� sgd�bg` q bsdq�ne�sgd�bnl l t mhsx�` r �` �v gnkd-�
CORE VALUES
RESPONSIBLE
SAFE
AUTHENTIC
VISION STATEMENT
V d� dwodbs� sgnr d� ` bshmf � nm� adg` ke� ne� sgd� Bhsx� ne� Gt ssn� sn� r ddj �bqd` shud� r nkt shnmr � sn� oqnakdl r -� Adhmf �oqnf qdr r hud� dms hkr � l ` j hmf �t r d�ne�mdv �nq�cheedqdms�l dsgncr +�noonqst mhshdr +�` mc�hcd` r �v hsg�sgd�hmsdmshnm�ne� ` cu` mbhmf �sgd�oq bshbd�nq�nt sbnl d� e qsgdq� ` mc� e r sdq�sg` m�hs�v nt kc�t mcdq�sgd�r s st r �pt n-
Rsq sdf hb�Enbt r �@qd` r �chqdbskx�r t oonqs�nt q�Bnqd�U` kt dr �` mc�Uhr hnm-�Sgdr d�` qd�sgd�aqn` c�` qd` r �sg` s�sgd�Bhsx�hr �hmsdmshnm kkx�ok bhmf �` m�hmsdmr d�enbt r -�Adknv �` qd�sgd�☺ud�Rsq sdf hb�Enbt r �@qd` r �ne�sgd�Bhsx�ne�Gt ssn-
PROGRESSIVE
STRATEGIC FOCUS AREAS

Naidbshudr �v hsghm�sgd�ok m� ` qd�sgd�oqhl ` qx� ` qd` r � sg` s�sgd�Bhsx�hr �hmsdmchmf �sn�mnshbd` akx� l ` j d�bg` mf dr �sn�hm�sgd�qdk shud�r gnqs�sdql �hm�et qsgdq mbd�ne�hsr �Uhr hnm-�Naidbshudr �` qd�l nqd�r odbh☺b�` mc�chqdbs�sg` m�Rsq sdf hb�Enbt r �@qd` r +�at s�hm�l nr s�b` r dr �` qd�mns�chr bqdds+�` bghdu` akd�f n` kr �hm�` mc�ne�sgdl r dkudr -� Naidbshudr � ` qd� cdr hf mdc� hm� r t bg� ` � v ` x� sg` s� he� sgd� nqf ` mhy` shnm� l ` j dr � r hf mh☺b` ms�oqnf qdr r �snv ` qcr �sgd�Naidbshudr +�hs�v hkk�g` ud� l ` cd� r hf mh☺b` ms�oqnf qdr r �snv ` qcr � ` bghduhmf �sgd�Uhr hnm-�
The chart below reflects the alignment of the City’s Objectives into the five Strategic Focus Areas.
OBJECTIVES
Generate a strategic path forward for enhancing the public safety apparatus, including police, fire, and
emergency medical services.
Create an aggressive, progressive economic
development strategy for the community.
Create an “open for business” culture throughout
the organization.
Construct and maintain infrastructure at the
desired levels of service.
Ensure responsible fiscal stewardship through
transparency and reporting.
Maintain an environment and quality of life that encompasses a safe, friendly, and entertaining
atmosphere for all ages.
Enhance the overall governance of the community.
Maintain a positive and inspired workforce.
Implement a quality city-wide customer service program.
Enhance mobility within the city.

Budget Process Sgd�Bhsx�ne�Gt ssn� t r dr � ` �oqhnqhsx,a` r dc�at cf dshmf �oqnbdr r �` mc�` mmt ` kkx�at cf dsr �nodq shmf �qdudmt dr �` mc�dwodmchst qdr �ax�sv n�sxodr �ne�et mcr 9�F nudqml dms k�Et mcr �` mc�Oqnoqhds qx�Et mcr -� � Sgd� Bhsx� t r dr � ` � sns k� ne� ent qsddm� r do` q sd� ` mc�hmcdodmcdmskx� at cf dsdc� et mcr � sn� b` qqx� nt s� sgd� c` x,sn,c` x�nodq shnmr �ne�sgd�Bhsx-��@�et mc�hr �f dmdq kkx�cdehmdc�` r �` �ehr b` k�` mc�` bbnt mshmf �dmshsx�sg` s�g` r �hsr �nv m�r dke,a` k mbhmf �r ds�ne�` bbnt msr �qdbnqchmf �b` r g� ` mc�nsgdq�ehm mbh k�qdr nt qbdr +� ` r �v dkk� ` r � ` mx� kh ahkhshdr � nq� qdr hct ` k� dpt hshdr � nq� a` k mbdr -��Mnql ` kkx�et mcr �` qd�r df qdf ` sdc�enq�sgd�ot qonr d�ne�b` qqxhmf �nt s� r odbhehb� ` bshuhshdr +� nq� ` ss hmhmf � bdqs hm� naidbshudr � hm�` bbnqc` mbd� v hsg� r odbh k� qdf t k shnmr +� qdr sqhbshnmr +� nq�khl hs shnmr - F nudqml dms k� et mcr � ` qd� t r dc� enq� s w� r t oonqsdc� f dmdq k�f nudqml dms� ` bshuhshdr � ` mc� hmbkt cd� sgd� F dmdq k� Et mc+� F dmdq k� Cdas� Rdquhbd� Et mc+� Rodbh k�Qdudmt d�Et mcr +�F dmdq k�B` ohs k�Oqnidbsr �Et mc+� mc�sgd�Cq hm f d�Et mc-��Oqnoqhds qx�et mcr �' et mcr �sg` s�nodq sd�l nqd�khj d�` �at r hmdr r �dmsdqoqhr d(�hmbkt cd�sgd�Tshkhsx�Et mc+�Hl o` bs�Edd�Et mc+�Tshkhsx�BHO�Et mc+�` mc�Tshkhsx�Cdas�Rdquhbd�Et mc- D` bg� et mc� hr � at cf dsdc� r do` q sdkx� ` mc� hmbkt cdr � hsr � nv m� ehm mbh k� r s sdl dms-� Sgd� Bhsx� hr � ` kr n�ehm mbh kkx� ` bbnt ms akd� enq� sgd� Gt ssn� Dbnmnl hb� Cdudknol dms� Bnqonq shnm� ' GDCB(+� ca` �Bnl l t mhsx�Cdudknol dms�Bnqonq shnm+�v ghbg�hr �qdonqsdc� ` r � ` �akdmcdc�bnl onmdms�ne�sgd�Bhsx-��Sgqnt f g� Sxod� @� ` mc� A+� sgd�bnqonq shnm�et mcr � dbnmnl hb� cdudknol dms� oqnidbsr � ax� t shkhyhmf � ` m�` cchshnm k�• �bdms�r ` kdr �s w�` ooqnudc�ax�sgd�unsdqr �hm�1/ 06-��Sgd�GDCB�at cf ds�hr �cdudknodc�ax�GDCB� r s ee� ` mc�an` qc� l dl adqr � ` mc� ` cnosdc�ax�ansg�sgd� r dudm,l dl adq�an` qc� ` mc�sgd�Bhsx�Bnt mbhk-�
Gather Information Enkknv hmf �Bnt mbhk�dkdbshnmr +�dkdbsdc�l dl adqr � f ` sgdq�sn�chr bt r r �at cf ds�oqhnqhshdr �` mc�r sq sdf hb�hr r t dr �hl onqs ms�sn�Gt ssn┴r �et st qd-�Oqhnqhshdr �` qd�hcdmshehdc�sgqnt f g�at cf ds�qduhdv �` mc�` m kxr hr �ne�at cf ds�qdpt dr sr �hm�` cchshnm�sn�bnmshmt ` k�bnl l t mhb` shnm�eqnl �sgd�Bnt mbhk�sgqnt f gnt s�sgd�xd` q-�Sgdr d�oqhnqhshdr �` qd�hmbnqonq sdc�v gdqd�onr r hakd�hm�sgd�` cnosdc�at cf ds-�At cf ds�oqhnqhshdr �enq�sgd�t obnl hmf �ehr b` k�xd` q�` qd�` ccqdr r dc�hm�sgd�nodmhmf �o` f dr �ne�sghr �cnbt l dms�` mc�hm�sgd�At cf ds�Sq mr l hss k�Kdssdq�r dbshnm+�` r �v dkk�` r �sgd�Rsq sdf hb�Ok m�` mc�Dwdbt shnm�F t hcd-
Utilize Strategic Plan Sgd�Rsq sdf hb�Ok m�` mc�Dwdbt shnm�F t hcd�bnmmdbsr �r gnqs,sdql �hmhsh shudr �v hsg�knmf ,sdql �r sq sdf hb�oqhnqhshdr � hcdmshehdc� ax� sgd� Bhsx� Bnt mbhk-� @cit r sl dmsr � ` qd� l ` cd� ` r � mddcdc� a` r dc� nm� r dquhbd�cdl ` mcr �` mc�` r r dr r l dmsr -�Et st qd�at cf ds�qdpt dr sr �` qd�f t hcdc�ax�f n` kr �` mc�oqhnqhshdr �hcdmshehdc�hm� sgd� r sq sdf hb� ok mr -� Ehr b` k� enqdb` r s� oqnidbshnmr � ` mc� dr shl ` sdr � ` qd� t oc` sdc� a` r dc� nm� sqdmc�` m kxr hr +�dwodbsdc� f qnv sg�ct d�sn�qdr hcdmsh k�` mc�bnl l dqbh k�dwo` mr hnm+�` mc�nsgdq�` mshbho` sdc�e bsnqr -

Revenue Projections
Qdudmt d�oqnidbshnmr �enq�sgd�mdv �ehr b` k�xd` q�adf hm�l hc,xd` q�ne�sgd�bt qqdms�ehr b` k�xd` q-�Oqnidbshnmr �` qd�a` r dc�nm�bnmr t ks shnmr �v hsg�r s sd�` mc�knb` k�` f dmbhdr +�sqdmc�` m kxr hr +�` mshbho` sdc�bg` mf dr �hm�sgd�knb` k� mc�qdf hnm k�dbnmnl x+� mc�chr bt r r hnmr �v hsg� r r nbh sdc�r s ee-�@ksgnt f g�adf hmmhmf �d` qkhdq+�qdudmt d�oqnidbshnmr �nbbt q�bnmbt qqdmskx�v hsg�cdo` qsl dms k�at cf ds�cdudknol dms+�` mc�dwsdmc�t mshk�sgd�at cf ds�hr �` cnosdc�a` r dc�t onm�sgd�qdbdhos�ne�mdv �hmenql ` shnm-
Budget Development Sgd�at cf ds�hr � oqdo` qdc�sn�oqnl nsd�ehr b` k�qdr onmr hahkhsx� ` mc�dmr t qd� r t odqa� r dquhbd�cdkhudqx�sn�Gt ssn�bhshydmr -�Hm�oqdo` qhmf �sgd�at cf ds+�cdo` qsl dmsr �` qd�` r j dc�sn�qduhdv �dwhr shmf �oqnf q l r +�l ` j d�bt sr �v gdqd�` ooqnoqh sd+�` mc�b` kbt k sd�sgd�qdr nt qbdr �mddcdc�sn�oqnuhcd�sgd�bt qqdms�nq�a` r d�kdudk�r dquhbd�hm�sgd�mdws�ehr b` k�xd` q-�@esdq�dr s akhr ghmf �a` r d�at cf ds�qdpt dr sr +�cdo` qsl dmsr �` qd�` r j dc�sn�e bsnq� hm� at cf ds� dmg` mbdl dmsr � a` r dc� nm� oqhnqhshdr � ` cnosdc� ax� sgd� Bhsx� Bnt mbhk-� At cf ds�dmg` mbdl dmsr � ` qd� bnr sr � qdk sdc� sn� mdv � nq� dwo` mcdc� oqnf q l r +� hmbkt chmf � mdv � odqr nmmdk+�r t ookhdr +�` mc�dpt hol dms- Ct qhmf � sgd� at cf ds� cdudknol dms� r s f d+� sgd� Bhsx� L ` m f dq� ` mc� Ehm mbd� Cdo` qsl dms� v nqj � v hsg�cdo` qsl dms� ` mc� chuhr hnm� l ` m f dqr � sn� ` m kxyd� qdpt dr sr +� oqnuhcd� ` cuhbd� ` mc� kdmc� ` r r hr s mbd-��Oqnf q l � f n` kr � ` mc�naidbshudr � ` qd�du` kt ` sdc�ct qhmf �sgd�at cf ds�cdudknol dms�sn�cdsdql hmd�sgd�deedbshudmdr r �` mc�deehbhdmbx�ne�oqnf q l �` bshuhshdr �sn�cdsdql hmd�` ooqnoqh sd�kdudkr �ne�et mchmf -�� Sgd�at cf ds�hr �cq esdc�hm�` bbnqc` mbd�v hsg�sgd�Bhsx┴r �Bg` qsdq+�r s sd�k v +�` mc�` kr n�sgd�Bhsx┴r �Ehr b` k�` mc�At cf ds qx�Onkhbx-�Sgd�Ehr b` k�` mc�At cf ds qx�Onkhbx�oqnuhcdr �` cchshnm k�f t hcdkhmdr �hm�qdf ` qc�sn�Ehm mbh k�Ok mmhmf +�sgd�At cf ds�Oqdo` q shnm�Oqnbdr r +�Qdudmt d�` mc�Dwodmchst qd�L ` m f dl dms+�Rs eehmf +� Dbnmnl hb� Cdudknol dms+� Hmsdqf nudqml dms k� Qdk shnmr +� B` ohs k,@r r ds� L ` m f dl dms+�Ehm mbh k�Qdonqshmf +�` mc�Cdas�L ` m f dl dms-�Sgd�Ehr b` k�` mc�At cf ds qx�Onkhbx�hr �hmbkt cdc�hm�sghr �at cf ds-
Budget Workshops and Public Hearings @�At cf ds�v nqj �r dr r hnm�v ` r �gdkc�v hsg�sgd�Bhsx�Bnt mbhk�sn�qduhdv �` mc�chr bt r r �sgd�oqnonr dc�at cf ds-�Bhshydm�hmot s�hr �f ` sgdqdc�sgqnt f g�ot akhb�gd` qhmf r -
Budget Adoption and Maintenance
At cf ds�` cnoshnm�nbbt qr �hm�Rdosdl adq�` esdq�ot akhb�gd` qhmf r �` mc�Bhsx�Bnt mbhk�cdkhadq shnmr -�Sgd�Bhsx�Bnt mbhk�l ` x�s j d�` bshnm�sn�l nchex�sgd�oqnonr dc�at cf ds�odq�hsr �chr bqdshnm�` mc�` cnos�` �s w�q sd�sn�r t oonqs�sgd�` cnosdc�et mchmf �kdudkr - @m� ` cnosdc� at cf ds� hr � bnl ohkdc� ` mc� ot akhr gdc� ct qhmf � sgd�ehqr s� l nmsgr �ne� sgd� mdv �ehr b` k� xd` q-��At cf ds� l ` hmsdm mbd� hr � ` � xd` q,qnt mc� ` bshuhsx� enq� cdo` qsl dms� ` mc� chuhr hnm� chqdbsnqr +� sgd� Bhsx�L ` m f dq+� ` mc� sgd� Ehm mbd� Cdo` qsl dms-� Oqnf q l r � ` qd� bnmshmt ` kkx� du` kt ` sdc� sn� hcdmshex�hmdeehbhdmbhdr �` mc�odqenql ` mbd�bnmbdqmr �r n�sg` s�` cit r sl dmsr �l ` x�ad�l ` cd�` bbnqchmf kx-��Bnmsqnk�l dbg` mhr l r �hmbkt cd�sgd� r t al hr r hnm�ne� l nmsgkx�ehm mbh kr � ` mc�at cf ds�sn�` bst ` k�qdonqsr �sn�Bhsx�Bnt mbhk+� l nmsgkx� qduhdv � ne� dwodmchst qdr � ax� sgd� Bhsx� L ` m f dq� ` mc� Ehm mbd� Cdo` qsl dms+� ` mc�` t sgnqhy` shnm� sn� ot qbg` r d� eqnl � sgd� Bhsx┴r � Ehm mbd� Cdo` qsl dms-� Sgd� Bhsx� L ` m f dq� l ` x� l nud�` ooqnoqh shnmr �eqnl �` bbnt ms�sn�` bbnt ms:�gnv dudq+�at cf ds�` l dmcl dmsr �qdr t kshmf �hm�` �cdbqd` r d�nq�hmbqd` r d�ne�sns k�` ooqnoqh shnmr �l t r s�ad�` ooqnudc�ax�nqchm mbd�ax�sgd�Bhsx�Bnt mbhk-
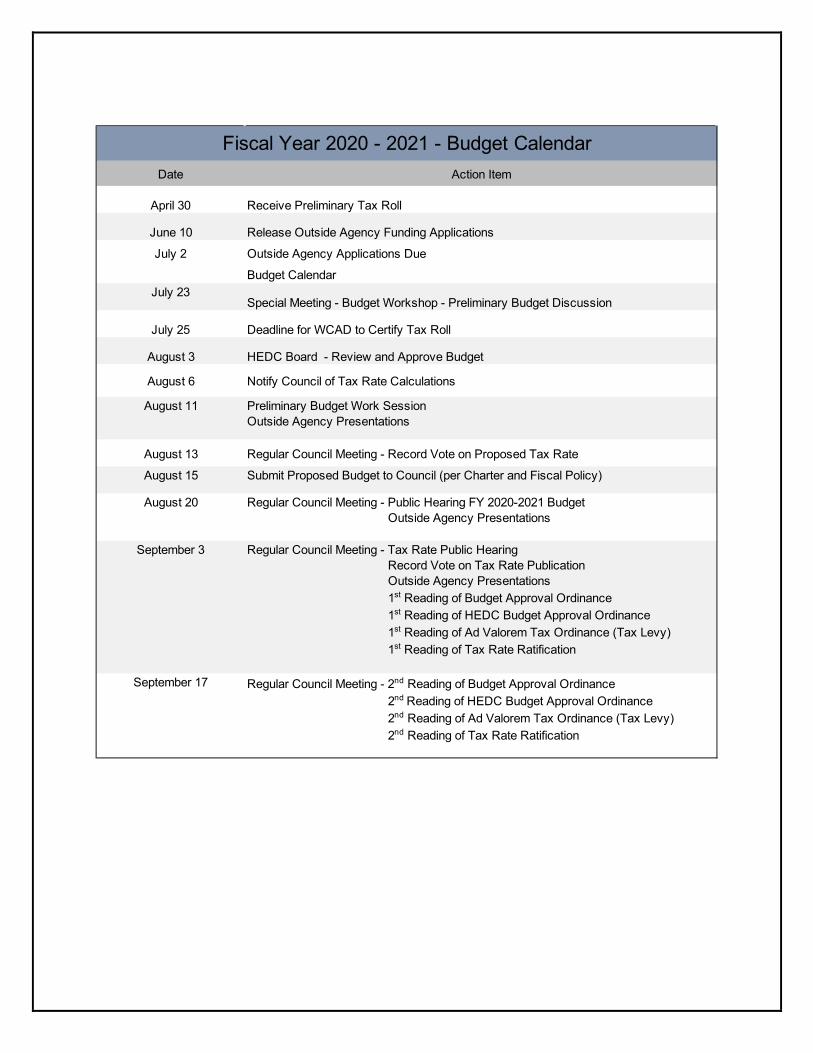
Date Action Item
April 30 Receive Preliminary Tax Roll
June 10 Release Outside Agency Funding Applications
July 2 Outside Agency Applications Due
Budget Calendar July 23
Special Meeting - Budget Workshop - Preliminary Budget Discussion
July 25 Deadline for WCAD to Certify Tax Roll
August 3 HEDC Board - Review and Approve Budget
August 6 Notify Council of Tax Rate Calculations
August 11 Preliminary Budget Work SessionOutside Agency Presentations
August 13 Regular Council Meeting - Record Vote on Proposed Tax Rate
August 15 Submit Proposed Budget to Council (per Charter and Fiscal Policy)
August 20 Regular Council Meeting - Public Hearing FY 2020-2021 Budget Outside Agency Presentations
September 3 Regular Council Meeting - Tax Rate Public Hearing Record Vote on Tax Rate Publication Outside Agency Presentations 1st Reading of Budget Approval Ordinance 1st Reading of HEDC Budget Approval Ordinance 1st Reading of Ad Valorem Tax Ordinance (Tax Levy) 1st Reading of Tax Rate Ratification
September 17 Regular Council Meeting - 2nd Reading of Budget Approval Ordinance 2nd Reading of HEDC Budget Approval Ordinance 2nd Reading of Ad Valorem Tax Ordinance (Tax Levy) 2nd Reading of Tax Rate Ratification
Fiscal Year 2020 - 2021 - Budget Calendar

Budget Overview
Sgd� oqnonr dc� EX� 1/ 1/ ,10� At cf ds� enq� sgd� Bhsx� sns kr � #14+270+270� hm� nodq shmf � dwodmr dr +�` ooqnwhl ` sdkx�#07+223+811�enq�b` ohs k�oqnidbsr +� mc�#00+803+/ 53�enq�cdas�r dquhbdr � r r nbh sdc�v hsg�dwhr shmf �cdas�nakhf ` shnmr -�V hsgnt s�` �ehql �t mcdqr s mchmf �ne�sgd�o` mcdl hb┴r �hl o` bs�nm�sgd�dbnmnl hb�nt sknnj +� bhsx� kd` cdqr gho� hr � oqnonr hmf � ` � bnmr dqu` shud� at cf ds� enq� EX� 1/ 1/ ,10-�V ghkd� sgd� Bhsx� hr �` mshbho` shmf � r ` kdr � s w� ` mc� cdudknol dms� eddr � sn� qdl ` hm� r sqnmf � ` r � hm� oqduhnt r � xd` qr +� qdudmt d�at cf dsr �qdekdbs�l hmhl ` k�f qnv sg-��Chuhr hnm k�at cf dsr �qdekdbs�` �enbt r �nm�bnqd�r dquhbdr �t mshk�r bgnnkr �` mc�at r hmdr r dr �qdnodm� ` mc� ` � cdsdql hm shnm�b` m�ad� l ` cd�nm�v g` s� sgd� ═mdv �mnql ` k║�hr �onr s,o` mcdl hb-��@r �sgd�Bhsx�ok xr �sgd�v ` hs,` mc,r dd�f ` l d+�hsr �f n` k�hr �sn�qdokdmhr g�` �chl hmhr gdc�et mc�a` k mbdr �` mc�r sq sdf hb` kkx�onr hshnm�hsr dke�enq�et st qd�bnl l t mhsx�f qnv sg�` mc�hmbqd` r dc�cdl ` mcr �nm�Bhsx�r dquhbdr -�����
Budget Priorities Sgd�Bhsx�Bnt mbhk�adf ` m�v nqj hmf �nm�` �mdv �Rsq sdf hb�Ok m�hm�sgd�ehqr s�pt ` qsdq�ne�1/ 06-�Sgdqd�v dqd�r dudq k� qdsqd` sr � v hsg� Bhsx� Bnt mbhk� ` mc� Bhsx� Rs ee+� ` r � v dkk� ` r � l ddshmf r � v hsg� An` qcr � ` mc�Bnl l hr r hnmr +�` mc�hmenql ` k�` mc�enql ` k�ot akhb�l ddshmf r �sn�nas hm�hmr hf gs�` mc�eddca` bj �eqnl �l ` mx�r s j dgnkcdqr �sn�cdudkno�sgd�mdv �Rsq sdf hb�Ok m�%�Dwdbt shnm�F t hcd+�v ghbg�v ` r �` kr n�sgdm�t oc` sdc�hm�I t md�ne�1/ 07+�` mc�hm�L ` qbg�ne�1/ 08-��@ksgnt f g�sgd�Rsq sdf hb�Ok m�v ` r �mns�t oc` sdc�hm�1/ 1/ �ct d�sn� sgd� o` mcdl hb+� sgd� oqnonr dc� EX� 1/ 1/ ,10� At cf ds� hr � hmsdmcdc� sn� bnmshmt d� sgd� r t oonqs� sgd�chqdbshudr �oqduhnt r kx�r ds-��
Operating Expenses, $25,381,381,
45.6%Capital Projects,
$18,334,922, 33%
Debt Service, $11,914,064,
21.4%
FY 2021 Budget

General Fund
The General Fund is the largest fund of the City and accounts for the general service and operations. The General Fund is where services such as Police, Development Services, Public Works, Parks and Recreation, and Administration are budgeted. The majority of the City’s employees are funded out of the General Fund.
The General Fund revenue budget totals $18.7 million, which is an increase over the prior year’s adopted budget. The General Fund expense budget totals $17.2 million, which is a decrease over the prior year’s adopted budget. City Council set the City’s ad valorem tax rate of $0.600000 per $100 of valuation.
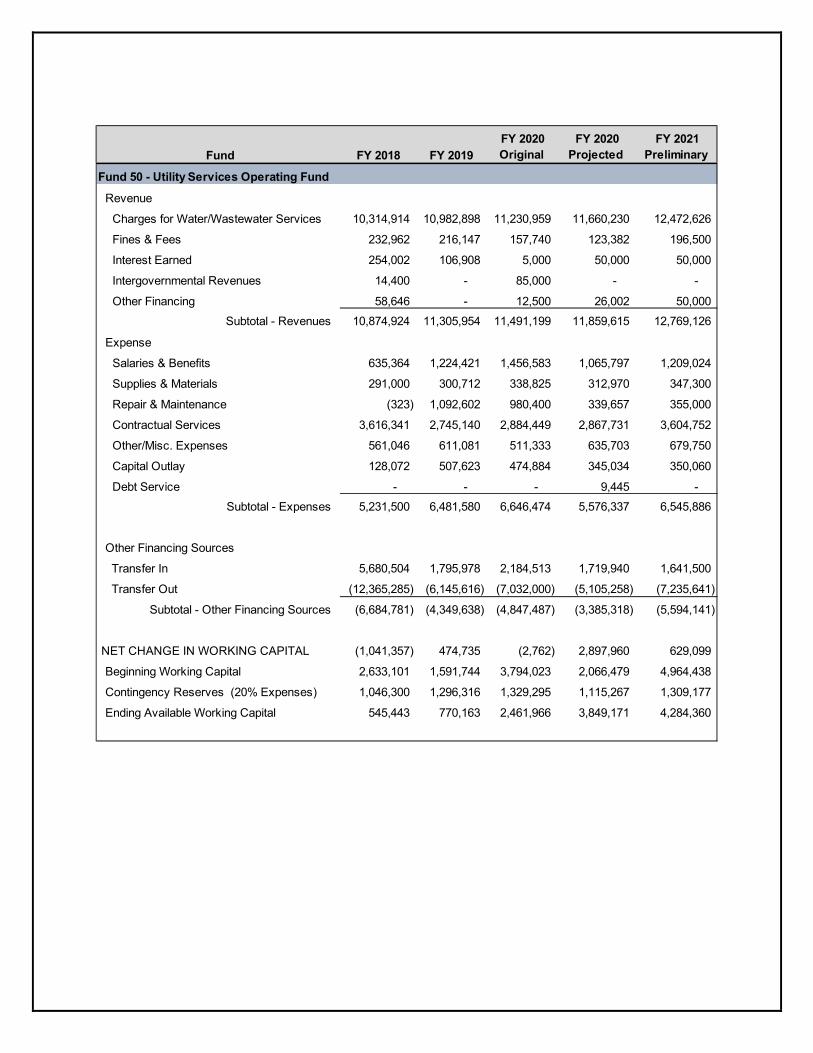
Utility Fund The Utility Fund, which accounts for the City’s water and wastewater systems, is the second major operating fund of the City. Utility Fund budgeted operational revenues total $12.8 million. Additionally, there is a transfer in of $1.5 million in impact fees and a transfer from the Solid Waste Fund for $141,500 to replenish the fund for administrative support.
Utility Fund budgeted operational expenses are proposed to total $6.5 million, with an additional $7.2 million to be spent on debt service requirements through a transfer out to the debt service fund. The majority of expenses in the Utility Fund are for contractual obligations, such as water purchase agreements and the wastewater treatment plant management agreement, payroll, maintenance and supplies. The City contracts for water with Manville Water Supply and the City of Taylor. The City contracts operation and maintenance of the wastewater treatment plants with the Brazos River Authority. As the City continues to grow, not only with more residential units, but with the addition of commercial, light industrial, and multi-use projects, the utility infrastructure will require some additions and upgrades to handle increased demands.
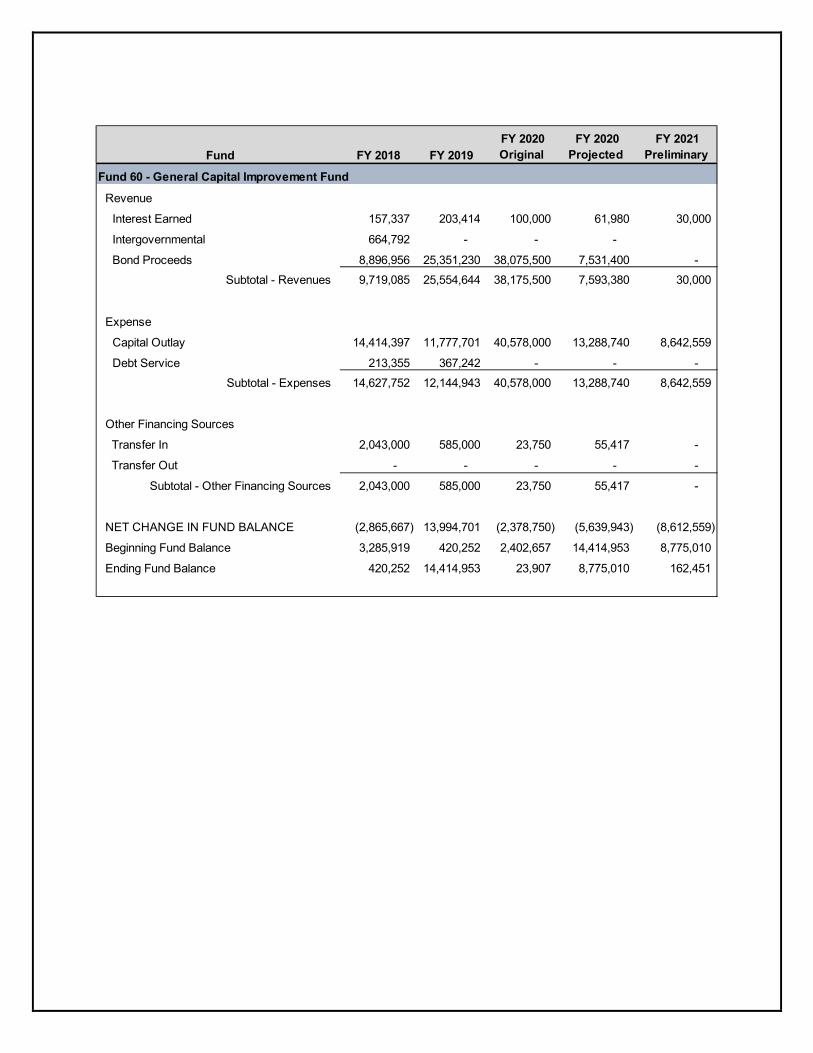
Capital Projects Due to the COVID pandemic, City Council and leadership has postponed the decision to fund new capital proiects until the pandmenic is over and/or more information becomes available on its impact on the economy as a whole --- and specifcally the City’s ability to support existing and new bond issuances. The FY 2020-21 budget contained estimates on remaining bond proceeds on hand for the completion on existing projects and any new needs that are identified. The capital budget includes approximately $18.3 million: $8.6 million in tax-supported projects and $9.7 million in utility-supported projects.
FY 2017-18 FY 2018-19 FY 2019-20 FY 2020-21
O&M Rate $0.416482 $0.389301 $0.397768 $0.405551
Debt Rate $0.098689 $0.125870 $0.233583 $0.194449Total Tax Rate $0.515171 $0.515171 $0.631351 $0.600000

ORGANIZATIONAL STRUCTURE
&
PERFORMANCE OBJECTIVES

Organizational Structure The City of Hutto is a home-rule municipality operating under a Council-Manager form of government in Central Texas. The City Manager serves as the CEO of the City. The City Manager is responsible for the day-to-day operations of the local government and its employees and reports directly to the Mayor and the City Council, who are elected on a non-partisan basis.
The City of Hutto is divided into a number of departments that are responsible for different aspects of city government under the direction of the City Manager. Executive Directors and Directors have operational responsibility for each department, ensuring that the City is effectively and efficiently fulfilling our strategic goals and concentrating on strategic focus areas approved by City Council to further the City.
City Administration City Administration is comprised of the City Manager’s Office, City Attorney, Human Resources, and Economic Development divisions.
The City Manager’s office ensures implementation of policies adopted by the City Council. This department coordinates various City events and serves as the primary point of contact and liaison to the City Council, City Attorney and the legal department, the community, the press, boards and commissions, area agencies, and other governmental bodies. It is the duty of the City Manager’s Office to ensure the effective and efficient operations of the entire organization to best meet the needs of the citizens by providing continual oversight of city staff, management of the City’s contracts, and mitigation of claims to reduce the City’s liability.
Financial Services Finance is comprised of three separate divisions. The Financial Services division plans and directs the City's financial activities and provides information to support decisions. The division analyzes financial and operational data, such as performance measures, and makes recommendations on City operations and procedures to ensure fiscal accountability and effective use of City Resources. The Municipal Court division is responsible for the judicial processing of Class C misdemeanors that originate from traffic citations, citizen complaints, code violations, and misdemeanor arrests, occurring within the city limits. The Utility Billing division provides bills and collects for all City utility services and contracted solid waste services. The office also processes requests for new and transferred service connections.
Economic Development The Economic Development division that promotes economic growth within the City. Through business recruitment and retention, the division helps to diversify the City’s tax base, create jobs, and increase the quality of life for the citizens, allowing citizens to live, work and play within in Hutto. The Economic Development division is responsible for marketing the City to prospective companies, managing and administering incentive programs for new and existing businesses.
Development Services The Development Services department is comprised of two divisions: Planning/GIS and Building. The department is responsible for the development of a healthy and vibrant city with a strong economic base, job opportunities, multiple types of commercial areas and a wide range of diversified housing. The department leads economic growth and development policies through annexation, amendments to the future land use map, updating the Unified Development Code (UDC), permitting, and processing of development applications and continuing to improve the efficiency of the one-stop-shop process.
Human Resources The Human Resources division oversees various aspects of employment, compliance with labor law and employment standards, administration of employee benefits, organizing of employee’s files including Local Government record retention requirements recruitment and retention.
Communications The Communications department is comprised of several divisions that ensure the City and its customers stay connected. The Communications and Community Relations divisions are responsible for creating and enabling communication between the City of Hutto as an organization and both news media outlets and the general public. The Community Relations team is responsible for supporting the local hospitality and tourism industry as well as organizing and producing citywide community events. The City Secretary’s office serves as liaison between the City Council and the public to provide highly responsible and complex administrative support to the Mayor, City Council, and City Manager. Information Technology is responsible for the architecture, hardware, software, and networking of all information devices owned and operated by the City of Hutto. They are charged with establishing, monitoring, and maintaining the City’s information technology systems and services. The City of Hutto Public Library is responsible the educational, informational, cultural, and recreational needs of all its patrons through the services offered in a modern public library.
Community Services The Community Services department is internally and externally focused on customer service. The Community Services team is made up of Parks and Recreation, Grounds Maintenance, Fleet Management, and Building Maintenance. Parks and Recreation members coordinate inter-departmental review of plans and programs and prepares staff reports, agendas, and minutes for the Parks Advisory Board to the City Council. Additionally, they are responsible for providing park amenities, acquiring park property, and increasing recreational opportunities for the citizens of Hutto. Grounds Maintenance is responsible for maintaining all of the parks, trails, pavilions, and parks assets (i.e., playgrounds and splash pads). Fleet Management ensures City vehicles are operating smoothly, seeks ways to improve performance, strives to keep operation costs at a minimum, and maintains compliance with Texas vehicle regulations. The Building Maintenance division is responsible for managing the maintenance of the new city hall facility, as well as all other City-owned facilities.
Public Works & Engineering Public Works and Engineering consists of four separate teams that work together to achieve City goals. Public Works has two of the three teams: Waste/Wastewater services, which ensures an adequate supply of potable and palatable water at continuous pressure and ensures an adequate capacity for wastewater flow to the treatment plant, and Streets and Drainage, which is responsible for the maintenance of road striping, signs, crack sealing, street repairs, curb-gutter, and sidewalk repairs on City streets, right of ways and drainage. The third and fourth team, the Engineering department, and Construction Inspection, work together have responsibility for reviewing subdivision plats and private development engineering plans while maintaining the City's Construction Standards and Design Criteria. They oversee construction to ensure that the City's infrastructure is built to City Code and complies with approved plans and contract documents.

Police The City of Hutto Police Department is comprised of several divisions which operate as a single cohesive unit. The Administrative division is responsible for managing all activities of the Police Department. The Criminal Investigations division is responsible investigating criminal cases, sex offender registration and tracking, responding to major crime scenes, criminal interviews, and staffing cases with the prosecutors. The Support Services division is responsible for all tasks not related to patrol or investigations, such as evidence collection from major crime scenes, securing and tracking all stored evidence and property, professional standards / training, code enforcement, and animal control and community resource/outreach programs. The Patrol division is responsible for the 24-hours-a-day tasks of preventing criminal activity, responding to calls for assistance, conducting preliminary criminal investigations, apprehending criminals, enforcing traffic laws, and investigating crashes.
Personnel Summary The city has seen tremendous growth in residential and business development in the past few years. As a result, staffing levels have slowly increased due to service demands, with the majority of the increases in our Police and Public Works (Streets, Drainage, Water, and Wastewater) departments. The trend is illustrated below:
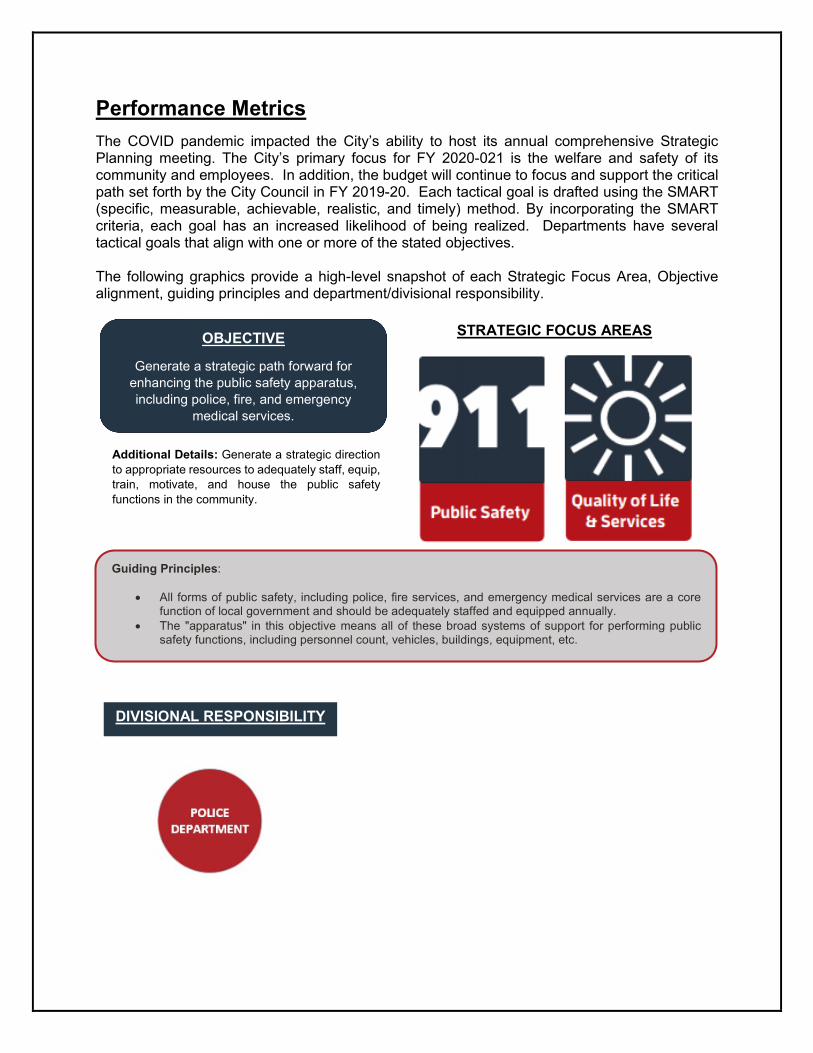
Additional Details: Generate a strategic direction to appropriate resources to adequately staff, equip, train, motivate, and house the public safety functions in the community.
STRATEGIC FOCUS AREAS
DIVISIONAL RESPONSIBILITY
Performance Metrics The COVID pandemic impacted the City’s ability to host its annual comprehensive Strategic Planning meeting. The City’s primary focus for FY 2020-021 is the welfare and safety of its community and employees. In addition, the budget will continue to focus and support the critical path set forth by the City Council in FY 2019-20. Each tactical goal is drafted using the SMART (specific, measurable, achievable, realistic, and timely) method. By incorporating the SMART criteria, each goal has an increased likelihood of being realized. Departments have several tactical goals that align with one or more of the stated objectives. The following graphics provide a high-level snapshot of each Strategic Focus Area, Objective alignment, guiding principles and department/divisional responsibility.
OBJECTIVE
Generate a strategic path forward for enhancing the public safety apparatus, including police, fire, and emergency
medical services.
Guiding Principles:
• All forms of public safety, including police, fire services, and emergency medical services are a core function of local government and should be adequately staffed and equipped annually.
• The "apparatus" in this objective means all of these broad systems of support for performing public safety functions, including personnel count, vehicles, buildings, equipment, etc.
STRATEGIC FOCUS AREAS
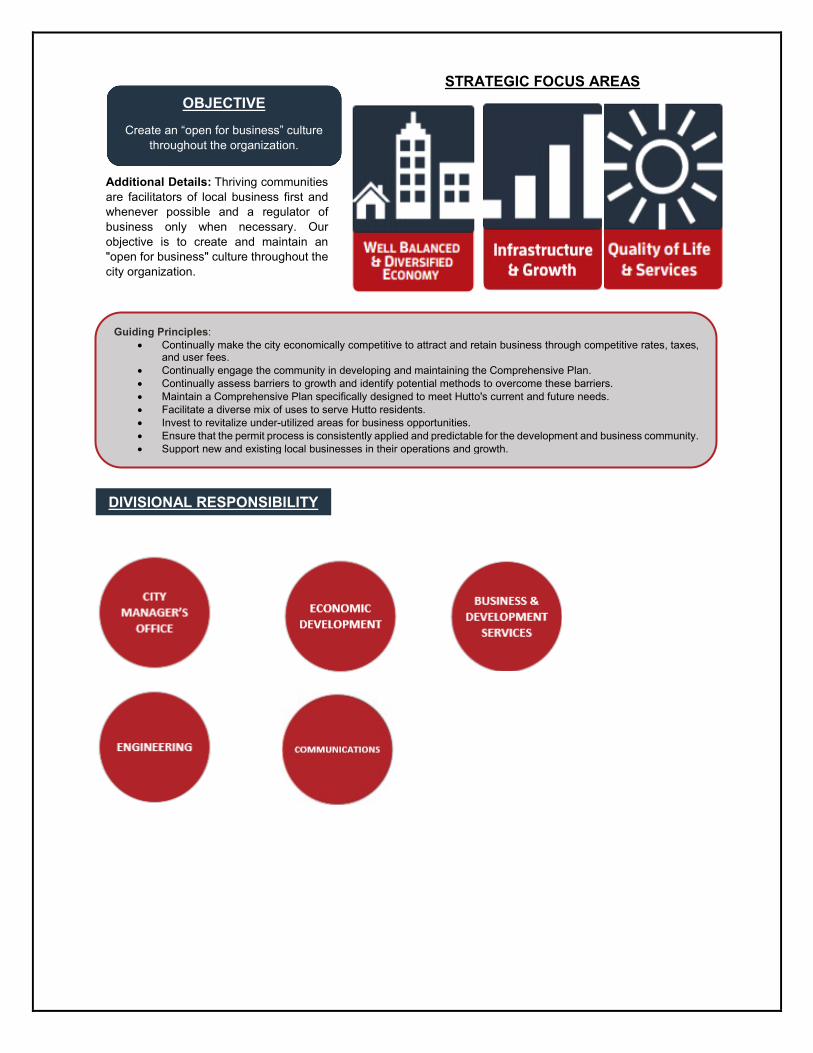
Additional Details: Thriving communities are facilitators of local business first and whenever possible and a regulator of business only when necessary. Our objective is to create and maintain an "open for business" culture throughout the city organization.
DIVISIONAL RESPONSIBILITY
OBJECTIVE Create an “open for business” culture
throughout the organization.
Guiding Principles: • Continually make the city economically competitive to attract and retain business through competitive rates, taxes,
and user fees. • Continually engage the community in developing and maintaining the Comprehensive Plan. • Continually assess barriers to growth and identify potential methods to overcome these barriers. • Maintain a Comprehensive Plan specifically designed to meet Hutto's current and future needs. • Facilitate a diverse mix of uses to serve Hutto residents. • Invest to revitalize under-utilized areas for business opportunities. • Ensure that the permit process is consistently applied and predictable for the development and business community. • Support new and existing local businesses in their operations and growth.

STRATEGIC FOCUS AREAS
DIVISIONAL RESPONSIBILITY
Additional Details: Economic Development is at the heart of Hutto's growth. To create a thriving community, we will have to be both aggressive and progressive in our economic development efforts.
OBJECTIVE
Create an aggressive, progressive economic development strategy for the community.
Guiding Principles: • Pursue a financially-sustaining development pattern. • Encourage infill development to maximize the use of existing infrastructure. • Ensure a city-wide jobs-housing balance. • Maximize the potential of intellectual capital. • Advance Hutto as a place for a qualified, diverse workforce. • Advocate Hutto as an economic hub for rail-served industry. • Encourage a mix of residential, retail, restaurant, and office use. • Encourage business development that promotes quality of place. • Invest to revitalize under-utilized areas for business opportunities. • Support new and existing local businesses in their operations and growth.

STR
ATEG
IC F
OC
US
AREA
S
Additional Details: In order to create a thriving community, City staff members need to be fully engaged in service to the public. In order to be fully engaged, the organization must continually cultivate a positive and inspiring workplace culture.
DIVISIONAL RESPONSIBILITY
Guiding Principles: • Provide continuing education opportunities for employees. • Maintain a highly effective police force. • Recruit and retain a highly effective Police force. • Departments should use succession planning to train and promote from within where feasible.
OBJECTIVE
Maintain a positive and inspired workforce.

STRATEGIC FOCUS AREA
Additional Details: We believe that all people can thrive when we are serving one another. Our objective is to implement a culture of service across the entire City of Hutto organization, and to provide outstanding customer service in all aspects of what we do.
DIVISIONAL RESPONSIBILITY
OBJECTIVE
Implement a quality city-wide customer service program.
Guiding Principles: • Provide on-going and consistent citizen communications. • Maintain strong relationships between the Police Department and the community. • Our customers are our citizens, property owners, the City Council, volunteer boards and commissions, institutions,
businesses, the development community and anyone that invests their time, energy, effort, or money into the City of Hutto.
STR
ATEG
IC F
OC
US
AREA
S
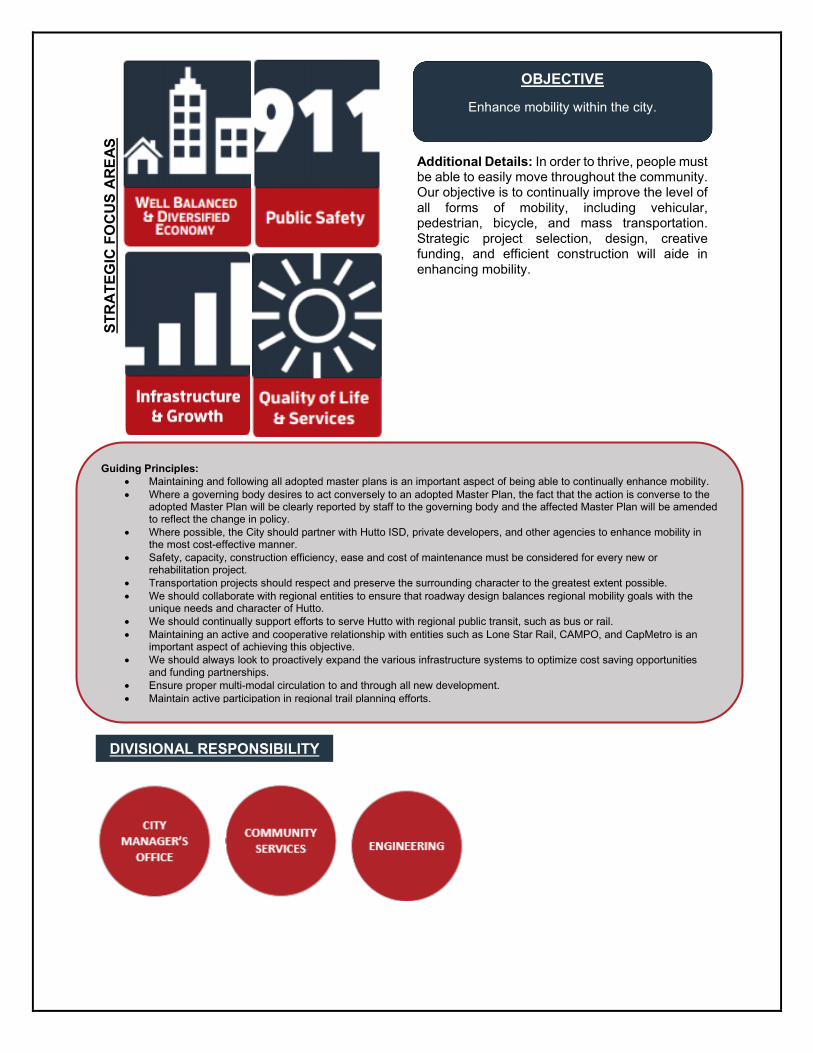
Additional Details: In order to thrive, people must be able to easily move throughout the community. Our objective is to continually improve the level of all forms of mobility, including vehicular, pedestrian, bicycle, and mass transportation. Strategic project selection, design, creative funding, and efficient construction will aide in enhancing mobility.
OBJECTIVE
Enhance mobility within the city.
DIVISIONAL RESPONSIBILITY
Guiding Principles: • Maintaining and following all adopted master plans is an important aspect of being able to continually enhance mobility. • Where a governing body desires to act conversely to an adopted Master Plan, the fact that the action is converse to the
adopted Master Plan will be clearly reported by staff to the governing body and the affected Master Plan will be amended to reflect the change in policy.
• Where possible, the City should partner with Hutto ISD, private developers, and other agencies to enhance mobility in the most cost-effective manner.
• Safety, capacity, construction efficiency, ease and cost of maintenance must be considered for every new or rehabilitation project.
• Transportation projects should respect and preserve the surrounding character to the greatest extent possible. • We should collaborate with regional entities to ensure that roadway design balances regional mobility goals with the
unique needs and character of Hutto. • We should continually support efforts to serve Hutto with regional public transit, such as bus or rail. • Maintaining an active and cooperative relationship with entities such as Lone Star Rail, CAMPO, and CapMetro is an
important aspect of achieving this objective. • We should always look to proactively expand the various infrastructure systems to optimize cost saving opportunities
and funding partnerships. • Ensure proper multi-modal circulation to and through all new development. • Maintain active participation in regional trail planning efforts.
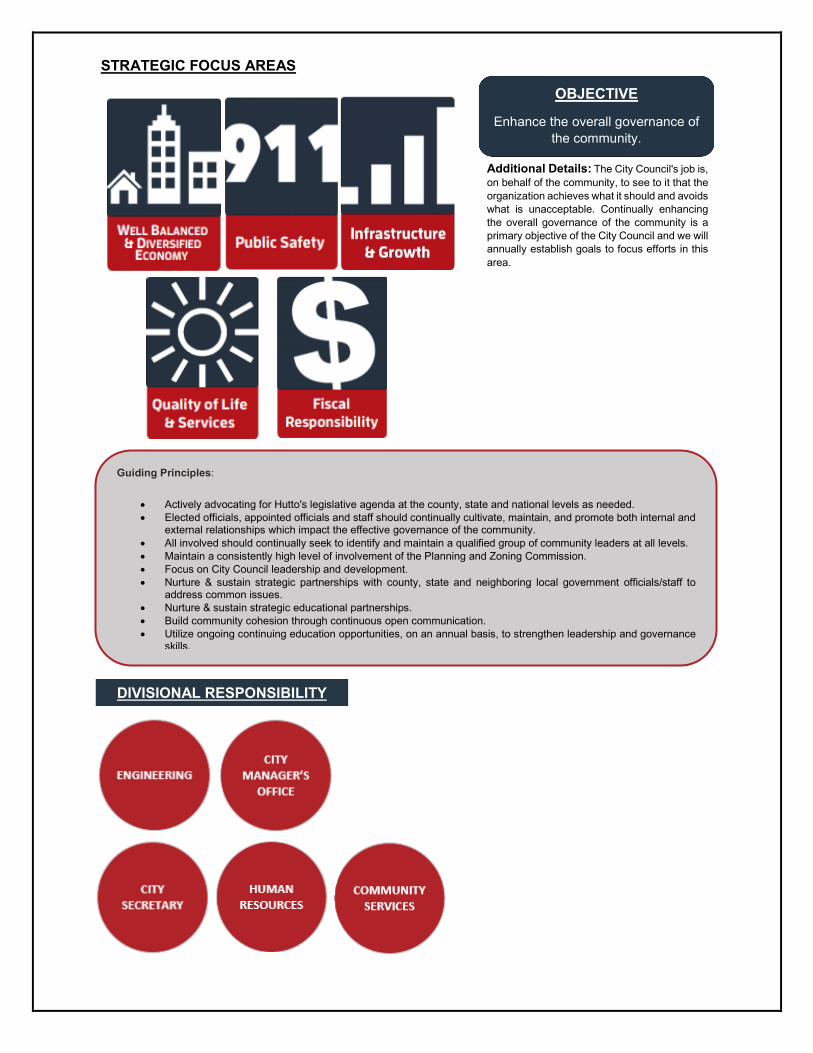
Additional Details: The City Council's job is, on behalf of the community, to see to it that the organization achieves what it should and avoids what is unacceptable. Continually enhancing the overall governance of the community is a primary objective of the City Council and we will annually establish goals to focus efforts in this area.
DIVISIONAL RESPONSIBILITY
STRATEGIC FOCUS AREAS
OBJECTIVE
Enhance the overall governance of the community.
Guiding Principles:
• Actively advocating for Hutto's legislative agenda at the county, state and national levels as needed. • Elected officials, appointed officials and staff should continually cultivate, maintain, and promote both internal and
external relationships which impact the effective governance of the community. • All involved should continually seek to identify and maintain a qualified group of community leaders at all levels. • Maintain a consistently high level of involvement of the Planning and Zoning Commission. • Focus on City Council leadership and development. • Nurture & sustain strategic partnerships with county, state and neighboring local government officials/staff to
address common issues. • Nurture & sustain strategic educational partnerships. • Build community cohesion through continuous open communication. • Utilize ongoing continuing education opportunities, on an annual basis, to strengthen leadership and governance
skills.
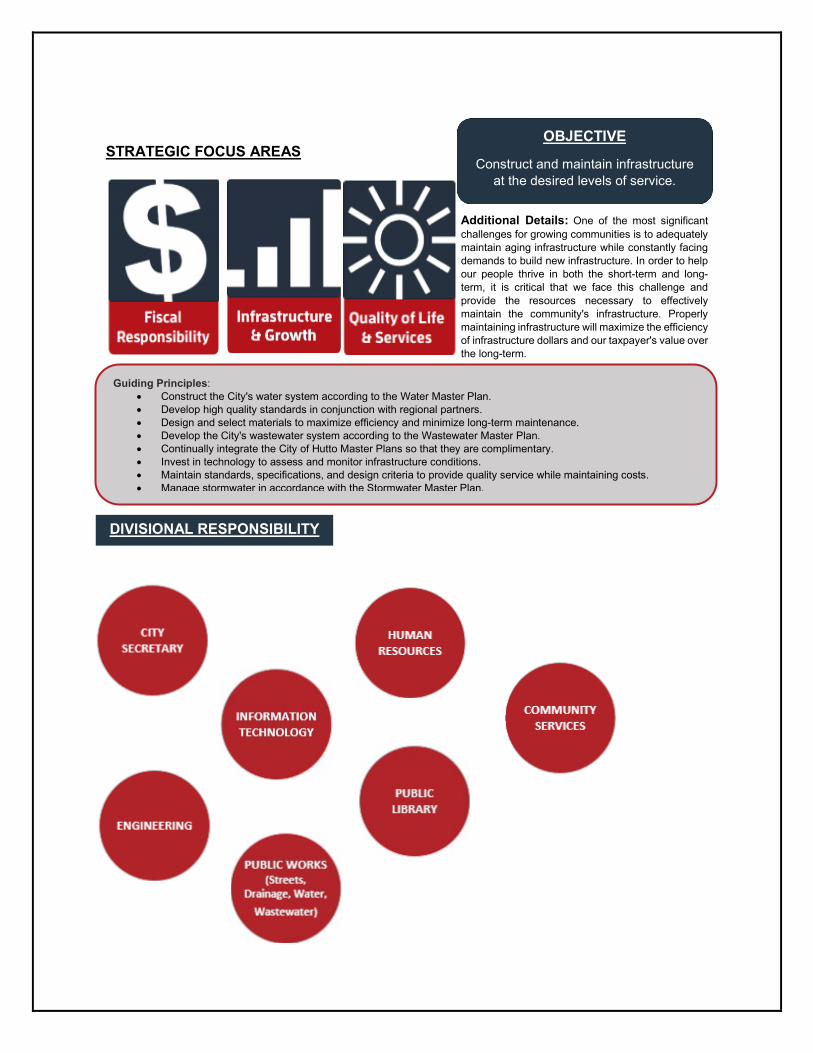
Additional Details: One of the most significant challenges for growing communities is to adequately maintain aging infrastructure while constantly facing demands to build new infrastructure. In order to help our people thrive in both the short-term and long-term, it is critical that we face this challenge and provide the resources necessary to effectively maintain the community's infrastructure. Properly maintaining infrastructure will maximize the efficiency of infrastructure dollars and our taxpayer's value over the long-term.
STRATEGIC FOCUS AREAS
OBJECTIVE
Construct and maintain infrastructure at the desired levels of service.
Guiding Principles: • Construct the City's water system according to the Water Master Plan. • Develop high quality standards in conjunction with regional partners. • Design and select materials to maximize efficiency and minimize long-term maintenance. • Develop the City's wastewater system according to the Wastewater Master Plan. • Continually integrate the City of Hutto Master Plans so that they are complimentary. • Invest in technology to assess and monitor infrastructure conditions. • Maintain standards, specifications, and design criteria to provide quality service while maintaining costs. • Manage stormwater in accordance with the Stormwater Master Plan.
DIVISIONAL RESPONSIBILITY

STR
ATEG
IC F
OC
US
AREA
Additional Details: Stewardship is the responsible care and oversight of the resources made available by the citizens and customers of the City of Hutto to effectively manage the governmental responsibilities of the community. Continued fiscal stewardship is critical to creating an opportunity for people to thrive in the long-term.
DIVISIONAL RESPONSIBILITY
OBJECTIVE
Ensure responsible fiscal stewardship through transparency and reporting.
Guiding Principles: • Provide funding for infrastructure to sustain growth. • Embrace the use of technology to enhance or reduce the cost of service delivery. • Reduce energy consumption and encourage the use of alternative and renewable energy sources. • Continually seek to stabilize and control program costs.
STR
ATEG
IC F
OC
US
AREA
S
DIVISIONAL RESPONSIBILITY
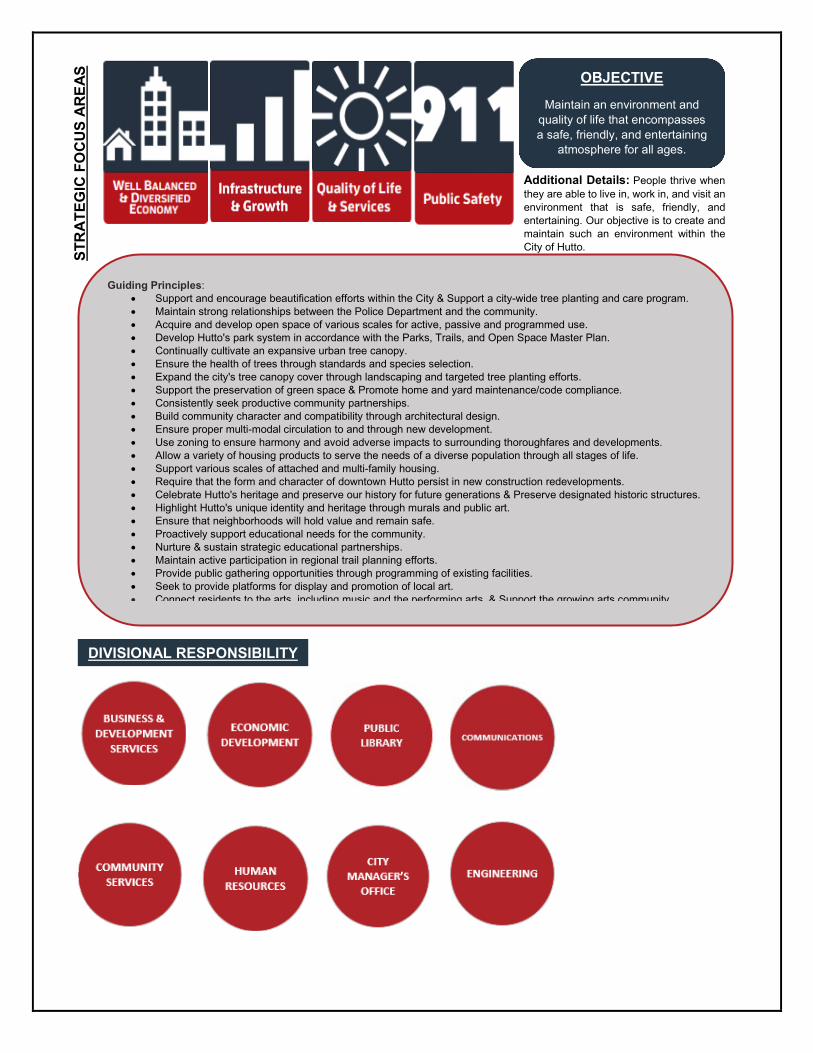
Additional Details: People thrive when they are able to live in, work in, and visit an environment that is safe, friendly, and entertaining. Our objective is to create and maintain such an environment within the City of Hutto.
OBJECTIVE
Maintain an environment and quality of life that encompasses a safe, friendly, and entertaining
atmosphere for all ages.
Guiding Principles: • Support and encourage beautification efforts within the City & Support a city-wide tree planting and care program. • Maintain strong relationships between the Police Department and the community. • Acquire and develop open space of various scales for active, passive and programmed use. • Develop Hutto's park system in accordance with the Parks, Trails, and Open Space Master Plan. • Continually cultivate an expansive urban tree canopy. • Ensure the health of trees through standards and species selection. • Expand the city's tree canopy cover through landscaping and targeted tree planting efforts. • Support the preservation of green space & Promote home and yard maintenance/code compliance. • Consistently seek productive community partnerships. • Build community character and compatibility through architectural design. • Ensure proper multi-modal circulation to and through new development. • Use zoning to ensure harmony and avoid adverse impacts to surrounding thoroughfares and developments. • Allow a variety of housing products to serve the needs of a diverse population through all stages of life. • Support various scales of attached and multi-family housing. • Require that the form and character of downtown Hutto persist in new construction redevelopments. • Celebrate Hutto's heritage and preserve our history for future generations & Preserve designated historic structures. • Highlight Hutto's unique identity and heritage through murals and public art. • Ensure that neighborhoods will hold value and remain safe. • Proactively support educational needs for the community. • Nurture & sustain strategic educational partnerships. • Maintain active participation in regional trail planning efforts. • Provide public gathering opportunities through programming of existing facilities. • Seek to provide platforms for display and promotion of local art. • Connect residents to the arts including music and the performing arts & Support the growing arts community

FUND STRUCTURE
&
BASIS OF BUDGETING

Fund Structure & Basis of Budgeting The city uses fund accounting to ensure compliance with finance-related legal and regulatory requirements and to safeguard one of our strategic goals of being fiscally responsible. A fund is an accounting entity that has a set of self-balancing accounts and that records all financial transactions for specific activities or government functions. The city’s funds can be divided into two categories: governmental funds and proprietary funds.
Governmental Funds Governmental funds consist of the General Fund, Special Revenue Funds, Capital Projects Fund and the Debt Service Funds. Most governmental functions of the city are financed through these funds. Governmental funds are supported by taxes and intergovernmental revenues. A modified accrual basis of accounting is used for the budgets of all governmental funds.
General The General Fund is the largest fund of the City and accounts for general service and operations. The General Fund is where services such as Police, Development Services, Public Works, Parks and Recreation and Administration are budgeted. The majority of the City’s employees are funded out of the General Fund.
Special Revenue The Special Revenue Funds collect funds from specific revenue resources committed to expenditure for specific purposes. The fund usage is restricted to specific projects. This fund type adds an extra level of transparency and accountability to taxpayers as it shows exactly where their tax dollars are going.
GOVERNMENTAL
GENERAL
SPECIAL REVENUE
CAPITAL PROJECT
DEBT SERVICE
PROPRIETARY
ENTERPRISE

Capital Project The Capital Projects Fund is used to account for all the City’s capital projects. Such projects include roads, bridges, drainage, park development, and construction of facilities necessary to provide City services.
Debt Service The Debt Services Fund is a reserve account use to pay for principal and interest obligations for bonds and other debt instruments according to a pre-determined payment schedule.
Proprietary Funds A proprietary fund is used to account for activities that involve business-like interactions, either within the local government or outside of it. While there are two types of proprietary funds, the City only utilizes enterprise funds.
Enterprise Funds Enterprise Funds account for operations similar to those found in the private sector and include�sgd�Tshkhsx�Et mc+�Hl o` bs�Edd�Et mc+�Tshkhsx�BHO�Et mc+�` mc�Tshkhsx�Cdas�Rdquhbd�Et mc-
Fund/Department Matrix The fund matrix below lists each City department and identifies which fund(s) each currently utilizes. The matrix is not intended to be inclusive. A department may have legal authority to utilize a particular fund; but due to internal processes and/or balance availability, may not employ its use.
DepartmentsCity
Administration Police Finance CommunicationsCommunity
ServicesDevelopment
ServicesPublic Works &
Engineering
General • • • • • • •Capital Improvement • • • •Capital Replacement •Drainage •Court Fees •Hotel Tax •PEG •Red Light Camera •Special Events •Park Improvement •General Debt Service •Solid Waste •Utility • •
GOVERNMENTAL FUNDS
ENTERPRISE FUNDS
The City uses a modified accrual basis of accounting. Modified accrual accounting combines accrual accounting and cash basis accounting, this means transactions are recognized when they occur, regardless of the timing of related cash flows.
Accrual accounting is effective for ensuring fiscal responsibility. With an accrual accounting method, the City receives a more immediate reflection of how much money is coming in, as well as what can be expected on future expense reports. With this type of recording methodology, financial analysts can look for financial trends and compute current cash flow statements on a regular basis -- keeping the citizens, the Council, and departments as up to date as possible.
Basis of Budgeting
FUNDS

Fund FY 2018 FY 2019 FY 2020Original
FY 2020Projected
FY 2021Preliminary
Fund 10 - General Fund
Revenues
Charges for Services 255,103 326,752 284,544 136,365 210,449
Fines & Fees 262,894 307,311 345,064 234,486 302,500
Franchise Fees 931,156 909,969 1,051,697 966,849 1,048,000
Interest Earned 71,662 177,632 65,000 90,900 150,000
Intergovernmental Revenues 269,253 16,900 7,500 14,400 14,400
Other Revenues 71,823 482,270 130,794 38,432 82,700
Permits & Licenses 1,647,340 2,754,193 2,834,980 3,068,953 3,390,800
Property Taxes 7,038,195 7,338,048 7,871,045 7,659,670 7,809,061
Revenue - Sales & Liquor Tax 3,680,409 4,308,332 5,561,432 5,343,001 5,679,515
Transfers from Other Funds - - - - - Subtotal - Revenues 14,227,835 16,621,408 18,152,056 17,553,055 18,687,425
Expense
Salaries & Benefits 8,713,793 12,011,731 14,094,996 10,918,168 10,636,419
Supplies & Materials 894,883 1,107,494 1,260,580 888,848 896,085
Repair & Maintenance 217,348 209,839 435,700 293,475 712,851
Contractual Services 1,854,220 2,623,641 2,536,147 3,401,923 3,183,993
Other/Misc. Expenses 1,124,274 1,372,721 1,135,954 1,116,752 1,303,290
Capital Outlay - 753,965 299,900 - 440,000
Debt Service 210,984 - 385,727 - - Subtotal - Expenses 13,015,502 18,079,390 20,149,004 16,619,166 17,172,638
Other Financing Sources
Sale of Assets 283,000 - - - 10,000
Transfer In 191,376 150,000 1,381,220 667,989 300,000
Transfer Out (2,897,505) (1,084,707) (47,500) (184,245) (25,000)
Subtotal - Other Financing Sources (2,423,129) (934,707) 1,333,720 483,744 285,000
NET CHANGE IN FUND BALANCE (1,210,796) (2,392,690) (663,228) 1,417,633 1,799,787
Beginning Fund Balance 4,831,933 3,621,137 4,694,203 1,228,447 2,646,080
Ending Fund Balance 3,621,137 1,228,447 4,030,975 2,646,080 4,445,867
Contingency Reserves (10%) (2019 - 7.5%) 1,301,550 - 4,029,801 1,661,917 1,717,264
Unreserved Ending Fund Balance 2,319,587 - 1,174 984,163 2,728,603
Fund FY 2018 FY 2019 FY 2020Original
FY 2020Projected
FY 2021Preliminary
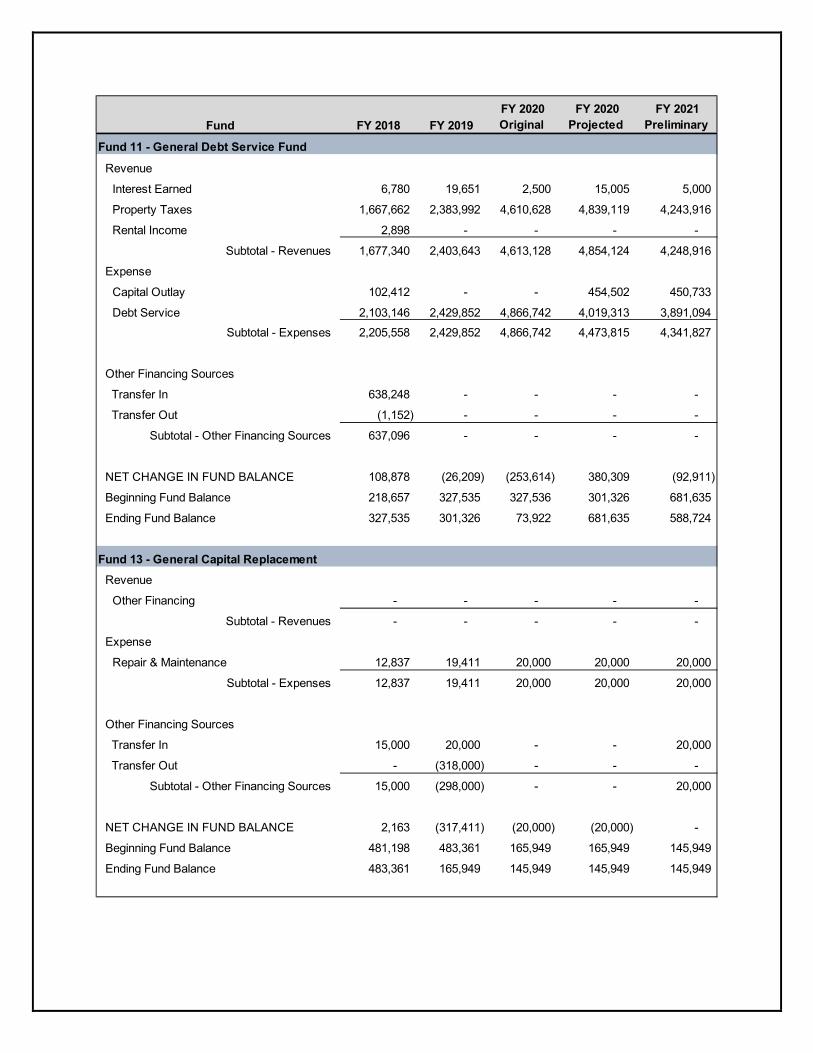
Fund 11 - General Debt Service Fund
Revenue
Interest Earned 6,780 19,651 2,500 15,005 5,000
Property Taxes 1,667,662 2,383,992 4,610,628 4,839,119 4,243,916
Rental Income 2,898 - - - -
Subtotal - Revenues 1,677,340 2,403,643 4,613,128 4,854,124 4,248,916
Expense
Capital Outlay 102,412 - - 454,502 450,733
Debt Service 2,103,146 2,429,852 4,866,742 4,019,313 3,891,094 Subtotal - Expenses 2,205,558 2,429,852 4,866,742 4,473,815 4,341,827
Other Financing Sources
Transfer In 638,248 - - - -
Transfer Out (1,152) - - - -
Subtotal - Other Financing Sources 637,096 - - - -
NET CHANGE IN FUND BALANCE 108,878 (26,209) (253,614) 380,309 (92,911)
Beginning Fund Balance 218,657 327,535 327,536 301,326 681,635
Ending Fund Balance 327,535 301,326 73,922 681,635 588,724
Fund 13 - General Capital ReplacementRevenue
Other Financing - - - - -
Subtotal - Revenues - - - - -
Expense
Repair & Maintenance 12,837 19,411 20,000 20,000 20,000
Subtotal - Expenses 12,837 19,411 20,000 20,000 20,000
Other Financing Sources
Transfer In 15,000 20,000 - - 20,000
Transfer Out - (318,000) - - -
Subtotal - Other Financing Sources 15,000 (298,000) - - 20,000
NET CHANGE IN FUND BALANCE 2,163 (317,411) (20,000) (20,000) -
Beginning Fund Balance 481,198 483,361 165,949 165,949 145,949
Ending Fund Balance 483,361 165,949 145,949 145,949 145,949

Fund FY 2018 FY 2019 FY 2020Original
FY 2020Projected
FY 2021Preliminary
Fund 15 - Jury Municipal CourtRevenue
Court Revenue - - 31 72
Subtotal - Revenues - - - 31 72
Expense
Other/Misc. Expenses - - - - -
Subtotal - Expenses - - - - -
NET CHANGE IN FUND BALANCE - - - 31 72
Beginning Fund Balance - - - - 31
Ending Fund Balance - - - 31 103
Fund 16 - Truancy Municipal CourtRevenue
Court Revenue - - 1,427 3,000
Subtotal - Revenues - - - 1,427 3,000
NET CHANGE IN FUND BALANCE - - - 1,427 3,000
Beginning Fund Balance - - - - 1,427
Ending Fund Balance - - - 1,427 4,427
Fund 20 - Court Technology FundRevenue
Court Revenue 6,232 6,568 3,500 5,389 7,200
Subtotal - Revenues 6,232 6,568 3,500 5,389 7,200
Expense
Supplies & Materials 1,311 340 - 2,720 2,200
Contractual Services 11,204 8,896 - 2,955 5,000
Subtotal - Expenses 12,515 9,235 - 5,675 7,200
NET CHANGE IN FUND BALANCE (6,283) (2,667) 3,500 (286) -
Beginning Fund Balance 9,600 3,317 280 649 364
Ending Fund Balance 3,317 649 3,780 364 364

Fund FY 2018 FY 2019 FY 2020Original
FY 2020Projected
FY 2021Preliminary
Fund 21 - Court Security FundRevenue
Court Revenue 4,674 5,013 5,100 4,540 6,000
Subtotal - Revenues 4,674 5,013 5,100 4,540 6,000
Expense
Salaries & Benefits 9,259 6,519 - 511 2,500
Supplies & Materials 1,832 1,010 250 - -
Other/Misc. Expenses 250 995 - - 1,000
Subtotal - Expenses 11,340 8,524 250 511 3,500
NET CHANGE IN FUND BALANCE (6,667) (3,511) 4,850 4,030 2,500
Beginning Fund Balance 27,791 21,125 4,470 17,613 21,643
Ending Fund Balance 21,125 17,613 9,320 21,643 24,143
Fund 22 - Court Training FundRevenue
Court Revenue 353 435 500 450 600
Subtotal - Revenues 353 435 500 450 600
NET CHANGE IN FUND BALANCE 353 435 500 450 600
Beginning Fund Balance 2,153 2,506 2,550 2,941 3,391
Ending Fund Balance 2,506 2,941 3,050 3,391 3,991
Fund 23 - Special EventsRevenue
Charges for Services - - 250,000 - -
Other Financing - - - - - Subtotal - Revenues - - 250,000 - -
Expense
Contractual Services 26,250 306,869 500,000 - - Subtotal - Expenses 26,250 306,869 500,000 - -
Other Financing Sources
Transfer In - 150,000 250,000 183,119 -
Transfer Out - - - - -
Subtotal - Other Financing Sources - 150,000 250,000 183,119 -
NET CHANGE IN FUND BALANCE (26,250) (156,869) - 183,119 -
Beginning Fund Balance - (26,250) - (183,119) -
Ending Fund Balance (26,250) (183,119) - - -

Fund FY 2018 FY 2019 FY 2020Original
FY 2020Projected
FY 2021Preliminary
Fund 24 - Hotel Tax Fund
Revenue
Hotel Tax 271,387 227,350 250,000 129,738 175,000 Subtotal - Revenues 271,387 227,350 250,000 129,738 175,000
Expense
Contractual Services 230,665 - 5,000 5,000 5,000
Other Financing Uses - - - - - Subtotal - Expenses 230,665 - 5,000 5,000 5,000
Other Financing Sources
Transfer In - - - - -
Transfer Out (95,000) (150,000) (250,000) (183,119) (300,000)
Subtotal - Other Financing Sources (95,000) (150,000) (250,000) (183,119) (300,000)
NET CHANGE IN FUND BALANCE (54,278) 77,350 (5,000) (58,381) (130,000)
Beginning Fund Balance 181,805 127,527 70,811 204,877 146,496
Ending Fund Balance 127,527 204,877 65,811 146,496 16,496
Fund 25 - Hutto Police Seizure Fund
Revenue 1,199 11,544 - - 5,000 Subtotal - Revenues 1,199 11,544 - - 5,000
Expense
Supplies & Materials - 8,686 - - 10,000 Subtotal - Expenses - 8,686 - - 10,000
Other Financing Sources
Transfer In - - - - -
Transfer Out - - - - -
Subtotal - Other Financing Sources - - - - -
NET CHANGE IN FUND BALANCE 1,199 2,859 - - (5,000)
Beginning Fund Balance 14,242 15,441 - 18,299 18,299
Ending Fund Balance 15,441 18,299 - 18,299 13,299

Fund FY 2018 FY 2019 FY 2020Original
FY 2020Projected
FY 2021Preliminary
Fund 26 - ATS Red Light Camera Fund
Revenue
Fines & Fees 5,498 4,736 10,000 - - Subtotal - Revenues 5,498 4,736 10,000 - -
Expense
Contractual Services 6,079 753 10,000 367 500 Subtotal - Expenses 6,079 753 10,000 367 500
Other Financing Sources
Transfer In - - - - -
Transfer Out - - - - -
Subtotal - Other Financing Sources - - - - -
NET CHANGE IN FUND BALANCE (581) 3,983 - (367) (500)
Beginning Fund Balance 95,947 95,367 85,370 99,350 98,983
Ending Fund Balance 95,367 99,350 85,370 98,983 98,483
Fund 27 - PEG Capital Fund
Revenue
Franchise Fees 48,933 40,757 38,723 36,264 45,000 Subtotal - Revenues 48,933 40,757 38,723 36,264 45,000
Expense
Supplies & Materials 36,228 81,908 75,000 15,096 20,000
Contractual Services - 4,219 25,500 5,000 25,000 Subtotal - Expenses 36,228 86,126 100,500 20,096 45,000
Other Financing Sources
Transfer In - - - - -
Transfer Out - - - - -
Subtotal - Other Financing Sources - - - - -
NET CHANGE IN FUND BALANCE 12,705 (45,369) (61,777) 16,168 -
Beginning Fund Balance 81,789 94,494 101,577 49,125 65,292
Ending Fund Balance 94,494 49,125 39,800 65,292 65,292

Fund FY 2018 FY 2019 FY 2020Original
FY 2020Projected
FY 2021Preliminary
Fund 40 - Park Improvement Fund
Revenue
Interest Earned 6,210 54,345 2,500 33,562 12,000
Park Land Fees 192,724 149,841 200,000 250,051 250,000 Subtotal - Revenues 198,933 204,186 202,500 283,613 262,000
Expense
Capital Outlay 47,909 6,850 - - Subtotal - Expenses 47,909 6,850 - - -
Other Financing Sources
Transfer In - - - - -
Transfer Out - - - - -
Subtotal - Other Financing Sources - - - - -
NET CHANGE IN FUND BALANCE 151,024 197,336 202,500 283,613 262,000
Beginning Fund Balance 315,792 466,816 438,016 664,152 947,765
Ending Fund Balance 466,816 664,152 640,516 947,765 1,209,765
Fund FY 2018 FY 2019 FY 2020Original
FY 2020Projected
FY 2021Preliminary
Fund 50 - Utility Services Operating Fund
Revenue
Charges for Water/Wastewater Services 10,314,914 10,982,898 11,230,959 11,660,230 12,472,626
Fines & Fees 232,962 216,147 157,740 123,382 196,500
Interest Earned 254,002 106,908 5,000 50,000 50,000
Intergovernmental Revenues 14,400 - 85,000 - -
Other Financing 58,646 - 12,500 26,002 50,000 Subtotal - Revenues 10,874,924 11,305,954 11,491,199 11,859,615 12,769,126
Expense
Salaries & Benefits 635,364 1,224,421 1,456,583 1,065,797 1,209,024
Supplies & Materials 291,000 300,712 338,825 312,970 347,300
Repair & Maintenance (323) 1,092,602 980,400 339,657 355,000
Contractual Services 3,616,341 2,745,140 2,884,449 2,867,731 3,604,752
Other/Misc. Expenses 561,046 611,081 511,333 635,703 679,750
Capital Outlay 128,072 507,623 474,884 345,034 350,060
Debt Service - - - 9,445 - Subtotal - Expenses 5,231,500 6,481,580 6,646,474 5,576,337 6,545,886
Other Financing Sources
Transfer In 5,680,504 1,795,978 2,184,513 1,719,940 1,641,500
Transfer Out (12,365,285) (6,145,616) (7,032,000) (5,105,258) (7,235,641)
Subtotal - Other Financing Sources (6,684,781) (4,349,638) (4,847,487) (3,385,318) (5,594,141)
NET CHANGE IN WORKING CAPITAL (1,041,357) 474,735 (2,762) 2,897,960 629,099
Beginning Working Capital 2,633,101 1,591,744 3,794,023 2,066,479 4,964,438
Contingency Reserves (20% Expenses) 1,046,300 1,296,316 1,329,295 1,115,267 1,309,177
Ending Available Working Capital 545,443 770,163 2,461,966 3,849,171 4,284,360
Fund FY 2018 FY 2019 FY 2020Original
FY 2020Projected
FY 2021Preliminary
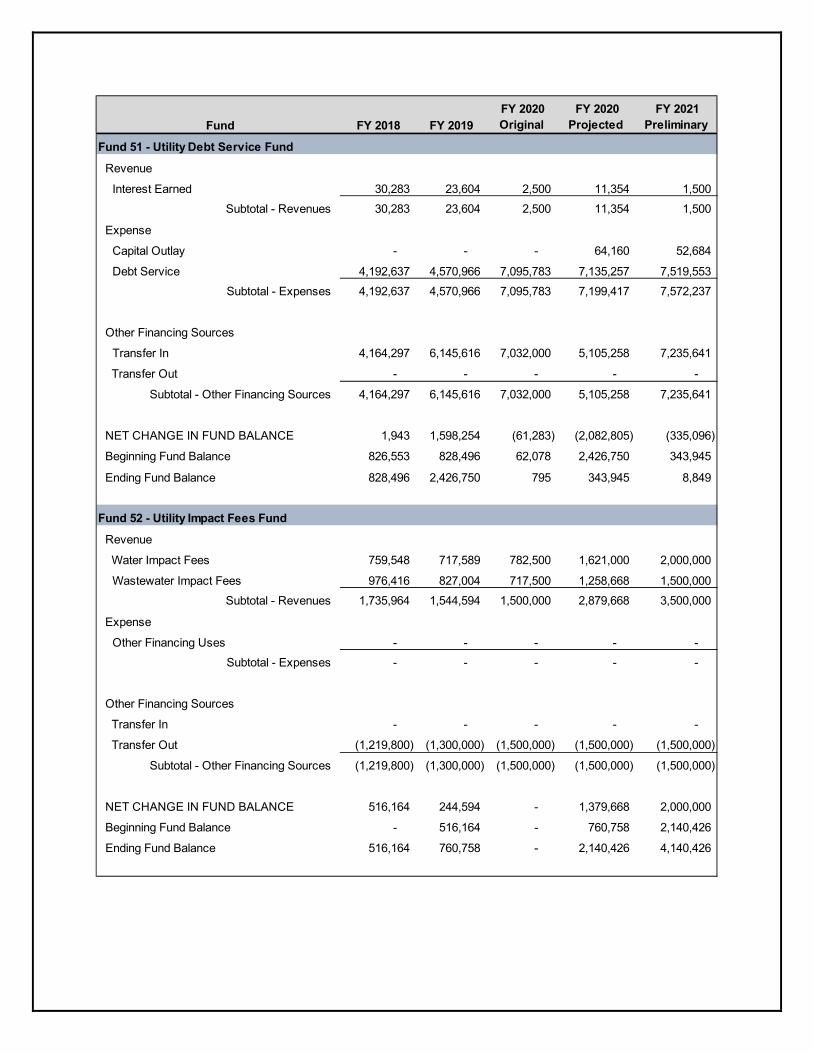
Fund 51 - Utility Debt Service Fund
Revenue
Interest Earned 30,283 23,604 2,500 11,354 1,500 Subtotal - Revenues 30,283 23,604 2,500 11,354 1,500
Expense
Capital Outlay - - - 64,160 52,684
Debt Service 4,192,637 4,570,966 7,095,783 7,135,257 7,519,553 Subtotal - Expenses 4,192,637 4,570,966 7,095,783 7,199,417 7,572,237
Other Financing Sources
Transfer In 4,164,297 6,145,616 7,032,000 5,105,258 7,235,641
Transfer Out - - - - -
Subtotal - Other Financing Sources 4,164,297 6,145,616 7,032,000 5,105,258 7,235,641
NET CHANGE IN FUND BALANCE 1,943 1,598,254 (61,283) (2,082,805) (335,096)
Beginning Fund Balance 826,553 828,496 62,078 2,426,750 343,945
Ending Fund Balance 828,496 2,426,750 795 343,945 8,849
Fund 52 - Utility Impact Fees Fund
Revenue
Water Impact Fees 759,548 717,589 782,500 1,621,000 2,000,000
Wastewater Impact Fees 976,416 827,004 717,500 1,258,668 1,500,000 Subtotal - Revenues 1,735,964 1,544,594 1,500,000 2,879,668 3,500,000
Expense
Other Financing Uses - - - - - Subtotal - Expenses - - - - -
Other Financing Sources
Transfer In - - - - -
Transfer Out (1,219,800) (1,300,000) (1,500,000) (1,500,000) (1,500,000)
Subtotal - Other Financing Sources (1,219,800) (1,300,000) (1,500,000) (1,500,000) (1,500,000)
NET CHANGE IN FUND BALANCE 516,164 244,594 - 1,379,668 2,000,000
Beginning Fund Balance - 516,164 - 760,758 2,140,426
Ending Fund Balance 516,164 760,758 - 2,140,426 4,140,426
Fund FY 2018 FY 2019 FY 2020Original
FY 2020Projected
FY 2021Preliminary
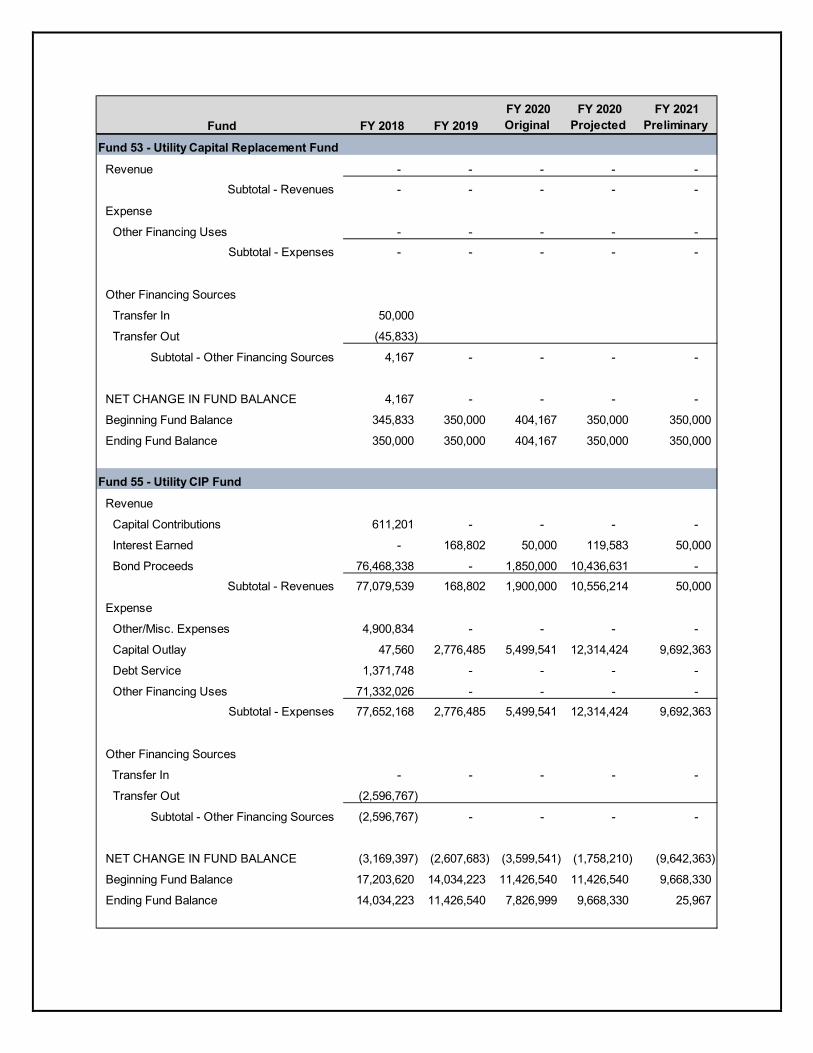
Fund 53 - Utility Capital Replacement Fund
Revenue - - - - - Subtotal - Revenues - - - - -
Expense
Other Financing Uses - - - - - Subtotal - Expenses - - - - -
Other Financing Sources
Transfer In 50,000
Transfer Out (45,833)
Subtotal - Other Financing Sources 4,167 - - - -
NET CHANGE IN FUND BALANCE 4,167 - - - -
Beginning Fund Balance 345,833 350,000 404,167 350,000 350,000
Ending Fund Balance 350,000 350,000 404,167 350,000 350,000
Fund 55 - Utility CIP Fund
Revenue
Capital Contributions 611,201 - - - -
Interest Earned - 168,802 50,000 119,583 50,000
Bond Proceeds 76,468,338 - 1,850,000 10,436,631 - Subtotal - Revenues 77,079,539 168,802 1,900,000 10,556,214 50,000
Expense
Other/Misc. Expenses 4,900,834 - - - -
Capital Outlay 47,560 2,776,485 5,499,541 12,314,424 9,692,363
Debt Service 1,371,748 - - - -
Other Financing Uses 71,332,026 - - - - Subtotal - Expenses 77,652,168 2,776,485 5,499,541 12,314,424 9,692,363
Other Financing Sources
Transfer In - - - - -
Transfer Out (2,596,767)
Subtotal - Other Financing Sources (2,596,767) - - - -
NET CHANGE IN FUND BALANCE (3,169,397) (2,607,683) (3,599,541) (1,758,210) (9,642,363)
Beginning Fund Balance 17,203,620 14,034,223 11,426,540 11,426,540 9,668,330
Ending Fund Balance 14,034,223 11,426,540 7,826,999 9,668,330 25,967
Fund FY 2018 FY 2019 FY 2020Original
FY 2020Projected
FY 2021Preliminary
Fund 60 - General Capital Improvement Fund
Revenue
Interest Earned 157,337 203,414 100,000 61,980 30,000
Intergovernmental 664,792 - - -
Bond Proceeds 8,896,956 25,351,230 38,075,500 7,531,400 - Subtotal - Revenues 9,719,085 25,554,644 38,175,500 7,593,380 30,000
Expense
Capital Outlay 14,414,397 11,777,701 40,578,000 13,288,740 8,642,559
Debt Service 213,355 367,242 - - - Subtotal - Expenses 14,627,752 12,144,943 40,578,000 13,288,740 8,642,559
Other Financing Sources
Transfer In 2,043,000 585,000 23,750 55,417 -
Transfer Out - - - - -
Subtotal - Other Financing Sources 2,043,000 585,000 23,750 55,417 -
NET CHANGE IN FUND BALANCE (2,865,667) 13,994,701 (2,378,750) (5,639,943) (8,612,559)
Beginning Fund Balance 3,285,919 420,252 2,402,657 14,414,953 8,775,010
Ending Fund Balance 420,252 14,414,953 23,907 8,775,010 162,451
Fund FY 2018 FY 2019 FY 2020Original
FY 2020Projected
FY 2021Preliminary
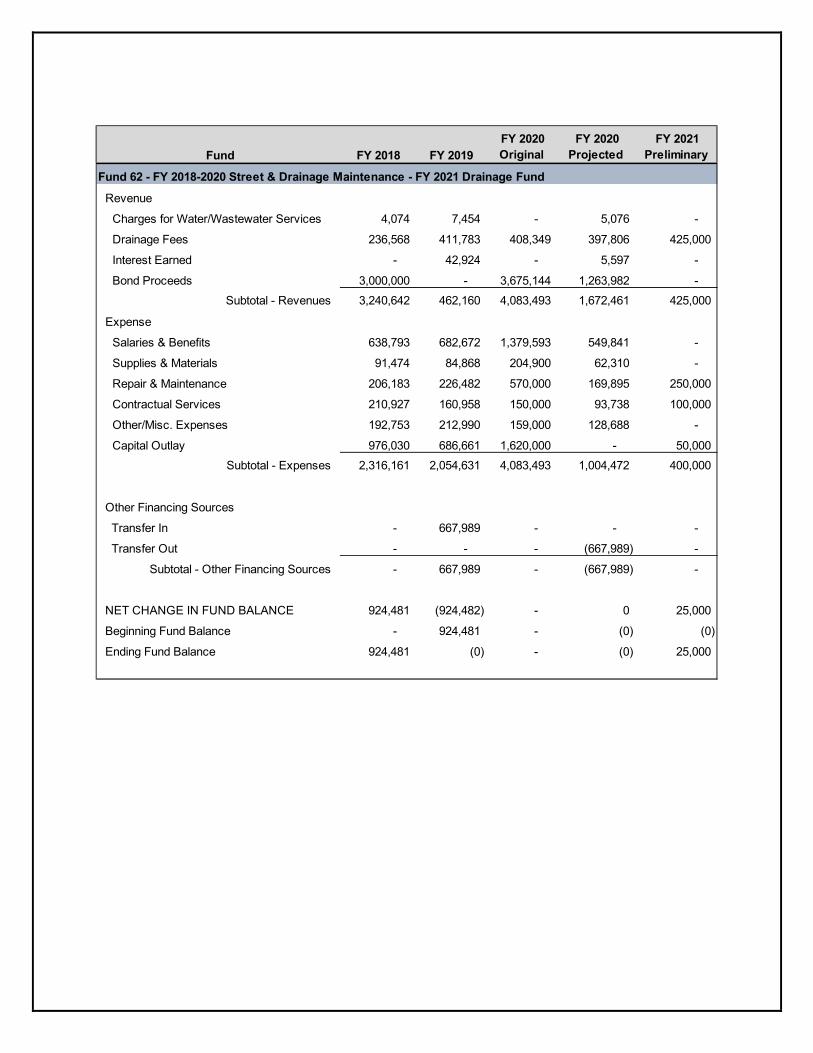
Fund 62 - FY 2018-2020 Street & Drainage Maintenance - FY 2021 Drainage Fund
Revenue
Charges for Water/Wastewater Services 4,074 7,454 - 5,076 -
Drainage Fees 236,568 411,783 408,349 397,806 425,000
Interest Earned - 42,924 - 5,597 -
Bond Proceeds 3,000,000 - 3,675,144 1,263,982 - Subtotal - Revenues 3,240,642 462,160 4,083,493 1,672,461 425,000
Expense
Salaries & Benefits 638,793 682,672 1,379,593 549,841 -
Supplies & Materials 91,474 84,868 204,900 62,310 -
Repair & Maintenance 206,183 226,482 570,000 169,895 250,000
Contractual Services 210,927 160,958 150,000 93,738 100,000
Other/Misc. Expenses 192,753 212,990 159,000 128,688 -
Capital Outlay 976,030 686,661 1,620,000 - 50,000 Subtotal - Expenses 2,316,161 2,054,631 4,083,493 1,004,472 400,000
Other Financing Sources
Transfer In - 667,989 - - -
Transfer Out - - - (667,989) -
Subtotal - Other Financing Sources - 667,989 - (667,989) -
NET CHANGE IN FUND BALANCE 924,481 (924,482) - 0 25,000
Beginning Fund Balance - 924,481 - (0) (0)
Ending Fund Balance 924,481 (0) - (0) 25,000
Fund FY 2018 FY 2019 FY 2020Original
FY 2020Projected
FY 2021Preliminary
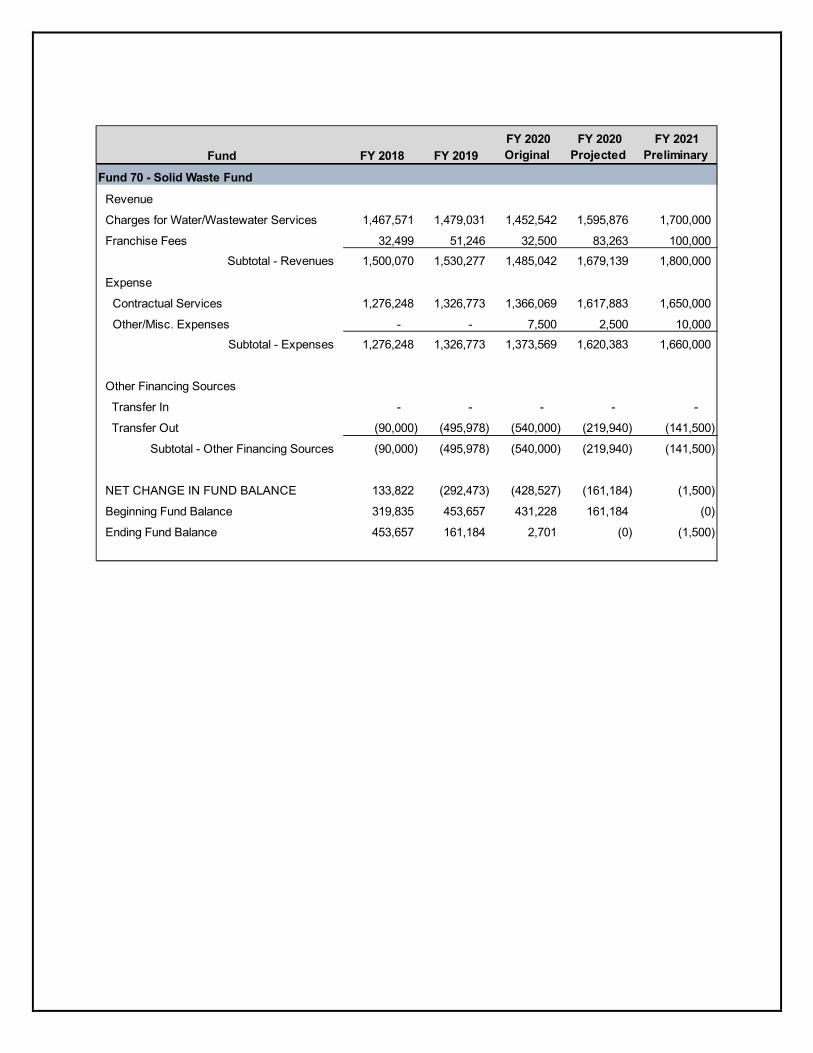
Fund 70 - Solid Waste Fund
Revenue
Charges for Water/Wastewater Services 1,467,571 1,479,031 1,452,542 1,595,876 1,700,000
Franchise Fees 32,499 51,246 32,500 83,263 100,000 Subtotal - Revenues 1,500,070 1,530,277 1,485,042 1,679,139 1,800,000
Expense
Contractual Services 1,276,248 1,326,773 1,366,069 1,617,883 1,650,000
Other/Misc. Expenses - - 7,500 2,500 10,000 Subtotal - Expenses 1,276,248 1,326,773 1,373,569 1,620,383 1,660,000
Other Financing Sources
Transfer In - - - - -
Transfer Out (90,000) (495,978) (540,000) (219,940) (141,500)
Subtotal - Other Financing Sources (90,000) (495,978) (540,000) (219,940) (141,500)
NET CHANGE IN FUND BALANCE 133,822 (292,473) (428,527) (161,184) (1,500)
Beginning Fund Balance 319,835 453,657 431,228 161,184 (0)
Ending Fund Balance 453,657 161,184 2,701 (0) (1,500)

PIDS
Fund FY 2018 FY 2019 FY 2020Original
FY 2020Projected
FY 2021Preliminary
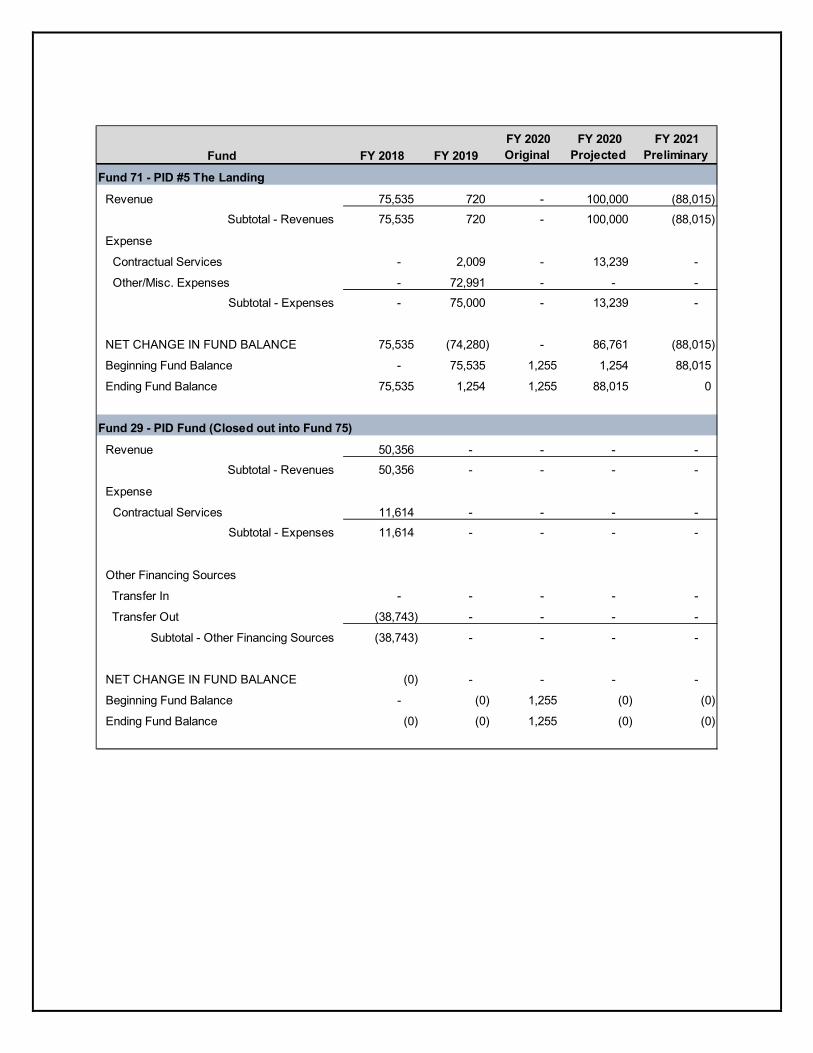
Fund 71 - PID #5 The Landing
Revenue 75,535 720 - 100,000 (88,015) Subtotal - Revenues 75,535 720 - 100,000 (88,015)
Expense
Contractual Services - 2,009 - 13,239 -
Other/Misc. Expenses - 72,991 - - - Subtotal - Expenses - 75,000 - 13,239 -
NET CHANGE IN FUND BALANCE 75,535 (74,280) - 86,761 (88,015)
Beginning Fund Balance - 75,535 1,255 1,254 88,015
Ending Fund Balance 75,535 1,254 1,255 88,015 0
Fund 29 - PID Fund (Closed out into Fund 75)
Revenue 50,356 - - - - Subtotal - Revenues 50,356 - - - -
Expense
Contractual Services 11,614 - - - - Subtotal - Expenses 11,614 - - - -
Other Financing Sources
Transfer In - - - - -
Transfer Out (38,743) - - - -
Subtotal - Other Financing Sources (38,743) - - - -
NET CHANGE IN FUND BALANCE (0) - - - -
Beginning Fund Balance - (0) 1,255 (0) (0)
Ending Fund Balance (0) (0) 1,255 (0) (0)
Fund FY 2018 FY 2019 FY 2020Original
FY 2020Projected
FY 2021Preliminary
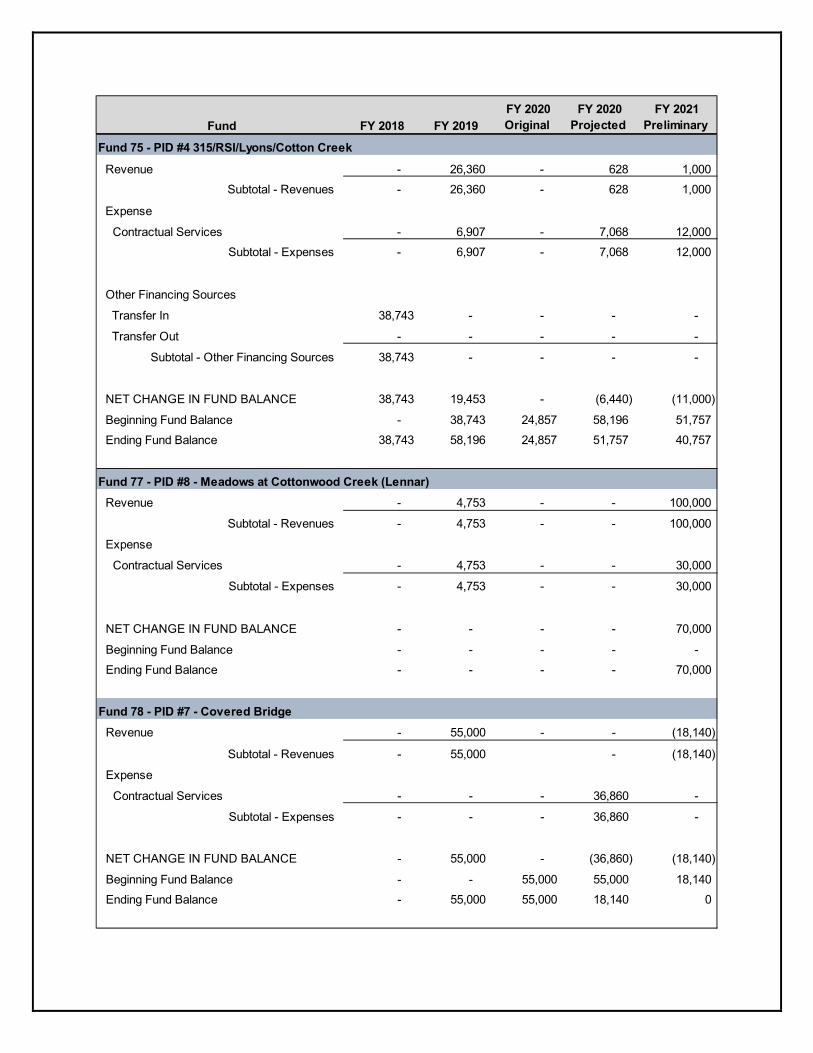
Fund 75 - PID #4 315/RSI/Lyons/Cotton Creek
Revenue - 26,360 - 628 1,000 Subtotal - Revenues - 26,360 - 628 1,000
Expense
Contractual Services - 6,907 - 7,068 12,000 Subtotal - Expenses - 6,907 - 7,068 12,000
Other Financing Sources
Transfer In 38,743 - - - -
Transfer Out - - - - -
Subtotal - Other Financing Sources 38,743 - - - -
NET CHANGE IN FUND BALANCE 38,743 19,453 - (6,440) (11,000)
Beginning Fund Balance - 38,743 24,857 58,196 51,757 Ending Fund Balance 38,743 58,196 24,857 51,757 40,757
Fund 77 - PID #8 - Meadows at Cottonwood Creek (Lennar)Revenue - 4,753 - - 100,000
Subtotal - Revenues - 4,753 - - 100,000
Expense
Contractual Services - 4,753 - - 30,000
Subtotal - Expenses - 4,753 - - 30,000
NET CHANGE IN FUND BALANCE - - - - 70,000
Beginning Fund Balance - - - - - Ending Fund Balance - - - - 70,000
Fund 78 - PID #7 - Covered BridgeRevenue - 55,000 - - (18,140)
Subtotal - Revenues - 55,000 - (18,140)
Expense
Contractual Services - - - 36,860 -
Subtotal - Expenses - - - 36,860 -
NET CHANGE IN FUND BALANCE - 55,000 - (36,860) (18,140)
Beginning Fund Balance - - 55,000 55,000 18,140 Ending Fund Balance - 55,000 55,000 18,140 0

Fund FY 2018 FY 2019 FY 2020Original
FY 2020Projected
FY 2021Preliminary
Fund 79 - PID #9 - Durango FarmsRevenue - - - 100,000 -
Subtotal - Revenues - - - 100,000 -
Expense
Contractual Services - - - 3,525 30,000
Subtotal - Expenses - - - 3,525 30,000
NET CHANGE IN FUND BALANCE - - - 96,475 (30,000)
Beginning Fund Balance - - - - 96,475
Ending Fund Balance - - - 96,475 66,475

LGCS

Fund FY 2018 FY 2019 FY 2020Original
FY 2020Projected
FY 2021Preliminary
Fund 45 - River Creek Development Corp
Revenue
Interest Earned - 247,935 - - -
Other Financing 146,077 371,808 144,828 - -
Subtotal - Revenues 146,077 619,743 144,828 - -
Expense
PID Assessment to Trustee - - 144,828 - -
Administration - 289,131 - - -
Contractual Services - - - 5 5,000
Capital Outlay - 11,490,403 - - -
Debt Service - 2,520,353 - - - Subtotal - Expenses - 14,299,887 144,828 5 5,000
Other Financing Sources
Bond Proceeds - 24,060,000 - - -
Transfer In - 4,753 - 5 5,000
Transfer Out - - - (9,461,802) (815,289)
Subtotal - Other Financing Sources - 24,064,753 - (9,461,797) (810,289)
NET CHANGE IN FUND BALANCE 146,077 10,384,609 - (9,461,802) (815,289)
Beginning Fund Balance - 146,077 - 10,530,686 1,068,884
Ending Fund Balance 146,077 10,530,686 - 1,068,884 253,595
Fund 72 - PID #2 The Meritage/Cross CreekRevenue 50,356 6,785,671 - 77,722 1,199,836
Subtotal - Revenues 50,356 6,785,671 - 77,722 1,199,836
Expense
Contractual Services - 33,874 - 48,844 36,414
Other/Misc. Expenses - 50,000 - 12,384 -
Capital Outlay - 4,582,057 - 1,803,640 815,289
Debt Service - - - 382,950 348,133
Subtotal - Expenses - 4,665,931 - 2,247,818 1,199,836
NET CHANGE IN FUND BALANCE 50,356 2,119,740 - (2,170,096) -
Beginning Fund Balance - 50,356 47,561 2,170,096 0
Ending Fund Balance 50,356 2,170,096 47,561 0 0

Fund FY 2018 FY 2019 FY 2020Original
FY 2020Projected
FY 2021Preliminary
Fund 73 - PID #1 The Co-Op
Revenue 94,770 17,736,993 - 637 990,610 Subtotal - Revenues 94,770 17,736,993 - 637 990,610
Expense
Contractual Services 74,585 108,756 - 7,210 134,966
Other/Misc. Expenses - 39,438 - 452,411 -
Capital Outlay - 9,385,983 - 1,695,204 1,942,775
Debt Service - - - 4,126,038 855,644 Subtotal - Expenses 74,585 9,534,177 - 6,280,863 2,933,385
NET CHANGE IN FUND BALANCE 20,185 8,202,817 - (6,280,226) (1,942,775)
Beginning Fund Balance - 20,185 (25,641) 8,223,002 1,942,776
Ending Fund Balance 20,185 8,223,002 (25,641) 1,942,776 0
Fund 74 - PID #3 Packsaddle/Mustang Creek
Revenue - 75,000 - 9,977,018 802,920 Subtotal - Revenues - 75,000 - 9,977,018 802,920
Expense
Contractual Services - 13,120 - 63,476 125,700
Other/Misc. Expenses - - - 260,211 -
Capital Outlay - - - 9,455,000 -
Debt Service - - - 260,211 677,220 Subtotal - Expenses - 13,120 - 10,038,898 802,920
NET CHANGE IN FUND BALANCE - 61,880 - (61,880) -
Beginning Fund Balance - - 75,000 61,880 (0)
Ending Fund Balance - 61,880 75,000 (0) (0)
Fund FY 2018 FY 2019 FY 2020Original
FY 2020Projected
FY 2021Preliminary
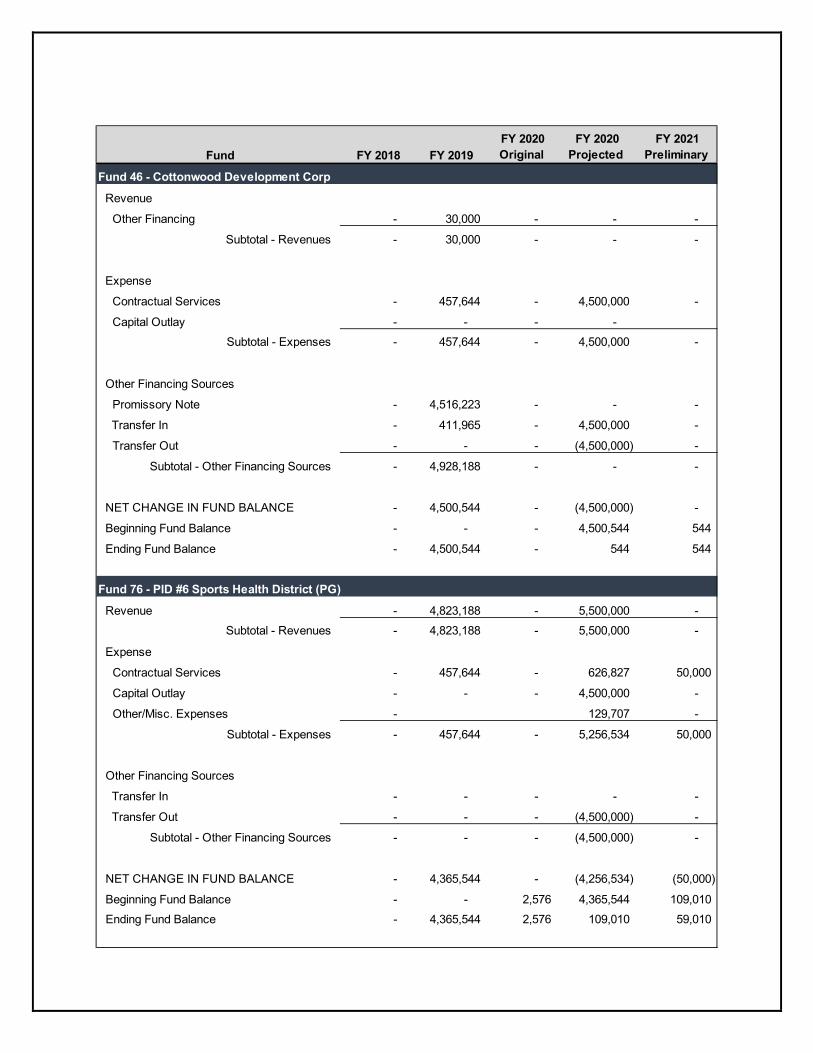
Fund 46 - Cottonwood Development Corp
Revenue
Other Financing - 30,000 - - -
Subtotal - Revenues - 30,000 - - -
Expense
Contractual Services - 457,644 - 4,500,000 -
Capital Outlay - - - - Subtotal - Expenses - 457,644 - 4,500,000 -
Other Financing Sources
Promissory Note - 4,516,223 - - -
Transfer In - 411,965 - 4,500,000 -
Transfer Out - - - (4,500,000) -
Subtotal - Other Financing Sources - 4,928,188 - - -
NET CHANGE IN FUND BALANCE - 4,500,544 - (4,500,000) -
Beginning Fund Balance - - - 4,500,544 544
Ending Fund Balance - 4,500,544 - 544 544
Fund 76 - PID #6 Sports Health District (PG)
Revenue - 4,823,188 - 5,500,000 - Subtotal - Revenues - 4,823,188 - 5,500,000 -
Expense
Contractual Services - 457,644 - 626,827 50,000
Capital Outlay - - - 4,500,000 -
Other/Misc. Expenses - 129,707 -
Subtotal - Expenses - 457,644 - 5,256,534 50,000
Other Financing Sources
Transfer In - - - - -
Transfer Out - - - (4,500,000) -
Subtotal - Other Financing Sources - - - (4,500,000) -
NET CHANGE IN FUND BALANCE - 4,365,544 - (4,256,534) (50,000)
Beginning Fund Balance - - 2,576 4,365,544 109,010 Ending Fund Balance - 4,365,544 2,576 109,010 59,010

TIRZ
Fund FY 2018 FY 2019 FY 2020Original
FY 2020Projected
FY 2021Preliminary
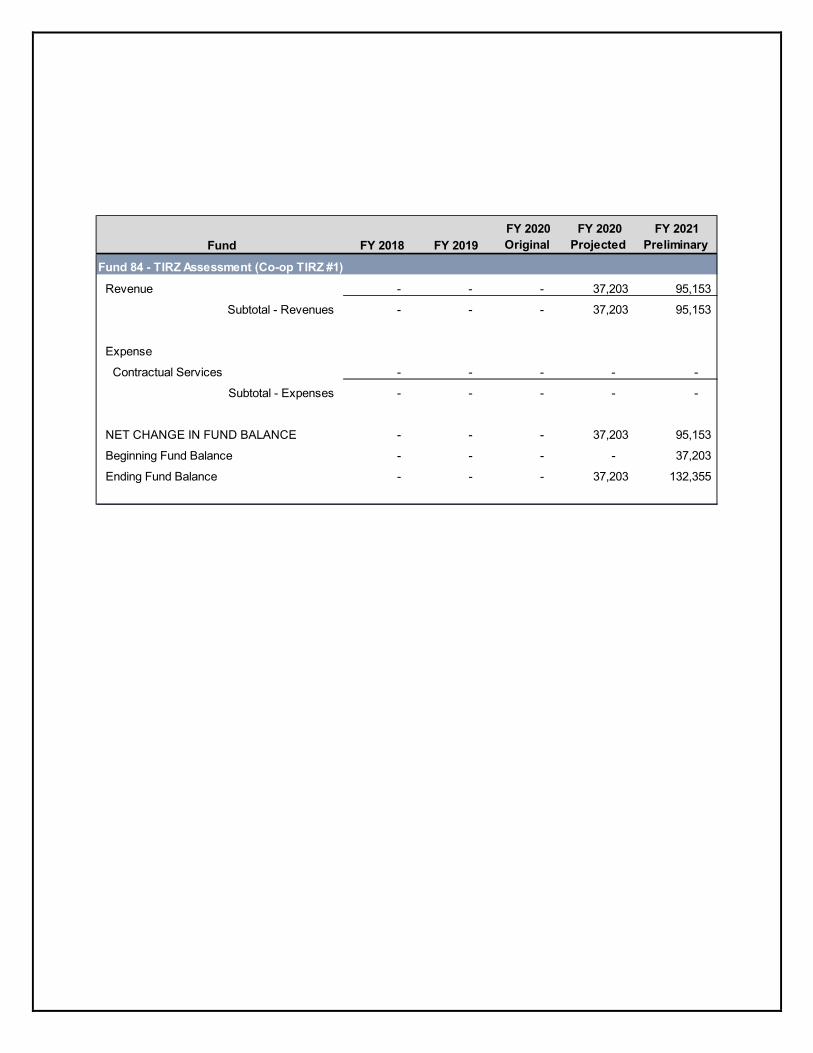
Fund 84 - TIRZ Assessment (Co-op TIRZ #1)
Revenue - - - 37,203 95,153
Subtotal - Revenues - - - 37,203 95,153
Expense
Contractual Services - - - - -
Subtotal - Expenses - - - - -
NET CHANGE IN FUND BALANCE - - - 37,203 95,153
Beginning Fund Balance - - - - 37,203
Ending Fund Balance - - - 37,203 132,355

CDC
Fund FY 2018 FY 2019 FY 2020Original
FY 2020Projected
FY 2021Preliminary
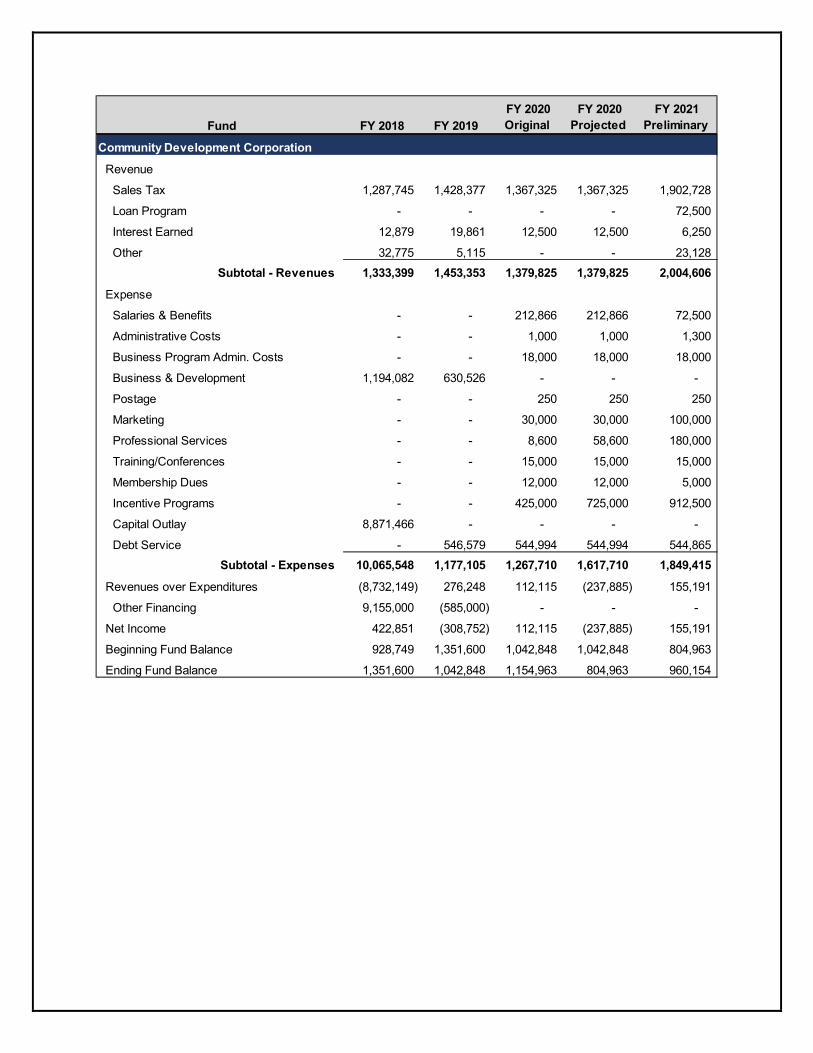
Community Development Corporation
Revenue
Sales Tax 1,287,745 1,428,377 1,367,325 1,367,325 1,902,728
Loan Program - - - - 72,500
Interest Earned 12,879 19,861 12,500 12,500 6,250
Other 32,775 5,115 - - 23,128 Subtotal - Revenues 1,333,399 1,453,353 1,379,825 1,379,825 2,004,606
Expense
Salaries & Benefits - - 212,866 212,866 72,500
Administrative Costs - - 1,000 1,000 1,300
Business Program Admin. Costs - - 18,000 18,000 18,000
Business & Development 1,194,082 630,526 - - -
Postage - - 250 250 250
Marketing - - 30,000 30,000 100,000
Professional Services - - 8,600 58,600 180,000
Training/Conferences - - 15,000 15,000 15,000
Membership Dues - - 12,000 12,000 5,000
Incentive Programs - - 425,000 725,000 912,500
Capital Outlay 8,871,466 - - - -
Debt Service - 546,579 544,994 544,994 544,865 Subtotal - Expenses 10,065,548 1,177,105 1,267,710 1,617,710 1,849,415
Revenues over Expenditures (8,732,149) 276,248 112,115 (237,885) 155,191
Other Financing 9,155,000 (585,000) - - -
Net Income 422,851 (308,752) 112,115 (237,885) 155,191
Beginning Fund Balance 928,749 1,351,600 1,042,848 1,042,848 804,963
Ending Fund Balance 1,351,600 1,042,848 1,154,963 804,963 960,154

DIVISIONAL BUDGETS
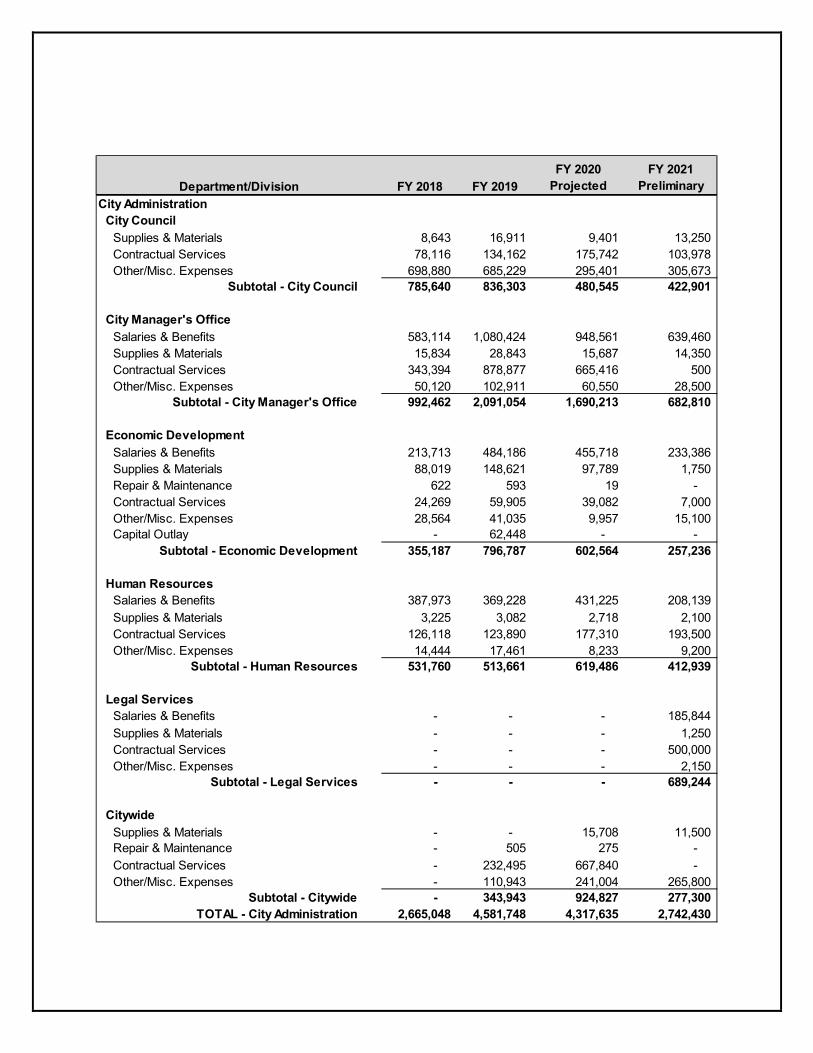
Department/Division FY 2018 FY 2019FY 2020
ProjectedFY 2021
Preliminary City Administration
City CouncilSupplies & Materials 8,643 16,911 9,401 13,250 Contractual Services 78,116 134,162 175,742 103,978 Other/Misc. Expenses 698,880 685,229 295,401 305,673
Subtotal - City Council 785,640 836,303 480,545 422,901
City Manager's OfficeSalaries & Benefits 583,114 1,080,424 948,561 639,460 Supplies & Materials 15,834 28,843 15,687 14,350 Contractual Services 343,394 878,877 665,416 500 Other/Misc. Expenses 50,120 102,911 60,550 28,500
Subtotal - City Manager's Office 992,462 2,091,054 1,690,213 682,810
Economic DevelopmentSalaries & Benefits 213,713 484,186 455,718 233,386 Supplies & Materials 88,019 148,621 97,789 1,750 Repair & Maintenance 622 593 19 - Contractual Services 24,269 59,905 39,082 7,000 Other/Misc. Expenses 28,564 41,035 9,957 15,100 Capital Outlay - 62,448 - -
Subtotal - Economic Development 355,187 796,787 602,564 257,236
Human ResourcesSalaries & Benefits 387,973 369,228 431,225 208,139 Supplies & Materials 3,225 3,082 2,718 2,100 Contractual Services 126,118 123,890 177,310 193,500 Other/Misc. Expenses 14,444 17,461 8,233 9,200
Subtotal - Human Resources 531,760 513,661 619,486 412,939
Legal ServicesSalaries & Benefits - - - 185,844 Supplies & Materials - - - 1,250 Contractual Services - - - 500,000 Other/Misc. Expenses - - - 2,150
Subtotal - Legal Services - - - 689,244
CitywideSupplies & Materials - - 15,708 11,500 Repair & Maintenance - 505 275 - Contractual Services - 232,495 667,840 - Other/Misc. Expenses - 110,943 241,004 265,800
Subtotal - Citywide - 343,943 924,827 277,300 TOTAL - City Administration 2,665,048 4,581,748 4,317,635 2,742,430
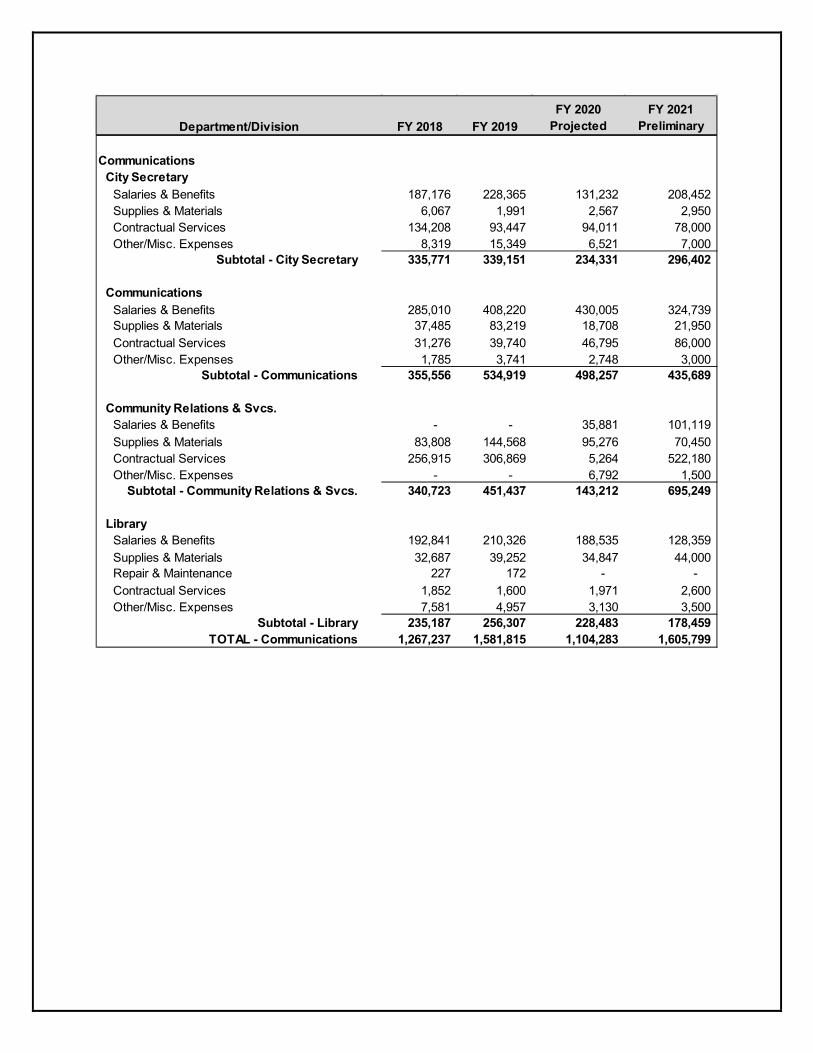
Department/Division FY 2018 FY 2019FY 2020
ProjectedFY 2021
Preliminary
CommunicationsCity Secretary
Salaries & Benefits 187,176 228,365 131,232 208,452 Supplies & Materials 6,067 1,991 2,567 2,950 Contractual Services 134,208 93,447 94,011 78,000 Other/Misc. Expenses 8,319 15,349 6,521 7,000
Subtotal - City Secretary 335,771 339,151 234,331 296,402
CommunicationsSalaries & Benefits 285,010 408,220 430,005 324,739 Supplies & Materials 37,485 83,219 18,708 21,950 Contractual Services 31,276 39,740 46,795 86,000 Other/Misc. Expenses 1,785 3,741 2,748 3,000
Subtotal - Communications 355,556 534,919 498,257 435,689
Community Relations & Svcs.Salaries & Benefits - - 35,881 101,119 Supplies & Materials 83,808 144,568 95,276 70,450 Contractual Services 256,915 306,869 5,264 522,180 Other/Misc. Expenses - - 6,792 1,500
Subtotal - Community Relations & Svcs. 340,723 451,437 143,212 695,249
LibrarySalaries & Benefits 192,841 210,326 188,535 128,359 Supplies & Materials 32,687 39,252 34,847 44,000 Repair & Maintenance 227 172 - - Contractual Services 1,852 1,600 1,971 2,600 Other/Misc. Expenses 7,581 4,957 3,130 3,500
Subtotal - Library 235,187 256,307 228,483 178,459 TOTAL - Communications 1,267,237 1,581,815 1,104,283 1,605,799
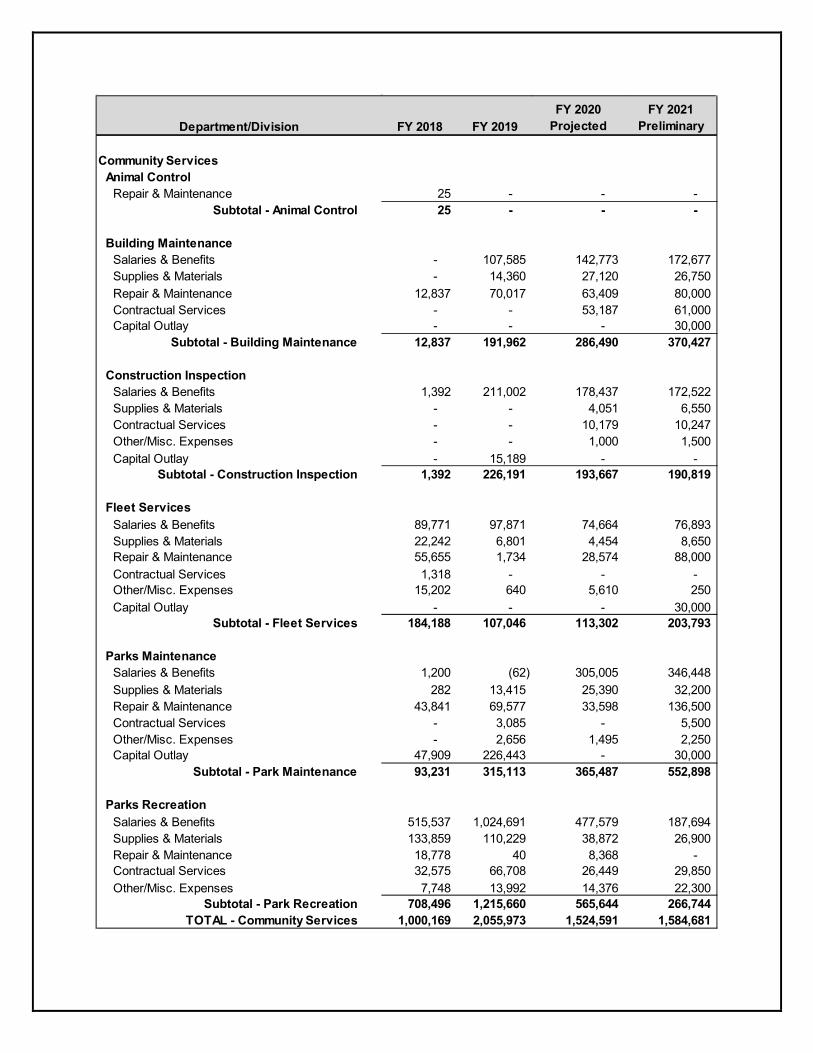
Department/Division FY 2018 FY 2019FY 2020
ProjectedFY 2021
Preliminary
Community ServicesAnimal Control
Repair & Maintenance 25 - - - Subtotal - Animal Control 25 - - -
Building MaintenanceSalaries & Benefits - 107,585 142,773 172,677 Supplies & Materials - 14,360 27,120 26,750 Repair & Maintenance 12,837 70,017 63,409 80,000 Contractual Services - - 53,187 61,000 Capital Outlay - - - 30,000
Subtotal - Building Maintenance 12,837 191,962 286,490 370,427
Construction InspectionSalaries & Benefits 1,392 211,002 178,437 172,522 Supplies & Materials - - 4,051 6,550 Contractual Services - - 10,179 10,247 Other/Misc. Expenses - - 1,000 1,500 Capital Outlay - 15,189 - -
Subtotal - Construction Inspection 1,392 226,191 193,667 190,819
Fleet ServicesSalaries & Benefits 89,771 97,871 74,664 76,893 Supplies & Materials 22,242 6,801 4,454 8,650 Repair & Maintenance 55,655 1,734 28,574 88,000 Contractual Services 1,318 - - - Other/Misc. Expenses 15,202 640 5,610 250 Capital Outlay - - - 30,000
Subtotal - Fleet Services 184,188 107,046 113,302 203,793
Parks MaintenanceSalaries & Benefits 1,200 (62) 305,005 346,448 Supplies & Materials 282 13,415 25,390 32,200 Repair & Maintenance 43,841 69,577 33,598 136,500 Contractual Services - 3,085 - 5,500 Other/Misc. Expenses - 2,656 1,495 2,250 Capital Outlay 47,909 226,443 - 30,000
Subtotal - Park Maintenance 93,231 315,113 365,487 552,898
Parks RecreationSalaries & Benefits 515,537 1,024,691 477,579 187,694 Supplies & Materials 133,859 110,229 38,872 26,900 Repair & Maintenance 18,778 40 8,368 - Contractual Services 32,575 66,708 26,449 29,850 Other/Misc. Expenses 7,748 13,992 14,376 22,300
Subtotal - Park Recreation 708,496 1,215,660 565,644 266,744 TOTAL - Community Services 1,000,169 2,055,973 1,524,591 1,584,681

Department/Division FY 2018 FY 2019FY 2020
ProjectedFY 2021
Preliminary
Development ServicesBuilding Services
Salaries & Benefits 322,572 332,249 177,545 172,941 Supplies & Materials 8,300 8,156 4,985 8,000 Repair & Maintenance 311 1,099 2,500 - Contractual Services 45,909 59,423 66,028 37,850 Other/Misc. Expenses 12,121 26,617 4,320 5,185
Subtotal - Building Services 389,213 427,543 255,378 223,976
Planning & GISSalaries & Benefits 427,079 543,870 505,001 482,493 Supplies & Materials 9,792 7,404 5,873 6,510 Contractual Services 330,923 96,993 23,411 318,410 Other/Misc. Expenses 11,694 33,413 6,993 14,930
Subtotal - Planning & GIS 779,488 681,679 541,279 822,343 TOTAL - Development Services 1,168,701 1,109,223 796,656 1,046,319
EngineeringSalaries & Benefits 395,257 278,190 224,767 330,903 Supplies & Materials 719 5,405 2,535 2,570 Repair & Maintenance - 25 - - Contractual Services 9,305 42,763 84,158 100,050 Other/Misc. Expenses 67 1,772 1,625 6,625 Capital Outlay - - - 30,000
TOTAL - Engineering 405,348 328,154 313,085 470,148
Financial ServicesCitywide
Repair & Maintenance - 15,000 15,000 - Contractual Services 325,919 218,808 142,504 250,000 Other/Misc. Expenses 39,640 66,799 71,492 75,000
Subtotal -Citywide 365,559 300,607 228,996 325,000
FinanceSalaries & Benefits 515,151 777,589 866,988 847,412 Supplies & Materials 8,780 9,686 4,466 5,700 Contractual Services 135,866 174,611 220,197 208,750 Other/Misc. Expenses 155,705 171,363 232,148 201,800
Subtotal -Finance 815,502 1,133,249 1,323,800 1,263,662
Municipal CourtSalaries & Benefits 222,033 256,748 211,395 249,709 Supplies & Materials 4,103 2,365 1,518 1,500 Contractual Services 232 6,693 12,660 8,250 Other/Misc. Expenses 16,034 15,726 17,291 19,300
Subtotal -Municipal Court 242,402 281,532 242,863 278,759
Utility BillingSalaries & Benefits 387,161 425,935 298,928 251,364 Supplies & Materials 104,027 135,430 135,357 132,300 Repair & Maintenance 2,709 2,716 3,497 1,500 Contractual Services 1,376,322 1,362,265 1,670,805 1,716,500 Other/Misc. Expenses 239,511 237,768 258,517 273,150 Capital Outlay - 21,856 35,034 40,000
Subtotal -Utility Billing 2,109,730 2,185,969 2,402,138 2,414,814 TOTAL - Financial Services 3,533,194 3,901,357 4,197,797 4,282,235

Department/Division FY 2018 FY 2019FY 2020
ProjectedFY 2021
Preliminary
Information TechnologySalaries & Benefits 151,850 172,506 206,007 232,519 Supplies & Materials 72,672 105,632 46,704 66,800 Contractual Services 416,378 515,218 719,510 610,700 Other/Misc. Expenses 3,068 2,411 2,915 3,100 Capital Outlay 44,411 73,371 - 40,000 Debt Service - - - -
TOTAL - Information Technology 688,379 869,139 975,136 953,119
PoliceAnimal Control
Salaries & Benefits 96,566 124,538 51,416 - Supplies & Materials 10,531 11,845 2,016 - Repair & Maintenance 1,252 4,667 1,144 - Contractual Services 74,194 74,227 103,783 - Other/Misc. Expenses 1,335 2,342 635 - Capital Outlay 8,932 8,932 - -
Subtotal -Animal Control 192,809 226,550 158,994 -
Criminal InvestigationSalaries & Benefits 510,329 623,480 704,621 743,361 Supplies & Materials 29,982 31,560 12,682 25,050 Repair & Maintenance 11,096 7,863 3,697 2,000 Contractual Services 17,169 10,260 14,108 13,816 Other/Misc. Expenses 11,167 8,932 7,486 12,000
Subtotal -Criminal Investigation 579,743 682,094 742,593 796,227
PatrolSalaries & Benefits 2,463,146 2,459,051 2,339,513 2,811,739 Supplies & Materials 256,951 310,132 307,221 334,555 Repair & Maintenance 62,844 54,728 46,588 7,500 Contractual Services 28,236 550 - 39,000 Other/Misc. Expenses 24,742 55,277 23,520 55,000 Capital Outlay 182,620 311,985 - 280,000
Subtotal -Patrol 3,018,539 3,191,722 2,716,842 3,527,794
Police Admin.Salaries & Benefits 423,067 584,855 497,054 433,031 Supplies & Materials 44,246 65,274 41,081 66,300 Repair & Maintenance 18,532 13,813 7,232 1,700 Contractual Services 19,767 19,962 40,892 29,295 Other/Misc. Expenses 5,793 10,168 30,190 32,600 Debt Service - - - -
Subtotal -Police Admin. 511,405 694,071 616,449 562,926
Special OperationsSalaries & Benefits - 4,640 123,444 - Supplies & Materials - - 3,464 - Repair & Maintenance - 57 280 - Contractual Services - - 3,428 - Other/Misc. Expenses - - 1,200 -
Subtotal -Special Operations - 4,696 131,816 -
Support ServicesSalaries & Benefits 494,016 570,854 620,093 639,511 Supplies & Materials 12,027 8,667 16,485 20,900 Repair & Maintenance 3,480 4,182 4,529 1,800 Contractual Services 750 5,330 82,570 118,045 Other/Misc. Expenses 25,864 36,053 44,637 43,650
Subtotal -Support Services 536,136 625,086 768,314 823,906 TOTAL - Police 4,838,632 5,424,220 5,135,009 5,710,853
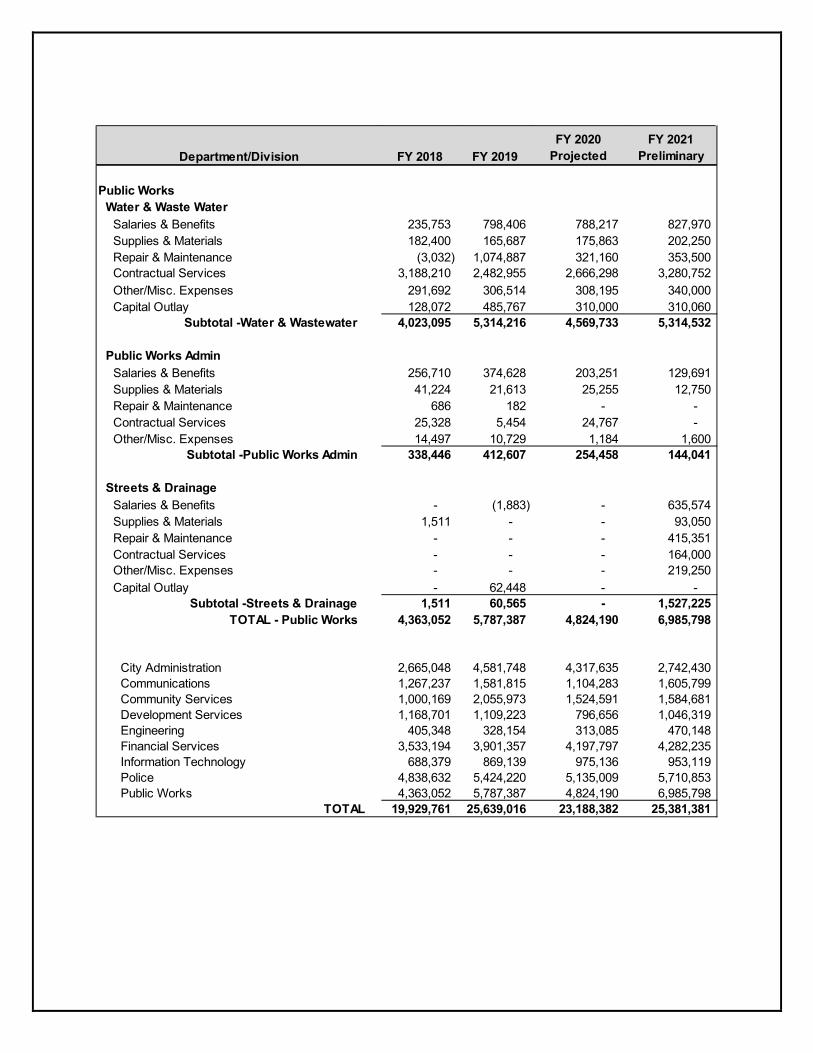
Department/Division FY 2018 FY 2019FY 2020
ProjectedFY 2021
Preliminary
Public WorksWater & Waste Water
Salaries & Benefits 235,753 798,406 788,217 827,970 Supplies & Materials 182,400 165,687 175,863 202,250 Repair & Maintenance (3,032) 1,074,887 321,160 353,500 Contractual Services 3,188,210 2,482,955 2,666,298 3,280,752 Other/Misc. Expenses 291,692 306,514 308,195 340,000 Capital Outlay 128,072 485,767 310,000 310,060
Subtotal -Water & Wastewater 4,023,095 5,314,216 4,569,733 5,314,532
Public Works AdminSalaries & Benefits 256,710 374,628 203,251 129,691 Supplies & Materials 41,224 21,613 25,255 12,750 Repair & Maintenance 686 182 - - Contractual Services 25,328 5,454 24,767 - Other/Misc. Expenses 14,497 10,729 1,184 1,600
Subtotal -Public Works Admin 338,446 412,607 254,458 144,041
Streets & DrainageSalaries & Benefits - (1,883) - 635,574 Supplies & Materials 1,511 - - 93,050 Repair & Maintenance - - - 415,351 Contractual Services - - - 164,000 Other/Misc. Expenses - - - 219,250 Capital Outlay - 62,448 - -
Subtotal -Streets & Drainage 1,511 60,565 - 1,527,225 TOTAL - Public Works 4,363,052 5,787,387 4,824,190 6,985,798
City Administration 2,665,048 4,581,748 4,317,635 2,742,430 Communications 1,267,237 1,581,815 1,104,283 1,605,799 Community Services 1,000,169 2,055,973 1,524,591 1,584,681 Development Services 1,168,701 1,109,223 796,656 1,046,319 Engineering 405,348 328,154 313,085 470,148 Financial Services 3,533,194 3,901,357 4,197,797 4,282,235 Information Technology 688,379 869,139 975,136 953,119 Police 4,838,632 5,424,220 5,135,009 5,710,853 Public Works 4,363,052 5,787,387 4,824,190 6,985,798
TOTAL 19,929,761 25,639,016 23,188,382 25,381,381

Planning for the Future
Hutto’s Strategic Plan is reviewed and updated annually. City Council and Hutto’s leadership hold multiple work sessions prior to the budget cycle to collaborate on the strategic direction of the City. Where the city is currently and where they would like it to be in the future, is an important deliberation as they consider the economic environment, demands on infrastructure and the City’s ability to meet increasing service needs. Establishing a vision for the future through the Strategic Plan is a critical step in setting goals for the City and aligning its resources.
A key component to managing the City’s resources is ensuring its financial viability over the long term. During the budget process, historical revenue and expense trends are analyzed and considered as new projections are compiled. Population estimates, economic growth indicators, debt commitments and reserve requirements are all factored into the financial planning process. Accounting for the City’s needs, both current and future, is just one piece of the puzzle. Because the majority of the City’s financial revenues are provided by its citizens through taxes, it is important for the City to develop financial and tax strategies that fund the municipality without overburdening its citizens.
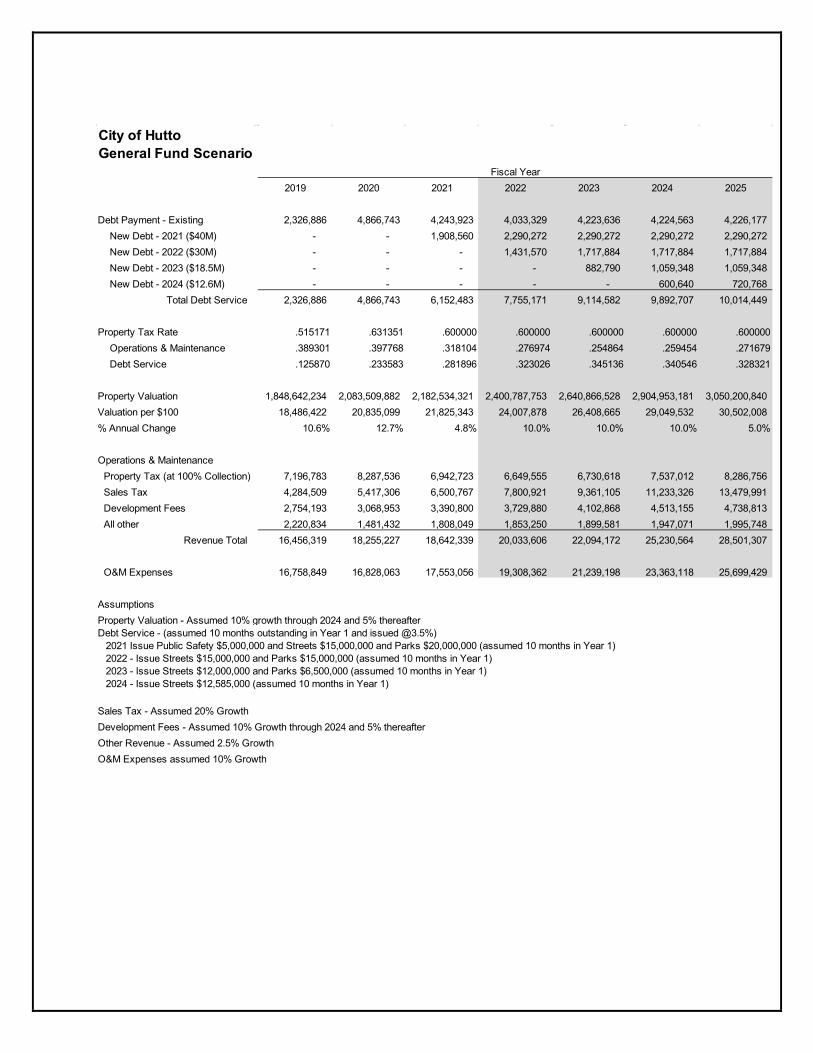
City of HuttoGeneral Fund Scenario
2019 2020 2021 2022 2023 2024 2025
Debt Payment - Existing 2,326,886 4,866,743 4,243,923 4,033,329 4,223,636 4,224,563 4,226,177 New Debt - 2021 ($40M) - - 1,908,560 2,290,272 2,290,272 2,290,272 2,290,272 New Debt - 2022 ($30M) - - - 1,431,570 1,717,884 1,717,884 1,717,884 New Debt - 2023 ($18.5M) - - - - 882,790 1,059,348 1,059,348 New Debt - 2024 ($12.6M) - - - - - 600,640 720,768
Total Debt Service 2,326,886 4,866,743 6,152,483 7,755,171 9,114,582 9,892,707 10,014,449
Property Tax Rate .515171 .631351 .600000 .600000 .600000 .600000 .600000Operations & Maintenance .389301 .397768 .318104 .276974 .254864 .259454 .271679Debt Service .125870 .233583 .281896 .323026 .345136 .340546 .328321
Property Valuation 1,848,642,234 2,083,509,882 2,182,534,321 2,400,787,753 2,640,866,528 2,904,953,181 3,050,200,840 Valuation per $100 18,486,422 20,835,099 21,825,343 24,007,878 26,408,665 29,049,532 30,502,008 % Annual Change 10.6% 12.7% 4.8% 10.0% 10.0% 10.0% 5.0%
Operations & MaintenanceProperty Tax (at 100% Collection) 7,196,783 8,287,536 6,942,723 6,649,555 6,730,618 7,537,012 8,286,756 Sales Tax 4,284,509 5,417,306 6,500,767 7,800,921 9,361,105 11,233,326 13,479,991 Development Fees 2,754,193 3,068,953 3,390,800 3,729,880 4,102,868 4,513,155 4,738,813 All other 2,220,834 1,481,432 1,808,049 1,853,250 1,899,581 1,947,071 1,995,748
Revenue Total 16,456,319 18,255,227 18,642,339 20,033,606 22,094,172 25,230,564 28,501,307
O&M Expenses 16,758,849 16,828,063 17,553,056 19,308,362 21,239,198 23,363,118 25,699,429
Assumptions
Sales Tax - Assumed 20% GrowthDevelopment Fees - Assumed 10% Growth through 2024 and 5% thereafterOther Revenue - Assumed 2.5% GrowthO&M Expenses assumed 10% Growth
Property Valuation - Assumed 10% growth through 2024 and 5% thereafterDebt Service - (assumed 10 months outstanding in Year 1 and issued @3.5%) 2021 Issue Public Safety $5,000,000 and Streets $15,000,000 and Parks $20,000,000 (assumed 10 months in Year 1) 2022 - Issue Streets $15,000,000 and Parks $15,000,000 (assumed 10 months in Year 1) 2023 - Issue Streets $12,000,000 and Parks $6,500,000 (assumed 10 months in Year 1) 2024 - Issue Streets $12,585,000 (assumed 10 months in Year 1)
Fiscal Year