fish and fish habitat component study for the ......information sources used for this omponent...
TRANSCRIPT

Fish and Fish Habitat
Component Study for the Environmental Impact Statement of the
Placentia Bay Atlantic Salmon Aquaculture Project
Prepared by
Prepared for
May 2018 LGL Project No. FA0144-2

Suggested format for citation: LGL. 2018. Fish and Fish Habitat. Component Study for the Environmental Impact Statement of the Placentia Bay
Atlantic Salmon Aquaculture Project. LGL Rep. FA0144-2. Rep. by LGL Limited, St. John`s, NL for Grieg NL, Marystown, NL. 71 p. + appendices.

Table of Contents
Page List of Figures ................................................................................................................................ iv List of Tables ...................................................................................................................................v 1.0 Rationale/Objectives ............................................................................................................1 2.0 Study Area ...........................................................................................................................1 3.0 Methodology ........................................................................................................................2 4.0 Study Outputs.......................................................................................................................3
4.1 Description of Fish and Fish Habitat .......................................................................3 4.1.1 Study Area Overview ...................................................................................3
4.1.1.1 Marine Water ................................................................................4 4.1.1.2 Marine Birds, Marine Mammals and Sea Turtles in
Placentia Bay ..............................................................................24 4.1.2 Project Area ...............................................................................................26
4.2 Placentia Bay Extension EBSA .............................................................................31 4.3 Oceanographic and Meteorological Data ...............................................................31
4.3.1 Data Sources ..............................................................................................32 4.3.2 Ice ...............................................................................................................35 4.3.3 Storm Frequency and Intensity ..................................................................38 4.3.4 Wind and Waves ........................................................................................38
4.3.4.1 Wind ............................................................................................38 4.3.4.2 Waves ..........................................................................................39
4.3.5 Water Currents ...........................................................................................39 4.3.5.1 Rushoon BMA ............................................................................40 4.3.5.2 Merasheen BMA .........................................................................40 4.3.5.3 Red Island BMA .........................................................................40 4.3.5.4 Long Harbour BMA ....................................................................40
4.4 Benthic Depositional Modelling ............................................................................41 4.4.1 Rushoon BMA ...........................................................................................41 4.4.2 Merasheen BMA ........................................................................................43 4.4.3 Red Island BMA ........................................................................................45 4.4.4 Long Harbour BMA ...................................................................................47
4.5 Mitigation and Monitoring .....................................................................................49 4.5.1 Deposition of Organic Material from the Sea Cages .................................49 4.5.2 Release of Unconsumed Therapeutants and Antibiotics into the
Marine Environment ..................................................................................51 4.5.3 Attraction of Naturally-occurring Biota to the Sea Cages .........................51 4.5.4 Pathogen and Parasite Transfer between Farmed Salmon and Wild
Fishes, including Atlantic Salmon .............................................................52
Page ii

4.5.5 Pathogen and Parasite Transfer between Lumpfish Cleaner Fish and Wild Fishes ................................................................................................58
4.5.6 Fish Escape ................................................................................................58 4.5.7 Entanglement .............................................................................................64
4.6 Follow-up Monitoring ............................................................................................64 5.0 References ..........................................................................................................................65 List of Appendices .........................................................................................................................71 Appendix A Sea Cage Site Water Quality Data: Water Temperature and Dissolved
Oxygen Appendix B Application of Available Multibeam Acoustic and Seascape Data to Map
Proposed Marine Finfish Production Locations in Placentia Bay, Newfoundland
Appendix C Sea Cage Site Physical and Biological Benthic Data Appendix D Metocean Conditions for the Placentia Bay Aquaculture Sites, Oceans Ltd.,
February 2018
Page iii

List of Figures
Page Figure 2.1. The Study Area, Bay Management Areas, and proposed sea cage sites for
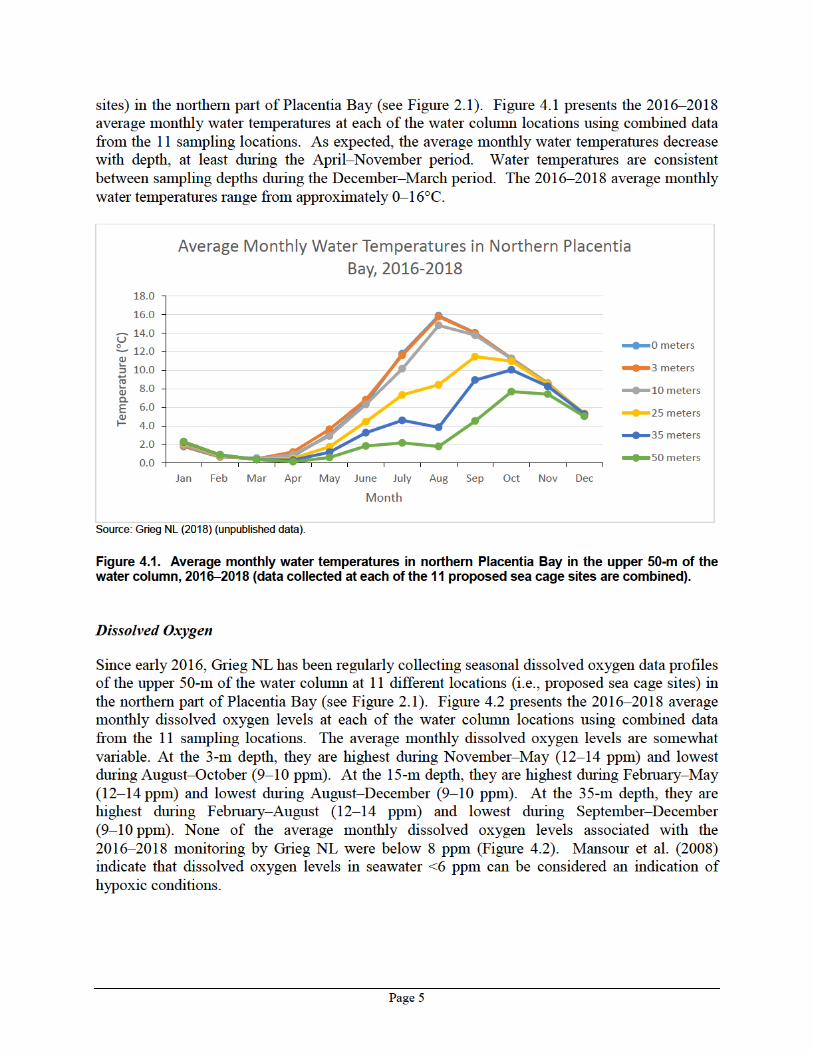
Grieg NL’s Placentia Bay Atlantic Salmon Aquaculture Project. ...........................2 Figure 4.1. Average monthly water temperatures in northern Placentia Bay in the upper
50-m of the water column, 2016–2018. ...................................................................5 Figure 4.2. Average monthly dissolved oxygen levels in northern Placentia Bay in the
upper 50-m of the water column, 2016–2018. .........................................................6 Figure 4.3. Locations of Sediment Sampling in Placentia Bay by Ramey and Snelgrove
(2003). ......................................................................................................................7 Figure 4.4. Areas with eelgrass restoration sites in Placentia Bay, NL. ..................................17 Figure 4.5. Locations of the MSC50 data set grid points, the ECCC weather stations, the
Red Island wave model and the SmartBuoys relative to proposed sea cage sites. .......................................................................................................................33
Figure 4.6. Locations of current meters in Placentia Bay. .......................................................34 Figure 4.7. Weekly analysis of 30-year frequency of presence for the four BMAs in the
week starting March 5, 1981–2010. .......................................................................37 Figure 4.8. Weekly analysis of 30-year median of ice concentration when ice is present
for the four BMAs in the week starting March 5, 1981–2010. ..............................37 Figure 4.9. Modelled footprint of the deposition of organic matter in the vicinity of the
proposed Gallows Island sea cage site. ..................................................................42 Figure 4.10. Modelled footprint of the deposition of organic matter in the vicinity of the
proposed Long Island sea cage site. .......................................................................42 Figure 4.11. Modelled footprint of the deposition of organic matter in the vicinity of the
proposed Oderin Island sea cage site. ....................................................................43 Figure 4.12. Modelled footprint of the deposition of organic matter in the vicinity of the
proposed Valens Island sea cage site. ....................................................................44 Figure 4.13. Modelled footprint of the deposition of organic matter in the vicinity of the
proposed Chambers Island sea cage site. ...............................................................44 Figure 4.14. Modelled footprint of the deposition of organic matter in the vicinity of the
proposed Ship Island sea cage site. ........................................................................45 Figure 4.15. Modelled footprint of the deposition of organic matter in the vicinity of the
proposed Butler Island sea cage site. .....................................................................46 Figure 4.16. Modelled footprint of the deposition of organic matter in the vicinity of the
proposed Red Island sea cage site. .........................................................................46 Figure 4.17. Modelled footprint of the deposition of organic matter in the vicinity of the
proposed Darby Harbour sea cage site...................................................................47 Figure 4.18. Modelled footprint of the deposition of organic matter in the vicinity of the
proposed Brine Island sea cage site. ......................................................................48 Figure 4.19. Modelled footprint of the deposition of organic matter in the vicinity of the
proposed Iona Island sea cage site. ........................................................................48
Page iv

List of Tables
Page Table 4.1. Summary statistics for water temperature data (°C) collected at the proposed
sea cage sites, March 2016–February 2018. ..........................................................26 Table 4.2. Summary statistics for dissolved oxygen data (mg/L [ppm]) collected at the
proposed sea cage sites, February 2016–February 2018. ......................................28 Table 4.3. Bathymetric and substrate specifics for the proposed sea cage sites. ....................30 Table 4.4. Percent frequency of weekly sea ice concentration for northern Placentia
Bay (2008–2017). ..................................................................................................36 Table 4.5. Wind speed statistics for the BMAs, 1954–2015...................................................38 Table 4.6. Wave height statistics for the BMAs, 1954–2015. ................................................39 Table 4.7. Grieg NL fallowing schedule for each proposed sea cage site relative to the
minimum regulatory fallowing schedule. ..............................................................50
Page v

1.0 Rationale/Objectives
This document is the Component Study on Fish and Fish Habitat as required by the Final Environmental Impact Statement (EIS) Guidelines for the Placentia Bay Atlantic Salmon Aquaculture Project proposed by Grieg NL (Newfoundland and Labrador Dept. Municipal Affairs and Environment [NL DMAE 2018). The primary impacts of marine aquaculture operations on fish and fish habitat include: (1) deposition of organic matter from the sea cages (e.g., feces, feed, therapeutants); and (2) attraction of wild fish to sea cage sites. The associated potential effects of these impacts could include changes to the benthic community occurring in the depositional footprint, and transfer of pathogens and parasites from farmed Atlantic salmon to wild fishes. The following sections discuss the existing fish and fish habitat in Placentia Bay with focus on the sea cage sites, the mitigation measures intended to minimize the potential effects of the proposed aquaculture project on fish and fish habitat, and the follow-up monitoring intended to validate the effects conclusions in the EIS. For the purposes of the EIS, ‘fish and fish habitat’ is considered a Valued Environmental Component (VEC). 2.0 Study Area
The boundaries of the Study Area have been defined as the Placentia Bay Extension Ecologically and Biologically Significant Area (EBSA; DFO 2012) (Figure 2.1). Within the Study Area, the focus of this Component Study is on the fish and fish habitat occurring at the proposed sea cage sites (i.e., the portion of the Project Area occurring in the marine environment). Note that the 11 sea cage sites are located in four Bay Management Areas (BMAs): (1) Rushoon BMA; (2) Merasheen BMA; (3) Red Island BMA; and (4) Long Harbour BMA (Figure 2.1).
Page 1

Figure 2.1. The Study Area, Bay Management Areas, and proposed sea cage sites for Grieg NL’s Placentia Bay Atlantic Salmon Aquaculture Project. 3.0 Methodology
This Component Study is a desktop literature review of information pertaining to the following topics as required in the Final EIS Guidelines (NL DMAE 2018):
• identify fish and fish habitat using benthic surveys, including identification of significant habitat, which may include invertebrates, crustaceans, corals and sponges, and eelgrass;
• identify fish and fish habitat, including species at risk, invasive species, marine mammals, and those species that directly or indirectly support a fishery, such as: cod, lobster, sea-run trout, herring, sharks, scallops, crab, seals, mussels, and lumpfish;
• features that led to the designation of Placentia Bay as part of an EBSA within the Newfoundland and Labrador Shelves Bioregion, including details of the biodiversity, composition, abundance, and distribution of ichthyoplankton, marine mammals, corals, sponges, and spawning and nursery habitat areas important for fish, avifauna
Page 2

within important bird areas, and any other features that may have been considered in this designation;
• water quality and benthic characteristics consistent with the baseline monitoring requirements of the provincial aquaculture licensing process;
• oceanographic and meteorological data at the sea-cage sites including water currents, wind and wave action, flood and tidal zones, ice dynamics, and storm patterns;
• aquatic dispersion modeling to predict the biochemical oxygen demand (BOD) material deposition from marine cage sites, as per the Aquaculture Activities Regulations; and
• monitoring that will be undertaken to ensure compliance with federal and provincial regulations related to the use and release of pesticides, therapeutants, and disinfectants in the marine environment, including possible effects on non-target organisms.
Information sources used for this Component Study included federal and provincial scientific research documents, academic research papers, data collected by Grieg NL at the proposed sea cage sites, and consultation with stakeholder groups and individuals. 4.0 Study Outputs
This section discusses the various topics listed in Section 3.0. Each topic is addressed in its own subsection. 4.1 Description of Fish and Fish Habitat
The description of fish and fish habitat is presented from two perspectives: (1) an overview of fish and fish habitat in the Study Area (i.e., Placentia Bay Extension EBSA); and (2) a more detailed description of fish and fish habitat in the marine Project Area (i.e., sea cage sites). The components of fish and fish habitat that will be discussed in this section include:
• marine water; • marine sediment; • bathymetry; • plankton (including ichthyoplankton and invertebrate eggs and larvae); • marine invertebrates and fishes; • marine birds; and • marine mammals and sea turtles.
4.1.1 Study Area Overview
The physical characteristics of Placentia Bay allow its waters to support a wide variety of planktonic, benthic, and pelagic communities. Characteristics of the Bay, such as its typically ice-free conditions, sufficient mixing of ocean waters and excellent sources of nutrients, allow a diverse range of species to flourish.
Page 3
Although marine birds, marine mammals and sea turtles are not really components of fish and fish habitat, the EIS Guidelines require some discussion of these animal groups because of their reliance on invertebrates and fishes as food sources, as well as their potential interactions with the Atlantic salmon sea cages. Marine birds and mammals inhabit the inner portions of Placentia Bay and surrounding areas. During summer months, communities of gannets, cormorants, alcids, gulls, and terns nest along rocky cliffs and islands. Several species of migratory birds, such as shearwaters, also over-winter and forage in these waters during summer months. Thirteen species of marine mammals, including baleen and toothed whales, are also considered seasonal visitors to Placentia Bay. There are a variety of fish habitat types in Placentia Bay. Catto et al. (1999) presented a biological and geomorphological classification of Placentia Bay in which they identified five regional subdivisions of shoreline biological communities:
1. Cape Shore (Cape St. Mary’s to northern tip of the Argentia Peninsula); 2. Northeast Placentia Bay (northern tip of Argentia Peninsula to North Harbour); 3. the Swift Current Estuarine Region (North Harbour to Prowsetown, including Sound
Island, Woody Island, and Bar Haven Island); 4. Northwest Placentia Bay (Merasheen Island, Long Island, the Ragged Islands
archipelago, Isle Valen, Presque Harbour, Paradise Sound, and the adjacent mainland shores of Newfoundland); and
5. Burin Peninsula. The Geologic Survey of Canada (GSC) and Canadian Hydrographic Service (CHS) recently conducted systematic mapping of Placentia Bay, Newfoundland using multibeam sonar and subbottom profilers (Shaw et al. 2011). Interpretation of the multibeam data was supported by seismic data, sidescan sonograms, bottom photographs, video, submersible observations and grab samples, resulting in the generation of a high-resolution seascape dataset (Shaw et al. 2011). The output was georeferenced spatially using GIS software (ESRI's ArcGIS Software Package) and then digitized and coded. High resolution outputs (5-m grid resolution GIS Shapefiles) and graphical outputs have been generated according to referenced coordinates. A key finding of the mapping of Placentia Bay included the complexity of the seafloor of Placentia Bay, including huge fields of ridges on the west side of the bay which likely provide good habitat for invertebrates and fishes. 4.1.1.1 Marine Water
Marine water quality relates to the composition of water as affected by natural processes and human activities. It includes not only chemical composition, but also biological and physical characteristics. The quality of water is also related to specific use and is usually measured in terms of constituent concentrations. The primary role of seawater being considered here is its importance as a component of fish habitat. Water Temperature
Since early 2016, Grieg NL has been regularly collecting seasonal water temperature data profiles of the upper 50-m of the water column at 11 different locations (i.e., proposed sea cage
Page 4


in the middle of southern Placentia Bay (O) (Figure 4.3). Sediments sampled in northern Placentia Bay were characterized by higher proportions of clay, carbon and nitrogen.
Figure 4.3. Locations of Sediment Sampling in Placentia Bay by Ramey and Snelgrove (2003). Plankton in Placentia Bay
Plankton are small and microscopic organisms that either drift pelagically or actively swim in the marine environment. This group includes phytoplankton (photosynthesizing plants), zooplankton (small crustaceans), and the eggs and larval stages of fishes (i.e., ichthyoplankton) and invertebrates. Plankton form the basis of the marine food web. Phytoplankton standing crop (as chlorophyll a concentrations) was measured in water samples collected at seven locations in Placentia Bay in June and August 1998 (Ramey and Snelgrove 2003). Samples were collected at a depth of 5-m at six locations in the northern part of the bay and one location in the central part of southern Placentia Bay. In both June and August, chlorophyll a concentrations were generally higher in northern Placentia Bay, the northernmost stations having the highest concentrations. Ramey and Snelgrove (2003) indicated that these
Page 7

trends were consistent with those shown by the Sea-Viewing, Wide-Field-of-View Sensor Spacecraft (SeaWiFS) in April, July and September of that same year. Overall, chlorophyll a concentration was highest in April, presumably a result of the spring phytoplankton bloom. Department of Fisheries and Oceans Canada (DFO) Newfoundland Region has conducted zooplankton sampling (including icthyoplankton) in Placentia Bay. Ichthyoplankton is defined as the free-floating egg and larval stages of fishes. Fish stomach analysis also provided information on zooplankton. The diet of capelin captured within Placentia Bay in January and May/June 1999 was investigated by O’Driscoll et al. (2001). Sampling sites during both sampling times were located throughout Placentia Bay. Temora spp. and Metridia spp. were the most abundant copepods in the diet of capelin collected in January. The proportion of Calanus spp. in the capelin diet had increased by the spring sampling. Large capelin caught in Placentia Bay in spring fed mainly on hyperiid amphipods. The seasonal diet of Atlantic cod in Placentia Bay was also investigated during this period. Planktonic invertebrates identified in the cod stomachs included various amphipods, cnidarians and copepods (Mello and Rose 2005a). Data related to the distribution of pelagic eggs of American plaice, Atlantic cod, and cunner (Tautogolabrus adspersus) have been compiled by Bradbury et al. (2003). Plaice and cod eggs were most abundant on the west side of Placentia Bay, particularly in the vicinity of Bar Haven Island and off the southern Burin Peninsula (see Subsection 4.2, Placentia Bay Extension EBSA). Notable abundances of Stage II eggs of both American plaice and cod were found immediately southwest of Merasheen Island. Cunner eggs were distributed more widely, occurring primarily in waters proximate to Marystown, between Marystown and Paradise Sound, off the Cape Shore, offshore of Paradise Sound, and extensively throughout the large islands of inner Placentia Bay. Bradbury et al. (2003) also provided distributional data of larvae of Atlantic cod, cunner, capelin, and sand lance (Ammodytes sp.), based on field sampling in June and August 1998. Cod larvae were most abundant in western Placentia Bay waters off the Burin Peninsula; cunner larvae in the northern part of Placentia Bay and off the southern Burin Peninsula; and capelin larvae in western Placentia Bay waters off the southern Burin Peninsula and southern Merasheen Island and Red Island. Sand lance larvae were most abundant in waters off the Cape Shore, in the central part of southern Placentia Bay, and off the southern Burin Peninsula. Of the four species, cod larvae were the least abundant. Patchiness in distribution generally increased during development of all three species with pelagic eggs (Atlantic cod, American plaice, and cunner). The range of estimated patchiness during development was highest for pelagic schooling species with demersal eggs (e.g., capelin, sand lance) (Bradbury et al. 2003). Spatial distribution patterns during the egg and early larval period of cod, American plaice, and cunner were consistent with passive transport out of the western side of Placentia Bay following spawning in the northern part of the bay. Bradbury et al. (2003) hypothesized that observed spatial patterns in older larvae, seasonal size increases in larvae from demersal eggs, and ontogenetic changes in patchiness reflect active processes. In other words, larger larvae may actively contribute to changes in their spatial distribution. The authors concluded that both swimming ability and behaviour become increasingly important in determining spatial distribution patterns during development of pelagic larvae. Ichthyoplankton surveys conducted
Page 8

during the spawning and postspawning seasons of 1997 and 1998 indicated that Atlantic cod egg densities were highest during early spring of both years, subsequently decreasing during spring and summer (Bradbury et al. 2000). The distributions of different egg and larval stages suggested that the eggs and larvae were released from spawning locations and developed during transport in the cyclonic flow from the southeast and around Placentia Bay towards the southwest (i.e., counter-clockwise flow). During the two years of study, Stage I cod eggs were concentrated at Perch Rock in the southeastern part of southern Placentia Bay, at Bar Haven in the northwestern part of northern Placentia Bay, and at Oderin Bank in the western part of southern Placentia Bay. The data suggested that substantial inshore cod spawning consistently occurs at the same locations in Placentia Bay. While the reasons for this are still uncertain, algal biomass is typically highest in the northern and western parts of Placentia Bay, and may therefore provide greater food resources for hatching larvae. Bradbury et al. (2001) suggested that the effects of predation on cod egg mortality are small relative to the advective effects within the Placentia Bay system. The interaction between advection and temperature-dependent vital rates of eggs may have dramatic consequences for coastal retention of eggs and larvae produced within Placentia Bay. Marine Benthos in Placentia Bay
The term “benthos” refers to those plants and animals that live either upon (i.e., epibiota) or within (infauna) the seabed sediment. Benthic communities are typically composed of many taxonomic groups that use a variety of feeding methods. Many species of fish, birds, and mammals feed on marine benthos. The seasonal diet of Atlantic cod in Placentia Bay was investigated between 1997 and 2000. Numerous types of benthic invertebrates were identified in the cod stomachs, including various echinoderms, amphipods, molluscs, polychaetes, and decapods (Mello and Rose 2005a). The diversity of species in fish stomachs is indicative of the diversity of species that occur in Placentia Bay. For the purposes of this Component Study, marine benthos refers to the invertebrate species only. A study conducted in the 1970s identified 84 gammarid and two caprellid amphipod species in Placentia Bay (Fenwick and Steele 1983). The first major study on sedentary macrofauna in muddy substrates in Placentia Bay was conducted in 1998 (Ramey and Snelgrove 2003). Benthic macrofauna were sampled at seven locations within Placentia Bay, six at depths within a 210–230 m range, and the other at a depth of 67 m (Ramey and Snelgrove 2003). Six of the sampling stations were located in the northern part of Placentia Bay north of latitude 47º25’N (see Figure 4.3) (shallowest one at the head of Placentia Bay inside of Bar Haven Island [H], two in the Western Channel between mainland and Merasheen Island [W1 and W2], two in the Eastern Channel between mainland and Long Island [E1 and E2], one in Central Channel between Merasheen Island and Long Island [C]), and one was near Oderin Bank [O] (latitude 47º11’N). Locations of these six sampling stations relative to shore ranged from 0.6–4.0 km. The single sampling station in southern Placentia Bay (i.e., ‘O’) was located 23 km from the Cape. Based on various statistical analyses, distinct infaunal communities occurred at the seven sampling stations (see Figure 4.3). The highest macrofaunal density was found at the station in southern Placentia Bay (i.e., ‘O’), while the lowest densities were observed at sampling stations in northern Placentia Bay. Vertical distribution of macrofauna in samples collected in southern
Page 9

Placentia Bay was more extensive than that for samples collected in the northern part of the bay. At all stations, macrofaunal density was highest in the upper three cm of seabed sediment compared to the 3–10 cm fraction (Ramey and Snelgrove 2003). Species richness (i.e., number of species per station) at all of the northern stations was less than that observed at the southern Placentia Bay station. In northern Placentia Bay, species richness was highest at the shallowest station (H) and least at the northernmost Western Channel station (W1) (Ramey and Snelgrove 2003). The dominant taxa at all seven sampling stations included numerous polychaete species, the bivalve Thyasira sp., and various ribbon worm species (Nemertea). The amphipod Byblis gaimardi was found at the southern Placentia Bay station but not at the northern stations. The most abundant polychaete species was Cossura longocirrata. While the polychaete Pectinaria granulata was abundant at the shallow northern station ‘H’, it was either rare or absent at all of the other six stations. The bivalve Thyasira sp. was most abundant at station ‘O’ in southern Placentia Bay, and at stations ‘C’ and ‘W2’ in the northern part of the bay (Ramey and Snelgrove 2003). Ramey and Snelgrove (2003) suggested that broad-scale changes in sediment-dwelling macrofaunal communities in Placentia Bay may be related to surface water characteristics such as chlorophyll a levels. At the more inshore stations, high levels of organic carbon influenced macrofaunal assemblages which were similar in structure to those typically observed in organic-rich areas. Surface chlorophyll a concentration was positively correlated with sedimentary organic carbon, the most important predictor of infaunal abundance. Marine benthic habitats in the vicinity of the Newfoundland Transshipment Terminal at Whiffen Head were assessed in 1996 (JWEL 1996). The survey was conducted in shallow subtidal areas and in several deeper subtidal areas (10 to >20 m depth). Three substrate types and their respective associated macrobenthos were identified.
1. Sand/cobble: sea urchins, sand dollars, scallops; 2. Cobble/boulder: sourweed (Desmarestia spp.), coralline algae, sea anemones,
mussels, sea urchins; and 3. Boulder/bedrock: rockweed (Fucus spp.), sea anemones, mussels, sea urchins,
cunners.
The shallow subtidal areas assessed by JWEL (1996) were predominantly boulder/bedrock and cobble/boulder habitats. The sand/cobble type of habitat occurred primarily in areas where depth exceeded 10 m. The coarser substrate habitats were also common in the deeper subtidal area (JWEL 1996). Other biota observed during the habitat survey at Whiffen Head included cord weed (Chorda filum), sea colander kelp (Agarum cribrosum), sea stars, winter flounder, yellowtail flounder, ocean pout, lumpfish, and Atlantic cod (JWEL 1996). In 1990, subtidal marine sediment samples were collected at a station near Bar Haven Island (LFA 1991). Samples were collected at depths of 6 and 12 m. Average abundance of benthic fauna was higher in the deeper sediments. Polychaetes comprised the most abundant benthic invertebrate group in the shallow sediments, followed by molluscs, crustaceans, and echinoderms. The most abundant benthic animals were capitellid thread worms (polychaetes),
Page 10
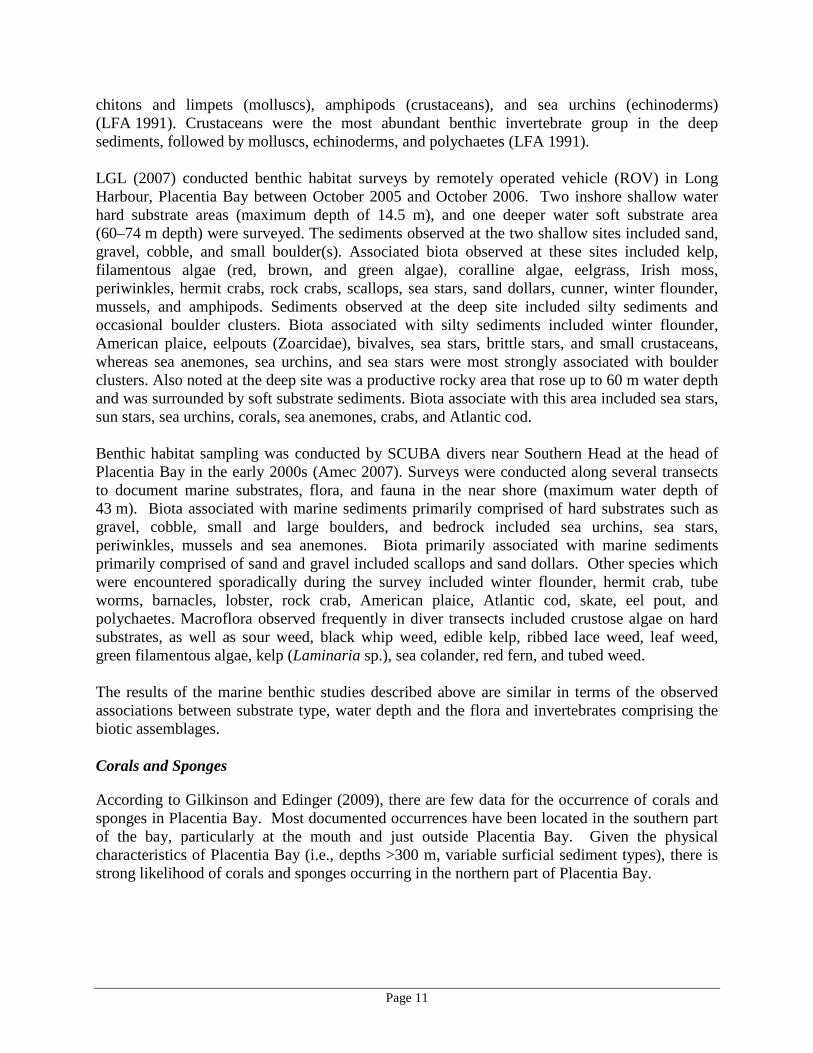
chitons and limpets (molluscs), amphipods (crustaceans), and sea urchins (echinoderms) (LFA 1991). Crustaceans were the most abundant benthic invertebrate group in the deep sediments, followed by molluscs, echinoderms, and polychaetes (LFA 1991). LGL (2007) conducted benthic habitat surveys by remotely operated vehicle (ROV) in Long Harbour, Placentia Bay between October 2005 and October 2006. Two inshore shallow water hard substrate areas (maximum depth of 14.5 m), and one deeper water soft substrate area (60–74 m depth) were surveyed. The sediments observed at the two shallow sites included sand, gravel, cobble, and small boulder(s). Associated biota observed at these sites included kelp, filamentous algae (red, brown, and green algae), coralline algae, eelgrass, Irish moss, periwinkles, hermit crabs, rock crabs, scallops, sea stars, sand dollars, cunner, winter flounder, mussels, and amphipods. Sediments observed at the deep site included silty sediments and occasional boulder clusters. Biota associated with silty sediments included winter flounder, American plaice, eelpouts (Zoarcidae), bivalves, sea stars, brittle stars, and small crustaceans, whereas sea anemones, sea urchins, and sea stars were most strongly associated with boulder clusters. Also noted at the deep site was a productive rocky area that rose up to 60 m water depth and was surrounded by soft substrate sediments. Biota associate with this area included sea stars, sun stars, sea urchins, corals, sea anemones, crabs, and Atlantic cod. Benthic habitat sampling was conducted by SCUBA divers near Southern Head at the head of Placentia Bay in the early 2000s (Amec 2007). Surveys were conducted along several transects to document marine substrates, flora, and fauna in the near shore (maximum water depth of 43 m). Biota associated with marine sediments primarily comprised of hard substrates such as gravel, cobble, small and large boulders, and bedrock included sea urchins, sea stars, periwinkles, mussels and sea anemones. Biota primarily associated with marine sediments primarily comprised of sand and gravel included scallops and sand dollars. Other species which were encountered sporadically during the survey included winter flounder, hermit crab, tube worms, barnacles, lobster, rock crab, American plaice, Atlantic cod, skate, eel pout, and polychaetes. Macroflora observed frequently in diver transects included crustose algae on hard substrates, as well as sour weed, black whip weed, edible kelp, ribbed lace weed, leaf weed, green filamentous algae, kelp (Laminaria sp.), sea colander, red fern, and tubed weed. The results of the marine benthic studies described above are similar in terms of the observed associations between substrate type, water depth and the flora and invertebrates comprising the biotic assemblages. Corals and Sponges
According to Gilkinson and Edinger (2009), there are few data for the occurrence of corals and sponges in Placentia Bay. Most documented occurrences have been located in the southern part of the bay, particularly at the mouth and just outside Placentia Bay. Given the physical characteristics of Placentia Bay (i.e., depths >300 m, variable surficial sediment types), there is strong likelihood of corals and sponges occurring in the northern part of Placentia Bay.
Page 11
Invasive Species
The current principal invasive species in Placentia Bay is the green crab (Carcinus maenas). Life stages (e.g., eggs, larvae, juveniles) of this European crustacean were likely brought to Newfoundland waters in bilge and ballast waters discharged by vessels sailing from the eastern North Atlantic Ocean. Green crab are known to disrupt eelgrass beds, important nursery areas for many marine species, and compete directly with native crustaceans including American lobster. Species Profiles
This subsection provides summary information regarding the life histories and ecological associations for three commercially-important benthic invertebrate species that occur in the Study Area; snow crab, American lobster and sea scallop. Snow Crab
Snow crab in Newfoundland waters typically occurs at water depths ranging between 60 and 400 m on substrates consisting of mud and gravel. The commercial fishery for snow crab has generally been very lucrative since the groundfish moratorium in 1992, but recent years have seen a downward turn in the stock (DFO 2016a). Spawning by snow crab typically occurs in spring and early summer. The eggs are carried by the females until larval hatch during the summer months when water temperatures are appropriate for development of the larvae. The larvae are pelagic and may remain in the water column for months. Eventually, the final pelagic larval stage settles to the seabed and continues development to maturity in the benthic habitat (DFO 2016a). After assuming the benthic habitat, snow crab feed on benthic organisms including polychaetes, echinoderms, and molluscs (DFO 2016a). Based on recent analysis of DFO commercial fishery data for the 2015 season and consultation with commercial harvesters, snow crab is harvested in areas of Placentia Bay proximate to the sea cage sites in the Rushooon BMA. American Lobster
The American lobster has a continuous distribution around the island of Newfoundland, occupying a relatively narrow band of rocky habitat over an approximate depth range of two to 40 m (Ennis 1984). The inshore lobster fishery is primarily conducted in areas with water depths of 15–20 m during spring and early summer and remains important for many fishers (DFO 2016b). Lobster mating typically occurs during the summer months, immediately after the female moults. Egg fertilization might not occur until late summer/fall, after which the female carries the developing eggs on the underside of her abdomen. Hatching occurs the following summer and the resultant larvae assume a pelagic existence. The planktonic larvae undergo four moults before settling to the benthic habitat. Development to the adult stage occurs on the ocean bottom (DFO 2016b). The American lobster is an opportunistic feeder and is known to consume a variety of food including crustaceans, echinoderms, molluscs, fishes, and polychaetes (DFO 2016b).
Page 12
Based on consultations with commercial fishers, lobsters are harvested in areas of Placentia Bay that are close to the Gallows Harbour sea cage site and that overlap with the Long Island sea cage site, both in the Rushoon BMA. However, most lobster harvesting is conducted inshore of the sea cage locations. Sea Scallop
Sea scallops are generally distributed throughout some of the shallow (<20 m) coastal regions around Newfoundland, occurring primarily on sand/gravel or gravel/pebble substrates. They are most abundant in shallow sheltered sandy locations, such as western Placentia Bay. Commercial and recreational harvesting of sea scallops occurs in areas around Newfoundland, including Fortune Bay, Placentia Bay, and St. Mary’s Bay. Spawning typically occurs in September and October. Both the eggs and larvae are planktonic, the latter for about four weeks. The larva develops a “foot” that allows it to attach to an appropriate substrate and, once attached, it develops into the juvenile stage. After a period of growth, the juveniles lose their byssal attachments and lie freely on the ocean bottom for development to the adult stage. Larval sea scallops feed on phytoplankton, while the larger juveniles and adults typically feed on plankton and detritus (DFO 2016c). Based on recent analysis of DFO commercial fishery data for the 2015 season, sea scallops are harvested commercially in areas proximate to the Ship Island, Red Island and Butler Island sea cage sites. Fishes in Placentia Bay
While all of the numerous marine finfish species that occur in Placentia Bay have ecological importance, only some are considered important from a fisheries perspective. This subsection provides summary information regarding the life histories and ecological associations for species of both groups that are most relevant to the proposed Atlantic salmon aquaculture project. Wild Atlantic salmon are discussed in detail in another Component Study prepared for this proposed project (LGL 2018). Fishery and Ecological Importance
Atlantic Cod
Atlantic cod has historically been one of the leading food fishes in the world, and until recent years was Newfoundland and Labrador’s single most important commercial species. The various Atlantic cod populations have decreased precipitously during the past couple of decades, to the point where inshore Atlantic cod appear to be more abundant than those in the offshore areas (DFO 2017a). Inshore cod spawning occurs in several bays in Newfoundland, including Placentia Bay. During 1997–1998, three cod spawning grounds were identified at Bar Haven, Perch Rock near Cape St. Mary’s, and Oderin Bank in Placentia Bay (Lawson and Rose 2000a). Spawning typically occurs during the March–August period.
Page 13

Juvenile cod remain pelagic during early growth after which they become associated with the seabed. First-year demersal juvenile cod have been found in shallow nearshore waters (<8 m depth) during autumn. First year juvenile cod have been caught over a variety of substrate types in nearshore waters, including mud, sand, gravel, and cobble. It appears that the preferred inshore habitat for juvenile cod is characterized by dense beds of eelgrass in sheltered coves, although high numbers also occur in areas without eelgrass, both sheltered and exposed. Juvenile cod in inshore waters move from shallow to deep water as they mature to age three, but do not appear to mix with adult cod until they reach about age three to four (DFO 2017a). Atlantic cod larvae and pelagic juveniles feed mainly on zooplankton. Early demersal stage juveniles in inshore areas continue to feed on zooplankton but then switch to benthic and epibenthic invertebrates (Scott and Scott 1988). There is evidence that capelin is necessary for the optimal growth, condition, and reproductive potential of northern cod (Rose and O’Driscoll 2002). Between 1996 and 2001, cod were sampled in three areas off Newfoundland and Labrador, including Placentia Bay. During January and June sampling, capelin was found in 9.5 percent of the cod taken in Placentia Bay and constituted 22 percent of the diet in terms of weight. During both January and June sampling, stomach content weights were highest in Placentia Bay cod compared to cod from Trinity Bay and Hawke Channel. The condition of Placentia Bay cod was usually higher than the condition of cod sampled further north at Hawke Channel, possibly because potential contact between cod and capelin was higher in the southern areas. Juvenile Fish From September to December, 1997–1999, age 0 cod were surveyed at numerous shallow shoreline sites throughout Placentia Bay (Robichaud and Rose 2006). Sites included a variety of habitat types, although most of them had eelgrass. Generally, catches of age 0 cod were higher at sites in the northern part. Highest overall catches were made at Great Brule and Bar Haven North in the inner bay. This study also indicated a density-dependent range expansion for age 0 juvenile cod - that is, as cod abundance increased, the number of occupied sites also increased. These juvenile cod were most likely found at sites with eelgrass, but with increasing abundance came increased occurrence at sites without eelgrass. Sites such as Great Brule and Bar Haven North may represent critical habitat since these two sites consistently had the highest abundances of these fish regardless of overall annual abundance. Habitat preferences and use of cover of one to four-year old juvenile cod in the inshore waters were investigated with the use of deep sea submersibles (Gregory and Anderson 1997) in areas ranging from 18–150 m. Age 2–4 juvenile cod were most often associated with areas of coarse substrate and high bathymetric relief (i.e., submarine cliffs). Age 1 juveniles were most often associated with areas of gravel substrate and low relief. Juvenile cod did not exhibit selection for substrates with macroalgae cover. Adult Fish The cod stock in Placentia Bay exhibits marked variations in abundance and composition over the course of an annual cycle. Based on data collected in 1999, (Mello and Rose 2005b), a patchy distribution comprised mostly of spawning, old (ages 7–9), large (>60 cm) cod were present in
Page 14

the inner part of Placentia Bay in April/May. The outer part of Placentia Bay had widely scattered and low fish density in April/May except for a higher density aggregation near Cape St. Mary’s in May. By July, cod were more dispersed throughout Placentia Bay in small dense aggregations and abundance had increased four-fold. The cod found in Placentia Bay in July and early-October were predominantly younger (ages 4–6) and smaller than those observed in April/May. The October distribution pattern was similar to that in July although fewer fish were located over the banks in the outer part of Placentia Bay. By November, most cod were located at the head of the bay in moderate to high-density aggregations. The November cod abundance had again decreased to levels similar to those observed in April/May and older, larger fish predominated. The variation in age and size of cod coincided with the expected influx of the non-resident young, small fish into Placentia Bay during the post-spawning period and their subsequent departure in the fall. In summary, Mello and Rose (2005b) showed that the cod stock in Placentia Bay experiences marked variations in abundance and composition over the annual cycle. The variations appear to be related to movement and mixing of fish from different populations. Acoustic surveys in Placentia Bay in 1997 and 1998 identified three primary cod spawning grounds: (1) Bar Haven; (2) Oderin Bank; and (3) Perch Rock (Lawson and Rose 2000a). Ground use and spawning times differed between years. Mean spawning female densities were highest at Perch Rock in 1997 and at Oderin Bank in 1998. Peak spawning in 1997 occurred in April but not until June/July in 1998. In both years, cod spawned at sub- or near-zero temperatures. Robichaud and Rose (2001) provided the first direct evidence through a telemetry study that cod undertaking long-distance feeding migrations may home to a specific spawning ground in consecutive years. Approximately 67 percent of the fish tagged at the Bar Haven spawning ground in April 1998 were relocated during the two years following spawning. All cod relocated during the 1999 and 2000 spawning seasons were within 10 km of the tagging location at Bar Haven. Several of the fish relocated outside of spawning season in 1999 and 2000 were as far as 110 km from the tagging location. Multi-year homing (1999 and 2000) was observed in 26 percent of the cod tagged at Bar Haven. Windle and Rose (2005) suggested that spatial familiarity may be a key factor in cod homing, reinforced through multiyear migrations. Relocation rates on the spawning ground were higher for male fish in all years, suggesting that female cod move in and out of male-dominated spawning aggregations (Robichaud and Rose 2003). Different spawning aggregation structures have also been observed with the application of active acoustics (Rose 1993). The pelagic behaviour of an aggregation of cod was observed in deep water areas (>300 m) and spawning columns were observed in shallow water areas (~50 m). Some of these spawning columns extended as high as 20 m off the ocean floor. Acoustic surveys and mark-recapture experiments conducted in the late 1990s investigated the seasonal movements and distribution of coastal cod in Placentia Bay (Lawson and Rose 1998, 2000b). Spawning cod tagged in the inner part of the bay in spring moved outwards along both the east and west sides of Placentia Bay during spring and summer, further on the east side, sometimes leaving Placentia Bay entirely. Lawson and Rose (2000b) estimated that
Page 15

10–30 percent of the Placentia Bay cod may move in spring and summer into the adjacent stock area, 3L. The majority of tagged cod recaptured in spring the next year following tagging were taken in the bay, perhaps suggesting a return migration. Smaller cod (<50 cm) tended to remain resident in the inner bay and did not migrate as far as larger fish. The degree of aggregation was highest in spring and fall, and lowest in the summer. Cod moved to shallower water after spawning and occupied an increasingly narrow range of depths from spring to fall. Results presented by Lawson and Rose (2000b) were evidence of repeat spawning, year-round residence, and return migrations, suggesting the existence of a Placentia Bay coastal cod stock. A mark-recapture study of Atlantic cod in Northwest Atlantic Fisheries Organization (NAFO) Subdivision 3Ps was initiated in 1997 (Brattey and Healey 2005). Between 1997 and 2006, more than 66,000 cod were tagged at locations in inner and outer Placentia Bay, but primarily the former. Results of the study indicate that most of the recaptures of cod tagged within Placentia Bay occurred in Placentia Bay. Some of the cod tagged in Placentia Bay have been recaptured in other inshore areas within 3Ps, inshore areas outside of 3Ps (Cape St. Mary’s to White Bay), and offshore areas within 3Ps. Based on recent analysis of DFO commercial fishery data for the 2015 season, Atlantic cod were harvested commercially in areas proximate to the Oderin Island sea cage site in the Rushoon BMA and the Ship Island sea cage site in the Merasheen BMA. Another area identified as cod grounds by local harvesters overlaps the Valen Island sea cage site in the Merasheen BMA. Restoration of Eelgrass Beds Eelgrass beds are known to be important nursery areas for a number of marine fishes, including Atlantic cod. The areal extent of coastal eelgrass areas in Placentia Bay has decreased during the past 20 years, perhaps due to an increase in the local population of the invasive species green crab (K. Best, Fisheries Biologist, Marine Institute of Memorial University of Newfoundland [MI], pers. comm., 13 February 2018). In response to this areal decrease, the Coastal Restoration Project, managed by the MI in collaboration with FFAW, intends to restore eelgrass areas in Placentia Bay using internationally-recognized eelgrass transplantation methodology. One important aspect of site preparation for eelgrass restoration is the removal of green crab in an effort to reduce its population spread. To date, this research has provided increased understanding of green crab biology and how this crustacean may affect local ecology (i.e., competition with lobster, destruction of eelgrass beds (FFAW|Unifor 2018). Individual green crab removals are being conducted by fishers at nine locations in Placentia Bay in preparation for eelgrass restoration; three along the western shore of Placentia Bay (vicinity of Rushoon), two along the northern shore (vicinity of North Harbour), and four along the eastern shore (vicinity of Long Harbour) (Figure 4.4). All are located ≥5 km from any of the proposed sea cage sites (K. Best, Fisheries Biologist, MI, pers. comm., 13 February 2018). The green crab harvest component of site preparation was begun in October 2017 (FFAW|Unifor 2017). April 1, 2018 to March 31, 2019 represents the first full year of green crab removal for the purpose of eelgrass site restoration preparation (K. Best, Fisheries Biologist, MI, pers. comm., 13 February 2018).
Page 16

Source: K. Best, Fisheries Biologist, MI, pers. comm., 1 March 2018.
Figure 4.4. Areas with eelgrass restoration sites in Placentia Bay, NL. Atlantic Herring
There are five coastal herring stocks in east and southeast Newfoundland, one of which is the St. Mary’s Bay-Placentia Bay (SMB-PB) stock (Wheeler et al. 2004; DFO 2017b). Although there are fall spawning herring, spring spawners appear to dominate most stocks. Atlantic herring generally spawn during May and June. These demersal spawners deposit adhesive eggs on stable bottom substrates, typically in shallow (<20 m depth) coastal waters, primarily on gravel or rocky bottom where there is an abundance of seaweed. Other documented spawning substrates include sand and bare rock. Eelgrass has been associated with herring spawning in some locations (Scott and Scott 1988). The larvae that hatch from the demersal herring eggs are pelagic. The pelagic larvae and the juveniles that develop from them are known to make diel (night-to-day) vertical migrations. The juveniles and adults tend to avoid the surface waters during daylight hours, likely a strategy for avoiding avian predators. These pelagic schooling fish do not appear to have any substrate preference during juvenile and adult phases. Atlantic herring are visual feeders, consuming primarily plankton during daylight hours (Scott and Scott 1988).
Page 17

Sjare et al. (2003) identified areas of herring aggregation in all five regional subdivisions of shoreline biological communities based on local ecological knowledge (Catto et al.1999). The primary areas indicated include coastal waters between Lamaline and St. Lawrence on the southern part of the Burin Peninsula, around Boat Harbour/Brookside/Little Harbour West on the west side of Placentia Bay, at the head of Placentia Bay, and around the islands of inner Placentia Bay (Merasheen Island/Long Island). Based on analysis of commercial fishery data for 2015, herring were harvested at the head of Placentia Bay, some distance away from any sea cage sites. Sea-run Brown Trout
Westley and Fleming (2011) confirmed the presence of brown trout (Salmo trutta) in the following five Placentia Bay rivers: (1) Northeast River; (2) South East River; (3) Come By Chance River; (4) Piper’s Hole River; and (5) Salmonier River (Burin Peninsula). There is potential for the occurrence of sea-run trout in these freshwater systems. Although there is no commercial fishery for sea-run trout, there is a recreational fishery. Ecological Importance
Lumpfish
Lumpfish are semi-pelagic, spending much of their time far from the coast. Adult lumpfish exhibit seasonal migrations in Newfoundland waters, moving into shallow coastal waters to spawn in spring and early summer, and then returning to deeper offshore waters in late summer and early fall. Mature female lumpfish are commercially fished for their roe during the inshore spring-summer spawning season (Kearley 2012). Lumpfish eggs adhere to the nest substrate, which is most often rock. Larval hatch typically occurs during May–June and the larvae attach to macroalgae and hard substrate by means of an adhesive disc. Juvenile lumpfish appear to remain in the coastal area up to age 1. They then adopt the semipelagic lifestyle characteristic of adult lumpfish and distribute themselves offshore (Scott and Scott 1988; Kearley 2012). Free-swimming larvae and first-year juveniles feed on zooplankton. After adopting the semipelagic lifestyle, lumpfish switch to a variety of benthic and pelagic food items including ctenophores, amphipods, polychaetes, molluscs, fish and ichthyoplankton (Scott and Scott 1988; Kearley 2012). Capelin
Capelin is one of the most ecologically fish species in the region since it is an important food species for many species of fish, marine birds and mammals. These pelagic fish exhibit inshore-offshore migrations associated with spawning. Capelin typically overwinter in offshore waters, move shoreward in early spring to spawn on appropriate beaches in spring/summer, and return to offshore waters in autumn. Exact timing of spawning appears to be highly dependent on
Page 18
water temperature. Juvenile capelin are found in Newfoundland bays but capelin larvae appear to be rapidly carried out of the bays and inshore areas by surface currents (DFO 2015). Five stock complexes of capelin have been recognized in the Newfoundland region based on spawning and overwintering locations, including the Saint-Pierre Bank stock that spawns on the south coast of Newfoundland (Carscadden et al. 1989). Beach suitability for spawning is primarily dependent on substrate type, with capelin showing a preference for gravel. Suitable beaches are found in exposed, moderately exposed and sheltered locations. Beach spawning by capelin is demersal with the eggs typically being deposited in the intertidal zone, although capelin are also known to deposit eggs in the subtidal zone in depths ranging up to 37 m (Carscadden et al. 1989). Capelin larvae remain on the gravel, upon hatching, until they are flushed by wave action. Once flushed from the spawning sediments, the capelin larvae are pelagic and rapidly advected from embayments into open bays and eventually into the offshore. Adult capelin exhibit diel (night-to-day) vertical migrations in that they occupy the lower water column during the day and move upwards at night. During autumn, the diel vertical migration shows a reverse pattern (Scott and Scott 1988; Carscadden et al. 1989). Capelin feed on various plankton, including copepods and amphipods, mainly during non-spawning times. (Scott and Scott 1988). The abundance and distribution of capelin in Placentia Bay were assessed using acoustic surveys in January, March, and June 1998, and in January 1999 (O’Driscoll and Rose 1999). Capelin biomass was highest in June 1998, estimated at 132,000 t in the outer bay. Estimated biomasses were much lower during the other three surveys, ranging from 390 t in January 1999 to 13,000 t in January 1998. In addition to these seasonal differences in spatial distribution, seasonal differences in vertical distribution were also observed. Capelin occurred near the surface at night and near the bottom during the day in June 1998. No diurnal vertical migration was evident during the other three survey times. Capelin tended to remain near the bottom during January and March. Most of the capelin observed during the four surveys were immature, approximately 75 percent measuring less than 130 mm. The highest capelin densities observed during January 1998 occurred on the eastern side of outer Placentia Bay, and immediately to the south of Merasheen Island and Red Island (O’Driscoll and Rose 1999). In March 1998 the highest densities had shifted towards the western side of outer Placentia Bay and throughout more of the inner bay. June 1998 densities were distributed relatively evenly throughout outer Placentia Bay. The survey in January 1999 found the highest densities in Paradise Sound and towards the head of the bay. Sjare et al. (2003) identified areas with capelin spawning beaches and offshore spawning areas based on local ecological knowledge. Capelin spawning beaches occur in all five of the regional subdivisions of shoreline biological communities described by Catto et al. (1999). Areas with offshore capelin spawning were identified in four of the five regional subdivisions; the exception was the Swift Current Estuarine Region. The most extensive area of offshore spawning activity was identified off the south coast of the Burin Peninsula.
Page 19

Sharks
Sharks have been identified as fish with the potential of causing damage to aquaculture sea cages. This subsection provides a brief summary of their occurrences in Newfoundland waters. The four largest species of shark that occur in Newfoundland waters are (1) porbeagle shark; (2) shortfin mako shark; (3) blue shark; and (4) white shark. Brief profiles are provided for the first three in this subsection, and a profile of the white shark is included in the subsection on species at risk (i.e., Schedule 1 of the SARA and the ESA). Porbeagle Shark
The porbeagle shark was designated as endangered by COSEWIC in May 2004. This large cold-temperate coastal and oceanic shark is distributed across the North Atlantic and is known to occur in southern Newfoundland waters during spring and summer (Scott and Scott 1988). The porbeagle shark is typically most common on continental shelves but is also found far from land in ocean basins and occasionally close to shore. It mates within NAFO Subdivision 3Ps during late summer/fall, followed by the release of live young (pups) the following winter (Campana et al. 2001). The pupping occurs outside of Placentia Bay. Porbeagle sharks are predators of various fish species and cephalopods (Campana et al. 2001). Pelagic species are the primary prey during the spring and summer, followed by a shift to groundfish species in the winter. This prey shift reflects the seasonal change of distribution of porbeagle (i.e., migration to deeper areas in fall and winter) (Campana et al. 2001). Shortfin Mako Shark
The shortfin mako shark was designated as threatened by COSEWIC in April 2006. Shortfin makos are distributed circumglobally in all tropical and temperate seas. In Canadian Atlantic waters, it is typically associated with warm water in and near the Gulf Stream. There are no reliable population-level stock assessments available in the northwest Atlantic. Trend information based on declines in bycatch rates in the entire northwest Atlantic suggests that shortfin mako populations may have decreased in the past 15–30 years (COSEWIC 2017). This shark is a highly migratory seasonal visitor (late summer and fall) to Canada’s Atlantic coast, typically occurring anywhere from surface waters to depths of about 500 m. The life cycle of the shortfin mako is not completely understood. It is ovoviviparous (internal hatching) and likely breeds outside of Canadian waters. Few mature makos have been caught in Canadian waters (COSEWIC 2017). Blue Shark
The blue shark occurs in oceanic pelagic and continental shelf pelagic habitats, ranging from the surface to at least 600 m depth and preferring temperatures of 12–20° C. Individuals show seasonal migrations, occurring on the continental shelf in the northwest Atlantic in summer and then moving into deeper off-shelf areas in November for the winter. The species has a single highly migratory population in the North Atlantic, of which a portion is present in Canadian waters seasonally (COSEWIC 2016).
Page 20

Bluefin Tuna
While not common in Placentia Bay, bluefin tuna have been identified as a species of fish with the potential of causing damage to aquaculture sea cages. This subsection provides a brief summary of its occurrence in Newfoundland waters. The bluefin tuna (Thunnus thynnus), the largest member of the mackerel-like fishes (family Scombridae), occurs on both sides of the Atlantic Ocean (Scott and Scott 1988). The species is at its northern range in Canada and often show unpredictable and changeable distribution (Archambault et al. 2001). Bluefin occur in Canadian waters from July to December over the Scotian Shelf, in the Gulf of St. Lawrence, and off Newfoundland (Archambault et al. 2001). The occurrence of bluefin tuna in Newfoundland waters has increased during recent years (G. Melvin, Research Scientist, DFO, pers. comm., 2015). Bluefin tuna occur in Canadian waters for feeding purposes (Neilson 2009). These opportunistic feeders prey extensively on herring, mackerel, squid, and crustaceans (Archambault et al. 2001; Neilson 2009). It must be noted that the only information available on the distribution of the species (both temporal and seasonal) is commercial fisheries data as there are no fisheries-independent surveys for large pelagic species (Archambault et al. 2001). In the west Atlantic, bluefin tuna are thought to spawn from mid-April to June in the Gulf of Mexico and Florida Straits (Archambault et al. 2001; see review by Rooker et al. 2007), far south of the SEA Area. Based on tagging studies, spawning may also occur in the central North Atlantic (Lutcavage et al. 1999). Juveniles are thought to occur over the continental shelf, primarily between 35°N and 41°N in summer and in offshore waters, at the same latitudes, in the winter (Archambault et al. 2001). Neilson (2009) noted that habitat for larval and juvenile stages of bluefin tuna occur outside of Canadian waters. Bluefin tuna has been identified as a candidate species by COSEWIC (Neilson 2009). Fish Species at Risk
The six fish species/populations listed on Schedule 1 of the Species at Risk Act (SARA) and/or under the Endangered Species Act (ESA) could occur in the Study Area. These species are profiled below. White Shark (Atlantic population)
The Atlantic population of white shark is designated as endangered on Schedule 1 of SARA and by COSEWIC. Globally, this species is observed and captured most frequently in waters over the continental shelves of the Northwest Atlantic Ocean, Mediterranean Sea, southern Africa, southern Australia, New Zealand, and the eastern North Pacific Ocean (LGL 2015). White shark is relatively rare in Canadian waters, which represents the northern-most portion of its sub-tropical and temperate distribution (COSEWIC 2006). This species occurs in inshore and offshore waters, including in the breakwaters off sandy beaches, off rocky shores, and within bays, lagoons, harbours and estuaries, from just below the surface to water depths of at least 1,280 m (COSEWIC 2006). White shark does not typically enter brackish or freshwaters (COSEWIC 2006). A highly mobile species, white shark individuals in Atlantic Canada are
Page 21

likely seasonal migrants that belong to a widespread Northwest Atlantic population (COSEWIC 2006). In recent years, numerous white sharks have been tagged by OCEARCH, a non-profit organization devoted to global-scale research on white sharks and other large apex predators, providing open source, near-real time data (including satellite tracks) through the Global Shark Tracker (LGL 2015; OCEARCH 2018). An adult female white shark, “Lydia”, originally tagged in March 2013 off Jackson, Florida, was within the Study Area during 26–29 October 2013, including in the vicinity of the proposed sea cage sites in the Rushoon BMA, within the southern portion of the Merasheen BMA, and south of the Red Island BMA (OCEARCH 2018). No abundance trend information is available for the Atlantic population of white shark (COSEWIC 2006). However, the white shark population has been estimated to have recently declined by ~80% in portions of the Northwest Atlantic Ocean beyond Canadian waters (COSEWIC 2006). Northern Wolffish
The northern wolffish is designated as threatened on Schedule 1 of SARA and by COSEWIC. This deepwater species has been captured from boreal and subarctic water depths of 38–1,504 m, with the densest concentrations observed between 500 and 1,000 m in water temperatures of 2–5ºC (COSEWIC 2012a; LGL 2015). In Canadian waters, northern wolffish range from the Canadian portion of the Gulf of Maine to the Labrador Sea as far as the waters off west Greenland and extend eastwards to the Grand Banks (COSEWIC 2012a). Northern wolffish undertake limited migration, inhabiting a variety of bottom substrate types such as mud, sand, pebbles, small rock and hard bottom, with the highest concentrations observed over sand and shell hash in the fall and coarse sand in the spring (C-NLOPB 2010; COSEWIC 2012a; LGL 2015). Unlike other wolffish species, both juvenile and adult stages of this species have been found a considerable distance above the bottom substrate, as indicated by diet (Kulka et al. 2007; LGL 2015). Northern wolffish have low productivity and are thought to spawn in the late-fall or early-winter on rocky bottom substrate (Templeman 1985, 1986 in C-NLOPB 2010; COSEWIC 2012a; LGL 2015). No northern wolffish were caught in the commercial fishery or DFO Research Vessel (RV) surveys within the Study Area in recent years although suitable habitat exists there (COSEWIC 2012a). Spotted Wolffish
Spotted wolffish are designated as threatened on Schedule 1 of SARA and by COSEWIC. The life history, distribution and habitat use of spotted wolffish are very similar to that of northern wolffish, except that it rarely inhabits the deepest areas used by northern wolffish (COSEWIC 2012b; LGL 2015). Spotted wolffish have been caught at water depths of 56–1,046 m, although they are most frequently observed between 200–750 m depth at water temperatures of 1.5–5ºC (COSEWIC 2012b; LGL 2015). In Newfoundland and Labrador waters, reproduction typically occurs in July and August on stony bottom habitat (LGL 2015). No spotted wolffish were taken in recent commercial fisheries or DFO RV surveys in the Study Area despite the presence of suitable habitat (COSEWIC 2012b).
Page 22

Atlantic Wolffish
Atlantic, or striped, wolffish are designated as special concern on Schedule 1 of SARA and by COSEWIC. Atlantic wolffish occupy the same general distribution range as northern and spotted wolffish, with juveniles and adults primarily inhabiting rocky or sandy bottom substrates of continental shelf waters (COSEWIC 2012c). Atlantic wolffish tolerate a broader temperature range than other wolffish species, from -1.5–13ºC (COSEWIC 2012c). Similar to other wolffish species, Atlantic wolffish have low productivity. Spawning is thought to occur in the fall, and the eggs are guarded by male Atlantic wolffish until they hatch (COSEWIC 2012c). The total number of Atlantic wolffish in Canadian waters has been estimated at 49 million, including ~5 million mature individuals (COSEWIC 2012c). No Atlantic wolffish were caught in recent commercial fisheries in the Study Area, while at least 21 individuals were caught during DFO RV surveys within the Study Area during 2010–2015, in water depths <200 m. American Eel
Although not listed on SARA, American eel is designated as threatened by COSEWIC and vulnerable under the ESA. American eel is a highly migratory species that spawns in oceanic waters, migrates to coastal and inland waters to grow, and returns to ocean spawning grounds to reproduce and die (Cairns et al. 2008 in C-NLOPB 2010; COSEWIC 2012d). The continental distribution of this species ranges from northern South America to Greenland and Iceland (COSEWIC 2012d). Historically, its Canadian range included all accessible freshwater habitats, estuaries and coastal marine waters connected to the Atlantic Ocean, up to the mid-Labrador coast (COSEWIC 2012d). The distribution and abundance of this species has decreased in freshwater habitats over the past 100 years due to human development (COSEWIC 2012d). Currently, American eel can be found in most coastal areas and adjacent accessible rivers in Newfoundland but are only known as far north as Labrador’s English River (FLR 2018). Maturing American eel are primarily benthic, using rocky, sandy or muddy substrate, woody debris and submerged vegetation for protection and cover, particularly eelgrass and interstitial spaces (i.e., spaces between aquatic sediments) (COSEWIC 2012d). American eel spawn once during their lifetimes, with spawning occurring in the Sargasso Sea (C-NLOPB 2010; COSEWIC 2012d). Newfoundland is relatively data-poor with respect to absolute abundance at any life stage (C-NLOPB 2010); however, time series data used to estimate percent change in indices of abundance indicated declines between the 1980s and 2000s (COSEWIC 2012d). American eel were not caught during commercial fisheries or DFO RV surveys within the Study Area in recent years, although the Study Area is within the habitat range of this species (COSEWIC 2012d). Banded Killifish (Newfoundland populations)
The Newfoundland populations of banded killifish are designated as special concern on Schedule 1 of SARA and by COSEWIC, and as vulnerable under the ESA. Banded killifish is distributed throughout much of eastern North America, with the Newfoundland populations exhibiting a scattered distribution, primarily concentrated in clear lakes and ponds with a muddy or sandy bottom along the south and west coasts of the island (Chippet 2003 and SAR 2006 in C-NLOPB 2010; COSEWIC 2014). The Newfoundland populations are isolated from the mainland populations and are now being investigated as a possible subspecies (FLR 2018).
Page 23

Although banded killifish most often inhabit fresh waters, it is euryhaline (i.e., capable of living in habitats with elevated salinity) and occasionally occupies estuaries or marine waters (Fritz and Garside 1974 in C-NLOPB 2010; COSEWIC 2014). This species requires shallow water, slow currents, soft substrates and abundant aquatic vegetation, and does not appear to become active in Newfoundland until water temperatures reach 12ºC (COSEWIC 2014). Spawning has been reported in Newfoundland from late-June through August, contrary to the mainland populations which reproduce during the spring (COSEWIC 2014). Adhesive eggs are attached to aquatic plants, and the young receive no parental care (COSEWIC 2014). Banded killifish are typically abundant within the confined regions in which they are found (GNL 2010). Limited data are currently available with regard to Newfoundland population trends, although there is no indication of decline in the number of populations or abundance within their scattered regions (GNL 2010; COSEWIC 2014). Known populations of banded killifish in freshwater bodies which ultimately drain into Placentia Bay are located in Freshwater Pond (southwest of Marystown), the town of Winterland (west of Marystown), and Garnish Pond (northwest of Marystown) (COSEWIC 2014). Additional banded killifish locations were recently identified near Marystown and the southern portion of the Burin Peninsula, although specific location names were not provided (DFO 2016d). Banded killifish were not caught during commercial fisheries or DFO RV surveys within the Study Area in recent years. 4.1.1.2 Marine Birds, Marine Mammals and Sea Turtles in Placentia Bay
This subsection provides brief overviews of the occurrences of marine birds, marine mammals and sea turtles in Placentia Bay. These animal groups are included because their principal prey are components of ‘fish and fish habitat’. Marine Birds
Placentia Bay is an important ecosystem for marine birds throughout the year. Placentia Bay has one of the highest densities of Bald Eagles in eastern North America (Dominguez 1998; Letto et al. 2015). A section of Placentia Bay surveyed annually by the Newfoundland and Labrador Wildlife Division from 1990–2009 had an average of 20.1 active nest annually with a maximum of 30 in 2007 (Letto et al. 2015). Newfoundland Bald Eagles appear to not have been affected by DDT and other pollutants that caused population drops across North America in the 1960s and 1970s. An understanding of Bald Eagle population dynamics in the relatively pristine Placentia Bay with a high density is considered informative for restoration and conservation of Bald Eagle populations elsewhere (Letto et al. 2015). Cape St. Mary’s supports the largest colony of the Northern Gannet in Newfoundland (13,515 pairs) and nearly 20 percent of the Atlantic Canada breeding population. Cape St. Mary’s also hosts 15,484 pairs of nesting Common Murre, 1,000 pairs of Thick-billed Murres and 10,000 pairs of Black-legged Kittiwakes (ECCC-CWS unpublished data). Middle Lawn Island, Burin Peninsula, supports the only known viable breeding colony of the Manx Shearwater in North America. Several large nesting colonies of Leach’s Storm-Petrel include 8,773 pairs on Middle Lawn Island, 100,000 Corbin Island and 48,000 on Green Island (ECCC-CWS unpublished data).
Page 24

Placentia Bay supports large numbers of non-breeding species as well. Concentrations of tens of thousands of Great Shearwaters from the Southern Hemisphere are known to concentrate in Placentia Bay to feed on capelin during the spawning season (June and July). In the winter, concentrations of sea ducks, especially the Common Eider spend the season feeding over rich inshore shoals particularly at Cape St. Mary’s and various other shoals and islets. Cape St. Mary’s is an important wintering area for the ‘Endangered’ Harlequin Duck. The rich avifauna of Placentia Bay is reliant on the existing healthy ecosystem. Both Great and Double-crested Cormorants nest in Placentia Bay. The Great Cormorants are year-round residents but the Double-crested Cormorants migrate south during the winter season. A certain portion of the population of Common Loon feeds in salt water year-round. Marine Mammals
Marine mammals are common visitors to the waters of Newfoundland and Labrador. Observed year-round, they are most common during summer months as the waters off Newfoundland and Labrador, including those of the Study Area, represent feeding habitat for a number of species. Eleven species of marine mammals are expected to regularly occur in Placentia Bay, including eight species of cetaceans and three species of seals. Several additional species have been sighted in the Study Area or likely occur there, but because of their rarity in the area are not considered further. Some river otters (Lontra canadensis) in the Study Area have adopted a primarily marine lifestyle and one of the highest otter densities in Newfoundland occurs in the coastal waters from the southern extent of Merasheen Island to the head of Placentia Bay (Goudie and Jones 2007). Three species of mysticetes or baleen whales regularly occur in Placentia Bay including humpback whale (Megaptera novaeanglie), fin whale (Balaenoptera physalus), and minke whale (B. acutorostrata). Of these species, the fin whale is listed as Special Concern under Schedule 1 of SARA. Baleen whales primarily feed on capelin, but also feed on krill, squid, herring, and sand lance. Two mysticete species, the blue whale (Balaenoptera musculus) and North Atlantic right whale (Eubalaena glacialis), whose occurrence in the Study Area would be considered rare are listed as Endangered under Schedule 1 of SARA. There were acoustic and visuals detection of North Atlantic right whales in summer 2017 in Placentia Bay (J. Lawson, DFO, Research Scientist, pers. comm., 3 April 2018). Five species of odontocetes or toothed whales are known or expected to regularly occur in Placentia Bay including long-finned pilot whales (Globicephala melas), short-beaked common dolphin (Delphinis delphis), Atlantic white-sided dolphin (Lagenorhynchus acutus), white-beaked dolphin (Lagenorhynchus albirostris) and harbour porpoise (Phocoena phocoena). The harbour porpoise is considered Special Concern by COSEWIC. Most toothed whales that occur in Placentia Bay are known or thought to consume squid, fish (capelin, cod, sand lance, herring, mackeral), and/or amphipods. Harbour (Phoca vitulina concolor), grey (Halichoerus grypus), and harp seals (Pagophilus groenlandicus) occur in Placentia Bay. Some harbour seals may occur there in small numbers year-round whereas harp and grey seals are considered visitors. These species are not considered at risk by COSEWIC nor are they listed on SARA. Seals have a varied diet including pelagic and
Page 25

demersal fish as well as cephalopods and crustaceans (e.g., Boulva and McLaren 1979; Hammill et al. 1995; Lawson et al. 1998). Sea Turtles
Leatherback sea turtles (Dermochelys coriacea) regularly occur in Placentia Bay and they are listed as Endangered on Schedule 1 of SARA. It is possible that loggerhead sea turtles (Caretta caretta), also listed as Endangered on Schedule 1 of SARA, may occur in Placentia Bay but their occurrence is considered uncommon. Leatherbacks are a pelagic, migratory species that tend to inhabit temperate oceanic and coastal shelf waters, where they forage on jellyfish between April and December (COSEWIC 2012e). Archibald and James (2016) suggested that Canadian waters may have the highest density of foraging leatherbacks anywhere throughout their range. Although critical habitat has not yet been designated for this species in Atlantic Canadian waters (ALTRT 2006), areas previously identified as important foraging habitat have now been identified in the proposed recovery strategy as critical habitat areas for leatherbacks (DFO 2016f). Three proposed critical habitat areas have been identified one of which is the Placentia Bay Area (DFO 2016f). 4.1.2 Project Area
Water Quality
Since early 2016, Grieg NL has regularly collected water temperature and dissolved oxygen (DO) data at all 11 sea cage sites (Grieg NL, unpublished data). The frequency of water quality data collection has been sufficient to provide measures throughout the year (i.e., variability due to seasonality has been captured). Water temperature data were collected at six water depths; 0, 3, 10, 25, 35, and 50 m. This depth range was selected based on the 45 m vertical dimension of the sea cages to be used in this project. Summary statistics (i.e., mean, minimum, and maximum values) for the water temperature data at each sea cage site are presented in Table 4.1. The highest mean temperatures collected at each water column depth are highest for the sea cage sites in the Long Harbour BMA, while the lowest mean temperatures were observed at the sea cage sites in the Rushoon BMA. The lowest minimum water temperature of -0.5°C was observed at both the 25-m and 35-m depths at the Oderin Island sea cage site (Rushoon BMA) site in March, and at the 50-m depth at the Butler Island sea cage site (Red Island BMA) in April. The maximum water temperatures exceeding 17.0°C were observed in the upper three meters of the water column at the Rushoon, Merasheen and Red Island BMA sea cage sites in August. Dissolved oxygen data were collected at three water depths: 3, 15 and 35-m. Summary statistics (i.e., mean, minimum, and maximum values) for the DO data at each sea cage site are presented in Table 4.2. The lowest mean DO levels were observed at the sea cage sites of the Long Harbour BMA, while mean levels at the other nine sea cage sites were quite similar. The highest maximum DO levels (i.e., 13.7–15.9 ppm) at 3-m and 15-m depths at all sea cage sites were typically observed during late spring (i.e., May and June). The timing of the highest maximum DO level at 35-m depth was more variable (e.g., in August for both the Merasheen and Long Harbour BMAs; May–July for the other two BMAs). The lowest minimum DO levels were
Page 26

observed at the Oderin Island sea cage site (e.g., 6.5–7.3 ppm). The timing for the lowest minimum DO levels was typically late summer/early fall for the sea cage sites in Rushoon and Merasheen BMAs, but slightly later (i.e., November) in the other two BMAs. Table 4.1. Summary statistics for water temperature data (°C) collected at the proposed sea cage sites, March 2016–February 2018.
BMA/Sea Cage Site Statistic
Sampling Depth Surface 3-m 10-m 25-m 35-m 50-m
Rushoon BMA Oderin Island Mean
Min Max
7.5 -0.2 (Mar) 17.2 (Aug)
6.0 -0.2 (Mar) 17.0 (Aug)
5.6 -0.2 (Mar) 15.6 (Aug)
4.5 -0.5 (Mar) 12.3 (Oct)
3.8 -0.5 (Mar) 12.1 (Oct)
2.7 -0.4 (Mar) 10.3 (Oct)
Long Island Mean Min Max
7.5 0.2 (Mar) 16.7 (Aug)
6.0 0.2 (Mar) 16.4 (Aug)
5.7 -0.1 (Mar) 16.0 (Aug)
4.8 -0.2 (Mar) 13.1 (Aug)
3.9 -0.2 (Mar) 12.5 (Sept)
2.8 -0.2 (Mar) 10.7 (Oct)
Gallows Harbour Mean Min Max
7.5 0.4 (Mar) 17.1 (Aug)
6.1 0.3 (Mar) 16.6 (Aug)
5.7 0.0 (Apr) 16.3 (Aug)
4.7 0.0 (Apr) 12.9 (Aug)
3.9 -0.1 (Mar) 11.8 (Sept)
2.8 -0.1 (Mar) 10.2 (Oct)
Merasheen BMA Valen Island Mean
Min Max
8.8 -0.1 (Mar) 17.1 (Aug)
7.4 -0.1 (Mar) 17.0 (Aug)
7.2 0.0 (Apr) 16.7 (Aug)
5.9 0.0 (Apr) 14.3 (Aug)
5.0 -0.1 (Apr) 13.0 (Sept)
3.6 -0.2 (Apr) 10.9 (Oct)
Chambers Island Mean Min Max
8.0 -0.1 (Mar) 17.1 (Aug)
7.5 -0.1 (Mar) 17.1 (Aug)
7.2 0.0 (Mar) 16.9 (Aug)
5.9 0.0 (Apr) 13.7(Sept)
4.9 0.0 (Apr) 13.5 (Sept)
3.6 -0.2 (Apr) 10.8 (Oct)
Ship Island Mean Min Max
8.0 -0.2 (Mar) 17.3 (Aug)
7.5 -0.2 (Mar) 17.3 (Aug)
7.3 0.0 (Mar) 17.1 (Aug)
5.9 -0.1 (Apr) 13.8 (Sept)
4.9 -0.1 (Apr) 12.8 (Sept)
3.4 -0.2 (Apr) 10.4 (Oct)
Red Island BMA Darby Harbour Mean
Min Max
7.6 -0.1 (Apr) 17.0 (Aug)
7.1 -0.1 (Apr) 17.0 (Aug)
7.0 -0.1 (Apr) 16.9 (Aug)
5.8 -0.1 (Apr) 13.1 (Sept)
4.7 -0.2 (Apr) 11.8 (Sept)
3.3 -0.2 (Apr) 10.8 (Oct)
Red Island Mean Min Max
7.8 -0.1 (Apr) 17.3 (Aug)
7.4 -0.1 (Apr) 17.2 (Aug)
7.2 -0.1 (Apr) 17.2 (Aug)
5.9 -0.1 (Apr) 13.6 (Sept)
4.7 -0.2 (Apr) 11.9 (Oct)
3.1 -0.3 (Apr) 11.3 (Oct)
Butler Island Mean Min Max
7.9 -0.2 (Apr) 17.4 (Aug)
7.4 -0.2 (Apr) 17.3 (Aug)
7.2 -0.2 (Apr) 16.8 (Aug)
5.9 -0.2 (Apr) 12.8 (Sept)
4.7 -0.3 (Apr) 12.6 (Sept)
3.3 -0.5 (Apr) 11.3 (Oct)
Long Harbour BMA Iona Island Mean
Min Max
10.3 2.0 (Dec) 16.3 (Aug)
10.5 2.0 (Dec) 16.3 (Aug)
10.0 2.0 (Dec) 15.9 (Aug)
8.5 1.2 (May) 13.5 (Sept)
6.6 0.7 (May) 10.9 (Sept)
4.3 0.4 (May) 9.7 (Oct)
Brine Island Mean Min Max
10.4 2.0 (Dec) 16.4 (Aug)
10.5 2.1 (Dec) 16.4 (Aug)
10.0 2.0 (Dec) 15.9 (Aug)
8.5 1.1 (May) 14.8 (Aug)
6.7 0.4 (May) 11.2 (Oct)
4.7 0.2 (May) 9.1 (Oct)
Source: Grieg NL (unpublished data). Note: Months in which minimum and maximum temperatures were observed are provided in parentheses.
Page 27

Table 4.2. Summary statistics for dissolved oxygen data (mg/L [ppm]) collected at the proposed sea cage sites, February 2016–February 2018.
BMA/Sea Cage Site Statistic Sampling Depth
3-m 15-m 35-m Rushoon BMA
Oderin Island Mean Min Max
11.7 6.5 (Aug) 15.4 (May)
11.8 6.9 (Aug) 15.6 (May)
11.9 7.3 (Oct) 15.0 (July)
Long Island Mean Min Max
11.7 7.5 (Aug) 15.5 (May)
11.7 7.6 (Aug) 15.6 (May)
12.0 8.6 Sept) 15.6 (May)
Gallows Harbour Mean Min Max
11.6 8.2 (Aug) 15.6 (May)
11.6 6.7 (Aug) 15.6 (May)
11.9 7.9 (Aug) 15.1 (May)
Merasheen BMA Valen Island Mean
Min Max
11.4 8.2 (Aug) 15.7 (May)
11.4 8.1 (Sept) 15.5 (May)
11.8 8.5 (Sept) 19.3 (Aug)
Chambers Island Mean Min Max
11.4 8.5 (Aug) 15.5 (May)
11.3 8.3 (Sept) 15.3 (May)
11.8 8.4 (Sept) 15.2 (Aug)
Ship Island Mean Min Max
11.4 8.4 (Sept) 15.3 (May)
11.4 8.3 (Sept) 15.4 (May)
11.8 8.2 (Nov) 15.1 (Aug)
Red Island BMA Darby Harbour Mean
Min Max
11.6 8.7 (Nov) 15.7 (May)
11.5 8.4 (Nov) 15.3 (May)
12.0 8.4 (Sept) 15.2 (May)
Red Island Mean Min Max
11.5 8.4 (Sept) 15.9 (May)
11.5 8.3 (Sept) 15.2 (May)
12.0 8.2 (Nov) 15.2 (May)
Butler Island Mean Min Max
11.4 8.0 (Nov) 15.7 (May)
11.5 7.8 (Nov) 15.3 (May)
12.0 6.9 (Nov) 15.2 (May)
Long Harbour BMA Iona Island Mean
Min Max
10.5 8.8 (Nov) 13.7 (June)
10.8 8.6 (Sept) 14.3 (May)
11.6 8.7 (Nov) 15.2 (Aug)
Brine Island Mean Min Max
10.5 8.6 (Nov) 13.8 (June)
10.8 8.6 (Nov) 14.2 (Aug)
11.6 8.6 (Nov) 15.0 (Aug)
Source: Grieg NL (unpublished data). Note: Months in which minimum and maximum dissolved oxygen levels were observed are provided in parentheses.
Page 28

Mansour et al. (2008) examined DO content around salmon farm sea cages and specified a DO content level of <6 ppm as an indicator of hypoxic conditions. All DO measurements taken by Grieg NL at sea cage sites since 2016 have been >6 mg/L (ppm). The full water quality data set collected to February 2018 by Grieg NL is in Appendix A. Benthic Habitat
Bathymetry and Substrate Type
An essential step toward implementing effective management strategies for ocean systems is to identify biophysical patterns and processes that delineate benthic system functions (Brown et al. 2011 in Amec 2017a). The process of producing seafloor habitat maps incorporates disparate datasets from biological, geological, hydrographical and geophysical inputs to produce simplified spatial representation of the seafloor relating to the distribution of biological characteristics (Brown et al. 2011). In the sublittoral environment, limitations of conventional in-situ sampling methods (e.g., benthic grabs, dredges, video, etc.) impair the ability to synthesize the complexities of benthic system interactions because they provide detailed information on the seafloor that they sample but on a very localized/small scale. It remains challenging to derive accurate representation of the biophysical characteristics of the seafloor in an area without extensive survey designs and tightly spaced sampling station transects (Brown et al. 2011). Therefore, application of acoustic survey techniques such as the use of side-scan sonar systems and multibeam echo sounders provides wide-scale reconnaissance style surveying to produce accurate images of the seafloor (Brown et al. 2011). Multibeam echosounders are able to provide bathymetric data detailing the terrain and structure (e.g., rugosity and/or steepness) of the seafloor as well as information that provides indication of substrate type (Dolan et al. 2009, Kaplan et al. 2010 in Amec 2017a). The relative hardness of the surficial sediment can be used for interpretation of some aspects of the physical habitat such as morphological structures and slopes (Dolan et al. 2009, Kaplan et al. 2010 in Amec 2017a). The interpretation of backscatter data also requires supportive in-situ observations using conventional benthic survey methods to validate the interpretations and ground-truth the data (Dolan et al. 2009, Kaplan et al. 2010 in Amec 2017a). Using a Geographic Information System (GIS), the combination of multibeam acoustic survey data and conventional in-situ sampling data helps to synthesize seafloor habitat characterization maps (seascapes) according to geomorphology, texture and biota (Dolan et al. 2009, Brown et al. 2011, Shaw et al. 2011, Todd and Greene 2007, Whitmire et al. 2007 in Amec 2017a). Proposed sea cage site area coverages represented by multibeam data were calculated (Table 4.3). Sea cage sites with less than 90% multibeam survey coverage were composited with CHS 10-m resolution bathymetry data and were subsequently surveyed using drop camera video at 100-m grid intervals by Grieg NL. For each proposed sea cage site, the depth range, percentage multibeam coverage and percentages of hard and soft substrate data are presented in Table 4.3. The baseline sea cage site characterization data were used to designate the potential sites as having either hard or soft bottoms. According to the Monitoring Protocol for Hard
Page 29

Bottom Benthic Substrates under Marine Finfish Farms in Newfoundland and Labrador (NL) under Annex 9 of the AAR, sea cage sites’ seabed characteristics are suitable for aquaculture if “more than 50% of the lease area is hard bottom composed of rockwall, bedrock, boulders, rubble, cobble, gravel, or hard packed finer substrates” (AAR, Annex 9; GC 2015). The full benthic characterization report (Amec 2017a) is provided in Appendix B. Table 4.3. Bathymetric and substrate specifics for the proposed sea cage sites.
BMA/Sea Cage Site Depth Range (m)
Multibeam Coverage (%)
Hard Substrate (%)
[No. of Sea Cages]
Soft Substrate (%)
[No. of Sea Cages]
Rushoon BMA Oderin Island 39–98 100 66 [7] 34 [5]
Long Island 75–180 69 51 [8] 49 [4] Gallows Harbour 140–170 16 16 [?] 84 [?]
Merasheen BMA Valen Island 58–308 100 54 [1] 46 [11]
Chambers Island 16–308 98 55 [8] 45 [4] Ship Island 144–159 100 38 [1] 62 [11]
Red Island BMA Darby Harbour 16–147 93 71 [6] 29 [6]
Red Island 18–250 100 93 [12] 7 [0] Butler Island 10–143 99 100 [12] 0
Long Harbour BMA Iona Island 54–108 95 70 [2] 30 [4]
Brine Island 40–100 2 78 [3] 22 [3] Source: Amec 2017a.
Benthic Biota
As indicated in the previous subsection, Grieg NL completed drop camera sampling at the three proposed sea cage sites with <90% multibeam coverage: (1) Gallows Harbour; (2) Long Island; and (3) Brine Island. Data related to surficial sediment composition and benthic biota occurrence were collected through analysis of the video. The substrate types observed were principally ‘hard’, including bedrock, gravel, and cobble. Neither fine sediments (i.e., mud) nor large boulders were observed during Grieg NL’s drop camera surveys. Coralline algae was observed in various proportions at all three sites. Benthic fauna observed included Cnidarians (e.g., sea anemones, jellyfish), echinoderms (e.g., brittle stars, feather stars, sea stars, sea urchins, sea cucumbers), molluscs (e.g., scallops, clams, whelks), crustaceans (e.g., shrimp, crabs) and fishes (e.g., sculpins). The full benthic habitat data set collected by Grieg NL is contained in Appendix C. The flora and fauna observed during baseline video sampling by Grieg NL are similar to the biota observed during a baseline study conducted in bays with aquaculture operations during 2003–2011 in southern Newfoundland. As per regulatory requirements for the aquaculture finfish site application process, Hamoutene et al. (2017) evaluated baseline benthic survey video
Page 30

collected in the Fortune Bay/Bay D’Espoir area. A total of 752 stations at 22 sites, depths ranging from 2–100 m, were analyzed. All sites had mixed substrate types, with most grain sizes being represented at each site. They reported that the most frequently observed taxa were sea anemones (39%), algae (28%), coralline algae (27%), brittle stars (26%), sea stars (14%), and kelp (14%). Feather stars, sea urchins, sand dollars, mussels, scallops, shrimp, polychaetes, tunicates, crabs, and fish were also observed during their baseline survey. Overall, the benthic habitats surveyed were characterized by low productivity, low abundance of individual animals and patchy distributions of biota (Hamoutene et al. 2017). 4.2 Placentia Bay Extension EBSA
The Placentia Bay Extension EBSA (DFO 2016e) serves as the Study Area for this Component Study. According to Bradbury et al. (2003), two areas in Placentia Bay are characterized by higher concentrations of early-stage eggs of American plaice, Atlantic cod and cunner. One area is located along the western side extending from just south of Marystown to just north of Long Island, and the other area is at the head of Placentia Bay that includes waters as far south as the southern tip of Merasheen Island. These two areas with higher concentrations of ichthyoplankton include the Rushoon, Merasheen and Red Island BMAs, Templeman (2007) indicated that the largest spawning stock of Atlantic cod in the Northwest Atlantic occurs in the Study Area although he did not provide any spatial information for this spawning stock. The areas around St. Lawrence, Marystown and Swift Current have been identified as areas with high pelagic fish productivity (Sjare et al. 2003). Besides important fish areas, there are also unique areas identified for marine birds, marine mammals and sea turtles. Two Important Bird Areas (IBAs) exist within the Placentia Bay Extension EBSA: (1) Cape St. Mary’s (NF001); and (2) Placentia Bay (NF028; Bird Studies Canada and Nature Canada 2004–14). Cetaceans, sea turtles, harbour seals, and otters are often in the area for feeding or migration purposes. Harbour seals also use the area for pupping and hauling-out during mating season. Sjare et al. (2003) identified several areas of high marine mammal (humpback whale and harbour seal) productivity and/or occurrence using Local Ecological Knowledge (LEK). 4.3 Oceanographic and Meteorological Data
The principal oceanographic parameter that most influences marine benthic fish habitat (i.e., organic deposition from aquaculture sea cages) is water current, both velocity and direction. Storm frequency and intensity, sea ice, freezing precipitation, and wind/waves can also impact fish and fish habitat should the sea cages fail, resulting in escaped farmed salmon. This section provides summaries of the data for the oceanographic and meteorological parameters that would most likely have effects on the integrity of farm sea cages. These parameters include the following:
• ice; • storm frequency and intensity;
Page 31

• wind and waves; and • water currents.
The full report on metocean conditions in the northern part of Placentia Bay (Oceans 2018) is contained in Appendix D. 4.3.1 Data Sources
The various data sources used during preparation of the metocean report (Oceans 2018) are as follow:
• MSC50 wave and wind reanalysis data set; • Environment and Climate Change Canada (ECCC) weather stations; • SmartBay buoys; • Red Island wave model; • Current meters deployed by Memorial University of Newfoundland (MUN), Bedford
Institute of Oceanography (BIO) and DHI; and • Canadian Ice Service.
The locations of the MSC50 data set grid points, the ECCC weather stations, the Red Island wave model and SmartBuoys relative to proposed sea cage sites are presented in Figure 4.5. The locations of the MUN and BIO current meters are presented in Figure 4.6. MSC50 Wave and Wind Reanalysis Data Set
Six grid points selected to best represent wind and wave conditions in the northern part of Placentia Bay (Figure 4.5) include:
1. Grid point 12163 located approximately 2.5 km W of the Oderin Island sea cage site in Rushoon BMA;
2. Grid point 12164 located approximately 6–7 km ESE of the Long Island sea cage site in Rushoon BMA;
3. Grid point 12360 located approximately 12 km S of the Valen Island sea cage site in Merasheen BMA;
4. Grid point 12548 located approximately 6 km ESE of the Valen Island sea cage site in Merasheen BMA, and ~8 km SE of the Chambers Island sea cage site in Merasheen BMA;
5. Grid point 12361 located approximately 9–10 km SE of the Darby Harbour sea cage site in Red Island BMA, and ~8 km W of Iona Islands sea cage site in Long Harbour BMA; and
6. Grid point 12549 located approximately 5 km NNW of the Brine Island sea cage site in Long Harbour BMA, and ~11–12 km NE of the Darby Harbour sea cage site in Red Island BMA
Page 32

Source: Oceans (2018).
Figure 4.5. Locations of the MSC50 data set grid points, the ECCC weather stations, the Red Island wave model and the SmartBuoys relative to proposed sea cage sites.
Page 33

Source: Oceans (2018).
Figure 4.6. Locations of current meters in Placentia Bay. Environment and Climate Change Canada Weather Stations
The five ECCC weather stations in northern Placentia Bay (see Figure 4.5) used in this analysis are at the following locations:
1. Come By Chance; 2. Arnold’s Cove; 3. Long Harbour; 4. Argentia; and 5. Marticot Island (located ~3 km NNE of MSC50 grid point 12164).
SmartBay Buoys
The two SmartBay buoys used in this analysis are at the following locations (see Figure 4.5):
Page 34

1. Northern Placentia Bay, approximately 5–6 km from Come By Chance; and 2. Eastern Placentia Bay, approximately 9 km W of Argentia.
Other Sources
There is also a Red Island Wave Model located approximately 5 km SE of the Darby Harbour sea cage site (see Figure 4.5) in Red Island BMA that was used in the analysis. Water current data were sourced from current meters deployed in Placentia Bay by the Department of Physics and Physical Oceanography at MUN (April–June in 1998 and 1999), and BIO (February–March 1988 and September–October 1998) (see Figure 4.6). There were also water current data collected by DHI, on behalf of Grieg NL, at each of the proposed sea cage sites during January–March 2016 (see DHI Hydrographic Report in Appendix B of this report; DHI 2016). Ice data were sourced from the Canadian Ice Service. 4.3.2 Ice
In comparison to other bays around Newfoundland, Placentia Bay is a relatively ice-free bay due to its location along the south coast of Newfoundland. A weekly analysis of the Canadian Ice Service’s 30-year median of ice in Placentia Bay reveals that ice is typically present in Placentia Bay only from mid-February until mid-April (1981–2010). The likelihood of ice presence in Placentia Bay is highest during the first week in March. During this week, the median of ice concentration in Placentia Bay is 9–9+/10. The frequency of sea ice presence in the four BMAs is 1–15%. In an effort to provide more up-to-date sea ice information, weekly sea ice charts for Placentia Bay during the past 10 years were analysed for the presence of sea ice within the northern half of Placentia Bay. A table containing the percent frequency of ice conditions within the region is provided below in Table 4.4. The information provided in this table provides a conservative indication of the most severe ice conditions which occurred within the region during the 10-year period. For example, if half of the region was covered in 1/10 ice, and the other half was classified ice free, then cover for the entire region was recorded as 1/10. Most of the sea ice concentrations in northern Placentia Bay reported during 2008–2017 was <1/10. Note that there was one year in which the week beginning February 05 reported 5/10 sea ice coverage. Definitions for the terms “Ice Free”, “Open Water”, “Bergy Water” and “Fast Ice”, as defined in the Environment and Climate Change Canada Ice Glossary are provided below.
• Ice Free - no ice present (this term not used if ice of any kind is present). • Open Water - a large area of freely navigable water in which ice is present in
concentrations less than 1/10. No ice of land origin is present. • Bergy Water - an area of freely navigable water in which ice of land origin is
present. Although other ice types may be present, their total concentration is <1/10.
Page 35

• Fast Ice - ice which forms and remains fast along the coast. It may be attached to the shore, to an ice wall, to an ice front, between shoals or grounded icebergs.
Table 4.4. Percent frequency of weekly sea ice concentration for northern Placentia Bay (2008–2017).
Week Ice Free
Open Water
Bergy Water
Fast Ice
Tenths 1 2 3 4 5 6 7 8 9 9+
Feb-05 70 20 0 0 0 0 0 0 10 0 0 0 0 0 Feb-12 40 50 0 0 0 10 0 0 0 0 0 0 0 0 Feb-19 20 80 0 0 0 0 0 0 0 0 0 0 0 0 Feb-26 30 70 0 0 0 0 0 0 0 0 0 0 0 0 Mar-05 40 60 0 0 0 0 0 0 0 0 0 0 0 0 Mar-12 40 40 10 10 0 0 0 0 0 0 0 0 0 0 Mar-19 50 20 0 20 0 10 0 0 0 0 0 0 0 0 Mar-26 60 20 10 10 0 0 0 0 0 0 0 0 0 0 Apr-02 40 30 20 10 0 0 0 0 0 0 0 0 0 0 Apr-09 40 40 10 10 0 0 0 0 0 0 0 0 0 0 Apr-16 60 10 20 10 0 0 0 0 0 0 0 0 0 0 Apr-23 60 10 10 10 0 10 0 0 0 0 0 0 0 0 Apr-30 70 0 30 0 0 0 0 0 0 0 0 0 0 0 Source: Oceans (2018). A graphic representation of the weekly analysis of 30-year frequency of ice presence for the four BMAs in the week starting March 5, 1981–2010 is contained in Figure 4.7. There is a 1–15% ice presence during this part of March which is regarded as the time of highest likelihood of presence. A graphic representation of the weekly analysis of 30-year median of ice concentration when ice is present for the four BMAs in the week starting March 5, 1981–2010 is contained in Figure 4.8. There is a 1–15% ice presence during this part of March, which is regarded as the time of highest likelihood of presence, the 30-year median is 9–9+/10. Between 1960 and 2015, only six icebergs have been observed in the areas of Placentia Bay where the proposed sea cage sites would be located. Only one iceberg was observed in each of the Long Harbour, Merasheen and Red Island BMAs, while in the Rushoon BMA, which is closer to the outer bay in comparison to the other three areas, three icebergs were sighted over the 55 years, in 1961, 1995, and 2001. Five of the six icebergs ranged in size from ‘growler’ to ‘medium’, and the sixth, which was observed in the Rushoon BMA, was of unknown size.
Page 36

Source: Oceans (2018).
Figure 4.7. Weekly analysis of 30-year frequency of presence for the four BMAs in the week starting March 5, 1981–2010 (Canadian Ice Service).
Source: Oceans (2018).
Figure 4.8. Weekly analysis of 30-year median of ice concentration when ice is present for the four BMAs in the week starting March 5, 1981–2010 (Canadian Ice Service).
Page 37
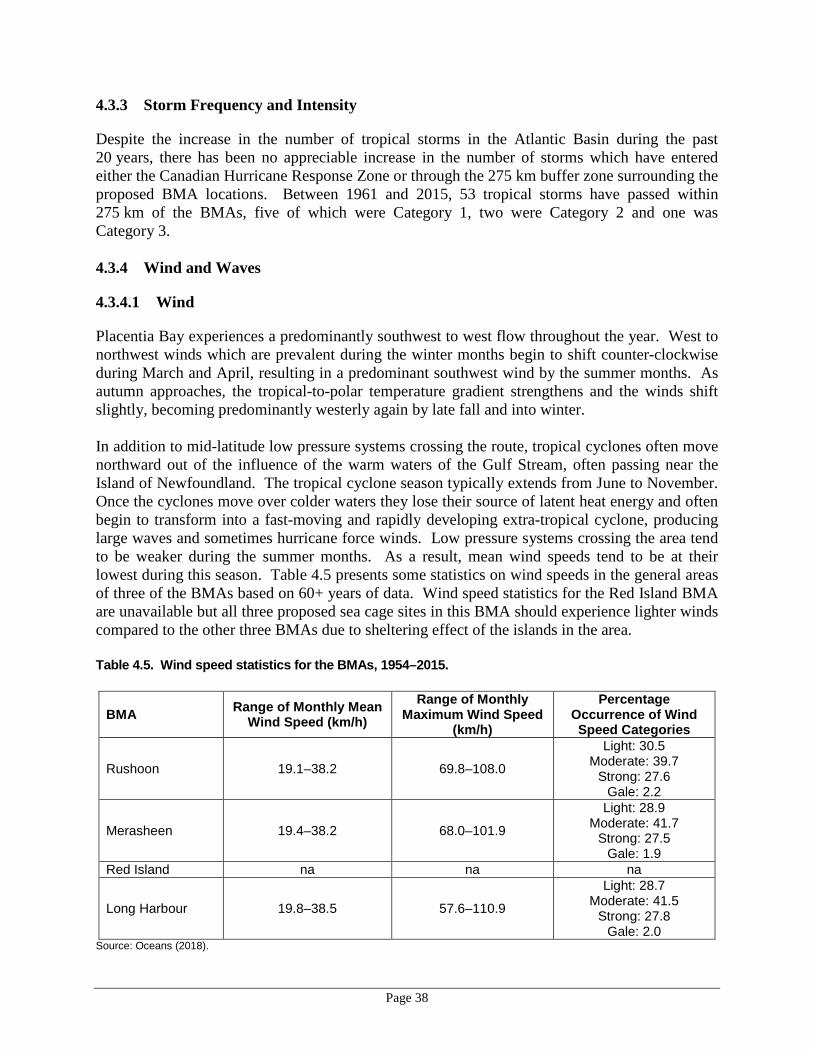
4.3.3 Storm Frequency and Intensity
Despite the increase in the number of tropical storms in the Atlantic Basin during the past 20 years, there has been no appreciable increase in the number of storms which have entered either the Canadian Hurricane Response Zone or through the 275 km buffer zone surrounding the proposed BMA locations. Between 1961 and 2015, 53 tropical storms have passed within 275 km of the BMAs, five of which were Category 1, two were Category 2 and one was Category 3. 4.3.4 Wind and Waves
4.3.4.1 Wind
Placentia Bay experiences a predominantly southwest to west flow throughout the year. West to northwest winds which are prevalent during the winter months begin to shift counter-clockwise during March and April, resulting in a predominant southwest wind by the summer months. As autumn approaches, the tropical-to-polar temperature gradient strengthens and the winds shift slightly, becoming predominantly westerly again by late fall and into winter. In addition to mid-latitude low pressure systems crossing the route, tropical cyclones often move northward out of the influence of the warm waters of the Gulf Stream, often passing near the Island of Newfoundland. The tropical cyclone season typically extends from June to November. Once the cyclones move over colder waters they lose their source of latent heat energy and often begin to transform into a fast-moving and rapidly developing extra-tropical cyclone, producing large waves and sometimes hurricane force winds. Low pressure systems crossing the area tend to be weaker during the summer months. As a result, mean wind speeds tend to be at their lowest during this season. Table 4.5 presents some statistics on wind speeds in the general areas of three of the BMAs based on 60+ years of data. Wind speed statistics for the Red Island BMA are unavailable but all three proposed sea cage sites in this BMA should experience lighter winds compared to the other three BMAs due to sheltering effect of the islands in the area. Table 4.5. Wind speed statistics for the BMAs, 1954–2015.
BMA Range of Monthly Mean Wind Speed (km/h)
Range of Monthly Maximum Wind Speed
(km/h)
Percentage Occurrence of Wind Speed Categories
Rushoon 19.1–38.2 69.8–108.0
Light: 30.5 Moderate: 39.7
Strong: 27.6 Gale: 2.2
Merasheen 19.4–38.2 68.0–101.9
Light: 28.9 Moderate: 41.7
Strong: 27.5 Gale: 1.9
Red Island na na na
Long Harbour 19.8–38.5 57.6–110.9
Light: 28.7 Moderate: 41.5
Strong: 27.8 Gale: 2.0
Source: Oceans (2018).
Page 38

4.3.4.2 Waves
The wave climate of Placentia Bay is dominated by extra-tropical storms, primarily during October through March. Severe storms may, on occasion, occur outside these months. Storms of tropical origin may occur during the early summer and early winter, but most often from late-August through October. Hurricanes are usually reduced to tropical storm strength or evolve into extra-tropical storms by the time they reach the area but they are still capable of producing storm force winds and high waves. Table 4.6 presents some statistics on wave heights in the general areas of three of the BMAs based on 60+ years of data. Wave height statistics for the Red Island BMA are unavailable but all three proposed sea cage sites in this BMA should experience lesser wave heights compared to the other three BMAs due to sheltering effect of the islands in the area. Table 4.6. Wave height statistics for the BMAs, 1954–2015.
BMA
Range of Monthly Mean
Significant Wave Height
(m)
Range of Monthly
Maximum Wave Height (m)
Range of Extreme
Significant Wave Height for
50-yr Return Period (m)
Range of Extreme Maximum Wave Height for 50-yr
Return Period (m)
Rushoon 0.7–1.6 3.7–7.8 6.1–7.3 11.0–13.2
Merasheen 0.2–1.4 1.3–7.2 2.1–6.8 4.0–12.2
Red Island 0.4–0.7 1.8–3.2 na na
Long Harbour 0.2–1.9 1.3–7.9 2.2–5.0 4.2–9.0 Source: Oceans (2018).
4.3.5 Water Currents
In general, the near-surface currents in Placentia Bay have been observed to flow counter clockwise around the Bay. This circulation pattern is not consistent at deeper levels. The flow in Placentia Bay is expected to be the result of tides, winds, and the Labrador Current. Since the variability due to tides account for about only 15% of the total variability, other factors are more important. Winds in the area are predominately from the southwest during all seasons and this would contribute to a counter clockwise pattern in the near surface waters. The inshore branch of the Labrador Current follows the bathymetric contours around the Avalon Peninsula. North of Green Bank, the direction of the bathymetric contours shift from an east/west direction to a north/south direction. The Labrador Current probably divides at this location with a portion of the Labrador Current contributing to the flow into Placentia Bay and becoming the major contributor to the overall current variability. Current speeds on the western side of Placentia Bay are typically less than those on the eastern side. The currents discussed in the following subsections are based on data collected by the eight MUN/BIO current meters deployed proximate to the proposed BMA locations as well as current data collected by DHI on behalf of Grieg NL.
Page 39

4.3.5.1 Rushoon BMA
The data collected by MUN in the spring of 1999 at locations relevant to the Rushoon BMA showed that the mean current speed at a depth of 20 m was 0.103 m/s, and the maximum current speed was 0.497 m/s. The flow was mainly towards the southwest (i.e., out of Placentia Bay). The semi-diurnal tidal current speed ranged from 0.014–0.059 m/s. The tidal current speed is expected to be approximately 0.08 m/s during spring tide. The BIO data collected in the fall of 1988 showed a similar pattern of the currents; mean current speed of 0.091 m/s and maximum current speed of 0.373 m/s (Oceans 2018). The data collected by DHI in January and February 2016 indicate variable current direction and a maximum current speed range for the three sea cage sites at a 30 m depth of 0.05–0.15 m/s. The range of current speeds for the three sea cage sites at mid-column (58–87 m) and lower-column (80–135 m) Acoustic Doppler Current Profilers (ADCP) locations was 0.05–0.25 m/s (DHI 2016). 4.3.5.2 Merasheen BMA
The data collected by MUN in the spring of 1999 at locations relevant to the Merasheen BMA showed that the mean current speed at a depth of 36 m was 0.079 m/s, and the maximum current speed was 0.365 m/s. The flow was mainly towards the southwest (i.e., out of Placentia Bay). The semi-diurnal tidal current speed ranged from 0.013–0.040 m/s. The tidal current speed is expected to be 0.05–0.06 m/s during spring tide (Oceans 2018). The data collected by DHI in February 2016 indicate variable current direction and a maximum current speed range for the three sea cage sites at a 25–30 m depth of 0.11–0.31 m/s. The range of current speeds for the three sea cage sites at mid-column (115–160 m) and lower-column (200–265 m) ADCP locations was 0.10–0.22 m/s (DHI 2016). 4.3.5.3 Red Island BMA
According to Oceans (2018), there are no data from the MUN and BIO ADCP deployments that are directly relevant to the sea cage sites in the Red Island BMA. The data collected by DHI in February and March 2016 indicate variable current direction and a maximum current speed range for the three sea cage sites at a 30 m depth of 0.15–0.18 m/s. The range of current speeds for the three sea cage sites at mid-column (70–80 m) and lower-column (100–122 m) ADCP locations was 0.12–0.19 m/s (DHI 2016). 4.3.5.4 Long Harbour BMA
The data collected by MUN in the spring of 1999 at locations relevant to the Long Harbour BMA showed that the mean current speed range at a depth of 20 m was 0.11–0.18 m/s, and the maximum current speed was 0.79 m/s. The flow was mainly into Placentia Bay. The semi-diurnal tidal current speed ranged from 0.037–0.06 m/s. The tidal current speed is expected to be approximately 0.10 m/s during spring tide. The BIO data collected in the fall and winter of
Page 40
1988 showed a similar pattern of the currents; mean current speed of 0.0.125 m/s at 23 m, and maximum current speed of 0.75 m/s (Oceans 2018). The data collected by DHI in March 2016 indicate variable current direction and a maximum current speed range for the three sea cage sites at a 30 m depth of 0.125–0.25 m/s. The range of current speeds for the three sea cage sites at mid-column (65–76 m) and lower-column (95–115 m) ADCP locations was 0.085–0.16 m/s (DHI 2016). 4.4 Benthic Depositional Modelling
To address the federal Department of Fisheries and Oceans (DFO) Aquaculture Activities Regulations (AAR) permitting requirements condition 8.1a, depositional contours representing the rates 1, 5 and 10 g C/m2/day were modelled for each proposed sea cage site using a specified daily quantity of feed usage. The organics deposited from a sea cage serve as a food source for water-borne bacteria that decompose the organic material using dissolved oxygen, thus reducing the dissolved oxygen for naturally-occurring invertebrates and fishes. The BOD is a measure of the amount of oxygen that bacteria will consume while decomposing organic matter under aerobic conditions. Modelling was conducted by Amec Foster Wheeler Environment & Infrastructure (Amec 2017b) at each of the proposed sea cage sites in 2016 (see Grieg NL Benthic Depositional Modeling Report in Appendix B of this report). The DEPOMOD particle tracking model was used to predict carbon flux deposition (g C/m2/d) of organic inputs (fish feed, feces) onto the seabed, effectively predicting the area on the seabed that may be impacted by aquaculture operations. Model input variables used include bathymetry, water current velocity and layers, particle information (e.g., settling velocity, % carbon in feed and feces), feed specifics, feeding rate and sea cage information (e.g., number, size) (DFO 2014; Amec 2017b). Water current velocity and direction data at near-surface, mid-depth and near-bottom were collected using ADCPs deployed at each sea cage site for varying lengths of time during the January–March 2016 period (DHI 2016). Figures 4.9–4.19 present the modelling results for each of the proposed sea cage sites. The extents of the footprints of three levels of organic deposition are shown. The maximum distance from sea cage to footprint edge is highest for the Chambers Island sea cage site (~150–200 m). This maximum distance is typically 50–100 m for most of the proposed sea cage sites. Overall the majority of depositional contours predicted from the model will not exceed 1g C/ m2 /day with minimal exceptions at shallower sites. 4.4.1 Rushoon BMA
Water current data were collected at the Rushoon BMA sea cage sites in January and February, 2016. The duration of data collection at each sea cage site ranged from 15 hr (Gallows Harbour) to 47 hr (Long Island). Water currents were strongest at the Long Island sea cage site (0.15 m/s @ 30-m; 0.11 m/s @ 87-m; 0.25 m/s @ 135-m), and weakest at Gallows Harbour (0.06 m/s @ 30-m; 0.06 m/s @ 70-m; 0.075 m/s @ 110-m).
Page 41
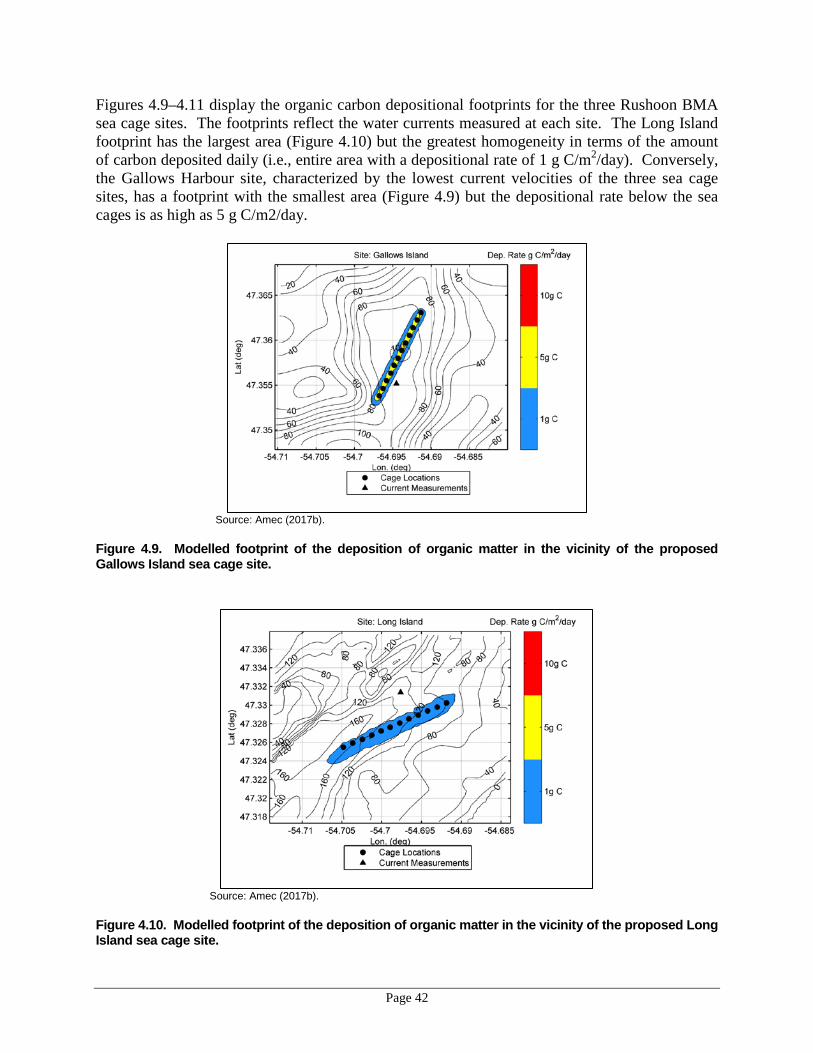
Figures 4.9–4.11 display the organic carbon depositional footprints for the three Rushoon BMA sea cage sites. The footprints reflect the water currents measured at each site. The Long Island footprint has the largest area (Figure 4.10) but the greatest homogeneity in terms of the amount of carbon deposited daily (i.e., entire area with a depositional rate of 1 g C/m2/day). Conversely, the Gallows Harbour site, characterized by the lowest current velocities of the three sea cage sites, has a footprint with the smallest area (Figure 4.9) but the depositional rate below the sea cages is as high as 5 g C/m2/day.
Source: Amec (2017b).
Figure 4.9. Modelled footprint of the deposition of organic matter in the vicinity of the proposed Gallows Island sea cage site.
Source: Amec (2017b).
Figure 4.10. Modelled footprint of the deposition of organic matter in the vicinity of the proposed Long Island sea cage site.
Page 42

Source: Amec (2017b).
Figure 4.11. Modelled footprint of the deposition of organic matter in the vicinity of the proposed Oderin Island sea cage site. 4.4.2 Merasheen BMA
Water current data were collected at the Merasheen BMA sea cage sites in February, 2016. The duration of data collection at each sea cage site ranged from 24 hr (Chambers Island) to 195 hr (Ship Island). Water currents were strongest at the Ship Island sea cage site (0.31 m/s @ 30-m; 0.19 m/s @ 115-m; 0.22 m/s @ 200-m), and weakest at Valens Island (0.11 m/s @ 25-m; 0.10 m/s @ 130-m; 0.135 m/s @ 235-m). Figures 4.12–4.14 display the organic carbon depositional footprints for the three Merasheen BMA sea cage sites. All three footprints are homogeneous in terms of the amount of carbon deposited daily (i.e., 1 g C/m2/day). The footprint areas are also quite similar for all three sea cage sites, the irregularly shaped one at Chambers Island perhaps being the largest (Figure 4.13).
Page 43
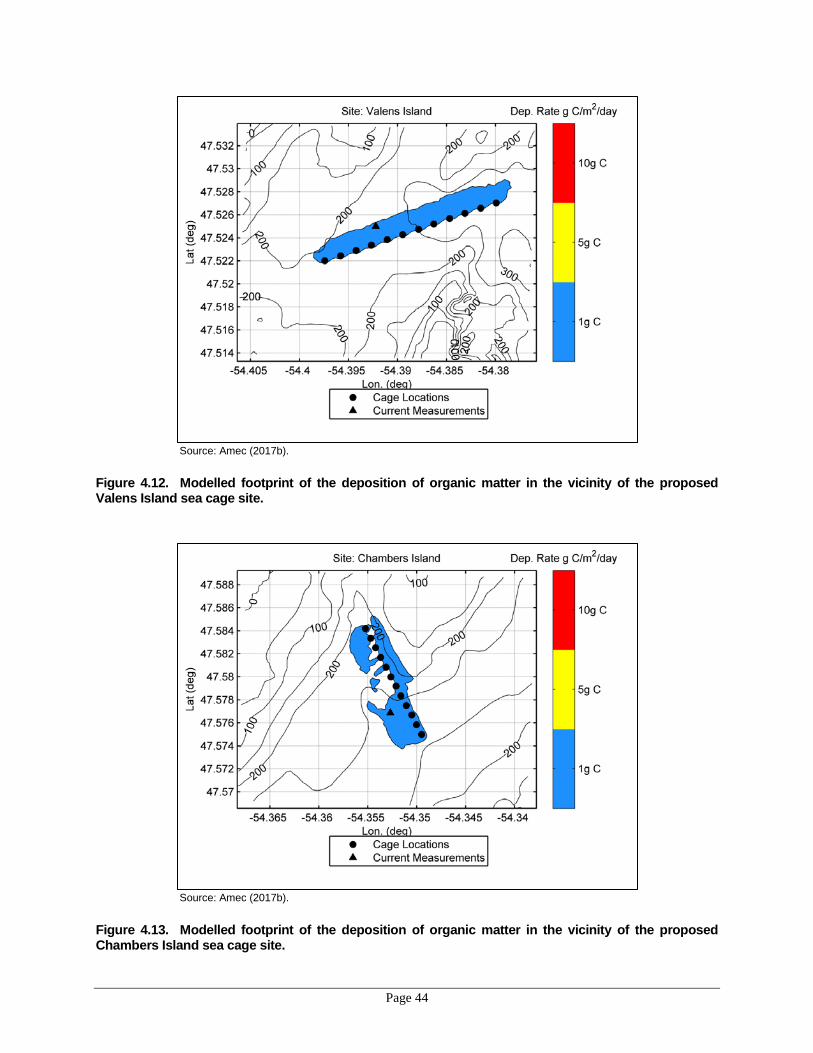
Source: Amec (2017b).
Figure 4.12. Modelled footprint of the deposition of organic matter in the vicinity of the proposed Valens Island sea cage site.
Source: Amec (2017b).
Figure 4.13. Modelled footprint of the deposition of organic matter in the vicinity of the proposed Chambers Island sea cage site.
Page 44

Source: Amec (2017b).
Figure 4.14. Modelled footprint of the deposition of organic matter in the vicinity of the proposed Ship Island sea cage site. 4.4.3 Red Island BMA
Water current data were collected at the Red Island BMA sea cage sites in February and March 2016. The duration of data collection at each sea cage site ranged from 19 hr (Red Island) to 141 hr (Darby Harbour). Water currents were strongest at the Darby Harbour sea cage site (0.18 m/s @ 30-m; 0.16 m/s @ 80-m; 0.10 m/s @ 122-m). Water currents at the Butler Island and Red island sea cage sites were similar (0.15 m/s @ 30-m; 0.12–0.13 m/s @ 70–75-m; 0.12–0.13 m/s @ 100–105-m). Figures 4.15–4.17 display the organic carbon depositional footprints for the three Red Island BMA sea cage sites. The footprint areas are quite similar for all three sea cage sites. While the Butler Island depositional footprint is homogenous in terms of the amount of carbon deposited daily (i.e., 1 g C/m2/day), the footprints at the Red Island and Darby Harbour sea cage sites (Figures 4.16 and 4.17, respectively) have patches of 5 g C/m2/day depositional rates under the cages.
Page 45

Source: Amec (2017b).
Figure 4.15. Modelled footprint of the deposition of organic matter in the vicinity of the proposed Butler Island sea cage site.
Source: Amec (2017b).
Figure 4.16. Modelled footprint of the deposition of organic matter in the vicinity of the proposed Red Island sea cage site.
Page 46

Source: Amec (2017b).
Figure 4.17. Modelled footprint of the deposition of organic matter in the vicinity of the proposed Darby Harbour sea cage site. 4.4.4 Long Harbour BMA
Water current data were collected at the two Long Harbour BMA sea cage sites in March 2016. The duration of data collection at each sea cage site ranged from 48 hr (Iona Island) to 67 hr (Brine Island). At the 30-m depth, water currents were stronger at the Brine Island sea cage site (0.25 m/s compared to 0.125 m/s). Water currents at the mid-column and lower-column depths for both sea cage sites were similar (9–10 m/s @ 65–76-m; 0.09–0.125 m/s @ 95–115-m). Figures 4.18 and 4.19 display the organic carbon depositional footprints for the two Long Harbour BMA sea cage sites. The footprint areas are quite similar for both sea cage sites. While the Brine Island depositional footprint is homogenous in terms of the amount of carbon deposited daily (i.e., 1 g C/m2/day) (Figure 4.18), the footprint at the Iona Island sea cage site has patches of 5 g C/m2/day depositional rates under the cages (Figure 4.19).
Page 47

Source: Amec (2017b).
Figure 4.18. Modelled footprint of the deposition of organic matter in the vicinity of the proposed Brine Island sea cage site.
Source: Amec (2017b).
Figure 4.19. Modelled footprint of the deposition of organic matter in the vicinity of the proposed Iona Island sea cage site.
Page 48

4.5 Mitigation and Monitoring
There are several primary types of effects that may result from Grieg NL Project activities at the sea cage sites, including effects on fish and fish habitat. Mitigation and monitoring measures intended to minimize the effects of Project activities on fish and fish habitat are described in this section. The planned and unplanned Project activities considered in this section include:
• Deposition of organic material (i.e., feed, feces) from the sea cages onto the seabed; • Release of unconsumed therapeutants and antibiotics into the marine environment; • Attraction of naturally-occurring biota to the sea cages; • Pathogen/parasite transfer between farmed salmon and wild fishes; • Pathogen/parasite transfer between lumpfish cleaner fish and wild fishes; • Fish escapes; and • Entanglement.
4.5.1 Deposition of Organic Material from the Sea Cages
Several mitigation measures and monitoring procedures will be implemented to minimize the potential effects of the deposition of organic BOD matter (fish feces, uneaten fish feed, and naturally occurring biofouling material) on fish and fish habitat occurring beneath and in the immediate vicinity of the sea cages. These mitigation and monitoring measures are discussed below.
1. Sea Cage Site Selection
One of the first steps is selecting proposed sea cage sites that meet the requirements of the AAR and DFLR’s Aquaculture Licence Application process. Relative to effects on fish and fish habitat, proposed sea cage sites were selected based on sufficient currents and direction necessary to minimize depositional build-up, adequate water depth for sea cages, and suitable bottom type (i.e., >50% hard bottom)
2. Fallowing Fallowing (leave the site without fish) is another key mitigation measure designed to minimize the effects of aquaculture on marine habitat. Atlantic salmon aquaculture sites in Newfoundland and Labrador are located predominantly over hard bottom substrates where it is difficult to consistently obtain sediment samples. The primary mitigation measure to manage potential effects from uneaten feed and feces is to fallow at the end of each production cycle. In Newfoundland and Labrador, the mandatory fallowing time after harvesting is seven months for a sea cage site and four months for a BMA. Grieg NL will increase the fallowing time for a sea cage site to a minimum of 16 months and a maximum of 19 months after harvesting, increasing the time for the benthic community to recover. A detailed fallowing schedule for each of the proposed sea cage sites is provided in Table 4.7. Follow-up monitoring to evaluate nutrification effects from deposition of BOD material will be conducted at each of the sea cage sites. The
Page 49

Monitoring Protocol for Hard Bottom Benthic Substrates under Marine Finfish Farms in Newfoundland and Labrador (AAR, Annex 9; GC 2015) will be followed.
Table 4.7. Grieg NL fallowing schedule for each proposed sea cage site relative to the minimum regulatory fallowing schedule. Year 1 and 2 are the Construction Phase of the Project.
3. Optimization of Feeding
Feed wastage will be minimized via the use of established feeding tables/software used to determine feed type and amount and an automatic feeding system which integrates video monitoring in the sea cages. Salmon will be monitored during feeding and once salmon have reached ~80% satiation, feed delivery will be ceased. Cameras mounted in the sea cages will provide staff (located in the control room on the feed barge and/or located remotely) with a view of the feeding behaviour of fish and feed can be stopped when reduced feeding behaviour is noticed. This system reduces nutrient inputs into the environment by optimizing feeding.
4. Husbandry Practices to Minimize Biofouling on the Sea Cages
Husbandry practices designed to minimize biofouling will also serve to mitigate effects on the marine environment. As overviewed below, Grieg NL will adhere to a schedule to clean its sea cages to minimize biofouling which can add to the depositional load of organic material. The cleaning schedule for cages and nets will be developed based on environmental conditions in Placentia Bay as well as routine monitoring. Nets will typically be cleaned weekly (via a ROV net cleaner equipped with an advanced camera system) and cages will be cleaned once or twice during heavy fouling periods. Cages and nets will also be cleaned after harvesting is completed and prior to cages being transferred to other BMAs. Routine checks of equipment utilizing underwater cameras (e.g., SmartEye Twin 360), ROVs, and inspections by divers (as needed) will be used to confirm the cleaning schedule of the sea cages. Grieg NL will ensure equipment has minimal biofouling.
J F M A M J J A S O N D J F M A M J J A S O N D J F M A M J J A S O N D J F M A M J J A S O N D J F M A M J J A S O N D
1 2 3 5 6 7 8 9 10 11 12 13 1 15 16 17 18 19 20 21 22 23 2 25 26 27 28 29 30 31 32 33 3 35 36 37 38 39 0 1 2 3 5 6 7 8 9 50 51 52 53 5 55 56 57 58 59 60
Rushoon BMA Oderin Island 1 2 3 4 5 6 7 8 9 10 11 12 13 14 15 16 1 2
Gallows Harbour 1 2 3 4 5 6 7 8 9 10 11 12 13 14 15 16 17 1
Long Island 1 2 3 4 5 6 7 8 9 10 11 12 13 14 15 16 17 18 19
1 2 3 4 5 6 7 8 9 10 11 12 13 14 15
Merasheen BMA Valen Island 2 3 4 5 6 7 8 9 10 11 12 13 14 15 16 17 18 19
Chambers Island 1 2 3 4 5 6 7 8 9 10 11 12 13 14 15 16 17 18
Ship Island 1 2 3 4 5 7 8 9 10 11 12 13 14 15 16 17 18 19
1 2 3 4 5 6 7 8 9 10 11 12 13 14 15
Red Island BMA Darby Harbour 1 2 3 4 5 6 7 8 9 10 11 12 13 14
Red Island 1 2 3 4 5 6 7 8 9 10 11 12
Butler Island 1 2 3 4 5 6 7 8 9 10 11
Long Harbour BMA Iona Island 1 2 3 4 5 6 7 8 9 10 11 12
Brine Island 1 2 3 4 5 6 7 8 9 10 11 12 13 14 15 16
1 2 3 4 1 2 3 4
Regulatory Fallow Time
Stocked HarvestSea Cage Site FallowBMA Fallow
Year 3 Year 4 Year 5 Year 6 Year 7
Page 50
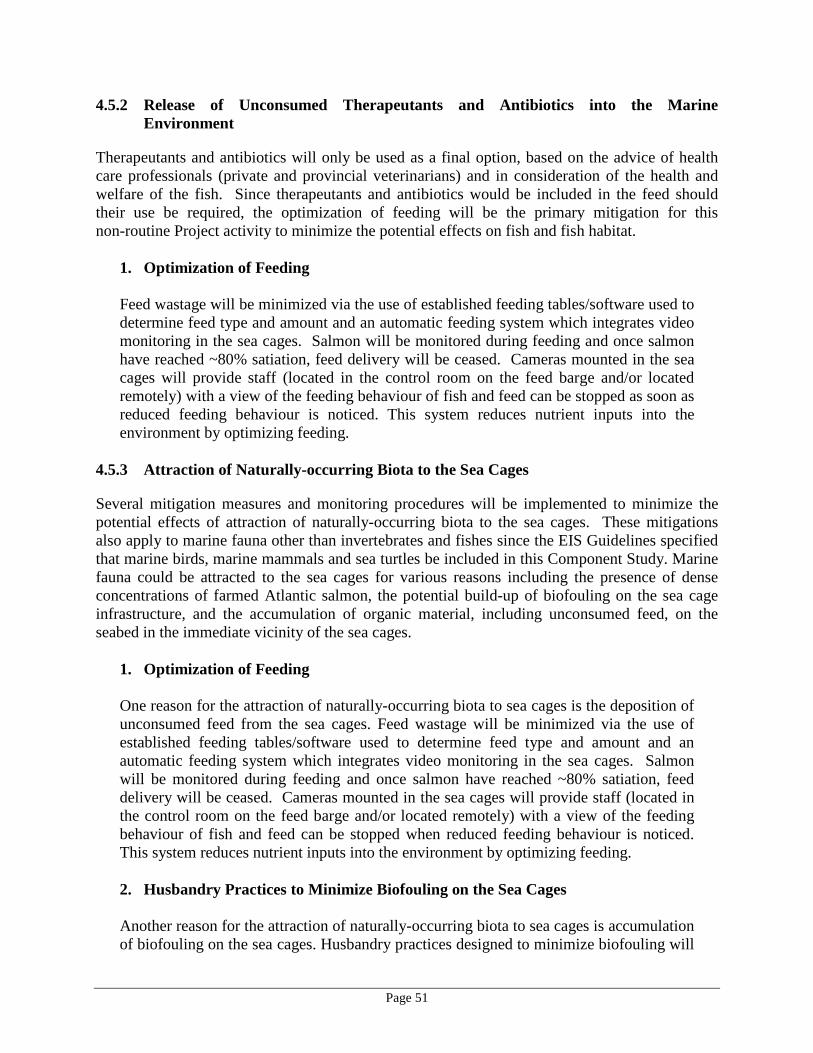
4.5.2 Release of Unconsumed Therapeutants and Antibiotics into the Marine Environment
Therapeutants and antibiotics will only be used as a final option, based on the advice of health care professionals (private and provincial veterinarians) and in consideration of the health and welfare of the fish. Since therapeutants and antibiotics would be included in the feed should their use be required, the optimization of feeding will be the primary mitigation for this non-routine Project activity to minimize the potential effects on fish and fish habitat.
1. Optimization of Feeding
Feed wastage will be minimized via the use of established feeding tables/software used to determine feed type and amount and an automatic feeding system which integrates video monitoring in the sea cages. Salmon will be monitored during feeding and once salmon have reached ~80% satiation, feed delivery will be ceased. Cameras mounted in the sea cages will provide staff (located in the control room on the feed barge and/or located remotely) with a view of the feeding behaviour of fish and feed can be stopped as soon as reduced feeding behaviour is noticed. This system reduces nutrient inputs into the environment by optimizing feeding.
4.5.3 Attraction of Naturally-occurring Biota to the Sea Cages
Several mitigation measures and monitoring procedures will be implemented to minimize the potential effects of attraction of naturally-occurring biota to the sea cages. These mitigations also apply to marine fauna other than invertebrates and fishes since the EIS Guidelines specified that marine birds, marine mammals and sea turtles be included in this Component Study. Marine fauna could be attracted to the sea cages for various reasons including the presence of dense concentrations of farmed Atlantic salmon, the potential build-up of biofouling on the sea cage infrastructure, and the accumulation of organic material, including unconsumed feed, on the seabed in the immediate vicinity of the sea cages.
1. Optimization of Feeding One reason for the attraction of naturally-occurring biota to sea cages is the deposition of unconsumed feed from the sea cages. Feed wastage will be minimized via the use of established feeding tables/software used to determine feed type and amount and an automatic feeding system which integrates video monitoring in the sea cages. Salmon will be monitored during feeding and once salmon have reached ~80% satiation, feed delivery will be ceased. Cameras mounted in the sea cages will provide staff (located in the control room on the feed barge and/or located remotely) with a view of the feeding behaviour of fish and feed can be stopped when reduced feeding behaviour is noticed. This system reduces nutrient inputs into the environment by optimizing feeding.
2. Husbandry Practices to Minimize Biofouling on the Sea Cages Another reason for the attraction of naturally-occurring biota to sea cages is accumulation of biofouling on the sea cages. Husbandry practices designed to minimize biofouling will
Page 51
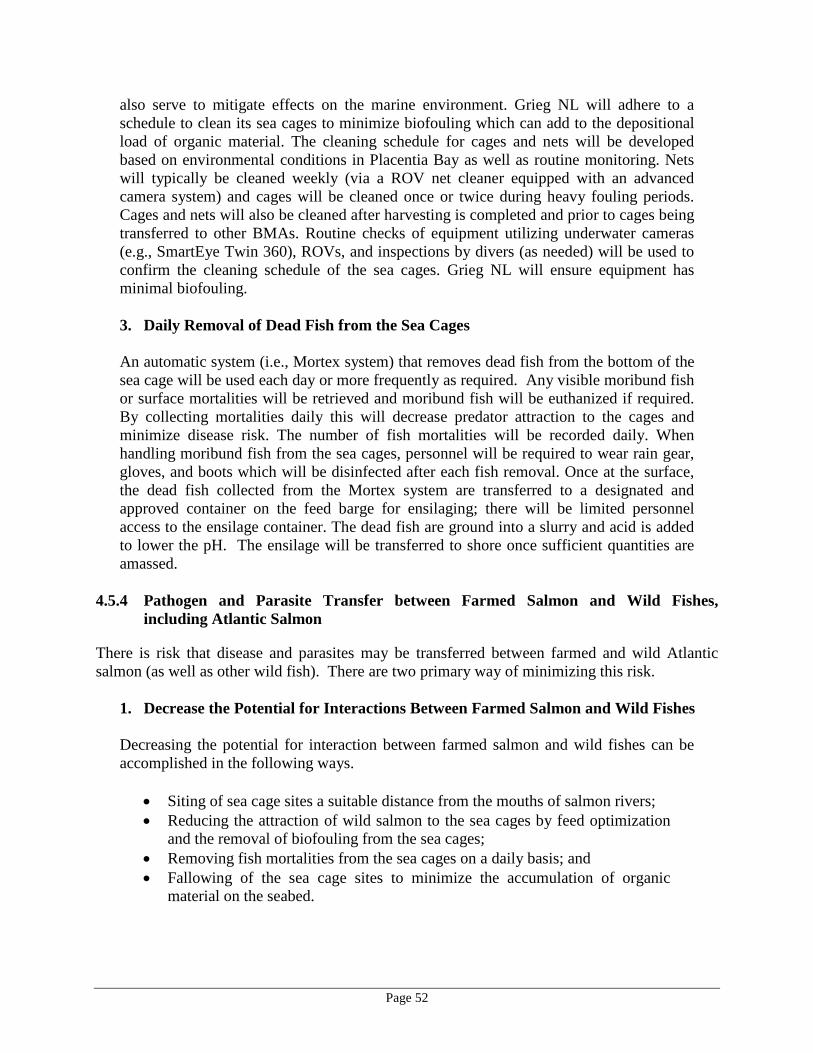
also serve to mitigate effects on the marine environment. Grieg NL will adhere to a schedule to clean its sea cages to minimize biofouling which can add to the depositional load of organic material. The cleaning schedule for cages and nets will be developed based on environmental conditions in Placentia Bay as well as routine monitoring. Nets will typically be cleaned weekly (via a ROV net cleaner equipped with an advanced camera system) and cages will be cleaned once or twice during heavy fouling periods. Cages and nets will also be cleaned after harvesting is completed and prior to cages being transferred to other BMAs. Routine checks of equipment utilizing underwater cameras (e.g., SmartEye Twin 360), ROVs, and inspections by divers (as needed) will be used to confirm the cleaning schedule of the sea cages. Grieg NL will ensure equipment has minimal biofouling. 3. Daily Removal of Dead Fish from the Sea Cages
An automatic system (i.e., Mortex system) that removes dead fish from the bottom of the sea cage will be used each day or more frequently as required. Any visible moribund fish or surface mortalities will be retrieved and moribund fish will be euthanized if required. By collecting mortalities daily this will decrease predator attraction to the cages and minimize disease risk. The number of fish mortalities will be recorded daily. When handling moribund fish from the sea cages, personnel will be required to wear rain gear, gloves, and boots which will be disinfected after each fish removal. Once at the surface, the dead fish collected from the Mortex system are transferred to a designated and approved container on the feed barge for ensilaging; there will be limited personnel access to the ensilage container. The dead fish are ground into a slurry and acid is added to lower the pH. The ensilage will be transferred to shore once sufficient quantities are amassed.
4.5.4 Pathogen and Parasite Transfer between Farmed Salmon and Wild Fishes,
including Atlantic Salmon
There is risk that disease and parasites may be transferred between farmed and wild Atlantic salmon (as well as other wild fish). There are two primary way of minimizing this risk.
1. Decrease the Potential for Interactions Between Farmed Salmon and Wild Fishes
Decreasing the potential for interaction between farmed salmon and wild fishes can be accomplished in the following ways.
• Siting of sea cage sites a suitable distance from the mouths of salmon rivers; • Reducing the attraction of wild salmon to the sea cages by feed optimization
and the removal of biofouling from the sea cages; • Removing fish mortalities from the sea cages on a daily basis; and • Fallowing of the sea cage sites to minimize the accumulation of organic
material on the seabed.
Page 52

2. Maintenance of Farmed Salmon Health
A number of aquatic disease-causing agents (pathogens) such as viruses and bacteria as well as parasites (i.e., sea lice), which occur naturally in the environment, can affect farmed fish. These pathogens can be spread from equipment used to transfer fish as well as through the water by animals releasing the pathogen or from sick or moribund fish. Some known sources of aquatic infections include contaminated equipment or feed and untreated wastewater. A number of tools will be implemented by Grieg NL to eliminate or minimize the spread of disease and sea lice at the sea cage sites and the surrounding aquatic environment. Mitigation measures and regular monitoring will be in place to maintain fish health including (1) biosecurity measures, (2) routine husbandry practices, (3) health checks and procedures, (4) use of specialized feed and feeding procedures, (5) sea lice control procedures, (6) water quality monitoring, (7) vaccinations, and (8) removal and treatment of dead fish. Grieg NL will implement a Fish Health Management Plan for its sea farms and all personnel will be trained in its proper procedures.
(1) Biosecurity Measures: Bay Management Areas (BMAs) are a strategy that Grieg NL has adopted to enhance biosecurity and mitigate pathogen presence and spread at its proposed sea cage sites. Grieg NL has proposed four separate BMAs within Placentia Bay (see Figure 2.1). BMAs enhance biosecurity by establishing discreet regions for individual companies and are recognized as an effective approach to disease management, to mitigate pathogen presence and spread (Chang et al. 2007). With the proper use of BMAs, including Grieg NL’s standard operating procedures (SOPs) that regulate personnel and equipment transfer between and within BMAs, the risk of disease introduction and spread is reduced. In addition to the use of BMAs, there are federal and provincial regulations, including inspections and permits, that ensure all aquaculture facilities operate in a manner that prevents disease spread while still facilitating market access for Canada’s aquatic resources, both wild and cultured. The CFIA addresses aquatic animal diseases of finfish through the National Aquatic Animal Health Program (NAAHP). The NAAHP is co-delivered by CFIA and DFO. CFIA is the lead agency for program development and implementation while DFO provides the science support for the program (diagnostics, research and advice), and also coordinates and assists with sampling for surveillance purposes. The main objective of NAAHP is to prevent the introduction and spread within Canada of reportable and emerging aquatic animal diseases. The program is consistent with international standards set by the World Organization for Animal Health (OIE). As part of this program, CFIA has a number of regulatory disease response tools including movement controls or “quarantine”, a License to Transport of Animals or Things, and an Order to Dispose. Domestic movements of aquatic animals or equipment (including nets and cages) may require a Domestic Movement Permit Application to move Finfish and/or Things within Canada (CFIA/ACIA 5743) from CFIA. Whether a permit is required depends on the declarations of the reportable disease status of the areas being transferred from and to.
Page 53

The use of permits for these movements implements a control to contain certain diseases within areas of Canada where they are known to occur. For this reason, CFIA would be contacted by Grieg NL prior to any domestic movements of fish or equipment. In addition to contacting CFIA for domestic movements, Grieg NL would also be required, following the National Code on Introductions and Transfers of Aquatic Organisms, to submit an application to DFLR and DFO, which will address three main risks: genetics, ecosystem and disease prior to any transfer of the fish from the RAS Hatchery to the sea cages for grow-out. The request is submitted to DFLR under a “one stop shop” process. DFLR and DFO review the request under their respective mandates, and if the request is acceptable to both regulators, DFLR forwards both approvals to the applicant. The fish will not be permitted to leave the RAS Hatchery until these approvals are received. The proposed sea cage sites have been selected based on suitable currents, water temperature, bottom types, and distance from municipal sewage outflows (see below for more details). Consideration of these factors, as well the requirement to fallow sites, all contributes to fish health and mitigating effects on the marine environment. Other biosecurity measures include ensuring that feed and ensilage stored on the barges at the sea cage sites are physically separated in secure containment units and that procedures for handling these materials minimize the risk of contamination. (2) Husbandry Practices: As in the RAS Hatchery, Grieg NL will employ standard husbandry practices designed to minimize the spread of disease at the sea cage sites. These practices include cleaning/disinfecting of equipment, vessels, and ROVs, and managing personnel and tasks to minimize health risks to fish. The cleaning schedule for cages and nets will be developed based on environmental conditions in Placentia Bay as well as routine monitoring. Nets will typically be cleaned weekly and cages will be cleaned once or twice during heavy fouling periods. Cages and nets will also be cleaned after harvesting is completed and prior to cages being transferred to other BMAs. Routine checks of equipment utilizing underwater cameras, ROVs, and inspections by divers (as needed) will be used to confirm the cleaning schedule of the sea cages. Personnel will be required to change into designated work clothing and boots upon arrival at the sea cage site. Personnel gear will be cleaned and disinfected on a routine schedule. Personnel will be transported from designated crew change sites (i.e., proposed at Petit Fort and Long Harbour). These crew change sites will have designated areas for embarkation and disembarkation to the sea cage sites, which are designed to avoid contamination. The proposed Petit Fort and Long Harbour sites will only be used for crew changes (via dedicated crew vessels). Resupply sites are proposed at two former OCI premises; one in Marystown and one in Burin. Grieg NL will use these sites for transporting equipment and supplies (primarily via service vessels) to and from the sea cage sites. Additionally, one of the resupply sites will receive waste from the sea cage sites. Service vessels (and the associated movement of equipment, supplies and waste) will not use the Petit Fort or Long Harbour crew change sites. The use of separate resupply sites is designed to avoid contamination.
Page 54

As discussed below, fish mortalities will be removed from each sea cage on a daily basis, primarily via the automated Mortex system. Once at the surface, the dead fish are transferred to a designated and approved container on the feed barge for ensilaging; there will be limited personnel access to the ensilage container.
(3) Health Checks and Procedures: Fish health (salmon and lumpfish) at the sea cage sites will be monitored by Grieg NL personnel following the procedures as prescribed by the Aquatic Animal Health Division. Fish are routinely monitored by staff for not only physical changes such as signs of fin erosion, lesions, pigmentation problems, parasites and deformities but will also include monitoring of fish behaviour changes. As part of Grieg NL’s Fish Health Management Plan, an active and passive surveillance program will be implemented in cooperation with a private veterinarian as well as the provincial veterinarian. Grieg NL personnel will be trained and aware of the importance of noticing and reporting to supervisors any noticeable changes (physical and behavioural). This health surveillance program will apply to both farmed Atlantic salmon and the cleaner lumpfish held in the sea cages. Three of the most common types of pathogens that can cause issues with fish at the sea cage sites are viruses, bacteria and parasites (i.e., sea lice). Many of these pathogens are considered to be opportunistic and can create a serious health challenge especially if the fish are exposed to stressful events or prolonged sub-optimal conditions. Care is taken throughout, to ensure the effects of necessary stressful events are kept to a minimum with sufficient recovery time allocated between stressors. Proper husbandry practices are put in place to ensure overall general hygiene is kept up to standard and proper disinfections procedures are put into place. Routine parasite screening will be carried out as well as routine diagnostic testing. All routine parasite screening and active surveillance will be conducted by Grieg NL personnel on a schedule determined in consultation with provincial authorities and a private veterinarian that also considers fish health and welfare. In addition to the active surveillance by Grieg NL, a passive surveillance program along with diagnostic testing will also be performed by provincial veterinarians. Although Grieg NL will aim to avoid the use of antibiotics, there are some potential diseases that may require treatment, particularly in consideration of the welfare of the fish. An example would be Enteric Red Mouth disease (ERM) that is caused by a bacterium that has a wide host range and a broad geographical distribution but can be treated before it becomes a chronic issue. Grieg NL will only utilize antibiotics as a last resort based on recommendations of health authorities such as the private and provincial veterinarians in consideration of the health and welfare of the fish. Grieg NL will be using a sea cage net which extends 45 m below the water surface. This relatively deep net has sufficient volume to allow fish to swim to depths that will allow it to avoid unsuitable surface conditions (e.g., water temperature, sea lice, and waves) and thereby decrease stress on the fish. In addition, the grow-out plan is that fish will only spend one winter at sea; this minimizes the risk of fish mortality. (4) Specialized Feed and Feeding Procedures: Grieg NL will use an established feed adjusted to meet the requirement of triploid sterile salmon. More specifically, the feed
Page 55

has been developed to minimize mandible and spinal deformities as well as minimize the development of cataracts in triploid salmon. Grieg NL will utilize a major supplier for all its triploid sterile salmon feed at the sea cages. All the feed will be CFIA and European Union (EU) approved. Feed wastage will be minimized via the use of established feeding tables/software used to determine feed type and amount and an automatic feeding system which integrates video monitoring in the sea cages. Salmon will be monitored during feeding and once salmon have reached ~80% satiation, feed delivery will be ceased. Cameras mounted in the sea cages will provide staff with a view of the feeding behaviour of fish and feed can be stopped as soon as reduced feeding behaviour is noticed. This system optimizes feeding by providing only enough feed to satisfy the fish while reducing nutrient inputs into the environment. (5) Sea Lice Control: Sea lice levels on salmon will be monitored weekly (anaesthetizing a sub-sample of fish and counting the sea lice) when water temperatures are above 4˚C and weather conditions allow. In consideration of fish health and welfare, when water temperatures are below 4˚C, physical monitoring as noted above will be less frequent and will be based on advice of a veterinarian; however, weekly monitoring by underwater cameras will be conducted. Grieg NL will use an adaptive management approach involving several methods to control sea lice in a given sea cage site and across BMAs. Lumpfish will be used as a cleaner fish to minimize sea lice occurrence on salmon in all sea cages. Lumpfish naturally exhibit a “scan-and-pick” feeding behaviour and have been successfully used as cleaner fish in other cold-water aquaculture projects (Powell et al. 2017). If monitoring indicates an increase in sea lice levels, guidance will be acquired from private and provincial veterinarians. If sea lice levels require implementation of additional mitigation measures beyond the use of cleaner fish at a given sea cage site, Grieg NL will implement further preventative mitigation measures at that give sea cage site and other active sea cage sites in all BMAs. These measures could include the use of sea lice skirts and delivering feed through a dispenser located ~6–7 m below the surface (i.e., via a sub-feeder). If implemented, these measures will be done in combination with the use of functional feed (Jensen et al. 2015). Functional feed has been developed to inhibit sea lice by increasing mucous production on the salmon skin, thereby making it more difficult for sea lice to attach to the salmon. The use of a sub-feeder will be considered for use when feeding with functional feed. This will motivate the fish to stay under the main sea lice area by receiving the feed at ~6–7 m below the surface. The use of a sea lice skirt will add one more extra barrier for the sea lice, which in combination with the above would reduce the sea lice pressure even further. If the use of all these measures is not successful at controlling sea lice, Grieg NL will once again consult with private and provincial veterinarians. At this stage, three options will be considered: the use of a “Thermolicer®”, therapeutants, or harvesting the fish. If required, therapeutants (e.g., SLICE) would be administered in the feed of the fish. The use of SLICE will be considered based on the advice from the private and provincial veterinarian and what stage of the production cycles the affected fish has reached. The Thermolicer works by exposing fish and sea lice to 30–34°C water for ~25–30 seconds. The sea lice have a much lower tolerance to this warm water than the fish do and fall off and die when exposed to these conditions. The sea lice are collected
Page 56

and removed and the treated fish are sent back to the sea cage.1 Depending on the size of the fish, it is also possible that the fish will be harvested early to minimize sea lice. Delousing efforts will be balanced against fish welfare, avoiding resistance and with regard to the effects on the environment. Continuous monitoring and response is important to ensure sea lice levels remain low and the use of therapeutants can be minimized or eliminated. (6) Water Quality Monitoring: A routine program will be established for monitoring, measuring, and recording water quality at all active sea cage sites on a daily basis throughout the Project. In-situ data loggers will be installed on the barges at each sea cage site as well as on each individual cage. In addition, sensors can be attached to cameras and buoys located at the perimeter of each sea cage site. These in-situ loggers will collect data on water temperature, oxygen levels, current speed and direction, as well as pH and salinity. Data will be wirelessly transmitted to centralized computer stations on the barges and at the control center in Marystown for real-time viewing or logged for historical collections. Plankton samples will be completed weekly, analyzed and levels recorded. This will be one of the information sources used to create net cleaning schedules. Data collection will be used to evaluate the severity of any environmental issues such as fouling or changes in physio chemical data, leading to a response. Environmental changes and plankton levels are rated and depending on the results various mitigation responses are initiated. During transport of smolt from the RAS Hatchery to the sea cage sites, water quality in the hold of the well boat will be monitored. (7) Vaccinations: Prior to transfer to sea, salmon will be vaccinated as per the specific recommendations of provincial veterinarians. Typical vaccinations include the standard bacterin with Aeromonas salmonicida, Listonella anguillarum and anguillarum type II, and Vibrio salmonocida. Grieg NL will also include the bacterial kidney disease (BKD) and the infectious salmon anemia (ISA) vaccine based on consultations and recommendations with health authorities (DFLR and a private veterinarian). The lumpfish will also receive vaccinations as recommended by provincial veterinarians prior to transfer to sea. Currently lumpfish vaccinations can be administered as a dip-vaccine or injected. Lumpfish dip-vaccines are commonly administered to protect against one or more variants of Vibrio bacteria. Injection vaccinations for lumpfish target Aeromonas salmonicida type V and type VI as well as some Vibrio bacteria. Grieg NL will communicate with suppliers of the lumpfish to ensure the appropriate vaccination regime for the lumpfish has been administered prior to accepting delivery of lumpfish to its sea cages.
1 The Steinsvik Thermolicer was tested by the Norwegian Veterinary Institute and they determined that “thermal de-licing results in a significant reduction in the number of mobile and adult lice” (Viljugrein et al. 2015). They also stated that “Thermal delicing is a new method without chemicals which can be used as an alternative to pharmaceuticals, and should be used together with other measures as an overall strategy against lice” (Viljugrein et al. 2015). Steinsvik has reached an agreement with a third-party supplier in Newfoundland to offer this system. Grieg NL will sign an agreement with Steinsvik to use this system in the future as necessary.
Page 57
(8) Mortality Removal and Treatment: Grieg NL will use an automatic system (i.e., Mortex system) that removes dead fish from the bottom of the sea cage each day or more frequently as required. Any visible moribund fish or surface mortalities will be retrieved and moribund fish will be euthanized if required. By collecting mortalities daily this will decrease predator attraction to the cages and minimize disease risk. The number of fish mortalities will be recorded daily. When handling moribund fish from the sea cages, personnel will be required to wear rain gear, gloves, and boots which will be disinfected after each mortality disposal. Once at the surface, the dead fish are transferred to a designated and approved container on the feed barge for ensilaging; there will be limited personnel access to the ensilage container. The dead fish are ground into a slurry and acid is added to lower the pH. The silage will be transferred to shore once sufficient quantities are amassed. If a mass mortality occurs, personnel will follow procedures detailed in Grieg NL’s Emergency Response Plan.
4.5.5 Pathogen and Parasite Transfer between Lumpfish Cleaner Fish and Wild Fishes
The same general mitigation measures and monitoring procedures described in Section 4.5.4 are applicable to the minimization of the potential effects of pathogen and parasite transfer between lumpfish cleaner fish and wild fishes.
1. Decrease the potential for interactions between lumpfish cleaner fish and wild fishes; and
2. Maintenance of farmed salmon health
4.5.6 Fish Escape
In Canada, there are several primary reasons which have led to the escape of finfish from sea farms including personnel errors made during routine fish handling procedures and net damage caused by weather, ice, and predators2. From 2010–2016 in Newfoundland there have been five reported incidents of salmon escapes from sea farms and at least nine breaches in nets with no official report of escapes. Of the five reported incidents two were attributed to personnel errors made during harvesting, two were attributable to extreme weather, and one was attributed to a predator strike (possibly sharks; DFA 2015). The nine net breaches, which were reported in 2012, were attributed to sharks and tunas. The reported salmon escapes in Newfoundland occurred during operation of a different type of sea cage system than the Aqualine cage system Grieg NL is proposing for use. Federal and provincial regulators as well as the aquaculture industry recognize the importance of preventing escapes of fish from sea cages and as such, have developed regulations to minimize the chances of such escapes. Since 1999, DFLR (formerly DFA), DFO and the salmonid industry have implemented a management strategy called the Code of Containment for the Cage Culture of Salmonids in Newfoundland and Labrador (COC; DFA 2014). Additionally, mitigation measures and monitoring for minimizing the effects of predators and ice on the sea cages are designed to minimize the potential escape of fish.
2 See http://www.dfo-mpo.gc.ca/aquaculture/protect-protege/escape-prevention-evasions-eng html
Page 58

The mitigation and monitoring measures that will be implemented to minimize the potential of farmed salmon escapes as well as the potential effects of escapes on the fish and fish habitat of Placentia Bay are described below.
1. Code of Containment The COC is based on internationally recognized principles that focus on procedures which minimize the potential for equipment failures and improve upon handling practices. There are five primary elements to the COC: (1) Equipment; (2) Handling Practices; (3) Inspections; (4) Documentation and Reporting; and (5) Other Mitigations. These elements and how they will be specifically applied to the Project are described below. Grieg NL is using industry best practice where possible. (1) Equipment: As per the COC, all finfish containment systems (cage structures and nets) must be designed, constructed and installed to withstand local weather and ocean conditions including storms, water currents, and waves. Sea cage systems must also be maintained to control biofouling and ice accretion, which can compromise the system. Predator control measures are also important to minimizing the risk of escapes (see below for more details). In addition to following the COC requirements with regard to the cage structure, nets and moorings, Grieg NL will utilize a Norwegian company, Aqualine, for its cage systems. The Aqualine Midgard sea cage system, including its dimensions, design, and construction, is based on the Norwegian Standards (NS9415:2009) currently in use in Norway and which are considered industry best practice (Sullivan et al. 2018). The Aqualine sea cage proposed by Grieg NL, weighs 35 tonnes and is constructed of robust materials (netting material is Aqualine Ultima/Ultra SG netting which is made with High-density Polyethylene [HDPE] material), and the collar structure has been certified by DNV GL. Model testing of the Aqualine Midgard system has shown its ability to withstand 9 m significant wave heights. The Norwegian Standards require cage system and mooring design to minimize the risk of fish escapes due to technical failure. This dimensioning allows for deformations, environmental loads such as wind, waves, currents and ice as well as damage such as puncture. If during extreme situations a rupture or damage occurs to parts of the floating collar, the cage construction will keep its shape and prevent total collapse. The clamps which are connected to a dimensioning main supporting system in the horizontal plane will hold the construction together while the floating collar’s remaining capacity will prevent the cage net from collapsing. Aqualine’s floating collars are equipped with floater tubes filled with rods made out of expanded polystyrene. Should damage or a puncture occur to the collar, these rods maintain the buoyancy of the cage until repairs can be completed. Tidal variations and storm surges are not critical for the floating collar; however, ice accretion may cause loads on the construction. The load effect from icing is primarily connected to loss of buoyancy. Build-up of ice can readily be removed (see below). Grieg NL will also use a ROV to assist in tasks such as net inspections and in-situ net repair, if required.
Page 59

(2) Handling Practices: The COC details Handling Practices and includes appropriate precautions to prevent escapes during all stages of fish handling including transfers, counting, grading, sea lice counts, treatments, harvesting, net changing or cleaning. Additionally, Grieg NL will avoid handling and feeding fish during superchill conditions. As a minimum, Grieg NL will adhere to the best practices included in Appendix 6 of the COC including for grading, weight sampling, sea lice counts, transportation, well boat treatments, and harvesting. A common mitigation measure that reduces the likelihood of escapes during handling is the use of a drop net. Drop nets are placed under the work area and above the sea surface in the event a fish is ‘dropped’ during routine procedures that require handling of fish. Prior to each use drop nets are inspected for holes, wear and any other damage. Drop nets will be of sufficient size to cover the entire work area and the mesh size will be small enough to contain the smallest fish being handled. In addition to following the COC recommendations to ensure that escapes are minimized, Grieg NL will also be utilizing technology including automatic counters and video monitoring as an added security during handling. Fish counters and video cameras will be utilized during handling procedures including grading, transfers and harvesting to allow careful monitoring of fish numbers and enable a quick response to potential issues. All personnel will receive appropriate training in handling procedures. (3) Inspections: As part of the COC, nets that are over three years old and still in use will be tested every 18 months by a third-party (i.e., Aqualine). Nets are tested for strength (e.g., stress test with a tension scale instrument) and integrity. In addition, as a minimum, nets will be visually inspected every 90 days by an ROV. Cages and surface mooring components will also be inspected as per the COC. Surface components of mooring systems, cages, nets and ropes on each site will be inspected once per week and recorded on Form A.4 of COC. Underwater components of the mooring system, including the anchors, will be inspected based on a schedule developed in consultation with Aqualine and approved by DFO or DFLR. Each year, Grieg NL will be required to submit a “Mooring Maintenance/Replacement Plan” Form A2 for each site occupied with fish. In addition, periodically audits of the cage system, as specified in COC Procedures for Compliance, will be conducted and DFLR will arrange for audits of net testing procedures. Audits by DFLR will be conducted at a minimum of twice yearly (one in the spring, after fish entry; one audit in fall/early winter). Any identified damaged equipment will be repaired or replaced immediately. Grieg NL will also comply with the Norwegian Standards (NS9415:2009) for its sea cage system as supplied by Aqualine. The Aqualine sea cage nets which will be used for this Project are issued a service card that is valid for not more than 24 months. These service cards provide information on the condition of the net as well as a period of validity. Nets without a valid service card cannot be used in the cage system. New service cards are issued after an inspection which follows established Aqualine and Norwegian Standards (NS9415:2009) procedures. (4) Documentation and Reporting: Submission of the net testing results every 18 months (for nets over three years old) and annual submission of inventory reconciliation including number of fish stocked, mortalities, removals and explanation of
Page 60

discrepancies is required. The COC includes forms for these reports and all documentation will be maintained by Grieg NL for inspection by DFLR during their routine audits. (5) Other Mitigation Measures: Other mitigation measures to minimize the potential of farmed fish escapes and associated effects include:
• Escape response drills will be performed on site annually. All new employees will also perform an escape response drill as part of their site orientation. Escape response drills will include deploying weighted netting over a "mock" hole in the sea cage, reviewing kit contents and reviewing SOPs;
• Should any escape be suspected or known to occur, the COC requires immediate reporting of escape incidents to both DFO and to the DFLR (C. Hendry, Acting Manager of Aquaculture Management, Ecosystems Management Branch, pers. comm., 5 April 2018). Grieg NL will be required to begin discussions with DFO within 24 hours of the incident to determine if recapture efforts should be initiated. Authorization of recapture is at the discretion or direction of DFO in consultation with Grieg NL and stakeholders as needed. Although all escapes are reported, not all escapes incidents may trigger recapture efforts. Factors such as the life history stage of the escaped fish, the time of year, incident-specific factors and conservation objectives for wild fish populations will be considered;
• DFO may deem it necessary to issue a license for recapture. Each BMA will have an escape response kit and all marine personnel will be trained in its use. Once notification has been provided to DFO, and if a recapture response is authorized along with any necessary licenses, Grieg NL will enact their Emergency Response Plan. If conditions permit, it will involve deployment of gill nets and/or dip nets near the sea cage sites where the escape has occurred. Procedures including methods to count, document and report on escaped fish are provided in the Emergency Response Plan. If a recapture response is triggered and there is a serious breach in the net, fish will be transferred to a well boat where they will be counted and later returned to a replacement net. This will allow for an accurate assessment of the number of escaped fish.
2. Ice Monitoring and Mitigation
Sea cages may accumulate ice during freezing rain events or from sea spray that freezes. All sea cages will be routinely monitored for ice accretion either directly by personnel on site and/or remotely via video camera. Ice accretion will be minimized by personnel removing ice as it accumulates, which is typically done with rubber mallets, as is the practice for vessels. Based on a review of Canadian Ice Service data (see Appendix D) and discussions with the Placentia Marine Communications and Traffic Services (MCTS) and local stakeholders, sea ice and icebergs are not predicted to pose a threat to the sea cage sites. However, it is recognized that there is a very low probability that sea ice may occur in
Page 61

and near the sea cage site. Grieg NL will routinely (i.e., minimum daily) receive and monitor broadcasts on ice conditions (and/or weather) from the MCTS and receive guidance on the predicted timing and extent of any pack ice (or iceberg) incursions. The Canadian Coast Guard (CCG) holds pre-season meetings with its clients to discuss traffic expectations and service requirements. Grieg NL has submitted an application to “request standing” with the CCG on a committee should the need arise for assistance with ice. A three-tiered approach will be used to manage ice based on the type and size of the ice:
(1) Slush, small patches of drift ice, and ice in general less than 5 cm thick will be
mitigated through the robust design of the Aqualine Midgard sea cage as well the deployment of an ice boom and use of Grieg NL operated service vessels.
(2) A multi-purpose vessel (operated by a third-party provider) with ice class capacity will be on standby to mitigate and potentially break-up and/or move 5–15 cm thick ice; more specifically pancake ice, ice cakes, brash ice (<20 m across); small ice floes (20–100 m across); and medium ice floes (100–500 m across).
(3) A CCG ice breaker may assist with large ice floes (>500 m across), solid pack ice, and iceberg(s) in the unlikely event these ice conditions are encountered at or near the sea cage sites.
In the rare circumstance of a major ice incursion which cannot be mitigated through the measures outlined above, Grieg NL’s Emergency Response Plan will detail procedures to either harvest the fish or tow the sea cage(s) to a safe location. The sea cage(s) can only be towed when water temperatures are suitable for the health and welfare of the fish (between 4–18˚C).
3. Predator Protection and Control
A Predator Control Plan will be required as part of Grieg NL’s aquaculture license application. Methods to monitor, deter and exclude marine predators from the sea cages sites are required because predators such as sharks and tuna can create holes in nets which may contribute to escapement. For example, in fall 2015, DFO reported farm-origin salmon at the mouth of a river in Fortune Bay. It was speculated that sharks, which had been observed in the area, may have created a hole in the bottom of the net (DFA 2015). In addition, birds may attempt to take fish from the sea cages. Several mitigation measures and monitoring tools will be in place to minimize interactions with predators. Each sea cage will have bird nets which cover the entire top of the cage and prevent birds from taking fish. The bird net and bird poles are part of the Aqualine Midgard sea cage system and are designed to provide sufficient tension to eliminate net sagging. The sides of the bird net can be raised and lowered like a window blind to quickly and easily access the cage. Bird nets will be deployed ensuring mesh size will be sufficient to deter predators but minimize the risk of entanglement. If a bird does become entangled Grieg NL will follow established procedures to release the bird (which will be developed in
Page 62

consultation with ECCC-CWS). Grieg NL will have a Migratory Bird Handling Permit (issued by CWS) in place and will follow reporting requirements. For waterborne predators several techniques will be used. The bottom of each sea cage will have reinforced netting which minimizes the risk of tears. Also, the daily removal of dead fish from the bottom of sea cages via the automated Mortex system is intended to reduce the attraction of sharks and possibly seals. Each sea cage will have one or two cameras that offer 360 degree viewing and can be raised and lowered within the water column. These cameras, in addition to an ROV inspection camera, will allow for monitoring of the net integrity and fish behaviour. If a hole is detected in the net, it will be repaired as quickly as possible (estimated to range from <1 hour to several hours) by an ROV. The fish behaviour in sea cages will be monitored by personnel on the feed/accommodation barge and/or at the monitoring control center located at the RAS Hatchery for indications (i.e., crowding in bottom of net, skittish behaviour, change in feeding) that a predator may be nearby. If fish behaviour indicates the presence of a predator and/or a predator is directly observed (via the video or by personnel at the sea cage), the net will be inspected immediately for holes. This may involve a thorough review of video footage and/or dedicated inspection via an ROV and/or a diver. If predator incursions are determined to be an issue, Grieg NL in consultation with DFLR and DFO, will determine whether an anti-predator net (i.e., a double net that completely surrounds the sea cage under water) is warranted. There are trade-offs with using an anti-predator net—the primary drawback is that it makes cleaning the primary net much more difficult, which can result in water flow issues and subsequent health risks to the fish. It is possible that seals and river otters may be attracted to the sea cages but it is unlikely they would gain access to fish from the top of the sea cage. The fencing (and bird netting) on the inside of the gangway would make it difficult for these animals to gain access to the fish. Like sharks, it is possible that seals and perhaps river otters may tear holes in the sea cage netting but to the best of our knowledge this has not happened previously in Newfoundland. However, monitoring should minimize this risk as described above. Of note, Grieg NL will not use acoustic deterrent devices in an attempt to keep marine animals away. In all circumstances, predator management will be conducted in such a manner as to ensure human safety. Any accidental entanglement of marine mammals, otters, wild fish, and sea turtles will be reported to DFO and action will be taken, in consultation with DFO, to free or remove the animal (see Entanglement below). In extreme circumstances, if all methods have failed and a marine animal is posing a serious threat to the integrity of the nets (or to personnel safety), lethal measures may be considered. Before such actions are taken (by a third-party; firearms will not be stored at the sea cage sites), DFO will be consulted.
Page 63

4. Other Mitigation Measures
In addition to the measures in the COC, predator protection and control, and ice monitoring and mitigation, there are other mitigation measures in place to further minimize the likelihood of fish escapes. These include:
• Sea cage sites are selected in areas that provide shelter, have suitable current
conditions, and are predominantly ice free; • Sea cages are oriented to minimize exposure to the prevailing winds and
waves; • Husbandry practices such as maintaining clean nets and continuous
monitoring of fish and nets also serve to minimize the risk of fish escapes.
4.5.7 Entanglement
It is possible that marine mammals, sea turtles, river otters, wild fish, and birds may become entangled in the sea cage nets and, in the case of some animals, in the associated mooring and buoy lines. Mitigations that will be implemented to minimize the potential of entanglement and its potential effects include:
• If a bird becomes entangled Grieg NL will follow established procedures to release the bird (which will be developed in consultation with ECCC-CWS). Grieg NL will have a Migratory Bird Handling Permit (issued by CWS) in place and will follow reporting requirements;
• Each sea cage is equipped with one or two video cameras with 360° viewing and which can be raised and lowered within the water column. This will allow for regular monitoring of entanglements;
• Sea cage mooring and buoy lines will be kept tensioned and no loose ropes will be left trailing in the water;
• Any entanglement of marine mammals, otters, wild fish, and sea turtles will be reported to DFO and action will be taken, in consultation with DFO (and the Whale Release and Strandings Group), to free or remove the animal; and
• In extreme circumstances, if all other methods to release an animal have failed and it is posing a serious threat to the integrity of the nets (or the safety of personnel), lethal measures may be considered. Before such actions are taken, DFO will be consulted.
4.6 Follow-up Monitoring
As indicated in Section 7.4 of the EIS Guidelines, Grieg NL will prepare and submit an Environmental Effects Monitoring and Follow-up Plan (EEMP) subsequent to the completion of the EIS but prior to initiation of project construction. The EEMP will provide the details of the proposed follow-up monitoring. Presented below are the concepts for the follow-up monitoring for the Fish and Fish Habitat VEC. As indicated above, the details will be presented in the EEMP.
Page 64

Follow-up monitoring that will be implemented to validate predictions regarding the residual effects of planned Project activities on fish and fish habitat include:
• Underwater camera surveys (i.e., drop camera, ROV) of benthic habitat in the vicinities of the sea cages will be undertaken to assess the degree of deposition of organics from the sea cages during regular operations;
• Samples of the deposited organic material will be collected (if possible) and analyzed for various parameters (e.g., sulfide levels);
• If therapeutants and antibiotics are used, samples of the deposited organic material in the vicinity of the sea cages will be collected (if possible) and analyzed for presence of the chemicals; and
• Implementation of a multi-year environmental monitoring program involving the deployment of an ADCP and multiple probes at the Rushoon, Merasheen and Red Island BMAs. Each of the three ADCPs will be deployed at a 40-m depth to collect current profile data in 2-m depth cells in the upper 40 m of the water column. In addition, multiple probes will be installed on the mooring lines at selected depths above the ADCP to collect data on the following parameters.
o Water temperature; o Wave profile; o Conductivity; o Salinity; o pH; o Total dissolved solids (TDS); and o Dissolved oxygen.
This time series of physical/chemical environmental data is intended to capture the variability within and across years and confirm that the measured parameters are suitable for the Project. 5.0 References
ALTRT (Atlantic Leatherback Turtle Recovery Team). 2006. Recovery Strategy for Leatherback Turtle (Dermochelys coriacea) in Atlantic Canada. Species at Risk Act Recovery Strategy Series. Fisheries and Oceans Canada, Ottawa. vi + 45 p.
Amec (Amec Foster Wheeler). 2007. Newfoundland and Labrador Refinery Project – Environmental Impact Assessment Component Study: Marine Fush and Fish Habitat Component Study. Report by Amec Earth and Environmental Ltd., St. John’s, NL for Newfoundland and Labrador Refining Corporation, St. John’s, NL. 81 p. + appendices.
Amec. 2017a. Application of available multibeam acoustic and seascape data to map proposed marine finfish production locations in Placentia Bay, Newfoundland. Report by Amec, St. John’s, NL for Grieg NL Seafarms Ltd, Marystown, NL. 35 p. + appendix.
Amec. 2017b. Benthic depositional modelling for Grieg Seafarms in Placentia Bay. Report by Amec, St. John’s, NL for Grieg NL Seafarms Ltd, Marystown, NL. 27 p. + appendix.
Archambault, D., G.A. Chouinard, T. Hurlbut, B. Morin, S.D. Paul, G.A. Poirier, J.M. Porter, and D.P. Swain. 2001. Summary of information on the biology of exploited groundfish species and bluefin tuna in the southern Gulf of St. Lawrence. Can. Sci. Advis. Sec. Res. Doc. 2001/120.
Archibald, D.W. and M.C. James. 2016. Evaluating inter-annual relative abundance of leatherback sea turtles in Atlantic Canada. Marine Ecology Progress Series 547: 233-246.
Page 65

Boulva, J. and I.A. McLaren. 1979. Biology of the harbour seal, (Phoca vitulina) in eastern Canada. Bull. Fish. Res. Board Can. 200: 25 p.
Bradbury, I.R., P.V.R. Snelgrove, and S. Fraser. 2000. Transport and development of eggs and larvae of Atlantic cod, Gadus morhua, in relation to spawning time and location in coastal Newfoundland. Can. J. Fish. Aquat. Sci. 57(9): 1761-1772.
Bradbury, I.R., P.V.R. Snelgrove, and S. Fraser. 2001. The influence of temperature on advective loss of Atlantic cod (Gadus morhua) eggs from the inshore environment. Fish. Oceanogr. 10(4): 342-353.
Bradbury, I.R., P.V.R. Snelgrove, and P. Pepin. 2003. Passive and active behavioural contributions to patchiness and spatial pattern during the early life history of marine fishes. Mar. Ecol. Prog. Ser. 257: 233-245.
Brattey, J. and B. Healey. 2005. Exploitation of Atlantic cod (Gadus morhua) in NAFO Subdiv. 3Ps: estimates from mark-recapture experiments for the October 2006 assessment. Can. Sci. Advis. Sec. Res. Doc. 2006/082.
Brown, C.J., S.J. Smith, P. Lawton, and J.T. Anderson. 2011. Benthic habitat mapping: a review of progress towards improved understanding of the spatial ecology of the seafloor using acoustic techniques. Estuarine, Coastal and Shelf Science, 92(3): 502-520.
Campana, S., L. Marks, W. Joyce, and S. Harley. 2001. Analytical assessment of the porbeagle shark (Lamna nasus) population in the northwest Atlantic, with estimates of long-term sustainable yield. DFO Can. Sci. Advis. Sec. Stock Status Report 2001/067.
Carscadden, J.E., K.T. Frank, and D.S. Miller. 1989. Capelin (Mallotus villosus) spawning on the Southeast Shoal: influence of physical factors past and present. Can. J. Fish. Aquat. Sci. 46(10): 1743-1754.
Catto, N.R., R.G. Hooper, M.R. Anderson, D.A. Scruton, J.D. Meade, L.M.N. Ollerhead, and U.P Williams. 1999. Biological and geomorphological classification of Placentia Bay: a preliminary assessment. Can. Tech. Rep. Fish. Aquat. Sci.
Chang, B.D., F.H. Page, R.J. Losier, R.J., P. Lawton, R. Singh, and D.A. Greenberg. 2007. Evaluation of bay management area scenarios for the southwestern New Brunswick salmon aquaculture industry: Aquaculture Collaborative Research and Development Program final project report. Can. Tech. Rep. Fish. Aquat. Sci. 2722: v + 69 p.
C-NLOPB (Canada-Newfoundland and Labrador Offshore Petroleum Board). 2010. Southern Newfoundland strategic environmental assessment. LGL Rep. SA1037. Rep. by LGL Limited, Oceans Limited, Canning & Pitt Associates Inc., and PAL Environmental Services, St. John’s, NL for Canada-Newfoundland and Labrador Offshore Petroleum Board, St. John’s, NL. 332 p. + appendix.
COSEWIC. 2006. COSEWIC assessment and status report on the white shark Carcharodon carcharias (Atlantic and Pacific populations) in Canada. Committee on the Status of Endangered Wildlife in Canada. Ottawa. vii + 31 p. Available at http://www.sararegistry.gc.ca/document/default_e.cfm?documentID=1019.
COSEWIC. 2012a. COSEWIC assessment and status report on the northern wolffish Anarhichas denticulatus in Canada. Committee on the Status of Endangered Wildlife in Canada. Ottawa. x + 41 p. Available at http://www.sararegistry.gc.ca/document/default_e.cfm?documentID=1156.
COSEWIC. 2012b. COSEWIC assessment and status report on the spotted wolffish Anarhichas minor in Canada. Committee on the Status of Endangered Wildlife in Canada. Ottawa. x + 44 p. Available at http://www.sararegistry.gc.ca/document/default_e.cfm?documentID=1162.
COSEWIC. 2012c. COSEWIC assessment and status report on the Atlantic wolffish Anarhichas lupus in Canada. Committee on the Status of Endangered Wildlife in Canada. Ottawa. ix + 56 p. Available at http://www.sararegistry.gc.ca/document/default_e.cfm?documentID=1133.
COSEWIC. 2012d. COSEWIC assessment and status report on the American eel Anguilla rostrata in Canada. Committee on the Status of Endangered Wildlife in Canada. Ottawa. xii + 109 p. Available at
http://www.sararegistry.gc.ca/document/default_e.cfm?documentID=2452. COSEWIC. 2012e. COSEWIC assessment and status report on the leatherback sea turtle Dermochelys coriacea in
Canada. Committee on the Status of Endangered Wildlife in Canada. Ottawa, ON. xv + 58 p. COSEWIC. 2014. COSEWIC assessment and status report on the banded killifish Fundulus diaphanus in Canada.
Committee on the Status of Endangered Wildlife in Canada. Ottawa. x + 22 p.
Page 66

Available at http://www.sararegistry.gc.ca/document/default_e.cfm?documentID=202. COSEWIC. 2016. COSEWIC assessment and status report on the Blue Shark Prionace glauca, North Atlantic
population and North Pacific population, in Canada. Committee on the Status of Endangered Wildlife in Canada. Ottawa. xv + 50 pp.
COSEWIC. 2017. COSEWIC assessment and status report on the shortfin mako Isurus oxyrinchus, Atlantic population, in Canada. Committee on the Status of Endangered Wildlife in Canada. Ottawa. xii + 34 p. Available at http://www.sararegistry.gc.ca/document/default_e.cfm?documentID=3304.
DFA. 2014. Code of containment for the culture of salmonids in Newfoundland and Labrador. Prepared by Department of Fisheries and Aquaculture, Aquaculture Branch. 46 p.
DFA. 2015. Aquaculture Licensing Process for Sea Cage Sites. Prepared by Department of Fisheries and Aquaculture, Aquaculture Development Division. 46 p.
DFO. 2012. Placentia Bay/Grand Banks Large Ocean Management Area – Integrated Management Plan (2012-2017). Placentia Bay/Grand Banks Large Ocean Management Area Secretariat. Oceans Division. Ecosystems Management Branch. Newfoundland and Labrador Region. 80 p.
DFO. 2014. Potential impacts of finfish aquaculture on hard bottom substrates and development of a standardized monitoring protocol. DFO Can. Sci. Advis. Sec. Sci. Advis. Rep. 2014/017.
DFO. 2015. Assessment of Capelin in Subarea 2 and Divisions 3KL in 2015. DFO Can. Sci. Advis. Sec. Sci. Advis. Rep. 2015/036.
DFO. 2016a. Assessment of Newfoundland and Labrador (Divisions 2HJ3KLNOP4R) Snow Crab. DFO Can. Sci. Advis. Sec. Sci. Advis. Rep. 2016/013.
DFO. 2016b. Assessment of American Lobster in Newfoundland. DFO Can. Sci. Advis. Sec. Sci. Advis. Rep. 2016/052.
DFO. 2016c. An Assessment of Sea Scallop on the St. Pierre Bank (Subdivision 3Ps). DFO Can. Sci. Advis. Sec. Sci. Advis. Rep. 2016/032.
DFO. 2016d. Report on the progress of the management plan implementation for the banded killifish (Fundulus diaphanus), Newfoundland population, in Canada for the period of 2011-2016. Species at Risk Act Management Plan Series. Fisheries and Oceans Canada, Ottawa. iv + 9 p. Available at http://www.dfo-mpo.gc.ca/species-especes/profiles-profils/killifish-fondule-eng html.
DFO. 2016e. Refinement of Information Relating to Ecologically and Biologically Significant Areas (EBSAs) Identified in the Newfoundland and Labrador (NL) Bioregion. DFO Can. Sci. Advis. Sec. Sci. Resp. 2016/032.
DFO. 2016f. Recovery Strategy for the Leatherback Sea Turtle (Dermochelys coriacea) in Atlantic Canada [Proposed]. Species at Risk Act Recovery Strategy Series. Fisheries and Oceans Canada, Ottawa. vii + 43 p.
DFO. 2017a. Stock Assessment of NAFO Subdivision 3Ps Cod. DFO Can. Sci. Advis. Sec. Sci. Advis. Rep. 2017/002.
DFO. 2017b. Assessment of Newfoundland east and south coast herring to the spring of 2016. DFO Can. Sci. Advis. Sec. Sci. Advis. Rep. 2017/028.
DHI. 2016. Grieg Seafarms, Newfoundland – Hydrographic Surveys. Report by DHI, Denmark for Grieg Seafood BC Ltd. 23 p.
Dominguez. L. 1998. Reproductive success and environmental contaminants among bald eagles in Placentia and Bonavista Bay, Newfoundland. Thesis submitted to the School of Graduate Studies, Biopsychology Programme, Memorial University of Newfoundland.
Ennis, G.P. 1984. Small-scale seasonal movements of the American lobster Homarus americanus. Trans. Amer. Fish. Soc. 113(3)
Fenwick, G.D. and D.H. Steele. 1983. Amphipods of Placentia Bay, Newfoundland. Occasional Papers in Biology No. 7, Memorial University of Newfoundland, St. John’s, NL.
FFAW|Unifor. 2017. Now accepting applications for green crab mitigation in Placentia Bay. Fish, Food and Allied Workers Union. Available at http://ffaw.nf.ca/en/news-and-events/news/now-accepting-applications-green-crab-mitigation-placentia-bay#.Wow6Ja7tx6t.
Page 67

FFAW|Unifor. 2018. Science programs. Fish, Food and Allied Workers Union. Available at http://ffaw.nf.ca/en/science-programs#sentinel.
FLR (Fisheries and Land Resources). 2018. Species at risk. Government of Newfoundland and Labrador. Available at http://www.flr.gov nl.ca/wildlife/endangeredspecies/index.html.
GC (Government of Canada). 2015. Aquaculture Activities Regulations. Available at: http://www.laws.justice.gc.ca/eng/regulations/SOR-2015-177/page-1 html. Gilkinson, K. and E. Edinger (Eds.). 2009. The ecology of deep-sea corals of Newfoundland and Labrador waters:
biogeography, life history, biogeochemistry, and relation to fishes. Can. Tech. Rep. Fish. Aquat. Sci. 2830: vi + 136 p.
GNL (Government of Newfoundland and Labrador). 2010. Banded killifish (Fundulus diaphanus). Newfoundland and Labrador Species at Risk. Department of Environment & Conservation, Wildlife Division, Endangered Species & Biodiversity. 1 p. Available at http://www flr.gov.nl.ca/wildlife/endangeredspecies/fish.html.
Goudie, I. and C. Jones. 2007. River otter in Inner Placentia Bay, Newfoundland. LGL Rep. SA914F. Rep. by LGL Limited, St. John’s, NL. 21 p. + appendices.
Gregory, R.S. and J.T. Anderson. 1997. Substrate selection and use of protective cover by juvenile Atlantic cod Gadus morhua in inshore waters of Newfoundland. Mar. Ecol. Prog. Ser. 146(1-3): 9-20.
Grieg NL. 2018. Unpublished water quality data. Hammill, M.O., M.S. Ryg and B. Mohn. 1995. Consumption of cod by the Northwest Atlantic Grey Seal in
Eastern Canada. pp. 337-349. In: A.S. Blix, L. Walloe and O. Ulltang (eds.), Whales, seals, fish and man. Proceedings of the International Symposium on the Biology of Marine Mammals in the North East Atlantic. Developments in Marine Biology 4.
Hamoutene, D., F. Salvo, R. Belley, L. Lush, C. Hendry, and K. Marshall. 2017. An evaluation of benthic monitoring baseline assessments completed as part of the regulatory requirements for aquaculture finfish site applications on the South Coast of Newfoundland. Can. Tech. Rep. Fish. Aquat. Sci. Fs97-6/3222E-PDF: v + 25 p.
Jensen, L.B., F. Proven, E. Larssen, J.E. Bron, and A. Obach. 2015. Reducing sea lice (Lepeophtheirus salmonis) infestation of farmed Atlantic salmon (Salmo salar L.) through functional feeds. Aquaculture Nutrition 21: 983-993.
JWEL (Jacques Whitford Environment Limited). 1996. Newfoundland transshipment terminal project: Environmental assessment. Volume 2. Report to Newfoundland Transshipment Terminal Team, St. John’s, Newfoundland.
Kearley, W. 2012. Here’s the Catch: The Fish We Harvest from the Northwest Atlantic. Boulder Publications, Portugal Cove-St. Philips, NL.165 p.
Kiceniuk, J.W. 1992. Aromatic hydrocarbon concentrations in sediments of Placentia Bay, Newfoundland. Can. Tech. Rep. Fish. Aquat. Sci. No. 1888.
Kulka, D., C. Hood, and J. Huntington. 2007. Recovery strategy for northern wolffish (Anarhichas denticulatus) and spotted wolffish (Anarhichas minor), and management plan for Atlantic wolffish (Anarhichas lupus) in Canada. Fisheries and Oceans Canada, Newfoundland and Labrador Region. St. John’s, NL. x + 103 p.
Lawson, G.L. and G.A Rose. 1998. Movement patterns of inshore cod in Subdivision 3Ps (southern Newfoundland) based on mark-recapture studies during 1996-97. Can. Stock Assess. Sec. Res. Doc. 98/24.
Lawson, G.L. and G.A. Rose. 2000a. Small-scale spatial and temporal patterns in spawning of Atlantic cod (Gadus morhua) in coastal Newfoundland waters. Can. J. Fish. Aquat. Sci. 57(5): 1011-1024.
Lawson, G.L. and G.A. Rose. 2000b. Seasonal distribution and movements of coastal cod (Gadus morhua L.) in Placentia Bay, Newfoundland. Fish. Res. 49(1): 61-75.
Lawson, J.W., J.T. Anderson, E.L. Dalley, and G.B. Stenson. 1998. Selective foraging by harp seals (Phoca groenlandica) in nearshore and offshore waters of Newfoundland, 1993-94. Marine Ecology Progress Series 163:1-10.
Letto, K.R., Y.F. Wiersma, J. Brazil, and B. Rodrigues. 2015. Bald Eagle (Haliaeetus leucocephalus) population increases in Placentia Bay, Newfoundland: evidence for habitat saturation? Avian Conservation and Ecology 10 (1): 4.
Page 68

LFA (LeDrew, Fudge and Associates Limited). 1991. Intertidal and subtidal benthic monitoring program at Come By Chance, Newfoundland, July 1990. Report for Newfoundland Processing Ltd., Come By Chance, Newfoundland.
LGL (Limited). 2007. Marine Environment Component Study of Long Harbour, Placentia Bay and Vicinity: Climate and Oceanography, Marine Ecology, Commercial Fisheries and Aquaculture, Bald Eagle, Marine Birds and Other Avifauna, River Otter. LGL Rep. SA889. Rep. by LGL Limited, St. John’s, NL, for Voisey’s Bay Nickel Company Limited, St. John’s, NL.
LGL. 2015. Environmental assessment of WesternGeco’s Eastern Newfoundland Offshore Seismic Program, 2015-2024. LGL Rep. FA0035. Rep. by LGL Limited in association with Canning & Pitt Associates Inc., St. John’s, NL for WesternGeco (Division of Schlumberger Canada Limited), Calgary, AB. 255 p. + appendices.
LGL. 2018. Wild Atlantic Salmon. Component Study for the Environmental Impact Statement of the Placentia Bay Atlantic Salmon Aquaculture Project. LGL Rep. FA0144-1. Rep. by LGL Limited, St. John`s, NL for Grieg NL, Marystown, NL. 62 p. + appendices.
Lutcavage, M., R.W. Brill, G.B. Skomal, B.C. Chase, and P.W. Howey. 1999. Results of pop-up satellite tagging of spawning size class fish in the Gulf of Maine: Do North Atlantic bluefin tuna spawn in the mid-Atlantic? Can. J. Fish. Aquat. Sci. 56:173-177.
Mansour, A., D. Hamoutene, G. Mabrouk, T. Puestow, and E. Barlow. 2008. Evaluation of some environmental parameters for salmon aquaculture cage sites in Fortune Bay, Newfoundland: emphasis on the occurrence of hypoxic conditions. Can. Tech. Rep. Fish. Aquat. Sci. 2814: vi + 21 p.
Mello, L.G.S. and G.A. Rose. 2005a. Seasonal growth of Atlantic cod: effects of temperature, feeding and reproduction. J. Fish. Biol. 67(1): 149-170.
Mello, L.G.S. and G.A. Rose. 2005b. Seasonal variation in abundance and stock composition of Atlantic cod (Gadus morhua L.) in Placentia Bay, Newfoundland, in relation to fisheries. Fish. Res. 74(1-3); 142-156.
Neilson, J.D. 2009. Available information for preparation of the Western Atlantic bluefin tuna (Thunnus thynnus) COSEWIC Status Report, DFO Can. Sci. Advis. Sec. Res. Doc. 2009/035. vi + 13 p.
NL DMAE. 2018. Environmental Impact Statement Guidelines for the Placentia Bay Atlantic Salmon Aquaculture Project. Guidelines prepared by Newfoundland and Labrador Department of Municipal Affairs and Environment for Grieg NL. 38 p. Available at: http://www.mae.gov.nl.ca/env_assessment/projects/Y2016/1834/
Oceans Ltd. 2018. Metocean Conditions for the Placentia Bay Aquaculture Sites. February 2018. OCEARCH. 2018. Global shark tracker. Available at http://www.ocearch.org/. O’Driscoll, R.L. and G.A. Rose. 1999. Seasonal changes in abumndance, distribution, and vertical migration of
capelin in Placentia Bay. In: Capelin in SA2 + Div. 3KL. Can. Sci. Advis. Sec. Res. Doc. 1999/206. O’Driscoll, R.L., M.J.D. Parsons, and G.A. Rose. 2001. Feeding of capelin (Mallotus villosus) in Newfoundland
waters. Sarsia 86(3): 165-176. Powell, A., J.W. Treasurer, C.L. Pooley, A.J. Keay, R. Lloyd, A.K. Imsland, and C. Garcia de Leaniz. 2017. Use of
lumpfish for sea-lice control in salmon farming: challenges and opportunities. Reviews in Aquaculture 0: 1-20.
Ramey, P.A. and P.V.R. Snelgrove. 2003. Spatial patterns in sedimentary macrofaunal communities on the south coast of Newfoundland in relation to surface oceanography and sediment characteristics. Mar. Ecol. Prog. Ser. 262: 215-227.
Robichaud, D. and G.A. Rose. 2001. Multiyear homing of Atlantic cod to a spawning ground. Can. J. Fish. Aquat. Sci. 58.(12): 2325-2329.
Robichaud, D. and G.A. Rose. 2003. Sex differences in cod residency on a spawning ground. Fish. Res. 60.(1): 33-43.
Robichaud, D. and G.A. Rose. 2006. Density-dependent distribution of demersal juvenile Atlantic cod (Gadus morhua) in Placentia Bay, Newfoundland. ICES J. Mar. Sci. 63(4): 766-774.
Rooker, J.W., J.R. Alvarado Bremer, B.A. Block, H. Dewar, G. de Metrio, A. Corriero, R.T. Kraus, E.D. Prince, E. Rodriguez-Marin, and D.H. Secor. 2007. Life history and stock structure of Atlantic bluefin tuna (Thunnus thynnus). Rev. Fish. Sci. 15:265–310.
Page 69

Rose, G.A. 1993. Cod spawning on a migration highway in the northwest Atlantic. Nature 366(6454):458-461. Rose, G.A. and R.L. O’Driscoll. 2002. Multispecies interactions – Capelin are good for cod: can the northern stock
rebuild without them? ICES J. Mar. Sci. 59(5):1018-1026. Scott, W.B. and M.G. Scott. 1988. Atlantic Fishes of Canada. Can. Bull. Fish. Aquat.c Sci. 219. 731 p. Shaw, J., D.P. Potter, and V.E. Kostylev. 2011. Seascapes, Placentia Bay, Newfoundland and Labrador. Geological
Survey of Canada, Open File, 6683. Sjare, B., B. Nakashima, and D. Mercer. 2003. Integrating scientific and local ecological knowledge to identify
potential critical habitats: A case study in Placentia Bay, Newfoundland. Can. Sci. Advis. Sec. Res. Doc. 2003/114.
Sullivan, G., R. Kennedy, K. Downey, S. Fleming, A. Parker, B. Parker, K. Richford, and N. Spence. 2018. Aqualine Midgard Sea-Cage Study. Component Study for the Environmental Impact Statement of the Placentia Bay Atlantic Salmon Aquaculture Project. Prepared by Spence Corrosion Canada Inc., St. John’s, NL, DNV GL, St. John’s, NL, Engineered Pipe Group, Mount Pearl, NL, and AKVA Group North America, St. John’s, NL. Prepared for Grieg NL, Marystown, NL. 59 p. + appendices.
Templeman, N.D. 2007. Placentia Bay-Grand Banks Large Ocean Management Area Ecologically and Biologically Significant Areas. DFO Can. Sci. Advis. Sec. Res. Doc. 2007/052. 15 p.
Viljugrein, H., A. Lillehaug, H.K. Nilsen, and A-G. Gjevre. 2015. Thermal de-licing of salmonid fish-documentation of fish welfare and effect. Report from Veterinaerinstituttet, Norwegian Veterinary Institute. Available at: https://www.vetinst.no/rapporter-og-publikasjoner/rapporter2015/thermal-de-licing-of-salmonid-fish-documentation-of-fish-welfare-and-effect
Westley, P.A.H. and I.A. Fleming. 2011. Landscape factors that shape a slow and persistent aquatic invasion: brown trout in Newfoundland 1883-2010. Diversity Distrib. 17: 566-579.
Wheeler, J.P., B. Squires, and P. Williams. 2004. Newfoundland east and southeast coast herring – an assessment of stocks to the spring of 2004. Can. Sci. Advis. Sec. Res. Doc. 2004/101.
Windle, M.J.S. and G.A. Rose. 2005. Migration route familiarity and homing of transplanted Atlantic cod (Gadus morhua). Fish. Res. 75(1-3): 193-199.
Personal Communication K. Best, Fisheries Biologist, Centre for Fisheries Ecosystems Research, Marine Institute, Memorial University of
Newfoundland. 13 February and 1 March 2018. C. Hendry, Acting Manager of Aquaculture Management, Ecosystems Management Branch,
5 April 2018. J. Lawson, Research Scientist, DFO, 3 April 2018. G. Melvin, Research Scientist, DFO, 2015.
Page 70
List of Appendices
Appendix A Sea Cage Site Water Quality Data: Water Temperature and
Dissolved Oxygen
Appendix B Application of Available Multibeam Acoustic and Seascape Data to Map Proposed Marine Finfish Production Locations in Placentia Bay, Newfoundland
Appendix C Sea Cage Site Physical and Biological Benthic Data
Appendix D Metocean Conditions for the Placentia Bay Aquaculture
Sites, Oceans Ltd., February 2018
Page 71