fish fauna of the severn estuary. are there long-term ... · fish fauna of the severn estuary. are...
TRANSCRIPT

Journal of Experimental Marine Biology and EcologyŽ .258 2001 15–37
www.elsevier.nlrlocaterjembe
Fish fauna of the Severn Estuary. Are therelong-term changes in abundance and species
composition and are the recruitment patterns of themain marine species correlated?
I.C. Potter a,), D.J. Bird b, P.N. Claridge c, K.R. Clarke c,G.A. Hyndes a, L.C. Newton b
a School of Biological Sciences and Biotechnology, Murdoch UniÕersity, Murdoch,Western Australia 6150, Australia
b Faculty of Applied Sciences, UniÕersity of the West of England, Bristol, BS16 1QY, UKc Plymouth Marine Laboratory, Prospect Place, West Hoe, Plymouth, PL1 3DH, UK
Received 13 April 2000; received in revised form 20 November 2000; accepted 23 November 2000
Abstract
Fish were collected from the intake screens of the Oldbury Power Station in the Severn Estuaryin each week between early July 1972 and late June 1977 and at least twice monthly betweenearly January 1996 and late June 1999. The annual catches, after adjustment to a commonsampling effort, demonstrate that the abundance of fish at Oldbury was far greater in the 1990sthan 1970s, mainly due to marked increases in the numbers of certain marine species, such as sandgoby, whiting, bass, thin-lipped grey mullet, herring, sprat and Norway pout. These increases mayreflect the great improvement that occurred in the water quality of the Severn Estuary betweenthese decades. The only species that declined markedly in abundance was poor cod. Modestdeclines in flounder and River lamprey paralleled those occurring elsewhere in the UK. Thespecies composition in the two decades also differed, reflecting changes not only in the relativeabundances of the various marine estuarine-opportunistic species, which dominated the ichthy-ofauna, but also in those of the suite of less abundant species in the estuary. The cyclical changesundergone each year by the species composition of the fish fauna of the Severn Estuary reflectsequential intra-annual changes in the relative abundances of species representing each of themarine, diadromous and freshwater categories. New approaches have been developed to testwhether or not large sets of correlations between patterns of recruitment amongst abundant marine
) Corresponding author. Tel.: q61-8-9360-2524; fax: q61-8-9360-6303.Ž .E-mail address: [email protected] I.C. Potter .
0022-0981r01r$ - see front matter q2001 Elsevier Science B.V. All rights reserved.Ž .PII: S0022-0981 00 00343-9

( )I.C. Potter et al.rJ. Exp. Mar. Biol. Ecol. 258 2001 15–3716
Ž .species internal correlations , and between those patterns and salinity and water temperatureŽ .within the estuary cross-correlations , were significant. The correlation profile analyses found no
evidence that the annual recruitment strengths of these species were either intercorrelated, orcorrelated with either one or a combination of both of the above environmental variables. Yet, thetimings of the recruitment of these species into the estuary were intercorrelated, i.e. a slightlyearlier or later than normal immigration by one species in a given year was paralleled by the sametrend in other species. However, this association in recruitment times could be linked neither tosalinity nor water temperature within the estuary, nor to a combination of these two variables.These results indicate that, while the factors that influence the annual recruitment strengths of thejuveniles of different marine species vary, inter-annual differences in the phasing of events thatregulate spawning times andror larval dispersal influence, in the same direction, the times whenmarine species are recruited into the estuary. q 2001 Elsevier Science B.V. All rights reserved.
Keywords: Annual cyclical changes; Correlation profile analyses; Environmental variables; Estuary; Fish;Long-term changes; Recruitment; Species compositions and abundances
1. Introduction
The fish faunas of estuaries in temperate regions of the northern hemisphere areŽdominated by marine species Haedrich, 1983; Dando, 1984; Elliott and Dewailly,
.1995 , which can be categorised as either marine stragglers or marine estuarine-op-Ž .portunists Potter et al., 1997 . The marine stragglers are defined as those species that
typically occur irregularly and in low numbers in estuaries and usually near their mouthswhere salinities are relatively high. In contrast, the marine estuarine-opportunistscomprise those euryhaline species which enter estuaries in large numbers and sometimes
Ž .penetrate far upstream into regions of reduced salinity e.g. Henderson, 1989 . Althoughmacrotidal estuaries in the northern hemisphere act as important nursery areas for certain
Ž .marine estuarine-opportunists e.g. Gunter, 1961; Haedrich, 1983; Maes et al., 1998 ,relatively few species are able to spawn and complete their life cycles in these systemsŽ .Dando, 1984; Kennish, 1990 .
Large numbers of the juveniles of certain marine estuarine-opportunist species areŽ . Žrecruited into nearshore waters of the Severn Estuary UK Claridge et al., 1986; Potter
.et al., 1997 . The more abundant of these species typically breed at some time betweenŽ .late winter and early summer and, from the distribution of their larvae Russell, 1980 ,
most of these spawn either within or just outside the Bristol Channel into which theSevern Estuary discharges. Weekly sampling in the Severn Estuary between July 1972and June 1977 has provided data on the abundance, time of occurrence and sizecomposition of each of the more numerous fish species present during that periodŽClaridge and Gardner, 1977, 1978; Claridge and Potter, 1983, 1984, 1985, 1987, 1994;Claridge et al., 1985; Badsha and Sainsbury, 1978; Titmus et al., 1978; Abou-Seedo and
.Potter, 1979; Hardisty and Badsha, 1986; Potter and Claridge, 1985; Potter et al., 1988 .Since the Severn Estuary used to be exposed to the input of large amounts of certain
Žcontaminants, and particularly of highly toxic elements such as cadmium Little and.Smith, 1994 , such contamination may have led to the mortality of some fish. If that was
the case, the marked decline in the input of those contaminants into the Severn Estuary

( )I.C. Potter et al.rJ. Exp. Mar. Biol. Ecol. 258 2001 15–37 17
Žduring the last 20–30 years Little and Smith, 1994; Vale and Harrison, 1994; Anon,.1997, 1999 might then have led to an increase in the abundance of fish in this estuary.
Such a situation would parallel that recorded in the Thames Estuary, in which, in thatcase, a marked improvement in oxygen concentrations in the 1960s and 1970s, was
Žaccompanied by a pronounced increase in fish abundance Andrews, 1984; Andrews and.Rickard, 1980 .
The species composition of the fish fauna in the Severn Estuary undergoes consistentcyclical annual changes, which is due in part to the sequential immigration andemigration of marine estuarine-opportunist species during autumn and early winterŽ .Potter et al., 1986, 1997 . Variations in the periods when the main fish species attainpeak abundance in other holarctic macrotidal estuaries indicate that the ichthyofaunal
Žcompositions in those estuaries undergo comparable cyclical changes e.g. McErlean et.al., 1973; Araujo et al., 1998; Maes et al., 1998 . However, the recruitment strengths of
the different marine estuarine-opportunist species in the Severn and other holarcticŽestuaries vary markedly between years Claridge et al., 1986; Elliott et al., 1990; Araujo
.et al., 1998 . In the case of the Severn Estuary, such variability may be due, in part, tointer-annual variations in environmental conditions, e.g. the water temperature andsalinity that prevail in the estuary at the time when recruitment typically occurs.
The present study was undertaken firstly to test the hypothesis that the markedimprovement that has occurred in the water quality of the Severn Estuary over the lasttwo to three decades will have been accompanied by an increase in the abundance of themain fish species and by a change in the species composition of the ichthyofauna. Wethus sampled the Severn Estuary in 1996–1999, using precisely the same methods asthose previously employed in 1972–1977, and then compared the data on the fishcommunity in these two periods. Since any intra-annual trends in the overall speciescomposition of the ichthyofauna of the Severn Estuary will reflect, to a large degree,those exhibited by the relative abundances of the most numerous species, we haveexamined whether such trends are also influenced by those of the suite of least abundantspecies. Emphasis was then placed on testing the hypothesis that the species composi-tions andror abundances of the different main components of the fish fauna, i.e. themarine estuarine opportunist, diadromous and freshwater species, will each exhibit aregular pattern of change during the year and thus collectively contribute to the cyclicalchanges in composition exhibited by the fauna as a whole throughout the year. Our nextaim was to test the hypothesis that, since the marine estuarine opportunist speciescomprise some species with a more northerly distribution and others with a moresoutherly distribution, the optimal temperature requirements for spawning will varyamongst those species and, as a consequence, the years of strong and weak recruitmentwill vary among those species. We have also tested the hypothesis that, since most ofthe marine estuarine-opportunistic species spawn in the spring and as temperature will
Ž .almost certainly influence their spawning times Lam, 1983 , the recruitment times ofthe species into the estuary may be correlated, i.e. if the recruitment of one speciesoccurs later than normal in a year, it will likewise be delayed in other species. Finally,we have determined whether the overall strength and timing of the recruitment of marineestuarine-opportunist species into the estuary are related to salinities and water tempera-tures in the estuary. To achieve the above aims regarding recruitment, we have

( )I.C. Potter et al.rJ. Exp. Mar. Biol. Ecol. 258 2001 15–3718
developed a new approach for establishing whether or not large sets of correlationsŽ .amongst times or strengths of recruitment internal correlations and between recruit-Ž .ment statistics and environmental variables cross-correlations are significant.
2. Materials and methods
2.1. Sampling regime
Fish were collected from the cooling water intake screens of the Oldbury PowerŽStation, which draws water from the inner Severn Estuary see Fig. 1 in Claridge et al.,
.1986 . Sampling was carried out weekly between early July 1972 and late June 1977Ž .see Claridge et al., 1986 and in at least 2 weeks in each month between January 1996and June 1999 except for in July and August 1998. The number of each species in eachsample, which represents the catch taken during the previous 24 h, was standardised to agiven volume of intake water, i.e. 2.2=109 l dayy1, the volume which, in 1972r1977,was typically drawn daily through the intake screens in the autumn and early winter, theperiod of the year when fish abundance was greatest. The numbers of each fish speciesin each of the four standardised samples in each month from July 1972 to June 1977were then summed, while those in each of the two or three standardised samplescollected in each month from January 1996 to June 1999 were summed and thenadjusted so that they corresponded to four samples per month and thus to the same
Ž .monthly sampling effort as in 1972r1977. The reader is referred to Potter et al. 1997for a comprehensive description of the sampling locality and regime, and to Claridge et
Ž .al. 1986 for a list of the common and scientific names of each species caught in theSevern Estuary.
Salinity was measured at the time of sampling, while water temperatures werederived from continuous recordings supplied by Power Station authorities. The mean ofeach of these variables in each month was then calculated. In our study, the emphasis, interms of the possible influence of variables, was placed on salinity and water tempera-ture because these two environmental variables are often regarded as having the greatest
Žeffect on the abundance of fish in estuaries e.g. Thiel et al., 1995; Marshall and Elliott,.1998 and each undergoes a marked change in the Severn Estuary during the year
Ž .Claridge et al., 1986 .
2.2. Comparisons between species compositions in 1972r1977 and 1996r1999
The mean numbers of each species in each sequential 2-month period, i.e. July–August, September–October, etc., for each year between July 1972 and June 1977 andbetween July 1996 and June 1998, were fourth-root transformed and ordinated, using the
Žmultidimensional scaling techniques in the PRIMER package Clarke and Warwick,.1994 . The fourth-root transformation ensures that the ordination reflects trends in the
abundance of all species, rather than simply those of the one or two species thatdominate the catch. Prior to ordination, the Bray–Curtis similarity measure was used toproduce the association matrix to determine whether each of the different components ofthe fish fauna contributed to the trends exhibited by the assemblage as a whole. The

( )I.C. Potter et al.rJ. Exp. Mar. Biol. Ecol. 258 2001 15–37 19
above ordination procedure was then adopted separately for the suite of least abundantspecies, i.e. those that contributed -10% to the total numbers of fish in all samples,and for the marine estuarine-opportunistic species to determine whether the compositionof each of these two categories undergoes cyclical changes each year.
Direct comparisons between the species composition in the period from July 1972 toJune 1977 with those from January 1996 to June 1999 are made difficult by theconsistent and progressive change undergone by the species composition during theyear. To ameliorate this problem, the mean abundances of each species were calculatedfor successive 2-month periods and then separated into two groups according to the timeof year, i.e. July to December and January to June. The mean abundances of all speciesand of both the marine estuarine opportunist species and least abundant species in eachbimonthly period in each 6-month period during each year of sampling in both decadeswere then fourth-root transformed and subjected to ordination as described earlier.
Ž .Two-way similarity percentages SIMPER 2 was employed to determine the speciesŽ .most responsible for any dissimilarities between decades Platell et al., 1998 .
2.3. Recruitment strengths and times of abundant marine species
Correlation analyses have been carried out on data for four ‘response variables’,namely the mean monthly abundances and months of peak abundance of eight majormarine estuarine-opportunist species in each of the 5 years between July 1972 and June1977, and the times between July 1 and when those mean monthly and peak abundancesof each of those species were attained. July 1 was chosen as a reference point becausethe new and strong 0qage class of the eight selected species had not yet started to enterthe estuary and as they each attained peak annual abundance at some time during theensuing 6 months. Note that the time to peak abundance is a single integer, denoting themonth in which the modal abundance is reached, and is likely to contain less detailedinformation than the continuous variable, time to mean monthly abundance. Note alsothat these correlation analyses did not include the sand goby and flounder, which arealso marine estuarine-opportunist species and numerous in the Severn Estuary, becausethe first species was shown during the study to comprise two morphologically very
Ž .similar species Webb, 1980 and the 0qage class of the second is relatively abundantŽ .in the estuary throughout the year Claridge et al., 1986; Hardisty and Badsha, 1986 .
In our analyses, we have avoided the type of ‘data snooping’ that involves selectingthose correlations which, in a wide range of pair-wise comparisons between theabundances of different species and various environmental variables, are significant atthe 5% level, and then using those results to draw biological conclusions. The latterprocedure is flawed because of the uncontrolled probability of a Type I error, i.e. thechance of deducing a significant result when there are no genuine correlations. Instead,we have calculated the complete set of pair-wise correlations for the selected eight majormarine fish species between 1972 and 1977 and performed a single test to determine ifthe set of correlations departs from that which would be expected by chance. For a
Ž .single response variable e.g. peak monthly abundance , the null hypothesis is that therewould be no correlation between any of the 28 pairs of species. The 28 correlations aretherefore ranked from largest negative to largest positive and plotted against their ranks,

( )I.C. Potter et al.rJ. Exp. Mar. Biol. Ecol. 258 2001 15–3720
producing a ‘correlation profile’. Since the number of years involved is small, somecorrelations might be expected to be close to 1.0 by chance alone, even under the nullhypothesis. Departure from the null is then more likely to be detected by a larger thanexpected number of moderately high correlations.
Ž . Ž .The correlation profile CPROF test performs m simulations here, ms1000 , foreach of which the values of the response variable across the 5 years are randomlypermuted, independently for each species. The resulting 1000 correlation profiles areaveraged to give a simulated mean profile, and a further 1000 random permutations ofthe data matrix are generated. The absolute difference of each new profile from thesimulated mean is recorded in a statistic D, and the departure of the real profile from thesimulated mean is then compared with this ‘null distribution’ of D, as in anyrandomisation test. The results are displayed by a plot of the real profile contrasted with
Žthe mean, upper and lower 5% profiles under the null hypothesis at any point, 5% of.the simulated curves lie above the upper bound, and 5% below the lower bound .
Ž .A related display is a ‘cross-correlation profile’ CCPROF , correlating every combi-Žnation of a species with an environmental variable here eight species and two.environmental variables, making 32 cross-correlations . A departure statistic D isc
defined in the same way as for D, except that the randomisations of the five yearlyŽ .values within each species and environmental variable are not performed indepen-
dently for each variable. More relevant to a null hypothesis of no cross-correlations is aconstrained permutation procedure in which a random permutation of the years is chosen
Ž .but applied to all species in the same way. Similarly, an independent randompermutation of the years is applied to all environmental variables, as a block, thecorrelation profile test proceeding as before. Here, there are only a limited number ofpermutations, and the null distribution is constructed from all possible permutationsrather than a random set of simulations.
In spite of the limited time period of this data set, these CPROF and CCPROFroutines therefore provide a rigorous test to determine whether there is any evidence ofcorrelation structure. Tests using this approach have clear advantages over a standardBonferroni procedure, in their power to detect a range of alternative hypotheses. Forexample, with few years, chance correlations close to 1.0 are possible and a Bonferroni
Ž .correction based essentially on the maximum observed correlation would never resultŽ .in rejection of the null, even in a case as here where departure from the null is
indicated by the presence of too many intermediate-sized positive correlations.
3. Results
3.1. Comparisons between the abundances of fish in 1972r1977 and 1996r1998
The number of fish species recorded annually in samples collected from the intakescreen of the Oldbury Power Station between July 1972 and June 1977 increasedprogressively from 42 in 1972r1973 to 48 in 1973r1974 to 53 in 1974r1975 and then
Ž .to 62 and 63 in 1975r1976 and 1976r1977, respectively Claridge et al., 1986 .Although the 50 and 49 species recorded at Oldbury in July–June of 1996r1997 and

( )I.C. Potter et al.rJ. Exp. Mar. Biol. Ecol. 258 2001 15–37 21
1997r1998, respectively, lie within the range for the above years, it must be borne inmind that the number of 24-h samples collected monthly in 1996r1998 were less than in
Ž .1972r1977, i.e. 2 or 3 vs. 4 see Section 2 . The only species that was recorded inŽ1996r1999 and not in 1972r1977 was the zander or pike perch Stizostedion luciop-
.erca . This teleost, which is a valuable freshwater sporting fish and native to easternEurope, has been introduced into open waterways in England at intervals since the late
Ž .1800s Wheeler, 1969 and, from the results of the present study, has now establisheditself in the catchment of the River Severn.
The total number of fish, after standardising the abundances to a constant intakeŽ .volume for each sample and to four samples per month see Section 2 , rose progres-
sively and by ca. 5.3 times from 8740 fish in 1972r1973 to 45,987 in 1975r1976 andŽ .remained at more than 40,000 fish in 1976r1977 Claridge et al., 1986 . The mean
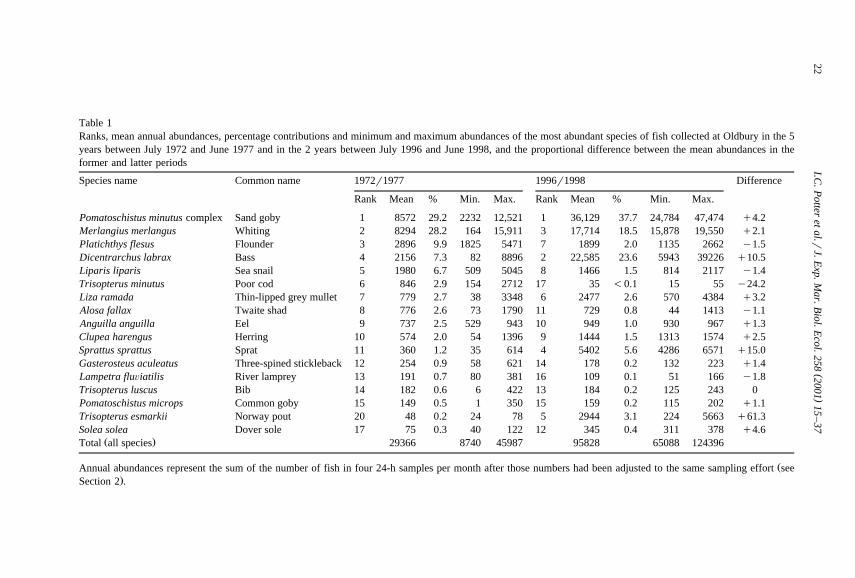
annual number of fish in 1972r1977, i.e. 29,366, is far lower than the mean annualŽ .number for 1996r1998, i.e. 95,828 Table 1 . Furthermore, the two annual values for
the latter period are over 1.4 and 2.7 times greater, respectively, than even the maximumŽ .annual values recorded during the 5 years in the 1970s Table 1 . Moreover, the
minimum number of fish recorded for the January to June periods in the 4 years in the1990s for which there are data, i.e. 1996–1999, exceeded the maximum recorded duringthe same period in any of the 5 years in the middle 1970s.
The greater number of fish caught per annum in the 1996r1998 than 1972r1977periods can be attributed largely to far higher catches of sand goby, whiting, bass,
Ž .thin-lipped grey mullet, herring, sprat, Norway pout and Dover sole Table 1 . Indeed,the annual numbers of each of these species were between 2.1 and 61.3 times greater in1996r1998 than in 1972r1977 and, in the case of sand goby, sprat and Norway pout,the least of the two annual catches in 1996r1998 was greater than the maximum annualcatch recorded in 1972r1977. In contrast to the situation with the above six species, themean annual abundances of poor cod, River lamprey and flounder were lower in1996r1998 than 1972r1977, the differences corresponding to factors of 24.2, 1.8 and1.5, respectively, while those of sea snail, twaite shad, eel, three-spined stickleback, biband common goby differed by factors of less than 1.5 times between the two decadesŽ .Table 1 .
In terms of their relative abundance, bass increased in rank from 4 to 2, sprat from 11to 4, Dover sole from 17 to 12 and Norway pout from 20 to 5, while flounder declinedfrom 3 to 7, sea snail from 5 to 8, poor cod from 6 to 17 and twaite shad from 8 to 11Ž .Table 1 . The rankings of species such as sand goby, whiting, thin-lipped grey mullet,eel, herring, bib and common goby remained either the same or differed by only onebetween the two decades. In terms of percentage contributions to the total catch, themean overall values for sand goby, bass, sprat and Norway pout were appreciablygreater in 1996r1998 than in 1972r1977, whereas the reverse was true for whiting,
Ž .flounder, sea snail and poor cod Table 1 .
3.2. Comparisons between the species compositions in 1972r1977 and 1996r1998
When the mean of the transformed abundances of each fish species in the samplesobtained for each bimonthly period between July and June in each of the 5 years
()
I.C.P
otteret
al.rJ.E
xp.Mar.B
iol.Ecol.258
200115
–37
22
Table 1Ranks, mean annual abundances, percentage contributions and minimum and maximum abundances of the most abundant species of fish collected at Oldbury in the 5years between July 1972 and June 1977 and in the 2 years between July 1996 and June 1998, and the proportional difference between the mean abundances in theformer and latter periods
Species name Common name 1972r1977 1996r1998 Difference
Rank Mean % Min. Max. Rank Mean % Min. Max.
Pomatoschistus minutus complex Sand goby 1 8572 29.2 2232 12,521 1 36,129 37.7 24,784 47,474 q4.2Merlangius merlangus Whiting 2 8294 28.2 164 15,911 3 17,714 18.5 15,878 19,550 q2.1Platichthys flesus Flounder 3 2896 9.9 1825 5471 7 1899 2.0 1135 2662 y1.5Dicentrarchus labrax Bass 4 2156 7.3 82 8896 2 22,585 23.6 5943 39226 q10.5Liparis liparis Sea snail 5 1980 6.7 509 5045 8 1466 1.5 814 2117 y1.4Trisopterus minutus Poor cod 6 846 2.9 154 2712 17 35 -0.1 15 55 y24.2Liza ramada Thin-lipped grey mullet 7 779 2.7 38 3348 6 2477 2.6 570 4384 q3.2Alosa fallax Twaite shad 8 776 2.6 73 1790 11 729 0.8 44 1413 y1.1Anguilla anguilla Eel 9 737 2.5 529 943 10 949 1.0 930 967 q1.3Clupea harengus Herring 10 574 2.0 54 1396 9 1444 1.5 1313 1574 q2.5Sprattus sprattus Sprat 11 360 1.2 35 614 4 5402 5.6 4286 6571 q15.0Gasterosteus aculeatus Three-spined stickleback 12 254 0.9 58 621 14 178 0.2 132 223 q1.4Lampetra fluÕiatilis River lamprey 13 191 0.7 80 381 16 109 0.1 51 166 y1.8Trisopterus luscus Bib 14 182 0.6 6 422 13 184 0.2 125 243 0Pomatoschistus microps Common goby 15 149 0.5 1 350 15 159 0.2 115 202 q1.1Trisopterus esmarkii Norway pout 20 48 0.2 24 78 5 2944 3.1 224 5663 q61.3Solea solea Dover sole 17 75 0.3 40 122 12 345 0.4 311 378 q4.6
Ž .Total all species 29366 8740 45987 95828 65088 124396
ŽAnnual abundances represent the sum of the number of fish in four 24-h samples per month after those numbers had been adjusted to the same sampling effort see.Section 2 .

( )I.C. Potter et al.rJ. Exp. Mar. Biol. Ecol. 258 2001 15–37 23
between July 1972 and June 1977 and between July 1996 and June 1998 were subjectedto ordination, the points for the bimonthly data in both decades pursued a similar
Ž .consistent and very pronounced anticlockwise direction on the ordination plot Fig. 1a .However, the points for each bimonthly period in the 1970s lay to the left of those foreach of the corresponding bimonthly periods in the 1990s. When the bimonthly data forthe numbers of the least abundant species, i.e. those that never contributed more than10% to the total numbers of fish in any bimonthly period, were similarly pooled andsubjected to ordination, the points for these data in both periods also each followed thesame pronounced cyclical pattern of change and those for the 1970s also lay to the left
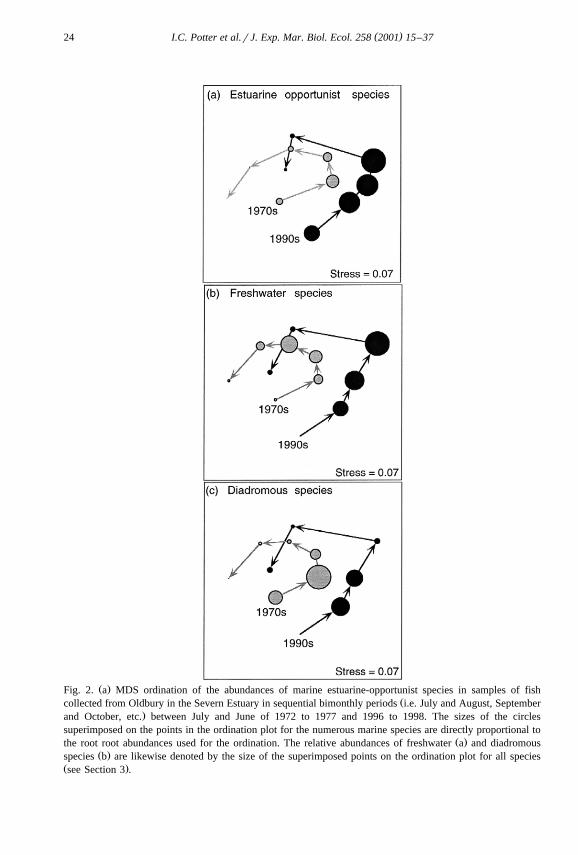
Ž .of those for the corresponding bimonthly periods in the 1990s Fig. 1b .The points for the samples of the marine estuarine-opportunist species followed very
similar trends to those for the whole fish fauna in the corresponding periods in bothŽ .decades cf. Figs. 1a and 2a . The superimposition of the relative abundances of marine
Ž . Ž . Ž .Fig. 1. Non-metric multidimensional scaling MDS ordination of the abundances of a all species and b thesuite of least abundant species in samples of fish collected from Oldbury in the Severn Estuary in sequential
Ž .bimonthly periods i.e. July and August, September and October, etc. between July and June of 1972 to 1977and 1996 to 1998. N.B. In this figure and in Fig. 2, data for each of the corresponding bimonthly periods ineach decade have been pooled.
( )I.C. Potter et al.rJ. Exp. Mar. Biol. Ecol. 258 2001 15–3724
Ž .Fig. 2. a MDS ordination of the abundances of marine estuarine-opportunist species in samples of fishŽcollected from Oldbury in the Severn Estuary in sequential bimonthly periods i.e. July and August, September
.and October, etc. between July and June of 1972 to 1977 and 1996 to 1998. The sizes of the circlessuperimposed on the points in the ordination plot for the numerous marine species are directly proportional to
Ž .the root root abundances used for the ordination. The relative abundances of freshwater a and diadromousŽ .species b are likewise denoted by the size of the superimposed points on the ordination plot for all species
Ž .see Section 3 .

( )I.C. Potter et al.rJ. Exp. Mar. Biol. Ecol. 258 2001 15–37 25
estuarine-opportunists on this ordination plot demonstrate that in 1972r1977 the relativeoverall abundance of this category increased progressively between JulyrAugust and
ŽSeptemberrOctober, reflecting the influx of large numbers of their juveniles Claridge et. Ž .al., 1986 , and then declined progressively in the subsequent 6 months Fig. 2a . While
the trends were similar in 1996r1998, the abundances in this year were greater andpeaked slightly later. The relatively greater abundance of estuarine-opportunists in theSeptember to December period of 1996r1998 than of 1972r1977 was mainly due to theimmigration of far greater numbers of species such as the sand goby, whiting, bass andthin-lipped grey mullet.
Since the freshwater and diadromous categories were often represented in samples byonly a small number of species and, on occasions, were not even caught, it wasinappropriate to subject the abundances of the species in these two categories toordination. However, the superimposition of the relative abundance of freshwaterspecies on the ordination plot for all species in 1972r1977 and 1996r1998 showed that,in both decades, the overall numbers of this category increased progressively betweenJulyrAugust and either JanuaryrFebruary or NovemberrDecember, when freshwaterdischarge was increasing and salinities were thus decreasing, and that they subsequentlydeclined progressively in MarchrApril and MayrJune, as freshwater discharge de-
Ž .creased and salinity increased Figs. 2b and 4 . Furthermore, superimposition of therelative abundance of diadromous species on the ordination plot for all species demon-strated that the relative abundances of these species followed similar trends in the twoperiods, peaking in SeptemberrOctober or NovemberrDecember, and then declining
Ž .progressively during the subsequent bimonthly periods Fig. 2c .When the abundances for all species in each bimonthly period between July and
December of each year were subjected to ordination, the three bimonthly points for that6 months in both decades followed a similar sequential progression from left to right
Ž .across the ordination plot Fig. 3a . However, all of the points for each of the bimonthlyperiods in 1996, 1997 and 1998 lay below andror to the right of those for each of thecorresponding bimonthly periods in each of the 5 years from 1972r1973 to 1976r1977Ž .Fig. 3a . The above trends were paralleled by those for the bimonthly periods inJanuary to June in both of these decades, except that, in this case, the points for the
Ž .1990s lay below andror to the left of those for the 1970s Fig. 3d . The abovedifferences between the locations of the points on the ordination plots for the whole fishfauna in the bimonthly periods in both July to December and January to June in1972r1977 and 1996r1999 were largely mirrored by those for both the marine
Ž .estuarine-opportunist species Fig. 3b,e and the least abundant species during the sameŽ .time periods Fig. 3c,f .
SIMPER 2 demonstrated that the fish fauna in July to December in 1996–1998 wasdistinguished from that of the corresponding 6 months in 1972 to 1976 by relativelygreater abundances of bass, sand goby, whiting, herring, thin-lipped grey mullet, codand sand smelt. In the January to June period, the samples in 1996 to 1999 containedrelatively greater numbers of bass, whiting, herring, conger eel and thin-lipped greymullet and relatively lower abundances of poor cod and flounder. In the case of the leastabundant species, July to December in 1996 to 1998 was characterised by relativelygreater contributions of carp, lumpsucker, scaldfish and mackerel. Between January and

( )I.C. Potter et al.rJ. Exp. Mar. Biol. Ecol. 258 2001 15–3726
Fig. 3. MDS ordination of the abundances of all species, marine estuarine-opportunist species and the leastabundant species in samples of fish collected from Oldbury in the Severn Estuary in sequential bimonthly
Ž .periods between July and December in 1972 to 1977 and 1996 to 1998 a–c and between January and JuneŽ .d–f in 1972–1977 and 1996–1999.

( )I.C. Potter et al.rJ. Exp. Mar. Biol. Ecol. 258 2001 15–37 27
June, the 1972 to 1977 years were characterised by relatively greater contributions ofcod, haddock and sea lamprey, whereas the 1996 to 1999 years were characterised bygreater contributions of scaldfish, roach and five-bearded rockling.
3.3. Annual recruitment strengths of main species in 1972r1977
The years between July 1972 and June 1977 in which the abundances of the eightŽmost numerous marine estuarine-opportunist fish species but excluding the sand goby
.complex and flounder—for rationale see Section 2 attained their monthly maxima wereŽ .not always the same Fig. 4 . Thus, maxima were attained by sprat and herring in
1973r1974, by bib and sea snail in 1974r1975, by poor cod in 1975r1976, and bybass, whiting and thin-lipped grey mullet in 1976r1977. The maximum monthlyabundances of the above eight species in any year ranged from 244 for bib in September
Ž .1974 to 5718 for whiting in October 1976r1977 Fig. 4 . The peak annual values for theabundance of whiting rose progressively in each of the 5 years of the study, whereas thatof sprat declined progressively between 1973r1974 and 1976r1977. However, suchsequential trends were not observed with any of the other six marine estuarine-op-portunist species. The maximum and minimum annual peak abundances over the 5 yearsdiffered by a factor of between about 10 and 18 times in the cases of sea snail, poor codand sprat, and by between approximately 70 and 110 times with whiting, bass,
Ž .thin-lipped grey mullet and herring Table 1 .
3.4. Correlations among the recruitment patterns of species and enÕironmental Õari-ables
Correlation profile analysis demonstrated that, during the 5 years between July 1972and June 1977, the mean monthly abundances of sprat, herring, bass, poor cod, bib,
Ž .whiting, thin-lipped grey mullet and sea snail were not correlated ps0.59 . This pointŽ .is emphasised by the fact that the departure statistic D was only 0.08 and that the
ArealB correlation profile is close to the Asimulated meanB profile and, throughout itsrange, is positioned below the upper boundary of the profile for the 95% confidence
Ž .bound Fig. 5a . The above lack of correlation was paralleled by the situation with thepeak monthly abundances of the above eight species over the 5-year period, for which
Ž .the departure statistic was even smaller Ds0.05 and ps0.95, data not presented . InŽ .contrast, there was a significant relationship p-0.01 between the time of mean
monthly abundance amongst the eight species over the 5 years. The departure value wasŽ .relatively high Ds0.33 and the real correlation profile is typically positioned above
Ž . Ž .the upper 95% bound Fig. 5b . Furthermore, the times to modal peak abundance forŽ .those species were also strongly correlated Ds0.29, p-0.01, data not presented .
Note that with this direct interpretation of D, when all observed correlations are greaterthan expected, the average correlation from this set is 0.29 higher than would be
Ž .expected by chance i.e. approximately zero when there are no genuine associations.The above results imply that when, in any given year, one species takes a longer orshorter than normal time to reach their mean monthly and peak values in abundance,

( )I.C. Potter et al.rJ. Exp. Mar. Biol. Ecol. 258 2001 15–3728
Fig. 4. Monthly numbers of eight marine estuarine-opportunist species of fish at Oldbury in the Severn Estuaryin each month between July 1972 and June 1997, based on the sum of four 24-h samples per month. Mean
Ž . Ž .monthly salinities continuous line and water temperatures discontinuous line are also shown.

( )I.C. Potter et al.rJ. Exp. Mar. Biol. Ecol. 258 2001 15–37 29
Ž . Ž .Fig. 5. Correlation profile analyses for mean monthly abundances a and c and times from July 1 to meanŽ . Ž . Ž . Ž .monthly abundance b and d . a and b represent all pairwise correlations between the eight species
Ž . Ž .investigated and c and d the cross-correlations between the eight species and the four environmentalŽ .variables salinity and water temperature in both JulyrAugust and SeptemberrOctober . The continuous line
Ždenotes real correlations, ranked from smallest to largest, contrasted with the mean simulated profile broken.line under the null hypothesis of absence of genuine correlations. The dashed lines indicate upper and lower
Ž .bounds for a single simulated profile see text .
other species will likewise take a longer or shorter time, respectively, to achieve thosevalues.
Having established that the time of peak abundance of the eight species is positivelycorrelated, it becomes legitimate to explore in detail which species pairs are most closelyassociated in this respect. The maximum correlation coefficients were between bass,poor cod, bib and whiting, with three of these six inter-correlations being in excess of
Ž0.85. Sprat is also positively associated within the members of this group correlations. Ž .from 0.55 to 0.81 and with herring 0.81 . These inter-relationships in year-to-year
fluctuations in the timing of recruitment can again be summarised by clustering andordination. The appropriate dissimilarity matrix is not now Bray–Curtis but the nor-
Ž .malised Euclidean distance Clarke and Warwick, 1994 , leading to the non-metric MDSplot shown in Fig. 6. The interpretation here is that species that lie close together on theplot have matching year-to-year fluctuations in their recruitment times. The analysis

( )I.C. Potter et al.rJ. Exp. Mar. Biol. Ecol. 258 2001 15–3730
Fig. 6. MDS configuration for the eight species used in correlation profile analysis, based on time to meanmonthly abundance for the 5 years 1972r77 and using normalised Euclidean distance as the dissimilaritymeasure.
removes any direct effect of differences between each pair of species in their averagetime of mean abundance, by examining only whether departures from the averagerecruitment times are of the same magnitude and direction over the 5 years. Nonetheless,the MDS plot in Fig. 6 shows that the species whose recruitment fluctuations are most
Ž .highly correlated are those whose average times of mean or peak monthly abundancesŽ .are similar cf. Figs. 4 and 6 . Thus, bass, whiting, bib and poor cod, which tend to
reach peak abundance in September and October, form a group in the bottom left handof the plot below and, in three cases, also to the right of those of herring and sprat,whose abundances peak earlier, i.e. August or September, and below and to the left ofthose of thin-lipped grey mullet and sea snail, which attain their peak abundances later,
Ž .i.e. November–January Fig. 6 .Having determined that there were significant relationships in the timing of recruit-
ment, it was then appropriate to examine whether they had a simple association withyear-to-year fluctuations in salinity and temperature within the estuary. When therecruitment strengths and times were cross-correlated with the mean values for salinityand water temperature in the estuary in both JulyrAugust and SeptemberrOctober,
Ž .neither the mean monthly abundances ps0.38 nor the times to mean monthlyŽ .abundance ps0.69 were correlated with these environmental variables. This point is

( )I.C. Potter et al.rJ. Exp. Mar. Biol. Ecol. 258 2001 15–37 31
illustrated by the fact that the real correlation profile for the mean abundance and thetime to mean abundance was located close to the corresponding simulated mean profileŽ . Ž .Ds0.14 and 0.11, respectively and below the upper 95% bound Fig. 5c and d . Theabove result was mirrored by the peak monthly abundances, and the times to peak
Ž .abundance Ds0.10, ps0.55 and Ds0.05, ps0.99, respectively . Furthermore,essentially the same results were obtained when salinity and water temperature weretreated separately. The cross-correlation profile analysis indicates that there were nosuch correlations, over and beyond those that would be expected by chance.
4. Discussion
4.1. Long-term changes in species abundance and composition
The results of the present study demonstrate that, on the basis of the same samplingregime, the abundance of fish at Oldbury in the Severn Estuary increased markedlybetween July 1972–June 1977 and January 1996–July 1999. The substantial increase infish abundance in the 1990s reflected, in particular, marked increases in the numbers ofsand goby, whiting, bass, thin-lipped grey mullet, herring, sprat and Norway pout.Amongst these seven species, the Severn Estuary is located towards the northern limit ofthe distribution of bass and thin-lipped grey mullet and towards the southern limit of
ŽNorway pout and well within the main body of the range of the other species Wheeler,.1969 .
The increases in the numbers of the above major contributors to the ichthyofauna ofthe Severn Estuary provide strong circumstantial evidence that conditions for successfulspawning, larval survival andror recruitment of these marine estuarine-opportunistspecies have improved over the last two to three decades. Although the conditions forspawning in the Bristol Channel may have improved during this period, any changes inthat vast water body are likely to have been much less pronounced than in the far morerestricted confines of the Severn Estuary, into which particularly large volumes of
Ž .industrial and domestic waste used to be discharged Martin et al., 1997; Anon, 1999 .Certainly, it is now well established that the imposition of much stricter regulations onthe discharge of heavy metals and organic waste has resulted in a marked improvement
Žin the water quality of this estuary over the last two to three decades Little and Smith,.1994; Vale and Harrison, 1994; Anon, 1997, 1999; Martin et al., 1997 . The fact that the
Ž .overall abundance of fish rose during the 1970s Claridge et al., 1986 suggests that thefish fauna had already begun to respond to the improvement that was occurring inenvironmental conditions during that period.
The increase in overall abundance of fish in the Severn Estuary during the last 20–30years parallels that recorded in the Thames Estuary between the 1960s and 1970sŽ . ŽThomas, 1998 . In the case of the Thames Estuary, the increases in the abundance and
.also diversity of fish was attributable, in particular, to an improvement in the levels ofŽ .dissolved oxygen, as a result of a marked reduction in sewage effluent Thomas, 1998 .
However, since the Severn Estuary has always been well mixed, and thus wellŽ .oxygenated, the causal factor s that led to an increase in fish abundance in this estuary

( )I.C. Potter et al.rJ. Exp. Mar. Biol. Ecol. 258 2001 15–3732
are unlikely to have been the same as in the Thames Estuary. It thus seems relevant thatdischarges of industrial effluents, including cadmium, a particularly toxic element, have
Ždeclined markedly in the Severn Estuary during the last 20–30 years Little and Smith,.1994; Vale and Harrison, 1994; Anon, 1997, 1999; Martin et al., 1997 . The increases in
fish abundance in the Severn Estuary during these years may therefore, at least partly,have resulted from fish no longer being exposed to exceptionally high levels ofdeleterious contaminants and which previously would have been likely to have hadsublethal effects and thereby reduced the ‘fitness’ of members of the fish assemblage.
Although the abundance of the seven species mentioned earlier increased markedlybetween 1972r1977 and 1996r1998, those of flounder and sea snail, which are alsorelatively abundant in the Severn Estuary, underwent modest declines of 1.5 and 1.4times, respectively, while that of poor cod decreased dramatically. Thus, although themajor species in the ichthyofauna of the Severn Estuary were almost invariably the samein 1996r1999 as in 1972r1977, the relative contributions of the various specieschanged between these two decades. This strong implication that the composition of thefish fauna changed between the 1970s and 1990s is supported by the fact that, on theordination plot that utilise the abundance data for each corresponding bimonthly periodin each decade, the points for the years 1996r1998 lay to the right of those for the years
Ž .1972r1977 Fig. 1a . This accounts for the fact that, when the data for the total fishfauna in each bimonthly period in each July to December period of 1996–1998 and ineach January to June period in 1996 to 1999 were treated individually, the points for the
Ž .two decades on the ordination plot were discrete Fig. 3a,d . The fact that the trendsexhibited by the marine estuarine-opportunists paralleled closely those of the total faunaŽ .cf. Figs. 3a,b,d,e and 2a emphasises the important contribution made by these marinespecies to the ichthyofauna of the Severn Estuary. However, since similar results were
Žproduced by ordination, when the data were restricted to the less abundant species Figs..1b and 3c,f , the shift in the composition of even these species also contributed to the
overall change in species composition between the 1970s and 1990s.While the abundance of poor cod declined dramatically between the 1970s and
1990s, the congeneric and behaviourally similar Norway pout underwent the greatestrelative increase in abundance of all species in the second decade. The decline inflounder in the Severn Estuary parallels that recorded in the Thames Estuary, in which
Ž .the decline was attributed to increased predation of the 0qyear class Thomas, 1998 .The decline in the numbers of the River lamprey is consistent with reports that, in UK,
Žthe abundance of this anadromous species has been declining for several years e.g..Maitland and Lyle, 1990 and which, as a consequence, has led to it being listed in the
1996 IUCN Red List of threatened animals compiled by the World ConservationMonitoring Centre. The decline in the abundance of the River lamprey is presumablydue to the impediments posed to the upstream migration of the adults by the construc-tion of weirs and dams andror to deleterious changes to the silt habitats of the larvae.
4.2. Seasonal cycling in species composition
Our data show that, during both the 1970s and 1990s, the compositions of the suitesof both the marine estuarine-opportunist and less abundant species each exhibited the

( )I.C. Potter et al.rJ. Exp. Mar. Biol. Ecol. 258 2001 15–37 33
same type of pronounced annual cyclical changes in the Severn Estuary. Furthermore,the overall abundances of both the freshwater and diadromous categories also underwenta pronounced cyclical change during the year. In the case of the marine estuarine-op-portunist species, the overall abundance and prevalence were typically highest in autumnand early winter, when the new 0q recruits of marine estuarine-opportunists typicallyenter the estuary. Freshwater species were either absent or in very low numbers insummer and early autumn, when salinities were at their highest, and relatively higher inwinter, when salinities were at their lowest, while diadromous species were mostabundant during autumn. However, it should be recognised that the different specieswithin each life cycle category often attain peak abundances at rather different times.This accounts for the highly consistent and regular pattern of change that is undergonethroughout the year by the overall composition of the ichthyofauna. Our data thus nowdemonstrate that the cyclical change undergone annually by the composition of the fishcommunity of the Severn Estuary reflects the cumulative effect of the time-staggeredand usually unimodal abundance patterns exhibited by the various species within eachlife cycle category.
4.3. The strengths and timing of recruitment of marine species
The use of correlation profile analyses has shown that there was no significantintercorrelation between the annual trends in the relative abundances of eight numerousmarine estuarine-opportunist species in the inner Severn Estuary. These results areconsistent with the observation that, although the abundances of groups of two or threespecies sometimes exhibited their annual maxima in the same year, the trends exhibitedannually by the peak abundance of any one species during the five years were not
Ž .necessarily paralleled by those of any other species Fig. 4 . Furthermore, cross-correla-tion profile analyses demonstrated that the recruitment strengths of those eight specieswere related neither to the salinity nor the water temperature in the inner Severn Estuary,nor to a combination of these variables. Our confidence that the types of tests we havedeveloped were sufficiently sensitive to reveal significant correlations is supported bythe ability of these tests to reveal significant correlations between the timing of theimmigrations of different species in the different years, even though such interannualvariations were only of the order of 2–3 weeks.
The results of the tests employed in this study suggest that it is inappropriate toconclude that, in any given year, a strong recruitment by two or more of the eightspecies into the inner Severn Estuary is due to anything other than chance. In otherwords, the factors that lead to the strong recruitment of one species into that region arenot necessarily the same as those that would result in the strong recruitment of anotherspecies in the same year. Indeed, there were numerous examples in which two specieswere very abundant in a year, and yet in other years, one of those species was abundantwhilst the other was poorly represented. For example, the maximum monthly abun-dances of whiting in the inner Severn Estuary in 1974r1975, 1975r1976 and 1976r1977were very high, ranging from 4160 to 5178 fish, whereas those of thin-lipped greymullet, while also relatively high for that species in 1976r1977, i.e. 1054 fish, werevery low in 1974r1975 and 1975r1976, i.e. 13 and 32 fish respectively. It is therefore

( )I.C. Potter et al.rJ. Exp. Mar. Biol. Ecol. 258 2001 15–3734
not surprising that the level of recruitment of those marine species into their estuarinenursery areas reflects neither the salinity nor water temperature in those waters.However, the relative abundances of certain fish species do change along the length ofthe estuary, presumably in response, at least in part, to the presence of a salinity gradientŽ .Henderson, 1989; Elliott et al., 1990; Marshall and Elliott, 1998 .
In contrast to the non-significant correlations found between the mean or peakabundances of the eight marine estuarine-opportunist species over the 5 years, thecorrelation profile analysis provides clear evidence that the timing of the recruitment ofthose species was associated. Thus, for time to both mean abundance and peakabundance, the correlations between species are, on average, 0.3 higher than would beexpected by chance and the data in Fig. 5b show that at least half of the correlationsexceed those that would be expected from the null hypothesis. Note also that there is noexcess of negative correlations, implying that a shift in the timing of recruitment of onemarine species into its estuarine nursery habitat was accompanied by a shift in the samedirection in the timing of the recruitment of the other species into the same region, andthat such shifts were most highly correlated in the case of species that tended to enterthe estuary at a similar time of the year. This latter finding is consistent with the fact thatthe timing of movements into the estuary are more likely to be linked to a commoninfluence outside the estuary, when that recruitment takes place during similar ratherthan different periods. However, shifts in the time of mean and peak abundances ofthose species were correlated neither with the salinity nor water temperature within theestuary nor with a combination of those two variables.
From the above, it follows that the recruitment times of the 0qage class of thesemarine species are more likely to be influenced by environmental conditions outsidethan inside the Severn Estuary. Since there is strong circumstantial evidence that mostmarine estuarine-opportunist species spawn in the nearby Bristol Channel into which the
Ž .Severn Estuary discharges Russell, 1980; Claridge et al., 1986 , the timing of therecruitment of these species into their estuarine nursery area is likely to be influenced byvariations in environmental conditions in the spawning area and their effect on spawningtime, andror by annual fluctuations in the characteristics of the currents that transporttheir larvae and juveniles towards the estuary.
Although the use of internal and cross-correlations failed to detect significantrelationships between either the annual abundances of different marine species in theinner Severn Estuary or between those abundances and either salinity or water tempera-ture in that region, the interannual variations in abundances of certain species in a regionjust outside the Severn Estuary have been found to be significantly correlated with
Ženvironmental variables e.g. Henderson and Holmes, 1991; Henderson and Seaby,.1994 . While such correlations may sometimes be biologically valid, it must be borne in
mind that attempts to correlate the individual abundances of each of a suite of fishspecies with a number of environmental variables will be likely to produce somecorrelations that are significant purely by chance. There thus appears to be a strong casein such studies to use initially the global tests of internal and cross-correlations,developed during the present study, to determine whether it is subsequently justifiable toexplore individual correlations. Correlation profile analyses would thus act in the sameway as F tests in the analysis of variance, by providing a ‘red light’ to further analyses

( )I.C. Potter et al.rJ. Exp. Mar. Biol. Ecol. 258 2001 15–37 35
and interpretation when the global hypothesis of an absence of correlation structure isnot rejected. Of course, it should not be overlooked that, where feasible, a more reliableway to avoid the dangers of ‘data snooping’ is to design the collection of data andexperimentation around tightly defined hypotheses involving specified variables. Withthis approach, only a very few hypothesis tests need to be performed.
Acknowledgements
Our gratitude is expressed to R.J. Huggins, R.A. Milne, J. Knight, D.C. Gardner, D.Molesworth, J.R. Rotchell and numerous undergraduate students for help with sampling.
[ ]Financial support was provided by the Leverhulme Trust. AU
References
Abou-Seedo, F.S., Potter, I.C., 1979. The estuarine phase in the spawning run of the river lamprey LampetraŽ .fluÕiatilis. J. Zool. London 188, 5–25.
Andrews, M.J., 1984. Thames Estuary: pollution and recovery. In: Sheehan, P.J., Miller, D.R., Butler, G.C.,Ž .Bourdeau, P.H. Eds. , Effects of Pollutants at the Ecosystem Level. Wiley, London, pp. 195–227.
Andrews, M.J., Rickard, D.G., 1980. Rehabilitation of the inner Thames Estuary. Mar. Pollut. Bull. 11,327–332.
Anon, 1997. Severn Estuary. Joint Issues Report of the Severn Estuary Strategy: University of Wales, Cardiff.Anon, 1999. Industry in Avonmouth. A public guide to pollution management. Environment Agency, Bristol.Araujo, F.G., Bailey, R.G., Williams, W.P., 1998. Seasonal and between-year variations of fish populations in
the middle Thames Estuary: 1980–1989. Fish. Manage. Ecol. 5, 1–21.Badsha, K.S., Sainsbury, M., 1978. Some aspects of the biology and heavy metal accumulation of the fish
Liparis liparis in the Severn Estuary. Estuarine Coastal Mar. Sci. 7, 381–391.Claridge, P.N., Gardner, D.C., 1977. The biology of the northern rockling, Ciliata septentrionalis, in the
Severn Estuary and Bristol Channel. J. Mar. Biol. Assoc. U.K. 57, 839–848.Ž .Claridge, P.N., Gardner, D.C., 1978. Growth and movements of the twaite shad, Alosa fallax Lacepede , in´ `
the Severn Estuary. J. Fish Biol. 12, 203–211.Claridge, P.N., Potter, I.C., 1983. Movements, abundance, age composition and growth of bass, Dicentrarchus
labrax, in the Severn Estuary and inner Bristol Channel. J. Mar. Biol. Assoc. U.K. 63, 871–879.Ž .Claridge, P.N., Potter, I.C., 1984. Abundance, movements and size of gadoids Teleostei in the Severn
Estuary. J. Mar. Biol. Assoc. U.K. 64, 771–790.Claridge, P.N., Potter, I.C., 1985. Distribution, abundance and size composition of mullet populations in the
Severn Estuary and Bristol Channel. J. Mar. Biol. Assoc. U.K. 65, 325–335.Claridge, P.N., Potter, I.C., 1987. Size composition and seasonal changes in abundance of juvenile sole, Solea
solea, in the Severn Estuary and Inner Bristol Channel. J. Mar. Biol. Assoc. U.K. 67, 561–569.Claridge, P.N., Potter, I.C., 1994. Abundance, seasonality and size of Atlantic salmon smolts entrained on
power station intake screens in the Severn Estuary. J. Mar. Biol. Assoc. U.K. 74, 527–534.Claridge, P.N., Hardisty, M.W., Potter, I.C., Williams, C.V., 1985. Abundance, life history and ligulosis in the
Ž .gobies Teleostei of the Inner Severn Estuary. J. Mar. Biol. Assoc. U.K. 65, 951–968.Claridge, P.N., Potter, I.C., Hardisty, M.W., 1986. Seasonal changes in movements, abundance, size
composition and diversity of the fish fauna of the Severn Estuary. J. Mar. Biol. Assoc. U.K. 66, 229–258.Clarke, K.R., Warwick, R.M., 1994. Change in Marine Communities. An Approach to Statistical Analysis and
Interpretation. Plymouth Marine Laboratory, Plymouth, 144 pp.Ž .Dando, P.R., 1984. Reproduction in estuarine fish. In: Potts, G.W., Wootton, R.J. Eds. , Fish Reproduction:
Strategies and Tactics. Academic Press, London, pp. 155–170.

( )I.C. Potter et al.rJ. Exp. Mar. Biol. Ecol. 258 2001 15–3736
Elliott, M., Dewailly, F., 1995. The structure and components of European fish assemblages. Neth. J. Aquat.Ecol. 29, 397–417.
Elliott, M., O’Reilly, M.G., Taylor, C.J.L., 1990. The Forth Estuary: a nursery and overwintering area forNorth Sea fishes. Hydrobiologia 195, 89–103.
Gunter, G., 1961. Some relations of estuarine organisms to salinity. Limnol. Oceanogr. 6, 182–190.Ž .Haedrich, R.L., 1983. Estuarine fishes. In: Ketchum, B.H. Ed. , Ecosystems of the World 26. Estuaries and
enclosed seas. Elsevier, Amsterdam, pp. 183–207.Hardisty, M.W., Badsha, K.S., 1986. Seasonal abundance, growth, feeding and age composition of flounder
Ž Ž ..Platichthys flesus L. populations of the Severn Estuary and Bristol Channel. Intern. J. Environ. Stud.27, 89–114.
Henderson, P.A., 1989. On the structure of the inshore fish community of England and Wales. J. Mar. Biol.Assoc. U.K. 69, 145–163.
Henderson, P.A., Holmes, R.H.A., 1991. On the population dynamics of dab, sole and flounder withinBridgewater Bay in the lower Severn Estuary, England. Neth. J. Sea Res. 27, 337–344.
Henderson, P.A., Seaby, R.M.H., 1994. On the factors influencing juvenile flatfish abundance in the lowerSevern Estuary, England. Neth. J. Sea Res. 32, 321–330.
Kennish, M.J., 1990. Ecology of estuaries. Biological Aspects vol. 2. CRC Press, Boca Raton, FL, pp.291–350.
Ž .Lam, T.J., 1983. Environmental influences on gonadal activity in fish. In: Hoar, W.S., Randall, D.J. Eds. ,Fish Physiology vol. IXB. Academic Press, London, pp. 65–116.
Little, D.I., Smith, J., 1994. Appraisal of contaminants in sediments of the Inner Bristol Channel and SevernEstuary. Biol. J. Linn. Soc. 51, 55–69.
Maes, J., Taillieu, A., Van Damme, P.A., Cottenie, K., Ollevier, F., 1998. Seasonal patterns in the fish andŽ .crustacean community of a turbid temperate estuary Zeeschelde Estuary, Belgium . Estuarine Coastal
Shelf Sci. 47, 143–151.Maitland, P.S., Lyle, A.A., 1990. Practical conservation of British fishes: current action on six declining
species. J. Fish Biol. 37, 255–256.Marshall, S., Elliott, M., 1998. Environmental influences on the fish assemblage of the Humber Estuary, U.K.
Estuarine Coastal Shelf Sci. 46, 175–184.Martin, M.H., Nickless, G., Steiner, R.D., 1997. Concentrations of cadmium, copper, lead and zinc in the alga
Fucus serratus in the Severn Estuary from 1971 to 1995. Chemosphere 34, 324–325.McErlean, A.J., O’Connor, S.G., Mihursky, J.A., Gibson, C.I., 1973. Abundance, diversity and seasonal
patterns of estuarine fish populations. Estuarine Coastal Mar. Sci. 1, 19–36.Platell, M.E., Potter, I.C., Clarke, K.R., 1998. Do the habitats, mouth morphology and diets of the mullids
Upeneichthys stotti and U. lineatus in coastal waters of south-western Australia differ? J. Fish Biol. 52,398–418.
Potter, I.C., Claridge, P.N., 1985. Seasonal catches, size and meristic data for sprat, Sprattus sprattus, in theSevern Estuary. J. Mar. Biol. Assoc. U.K. 65, 667–675.
Potter, I.C., Claridge, P.N., Warwick, R.M., 1986. Consistency of seasonal changes in an estuarine fishassemblage. Mar. Ecol.: Prog. Ser. 32, 217–228.
Potter, I.C., Gardner, D.C., Claridge, P.N., 1988. Age composition, growth, movements, meristics andparasites of the whiting, Merlangius merlangus, in the Severn Estuary and Bristol Channel. J. Mar. Biol.Assoc. U.K. 68, 295–313.
Potter, I.C., Claridge, P.N., Hyndes, G.A., Clarke, K.R., 1997. Seasonal, annual and regional variations inichthyofaunal composition in the Inner Severn Estuary and Inner Bristol Channel. J. Mar. Biol. Assoc.U.K. 77, 507–525.
Russell, F.S., 1980. On the distribution of postlarval fish in the Bristol Channel. Bull. Mar. Ecol. 8, 283–290.Thiel, R., Seulveda, A., Kafemann, R., Nellen, W., 1995. Environmental factors as forces structuring the fish´
community of the Elbe Estuary. J. Fish Biol. 46, 47–69.Thomas, M., 1998. Temporal changes in the movements and abundance of Thames Estuary fish populations.
Ž .In: Attrill, M.J. Ed. , A Rehabilitated Estuarine Ecosystem. Kluwer Academic Publishing, Dordrecht, pp.115–139.
Titmus, G., Claridge, P.N., Potter, I.C., 1978. Growth and abundance of 0-group herrings, Clupea harengusL., in the Severn Estuary. J. Linn. Soc. Zool. 64, 251–260.

( )I.C. Potter et al.rJ. Exp. Mar. Biol. Ecol. 258 2001 15–37 37
Vale, J.A., Harrison, S.J., 1994. Aerial inputs of pollutants to the Severn Estuary. Biol. J. Linn. Soc. 51,45–54.
Ž .Webb, C.J., 1980. Systematics of the Pomatoschistus minutus complex Teleostei: Gobioidei . Philos. Trans.R. Soc. 291, 201–241.
Wheeler, A., 1969. The fishes of the British Isles and north-west Europe. Warne, London.