fisheries and aquaculture in - eurofish magazinewto.eurofishmagazine.com/countries/croatia.pdf ·...
TRANSCRIPT

Fisheries and Aquaculture Fisheries and Aquaculture in Croatiain Croatia
The WorldTrade Organization (WTO) and fisheries
St. Petersburg, 29‐31 October 2013
CROATIAMinistry of AgricultureDirectorate of Fisheries
Božena Vidović, [email protected] Lukin, [email protected]

ContentContent1. Capture fisheries in Croatia
2. Aquaculture in Croatia
3. Trade of aquaculture and fisheries products

CroatiaCroatia• Total area: 87.609 km2
o 64,5% - land areao 35,5% - marine area
• Coast length: 5.835 km
• Number of Islands:1.246 (47 inhabited)
• Total population: 4.290.612

Fisheries sectorFisheries sector
73%
18%
0%9%
MARINE CAPTUREFISHERIES MARINEAQUACULTUREFRESHWATERCAPTURE FISHERIESFRESHWATERAQUACULTURE

1. 1. Capture fisheries in Capture fisheries in CroatiaCroatia

1.1. 1.1. Freshwater capture Freshwater capture fisheriesfisheries
0
100
200
300
400
500
600
700
800
2000. 2001. 2002. 2003. 2004. 2005. 2006. 2007. 2008. 2009. 2010.
Main species: common carp, grass carp, tench, Wels catfish, zander,Northern pike and trout

1.2. Marine capture 1.2. Marine capture fisheriesfisheries
• Adriatic area• Fleet:
o cca 80% - less then 12 m; multipurpose & small-scale vessels
o cca 20 % - trawlers & purse seine
• cca 95% of catch• Most representative
species:o sardines, anchovy, hake,
mullet, lobster, tuna (farming)

1.2. Marine capture 1.2. Marine capture fisheriesfisheries
TYPE CATCH (kg)
DEMERSAL FISH 4.277.836
CEPHALOPODS 1.166.887CARTILAGINOUS FISHES 161.995
SMALL PELAGIC FISH 56.301.980
BIG PELAGIC FISH 454.329
SHRIMP 487.657
MOLLUSCS 186.076
OTHER 27.541
TOTAL 63.064.301
Catch 2012.
•89% small pelagic fish•6,7% demersal fish•1,8% cephalopods•0,8% shrimp•0,7% big pelagic fish (tuna)

1.2. Marine capture 1.2. Marine capture fisheriesfisheries
020.00040.00060.000
2000. 2001. 2002. 2003. 2004. 2005. 2006. 2007. 2008. 2009. 2010.TON
NES
Pelagic species Demersal species Others Total

2. 2. Aquaculture in CroatiaAquaculture in Croatia

2.1. Freshwater aquaculture2.1. Freshwater aquaculture• 49 steakholders• warm-water (cyprinid,
carp-like) specieso 28 carp farms o 10.650 hao pondso continental parts
• cold-water (salmonid, trout-like) species
o 27 trout farmso 49.897 m2
o tanks and racewayo flow-through systemso mountainous parts

2.1.Freshwater aquaculture2.1.Freshwater aquacultureProduction:
•carp 2.484 t•trout 1.232 t•Total value (2012) cca 8 mil EUR
Source: CBS&MA-DoF, Since 2010 according to the EU statistical methodology production refers to quantities placed on the market
Species 2000 2001 2002 2003 2004 2005 2006 2007 2008 2009 2010 2011 2012Common carp 3.952 3.705 2.872 2.617 3.298 3.716 3.481 2.868 3.201 4.088 1.816 2.891 2.484Grass carp 333 304 334 442 413 492 371 377 206 307 231 158 202Silver carp 292 82 103 18 10 64 110 207 149 157 73 95 88Bighead carp 109 253 358 433 379 325 480 455 547 599 309 522 296Tench 8 4 9 12 9 29 30 14 8 4 1 1 3European catfish 58 38 58 72 71 40 29 38 52 67 29 24 36Zander 9 8 10 7 8 10 18 17 10 7 7 8 7Pike 21 12 13 2 10 5 5 8 11 14 8 11 12Trout 1.162 1.080 1.666 1.400 1.359 1.423 1.729 1.646 2.752 2.071 2.492 2.489 1.232Other 85 63 77 73 61 95 75 165 191 174 82 84 81TOTAL 6.029 5.549 5.500 5.076 5.618 6.199 6.328 5.795 7.127 7.488 5.048 6.283 4.441

2.2. Marine aquaculture2.2. Marine aquaculture• 330 locations
• 4’856’068 m2 of marine area
• 144 producers
• 8 species

2.2. Marine aquaculture2.2. Marine aquaculture• Finfish production:
o Closed farming cycle of seabream and seabass
o Caputre-based tuna farmingo Floating cages at seao Seabass, Seabream,
Meagre, Common dentex, Bluefin tuna
• Shellfish production:o Small family farmso Traditional way of producingo European flat oyster,
Mediterranean mussel

2.2. Marine aquaculture2.2. Marine aquaculture

2.2. Marine aquaculture2.2. Marine aquacultureProduction & value (2012)
•3 hatheries – 14 mill. pcs (30% of domestic market demand)

3. 3. Trade of aquaculture Trade of aquaculture and fisheries productsand fisheries products

3. Trade 3. Trade ‐‐ freshwater freshwater aquacultureaquaculture
• Most of production is placed on domestic market
• Trout - 99,9% on domestic market
• Carp - 20% of production -export of fresh fish (no processed products)
• 2012 – main export destination: Germany, Italy, Hungary, Bosnia and Herzegovina, Serbia

3. Trade 3. Trade ‐‐ marine marine aquacultureaquaculture
• Shellfish – 100 % domestic market
• Seabass & Seabream –90% domestic and Italian market
• Bluefin tuna (Thunnus thynnus)o 27% of productiono 55% of value (31 mill €)o 99,99% export Japan
tonnes

3. Trade3. Trade

3. Trade3. Trade

3. Trade 3. Trade –– exexport 201port 20122

3. Trade 3. Trade –– import 2012import 2012

3. Trade 3. Trade –– export/import EU 2012export/import EU 2012

3. Trade3. Trade• Export:
o fresh and chilled products mainly exported to Italy
• well organized transport – quality products in few hours on Italian market
o mostly anchovy, sardines and aquaculture products
o tuna for Japanese marketo canned products mainly exported to Serbia,
Bosnia & Herzegovina

3. Trade3. Trade• Import:
o mostly frozen and canned productso herring, Loligo patagonica, shrimpso 1/4 for tuna-farming
• Croatia produces and exports higher quality products

3. Trade3. Trade•Law per capita consumption
o 8-9 kg/yearo 0.4-0.5 kg of freshwater fish
• clear consumer preference for seafish as opposed to freshwater fish
•Potential development of domestic marketo small production of quality products – local foodo certification & labeling

3. Trade3. TradeMarket & accession in EU
• Advantage – open EU marketo Croatia meets all EU standards regarding food
safety, labeling, consumer protection, IUU o No quotas and customs for EU memberso New possibilities for shellfish producerso EU funds for further development
• certification & labeling

3. Trade3. TradeMarket & accession in EU
•Disadvantage – new customs for CEFTA members
o Serbia, Bosnia & Herzegovina, Macedonia, Montenegro

ConclusionConclusion
Regarding trade of fisheries and aquaculture products, accession of Croatia to EU brings
much more advantages then disadvantages and opens new possibilities
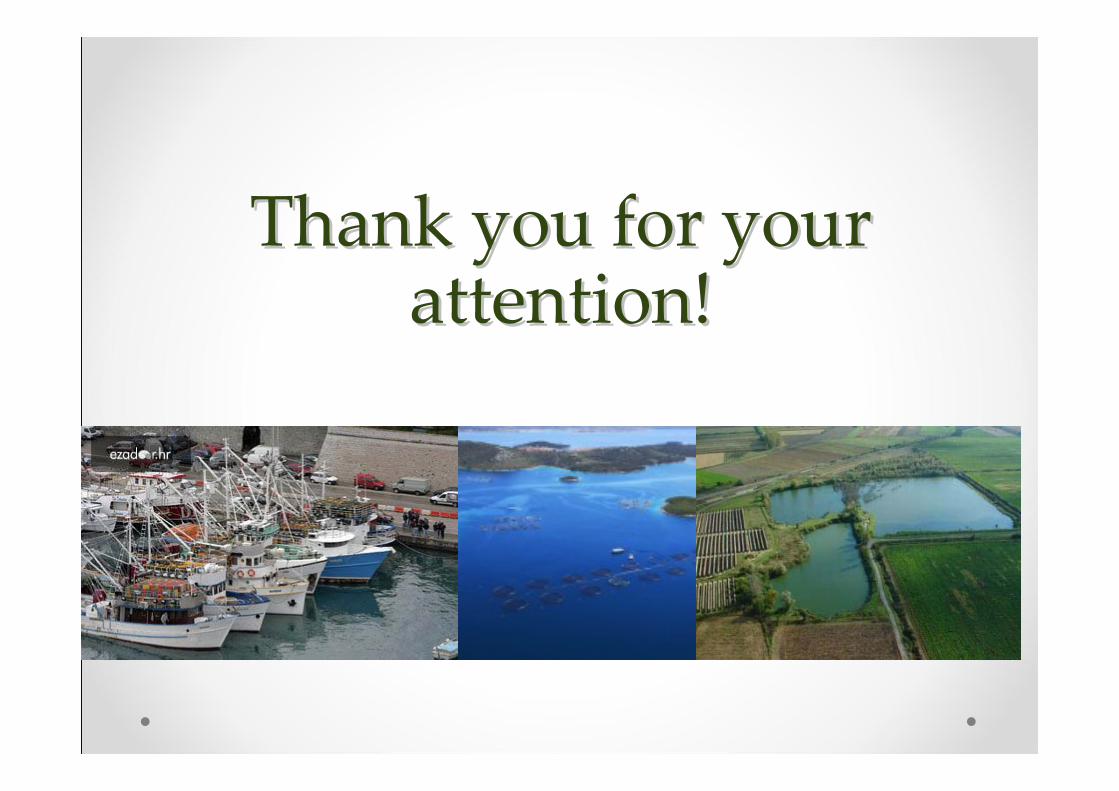
Thank you for your Thank you for your attention!attention!