fisheries stock assessment
TRANSCRIPT
WORKING PAPER SERIES
FISHERIES STOCK ASSESSMENT TITLE XI1
Collaborative Research Support Program
Fisheries Stock Assessrnent CRSP Management Office Internationai Programs, College of Agriculture
The University of Maryland, College Park, Maryland 20742
In cooperation with the United States Agency for International Development (Grant No.DAN-4146.G-SS-5071-,)0) the Fisheries Stock Assessment CRSP involves the following participating institutions:
The Univeis-t, of Maryland-Center for Environmental and Estuarine Studies The University of Rihode Island- International Center for Marine Resource DevelopmentThe University of Washington--Center foi Quantitative Sciences The University of Costa Rica-Centro de Investigaci6n en Ciencias del Mar y LimnologiaThe University of the Philippines.-Marine Science Institute (Diliman)--College of Fish
eries (Visayas)
In collaboration with The University of Delaware: The University of Maryland-Collegeof Business and Management; The University of Miami; and The International Center forLiving Aquatic Resources Management (ICLARM).
Working Paper Series
Working Paper No. 9 "Hydrcacoustics and Ground Truth"
by Richard E. Thorne
School of Fisheries University of Washington
May, 1987
Fisheries Stock Assessment Title XII
Collaborative Research Support Program
The Fisheries Stock Assessment CPSP (sponsored in part by USAID GraiL No.DAN-4146-G-SS-5071-00) is intended to support collaborative research betweenU.S. qnd developing countries' universities and institutions on fisheries stock assessment and managenent stratrjies.
This Working Pdoer has been produced by the collaborative efforts of TheUniversity of Washington and The University of Costa Rica-Centro deInvestigacion en Ciencias del Mar y Limnologia (CIMAR) in association with TheUniversity of Delaware. Additional copies are available from the CRSP Management Office and from:
Dr. Vincent Gallucci, Director Center for Quantitative Science HR-20
School of Fisheries University of Washington
3737 15th Avenue, N.E., Room 304 Seattle, Washington 98195
HYDROACOUSTICS AND GROUND TRUTH
Richard E. Thorne
School of Fisheries
University of Washington
Seattle, WA 98195
Abstract
One of the most difficult problems in hydroacousticapplications is the acquisition of ground truth data. A major incentive for the use of hydroacoustics is the deficiencies of the same alternate techniques that areavailable for such ground truth data. However, such data areoften required for biological information including speciescomposition. In addition, since hydroacoustic techniques are not universally accepted, ground truth information issometimes needed to establish confidence in the results. Theauthor has been involved in over 2000 hydroacoustic surveysof various species in a variety of locations. Many different approaches were used to obtain ground truth data. Examination of these results provides some interestinginsights into the characteristics of both the hydroacousticand the ground truth techniques and suggests some principlesfor ground truth efforts in conjunction with hydroacousticsurveys. A major conclusion is that the appropriate role of ground truth efforts is not verification, but is to aid interpretation of the hydroacoustic data.
2
HYDROACOUSTICS AND GROUND TRUTH
Richard E. Thorne
Introduction
I had an occasion in 1980 to compile a list of the
number and type of hydroacoustic surveys in which I had
participated during the previous decade. The total came to
1025 (Thorne 1983). In the subsequent seven years, the total
has probably doubled. These represent a considerable variety
of habitat and species. Virtually all have had some type of
ground truth effort in conjunction with the surveys. The
type and effectiveness of the ground truth efforts were also
highly variable. The purpose of this paper is to summarize
these results and to develop some general principles for
ground truth programs. It should be emphasized that the
results represent my particular experiences. Even 2000
surveys are a small fraction of the potential interactions
among habitats, species and ground truth techniques. Other
investigators may have differing experiences. Nevertheless,
I think the results can provide vaiuable insight into ground
truth techniques.
Ground Truth and the Laws of Physics
Different investigators have differing definitions of
the concept of ground truth. One commonly held concept is
that of verification. Under this definition, cround truth is
an alternate technique that can be used to determine if the

3
hydroacoustic techniques are providing the "right" answer.
This was the concept underlying my initial research in this
field nearly 20 years ago (Thorne 19*!0, L971). One
difficulty with this concept is that there are very few
circumstances where alternate techniques can provide an
adequate standard. The glaring deficiencies of these
techniques are part of the motivation to use hydroacoustics
in the first place. In addition, most fisheries acousticians
have come to realize in the past two decades that the
question is not whether hydroacoustics are "right" or
"wronq", but the appropriate question is, "how can the
information contained in the physics of the acoustic data be
most effecti.rely processed and interpreted?" This concept
starts with the realization that the informaLion contained in
the acoustic data already limits the scope of possibilities
for interpretation. The data already contain considerable
information on the location and nature of targets. The role
of ground truth should be to facilitate interpretation of
this information. This is the concept of ground truth which
forms the basis of this paper.
Scope of Paper
The major techniques that have used in association with
my hydroacoustic surveys have been various types of trawls,
surrounding nets, gill nets, fyke nets, visual techniques,
hand lines, electroshocking and cove rotenone. In addition
to these fishery independent techniques, valuable insight
4
into the interpretation of hydroacoustic data can often be
obtained from comparisons with commercial catch data. In the
remainder of this paper I will discuss results with these
various techniques individually, then discuss multiple
techniques, and finally close with some general principles.
Direct Capture Techniques
Trawling
Trawling techniques have often been used for ground
truth efforts in association with hydroacoustic surveys. A
trawl provides an output similar to that from a mobile
hydroacoustic survey, that is, a density estimate in a depth
strata over a distance. I have previously reported many
examples of comparisons between trawl catches and
hydroacoustic estimates (fnorne 1971, 1973, 1977, 1983b,
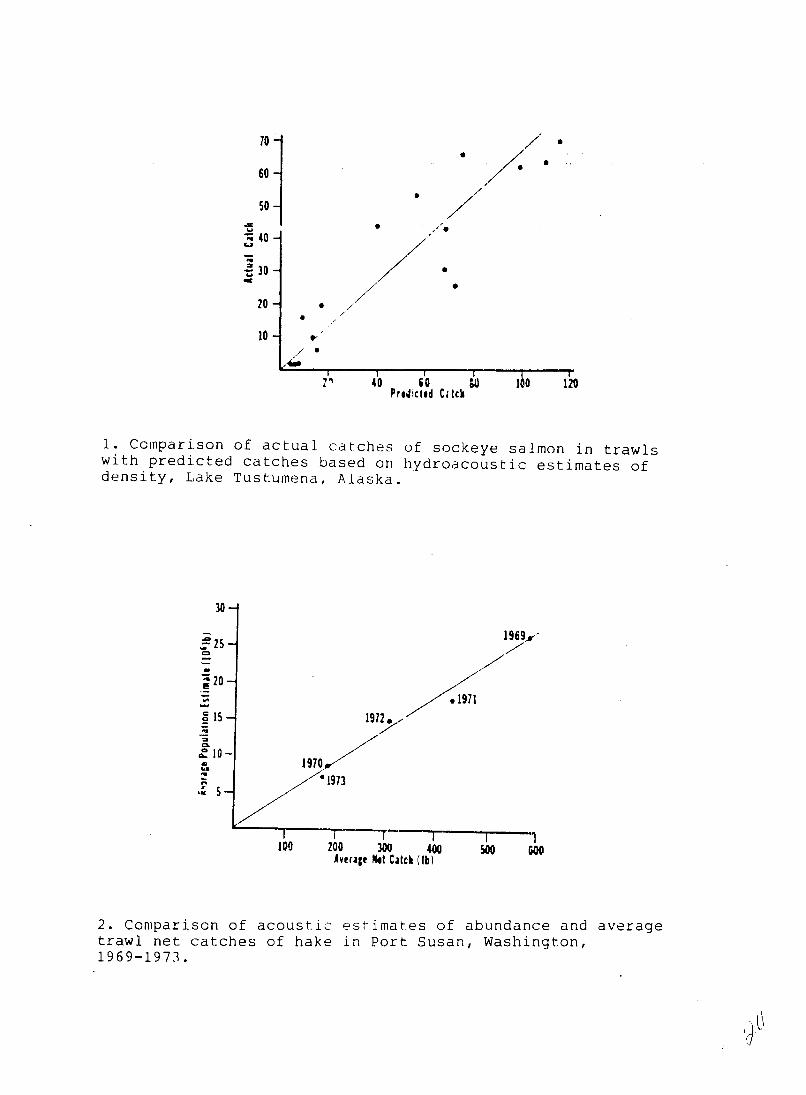
1983c). The general conclusion is that synoptic trawl and
hydroacoustic observations are often higoly correlated (Figs.
I and 2). However, that conclusion must be treated
cautiously. First, trawls, like virtually all techniques,
are selective. They provide good correlation with the
acoustic data when the predominate species are suitable for
the selectivity characteristics of the net. The acoustic
data can often provide information for evaluation of the
appropriateness of the trawl. For example, McClain (1987)
demonstrated correlation between dual beam target strength
measurement of two juvenile salmon cohorts in Lake Tustumena,
5
Alaska, and corresponding trawl catch proportions. However,
both cohorts were relatively small and not greatly dissimilar
(mean lengths 47 and 75mm). The small mesh trawl was
suitable and the glacially turbid water resulted in an
unsually high catch efficiency of about 70% (Thorne and
Thomas, 1984). The same trawl would be ineffective on the
adults of that same species. Further, other comparisons have
been made between the estimates of relative year class
proportions from trawls and those from subsequent
outmigrat 'n data. These often indicate underestimation of
the larger cohort by the trawl data (Gary Kyle, Alaska Dept.
of Fish & Game, personal communication.
The second caution is that the efficiency of the trawl
is greatly affected by the environmntal conditions. For
example, the same type of trawl that effectively caught fish
in the glacially turbid Lake Tustumena was extremely
inefficient for the same size groups in clear water nursery
lakes. Further, Robinson and Barraclough (1978) showed
changes in trawl catch efficiency with changes in moonlight
and cloud cover conditions.
The limitations caused by untrawlable habitats are well
recognized and will be further discussed later. A recent
example is reported in Marino (1987). In this case the
hydroacoustic data clearly identified two di.3tributions: one
limnetic and one littoral. The trawl appeared adequate for
the first, but could not sample the fish in the near-shore,
near-bottom locations.
Surrounding Nets
Surrounding nets are more difficult to correlate with
hydroacoustic observations than trawls, but are often
effective for near surface fishes. Surrounding nets are
generally less selective than most other direct capture
techniques and are often very efficient. I have used
surrounding nets (lampara seines) for ground truth data in
two studies, one in the Southern California Bight and the
second in the nearshore Beaufort Sea. In the Beaufort Sea
study, estimates of capture efficiency were made on several
species. The results indicated catch efficiencies varied
between 20 and 29% (anon. 1984). The Southern California
study was the most extensive. It concerned an evaluation of
fish entrapment by offshore water intakes of coastal power
generating plants. Some of the :esults are reported in
Thomas (1982). The survey design was unusual. The sampling
area consisted of a 300m radius around a water intake. The
circle was divided into 4 quadrants, in- and off-shore and
up- and down-coast. Randomly selected radial transects were
run in each quadrant, then replicated On the replicate
rouiid, a lampara set was made in one of the quaarants
immediately following the run. This procedure was repeated
at hourly intervals. The lampara data were used to allocate
the fish density by species. In order to evaluate the
effective(ness this technique, the resulting acoustic
7
estimates of fish density were compared with the
corresponding net catches. The results showed high
correlation between the density estimates and the net catches
for all the major species and all species combined (Table 1).
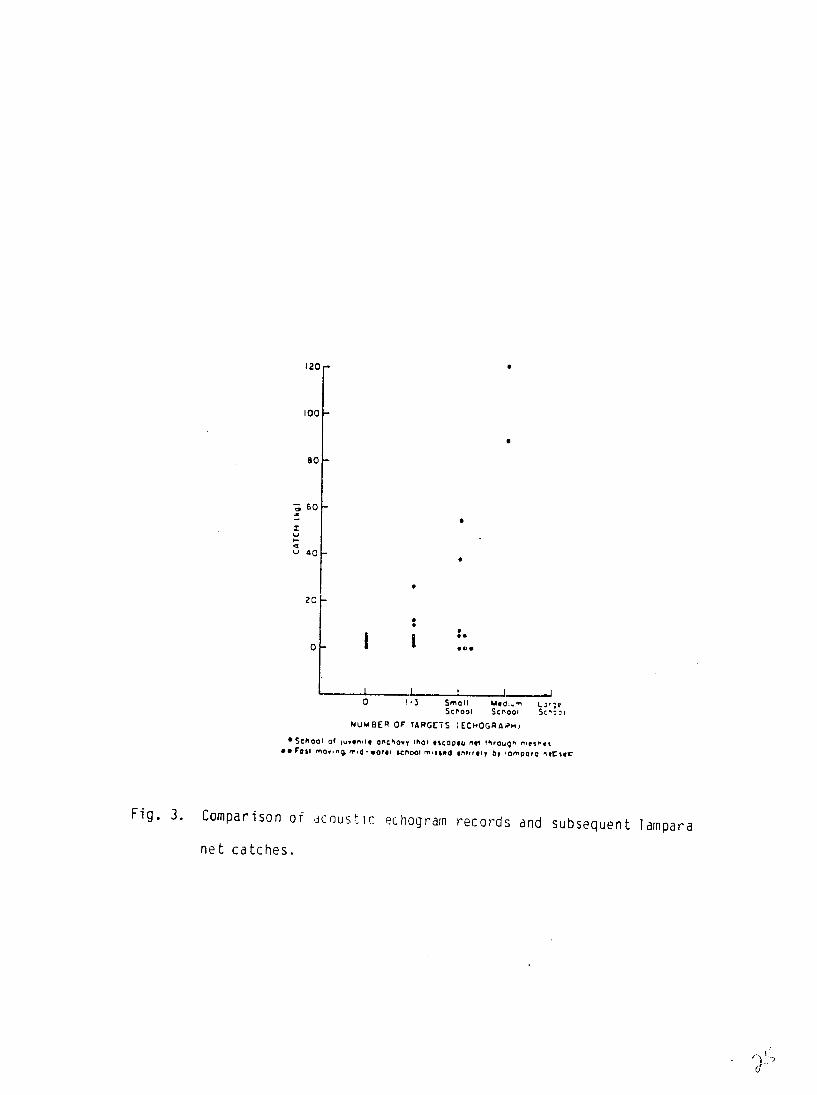
An earlier, similar study also showed good correlation
between acoustics and lampera net catches. However, this
study only used a simple echogram analysis to evaluate catch
effectiveness. The resul-s showed good correlation (Fig. 3),
but also noted two anlolous points in which fish escapement
from the net was observed. Finally, a third -t'idv during a
period where large mackeral schools were Present showed very
poor correlation between acoustic data and net catch because
of poor catching efficiency on these fish (Thomas et al.
1980).
Gill Nets
I have used gill nets in many studies. Gill nets are
very selective, but that problem can be partially overcome
with the appropriate application of multiple mesh sizes.
However, there are two other major difficulties. Tne is that
the abundance of fish captured by gill nets is difficult to
relate to acoustic measurements of density, because gill
nets measure the flux of fish movement rather than density.
One impact of this characteristic of gill net catchability is
that gill nets are more effective on more active and faster
swimming fish. This causes a selection against small fish
(which swim slower). The selection against small fish is

8.
accentuated by the fact that momentum plays an important role
in the catching process, and momentum is a function of both
swimming speed and mass. I conducted a comparison of
acoustic detections, swimming speed and gill net catches in
the nearshore Beaufort Sea during 1982. The results showed
considerably greater gill net catchability relative to
acoustic detections for larger, faster swimming fish (Thorne
1983c).
While gill nets provide an index which is difficult to
compare with the density measurements from mobiJe acoustic
surveys, they do provide an good index for comparison with
stationary transducer deployment, especially for study of
fish migration rates. Stationary deployments; including
slant angle deployment, provide an estimate of fish passage
through an area, or flux, which is similar to the measurement
provided by a gill net. This was the type of transducer
deployment used in the Beaufort Sea study cited above.
A second difficulty with gill is the strong affectsnets
of such environmental parameters as water clarity, ambient
light and current on catch efficiency. Considerable
improveinelt in our understanding of gill net catchability
characteristics could be obtained by synoptic comparisons of
catch with stationary transducer deployment, including dual
beam and slant angle. Unfortunately, very little research
has been conducted in this area despite extensive use of gill
nets in fisheries research.
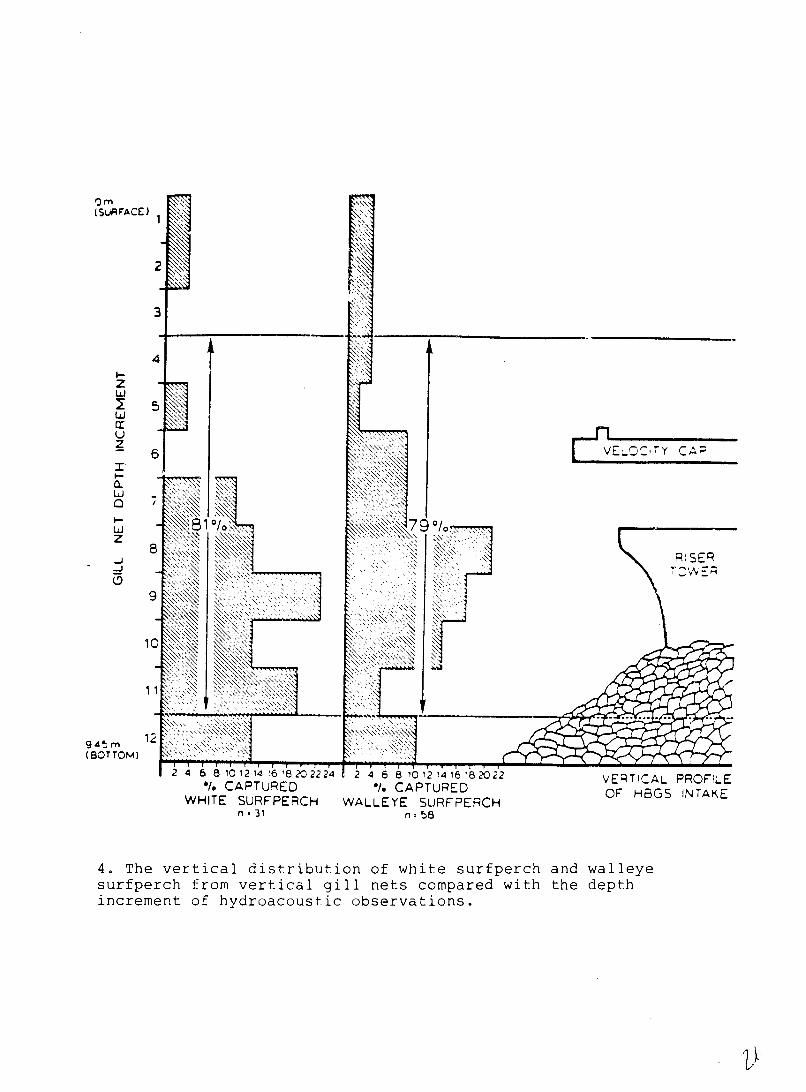
An advantage of vertical gill nets in conjunction with
9
hydroacoustic observations is that they can provide detailed
vertical distributional information for comparison with the
hydroacoustic data. A variation of this capability was used
to examine the potential near-surface and near-bottom bias of
acoustic estimates (Thomas et al. 1980). In this case the
vertical distribution from the gill nets was used to correct
for the proportion of fish in depth intervals that could not
be acoustically sampled (Fig. 4).
Other Direct Capture Techniques
Four other direct ci; )ture techniques that have been used
in conjunction with my acoustic surveys are fyke nets,
electroshocking, hand lines and cove rotenone. The
application of fyke nets and the electro,hocking were part of
multiple technique studies and will be discussed later. Hand
lines are difficult to quantify, but in some cases can
provide a rapid confirmation of acoustic targets. Jackson
and Thomas (1979) used hand lines to rapidly identify large
schools thaL were detected by naval sonars. In a recent
survey of Crater Lake, Oregon (Marino 1987), limited hand
line data were the only source of species identification
because of the difficult access to the lake and lack of
histcrical investigations.
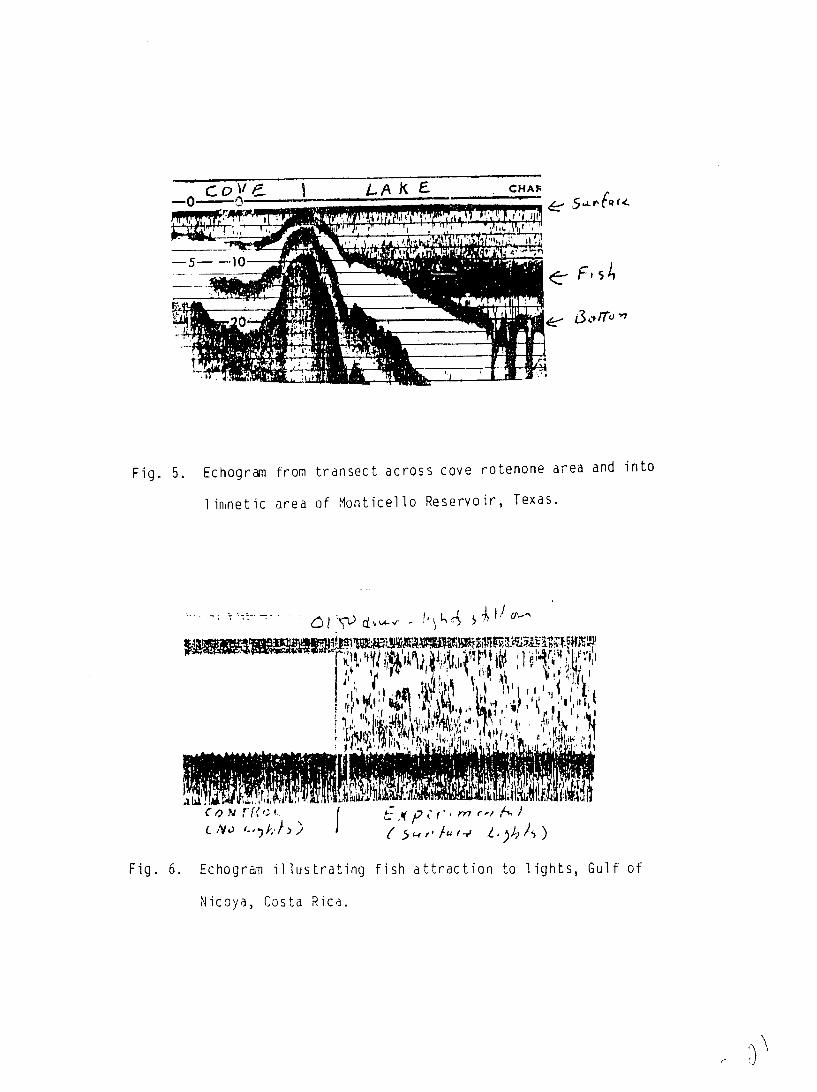
The cove rotenone effort was associated with three
reservoirs in Texas that are used for cooling water purposes.
Hydroacoustic estimates of fish abundance for tb- thr~e
reservoirs were compared with corresponding cove rotenone
10
results. In all three cases, the hydroacoustic estimates
were far higher. The cove areas were simply not
representative of the areas of major fish biomass, which were
limnetic (Fig. 5).
Visual Techniques
There are a wide variety of visual techniques used in
fisheries. My experience has included comparisons of
hydroacoustic observations with video cameras, surface
observations and diver observations. One of the major studi?s
involved synoptic use of acoustics and a.video camera around
the water intake for the Southern California Edison Steam
lights for
Generating Plant at Redondo Beach, California (Thorne 1980).
The combination was effective during daytime. However,
observations at night required use of artificial
the video camera. The synoptic acoustic observations showed
major pertubation (fish attraction) by the artificial lights.
A similar light attraction was observed near an artificial
reef in the Gulf of Nicoya, Costa Rica (Fig. 6). This study
also demonstrated another limitation of visual observation,
this time from divers. Hydroacoustic observations from a
stationary transducer on the reef showed high concentrations
of fish near surface above the reef. The abundance of these
fish was considerably underestimated by the divers,
apparently because of the distance from the reef to the
surface combined with active avoidance by the fish.
Despite these limitations, diver observations can be
very helpful. In several instances, diver observations have
served to identify fish and also to note fish on the bottom
that were not detected by the acoustics. In one case, diver
observations were used to identify a very large acoustic
target that turned out to be a dense school of fish that was
associated with a breakwater and could not be acoustically
resolved from the structure.
Occasionally ground truth data can be obtained from
surface visual observation. Visual counting techniques were
used to verify acoustic estimates of the adult sockeye salmon
escapement into Lake Washington (Thorne 1979). The two
techniques differed by less than 2% over a four-year period.
Surface visual techniques were helpful in a recent survey of
fish in several reservoirs in eastern Texas. In this case,
the hydroacoustic data indicated predominance of small fish.
The gill net and cove rotenone data available were clearly
biased against capture of the size class of fish indicated by
the acoustic data. Visual observations, including attraction
of fish to the surface with lights, verified the presence of
huge numbers of minnows of various species.
Another case where acoustic data dictated a ground truth
approach was an evaluation of fish migration past a
hydroelectric dam via a sluiceway. The particular
hydroacoustic approach assumed individual fish passage.
However, examination of the acoustic data suggested schooled
targets. Subsequent visual observations, although inadequate
for accurate enumeration, verified passage of fish in small
12
dense schools, thus dictating an alternate approach to the
acoustic data processing (Llew Johnson, Associated Fisheries
Biologists, personal communication).
Comparisons with Fishery Catch Data
A common objective of hydroacoustic surveys is to
provide data to oid the management of a commercial fishery.
In this case, the actual catch of the fishery can often aid
interpretation of the acoustic data. In one of my first
studies, analysis of the annual variation of the acoustic
estimates, combined with the catch data, demonstrated flaws
in the acoustic technique, which later turned out to be
inadequate areal coverage (Thorne et al. 1971, Thorne 1973).
Comparisons of acoustic estimates and subsequent commercial
captures for several herring stocks in Alaska provided
considerable input to improvements in the acoustic techniques
(Thorne et al 1.983). Commercial fishing data, in conjunction
with hydroacoustic surveys, can provide valuable information
on the adequacy of survey coverage, input to stratified
efforts, species composition information and other necessary
biological data. An example of the use of commercial catch
data is presented in the next section.
While commercial catch data can provide data for
interp'-etation of acoustic surveys, the inverse is also true:
acoustic data can provide insight into the characteristics of
the commercial catch data that can aid interpretation of that
data. This potential is greatly underutilized, at least in1
13
the U.S. We have an unfortunate tendency to overuse,
overmassage and overmodel fishery catch data regardless of
its quality or biases.
Multiple Techniques
Sometimes the application of hydroacoustics is part of a
program for the development of optimal sampling tools for a
oarticular habitat. An example is a study I participated in
on the Mississippi River, 2ool 18. The objective of the
study was to evaluate several techniques in order to
determine the best technique, or combination of techniques,
for use in studies of fish abundance and behavior in this
particular habitat (Peterson 1983). The main techniques, in
addition to hydroacoustics, were gill nets, trawls and
electrofishing. The comparative study demonstrated major
differences in performance among the three capture
techniques. For example, in one location the electroshocking
indicated predominance of emerald shiner (49%) and gizzard
shad (48%) , while trawling in the same area suggested
predominance of drum (54%) and channel catfish (29%), and the
gill nets suggested that longnose gar (a species not even
caught with the other two techniques) was a major component.
Some of the differences are illustrated in the comparison of
minimum and m, :imum lengths of various species from the total
effort (Table 2). Overall conclusions included: (1) gill
nets were relatively poor indicators of species composition;
(2) trawls were 'ess selective, but were very limited by

14
untrawlable habitats, and (3) electrofishing sampled the
largest diversity and the largest sample size and was clearly
the best in shallow water, but the technique was difficult to
quantify either for its selectivity or efficiency.
A second multiple gear study took place under ice in the
nearshore Beaufort Sea near Prudhoe Bay. This study involved
comparison of fyke nets, gill nets and diver observations, as
well as fixed aspect hydroacoustic transducers. The nets and
acoustics operated day and night; diver operations were
limited to daytime. The fyke nets captured 19 Arctic cod and
2 snailfish; gill nets captured no fish; divers observed 29
snailfish, 7 sculpins, 5 Arctic cod and 1 eelbleeny. Only
the Arctic cod were observed in the water column. All others
were in contact with the bottom or kelp. The acoustics
detected 498 fish targets. Detection rates at night were
about 5 times higher. The results indicate that the fyke net
is most efficient for the more mobile cod, whereas the divers
more often observed the more sedentary fish. The diel
variation in the acoustic data indicated that the sedentary
fish were more active at night, but the lack of catch of
these species in the fyke net indicated that the activety was
locally oriented. The lack of success with the gill nets was
probably due to the clear water combined with ice formation
on the meshes.
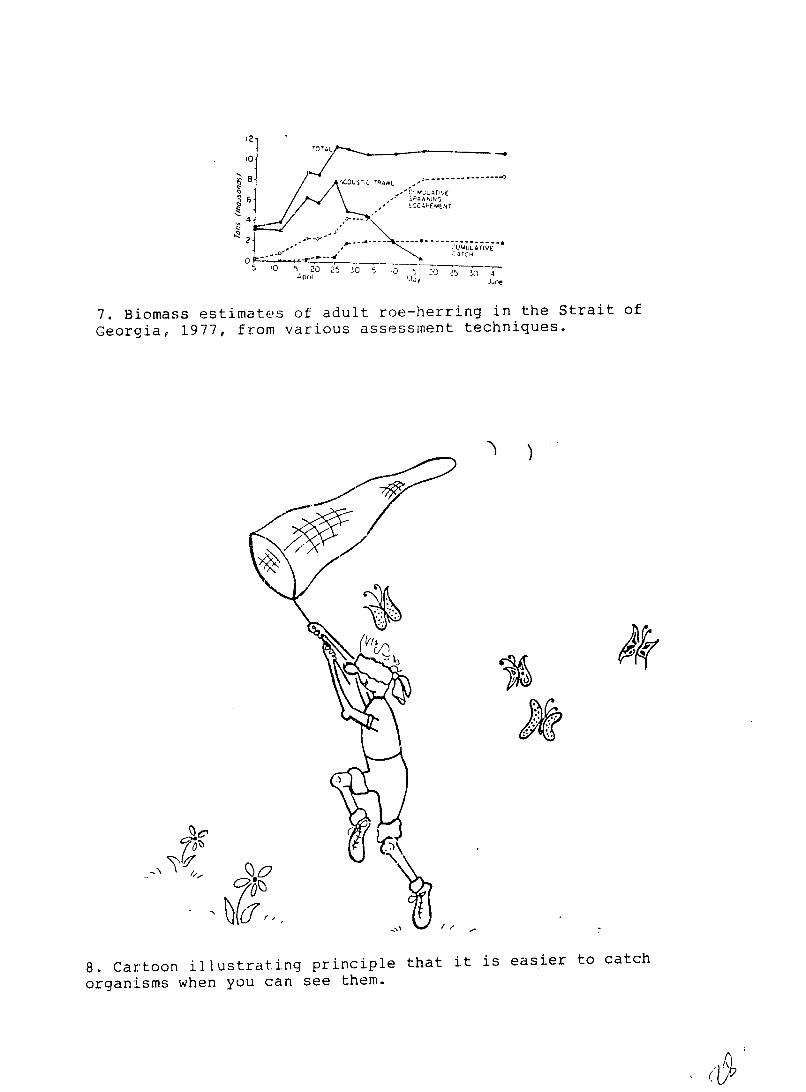
One final example of the use of a combination of
techniques, including commercial catch data, is the
procedures developed for management of the herring roe
15
fishery in the Strait of Georgia (Trumble et al. 1982). The
combina:ion was hydroacoustic surveys, midwater trawling,
commercial catch data and spawning ground surveys. The
hydroacoustic surveys provided a time series of estimates of
the fish biomass as the herring moved into the area prior to
spawning. The midwater trawling effort provided data on the
species composition and the percentage of mature females.
The commercial catch data provided an accounting of the fish
removed by harvest, while the spawning ground surveys
estimated the number of fish that subsequently spawned and
left the area. Once the last herring is recruited into the
area, the combined techniques provide a total accounting of
the population size (Fig. 7). Although the acoustic data
provide an early indication of the population, the entire
combination is required to provide the real time accounting
of the total fishery that is needed for the management. No
lesser combination could have provided adequate information.
Conclusions - Some General Principles
The most important principle in field investigations of
fisn abundance, distribution and behavior is that all gear
types, including hydroacoustics, have some bias. This aspect
is clearly pointed out in several of the results reported
here, especially the multiple gear studies. Witn this
prinicple in mind, it is important to again point out that
the proper context of a ground truth program associated with
hydroacoustics is not to determine the "right" or "wrong" of
16
the acoustics, but to determine which complementary technique
or techniques can provide the information needed to most
effectively interprete the acoustic data. The primary
advantage of hydroacoustic techniques is the ability to
rapidly determine the location of fish targets. In addition,
acoustic data contain considerable information on the nature
of the targets, including abundance. No other technique
approaches the capability of hydroacoustics in this regard.
The capability to "see" fish one ofis the major advantages
of hydroacoustic techniques, and it is easier to catch a
target when you can see it (Fig. 8).
The second principle, which follows from the first, is
that ground truth techniques can be most effectively used
when the characteristics of the environment are well
understood. This is a variation of the principle in survey
design that the best statistical design can be achieved when
you already know all the distributional characteristics of
the fish to be surveyed. In practice there is always a
learning experience in every study. The more you learn about
the environment, the better you can monitor it. It is naive
to believe you can go into an environment the first time and
accomplish an effective study. I have observed many failures
in hydroacoustic assessments that were the result of
incorrect assumptions about the nature of the target species
and that could have been successful if properly designed.
The third principle, which again follows from the first
two, concerns the role of the acoustics in the selection of
17
ground truth techniques. The initial choice when entering a
new environment has to rely on assumptions based on the best
information available. However, the subsequent acoustic data
usually adds considerably to this knowledge and should be
used to reconsider and possibly redesign the ground truth
appoach. Fxamples of the type of information include depth
distribution, horizontal distribution, patchiness, schooled
or layerc-d distribution, near-boundary orientation, size of
targets and diel changes in distribution and behavior.
This capaui Iity leads to the fourth pi.nciple: that
ground truth t.echniques are most effective when they are
directed by the acoustic observations. Since the appropriate
role of ground truth is to provide information to interprete
the acoustic data, it can be most effective when the ground
truth efforts are directed to answer specific questions asked
by the acoustic (oata. Correlations between acoustic
observat ions are always best when they are synoptic. It
follows that the information value of the ground truth data
is greatest. when it can be directly compared to the synoptic
acoustic data. Whenever possible I use a two boat operation:
an acous-ic boat followed by a direct capture boat.
Finally, it should be apparent that a single ground
truth technique may not be adequate. If the acoustic data
are used to direct ground truth efforts, it follows that the
characteristics of the targets and the habitat that are
identified by the hydroacoustics should be used to determine
the best techniques to sample those targets in that habitat.
18
In many circumstances, that will require multiple ground
truth techniques.
Acknowledgments
I am grateful to many individuals and agencies for support of the studies summarized here. Initial preparationof this manuscript was supported by the Washington Sea Grant Program. I am indebted to the U.S. Agency for International Development (AID) for the funds for its completion and publication.
Literature Cited
Anon. 1984. Prudhoe Bay Waterflood Project Fish ManagementProgram 1983. Final Report, BioSonics Inc., Seattle.
Jackson, D.R. and G.L. Thomas 1979. Acoustic measurements of fish schools using array phase information. Proc. Oceans 79:59 (abstract).
Marino, D.A. 1987. An investigation of the summertime spatial and distribution behavior of kokanee (Oncorhynchus nerka) in Northwest lakes using dual beam hydroacoustic techniaues. Paper # 83, Internat. Symp. on Fish. Acoustics, Seattle.
McClain, J. 1987. A comparison of cohort proportions obtained by dual beam techniques and by tow netting in a sockeye salmon nursery lake. Paper # 85, Internat. Symp. on Fish. Acoustics, Seattle.
Peterson, G.A. 1983. A pilot study to evaluate the winter fishery biology of Pool 18, Upper Mississippi River. Final Contract Report, U.S. Fish and Wildlife Service, Rock Island Ecological Services Field Office. 13p + 4 Appendices.
Robinson, D.G. and W.F. Barraclough 1978. Population estimates of sockeye salmon in a fertilized oligothrophic lake. J. Fish. Res. Bd., Canada 35:851-860.
Thomas, G.L. 1982. Complementary hydroacoustic and net sampling techniques for determining the vulnerabilityof fish to power plant entrapment. Paper # 102, Symp.
19
on Fish. Acoustics, Bergen, Norway, 12p.
Thomas, G.L., R.E. Thorne, W.C. Acker, T.B. Staples, A.S. Kolok, L. Johnson, K. Miller, J. Yuge, B. Kulik and S. Shiba 1980. The effectiveness of a velocity cap and decreased flow in reducing fish entrapment.Final Contract Report, FRI-UW 8027, Univ. Wash. Fish Res. Inst. 22p + 9 Appendices.
Thorne, R.E. 1970. Investigations into the integrator for measuring pelagic fish aThesis, Univ. Wash., ll7pp.
use bunda
of an nce.
echo Ph.D.
Thorne, R.E. 1971. Investigations into the relation between integrated echo voltage and fish density. J. Fish. Res. Bd., Canada 28:1269-73.
Thorne, R.E. 1973. Acoustic assessment of hake, 1969-1973. Proc. IEEE' Symp. on Eng. in the Ocean Environ., 249-252.
Thorne, R.E. 1977. Acoustic assessment of hake and herringstocks in Puget Sound, Washington, and southeastern Alaska. ICES Rap. et Proc.-v. 170:265-278.
Thorne, R.E. 1979. Hydroacoustic estimates of adult sockeyesalmon in Lake Washington, 1972-1975. J. Fish. Res. Bd. Canada 36:1145-49.
Thorne, R.E. 1980. Application of stationary hydroacoustic systems for studies of fish abundance and behavior. Proc. Oceans 80:381-385.
Thorne, R.E. 1983. Assessment of population abundance byhydroacoustics. J. Biol. Ocean. 2:253-262.
Thorne, R.E. 1983b. Application of hydroacoustic assessment techniques Lo three lakes with contrasting fish distributions. FAO Fish. Rep. 300:269-277.
Thorne, R.E., J.E. Reeves and A.E. Millikan 1971. Estimation of the Pacific hake (Merluciusproductus) population in Port Susan, Washington, using an echo integrator. J. Fish. Res. Bd., Canada 28:1175-84.
Thorne, R.E., R. Trumble, N. Lemberg and D. Blankenbeckler 1983. Hydroacoustic assessment and management of herring fisheries in Washington and southeastern Alaska. FAO Fish. Rep. 300:217-222.
Thorne, R.E. and G.L. Thomas 1984. Recent applications of hydroacoustics to assessment of limnetic fish abundance and behavior. Proc. NALMS 1983 Internat. Symp. on Lake and Reservoir Management. USEPA

20
400/5/84-001, pp. 305-309.
Trumble, R., R. Thorne and N. Lemberg 1982. The Strait of Georgia herring fishery: A case history of timely management aided by hydroacoustic surveys. Fish. Bull. 80:381-388.
List of Tables
1. Spearman rank correlation coefficients between nightly mean larpera catch per set and acoustic estimates of densityfor queenfish, white croaker, north)ern anchovy and all species combined, Huntington Beach 1979-80.
2. Minimum and maximum lengths (mm) of various species caughtby gillnet, trawl and electrofishing, Mississippi River, Pool i8.
List of Figures
1. Comparison of actual catches of sockeye salmon in trawls with predicted catches based on hydroacoustic estimates of density, iLake 'Tustumena, Alaska.
2. Comparison of acoustic estimates of abundance and averagetrawl net catches of hake in Port Susan, Washington, 1969-1 973.
3. Comparison of acoustic echogram records and subsequent lampara net catches.
4. The vertical distribution of white surfperch and walleyesurfperch from vertical gill nets compared with The depthincrement of hydroacoustic observations.
5. Echogram from transect across cove rotenone area and into limnetic area of Monticello Reservoir, Texas.
6. Echogram illugftrating fish attraction to lights, Gulf of Nicoya, Costa Rica.
7. Biomass estimates of adult roe-herring in the Strait of Georgia, 1977, from various assessment techniques.
8. Cartoon illustrating principle that it is easier to catch organisms when you can see them.
(%,
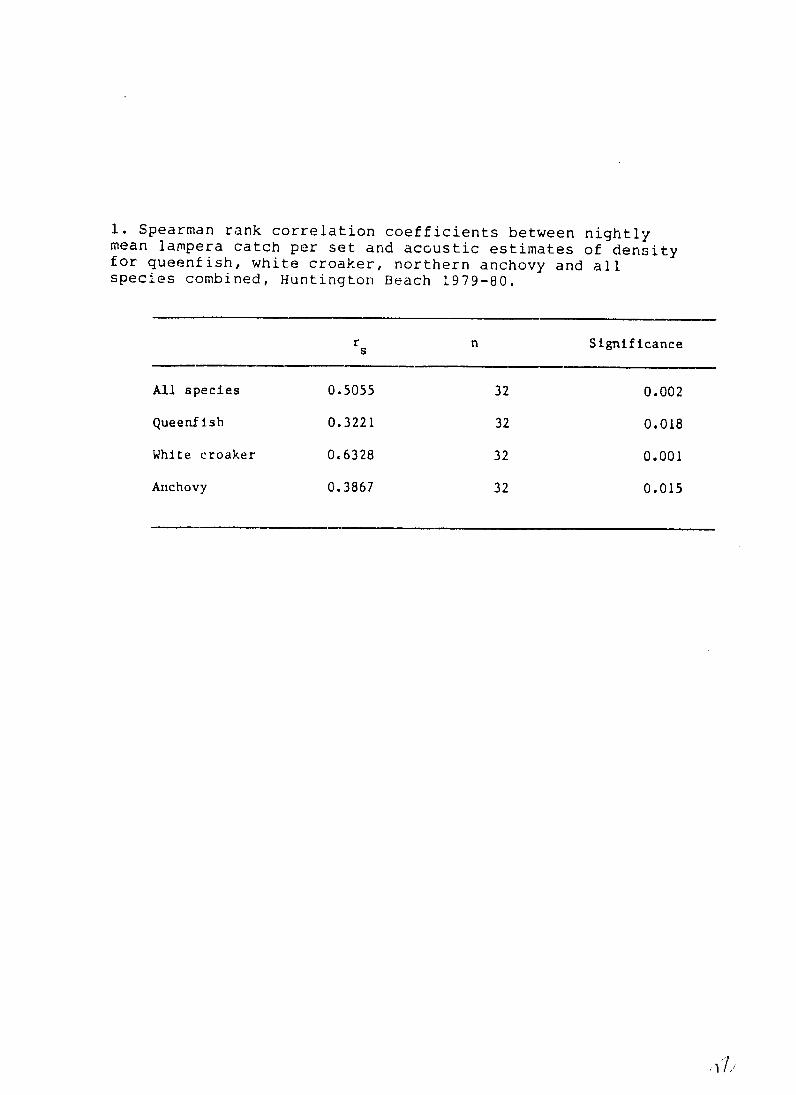
1. Spearman rank correlation coefficients between nightly mean lampera catch per set and acoustic estimates of density for queenfish, white croaker, northern anchovy and all species combined, Huntington Beach 1979-80.
r n Significances
All species 0.5055 32 0.002
Queenfish 0.3221 32 0.018
White croaker 0.6328 32 0.001
Anchovy 0.3867 32 0.015
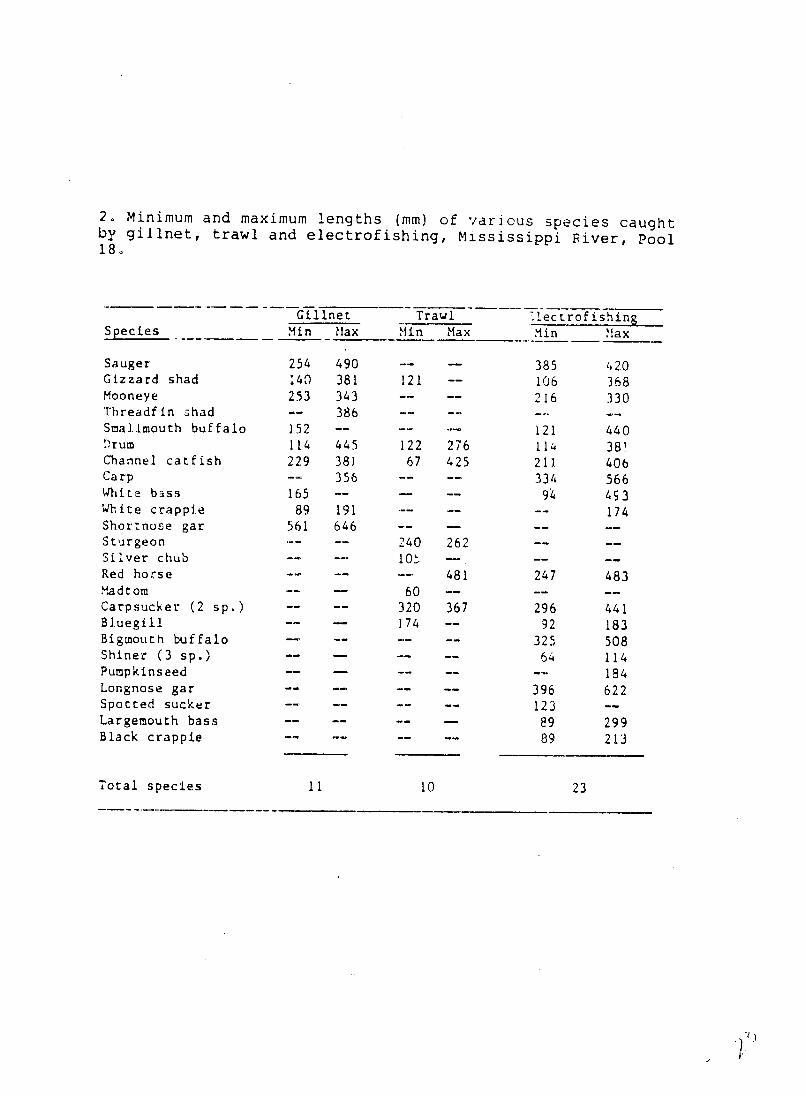
2. Minimum and maximum lengths (mm) of varicus species caughtby gillnet, trawl and electrofishing, Mississippi River, Pool 18.
Gillnet Trawl .1ectrofishing Species Min fin Max Min -Max Max
Sauger 254 490 -- 385 420 Gizzard shad 140 381 121 -- 106 368 Mooneye 253 343 -- 216 330 Threadfin ;had -- 386 .. ... --Smallmouth buffalo 152 -- -- 121 440 Drum 114 445 122 276 114 38 Channel catfish 229 38) 67 425 211 406 Carp -- 356 -- -- 334 566 White bass 165 --. 94 493 White crappie 89 191 .. .-- 174 Shortnose gar 561 646 .. ...--Sturgeon ... .. 240 262 .... Silver chub . . 10-1 - -- --
Red horse .. .-- 481 247 483Madtom - - 60 ...--
Carpsucker (2 sp.) .. .. 320 367 296 441 Bluegill -- - 174 -- 92 183 Bigmouth buffalo .. ...-- . 325 508 Shiner (3 sp.) .. ... .. 64 114 Pumpkinseed .. ... .... 184 Longnose gar .. .. .. .. 396 622 Spotted sucker .. .... .. 123 --Largemouth bass .. .. .. . 29989 Black crappie .. .. .. .. 89 213
Total species i1 10 23
I 0 <701 . 60
so S
0 /I0
40
30 /0
20 /-,
10
I I I
40 60 100 120 Predicted Citck
I. Comparison of actual catches of sockeye salmon in trawls with predicted catches based on hydroacoustic estimates of density, Lake Tustumena, Alaska.
1225 -1969,-"
A ;20
0 -. 1971 =15 - 1972..
CE10 ,,1970e
1973
- - - - I I 1 100 200 300 400 500 600
Average Not Catch (Ib)
2. Comparison of acoustic estimates of abundance and averagetrawl net catches of hake in Port Susan, Washington, 1969-1973.
'20
100
80
60
z0t
ki 40
204. see 0 1.3 Small wqau ' L.. e
School Scrooi Sc":: NUMBER OF TARGETS (ECHOGRAPMI
OSChoo of lwu.Sfl oflr'h0y th(al #COQSCI Ml'S troUgP' mjeptI Oes oll mo ,-gt Id-wlojr &crOol m.lsd e'lfrqly by iomporo n,"erl
Fig. 3. Comparison of icoustic echogram records and subsequent lampara
net catches.
rm [src}1 " '"(SURFACE) '
N "'N
3
4
z LU
2 5 LLU
U
LU - ," :,,,
\\''k""\\"' " \LU l0/0>
.. ":\. , , 4 R:SEP ~N ,JZ, ,.
,9'"'"-"
\\',',>,&,
K' 0"
2 4 6 8 101214 16 18202224 2 4 6 8 i0 2 1416 '82022 VERTICAL PROFILE */ CAPTURED '1 CAPTURED OF HBGS INTAKE
WHITE SURFPERCH WALLEYE SURFPERCH n,-31 n 58
4. The vertical distribution of white surfperch and walleye surfperch from vertical gill nets compared with the depth increment of hydroacoustic observations.
p1
t- ACHAfi-0 CC
-- 5-- -- lO .. .. ...........
and intoFig. 5. Echogram from transect across cove rotenone area
1innetic area of Monticello Reservoir, Texas.
, , •c~" ' "i
VN
Fig. 6. Echogran illustrating fish attraction to 1lights, Gui f of
Nicoya, Costa Rica.
--- -- - - -- - - -- - -
12
~~ 8 ~ COU~r:C TPA.VVL -"CLVLATI E
~ 6 ~2CAPEMENT 0 'L. dl ~~ 2 . '" '" - --- -------------..
4
2 a- UP4UL~rIVE
---- 4H 05 10 '~ 20 2,5 !.C 5 0 15 3'~T 40
7. Biomass estimates of adult roe-herring in the Strait of
Georgia, 1977, from various assessment techniques.
Q0 NK
8. Cartoon illustrating principle that it is easier to catch
organisms when you can see them.