fitting into place (or not): the ecological footprint martha rosemeyer eco ag/eco design january 8,...
Post on 22-Dec-2015
219 views
TRANSCRIPT

Fitting into Place (or not): The Ecological Footprint
Martha RosemeyerEco Ag/Eco DesignJanuary 8, 2004

Wackernagel and Reese, Our Ecological Footprint

General Concept of sustainability
“Satisfying the needs of present generations without compromising the needs of future generations.” Bruntland Commission 1987
So broad that it is devoid of operational significance
How do we know that progress is being made toward sustainability?

Measurement of how much we do or don’t fit into place, an indicator of sustainability
We want to measure the ability to consume sustainably in a number of different categories food shelter transport goods and services
Question becomes how to aggregate these measurements

Characteristics of an indicator of sustainability
Relatively easy to measureCould be repeatedSensitiveCorrespond to level of aggregation
that is appropriateDeveloped in a participatory manner

Concept of Ecological FootprintThe quantity of bioproductive land that is required to support current consumption
food, housing, transport, consumer goods, services
Includes land needed for absorption of waste
Wackernagel and Reese, Our Ecological Footprint

Assumptions
The data for resource consumption and waste present and accessible
We have the data that allows conversion from these various categories to one “currency”, e.g. land
Does not deal with pollution beyond carbon dioxide

US Ecological Footprint- 2001Redefining Progress website
Note: new fishing numbers
Total
.7 5.4
0 5.2
0 4.3
0 5.8
0 2.8
.7 23.5

Consumption in over 60 categories Add imports and subtract exportsResource use and waste emissions
are expressed in land area required -- one unit

Ecological footprints of nations - 1999 data
US 24 acresCanada 22 acresSwitzerland 12.5Germany 10 acresItaly 9 acresChina 4 acresIndia 2 acresRedefining Progress website 2002

Energy land
Land neededto absorb CO2
Less 35%absorbed intoocean
2.47 acre/1 ha
acre = football field

Crop and range land
Productive land available for growing feed, oil, fiber, rubber
Most land of all categoriesUnderestimates environmental effectsEffect of diet
0.78 ha/T (vegetarian) vs. 2.1 ha to produce 1T of animal-based food
depends on how it is grown- high energy and agrochemical or low

Forest use
Fuelwood FiberPaper
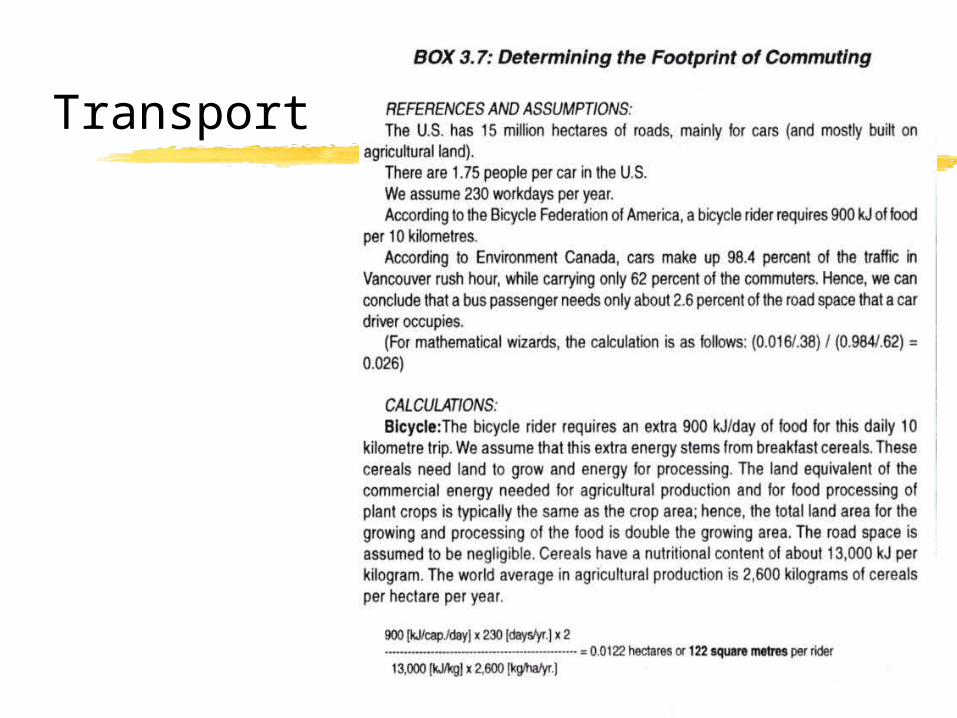
Transport

Transport

Fishing
Use of biologically productive part of ocean (10% of ocean)
Total FAO fish catch, including fish for fishmeal and 25% bycatch

How can the ecological footprint be used?
Global scaleNational levelMunicipalities, e.g. Thurston Co.Household/personal scaleIndividual items: tomatoes grown in
greenhouse vs. in the field

Global

Overshoot
Growth beyondcarrying capacityorwhen demand exceeds ecological supply

Humanity’s Ecological Footprint- 20-30% larger than is sustainable

Only 1.9 ha or 4.7 acres of biologically productive space per person on Earth
World average is 2.3 ha or 5.6 acres

Recognition
Proceedingsof the National Academy of Sciences, July 2002Concludes thatsince 1980s haveexceeded regenerativecapacity of biosphere
1999- 20% overshoot

Global Ecological Demand over time in six categories
Wackernagelet al. 2002Energy
footprinthuge and growing!

National EF with capacity and deficit
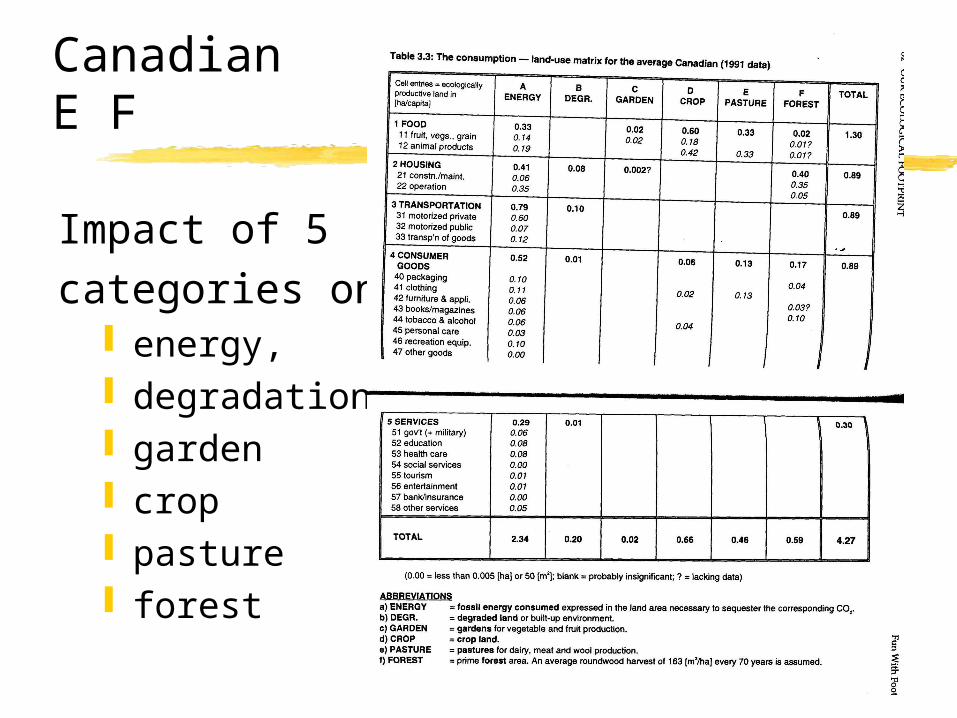
CanadianE F
Impact of 5categories on
energy, degradation garden crop pasture forest

Regional E F
Lower Fraser RiverValley BCproblem can be
trade

Ecological Footprint of Thurston County
“According to new calculations that more accurately account for CO2 emissions, Thurston County's “ecological footprint” is even bigger than reported in our 1997 Indicator Update. At 10.3 hectares (25.4 acres) per capita, sustaining our current population requires a land area ten times the size of Thurston County. At projected growth rates, we'll require one and a half times that amount of land to maintain our current quality of life — unless many more of us redefine what “quality of life” means, adopt an ethic of “voluntary simplicity,” and radically reduce our consumption.”
--Dr. Paula Swedeen, Sustainable Community Roundtable

Comparingsystems
Greenhousevs.field grown(10x greater)

Personal
Calculation ofindividual ecological footprint

Opportunity for personal reflection
Assignment due next Thursday, January 15.