five forces michael porter
DESCRIPTION
strategi 5 kekuatan utamaTRANSCRIPT
Michael Porter’sFive Forces Five Forces
ModelModel
Michael Porter …
“An industry’s profit potential is largely determined by the intensity of competitive intensity of competitive rivalryrivalry within that industry.”
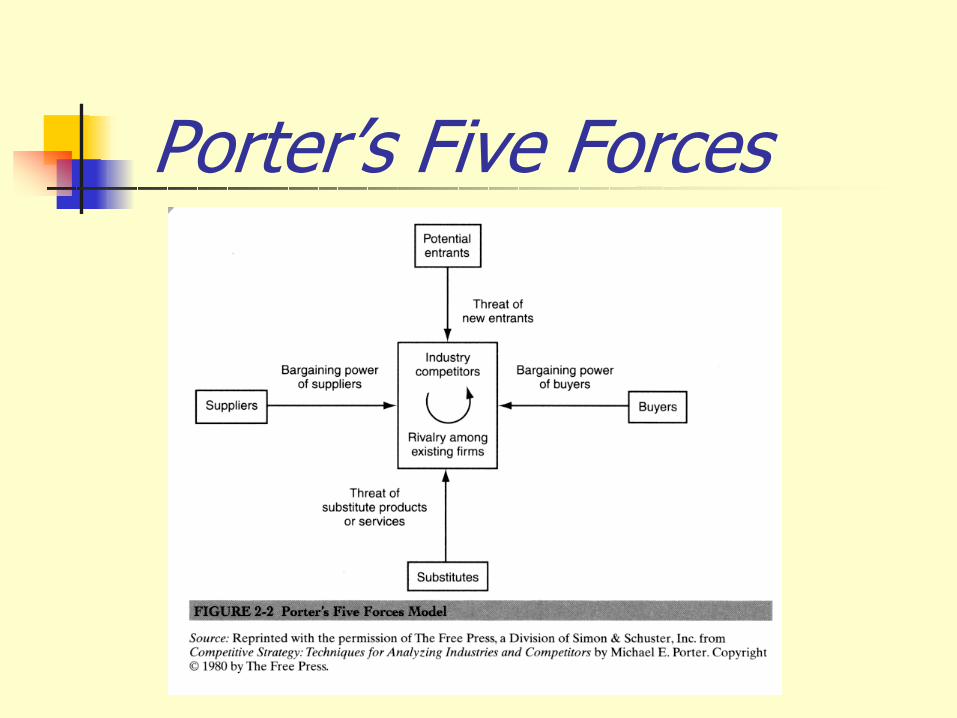
Porter’s Five Forces
Portfolio Analysis …… Strategy at the time (1970s) was focused on two dimensionstwo dimensionsof the portfolio grids …
… Industry AttractivenessIndustry Attractiveness… Competitive PositionCompetitive Position
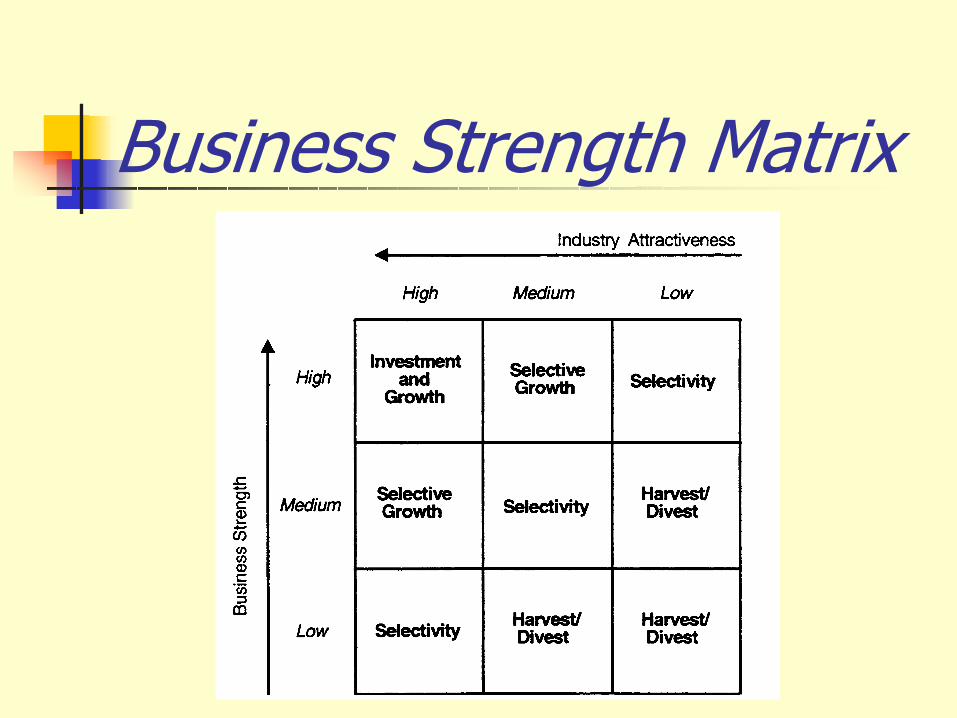
Business Strength Matrix

Where was Where was Michael Porter Michael Porter coming from?coming from?
School of Economics …… at Harvard …
… Exposed Porter to the Industrial OrganizationIndustrial Organization (I0) sub-field of Economics.
Structural reasons why …… some industries were profitable* Firm concentration
* Established cost advantages* Product differentiation
* Economies of scale
Structural reasons …
… all represented barriers to barriers to entryentry in certain industries, thus allowing those industries to be more more profitableprofitable than others.
But EconomistsEconomists …
… generally concerned them-selves with the minimizationminimizationrather than maximization of what they viewed as excess excess profitsprofits (i.e., Public Policy).
Business policy objective… of profit maximization
Porter developed his elaborate framework for the structural structural analysisanalysis of industry attractiveindustry attractive--ness ness within the framework of Business Policy.
Michael Porter …
By using a frameworkframework rather than a formal statistical modelformal statistical model, Porter identified the relevant variables variables and the questions questions that the user must answer in order to develop conclusions tailored to a particular industry and company.
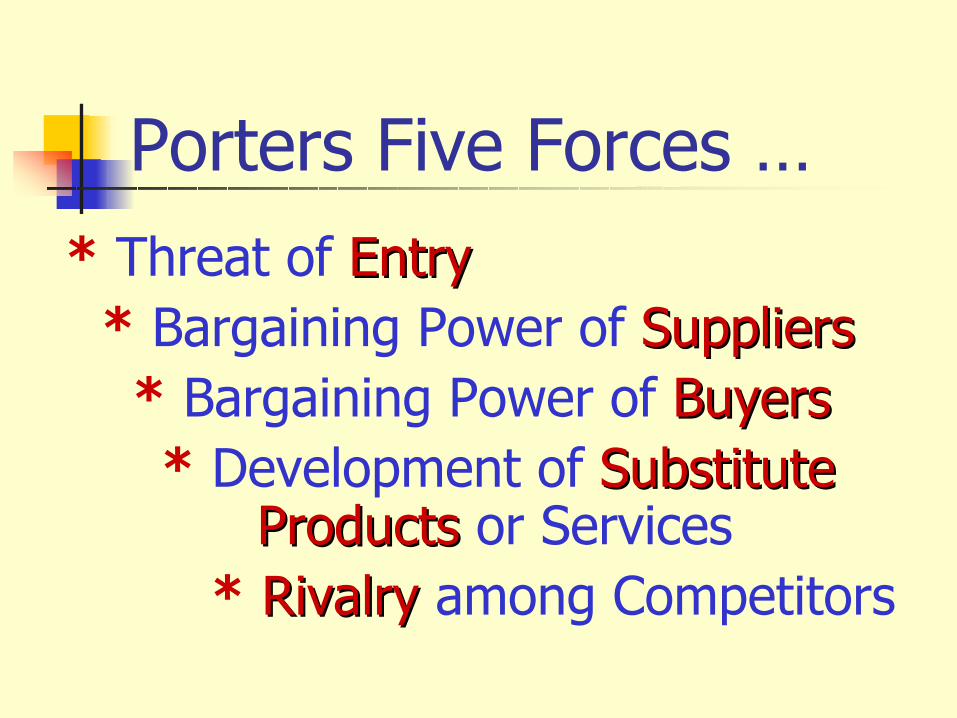
Porters Five Forces …* Threat of EntryEntry
* Bargaining Power of SuppliersSuppliers* Bargaining Power of BuyersBuyers* Development of SubstituteSubstitute
ProductsProducts or Services* RivalryRivalry among Competitors
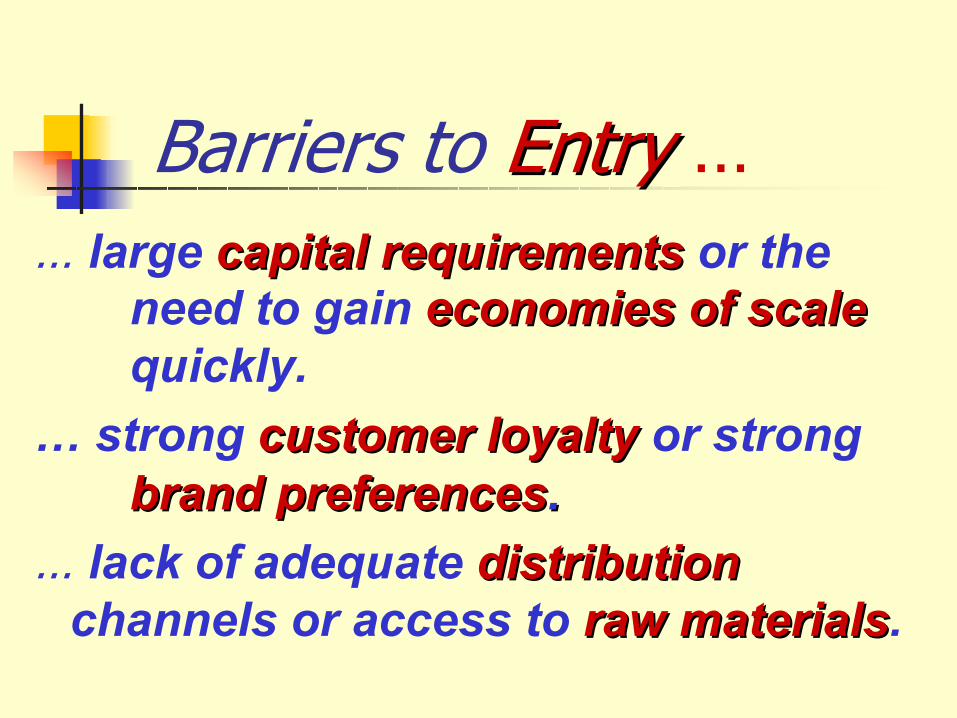
Barriers to EntryEntry …… large capital requirementscapital requirements or the
need to gain economies of scaleeconomies of scalequickly.
… strong customer loyaltycustomer loyalty or strong brand preferencesbrand preferences..
… lack of adequate distributiondistributionchannels or access to raw materialsraw materials.
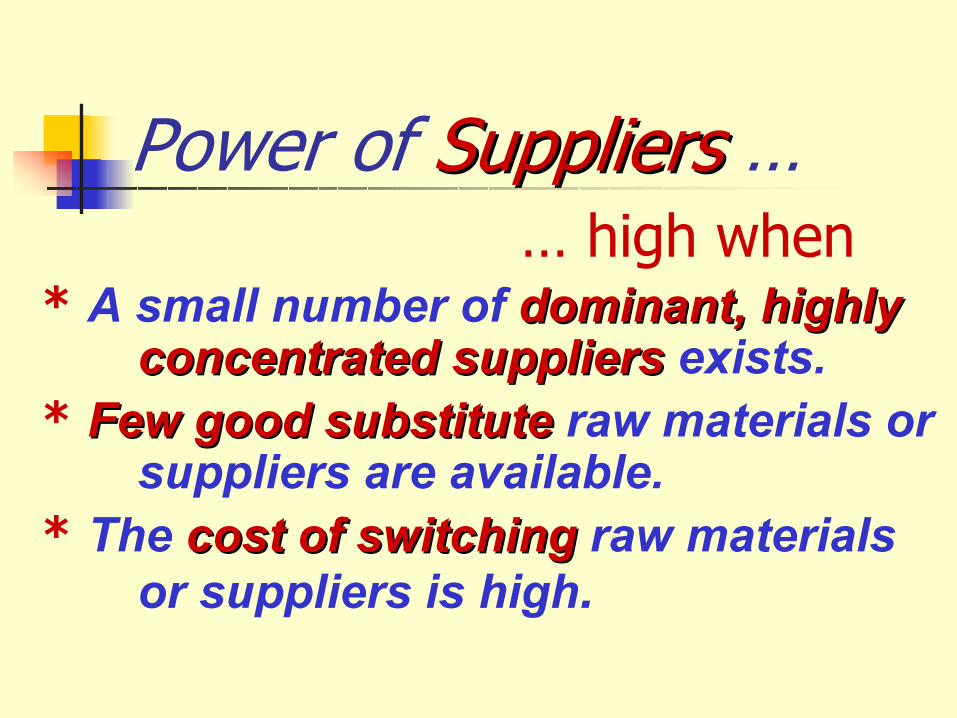
Power of Suppliers Suppliers …… high when
* A small number of dominant, highly dominant, highly concentrated suppliersconcentrated suppliers exists.
* Few good substituteFew good substitute raw materials or suppliers are available.
* The cost of switchingcost of switching raw materials or suppliers is high.
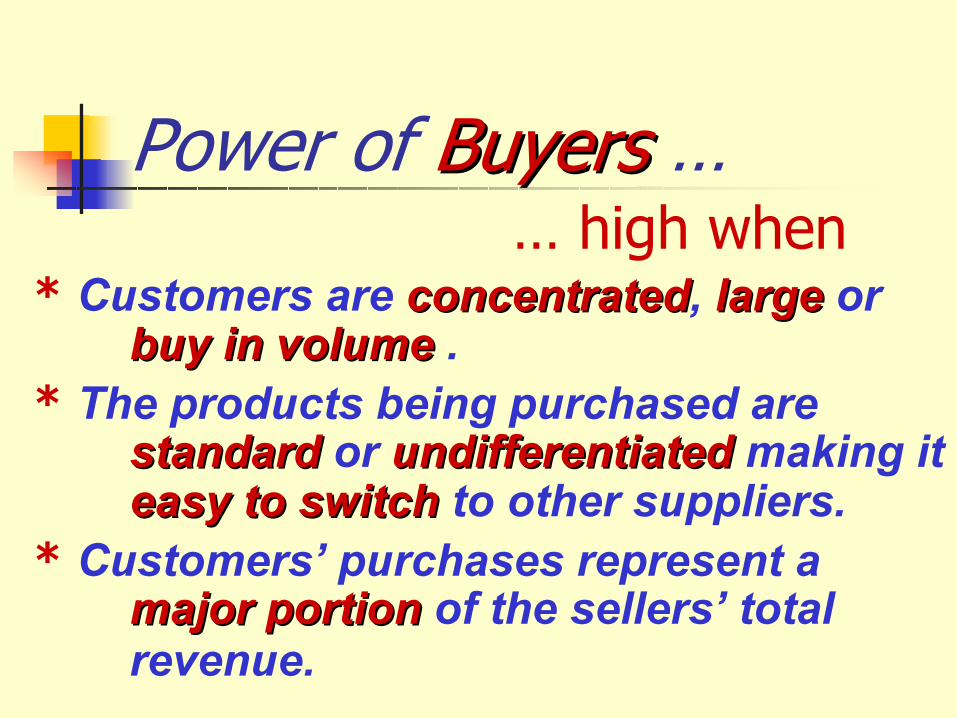
Power of Buyers Buyers …… high when
* Customers are concentratedconcentrated, largelarge or buy in volumebuy in volume .
* The products being purchased are standard standard or undifferentiatedundifferentiated making it easy to switcheasy to switch to other suppliers.
* Customers’ purchases represent a major portionmajor portion of the sellers’ total revenue.
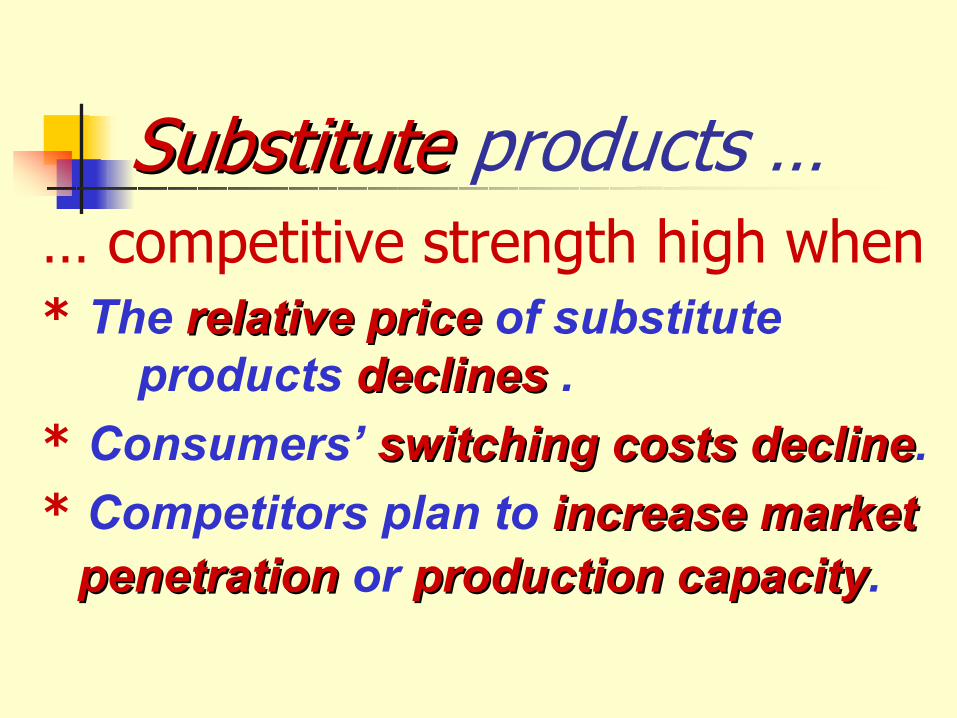
Substitute Substitute products …… competitive strength high when* The relative pricerelative price of substitute
products declinesdeclines .* Consumers’ switching costs declineswitching costs decline. * Competitors plan to increase market increase market
penetrationpenetration or production capacityproduction capacity.
Rivalry Rivalry among competitors… intensity increases as
* The numbernumber of competitors increasesincreasesor they become equal in sizeequal in size.
* Demand for the industry’s products declinesdeclines or industry growth slowsindustry growth slows.
* Fixed costsFixed costs or barriers to leavingbarriers to leaving the industry are highhigh.
SummarySummary …As rivalry among competing firms intensifiesintensifies, industry profits declinedecline, in some cases to the point where an industry becomes inherently inherently unattractiveunattractive.
The Experience CurveExperience Curve …… as an entry barrier
Unit costs associated with economies of scale, the learning curve for labor, and capital-labor substitution decline with “experienceexperience,” and this creates a barrier to entrybarrier to entry, as new competitors with no “experience” face higher costs than established ones.
HoweverHowever …… If a new entrant has built the
newest, most efficient plant, it will not have not have to “catch upcatch up.”
… Technical advances purchased by new entrants – free from the legacy of heavy past Investmentsheavy past Investments –may provide those companies a cost advantagecost advantage over the leaders.
In addition In addition …The experience curve barrier can be nullified nullified by product or process innovations innovations that create an entirely new experience curve – one to which leaders may be poorly poorly positioned to jumppositioned to jump, but to which new entrants can alight as they enter the marketenter the market .
Strategic GroupsStrategic Groups …
Firms that face similar threats or similar threats or opportunitiesopportunities in an industry but which differ from the threats and opportunities faced by other other setssets of firms in the same industry (e.g., in the beverage industry: soft drinks group versus alcoholic beverages).
Strategic GroupsStrategic Groups …Rivalry generally is more intense within strategic groupswithin strategic groupsthan between them because members of the same group focus on the same market same market segmentssegments with similar productssimilar products, strategiesstrategies and resourcesresources.
Industry & Product Industry & Product Life CyclesLife Cycles