five-year review report - united states … review report third five-year review report for monsanto...
TRANSCRIPT
Five-Year Review Report
Third Five-Year Review Report
For
Monsanto Corporation (Augusta Plant) (EPA ID #: GAD001700699)
Augusta Richmond County, Georgia
September 2010
Prepared by: U.S. Army Corps of Engineers Savannah District P. O. Box 889 Savannah, GA 31402-0889
Director, Superfund Division US EPA, Region 4
111111111111 111111111111111 11111111111111111111111 10760579
~----------------------------------------------------------------------------------------
Table of Contents
1. Introduction ..............................................................................................................................1
2. Site Chronology ........................................................................................................................2
3. Background ..............................................................................................................................3
3.1 Physical Characteristics ...........................................................................................3
3.2 Land and Resource Use ............................................................................................3
3.3 History of Contamination ....................................................................................... .4
3.4 Initial Response ........................................................................................................4
3.5 Basis for Taking Action ...........................................................................................5
4. Remedial Actions .....................................................................................................................6
4.1 Remedy Selection ....................................................................................................6
4.2 Remedy Implementation ..........................................................................................7 4.2.1 Area I ........................................................................................................... 7 4.2.2 Area II ..........................................................................................................8 4.2.3 Area III ......................................................................................................... 8
4.3 System Operations and Maintenance ....................................................................... 8
5. Progress Since the Last Review ............................................................................................10
5.1 Overall Progress ..................................................................................................... 10
5.2 Recommendations from the 2005 Five-Year Review ............................................ 10
6. Five-Year Review Process ...............................................................................................12
6.1 Administrative Components .................................................................................. 12
6.2 Community Involvenlent ....................................................................................... 12
6.3 Document Revie\v .................................................................................................. 12
6.4 Data Review ........................................................................................................... 13 6.4.1 Groundwater Geochemical Evaluations .................................................... 13 6.4.2 Aquifer Material Evaluations ..................................................................... 14 6.4.3 Leaching Tests ........................................................................................... 15 6.4.4 Adsorption Tests ........................................................................................ 16 6.4.5 Background and Trend Evaluations ........................................................... 16 6.4.5.1 pH Trends ................................................................................................... 16 6.4.5.2 Arsenic Trends ........................................................................................... 17 6.4.5.3 Background Concentrations ....................................................................... 18
6.5 Site Inspection ........................................................................................................ 19

6.6 Site Interviews ....................................................................................................... 19
7. Technical Assessnlent ...................................................................................................... 22
8. Issues ................................................................................................................................. 24
9. Recommendations and Follow-up Actions .................................................................... 25
10. Protectiveness Statement................................................................................................. 26
11. Next Review ...................................................................................................................... 27
List of Tables
Table I Chronology of Events
Table 2 2005 Five-Year Review Recommendations and Follow-up Actions
Table 3 Arsenic Historical Monitoring Data Summary
Table 4 2010 Five-Year Review Issues
Table 5 2010 Five-Year Review Recommendations and Follow-up Actions
List of Figures
Figure 1 Site Location Map
Figure 2 2009 Average Potentiometric Map
Figure 3 Site layout
Figure 4 Approximate Extent of Groundwater Above MCl
Attachments
Attachment A Technical Memorandum
Attachment B Public Notice
Attachment C Interview Forms
Attachment D List of Documents Reviewed
Attachment E Site Photographs
Attachment F Site Inspection Checklist
11

List of Acronyms
ARAR Applicable or Relevant and Appropriate Requirement
AOC Administrative Order on Consent
Bls Below land surface
CD Consent Decree
CERCLA Comprehensive Environmental Response, Compensation, and Liability
CFR Code of Federal Regulations
CIC Community Involvement Coordinator
COC Contaminants of Concern
DO Dissolved Oxygen
EMP Electron Microprobe
EPA Environmental Protection Agency
EPD Georgia Environmental Protection Division
ft msl Feet above mean sea level
GPAL Groundwater Protection Achievement Levels
GPM Gallons per Minute
HTRW Hazardous Toxic Radiological Waste
MCL Maximum Contaminant Level
)lg/L Micrograms per Liter
MLEI EM Maximum Likelihood Estimation I Expectation Maximum
NCP National Oil and Hazardous Substances Pollution Contingency Plan
NPL National Priorities List
O&M Operations and Maintenance
ORP Oxidation Reduction Potential
OUs Operable Units
PCA Principal Component Analysis
POTW Publicly Owned Treatment Works
PRP Potentially Responsible Party
RA Remedial Action
RCRA Resource Conservation and Recovery Act
RI/FS Remedial Investigation/Feasibility Study
ROD Record of Decision
RPM Remedial Project Manager
SARA Superfund Amendments and Reauthorization Act
USACE U.S. Army Corps of Engineers
USC United States Code
XRF X-Ray Fluorescence
1Il

Executive Summary
The United States Environmental Protection Agency (EPA) Region 4 conducted the third tive-year review of the remedial action implemented at the Monsanto Corporation (Augusta Plant) Superfund Site (Site) in Richmond County, Georgia. The U.S. Army Corps of Engineers (USACE) Savannah District provided technical support for the review. The review was conducted from March 2010 through April 2010. The tirst and second five-year reviews were completed in April 2000 and September 2005 respectively. This five-year review is required as a matter of policy by the Comprehensive Environmental Response, Compensation, and Liability Act (CERCLA) because the remedial action is a post-Superfund Amendments and Reauthorization Act (SARA) action that, upon completion, will not leave hazardous substances, pollutants, or contaminants onsite above levels that allow for unlimited use and unrestricted exposure, but requires five years or more to complete.
A Record of Decision (ROD) was signed in 1990 requiring the potentially responsible party (PRP) to monitor the groundwater onsite and install extraction wells in the areas where arsenic levels exceed the Maximum Contaminant Level (MCL). Contaminated groundwater was extracted from the surticial aquifer and transported to a Publicly Owned Treatment Works (POTW) for treatment and disposal. This process is to continue until all onsite monitoring wells indicate that the MCL for arsenic is not exceeded for a period of two years.
Since the Site is adequately being addressed simultaneously by the State of Georgia under the Resource Conservation and Recovery Act (RCRA) and the same groundwater cleanup levels must be met to comply with the RCRA standards, EPA initiated the National Priorities List (NPL) deletion process. In March 1998, the Site was deferred to RCRA, and the State is overseeing the pump and discharge to POTW activities and the groundwater monitoring program for the Site.
The extraction system continues to operate with the removed groundwater being transported to a POTW for treatment and discharge. The groundwater remedial system consists of active extraction in Area I (region in the vicinity of former Landfill 1) at well MW-5 and in Area II (region in the vicinity of former Landfill 2) in extraction wells MW-24S and EX-3. Otfsite extraction in Area III monitoring wells MW-42 and MW-43 was discontinued on May 30, 2000.
The RCRA permit for the Site was changed in February 2002. Prayon, Inc. 's Pemlit [HW-074(S) Permit Condition IV.D.] states that the Groundwater Protection Achievement Levels (GPAL) for all groundwater monitoring is the MCL for arsenic. EPA has changed the MCL from 50 micrograms per liter (llg/L) to 10 ~lg/L. Under the RCRA permit, remediation must continue until the groundwater at the Site meets this level.
Based on the data reviewed, the Site inspection and interviews, the remedy is functioning as intended by the ROD. There have been no changes in the physical conditions of the Site that would affect the protectiveness of the remedy. Groundwater contamination at the Site persists above the cleanup levels and requires continued remediation and monitoring to ensure attenuation.
The issues identitied during the tive-year review are summarized below.
IV

• Significant decrease in flow rate from extraction well EX-3 potentially attributed to the accumulation of microorganisms along the well screen (bio-fouling)
• Inconclusive data trend in Area II potentially attributed to observed elevated pH
• Cleanup levels attainment in light of observed elevated groundwater pH level
• Groundwater restrictions are not in place as required in the 1990 ROD
The following recommendatisms were made to address these issues:
• Evaluate extraction well EX-3 to determine the cause of the decrease in flow rate and make the necessary modifications to the well to maintain consistent flow rates to support the drawdown cones of depression.
• Perform multivariate or stage-wise trend analyses of arsenic data in areas with elevated pH levels to account for the covariate.
• Perform a comprehensive evaluation to determine the background pH level and arsenic concentration and utilize the results of this evaluation to determine whether modifications of the remedy and/or the cleanup levels are necessary.
• Place groundwater use restrictions on the surficial aquifer as required in the 1990 ROD
The remedy at the Site is currently protective of human health and the environment because there are no current exposure pathways to the contaminated aquifer. However, in order for the remedy to be protective in the long-term, groundwater restrictions to prevent exposure to the contaminated surficial aquifer while remediation is ongoing will be required. In addition, a comprehensive evaluation to determine the background pH level and arsenic concentrations will be required. The results of this evaluation will be utilized to determine whether modifications of the remedy and/or the cleanup levels are necessary.
v
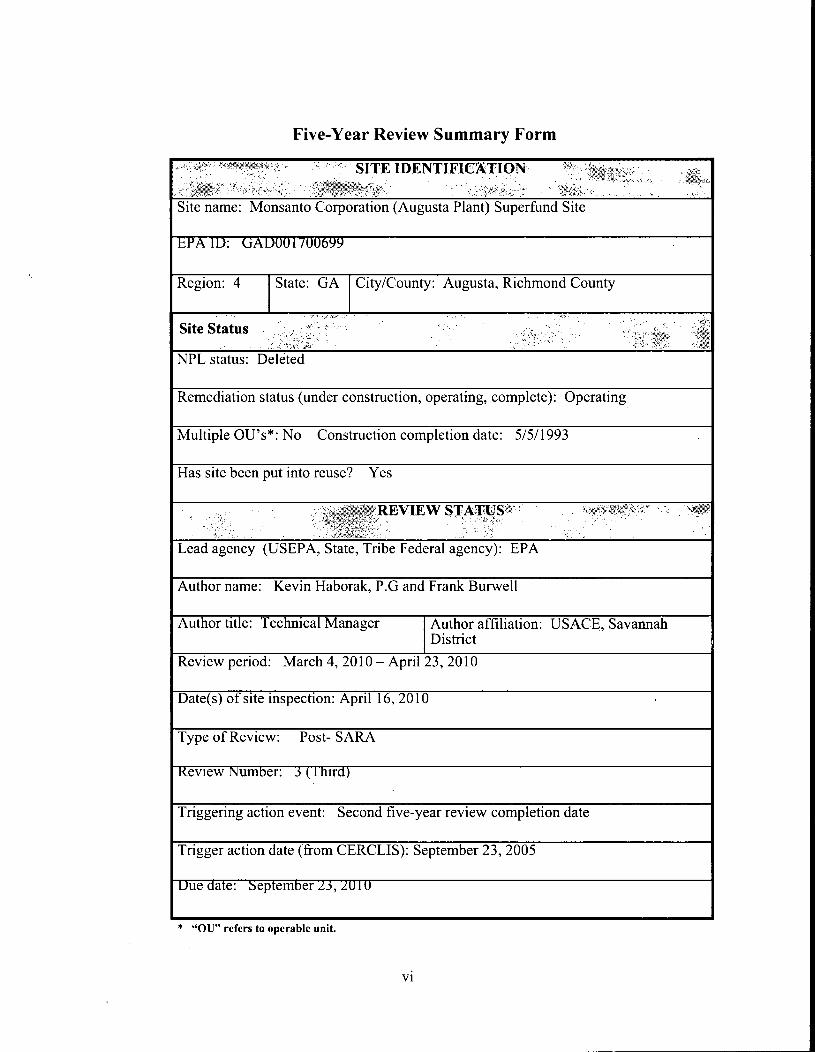
Five-Year Review Summary Form
Site name: Monsanto Corporation (Augusta Plant) Superfund Site
EPA lU: liAUUU I/UUb~~
Region: 4 State: GA City/County: Augusta, Richmond County
~. ~ ••Y,." _¥..,.-.,". : ..
Site Status .•·.•···.:,/1,···· . NPL status: Deleted
Remediation status (under construction, operating, complete): Operating
Multiple OU's*: No Construction completion date: 5/5/1993
Has site been put into reuse? Yes
Lead agency (USEPA, State, Tribe Federal agency): EPA
Author name: Kevin Haborak, P.G and Frank Burwell
Author title: Techmcal Manager Author affiliation: USACE, Savannah District
Review period: March 4,2010 - April 23, 2010
Date(s) of site inspectIOn: April 16, 2010
Type of Review: Post- SARA
Kevlew Number: J (I hml)
Triggering action event: Second five-year review completion date
Trigger action date (from CERCLIS): September 23, 2005
Uue date: September LJ, LUlU
* "OU" refers to operable unit.
VI

Five -Year Review Summary Form, cont'd.
Issues:
Based on the data reviewed, the Site inspection and interviews, the remedy is functioning as intended in the ROD. There have been no changes in the physical conditions of the Site that would affect the protectiveness of the remedy. The issues identified during the review include:
Decreased flow rate of extraction well EX-3
Elevated groundwater pH level observed at the Site
Attainment of cleanup levels in light of pH level
Groundwater use restrictions are not in place
Recommendations and Follow-up Actions:
Evaluate extraction well EX-3 to determine the cause of the decrease in flow rate and make the necessary modifications to the well to maintain consistent flow rates to support the drawdown cones of depression
Perform multivariate or stage-wise trend analyses for arsenic in areas with elevated pH levels in groundwater to account for the covariate
Perform a comprehensive evaluation to determine the background pH level and arsenic concentration and utilize the results of this evaluation to determine whether modifications of the remedy and/or the cleanup levels are necessary.
Place groundwater use restrictions on the surficial aquifer as required in the 1990 ROD
Protectiveness Statements:
The remedy at the Site is currently protective of human health and the environment because there are no current exposure pathways to the contaminated aquifer. However, in order for the remedy to be protective in the long-term, groundwater restrictions to prevent exposure to the contaminated surficial aquifer while remediation is ongoing will be required. In addition, a comprehensive evaluation to determine the background pH level and arsenic concentration will be required. The results of this evaluation will be utilized to determine whether modifications of the remedy and/or the cleanup levels are necessary
Other Comments:
None
VII

1. Introduction
EPA conducted the third five-year review of the remedial action implemented at the Site from March 2010 to April 2010. The USACE, Savannah District provided technical support during the development of this five-year review report.
The purpose of the five-year review is to evaluate the implementation and performance of the remedy to determine whether the remedy is or will be protective of human health and the environment. In addition, a report summarizing the issues identified during the review is developed. Recommendations and follow-up actions to address the identified issues are also presented in the report.
EPA is overseeing the five-year review process pursuant to CERCLA §121 (c) and the National Contingency Plan (NCP). CERCLA §121 states:
If the President selects a remedial action that results in any hazardous substances, pollutants, or contaminants remaining at the site, the President shall review such remedial action no less often than each five years after the initiation ofsuch remedial action to assllre that human health and the environment are being protected by the remedial action being implemented. In addition, ifupon such review it is the judgment ofthe President that action is appropriate at sllch site in accordance with Section 9604 (CERCLA §104) or Section 9606 (CERCLA §106) the President shall take or require sllch action. The President shall report to the Congress a list of facilities for 'which such review is required. the results ofall such reviews, and any actions taken as a result ofsuch reviews.
EPA interpreted this requirement further in the NCP, as stated in 40 Code of Federal Regulations (CFR) §300.430(f)(4 )(ii):
Ifa remedial action is selected that results in hazardous substances, pollutants. or contaminants remaining at the site above levels that allow for unlimited use and unrestricted exposure. the lead agencJ' shall review such action no less ojien than evelY jive years after the initiation ofthe selected remedial action.
The trigger for this review is the approval date of the second five-year review report (September 23,2005). The five-year review is required as a matter of policy by CERCLA because the remedial action is a post-SARA action that, upon completion, will not leave hazardous substances, pollutants, or contaminants onsite above levels that allow for unlimited use and unrestricted exposure, but requires five years or more to complete.

2. Site Chronology
A chronology of the key events for the Site is presented in Table 1.
2
I
3. Background
This section presents a summary of the Site background information including, physical characteristics, land and resource use, history of the contamination, initial response, and the basis for taking action.
3.1 Physical Characteristics
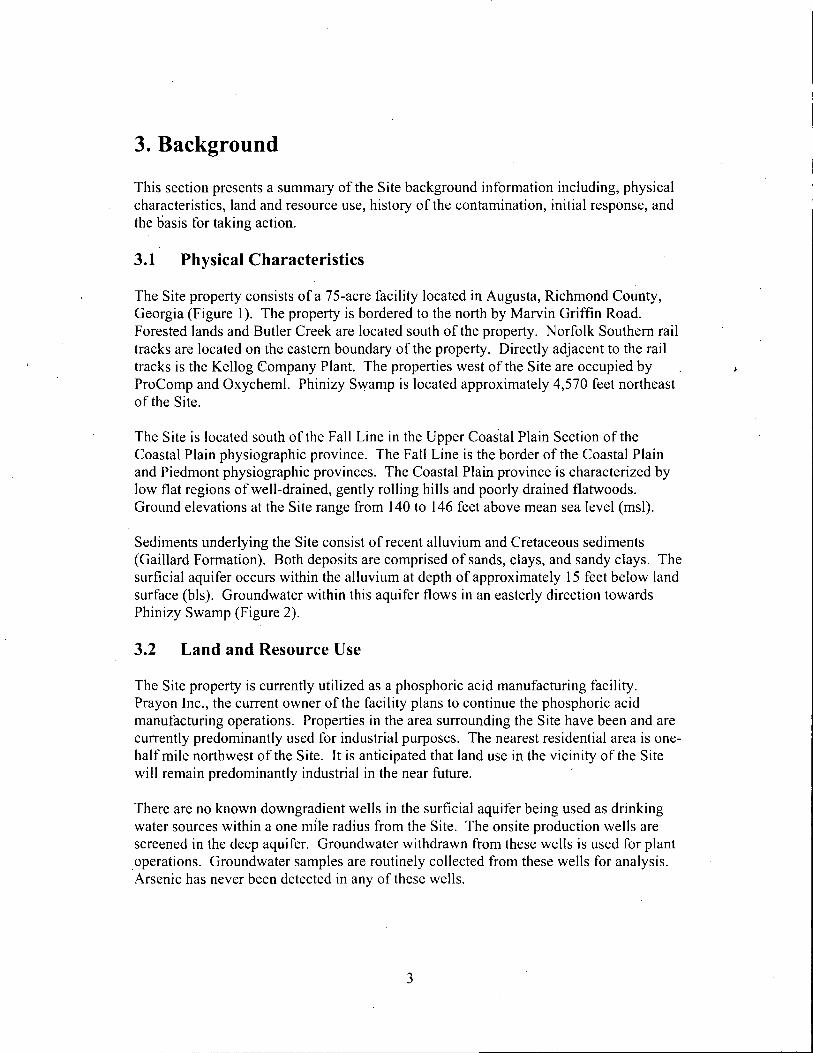
The Site property consists of a 75-acre facility located in Augusta, Richmond County, Georgia (Figure 1). The property is bordered to the north by Marvin Griffin Road. Forested lands and Butler Creek are located south of the property. Norfolk Southern rail tracks are located on the eastern boundary of the property. Directly adjacent to the rail tracks is the Kellog Company Plant. The properties west of the Site are occupied by ProComp and Oxycheml. Phinizy Swamp is located approximately 4,570 feet northeast of the Site.
The Site is located south of the Fall Line in the Upper Coastal Plain Section of the Coastal Plain physiographic province. The Fall Line is the border of the Coastal Plain and Piedmont physiographic provinces. The Coastal Plain province is characterized by low flat regions of well-drained, gently rolling hills and poorly drained flatwoods. Ground elevations at the Site range from 140 to 146 feet above mean sea level (msl).
Sediments underlying the Site consist of recent alluvium and Cretaceous sediments (Gaillard Formation). Both deposits are comprised of sands, clays, and sandy clays. The surficial aqui fer occurs within the alluvium at depth of approximately 15 feet below land surface (bls). Groundwater within this aquifer flows in an easterly direction towards Phinizy Swamp (Figure 2).
3.2 Land and Resource Use
The Site property is currently utilized as a phosphoric acid manufacturing facility. Prayon Inc., the current owner of the facility plans to continue the phosphoric acid manufacturing operations. Properties in the area surrounding the Site have been and are currently predominantly used for industrial purposes. The nearest residential area is one half mile northwest of the Site. It is anticipated that land use in the vicinity of the Site will remain predominantly industrial in the near future.
There are no known downgradient wells in the surficial aquifer being used as drinking water sources within a one mIle radius from the Site. The onsite production wells are screened in the deep aquifer. Groundwater withdrawn from these wells is used for plant operations. Groundwater samples are routinely collected from these wells for analysis. Arsenic has never been detected in any of these wells.
3

3.3 History of Contamination
The Site property has been utilized as a phosphoric acid manufacturing facility since 1962. Several waste products including arsenic trisulfide were generated during the manufacturing operations. These materials were disposed of at two small landfills (Landfill #1 and Landfill #2), approximately 0.1 acre each, located along the eastern boundary of the property (Figure 3). These practices resulted in the contamination of soil and groundwater at the Site. Plant officials estimated, approximately 1,500 pounds (lb) of arsenic was placed in these two landfills from 1966 to 1974. The landfiIls were covered with soil, crowned with gravel, seeded with grass, and closed in 1971 and 1977 respectively.
3.4 Initial Response
The Georgia Environmental Protection Division (EPD) identified the Site in August 1975. In June 1979, under EPD's oversight, the PRP initiated a groundwater monitoring program to assess the quality of groundwater in the vicinity of the landfills. In February 1980, additional monitoring wells were installed and soil and groundwater samples were collected and analyzed. Analytical results of the coIlected soil and groundwater samples revealed that soil and surficial aquifer groundwater in the vicinity of the landfills contained arsenic at concentrations above human health standards.
In November 1983, the PRP excavated the contents of the landfiIls. The excavated materials were transported to a RCRA pern1itted facility in Emelle, Alabama. Post excavation soil samples collected from the bottom of the excavation areas resulted in concentrations below the extraction procedures (EP) toxicity standards of 5 part per million (ppm) for arsenic. The excavated landfill areas were backfilled and graded to maintain positive runoff drainage. The areas were also seeded to prevent erosion.
In September 1984, the Site was listed on the NPL due to the potential risks presented by the groundwater contamination. In January 1989, EPA issued a special notice letter to Monsanto Corp., the PRP, and provided them the opportunity to conduct the Remedial Investigation and Feasibility Study (RIlFS) for the Site under EPA's oversight. In April 1989, the PRP entered into an Administrative Order on Consent (AOe) with EPA to conduct the RIfFS. The RIfFS activities were conducted from October 1989 until September 1990. Two groundwater plumes containing arsenic at concentrations above the MeL (50 JlgfL) were identified during the RIfFS. The extent of groundwater containing arsenic at concentrations above the MCL is presented on Figure 4. It should be noted that, in January 2006, the MeL for arsenic was changed from 50 JlgfL to 10 ~lgfL.
In December 1990, EPA issued the ROD summarizing the remedy selected to address the Site contamination. The primary components of the remedy are presented in Section 4 of this report.
4

3.5 Basis for Taking Action
During the RIfFS, human health and ecological risk assessments were conducted. These assessments concluded no exposure pathways existed under the current conditions of the Site. However, future exposure through ingestion of the contaminated groundwater resulted in excess cumulative risk. Groundwater at the Site contained arsenic at concentrations above the Mel (50 ~lgfl at the time of the ROD). Therefore, remedial action to address the contamination was necessary.
5
4. Remedial Actions
In accordance with CERCLA and the NCP, the overriding goals for any remedial action are protection of human health and the environment and compliance with applicable or relevant and appropriate requirements (ARARs). A number of remedial alternatives were considered for the Site, and final selection was made based on an evaluation of each alternative against nine evaluation criteria that are specified in Section 300.430(e)(9)(iii) of the NCP. The nine criteria include:
• Overall Protectiveness of Human Health and the Environment
• Compliance with ARARs
• Long-Term Effectiveness and Permanence
• Reduction of Toxicity, Mobility or Volume of Contaminants through Treatment
• Short-term Effectiveness
• Implementability
• Cost
• -State Acceptance
• Community Acceptance
4.1 Remedy Selection
The ROD selecting the remedy to address the Site groundwater contamination was issued in December 1990. The primary objectives of the remedy consist of minimizing the potential migration of the contamination from the former landfill areas to Phinizy Swamp and the underlying Cretaceous aquifer, and restoring the groundwater in the surficial aquifer to drinking water quality for arsenic.
The primary components of the remedy included:
• Continue quarterly groundwater monitoring during the design of the selected remedy to determine compliance with the GPAL
• Commence extraction of the groundwater which exceeds the Primary Drinking Water Standard for arsenic should the annual average of the levels as determined by quarterly monitoring exceed the GPAL
• Discharge extracted groundwater for treatment at a POTW
• Monitor groundwater for a minimum of two (2) years following the achievement of the MCL
• Groundwater use restrictions on the surficial aquifer and Site access would be required during this period
6

4.2 Remedy Implementation
In October 1991, the Consent Decree (CD) for the implementation of the Site remedy· was finalized. Subsequently, the PRP prepared the necessary remedial design documents as specified in the CD. The design documents were submitted to EPA for approval prior to implementation.
As specified in the ROD, in 1991, a quarterly groundwater monitoring program was initiated. The purpose of this program was to monitor the Site groundwater during the remedial design phase of the project to ensure compliance with the GPAL. Analytical results of the groundwater samples collected in October 1991 and January 1992 showed the Site groundwater contained arsenic at concentrations above the GPAL and MCL. Therefore, implementation of the pump and discharge system specified in the ROD was required.
Construction activities were initiated in February 1993 and were completed in April 1994. Subsequent to the completion of the construction activities, a final inspection was conducted to ensure compliance with the design documents.
The groundwater extraction system consisted of two extraction wells EX-l and EX-2 located in the vicinity of former landfill #2 and landfill # I respectively. On February 23, 1993, an unsuccessful attempt to redevelop extraction well EX-l was made. Subsequently, extraction well EX-3 was installed in the vicinity of former landfill #2 as a replacement for EX-I, which was abandoned. Operation of the Site groundwater extraction and discharge system is ongoing since the cleanup levels have not been met. A summary of the pump and discharge system for each area is presented below.
4.2.1 Area I (Adjacent to Former Landfill #1)
Extraction in Area I started on April 16, 1993. Groundwater was extracted from extraction well EX-2 at a rate of 0.84 gallon per minute (gpm). This extraction system operated for approximately one month and shutdown on May 28, 1993. The system was shutdown because the extraction well was located in a perched water zone and that zone had been dewatered.
On July 10, 1995, operations of an injection/extraction system were initiated in Area I. This system consisted of the injection of potable water from well MW-A and extraction of the injected water through an adjacent well. Initially, the injected water was extracted from MW-S. Piezometer well P3 and MW-43 were subsequently utilized to extract the injected water. On May 17,2007 extraction was initiated at MW-l1 to address elevated arsenic concentrations detected in this well. Currently, contaminated groundwater is being extracted from MW-5 and MW-II. The combined extraction rate from these two wells is approximately 1.5 gpm.
7
4.2.2 Area II (Adjacent to Former Landfill #2)
Extraction in Area II started on April 16, 1993. The extraction system initially consisted of one extraction well (EX-3), extracting contaminated groundwater at a rate of approximately 27.5 gpm. EX-3 extraction rate has been adjusted to maintain drawdown and balance extraction from other wells as they have been added to the system. EX-3 currently produces approximately 0.26 gpm. This is a signi(icant reduction from the initial pumping rate. This rate reduction may be attributed to the accumulation of microorganisms along the well screen (bio-fouling).
On July 11, 1994, MW-24D was added to the extraction system to address elevated arsenic concentrations detected in this well. Extraction at MW-24D was discontinued on October 15, 1996 and was initiated at MW-24S because elevated arsenic concentrations were observed in the shallow aquifer. Extraction was continued at MW -24S until May I, 2007 when extraction at MW-24D was resumed. Extraction at MW-24D is ongoing at a rate of approximately 0.19 gpm.
4.2.3 Area III (Offsite Area)
Pump and discharge activities were conducted in Area III (offsite area) from February 14, 1994 until May 30,.2000. Groundwater was extracted from this area because elevated arsenic concentrations were obserVed from the monitoring wells located on the Murray Biscuit Company (currently Kellogg Company) facility. Monitoring wells MW-42 and MW-43 were utilized to extract the contaminated groundwater. These wells were abandoned in May 2000 during the construction expansion of the Murray Biscuit Company facility. In September 2001, a monitoring well network was installed downgradient to MW-42 and MW-43 to monitor the contaminated groundwater.
4.3 System Operations and Maintenance (O&M)
In June 1993, the PRP developed an O&M Plan for the Site. The purpose of this plan was to document the O&M activities to be implemented to ensure the integrity and functionality of the remedial system. The primary O&M activities implemented at Site included:
• Operating submersible pumps, in one or more groundwater extraction wells
• Opening and closing pipe valves
• Checking system components to assure unimpeded and uninterrupted flow, proper flow metering/monitoring and system function
• Periodic sampling of extracted groundwater
• Data collection and record keeping.
The O&M Plan also described the monitoring activities to be performed during the operation of the treatment system. Monitoring of the remedial action system consists of the daily O&M walk-through inspection. Flow readings. and water levels are recorded for
8

each of the extraction wells and water levels were recorded for select monitoring wells. During the design phase of the project, a quarterly groundwater sampling program was developed and implemented. Groundwater sampling frequency was reduced and sampling is conducted semi-annually. Groundwater sampling will continue until the cleanup levels are met. '
The level of effort required to operate and maintain the system is relatively minimal. As stated above, Prayon's personnel are perfomling the daily O&M activities to ensure the integrity of the system. The estimated total annual costs to operate and maintain the system and to perform the required groundwater sampling and monitoring are $100,000.
9

5. Progress Since the Last Review
The second five-year review for the Site was conducted from April to July 2005. A report documenting the results of the review was completed in September 2005. The report stated the remedy is expected to be protective of human health and the environment upon completion, and in the interim, exposure pathways that could result in unacceptable risks are being controlled.
5.1 . Overall Progress
The extraction system is operating. Contaminated groundwater is being extracted and discharged at a POTW. The treatment system will continue to operate until arsenic concentrations are below the MCL.
Currently, MW-5 and MW-ll are actively extracting groundwater in Area I (vicinity of Landfill #1). The average extraction rates for MW-5 and MW-II are 0.84 gpm and 0.72 gpm respectively. In Area II (vicinity of Landfill #2), contaminated groundwater is being extracted from EX-3 and MW-24D at rates of 0.26 gpm and 0.19 gpm respectively.
In June 2005, EPD indicated that a comprehensive sampling of all Site monitoring wells needed to be performed to provide a snapshot of the current Site conditions. All 47 monitoring wells were sampled in January 2006 to comply with this request. The results of the sampling showed that arsenic concentrations at 19 monitoring wells were above the current MCL (10 11 gIL ).
5.2 Recommendations from the 2005 Five-Year Review
The recommendations identified during the 2005 five-year review are summarized in Table 2.
To address the recommendations identified in the second five-year review (September 2005), Solutia conducted several studies to further characterize the Site and to evaluate the mobilization and distribution of arsenic in the groundwater.
The January 2006 data along with select historical data were evaluated. The parameters that were evaluated included pH, oxidation reduction ·potential (ORP), dissolved oxygen (DO), temperature, specific conductivity, ferrous iron, major cations, major anions, iron, manganese and silica. In August 2006, groundwater samples were collected from 21 monitoring wells. The collected groundwater samples were analyzed for major ion species. This sampling was performed to evalu~te the geochemical characteristics of the groundwater at selected locations to determine the species of arsenic present at the Site. The results of the analyses were also used to assess t~e factors controlling the mobility and attenuation of arsenic and to evaluate the migration of groundwater from upgradient areas.
10
------------------------------------------------
------------------
Based on the sampling and analysis performed in January and August 2006, a program was developed to evaluate the mobilization and transport of arsenic at the Site. The objectives of this study consisted of the following:
• Evaluate the conditions and factors controlling the mobility and distribution of arsenic in the groundwater
• Evaluate the impacts of upgradient elevated pH and dissolved solids on the mobility and distribution of arsenic in onsite groundwater
• Evaluate alternatives to groundwater pump and treat remediation in areas where arsenic exceeds 10 Ilg/L
The study utilized multivariate statistical techniques to evaluate the August 2006 sampling data and the data collected from three additional monitoring wells in January
·2007. The study also included additional soil and groundwater sampling and analysis. In order to evaluate the soil onsite, 10 soil borings were installed in background areas. Continuous core samples were collected at each boring location. The collected soil samples were analyzed using several techniques including, X-ray Fluorescence (XRF), Electron microprobe (EMP), Leaching Tests, and Adsorption Tests. Two of the soil borings were converted into permanent monitoring well locations.
The XRF analysis was performed to determine the quantity of arsenic that was present in the soil samples. The EMP testing was utilized to determine the form, species, and chemical makeup of the arsenic in the soil. EMP testing provides insight into the geochemical history of individual soil particles. Leaching tests were performed to deternline how arsenic mobilization is affected by pH, phosphorus, and silica. A different concentration of each variable was added to the soil collected from the Site. The capability of each solution to leach arsenic from the soil was deternlined by using this test. Adsorption tests were performed to measure the potential for the soil to adsorb the arsenic in groundwater. The results of the evaluation are discussed in Sections 6.5.1 through 6.5.4.
In April 20 I 0, Solutia conducted additional statistical analyses to address the recommendations identified during the 2005 five-year review. A summary of these analyses were presented to the USACE during the Site visit. A technical memorandum providing additional details of the methods used and the results was provided to the USACE on April 20, 20 I O. A copy of this technical memorandum is included in Attachment A.
A database containing the historical data for pH and arsenic was developed. The data were transformed using standard methods. The transfornled pH and arsenic data were then evaluated for trends using the univariate non-parametric Mann-Kendall and Sen's Slope techniques. The data were also used to determine background concentrations using probability plots and Maximum Likelihood Estimation/Expectation Maximization (MLE/EM). The results of these evaluations are discussed in Section 6.5.5
II
-----------------------------"

6. Five-Year Review Process
The purpose of the five-year review is to evaluate the implementation and performance of the remedy to determine whether the remedy is or will be protective of human health and the environment. This Section summarizes the components of the five-year review process.
6.1 Administrative Components
The five-year review team members met on March 4, 20 10, to initiate the review process. Representatives from EPA, USACE, and EPD attended the March 4, 20 10, kickoff meeting. The five-year review process was led by Robenson Joseph, the EPA Remedial Project Manager (RPM). The US ACE, Hazardous, Toxic, Radiological Waste (HTRW) Section representatives provided technical support in developing the report. Ben Bentkowski, the EPA Site Hydrogeologist and Kim DoHyong, the EPD Project Manager assisted in the review of the report. Sherryl Carbonaro and Linda Starks, EPA Community Involvement Coordinators (Cle) provided community involvement support during the review process.
6.2 Community Involvement
On June 24, 20 10, a public notice was published in the Augusta Chronicle announcing the commencement of the five-year review process for the Site, providing contact information for Robenson Joseph and Linda Starks, and inviting community participation. A copyofthe public notice is included in Attachment B.
The five-year review report will be made available to the public once it has been finalized. Copies of this document will be placed in the designated Site repository: Augusta Richmond Public Library, 902 Green Street, Augusta, GA 30901. Upon completion of the five-year review report, a public notice will be placed in the Augusta Chronicle to announce the availability of the final report in the Site's document repository.
The USACE and EPA CIC coordinated and conducted interviews with the Site stakeholders including, the local residents, the Site owner(s), EPD, and the O&M Contractor. Summaries of these interviews are presented in Attachment C.
6.3 Document Review
On April I, 20 I 0, Frank Burwell, USACE Technical Manager, met with the EPD Project Manager, Kim DoHyong and began reviewing the project files. Documents that were reviewed were related to monitoring reports, Site investigations, remedy effectiveness, and delineation reports. A listing of documents reviewed in developing the five-year review report is included in Attachment D.
12

6.4 Data Review
Solutia perfonned extensive studies to determine the transportation and mobility of arsenic in the groundwater. Several univariate and multivariate statistical techniques were used to assess background arsenic concentrations and pH levels. In addition, laboratory analyses and batch studies were perfonned in order to evaluate the geochemistry of the Site and to enhance the Site conceptual model. The results of these analyses were presented in a technical memorandum (COM, April 2010) and the Evaluation of Arsenic Mobilization and Transport Report (COM, February 2008).
6.4.1 Groundwater Geochemical Evaluations
The groundwater geochemical analyses included using pH trend plots to study the rate of change of pH in select monitoril)g wells and using Principal Component Analysis (PCA) to identify discrete populations of groundwater. Trend plots were presented for four monitoring wells located on the southern portion of the Site and included both upgradient and downgradient wells. The plots showed pH increase in three of the wells (the farthest upgradient well already had a high pH when it was first sampled in 1985) and that the increase happens fairly rapidly as the groundwater overcomes the buffering capacity of the soils. The rate of migration of the pH is estimated at 0.2 feet/day from the plots. This is approximately 4.5 times slower than the estimated rate of migration for groundwater.
PCA is a multivariate statistical technique that examines the variance within a dataset. PCA involves a mathematical procedure that transfonns a number of possibly correlated variables into a smaller number of uncorrelated variables that are called principal components. The transfonnation accounts for as much of the variation of the data set as possible in the first principal component and each succeeding component accounts for as much of the remaining variation as possible. In other words, PCA is a coordinate rotation that aligns the transfonned axes with the direction of maximum variance. PCA is used in the environmental field with the assumption that the larger variances correspond to important system dynamics. That is, the components that account for the most variation correspond to a signal and the remaining components correspond to noise within the dataset.
. The data reduction that was perfornled prior to the analysis is not discussed within the report. During the site visit Mr. Olsen stated that the data were log transfornled (with the exception of pH) and non-detects were replaced with half of the detection limit. However, it is unlikely that redox potential (Eh) data were log transfonned since some of the values are negative.
The results of the analysis indicate that approximately 35% of the variation within the dataset can be explained by the first factor. The component loadings for this factor indicate that alkalinity, sodium, and conductivity correlate very well with this factor. These parameters are characteristic of a high pH sodium silicate waste. Arsenic and silica also correlate reasonably well with the first factor but due to the geochemistry of the Site it is expected that these would not correlate as well as the first three parameters
13
(silica drops out of solution very rapidly below a pH of 10 and once the arsenic is present in higher concentrations at locations of low pH due to contamination, and in low concentrations at areas of high pH due to all of it being stripped from the soil).
Factor scores are the combination of the component loadings and the measured concentration for each parameter. The factor score can be thought of as the concentration of the factor. The factor scores for Factor 1 for each of the wells indicates that the southern wells tend to have the highest factor score. This is expected as the high pH anthropogenic water has migrated across the southern portion of the site. Therefore the factor scores for Factor 1 are useful in identifying those waters that have been affected by the anthropogenic waters and those that have not.
The second factor accounts for 17% of the variation within the dataset. The component loadings for the second factor indicate that potassium has a strong correlation, silica and pH have a strong inverse correlation, and that arsenic, sulfate, and Eh have a reasonably good correlation with Factor 2. A reasonable explanation for this combination of parameters could not be developed so it is likely that the remaining factors calculated by the analysis represent noise within the dataset. This result is because the analysis accounts for all variance within the dataset and not just common variance of the parameters.
6.4.2 Aquifer Material Evaluations
Soil material~ from the Geoprobe investigation were used to analyze the chemical composition (arsenic concentration), physical condition, and buffering capacity of the soil. The chemical composition was measured using XRF and EMP. The physical condition of the soil particles was also performed using the EMP. The buffering capacity was tested by titrating mixtures of soil and deionized water.
The detection limits for arsenic using the XRF were typically around 2 milligram/kilogram (mg/kg). The analysis indicated that the soils on site typically contain less than 7 mg/kg arsenic. The exceptions are the clays which contained arsenic at higher concentrations and soils furthest upgradient where it appears that all of the arsenic has been leached out of the soil. The results of the EMP analysis also showed that these soils contained little arsenic, and that the arsenic present was contained in amorphous silica that had precipitated out of solution.
The butTering capacity of the soils was tested by mixing 10 grams of soil with 20 grams of deionized water and titrating with sodium hydroxide. The tests were performed on soils that contained a high pH and on those that contained a low pH. As would be expected, the results of the experiment indicate that those soils with a high pH had little additional butTering capacity. The low pH soils contained a neutralization capacity of approximately 30 milliequivalents per kilogram. The results followed a standard titration curve and indicated that once the capacity was expended the pH spiked sharply. This is consistent with what has been seen in the southern monitoring wells as the high pH groundwater has moved across the site.
14

EMP analysis was petfonned to check for chemical weathering of the soils. Samples were inspected from sites that had been exposed to the high pH water for some time, sites that were beginning to be exposed to the high pH groundwater, and sites that were unaffected by the high pH groundwater. The analysis indicated that samples that had not been affected by the high pH groundwater typically contained angular grains with very
-little chemical weathering and arsenic that was bound to clays. The samples collected from the sites that were starting to be affected by the high pH groundwater were becoming rounded and showed signs of pitting on the surface. These samples also contained arsenic bound to clays but some of them also contained arsenic in amorphous silica that had precipitated out of solution. The samples tliat had ,been affected by the high pH groundw~ter showed significant signs of chemical erosion. The grains had become rounded and large amounts of pitting were visible on the surface. Most of the samples contained little to no arsenic, and when it was present it was in amorphous silica that had precipitated out ofsolution."
6.4.3 Leaching Tests
Soil materials from the Geoprobe investigation were used to analyze capacity for arsenic to disassociate from the soil on site. Two individual soil samples (meaning soil was taken from the same interval of the boring) were used as well as seven composite samples (meaning soil was taken from ditTerent intervals in the boring and different borings) for the leaching analysis.
COM followed the EPA guidance document Batch-Type Adsorption Procedures, EPA/530-SW-87-006. The soils were mixed in a 2:1 ratio with deionized water to fonn test solutions. There were four different types of solutions that were used for this analysis. To evaluate the etTects of pH, deionized water was added to the soils and the pH was adjusted by adding differing concentrations of sodium hydroxide or hydrochloric acid. Sodium hydroxide was added to the solution to make it more basic, and hydrochloric acid was added to the solution to make it more acidic. The effect of phosphate on the soil was detennined by adding varying concentrations of sodium phosphate to deionized water. The sodium phosphate was added until concentrations of 5, 10, 20, 40, 100, and 150 mg/L was achieved. To detennine the effect of silica on arsenic mobilization two ditTerent solution concentrations were added to the soil. Silica solutions of 100 and 400 mg/L were achieved by adding the necessary amount of sodium metasilicate pentahydrate to deionized water. An analysis was also run to try and detennine what effect that high pH and high phosphate concentrations had on arsenic mobil ization.
The results of the leaching experiments indicate that increasing the pH of the site soils could release significant levels of arsenic into the groundwater. The exceptions were soils that had been exposed to the high pH groundwater for a long time. These soils released no arsenic into the groundwater, likely because all of the arsenic had previously been released. Groundwater samples from wells installed in the borings that these soils
i5

were collected from confirmed this result as the groundwater samples did not contain arsenic above the detection limit.
The results of the experiment also showed that increasing the levels of phosphate would leach some arsenic out of the soil, but that the capacity was significantly lower than that of increasing the pH. Increasing the silica concentration showed no impact on the capacity to leach arsenic out of the groundwater.
6.4.4 Adsorption Tests
Adsorption tests were performed by preparing soil and water mixtures and spiking the mixture with varying amounts of arsenic. The mixtures were allowed to equilibrate for 48 hours and then the amount of arsenic that had been adsorbed was measured. The results of the adsorption tests indicated that the maximum capacity for the soils to adsorb arsenic was relatively low, approximately 3.5 mglkg. Using standard calculations and assumptions to predict the retardation factors for arsenic resulted in a retardation factor of 14. That is, dissolved arsenic in groundwater would move at a rate that is 14 times slower than the groundwater.
6.4.5 Background and Trend Evaluations
Data evaluation summaries are presented below.
6.4.5.1 pH Trends
Univariate non-parametric Mann-Kendall and Sen's Slope techniques were used to evaluate historic arsenic and pH data for trends. A table containing the results of the analysis is included in the technical memorandum presented as Attachment A. The significance level used for the Mann-Kendall analyses was 5%, this translates into a 95% confidence level that the observed trend is real. Sen's Slope is an estimate of the median slope between all data pairs in the data set, it provides an indication of the steepness of the trend. Additional analyses can be performed to detemline if the median slope is significantly different from zero (i.e., no trend).
The results of the Mann-Kendall trend analyses for the pH data indicate that statistically significant upward trends are present in the data from15 wells, statistically significant decreases are present in the data from 9 wells, and no conclusions could be made about potential trends (up or down) with a 95% confidence level at 33 locations.
The wells with decreasing trends in pH data tend to be in the vicinity of Area I; the exceptions are MW-15, MW-6S, and MW-6D which are in the northern portion of Area II and MW-46 which is in Area III. The pH in each of these wells ranged from 4.55 to 6.18 during the July 2009 sampling event except for wells MW-46 and MW-22S. The pH ofMW-22S was not measured during that event and the pH of MW-46 was 8.05.
16
~----------------- - - ---
The wells with increasing trends in the pH data tend to be the vicinity of Areas II and III; the exceptions are MW-13 which is east of Area I and MW-19 which is a background well. It should be noted that the pH in MW-13 during the July 2009 sampling event was 5.68 su; therefore, the increase In this well appears to be o1inor.
Time series plots of pH in select wells provided in the July 2009 Annual Report of Corrective Action Effectiveness (URS, July 2009) indicate that high pH water has migrated from west to east (following the general direction of groundwater flow) across the site. The results of the Mann-Kendall pH trend analyses indicate that the northern limits of dispersion of the high pH water appears to be along the line from MW-19 to MW-6D.
6.4.5.2 Arsenic Trends
A summary of the historical arsenic monitoring data is included in Table 3. The sampling frequency has varied over time and by well (i.e., quarterly, semi-annually, etc.). Therefore the data have been condensed into average annual arsenic concentrations. The data were included in the Annual Report of Corrective Action Effectiveness (URS, 2009).
The Technical Memorandum (CDM, April 20 I 0) included a trend analysis of the historic arsenic data. The results of the analyses for the arsenic data indicate statistically significant upward trends at seven locations, statistically significant downward trends at 20 locations, and no conclusions could be made about potential trends (up or down) with a 95% confidence level at 31 locations.
Three characteristics of the data need to be considered before drawing conclusions from these results. The first characteristic is the method with which non-detects have been entered into the database. Arsenic results which were non-detect were entered into the database as a value of half of the detection limit; however, the results could not be flagged to indicate that they were non-detect values. Therefore, the analysis could indicate that a decreasing trend or no trend exists due to elevated historic detection limits. The second characteristic is the correlation of arsenic concentration with pH. Data from a well that has experienced an increase in pH could indicate that a decreasing trend does not exist for arsenic (i.e., an increasing trend or no trend) where the cause of that increase is not due to additional arsenic mobilizing out ofthe forn1er source areas. The third characteristic is that the data could indicate that no apparent trend exists because the arsenic concentrations have remained steady at levels that are below the MCL.
The results of the trend analyses for the wells in the vicinity of Area I indicate that the arsenic concentrations in these wel1s are generally trending lower. These wells are north of the area affected by the high pH groundwater. Therefore, these results indicate that the source removal and groundwater extraction activities have generally been effective.
The results of the trend analyses for the wells in vicinity of Area II also generally indicate a decreasing trend for these wells. These monitoring wells (MW-2, MW-17, MW-24S, MW-24D, MW-34, and MW-35) exhibit a decreasing trend for arsenic with a
17
corresponding increase in pH. However, this trend could be the result of an initial spike due to the increase in pH followed by a decreasing trend as the high pH water migrates through. The average annual data presented in the Annual Report of Corrective Action Effectiveness (URS, 2009) indicate that some of the wells have decreased below the levels present before the spike while others remain elevated. This data should be reassessed using a stage-wise procedure to account for the covariate or by utilizing a multivariate technique such as the partial Mann-Kendall test to check for trends in the presence of covariatcs.
Only MW -43 and MW-44 have historically exhibited elevated concentrations of arsenic in the vicinity of Area 1lI and have not been decommissioned due to construction on that site. The data for MW-44 exhibit a decreasing trend the data for MW-43 are inconclusive.
6.4.5.3 Background Concentrations
The background analyses for pH and arsenic were performed utilizing probability plots and MLE/EM. If the data were normally distributed the probability plots would be linear. The probability plot for all of the pH values recorded at the site contains two inflection points. Below the lower inflection point and above the higher inflection point the plots follow a straight line that would be typical of a normally distributed data set. The lower area is the data that represents the low pH natural background levels on the site, the higher area represents that anthropogenic high pH groundwater that has migrated on site. The area between the two inflection points represents the wells that have undergone the transition from the low pH natural water to high pH anthropogenic water.
The MLE/EM technique was used to estimate the means and standard deviations of the two sources by modeling the groundwater as two lognormally distributed populations. The MLE/EM analysis on the site-wide pH data produced estimates of 6.68 and 9.76 for the means of the two populations. The lower value is the estimated mean for the natural groundwater and the higher value is the estimated mean for the wells that have been affected by the anthropogenic source.
Similar analyses were performed for the site-wide arsenic concentrations. This probability plot did not contain the same distinct inflection points as the pH plot. This is due to the complex nature of the arsenic data on the site. The data represent multiple populations including a significant amount of non-detects (the vertical lines on the plots), natural background concentrations above the detection limits, impacts from the anthropogenic high pH water onto the site, and contamination due to site activities. The presence of these multiple populations in the dataset causes the probability plot analysis to be indetemlinate.
An MLE/EM evaluation was also performed on the site-wide arsenic data. The analysis failed to converge. Another evaluation was performed using only the data that was greater than 5.4 ug/L. This'removed 851 data points (approximately 27% of the data) from the original 3,126 data points. The analysis of these 2,275 data points did converge
18

-------------------------------------
and provided estimates of 31 ug/L and 259 ug/L for the means of the two lognonnally distributed populations. However, removing approximately 27% of the data which accounts for a significantly greater portion of the background data in an effort to get the model to converge on an estimate of background values seems counterintuitive. The value is presented as the altered background value due to the high pH waters migrating onsite. Background is defined as natural concentrations and those that are due to anthropogenic sources, but the cleanup standard for the areas that have not been affected should not be based on data from areas that have been affected. Cleanup standards should be proposed for both the areas that have been affected by the anthropogenic source and by those that have not been affected.
6.5 Site Inspection
On April 16, 2010, USACE representatives, Kevin Haborak and Tracey Epperly met with ; .
Mike House of Solutia Inc., Burt Taylor and Jeff Lokken of Prayon Inc., Dale Voykin of' URS, and Roger Olsen of COM. Roger Olsen led the group in a discussion on the investigations that have been performed since the last five-year review to address the arsenic and pH distribution across the Site. A tour of the Site was taken following the discussion of the recent investigations.
The Site visit began with a trip to extraction wells in Area I. The former landfill in Area I is approximately 0.1 acre, the boundary is defined by a slight mounding in the ground. This mounding can be seen in the Site photographs included in Attachment E. The tour proceeded south along the fence line to the vicinity of Area II. The recovery wells in both areas appeared to be in good condition and functioning properly. However, degradation in the recovery rate for extraction well EX-3 indicates that a problem .likely exists with that well.
A copy of the Site Inspection Checklist is included in Attachment F
6.6 Site Interviews
The Site interviews were conducted on April L6, 2010 and July 29, 2010. Kevin Haborak, Tracey Epperly, Mike House, Burt Taylor, Jeff Lokken, Dale Voykin, and Roger Olsen attended the April 16th interview meeting.
The discussion began with introductions of each of the attending parties. The USACE personnel introduced themselves and gave a brief summary of their professional background. Mike House introduced the members of his project team and gave a brief overview of their contributions to the project. The floor was then turned over to Roger Olsen of COM to give a presentation on the methods and findings of the study performed to evaluate the mobilization and transport of arsenic at the site and the statistical analyses perfornled to address the issues raised in the 2005 Five-Year Review.
The discussion began with an explanation of why the study was p~·rfonned and a brief history of the site and the neighboring Oxychem property. During this portion of the
19

discu~sion historical information was presented explaining the site conceptual model. This information is typically presented in the monitoring reports such as plots that showed the migration of the high pH levels across the southern portion of the site over time. The presentation also included a discussion of the methods and results of the PCA (Section 6.4.1), the aquifer material evaluations (Section 6.4.2), the batch leaching . studies (Section 6.4.3), th-e adsorption tests (Section 6.4.4), and the background and trend evaluations (Section 6.4.5).
A copy of the Evaluation a/Arsenic Mobilization and Transport Report (COM, February 2008), had been supplied in advance of the meeting to USACE personnel. During the presentation, the USACE personnel-asked questions to clarify items presented in the report and to obtain more background on the methods used in the data reduction since they were not included in the report. A copy of the statistical analyses had not been supplied to USACE personnel in advance of the meeting. Following the discussion, USACE personnel requested a copy of the analyses which was received in the form of a Technical Memorandum (COM, April 2010).
USACE personnel asked questions in regards to the site operation and maintenance. These questions related to the methods and level of effort required to maintain the site, the costs in maintaining the site, and the costs to perform the requisite sampling. After the question and answer period, a break was taken for lunch and then the site inspection was performed. The meeting reconvened following the site inspection. USACE personnel provided a list of questions to the Parachem personnel regarding their impression of the progress of the project, and asked them to send answers back to the USACE personnel so they could be forwarded to the USEP A Community Involvement Coordinator. The meeting then adjourned following final comments from Mike House.
During the aforementioned discussion, USACE personnel also asked ifEX-3 had been evaluated for bio-fouling since the recovery rate showed such a significant deciine. It was stated that the O&M personnel do not see any of the slime that is typical in a well that has been plugged by biofouling, and it was postulated that the decline in the rate can be explained by the duration of the pumping. That is, since EX-3 has been pumping for such a long time and the cone of depression is so well established, the level of effort to maintain the cone of depression has drastically decreased. Given the nature of the aquifer (unconsolidated sediments) and that the aquifer has not dewatered, this explanation seems to imply that inertial effects are helping to maintain the cone of depression.
The average annual potentiometric maps presented in the Annual Report a/Corrective Action Effectiveness (URS, 2009) do indicate a significant cone of depression is maintained in Area II. However, the maps were typically drawn using the lowest average water level for either MW-24S or MW-240 even though the average water level for the well that wasn't lIsed may be close to static conditions in some years (indicating a possible lack of capture). And in at least one case, the potentiometric map for the 14th remedial period, the value used does not match the data that is presented in the historical water level table within the same report for either well.
20
EX-3 should be rehabilitated (e.g., surging and redevelopment) or replaced, if necessary. Alternatively, if aquifer perfonnance tests (e.g., slug tests or pump tests) have been perfonned on EX-3 in the past, the well could be turned off, allowed to equilibrate, and retested to detennine the degree to which the hydraulic properties of the well screen, sand pack, or aquifer material in the immediate vicinity of the sand pack, have degraded due to compaction, infilling, or biofouling. A detem1ination can then be made whether to attempt to rehabilitate the well.
21

7. Technical Assessment
Question A: Is the remedy functioning as intended by the decision documents?
The review of documents, ARARs, risk assumptions, analytical data, and Site inspections indicate the remedy is generally functioning as intended by the ROD. However, the analytical data showed that arsenic concentrations above the MeL are present in the groundwater. Therefore, continued operation of the remedial system is required pursuant to the ROD. Groundwater remediation and monitoring should continue under the ReRA permit to ensure the cleanup levels are met.
The review of the remedy included: evaluation of the remedial action performance, system operations, opportunities for optimization, early indicators ofpotential issues, and implementation of institutional controls. The groundwater pump and discharge system generally appears to be functioning as intended. In Area I, a decreasing trend of arsenic concentrations are observed. However, the data from Area II showed the concentrations of arsenic are generally fluctuating or stabilizing. A significant (two order of magnitude) extraction flow rate decrease was observed from EX-3. This tlow rate reduction may be attributed to bio-fouling. It is recommended that the well be evaluated and rehabilitated or replaced if necessary in order to maintain a reasonable cone of depression and avoid potential failure of the well.
Arsenic concentrations from the monitoring wells located in the vicinity of the removal areas have typically been stable or decreasing. Arsenic concentrations are expected to remain above the cleanup levels until the elevated pH in the Site groundwater is addressed.
The property is fenced, and access to the Site is limited to plant personnel. The production wells on the Site are deep wells, screened below the surficial aquifer. Water withdrawn from the wells is used for plant operations. Arsenic has never been detected in these wells. No groundwater use restrictions have been placed on the property .
. Question B: Are the exposure assumptions, toxicity data, cleanup levels and remedial action objectives (RAOs) used at the time of the remedy selection still valid?
The exposure pathways, toxicity values, risk assessment methods, and standards identified in the ROD were reviewed to identify changes that may affect the protectiveness of the remedy.
New exposure pathways were not identified that could affect the protectiveness of the remedy. The land use in the vicinity of the Site is industrial and is expected to remain industrial. The physical conditions of the Site have not changed in such a way that is expected to affect the protectiveness of the remedy, and unanticipated toxic byproducts for the remedy have not been identified.
22

The initial risk assessment did not consider the vapor intrusion pathway. Vapor intrusion occurs when gases or vapors from chemicals in soil or groundwater migrate into occupied buildings. Until recently, this transport pathway was not routinely considered in RCRA or CERCLA investigations. This pathway was not considered in the final baseline risk assessment. Exposure via the vapor intrusion pathway does not affect the current protectiveness of the remedy since arsenic is not expected to volatilize (i.e., a complete exposure pathway does not exist).
The oral cancer slope factor (SFO) identitied in the ROP is 1.75 (mglkg-daYr', the current SFO established in the Integrated Risk Information System (IRIS) is 1.5 (mg/kg-dayr'. However, this change does not affect the remedy since a risk based remediation level was not established in the ROD. A risk based remediation level was not established in the ROD for groundwater restoration because an ARAR for arsenic existed. This ARAR is the MCL. Both the ROD and the RCRA permit
; require compliance with this. ARAR.,The MCL for arsenic has not. changed, since the 2005 Five Year Review.
Question C: Has any other information come to light that could call into question the protectiveness of the remedy?
No additional information has been identified that would call into question the protectiveness of the remedy.
Technical Assessment Summary
Based on the data reviewed, the Site inspection and interviews, the remedy is functioning as intended by the ROD. There have been no changes in the physical conditions of the site that would affect the protectiveness of the remedy. ARARs for groundwater were evaluated to determine if the remedy is still protective. Under the RCRA permit, remediation must continue until arsenic concentrations for the Site groundwater are below the MCL. Site groundwater monitoring data showed that arsenic concentrations at several monitoring wells are above the MCL. Therefore, groundwater remediation and monitoring are required to continue to ensure compliance with the ROD and the RCRA pem1it. Groundwater use restrictions on the surficial aquifer have not been place as required in the ROD.
23
8. Issues A summary of the issues identified during the third five-year review is presented in Table 4.
24

9. Recommendations and Follow-up Actions The recommendations and follow-up actions identified during the review process are presented in Table 5.
25
10. Protectiveness Statement The remedy at the Site is currently protective of human health and the environment because there are no current exposure pathways to the contaminated aquifer. However, in order for the remedy to be protective in the long-term, groundwater restrictions to prevent exposure to the contaminated surficial aquifer while remediation is ongoing will be required. In addition, a comprehensive evaluation to detem1ine the background pH level and arsenic concentration will be required. The results of this evaluation will be utilized to determine whether modifications of the remedy and/or the cleanup levels are necessary
26
11 Next Review
Five-year reviews are required as a matter of policy by CERCLA for this Site because the remedial action is a post-SARA action that, upon completion, will not leave hazardous substances, pollutants, or contaminants onsite above levels that allow for unrestricted use and unlimited exposure, but requires five years or more to complete. The fourth five-year review for this Site will be due within five years of the signature/approval date of this report.
''-:,
27

Tables

Table 1 Chronology of Events
, .~. '. /
'>~~:" Event , '<
Date <,,' ':: Start Completil')Q:<;
Monsanto builds Landfill No.1 1962 Over 700 lbs. of Arsenic placed in Landfill No.1 1966 1971 Monsanto closes Landfill No. I and builds Landfill No.2 1971 Over 800 Ibs. of Arsenic placed in Landfill No.2 1971 1974 Monsanto closes Landfill No.2 1977 Site Discovery 11/0111979 Preliminary Site Assessment 12/0111979 Proposal to NPL 09/08/1983 Waste removed under Georgia Environmental Division oversight
1983 1984
Final Listing on NPL 09/21/1984 Administrative Order on Consent 04/2711989 Site Inspection 06/1211989 Potentially Responsible Party Remedial Investigation/Feasibility Study
4127/1989 12/07/1990
Record of Decision 12/07/1990 Consent Decree 03/29/1991 10108/1991 PRP Remedial Design 03/28/1991 12/3011992 Removal Assessment 12/3111992 PRP Remedial Action 12/30/1992 08/02/1993 Preliminary Close-Out Report 05/05/1993 Operations and Maintenance 08/02/1993 Ongoing Deletion from NPL 03/09/1998 First Five-Year Review 06/01/1999 04/05/2000 Site deferred to ReRA 03/1998 Second Five-Year Review 04/0112005 09/23/2005
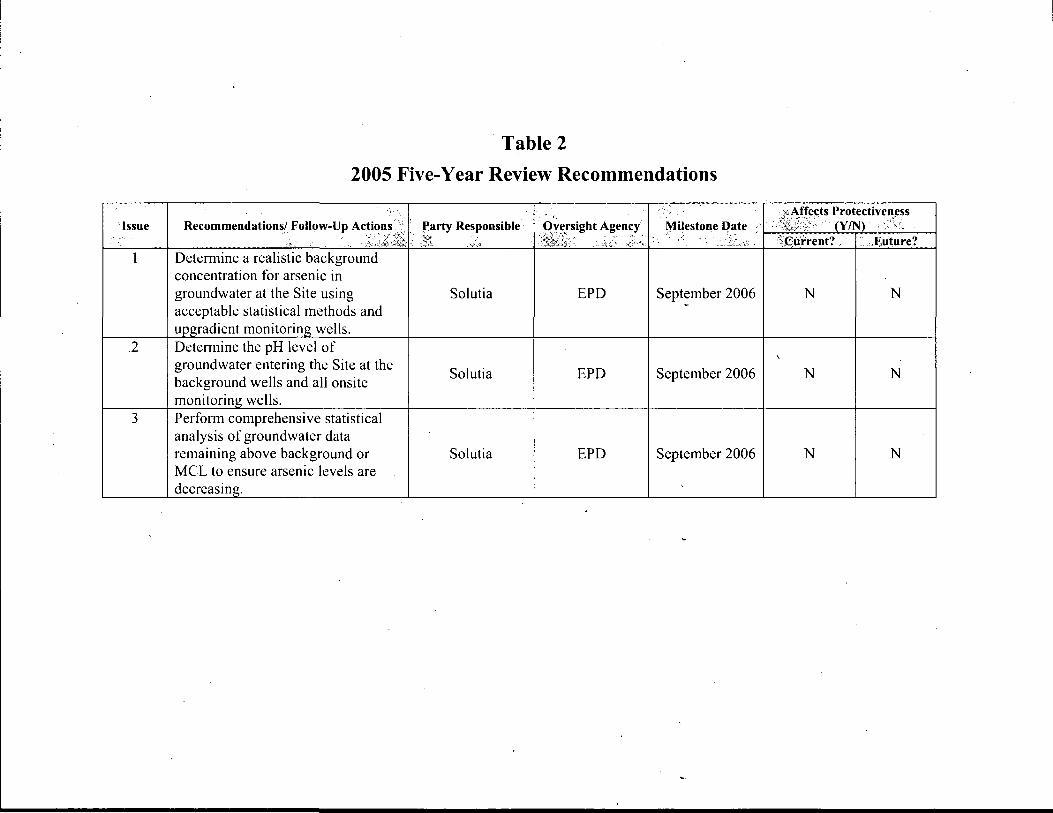
Table 2
2005 Five-Year Review Recommendations
"Issue
..~ ..
Recommendationsl Follow-Up Actions "'.' farty Responsible .()y~rsight Agency ~ilestone Qate xNfi!t;ts Protectiven~ess <X>,~:,,' (YIN) '.:'>/
"':.:~< . ~~·.;~;:~.<G~ / ·:32. .v,·~. ::.~;.:;.';.:~ .'. ,\~..~~ j:'.::~:.
Detemline a realistic background concentration for arsenic in groundwater at the Site using acceptable statistical methods and upgradient monitoring wells.
Solutia EPD September 2006 N N
Detemline the pH level of groundwater entering the Site at the background wells and all onsite monitoring wells.
Solutia EPD September 2006 N N
3 Perfoml comprehensive statistical analysis of groundwater data remaining above background or MeL to ensure arsenic levels are decreasing.
Solutia EPD September 2006 N N

Table 3 Arsenic Historical Monitoring Data Summary (ug/L)
WELL
AVG AS April 90 April 93
AVG AS April 93 April 94
AVG AS April 94 April 95
AVG AS April 95 April 96
AVG AS April 96 April 97
AVG AS April 97 April 98
AVG AS April 98 April 99
AVG AS April 99 April 00
AVG AS April 00 April 01
AVG AS April 01 April 02
AVG AS April 02 April 03
AVG AS April 03 April 04
AVG AS April 04 April 05
AVG AS April 05 April 06
AVG AS April 06 April 07
AVG AS April 07 April 08
AVG AS April08 April 09
AS July 09
MW1A 64.33 87 63.75 5 11.75 9.25 21.67 21.5 17 15.5 17.5 5 5 5 14 7.7 11.15 5.4 .MW2 . .. 19.23 35.75 43.5 24.5. .39JiJ .39.75 42.5; .: 36' .r 20~ 33.5 23~65,!:,..'. 26.15" . 41.45.i, . 17.1 ..<. MW3 5 MW4 ...;;~,);.
MW5 22.91 33.5 25 26.5 26.25 23.45 22 34 37 38.5 35.5 23.5 32 28.8 30.45 29.55 28.25 34.2 MWGS\«.:·5.S6 •. .' 5 •. 5 .. .Ji. 5 8. 5';TiF :·'3.9 .. , .. ;'\3'.25..-.; 2.15 ..5.4 ..
MW6D 5.56 5 5 5 5 5 5 5 5 S 5 5 5 3.9 3.25 5.4 5.4
... MW7S . .. :.: ~ , .~ .
MW7D 14.3
. ,'" tv ;'5· .. :0 .. ".54;.. MW9 7 19.75 7.75 17.75 18.68 15.33 23 24.5 8 11.5 11 10.5 5 7.55 10.25 12.7 14.2
·MW10 '.
MW11 54.6 52.7 17.1 21.4 8.9
MW12 MW13 20.17 17.25 20 19.25 18 17.45 13.67 12 26.5 41.5 38 25 22.5 9.5 24.1 18.7 12.95 7.5
28.75",31.75:. ':\;;34 ..L35.75.1 r;38~75 MW15 9.09 5 5 5 5 5 5 12 5 5 14 5 5 5 6.75 6.05 5.95 5.4
MW17 53.69 42.25 37.13 32 50.25 76.64 25.67 50.75 83 237.5 335 172 64.5 87.5 26.45 26.75 149.4 25 MW18..· 15.92: :> 18.25. 25.25. .' 26:75 . f-,;I:~20' • 20A!!~ .,2033. ;~23;0. 17.5' 17.5 .,' L*;13 ..:.... .' . 5*~·/ . . 26.65'£\.. 30.55. :·.'14.95" ....26.91'; ..
MW19 16.25 25 26.75 25.75 18.5 27.65 27.67 33 39 32.5 30.5 16.5 23 18.75 22.95 22.1 23.55 21.9
· . .MW20 .; .; -MW21 5 MW22S >';
• :), <.~ j .. .~.'
MW22D 5
,MW23S 24.17. 15.75 28.5 27.25 ·.22.75 270451;0 25.67.: \1"27 21 36.5 20.5 3.9.. .9.45 5.4. MW23D 18.13 9 19.75 10 557 5 5 10 5 5 5 8.05 7.15 7.9 7.4 MW24S 117.31 17.75 20.88 48 51.13 ;.. 1:;..62.7 44.83 71.75 43.25 37.25 34.5 40 :j :;;<30.i5 ..35.9. 63.6 80.2 71.8.
MW24D 41.82 75.25 39 33 37 41.55 47.67 54 58 58.5 67.5 52 51.5 55.55 55.7 32.15 26.95 21.3 ':MW31 :14.54 18.25 17.25 1B 10.3:L: 12 11 8.5 B , 11. '. 5.';',,·. 0'['(!-7'5.. . .15.1. 16.6 .6.05. 11.7
MW32 28.46 21 33.25 38.25 33.75 35.38 35.33 35.5 43.5 47 41.5 44 34 22.9 36.75 32.65 28.3 28 "'MW33", ) 27.23 .. 26.25 36.25" .. 29. " 43.5;,.;';' :-" 28.73 28.4
MW34 24.62 15.25 17.25 23 24 31.63 28.33 32.5 30.5 28 31.5 42 • 33 15.2 14.65 21.55 22.45 32.5 MW35 42:18. \.,.:.47. 32.75 j; 28;75;.4tt.251U:.· 21.48 . .)1'20.33 38.5... 31.5 '. 34.5 . 18.5 ..; 16.5 '" . ~023:S 13'1':£ if: 24.9 . " ... :2L55: 44.65 . 18.ly{
MW36 8.85 7.5 5 6.5 9.75 5 7.33 7.5 5 5 5 5 5 5 11.3 9.4 6.95 7.6 nMW37 .· ..:8;31.· 6.25. .5' .. ;\), 005'·;,.> 8.5. :.. ...~ 5:':> (S}5 ".:: .....' \:5~.i· .5:.:;0; '<:.+5' .. ;'9:47;'.i:···' U. . •. 10,". '8.7 ..
MW38 25.08 30 19.75 29.75 22.75 18.05 17.33 25 Decommissioned 2/18/2000
MW39!.!. /32.69 '.. 36'.;-.. ',':::
MW40 13.29 Decommissioned 10/24/1991 MW41 ·jiG;5. '.8,(:'/: ::.i9.25: 24.754 . . i!.18.45 L 22 MW42 64.67 54 43.25 42 35.88 40.66 43.5 43.5 Decommissioned 2/18/2000 .
MW43 MW44 38 31.25 37 34.75 37.83 29.67 28 19.75 7.25 5 5 5 5 4.4 3.25 5.4 5.4
.·.MW4S." MW46 5 8.5 16.5 5 5 3.9 3.25 5.4 5.4

Table 3 Arsenic Historical Monitoring Data Summary (ug/L)
AVG AS AVGAS AVGAS AVGAS AVGAS AVG AS AVG AS AVG AS AVG AS AVG AS AVG AS AVG AS AVG AS AVG AS AVG AS AVG AS AVG AS
April 90 April93 April 94 April 95 April 96 April 97
WELL April 93 April 94 April 95 April 96 April 97 April 98
MMW47 . ,'':'"" : ',;"'/~
MW48
MW50
MW52
MW53
EX1
EXl 35.25' 29.25
April 98 April 99 April 00
April 99 April 00 April 01
: .~ ~.' , .f;.:~·~·V}. .. (!.\:\ '."
April01
April02
5.
5
April 02 April 03 April 04 April 05 April 06 April 07
April 03 April 04 April 05 April 06 April07 April 08
5 8 5 5 3.9 3.25
5 5 3.9 4.25
4.75
... 23.8 ..
16.5
:.'if.
EX3 31.75 50.5 46 58 44.9 42 56.5 29.5 12.5 7.5 30·" 25 12.6 20.75 32.55
P3 WBl 32.5 44.5 35.5 43 43.68 37.33
<LWB2 45.33 51
43
.., :", :~';':' .;;
40.5 34.5 33 31 33 31.25 35.05 23.55
April08
April09
'10.75.' 5.4
11.45
·,9:55
AS
July 09
5.4
·SA"
5.4
8 .•6 5.8 6
.58.85.:: 45.4·
19.4 26.3
25.7 23.6
Notes:
Table is annual average concnetrations for the quarterly and semi-annual monitoring data.
ug/L = micrograms per liter
•••• = Quarterly sampling discontinued.
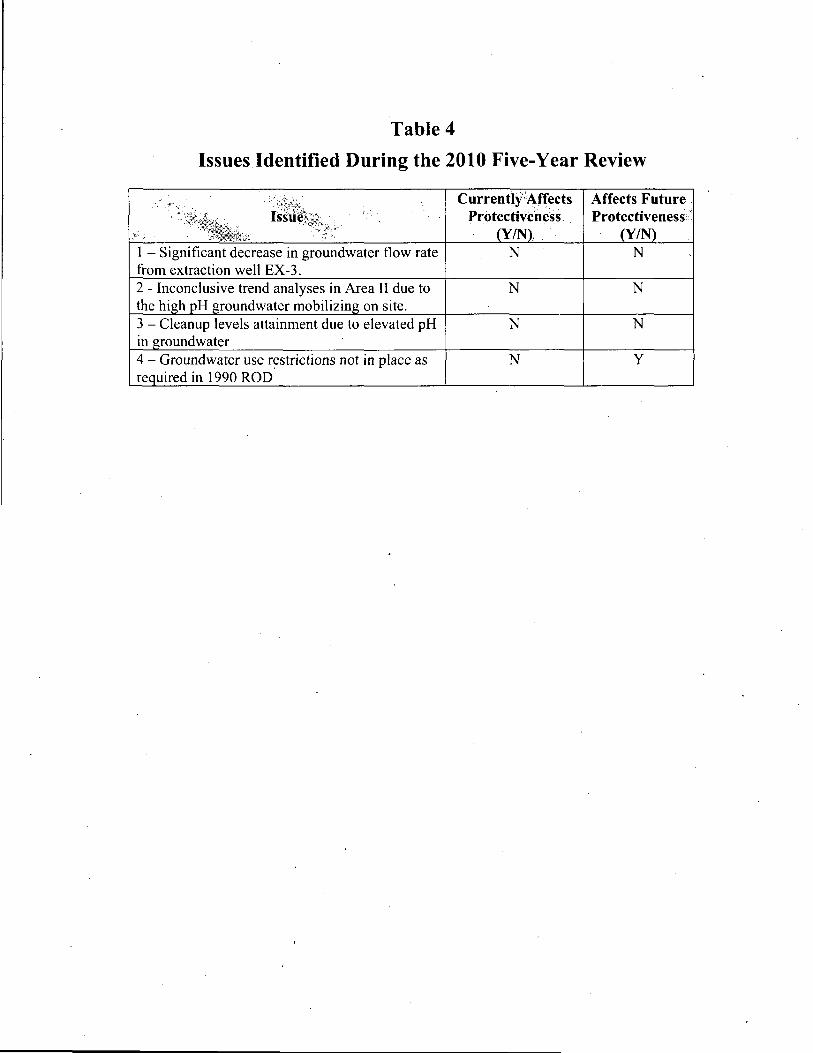
Table 4
Issues Identified During the 2010 Five-Year Review
1 - Significant decrease in groundwater flow rate from extraction well EX-3.
CurrentlY<.-\.ffects Protectivel1ess
y
N
Affects Future
N
2 - Inconclusive trend analyses in Area II due to the hi h H roundwater mobilizin on site. 3 - Cleanup levels attainment due to elevated pH in roundwater
N
N
N
N
4 - Groundwater use restrictions not in place as re uired in 1990 ROD
N Y

Tabie 5
2010 Five-Year Review RecommeJrndatnons aHlld FO.uOW-llBP Actions SlUlmmary
Iss~e {/ .;-it { "F
Recommendations! F;ollow~Up Actions>~~' Party Responsible Oversight Agency Milestone Date ,i ,W",,' ',' ", , "," Current?', ,',,::yFutiJre?
Evaluate EX-3 to detemline the cause of the decrease in flow rate and make the necessary modifications to the well to maintain consistent flow rates to support the drawdown cones of depression.
Solutia EPD 03/31/2011 N N
2 Perfoml multivariate or stage-wise trend analyses of arsenic data in areas with elevated pH levels to account for the covariate.
Solutia EPD 09/30/2011 N N
3 Perfoml a comprehensive evaluation to determine the background pH level and arsenic concentration. Utilize the results of this evaluation to detennine whether modifications of the remedy and/or the cleanup levels are necessary.
Solutia EPA 09/30/2012 N N
4 Place groundwater use restrictions on the surficial aquifer as required in the 1990 ROD
Solutia EPA 09/3012011 N y

Figures

Source: Topozone.com Augusta East Quadrangle, 1995
Richmond County - Georgia 7.5 Minute Series (Topographic)
/ AUGUSTA \>.---
; I" AUG]
J. URSJamle.proJ".Pr.yOnAugU5t\V(!l"lIca1.Oe11neallon 1 2~200,5\Sllemop.•1

I .. _.. _.. AREA III
I
I
I ~ ..~
'
.0 48" Sewer 1 ~ .•
'&1cf!. 1:: •
Manhole
.~, \.:i --,.,
.1::" <> ~.
~I : --'28,
/ -------
I
:1 / 1
"tJ{·c -730/s . ,<3 ";::
LEGEND • -Lfxtraction weill II - Decommissioned Well 411 - Monitoring Well
'-- .
122 - Groundwater Elevation (feet) - Apparent Direction ofGroundwater Flow
'Active Extraction @MWS, MWl 1, MW240.and EX3 "Without MWl A
DATt ·
SCA L E'
i Jl,\II
MW39
• Building Expansion
As Shown
__-------124--~~nrn~m-----
_----11ii--- 125
lb.11 lEX})
.!l>.}tl
411 MW20 MWB 11 .70 l)to:,l
411 127
This figure is from
728 the 2009 Annual
Action Effectiveness
I for the Former
Monsanto Plant
prepared by URS 129 __ Corporation
1LB.+1 MW51 200 0 200 400 MW50 411
l/q_ _ 411
SCALE IN FEET
TITLE '
Water Level Contour Map* ril2009 Sixteenth Remedial Period J. Gross
PR OJ . NO.:
lS261m ASK NO.:
J. Gross 09300 IGUR E: 2
-
tI :\proj\Prllyon A.ueuna\Apri12009\H2OContou r16lhRP.ai D. Vovkin
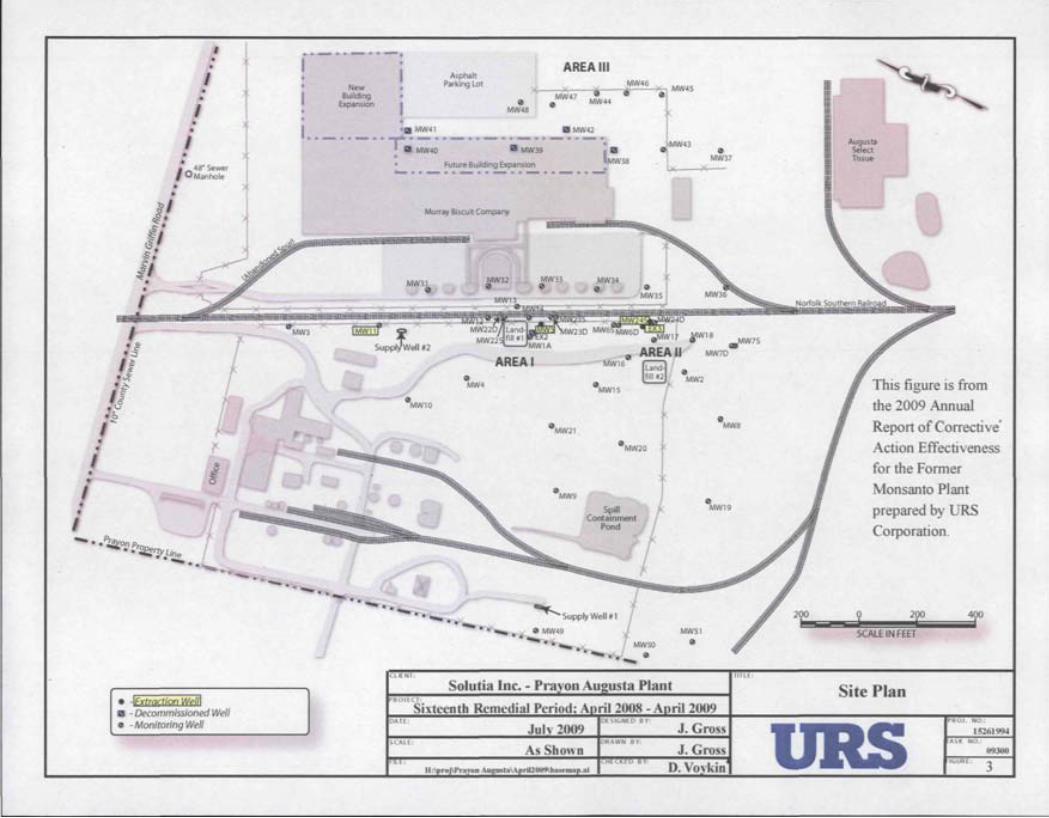
I • I
I
I
I
• I
'
.048" Sewer Manhole
.. --- .. '-.
New Building
Expansion
1 .• _ •• _ ••
AREA III Asphalt
Parking Lot x ~ ~ MW4S
e MW47 MW44
II MW41
MW40
e MW48
II MW39
II MW42
II
Future Building Expansion MW38 ..... _.. _.. - .. _.. -
Murray Biscu it Company
MW31 e MW32 e
MW33 e
e
e4AW43 e MW37
~W18 a MW75
MW7D AREAl MW1 6 Land
GI MW2e fi ll #2
MW4
eMW1 0
-.. -.
eMW1S
eMW21
Gl MW20
GlMW9
Spill Containment
Pond
[ Supply Well ~ 1 !• ...... •• e MW49 ............. MW50
f
J
e MW8
MWSl e
e MW19
Augusta Select Tissue
This figure is from
the 2009 Annual
Report of Correcti ve'
Action Effectiveness
for the Former
Monsanto Plant
prepared by URS
Corporation.
o 2(>0;;;0;1
SCALE IN FEET
.I . --.
.............. ct
CLIE NT : TITLE :
Site Plan • -IExtraction Weul
ri12009II - Decommissioned Well PRO) . NO.:DATE: e -Monitoring Well J. Gross 15261m ASK NO.:DRAW N BY: SCALE:
09300As Shown J. Gross IGURE:
3D. Voykin
PROJECr :
Sixteenth Remedial Period' A
Julv 2009
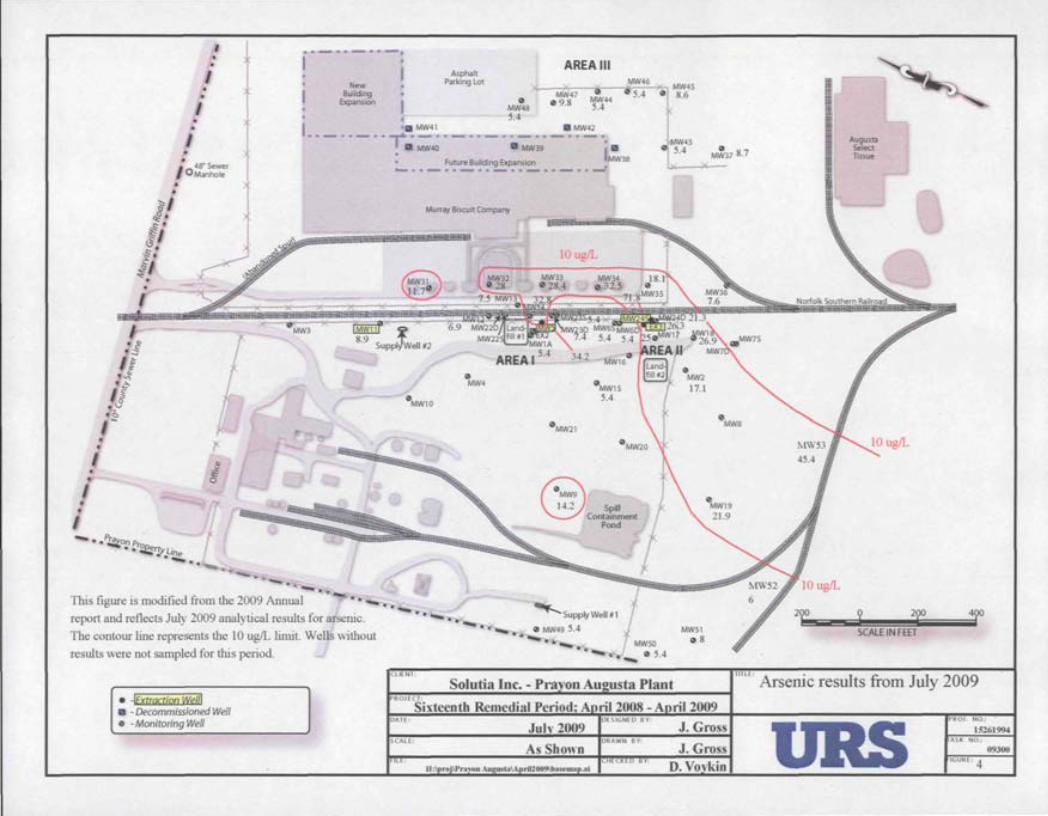
I ._.. -. AREA III
Asphalt
II) MW4 Gl
MW1S 5.4
/ "nDIIl
/
/.
/
/ ' 048" Sewer
Manhole
New Building
Expansion
1 .• _ .. _ •. III MW4 1
GI II) 9.8
III MW40 III MW39 III II) 5.4 Select
-
Parking Lot
MW48 5.4
Future Building Expansion
MW47
III MW42
MW38
i1 MW45 GI l 8.6
MW43
Murray Biscuit Company
Augu sta
Tissue
I MW9
14.2 Spill Containment
@/ Pond
- • • p~onPn '. ~'!YLine......... - 0- .. -.
This figure is modified from the 2009 Annual - . •• _ Supply Well *1 r ! 9 290200report and ret1ects July 2009 analytical results for arsenic .
• • _ '. GI MW49 5.4 I MWSl SCALE IN FEETThe contour line represents the IO ugIL limit. Wells without -" _ MW50 GI S
results were not sampled for this period. ' . - " _ GI 5A
t,::C~LlE~NT :~~"";;;';;';';;;;;;:;";;::':::"";';':;II..:::~:=:liI:=::":"::::::::"__--1 TITLE : Arsenic results from July 2009 • -lExtraction Weill riJ 2009III - Decommissioned Wel/
P ROJ . NO.: •GI - Monitoring Well J. Gross 15261 99.t
ASK NO.:
09300J. Gross IGURE: 4URSD. VOykin
DATE;
SCA L E:

Attachment A

CDM
Memorandum
To: Michael L. House, Solutia Inc., St. Louis, MO
From: Roger L. Olsen, COM, Denver, CO
Date: April 19, 2010
Subject: Evaluations Concerning USEPA's Requested Follow-up Actions
Introduction This document addresses the follow-up actions requested by U.s. Environmental Protection Agency (USEPA) in their last 5-year review of the Former Monsanto Plant Site in Augusta, Georgia (Second Five-Year Review Report for Monsanto Corporation, Augusta Plant, September 2005). The requested follow-up actions are:
1. Determine a realistic background concentration for arsenic in groundwater at the site using accepted statistical methods and upgradient monitoring wells.
2. Determine the pH of groundwater entering the Site at the background wells and all monitoring wells on the site.
3. Comprehensive statistical analysis of groundwater data remaining above background or MCL to ensure arsenic levels are decreasing.
The overall approach to address these follow-up actions was to perform the requested evaluations in a manner similar to what EPA would do or would require using accepted EPA and standard statistical techniques. The techniques used for the evaluations are summarized below, followed by the results.
Database Compilation and Exploratory Statistics The past data concerning arsenic and pH values were obtained· from Dale Voykin at URS (Atlanta, Georgia). The data included 3,126 values for arsenic collected from June 1979 through July 2009 and 2,893 values for pH collected from February 1980 through July 2009. Data were available for 58 locations (monitoring wells, extraction wells, one production well and two weir boxes). Detection limits for arsenic have varied over time and have typically been recorded in the database at 1/2 the minimum detection limit. The detection limits have been 10 )lgl L (recorded as 5), 5 )lSi L (recorded as 2.5) and 1 )lgl L (recorded as 1 )lgl L). No

Mr. Michael L. House
April 19, 2010
Page 2
qualifiers were preserved in the database so actual nondetectable values (U qualifier) or estimated values 0 qualifier) could not be identified. This did not affect the evaluations. Exploratory statistical evaluations show that the arsenic values are log-normally distributed; therefore, the arsenic data were transformed before statistical evaluations. The pH values are no~mally distributed (pH values are the log of the hydrogen ion concentration) and therefore were not transformed
Trend Evaluations The changes in arsenic and pH values at the groundwater wells were evaluated to determine if a statistical increasing trend, decreasing trend or no trend is occurring at each location. Trend analyses were conducted using two techniques: the Mann-Kendall and the Sen's slope techniques. TIle Mann-Kendall technique was used by EPA in its last 5 year review.
The Mann-Kendall test is recorrunended in several EPA guidance documents including: Guidance for Data Quality Assessment, Practical methods for Data Analysis, EPA QAjG-9, EPAj600jR-96j084; and, in recent texts including R. O. Gilbert, 1987, Statistical Methods for Environmental Pollution Monitoring, Van Nostrand Reinhold, New York, New York.
The Mann-Kendall test is a non parametric (distribution-free) test of trend, which determines a statistic (S) calculated from:
S = l:1l-'l: s n(x, -x );=1 ;'=k+1 g , ,
where i represents the i-th sample ordered by round (date of sample collection) and sgn represents the sign (positive or negative) of the difference in concentration. Essentially, S is the number of positive increases minus the number of negative increases for every possible data pair. A positive S indicates an inc'reasing trend and a negative S indicates a decreasing trend. Probabilities that associated S values w0l!ld be obtained given no real trend in the sample data are as follows:
Z= S-I ~fS>O [var(S)]" 5
Z = 0 ~(S = 0
Z = S + I ~r S < 0 [var(S)r' 5
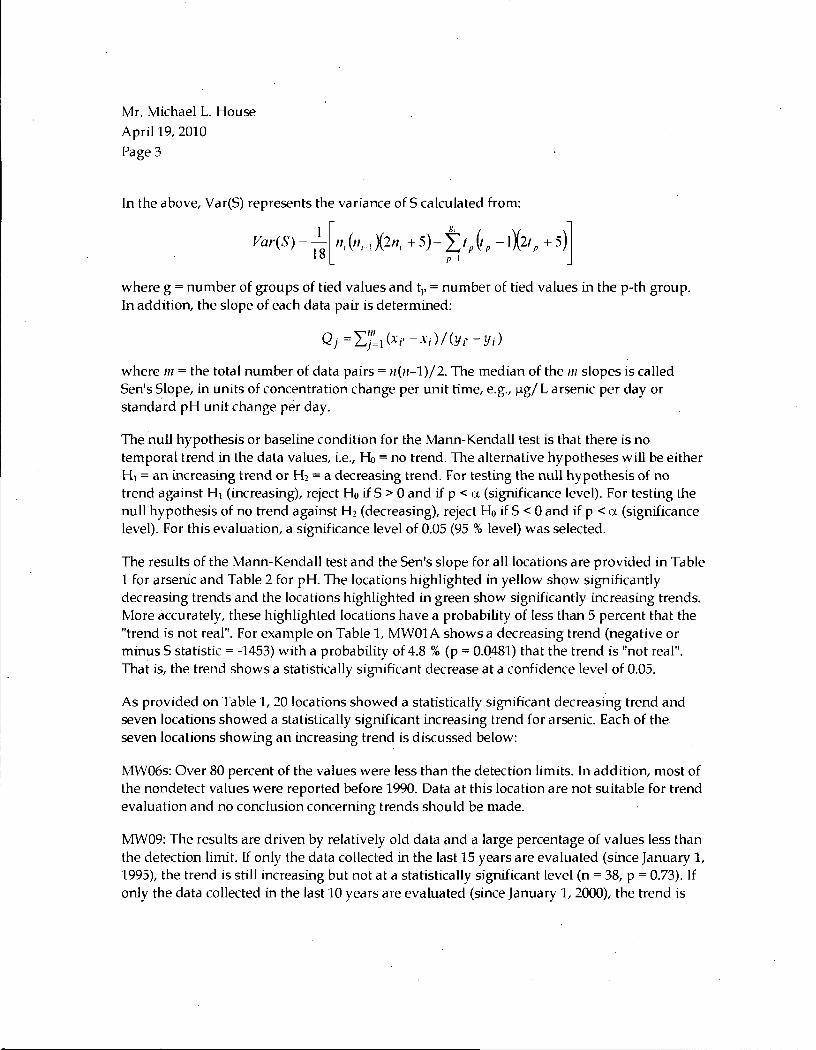
Mr. Michael L. House
April 19, 2010
Page 3
In the above, Var(S) represents the variance of S calculated from:
Var(S) =_1 [l1i(l1i_IX2Ili +5)- ~>p~p -IX2tp+5)l 18 p=1 J
where g = number of groups of tied values and tp = number of tied values in the p-th group. In addition, the slope of each data pair is determined:
Qj = L.'j~1 (x;, - X; ) / (Y;' - y; )
where 111 = the total number of data pairs = 1l(1l-1)/2. The median of the III slopes is called Sen's Slope, in units of concentration change per wlit time, e.g., Ilg/ L arsenic per day or standard pH unit change per day.
The null hypothesis or baseline condition for the Mann-Kendall test is that there is no temporal trend in the data values, i.e., Ho = no trend. The altemative hypotheses will be either HI = an increasing trend or H2 = a decreasing trend. For testing the null hypothesis of no trend against HI (increasing), reject Ho if S > 0 and if p < C1. (significance level). For testing the null hypothesis of no trend against H2 (decreasing), reject Ho if S < 0 and if p < (1. (significance level). For this evaluation, a significance level of 0.05 (95 % level) was selected.
The results of the Mann-Kendall test and the Sen's slope for all locations are provided in Table 1 for arsenic and Table 2 for pH. The locations highlighted in yellow show significantly decreasing trends and the locations highlighted in green show significantly increasing trends. Mote accurately, these highlighted locations have a probability of less than 5 percent that the "trend is not real". For example on Table 1, MW01A shows a decreasing trend (negative or minus S statistic = -1453) with a probability of 4.8 % (p = 0.0481) that the trend is "not real". That is, the trend shows a statistically significant decrease at a confidence level of 0.05.
As provided on Table 1, 20 locations showed a statistically significant decreasing trend and seven locations showed a statistically significant increasing trend for arsenic. Each of the seven locations showing an increasing trend is discussed below:
NfW06s: Over 80 percent of the values were less than the detection limits. In addition, most of the nondetect values were reported before 1990. Data at this location are not suitable for trend evaluation and no conclusion concerning trends should be made.
NfW09: TIle results are driven by relatively old data and a large percentage of values less than the detection limit. If only the data collected in the last 15 years are evaluated (since January 1, 1995), the trend is still increasing but not at a statistically significant level (n = 38, P = 0.73). If only the data collected in the last 10 years are evaluated (since January 1, 2000), the trend is

Mr. Michael L. House
April 19, 2010.
Page 4
decreasing (instead of increasing) but not at a statistically significant level (n = 20, P = 0.28). Overall, no conclusion concerning trends can be accurately made.
lVrwll: Only 18 arsenic values for this location were used in the evaluation. Eight of these were collected since January 2006 and nine were collected before May 1986. Because of the few data points and the large amount of time between data collection, no conclusion concerning trends can be made.
MW19: The results are driven by relatively old data. If only the data collected in the last 15 years are evaluated (since January 1, 1995), the trend is decreasing (instead of increasing) but not at a statistically Significant level (n = 38, P = 0.21). No conclusion concerning trends can be made.
lVrw 20: Only limited recent data are available for this location (only six values in the last 15 years). No conclusion concerning trends can be made at this location.
MW34: The results are driven by relatively old data. If only the data collected in the last 10 years are evaluated, the trend is decreasing but not at a statistically significant level (n = 20, P = 0.15). No conclusion concerning trends should be made at this location.
MW41: No data are available at this location in the last 10 years. No evaluation of trends should be made at this location.
Overall, arsenic concentrations appear to be decreasing or are relatively constant (no trend). However, more detailed evaluation should be conducted taking into consideration the well location, geochemical condition changes with time (pH values, see next section), and more recent (vs. older) data.
Table 2 provides the trend evaluation results for pH values at each of the locations. Similar to the arsenic values, pH trends need to be carefully evaluated based on location and time. In particular, groundwater with high pH values from an offsite, upgradient source migrated onto the Site in the mid-1970s resulting in a large change in the onsite groundwater characteristics including large increases in pH values. This is illustrated by the observed trends at lVrw02 shown in Figure 1. From 1980 to approximately 1989, most pH values reported were around a pH value of 7 su (some higher and lower values were also reported). After 1990, most of the pH values reported were around a pH value of 10 to 11 su (some lower values were also reported). After 1994,'all pH values reported were around 10 suo This change in pH at MW02 is interpreted as resulting from an offsite, upgradient source of high pH water migrating onto the Site in the mid-1970s and reaching lVrw02 between 1989 and 1990, This change in pH values also resulted in changes in the groundwater chemistry including increases in arsenic levels. As a result of these changes, trend evaluations are complex and should be interpreted carefully.
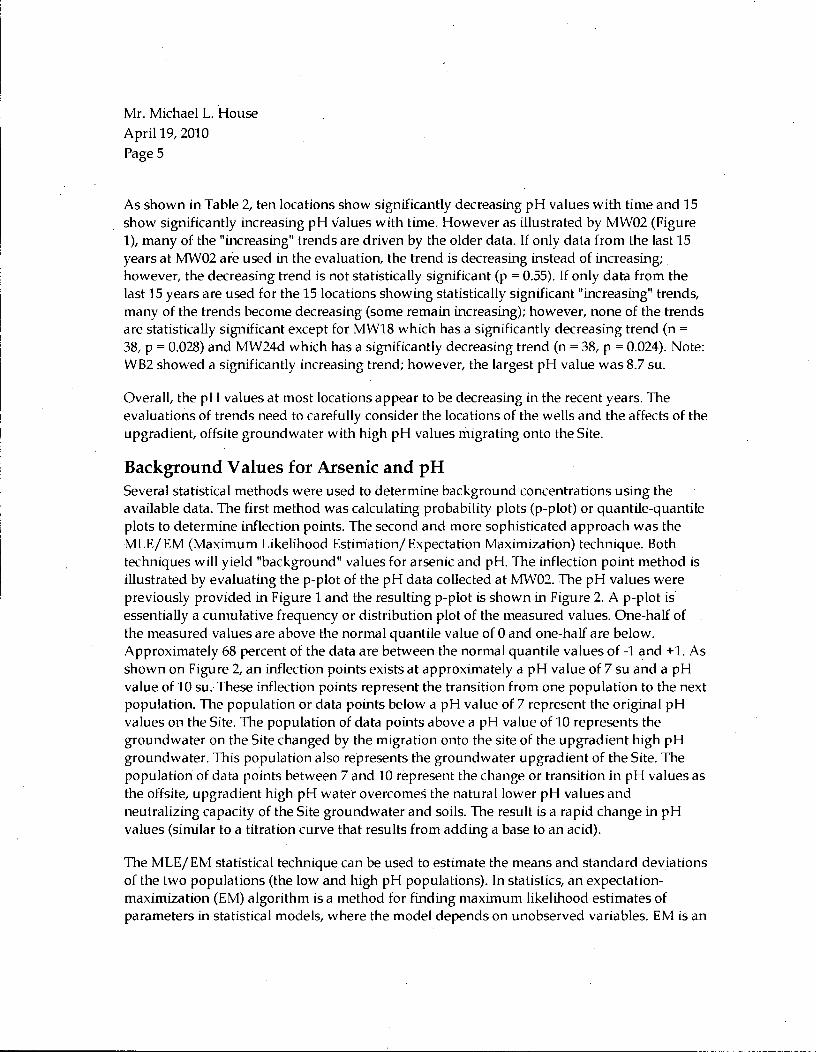
Mr. Michael L. House
April 19, 2010
PageS
As shown in Table 2, ten locations show significantly decreasing pH values with time and 15 show significantly increasing pH values with time. However as illustrated by MW02 (Figure 1), many of the "increasing" trends are driven by the older data. If only data from the last 15 years at MW02 are used in the evaluation, the trend is decreasing instead of increasing; however, the decreasing trend is not statistically significant (p = 0.55). If only data from the last 15 years are used for the 15 locations showing statistically significant "increasing" trends, many of the trends become decreasing (some remain increasing); however, none of the trends are statistically significant except for MW18 which has a significantly decreasing trend (n =
38, P = 0.028) and MW24d which has a significantly decreasing trend (n =38, P =0.024). Note: WB2 showed a significantly increasing trend; however, the largest pH value was 8.7 suo
Overall, the pH values at most locations appear to be decreasing in the recent years. The evaluations of trends need to carefully consider the locations of the wells and the affects of the upgradient, offsite groundwater with high pH values migrating onto the Site.
Background Values for Arsenic and pH Several statistical methods were used to determine background concentrations using the available data. The first method was calculating probability plots (p-plot) or quantile-quantile plots to determine inflection points. The second and more sophisticated approach was the MLEj EM (Maximum Likelihood Estimationj Expectation Maximization) technique. Both techniques will yield "background" values for arsenic and pH. The inflection point method is illustrated by evaluating the p-plot of the pH data collected at MW02. The pH values were previously provided in Figure 1 and the resulting p-plot is shown in Figure 2. A p-plot is' essentially a cumulative frequency or distribution plot of the measured values. One-half of the measured values are above the normal quantile value of 0 and one-half are below. Approximately 68 percent of the data are between the normal quantile values of -1 and +1. As shown on Figure 2, an inflection points exists at approximately a pH value of 7 su and a pH value of 10 suo These inflection points represent the transition from one population to the next population. The population or data points below a pH value of 7 represent the original pH values on the Site. The population of data points above a pH value of 10 represents the growldwater on the Site changed by the migration onto the site of the upgradient high pH growldwater. This population also represents the growldwater upgradient of the Site. The population of data points between 7 and 10 represent the change or transition in pH values as the offsite, upgradient high pH water overcomes the natural lower pH values and neutralizing capacity of the Site groundwater and soils. The result is a rapid change in pH values (similar to a titration curve that results from adding a base to an acid).
The MLEjEM statistical technique can be used to estimate the means and standard deviations of the two populations (the low and high pH populations). In statistics, an expectationmaximization (EM) algorithm is a method for finding maximum likelihood estimates of parameters in statistical models, where the model depends on unobserved variables. EM is an
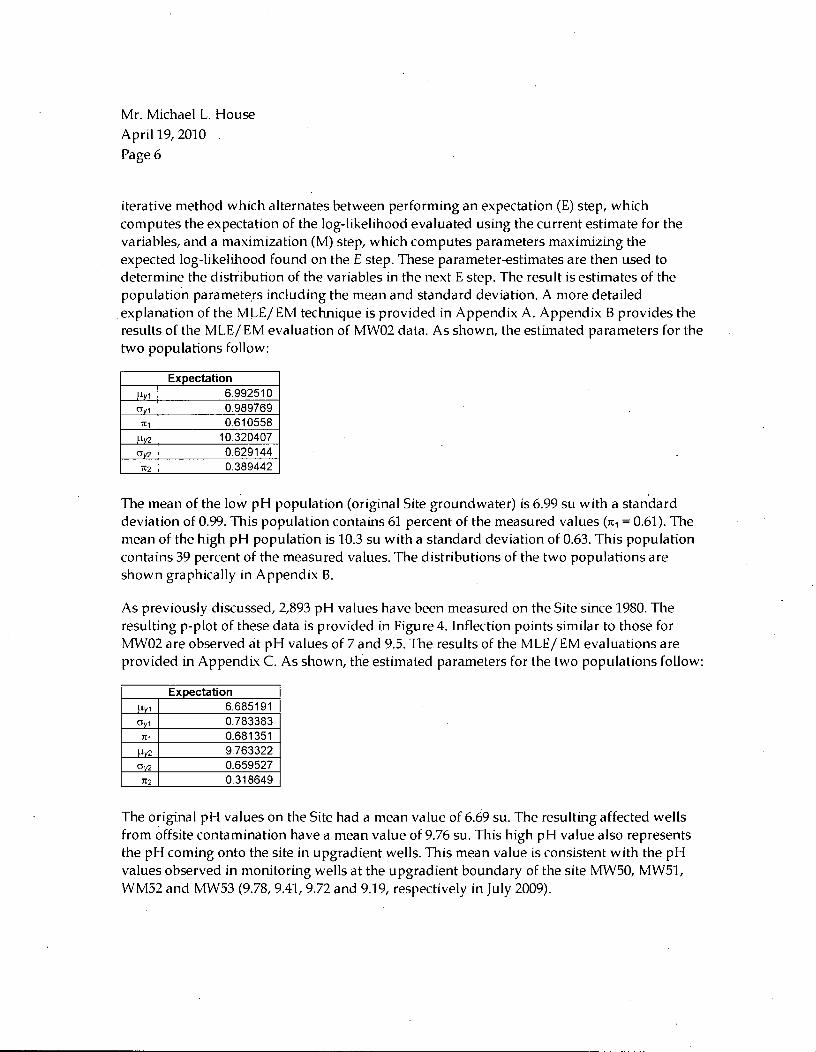
Mr. Michael L. House
April 19, 2010
Page 6
iterative method which alternates between performing an expectation (E) step, which computes the expectation of the log-likelihood evaluated using the current estimate for the variables, and a maximization (M) step, which computes parameters maximizing the expected log-likelihood found on the E step. These parameter-estimates are then used to determine the distribution of the variables in the next E step. The result is estimates of the population paramete,rs including the mean and standard deviation. A more detailed explanation of the MLEjEM technique is provided in Appendix A. Appendix B provides the results of the MLEj EM evaluation of MW02 data. As shown, the estimated parameters for the two populations follow:
Expectation ~y1 6.992510 CTy1 0.989769
1t1 0.610558 ~ly'2 10.320407 CTy'2 0.629144
1t2 0.389442
The mean of the low pH population (original Site groundwater) is 6.99 su with a standard deviation of 0.99. This population contains 61 percent of the measured values (11:1 = 0.61). TI1e mean of the high pH population is 10.3 su with a standard deviation of 0.63. This population contains 39 percent of the measured values. The distributions of the two populations are shown graphically in Appendix B.
As previously discussed, 2,893 pH values have been measured on the Site since 1980. TI1e resulting p-plot of these data is provided in Figure 4. Inflection points similar to those for MW02 are observed at pH values of 7 and 9.5. TI1e results of the MLEj EM evaluations are provided in Appendix C. As shown, the estimated parameters for the two populations follow:
Expectation llY1 6.685191 CTy1 0.783383
1t1 0.681351 ~ly2 9.763322 CTy'2 0.659527
7t2 0.318649
The original pH values on the Site had a mean value of 6.69 suo The resulting affected wells from offsite contamination have a mean value of 9.76 suo TI1is high pH value also represents the pH coming onto the site in upgradient wells. This mean value is consistent with the pH values observed in monitoring wells at the upgradient boundary of the site MWSO, MWS1, WMS2 and MWS3 (9.78,9.41,9.72 and 9.19, respectively in July 2009).
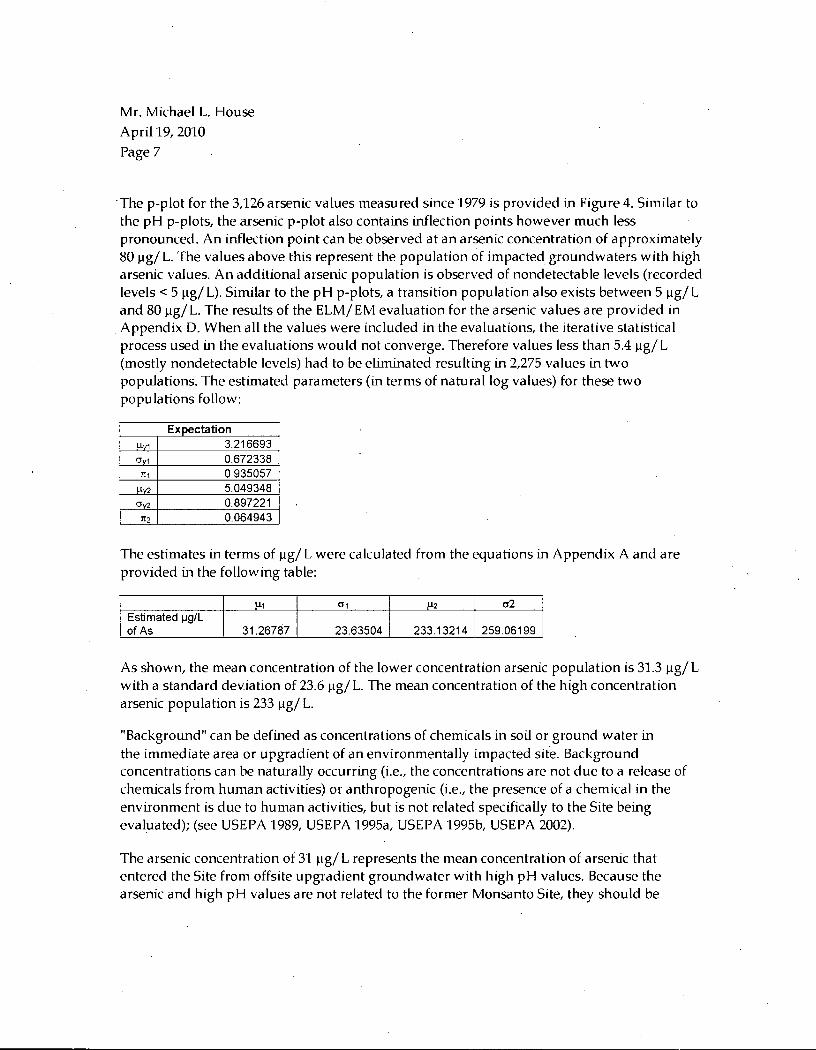
Mr. Michael L. House
April 19, 2010
Page 7
-TI1e p-plot for the 3,126 arsenic values measured since 1979 is provided in Figure 4. Similar to the pH p-plots, the arsenic p-plot also contains inflection points however much less pronounced. An inflection point can be observed at an arsenic concentration of approximately 80 J.lg/ L. The values above this represent the population of impacted groundwaters with high arsenic values. An additional arsenic population is observed of nondetectable levels (recorded levels < 5 J.lg/ L). Similar to the pH p-plots, a transition population also exists between 5 J.lg/ L and 80 J.lg/L. The results of the ELM/ EM evaluation for the arsenic values are provided in Appendix D. When all the values were included in the evaluations, the iterative statistical process used in the evaluations would not converge. Therefore values less than 5.4 J.lg/ L (mostly nondetectable levels) had to be eliminated resulting in 2,275 values in two populations. The estimated parameters (in terms of natural log values) for these two populations follow:
Expectation I-lv1 3.216693 O"y1 0.672338
lt1 0.935057 Uv2 5.049348 0v2 0.897221
lt2 0.064943
TI1e estimates in terms of J.lg/ L were calculated from the equations in Appendix A and are provided in the following table:
1J.1 01 /-12 a2 Estimated 1J9/L of As 31.26787 23.63504 233.13214 259.06199
As shown, the mean concentration of the lower concentration arsenic population is 31.3 J.lg/L with a standard deviation of 23.6 J.lg/ L. The mean concentration of the high concentration arsenic population is 233 J.lg/ L.
"Background" can be defined as concentrations of chemicals in soil or ground water in the immediate area or upgradient of an environmentally impacted site. Background concentrations can be naturally occurring (i.e., the concentrations are not due to a release of chemicals from human activities) or anthropogenic (i.e., the presence of a chemical in the environment is due to human activities, but is not related specifically to the Site being evaluated); (see USEPA 1989, USEPA 1995a, USEPA 1995b, USEPA 2002).
The arsenic concentration of 31 J.lg/ L represents the mean concentration of arsenic that entered the Site from offsite upgradient groundwater with high pH values. Because the arsenic and high pH values are not related to the former Monsanto Site, they should be
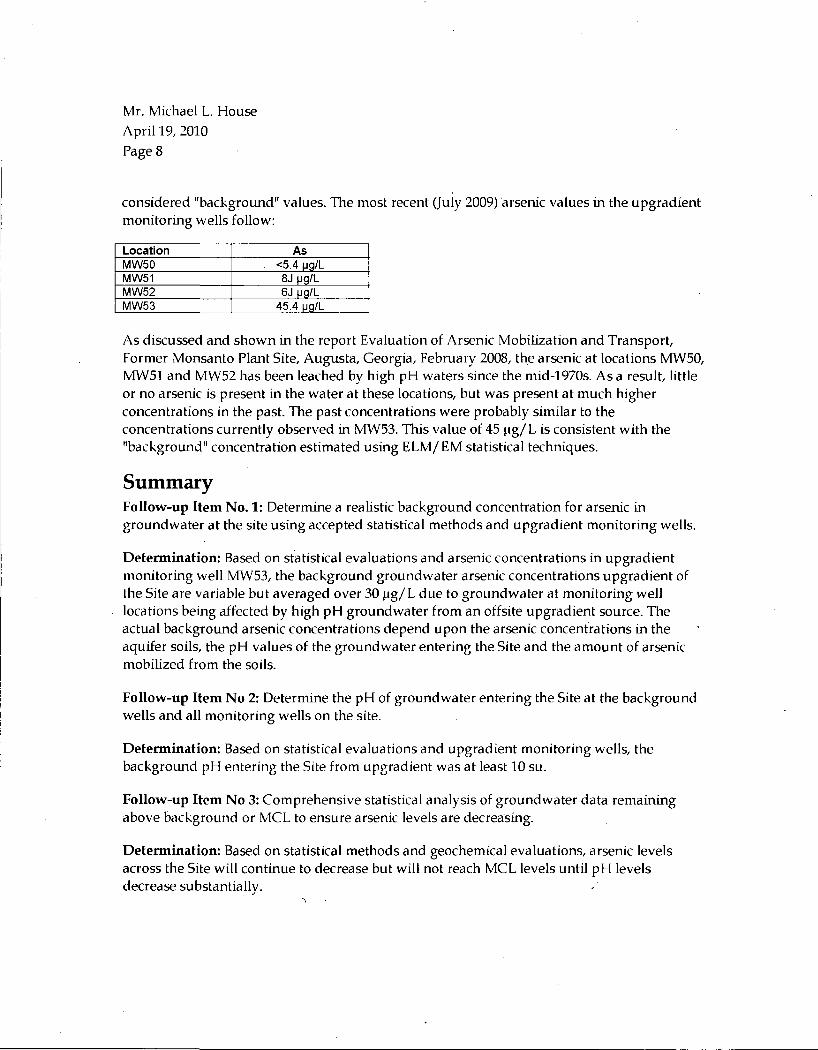
Mr. Michael L. House April 19, 2010
Page 8
considered "background" values. The most recent Ouly 2009) arsenic values in the upgradient monitoring wells follow:
Location As MW50 <5.4 1J9/L MW51 8J IJg/L MW52 6J IJg/L MW53 45.4 IJg/L
As discussed and shown in the report Evaluation of Arsenic Mobilization and Transport, Former Monsanto Plant Site, Augusta, Georgia, February 2008, the arsenic at locations MW50, rvfW51 and MW52 has been leached by high pH waters since the mid-1970s. As a result, little or no arsenic is present in the water at these locations, but was present at much higher concentrations in the past. The past concentrations were probably similar to the concentrations currently observed in MW53. This value of 45 Ilg/L is consistent with the "backgrowld" concentration estimated using ELM/ EM statistical techniques.
Summary Follow-up Item No.1: Determine a realistic background concentration for arsenic in groundwater at the site using accepted statistical methods and upgradient monitoring wells.
Determination: Based on statistical evaluations and arsenic concentrations in upgradient monitoring well rvfW53, the background groundwater arsenic concentrations upgradient of the Site are variable but averaged over 30 Ilg/ L due to groundwater at monitoring well locations being affected by high pH groundwater from an offsite upgradient source. The actual background arsenic concentrations depend upon the arsenic concentrations in the aquifer soils, the pH values of the groundwater entering the Site and the amount of arsenic mobilized from the soils.
Follow-up Item No 2: Determine the pH of groundwater entering the Site at the background wells and all monitoring wells on the site.
Determination: Based on statistical evaluations and upgradient monitoring wells, the backgrowld pH entering the Site from upgradient was at least 10 suo
Follow-up Item No 3: Comprehensive statistical analysis of groundwater data remaining above backgrowld or lVICL to ensure arsenic levels are decrea'sing.
Determination: Based on statistical methods and geochemical evaluations, arsenic levels across the Site will continue to decrease but will not reach MCL levels until pH levels decrease substantially.
Mr. Michael L. House April 19, 2010
Page 9
References Gilbert, R. 0., 1987, Statistical Methods for Environmental Pollution Monitoring, Van Nostrand Reinhold, New York, New York
USEPA, 1996, Guidance for Data Quality Assessment, Practical methods for Data Analysis, EPA QA/G-9, EPA/600/ R-96/084
USEPA, 1989, Risk Assessment Guidance for Superfund (RAGS): Volume I: Human Health Evaluation Manual, interim Final, Office of Emergency and Remedial Response, Washington, DC, EPA/540/1-89/002, OSWER 9285.70-02B
USEPA, 1995a, Engineering Forum Issue Paper: Determination of Background Concentrations of in6rganics in Soils and Sediments at Hazardous Waste Sites, Office of Research and Development, Office of Solid Waste and Emergency Response, EPA/ 540/5-96/500
USEPA, 1995b, Establishing Background Levels, Office of Emergency and Remedial Response, Directive 9285.7~19FS, EPA/540/F-94/030
USEPA, 2002, Guidance for Comparing Background and Chemical Concentrations in Soil for CERCLA Sites, Office of Emergency and Remedial Response, EPA 540-R-OI-003, OSWER 9285.7-41

Tables and Figures

Table 1: Arsenic Trend Evaluations Location Analyte Count (n) S Statistic Var(S) Trend p-value Sen 's Slope
EX2 Arsenic 9 -12 90 Decreasing 0.246252 -0.025548
EX3 Arsenic 44 -319 9751.667 Decreasing 0.001281 -0.005014
MW01A Arsenic 169 -1453 539883 Decreasing 0.048139 -0.001527
MW01B Arsenic 42 -89 8377.667 Decreasing 0.336332 -0.005051
MW02 Arsenic 169 -3416 540812.7 Decreasing 3.42E-06 -0.007389
MW03 Arsenic 80 184 54698 Increasing 0.433941 0
MW04 Arsenic 31 76 3226 Increas ing 0.186678 0 MW05 Arsenic 113 -2027 162299.7 Decreasing 4.93E-07 -0.004093
MW06d Arsenic 106 469 113353.7 Increasing 0.164516 0
MW06s Arsenic 104 1689 107668.3 Increasing 2.68E-07 0
MW07d Arsenic 54 -553 17873 Decreasing 3.64E-05 -0.008466
MW07s Arsenic 53 -582 16864.67 Decreasing 7.68E-06 -0.007392
MW08 Arsenic 59 -415 23294.33 Decreasing 0.006677 -0.001836
MW09 Arsenic 110 1133 147355.7 Increasing 0.003189 0.000613
MW10 Arsenic 23 31 1413 Increasing 0.42482 0.0005806
MW11 Arsenic 18 52 666.6667 Increasing 0.048243 0.0010059
MW12 Arsenic 95 -1423 84019 Decreasing 9.3E-07 -0.000386
MW13 Arsenic 95 -759 96505.67 Decreasing 0.014687 -0.000962
MW14 Arsenic 95 -793 96593.67 Decreasing 0.010825 -0.001202
MW15 Arsenic 88 268 60746 Increasing 0.278671 0
MW16 Arsenic 38 44 6296.667 Increasing 0.587893 0.0012151
MW17 Arsenic 95 -1182 96708.67 Decreasing 0.000146 -0.01164
MW18 Arsenic 95 -332 96472.67 Decreasing 0.286569 -0.000356
MW19 Arsenic 93 843 90648.33 Increasing 0.005164 0.0012272
MW20 Arsenic 16 61 492.3333 Increasing 0.006849 0.0030339
MW21 Arsenic 11 -4 152.6667 Decreasing 0.80816 0
MW22d Arsenic 27 55 1334.333 Increasing 0.139328 0
MW22s Arsenic 27 5 2267 Increasing 0.933048 0
MW23d Arsenic 83 -1723 62301 Decreasing 5.24E-12 -0.002753
MW23s Arsenic 87 -951 74243 Decreasing 0.000489 -0.002772
MW24d Arsenic 86 -1151 71822.33 Decreasing 1.78E-05 -0.003982
MW24s Arsenic 88 -909 76957 Decreasing 0.001064 -0.006273
MW31 Arsenic 59 -457 23143 Decreasing 0.002722 -0.001064
MW32 Arsenic 59 216 23318.67 Increasing 0.159146 0.0006798
MW33 Arsenic 59 -45 23338.33 Decreasing 0.773334 -0.000218
MW34 Arsenic 59 342 23325.33 Increasing 0.025565 0.0016396
MW35 Arsenic 57 -458 21064.67 DecreaSing 0.00164 -0.003452
MW36 Arsenic 59 117 15438.33 Increasing 0.350514 0
MW37 Arsenic 58 58 14847.33 Increasing 0.639935 0
MW38 Arsenic 39 -162 6782.667 Decreasing 0.050594 -0.001706
MW39 Arsenic 39 -60 6783.333 Decreasing 0.47377 -0 .000548
MW40 Arsenic 8 -11 61.66667 Decreasing 0.202866 -0.01105
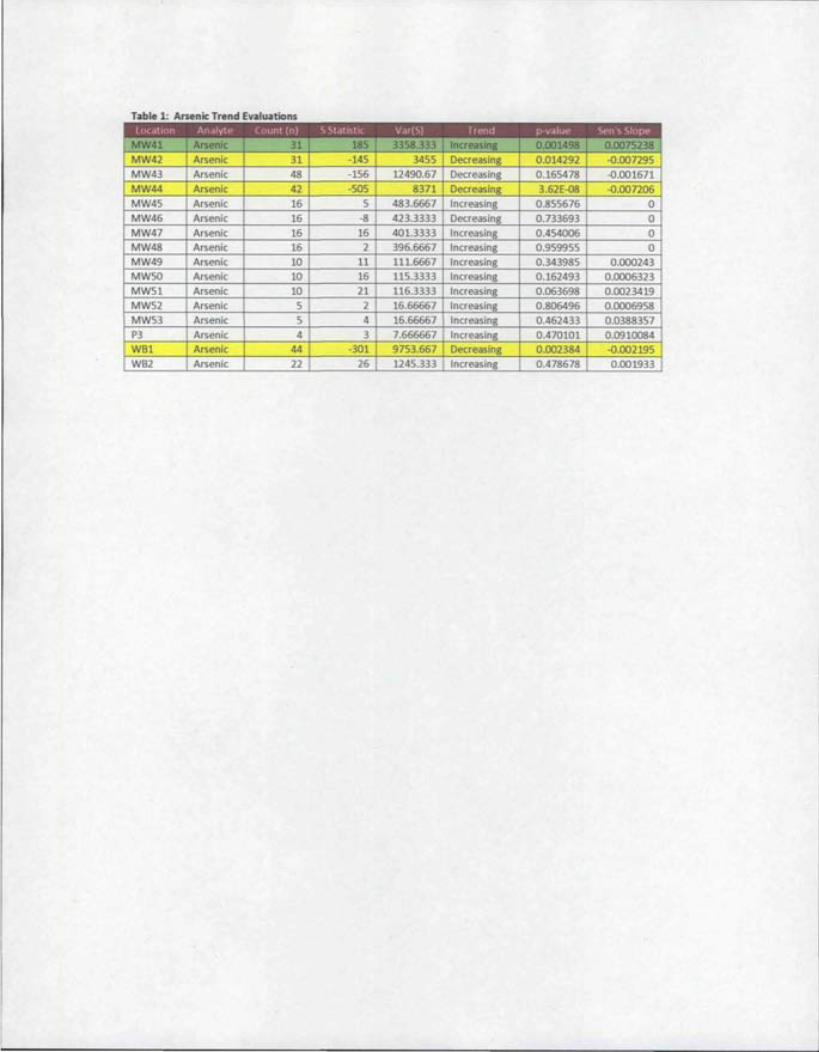
Table 1: Arsenic Trend Evaluations Location Analyte Count (n) S Statistic Var(S) Trend p-value Sen's Slope
MW41 Arsenic 31 185 3358.333 Increasing 0.001498 0 .0075238 MW42 Arsenic 31 -145 3455 Decreasing 0.014292 -0.007295 MW43 Arsenic 48 -156 12490.67 Decreas ing 0.165478 -0.001671 MW44 Arsenic 42 -50S 8371 Decreasing 3.62E-08 -0.007206 MW45 Arsenic 16 5 483.6667 Increasing 0,855676 0 MW46 Arsenic 16 -8 423.3333 Decreas ing 0.733693 0 MW47 Arsenic 16 16 401.3333 Increasing 0.454006 0 MW48 Arsenic 16 2 396.6667 Increasing 0.959955 0 MW49 Arsenic 10 11 111.6667 Increasing 0.343985 0.000243 MW50 Arsenic 10 16 115.3333 Increasing 0.162493 0.0006323 MW51 Arsenic 10 21 116.3333 Increasing 0.063698 0.0023419 MW52 Arsenic 5 2 16.66667 Increas ing 0 ,806496 0.0006958 MW53 Arsenic 5 4 16.66667 Increasing 0.462433 0.0388357 P3 Arsenic 4 3 7.666667 Increasing 0.470101 0.0910084 WB1 Arsenic 44 -301 9753 ,667 Decreasing 0.002384 -0.002195 WB2 Arsenic 22 26 1245.333 Increasing 0.478678 0.001933


Table 2: pH Trend Evaluations Location Analyte COUllt (n) S Statistic Var(S) Trend p-value Sen's Slope
MW46 pH 16 -58 493.3333 Decreasing 0.010279 -0.001138 MW47 pH 16 -24 493.3333 Decreasing 0.300427 -0.000106 MW48 pH 16 -16 493.3333 Decreasing 0.499461 -0.000197 MW49 pH 10 -15 125 Decreasing 0.210498 -0.000333 MW50 pH 10 10 124 Increasing 0.418962 0.0007165 MW51 pH 10 9 125 Increasing 0.474274 0.0008814 MW52 pH 5 -1 15.66667 Decreasing 1 -0.000553 MW53 pH 5 0 16.66667 None 1 0.0001989 P3 pH 4 -2 8.666667 Decreasing 0.734095 -0.00532 WBl pH 44 -132 9768.667 Decreasing 0.185032 -5.43E-05 WB2 pH 22 118 1254.667 Increasing 0.000956 0.0004934

14
'12
10
8 :J CII
6 • 4
• 2
0
1-FQb-80 2~-Jul-85 1~-Jan-9 1
Figure 1: MW02 pH Values vs. Time
pH
•
"".., .... • ••
6-Jul-96 Date
27-DQc-01
Normal Probability Plot
~ "" Ie :J
0 0 i5 E is Z -1
-2 " • •
-3
0 4 • C 6 10
pH
Figure 2: Probability Plot - MW02 pH Values
• • • • •
19-Jun-07
•
°2 1L

Normal Probability Plot
4
3
2
~ 1
~ "' :::l (J 0 "iij
E 0 -1 Z
-2
-3 , •
• -4
0 2 4 6 8
pH
Figure 3: Probability Plot - All pH Values (2,893 values)
Normal Probability Plot
4
3
2
~ 1
C "' :::l (J 0 "iij
E 0 -1 Z
-2 .r--3
-4 10 100
Arsenic
10
• • ,"
1000
Figure 4: Probability Plot - All Arsenic Values (3,126 Values)
• •
12 14
10000

Appendix A
MLEIEM Description
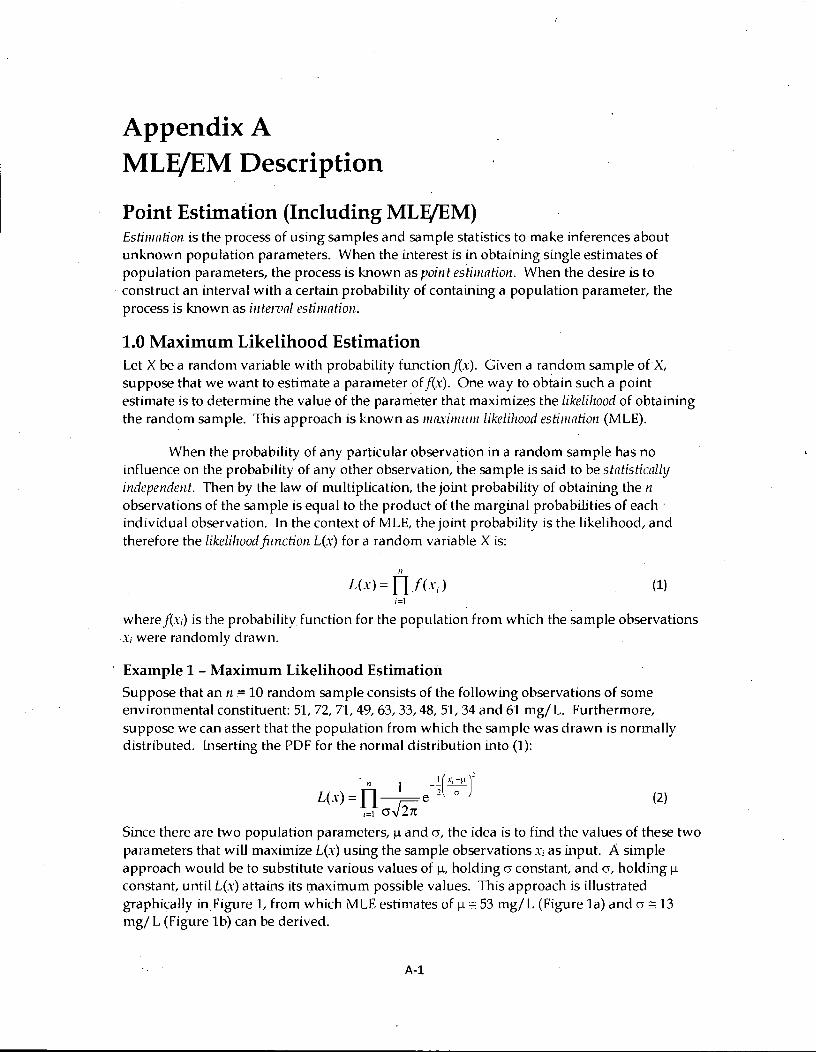
Appendix A MLEjEM Description
Point Estimation (Including MLFjEM) Estimation is the process of using samples and sample statistics to make inferences about unknown population parameters. When the interest is in obtaining single estimates of population parameters, the process is known as point estilllation. When the desire is to construct an interval with a certain probability of containing a population parameter, the process is known as illterual estilllatioll.
1.0 Maximum Likelihood Estimation Let X be a random variable with probability functionf(x). Given a random sample of X, suppose that we want to estimate a parameter of f(x). One way to obtain such a point estimate is to determine the value of the parameter that maximizes the likelihood of obtaining the random sample. This approach is known as maxillllllll likelihood estilllation (MLE).
When the probability of any particular observation in a random sample has no influence on the probability of any other observation, the sample is said to be statistically independent. Then by the law of multiplication, the joint probability of obtaining the n observations of the sample is equal to the product of the marginal probabilities of each, individual observation. In the context of MLE, the joint probability is the likelihood, and therefore the likelihoodfimction L(x) for a random variable X is:
II
L(x) = n f(x i ) (1) i=1
wheref(xi) is the probabilityfunction for the population from which the sample observations Xi were randomly drawn.
Example 1 - Maximum Likelihood Estimation Suppose that an n = 10 random sample consists of the following observations of some environmental constituent: 51, 72, 71, 49, 63, 33,48,51,34 and 61 mgj L. Furthermore, suppose we can assert that the population from which the sample was drawn is normally distributed. Inserting the PDF for the normal distribution into (1):
. 1 (x -~ )' L(x) = fI-l-e-'2-"-;-
. 1=1 cr..J2;. (2)
Since there are two population parameters, 11 and 0, the idea is to find the values of these two parameters that will maximize L(x) using the sample observations Xi as input. A simple approach would be to substitute various values of 11, holding 0 constant, and 0, holding 11 constant, until L(x) attains its maximum possible values. This approach is illustrated graphically inFigure 1, from which MLE estimates of 11 == 53 mgj L (Figure la) and 0 == 13 mgj L (Figure 1 b) can be derived.
A-1

From Figure 1, L(x) reaches its maximum values where the slopes of the two curves are zero, i.e., where the partial derivatives with respect to J.l and with respect to (J equal zero. In the case of the normal PDF, it can be shown that upon taking the partial derivatives and setting them equal to zero:
cr=
II
2: x; ';=1 -Il=--=x
n
II
2: (x, -.rr ..:..'=....:..1 ____ = F
n
(3)
(4)
Such formulas are estilllators and therefore the "hat" convention is used to denote them. Note that the MLE estimator of J.l in this case is the formula for the sample mean, while the MLE estimator of (J is the formula for the biased sample standard deviation. Solving these MLE estimators for Example 1:
i!=x=53.3 a=-Js; =12.9
An estimator is a random variable and therefore an estimate is just one particular realization of this random variable. In other words, if we were to obtain another sample of size n we would obtain another realization of the estimator, or another estimate, which would likely be different from the first. Therefore if we were to repeat this process a large number of times, eventually the sampling distribution of the estimator would emerge. Intuitively, the sampling distribution of a good estimator should cluster around the parameter it is estimating with a small variance. Thus two important criteria of a good estimator are: (1) the mean of its sampling distribution should be equal to the parameter, i.e., it should be lInbiased, and (2) its sampling distribution should exhibit minimum variance relative to aU other estinlators. When these two criteria are met the estimator is said to be a minilllum ul1ril1nce unbiased (MVU) estimator. As the sample size increases, the sampling distribution of a good estimator should cluster increasingly tightly arowld the parameter, i.e., the variance of the sampling distribution of the estimator should decrease as n increases. An estimator with this desirable characteristic is said to be a consistent estimator. Another desirable characteristic of a good estimator is that it should also be an efficifllt estimator, meaning that it should require a relatively small sample size to achieve minimum variance. FinaUy, a good estimator should be a sufficient estimator, in that once it has made its estimate no additional irlformation regarding the parameter is contained in the sample. MLE estimators often exhibit many of these desirable characteristics; they are not always unbiased, however, as illustrated by (4), especially for smaU sample sizes.
A-2

2.0 Expectation Maximization MLE can be used to estimate the ~1arameters of any probability distribution. Provided that the appropriate probability distribution function can be inserted into (1), an iterative solution can be found that maximizes L(x); and of course direct mathematical estimates are possible when solutions can be derived for the partial derivatives when they are set equal to zero. Suppose now that the observations Xi in a random sample are derived from a mixture of III underlying distributions. Then from (1):
IJ m
L(x) = DI>rkfk(x;) (5) i=1 k=1
where ITk represents the mixtllre proportion of the kill distribution. Hence the observations Xi
each have a set of attached weights Wik representing their probabilities of being drawn from each of the k distributions:
k=1
The sum of the weights for each observation of course must be 1,
m
L W ik = I k=1
and the average weight for the kill distribution is the mixture proportion:
II
L Wik
1! --I' -~ k - lik -n
(6)
(7)
(8)
Given (5) through (8), MLE estimates of the parameters offi (x) can be obtained. The problem, however, is that since we usually don't know the mixture proportions ITk we can't calculate the weights Wik using (6), i.e., information is missing. The solution is to make initial estimates of ITOk along with initial estimates of the wlderlying distribution parameters. Then (6) can be solved to obtain initial estimates of Wik GlUed an expectation. The expectation can then be used to re-estimate ITk using (8) along with MLE re-estimates of the parameters, which is called IIlllximizatioll. The process of iterating until the estimates converge is therefore known as e:rpectlltion IIl17ximizlltion (EM).
Example 2 - Expectation Maximization Table 1 is an Il = 254 data set of the concentrations of arsenic in soil at a large commercial site believed to be a mixture of two lognormal distributions, one representing background or natural levels, and the other representing contamination by historical application of arseniccontaining herbicide. For risk assessment purposes we wish to estimate the parameters of the two distributions using EM. After natural log transformation of the data (yi = In Xi), we begin by making an initial (arbitrary) set of parameter estimates, e.g.:
A-3
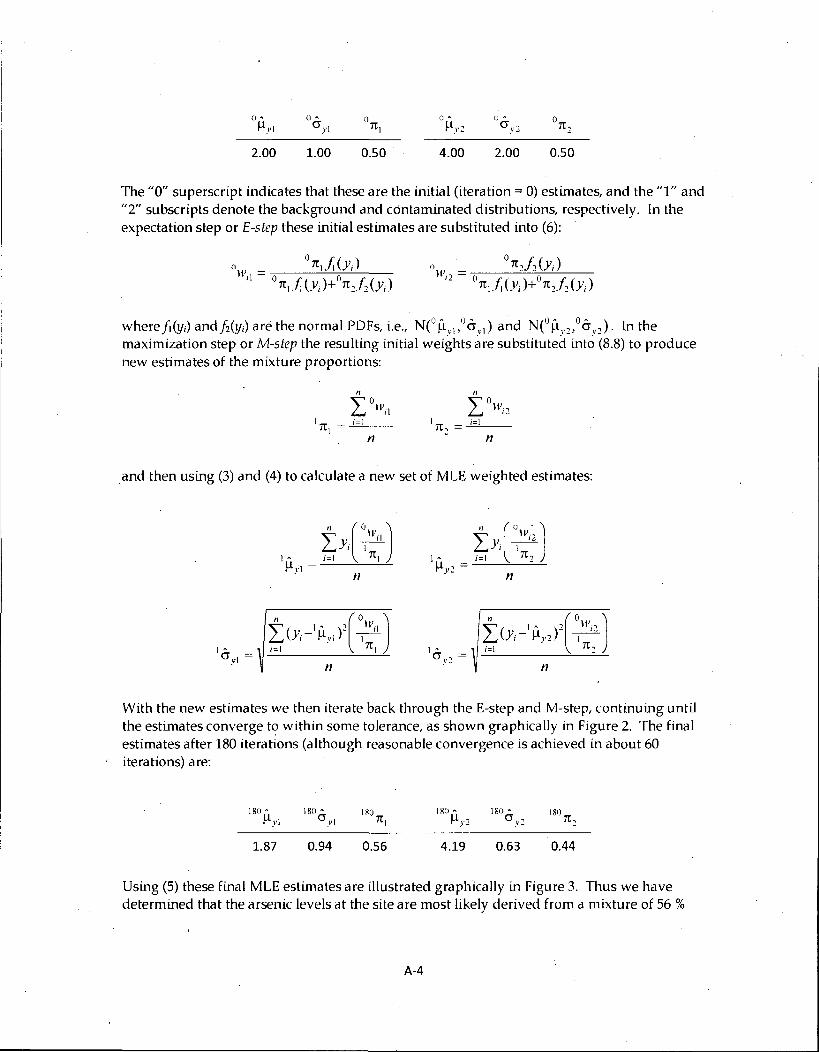
n ... -11.1"
2.00 1.00 0.50 4.00 2.00 0.50
The "0" superscript indicates that these are the initial (iteration = 0) estimates, and the "1" and "2" subscripts denote the background and contaminated distributions, respectively. In the expectation step or E-step these initial estimates are substituted into (6):
n r, - ) n - 11:, ,( V -w' = , . _- 1-
tl II r,- ) II f( ) -11:,. '(Yi +'11: 2• 2 Yi_
where !l(yi) andjz(Yi) are the normal PDFs, i.e., Nt !1y ,,"6y ,) a~d N('!1_,.",o6yJ. In the maximization step or M-step the resulting initial weights are substituted into (8.8) to produce new estimates of the mixture proportions:
/I
L'\l'i2 '11:, = ---,-i=--,-' __
n n
and then using (3) and (4) to calculate a new set of MLE weighted estimates:
/I (O\\-, J LYi _,_i' , • _ i=' ,11:, 11", -
- 1/
With the new estimates we then iterate back through the E-step and M-step, continuing until the estimates converge t<;> within some tolerance, as shown graphically in Figure 2. The final estimates after 180 iterations (although reasonable convergence is achieved in about 60 iterations) are:
'80 • 11.1"
1.87 0.94
'81) 11: , 0.56
'8011:,
4.19 0.63 0.44
Using (5) these final MLE estimates are illustrated graphically in Figure 3. Thus we have determined that the arsenic levels at the site are most likely derived from a mixture of 56 %
A-4

background distributed as LN(1.87, 0.94), and 44 % contaminated distributed as LN(4.19, 0.63).
3.0 Estimating the Mean and Standard Deviation of Lognormal Distributions In Example 2 we estimated the parameters of two mixed lognormal distributions. Usually of course we are interested in also estimating the corresponding arithmetic means and arithmetic standard deviations. We can't just exponentiate the parameter estimates because this would only result in estimates of the geometric means and geometric standard deviations. Rather, we must calculate the weighted means and weighted standard deviations of the original wltransformed data:
11 [w J " ik L..,.x ~ • . i=1 I 1tk
Ilk = (9) n
t<Xi -ftd 2(w'k J i=1 . 1tk
n-I (10) Ok =
Of course when dealing with a single lognormal distribution and not a mixture the weighting term is simply ignored. Using (9) and (10) results in the following estimates for the two distributions in Example 2:
10.1 12.1 80.0 53.8
Thus the estimated arithmetic mean of the background arsenic distribution, for example, is 10.1 mg/kg. This "simple" method of estimating the arithmetic mean and standard deviation is applicable for any type of distribution; however, it tends to produce estimates that become increasingly more biased as the sample size decreases, especially for highly skewed distributions such as the lognormal. Hence in the case of the lognormal distribution the following MVU estimators may be necessary:
• v_ (S~kJ Il - e- I Ll -k- 11 2 (11)
(12)
A-5

where:
" (11' J LV~ --; _ i=1 - I ITk h- (13)
n
:t CVi - Yk f(~J i=1 ITk
n-I (14)
and ll" is the infinite series (a Bessel function):
( )-1 (n-I)u (lI_l)3 11 2 (n_I)5 11 3
d" u - + + , + ---=-,-'------:-. -'----'. n 2!n~(n+l) 3!n-(n+I)(n+3)
(n-Ifu4 (15)
+ 4!n4(/1 + 1)(11 + 3)(n + 5) + ...
Using (11) through (15) results in the following estimates for the two distributions in Example 2:
1=11 . 1-12
10.1 12.0 80.1 55.6
Note that in this example, since II is fairly large, the simple and the lVNU estimators produce similar·estimates .. '
A-6
References Fisher, 1925, Theory of statistical estimation, Proc. Camb. Phil. Soc., 22, 700-725.
Dempster, A.P., Laird, N.M. and D.S. Rubin, 1977, Maximum likelihood from incomplete data via the EM algorithm, J. Royal Stat. Soc, 39(1), 1-38.
Helsel, D. K, 2005, Nondetects and Data Analysis, Statistics for Censored Environmental Data, Wiley.
Lynch, M. and S. Walsh, 1998, Genetics and Analysis of Quantitative Traits, Sinauer Associates.
Gilbert, KO., 1987, Statistical Methods for Environmental Pollution Monitoring, Van Nostrand Reinhold.
Peters, S.c. and H.F. Walker, 1978, An iterative procedure for obtaining maximum-likelihood estimates of the parameters for a mixture of normal distributions, SlAM J. Appl. Math., 35(2), 362-378.
A-7

Table 1 Concentrations Xi (mg/kg) of arsenic in soil (Example 2).
0.30 3.08 4.88 8.02 15.8 29.3 46.4 76.1 117
0.75 3.14 4.99 8.76 15.9 29.8 46.7 76.1 119
1.05 3.17 5.05 9.38 16.1 29.8 46.9 77.3 119
1.16 3.17 5.23 9.95 16.1 31.1 49.7 78.8 123
1.35 3.29 5.28 10.1 16.2 32.9 52.2 81.1 123
1.36 3.32 5.28 10.5 16.7 33.3 52.6 81.2 127
1.46 3.34 5.49 10.6 16.8 35.3 52.8 81.4 128
1.61 3.38 5.62 10.6 17.8 35.8 53.3 82.3 133
1.74 3.40 5.67 11.0 17.8 36.4 54.6 83.0 135
1.77 3.51 5.85 11.1 17.9 36.6 55.1 84.6 137
1.84 3.52 6.28 11.4 19.0 37.9 55.2 85.2 145
1.89 3.61 6.30 11.4 19.4 38.3 55.8 86.5 145
1.92 3.64 6.35 11.5 19.7 38.7 56.2 87.3 148
1.98 3.70 6.47 11.6 19.8 38.8 57.9 87.9 160
2.08 4.02 6.55 11.7 20.5 38.9 58.6 89.1 161
2.10 4.05 6.61 11.9 21.3 39.1 58.9 92.6 181
2.18 4.21 6.65 12.5 22.7 40.0 59.1 92.9 191
2.25 4.23 6.75 12.6 23.0 40.8 59.5 93.4 196
2.31 4.28 6.86 12.7 23.6 41.3 61.9 93.5 215
2.32 4.32 6.97 12.8 24.9 42.5 63.0 96.0 219
2.34 4.36 6.97 13.2 25.2 43.8 65.2 99.2 278
2.36 4.46 6.97 13.6 25.3 44.0 66.3 99.9 342
2.52 4.55 7.01 13.7 26.1 45.0 66.5 101
2.65 4.70 7.03 13.7 26.1 45.1 66.7 102
2.65 4.71 7.13 14.2 26.3 45.2 68.8 104
2.68 4.71 7.35 14.5 26.5 45.3 68.9 105
2.75 4.75 7.39 14.5 27.6 45.3 70.7 106
2.77 4.85 7.88 15.4 27.9 45.5 72.6 108
2.99 4.85 7.94 15.5 28.4 45.9 74.5 110
A-8

30 35 40 45 50 55 60 65 70 75 80
Figure la MLE of parameter ~ in N(~l, cr) for a random sample (Example 1).
o 2 4 6 8 10 12 14 16 18 20 22 24 26 28 30 32
cr
Figure Ib MLE of parameter cr in N(~, cr) for a random sample (Example 1).
A-9
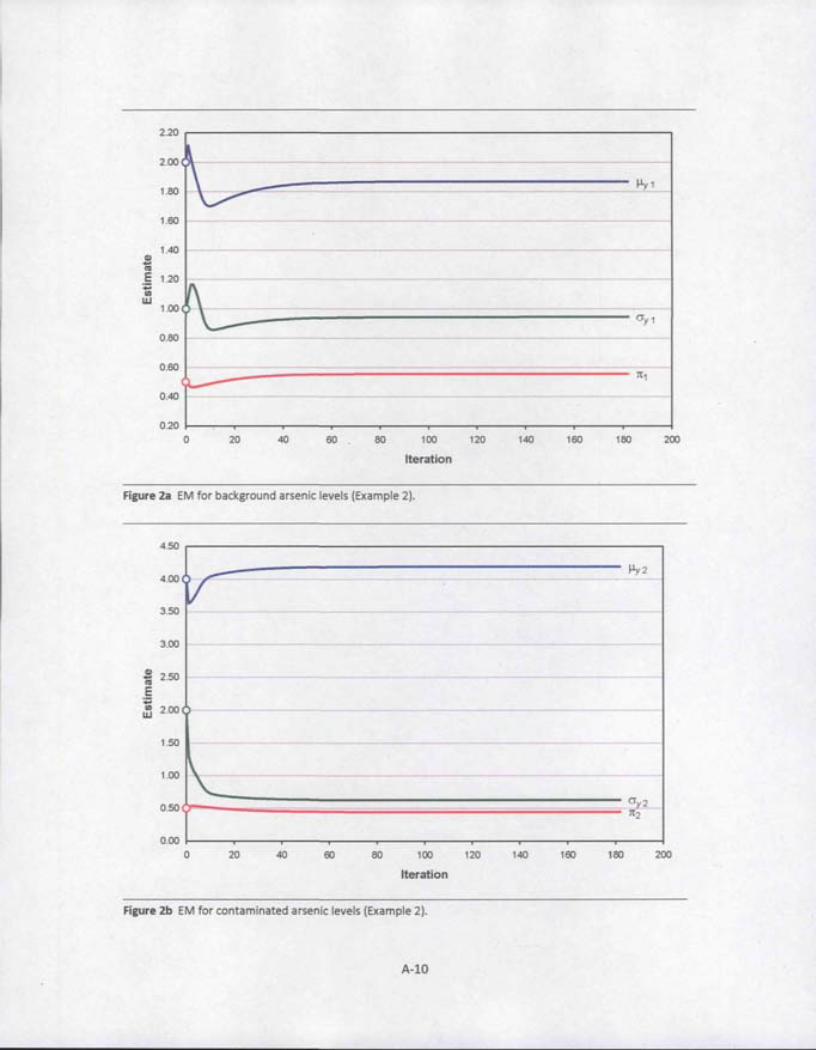
2.20
2.00
1.80 J.Ly 1
1.60
1.40 CII -til E 1.20 .. III W
1.00 ~ ____ ~~=-~::::::::::-=::::~::~::::::::::::::::::=-- cry
1
0.80
0.60 -------0.40
0.20
0 20 40 60 80 100
Iteration
Figure 2a EM for background arsenic levels (Example 2).
4.50
4.00
3.50
3.00
S 2.50 til
E .. III 2.00 W
1.50
1.00
0.50
0.00 0 20 40 60 80 100
Iteration
Figure 2b EM for contaminated arsenic levels (Example 2).
A-IO
120 140 160 180
J.Ly2
120 140 160 180
200
200

) 1.00 1.50
\ 2.00 2.50 3 .00
Estimate
" /lyz
J \ 3.50 4.00 4.50
Figure 3a MLE of parameters Ily in two mixed lognormal distributions (Example 2).
0.20 0 .40 0.60 0 .80
Estimate
1.00 1.20
Figure 3b MLE of parameters cry in two mixed lognormal distributions (Example 2).
A-ll
5.00
1.40

Appendix B MLEIEM Evaluation
MW02

MW-02 (150 pH Values)
Probability plot showing inflection point:
Normal. Probability Plot
3 r--------------------------------------------------------,
~ :g c: IV
2
:::::I a 0 'iij E ... o 2
-1
-2 • • • •
-3 '---------------------
o 2 4
•
,. 6 8 10 12 14
pH
B-1

EM iterations converge:
9.00 (
8.00 ( ~
7.00 \. --
6.00
S 5.00
~ C\I E --sy1 ;::I 1/1 4.00 --p1 w
3.00
2.00
1.00( t"..
0.00 0 20 40 60 60 100 120
Iteration
14.00
12.00 (
10.00 ...
$ 8.00
8 ." E --sy2 ;::I 1/1 - p2 w 6.00
4.00
2.00 (
1\ 0.00
0 20 40 60 80 100 120
. Iteration
B-2
---------------------------------- ----
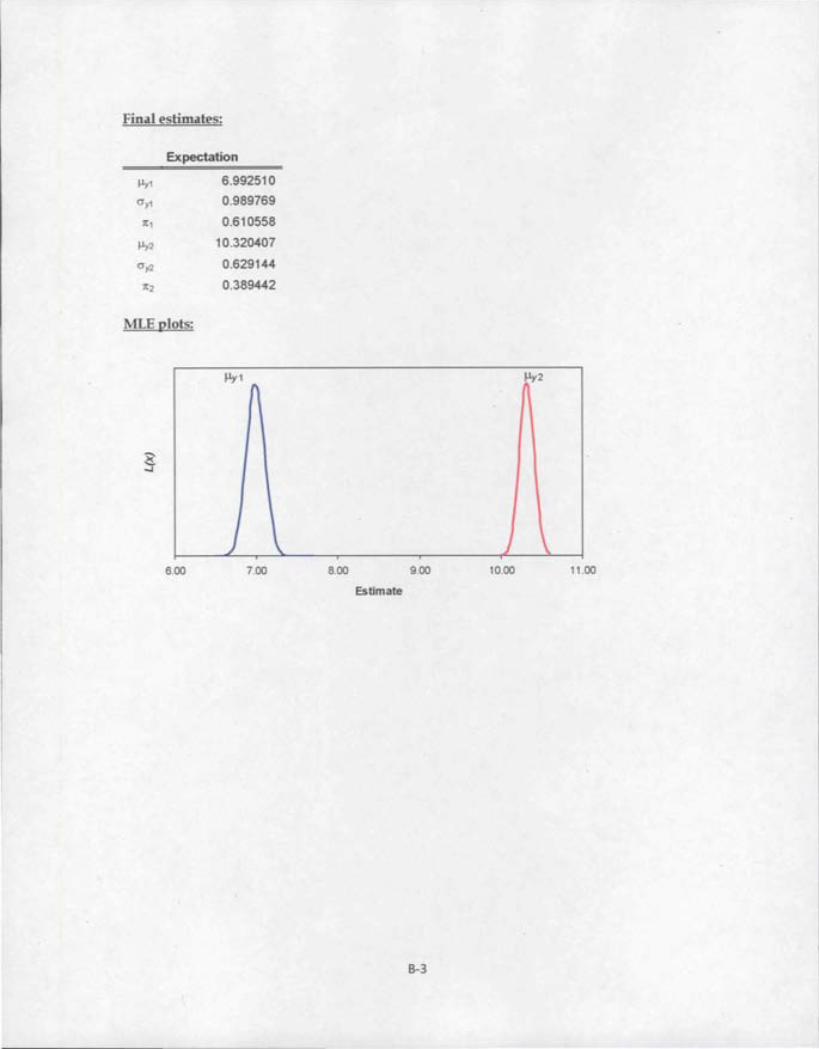
Final estimates:
Expectation
J-ly1 6 .992510
Ciy1 0.989769
7t1 0.610558
J-ly2 10.320407
Ciy2 0.629144
7t2 0.389442
MLE plots:
!!y1 n Jlr2
J ) \ 6.00 7.00 8.00 9.00 10.00 11 .00
Estimate
B-3

Appendix C MLEIEM Evaluation
All pH Data (2,893 Values) .

All pH data (2,893 values)
Probability plot showing inflection points:
Nonnal Probability Plot
4 .--------------,---------------,----~-,------~i-------,
3
2
~ 1 -
'" c
3 0 -- -l 'iij E ... ~ -1
-2 ---- -- ----
I
: . . : -t--------
+- --- --
I I -t---
, I
:-- -1----3 ------ ----,---'-
-4 ~----------,----------,-----------,-------,----I ----,---I ----I o 2 4 6 8 10 12 14
pH
C-1

EM iterations converge:
8.00
7.00 ,.-
6.00 (
5.00
oS EJ I'll E 4.00 --sy1 := C/I --p1 w
3.00
2.00
1.00
0.00 0 20 40 60 80 100 120
Iteration
12.00
10.00
V-
8.00
oS
8 I'll E 6.00 --sy2 = CII --p2 w
4.00
2.00 (
'-. 0.00
0 20 40 60 80 100 120
Iteration
C-2

Final estimates (natural log):
Expectation
lly1 6.685191
cr y1 0.783383
1t:1 0.681351
1ly2 9.763322
cry2 0.659527
1t:2 0.318649
(-3

Appendix D MLEIEM Evaluation
Arsenic Data (2,275 Values)
---------------------------- ---------

Arsenic data (with < 5.4 ugIL values removed - 2,275 values)
Probability plot showing inflection points (all data - 3,126 values):
Normal Probability Plot
4 r-----------~--------------------------~----------__.
3 --------l -!- .. -..1: 1 '1 I I I
2 ---------- ----t . - -: --1
,
1
.!! 1----------+- ---I ,
._. _. ____ . ______ l- __ _
~ lii I I ::J I I ~ 0 -------~--t--- --- ------- r--~ -1- -- -- - - - -f- --- r -- -- ------- - -- ~ --,-~- - --- --
-2 I---------=-J- t ------3 --y------ -- ---------- ---4 L-________ ~~ ____________ ~ ____________ ~ __________ ~
10 100
Arsenic
0-1
1000 10000

EM iterations converge:
4.50.
4.0.0.
3.50
3.00 (
S 2.50 8 CII E --sy1 ~ III 2.0.0. --p1 w
1.50
1.0.0. < ~
0..50. <
0..00 0. 10.0. 200 300 400. 500 600 700
Iteration
7.0.0.
6.0.0.
5.0.0.
S 4.0.0. V ~
CII E --sy2 ~ C/I --p2 w 3.0.0.
2.0.0.
1.0.0.
< 0..0.0.
0. 100 200 30.0. 400. 500 600 700
Iteration
. D-2

Final estimates (natural log):
Expectation
lly1 3.216693
O'y1 0.672338
1C1 0.935057
1ly2 5.049348
0'y2 0.897221
1C2 0.064943
MVU estimates of arithmetic means and standard deviations:
112 0'2
MVU (lJg/L) 31.26787 23.63504 233.13214 259.06199
D-3

Attachment B
4NeuguSUlchronicle.com
M:lWSS THE \ArlOl\
Man huntln, bin Ladan raturns, Isn t giving up
lOS AlIi8.B - An Ameman on il solo mission to hunt down !~amablnLldenisbackin
the United SLnla 10 daY!l a.l'ter authorities found him in the v.:oodsofnorthern Pnkista.nwilh apistolaswoniandrught·vl5lon e-quipmenL
TV reporu showed Garj' F'llulkneron Wednesday aJ'ter· noon ntter he arrh'ed at Los Angeles InternaUonai Airport. The Colorndo man !CIid he WCl5l1't givinguponhl.!lmission.
"Iwouldd~rlbethesitualion. like: I g,A d!ul)"'!liS. So any onegolokidneytheywantto lend mesol can finish this up?" F'ouLknertold KNBC-TV !honly after his nnivnl '1llis I! not about me. "'hal thl!ll!l about I!I the AmerirllJl people and the v.:orld. Wecnn't let pe<Jple liie thiS sctll"e us."
Judga OKs sattlemant lor 9/11 raspondalS
IE:WYIIII-Ajudgesiined offWedne-:5dny on a mnssl\'e 5ettlement for thousands of9111 responders exp05ed La toxir Yiorld Trode Cemer dust.
The settJement must be ap.. proved by 95 peTCt'fltofthe piDmu1fs before becoming f1nai
The settlement would pay S6!!5milllontoS71.2.5million. depending on how mnny people Uke the denl L.a~ers prese!l1ed
pay,)ut estlmate~ tlwt would pay Just more thnn SJ.(X()to peopie ~olTied the)" might be1::ome ill As much nsSl.B million ~ouid go to the e.nt~ ofth05e who died.
The delll would resolve SUIt! rued byneariy IO.OOOpoliceof· t1cer.l.flrei1ghtet'.!o.ndrol15true· nonworkers~therity.
Hundreds In prison got homebuyar tal credit
WAlHlmTOl- Living in prISOn didn't ~op ne-ariy 1.300 mmale!'!fromcoshingmona popular tax brenk for l1m·tlme homebuyen. n government in~'estUlator reported Wedne!ldll)'. TheutaIe: more-thon$9 million.
In rulm'lre-than l4.100f1lers wronglyrec-eive-t\atleIl!t1167 ruili.Lon LD tax crE.'l:liu meant to bo<:Jsl.thenation'sslumpiDihoU5-Ins marbl:!. s:ud the reporr by J.RussellGfflJ1(e.theTrea.sury De~enrs UUpector~eDernl fortaxadmmlStnlUon.
A common seam hod muluple taxpayers using the saie ofll Slngle home. Wllh eaeh rlai.rnJogthe credil In otherc~. tupoyers gOl Uie credit for Stllesthtlt h.CIppened before th~ breD..k st1lrt!'d.
The IRS SIl}'3 ltl.!ltakln,ll ;;teps to get the money bllclt. The :If!ency noted that more thIln:L8 mJUiontaxpayenclDlmedlhe tax m·dlt lhrouih April-claim· iru:llS.7 billIOn In eredit!-wlth only aliny rroctioo gOing to pM5-on lDmates or otherscomn~
- .-WoeLntd Prea
SCIENCE
Blindness cured in stem cell test Chemical damage reversed in study
LOS ANGELES - DOlens ofpeoplewho .... ere blinded or otherwise suffered severe eye d:Jmoge ~hen they we~ splashed .... lthcaust.icehemicalshadtheir si,ctJtrestored~ithtr8.!L'lplantsor their own stem cells. tI sWnnl1li 5uccess for the burgeonmg cellthernpyfteld,lla.l.innre!lt'arch~ reported WNine:w::lay.
The lrealment worked rom· Illetely inS:.! of 107 eyes and par ti"Uyin 14 uthers.wlth b~nent.ol lastm,g upto II decade so far. One man whose eyt',were&everely damaged more thllJl 60 years ago now hns near·nonnal mion.
"'ThiS is 0 roaring 5uecess:' sllid ophlhalmologlst Dr. h'lIn Schwab of the University of Cnlifornill. Dovis. who had no role in the study ~ the long~ and largest of Jts .hnd.
Theapproach .... ouldnothe-Ip p~ple with damage to the optic nerve or mnculordegeneration. whieh im'olves the retma. Nor would it work in people who are C'ompletely blind in both eyes, t.eCDu~e doctors need at Ie-ast ~')mehenlthytis.suethDttheycan trrmsplanL
In the study. published on· line by the Ntw EnglandJQl.lmal
of Mt~. re~eDrcher.l took a ~mall aurnber of stern reUs from a p:lUent"s hea.l~· eye. multiplied them in the Inb nnd plnce-dthem into the burnet! eye, where they wereable-togrow newcornetll tissue to replace what had been d:u:oaged. Because the stem cells orerromthelro~'n bodies. the patient! do not need to to.Jr.e nnti~Jectlondru~.
Adult stem cells have been used for decndes to cure blood cancers 5ueh flS leukemio Ilnd diseases such as sickle cell nnemla ButfixlDQllproblemsuch asdamog~deyes !s a relatively new use-. R~earchers have been stud)1ng cell thernpy for a host of &ierdiseases.includingdiabet.eol and heart failure. With limited success.
Adult stem rells, whlrh tll"e found nroundthe body.ore-dif· ferent from~mbryonic st~m e~lk whlrhcomefro01humCIDt'01br)"os andh.ave!OU)Tl'dethicruroncerm be-cause removing: the cells re· qUUe5 d~ll'.7inA the ernbl1·05.
Pe-ople With eye bums can get an artifiCIal romen. a procedure that carnes compilcntions. or they can receiVe a transplnnt usmgstem cells from II cadaver. bUlthatrequires\akinidrull-'to pf('Ventrejection.
THE UNITED STATES ENVIRONMENTAL PROTECTION
AGENCY Announce-; 8
3rd Five-Year Re.iew For the
Monsanto Corporation Site "Jnl F"'~'Yelr R ... i ... il ~i.n,.:on.hio:!N by lbo u.~ 1'1I'""r-tonmtf\taJ ~Li,,", .\~n...-y d:'p.\)"llbo ,letllupup au-.iLi". LaU".11.bo .'>t.,..,..,t~ S,It I"",.w ID
"u~u.1a.Ridll",:o:IC"""I).G.<:q1.l. 11v .......... eoltlm ..... i ... islD ..... Ju.oIt~
;",rl~mt!lI.l.Li""' IIII!d pcr1mn~ 01 ~ rmwdy 111 "1"Ilrr '" litttlllllllf If!llt ....... ..ry i> rrnLa u.~ o! hWll" h~lIl1h LIId I.lJe tD\lJ"t!l1IIItnl .... hnI ''''IIPIt1CJ.. top)' 01
1M' ...... '.,...," .,lLho- pLo<OoJ Il Lbo lliI.:zrm.auCZll P.ep-:oollCZl)' tilco "".IN ",!bo-I r.\ R .... "n1(...,"',. 1111> FL<zor, 1>1 Fon~1I> ')!,..,.t. S w. ,\!.Ionla. GA JfI)U).lnd<bo .\u~Ull.·Ridv'."nd Co:z<IIIIy Publ;"'1.,bo"ary. 'IO~ G ......... ~ln>rl AUiUS'", l.lA 10\101.
1'1'.\ .... ,11 11s" ....... d"',. nU/tllToo,ol in"',....,~ ...... 'u.nollfTyt....III01ot •. ...:",Jm ... h~"J"rn,IaIs .• 'I"or!l,ilb.lIIololh .... "'ot-'"iPwirop'ruon"nlh~,"'lInuP
ll1C" "'ItIIlll1IUty till ,(!fIIrit..!edunn£t lIW rrz ..... ") pro.iJ",~ ,,,,,u,..,,I..I/"O( ~_u,... flI.e ... bo:.luLeJdw: o! ~ompl,,"on !o, ,boo ri.~·,u, 11">"'" II Srp''''''ho-,. !II10 II you .ouLd ~uto"P"u. ..,Ih ..... b-out!hi.o ~i"'.pLe...,cILlI.,ndI.sl&T\.J.. [p .... C<"T(llltlUllJty l .... ot-o::rm"'Coon1ma" Ii ,olQ.!1!>('2·8-IS1. II ~()U M"III)" ""bn;"'oJ ~ .... uo ... , pl~_ c"DlloW"\ RobmJ ..... J~h. [P., Rnn..Jisl Pr0i .... . \!l:II(ltr.'!-II~J -'to~·~8L'~.
Thursday, June 24 :!OIO
NATION
Cap placed back on oil leak Estimated 290,000 gallons spills after robot accident
FrurnK-"i",R'7'f.'TU
NEVo'(IRLEANS-(tilspewedunoontrolled1JIl.o the Gulfof Me:urofor much of the day Wednesday b~rore engineen reattached a cap being used to contain the gusher llJld direct !IOmeorthe crude to Ilsuriace:;hip.
The lOgIStiC"'!! roordlD.lltor on board the Disc~ .. erer E:nterpnsE!r. the slup that has be-en siphoning the nil said that after more than iO hours. the system was again wUectmg the crude. The rrewmember cled not to be identifled by nome b(,(lIuse he WD.!l
nat aul.horued to prOVide the information. BP bter confirmed thecnp WD!I bock In ploet.
The coordinator said it would to.Jr.e a little time for the system to "get ramped bock up."
Most reC"~ntly. the- system. which has been In plxe~nreJuneol ..... a~S1Jti.J.ngup about29,OOOgnllorus an hour. erude that spew~ back into \.he- Gulf unabated Wednesday. At that rate. it could mean :lbout ~.OCC extrn gallOrul eseaped intothe water before the syiU!m restarted. Anothersrup "'CIS ru.u coUe-cting.!l smaUer amount of oil and burniDi it on the surf:lce.
The eap was hfted Wednesdoy morning ru'ter a robotir submarine bumped intoitondclose-don oil venL m151L1i fellTS thot &lushy "'hydrate!'!" mJght
"'C'"ll£LSI'O,~"!:'~!II!ASSOO·Il'DP,*-SS
Susan Sundell of Salem, N.H .. watehe. oil wuh .. hore .1 Pen.KOla 8aKh, Fla, She de.eribed the Kene a. "like going to a"" ••. "'
fonn under the cop, U.S. COlI..5t Guard Rear Adm. Thad Allen said e3Tlier in a media briel1na.
"Out of an abundanee of rIIUUOD .. they moved the eOl:ltamment C:JP ~ith the riser pipe and m(l'o'ed away So they C'lIn IlS5t'!5 the rondnion.'" Alle-n srud.
Allelllhf' feder4.l ,io"\iernment"s point man for ther~onse.S3.ldthalevenifthec.llpS)""Slem .... ere put back. rough 5easl'rom troplcnl .... eather systems mLght force workers to dISengage it (or II number ofdlij"!.
AcruWefllher.rom hurneane expert Joe BIlS· lardl .... arned Wedne-sdllY that a tropiral storm eould form in the reglon next w£"ek. One rornputer model projects a streugthening troplelll cyclone movJ.O.g to .... ard Louwnna from the Cmbbenn.
,I.JI~IN/5SJ~Et1IOpri:rsa!a.
'1l"*l~'.arllaI""lml , [mdl!'9'ia delofy l,ijsodooafrs Ittl~crde-1.IIJ~5Jm. .l,4erttLnlYITlISl.t:erml'l9:l 1* Seleae!llM'SJDL5COI1I15lJ-70\
so MUCH MOREl Space simply will 110t
Former Bassett Location
us 10 lislallthat go now ... regardless
of cost or profit. 00n1 miss the opportu1utyl
1254 Augusta West Parkway Augusta. GA 30909
Phone: 706-860-1210
DEVELOPMENTS • BP managing duoctor Bob
Dudley, ..... ho Inhentaa the Gull oil SPIll re!:OO"lse from BP's CEO. said Amancan:s nave Deef1 t)Q quo. kl blame his company lor ~e d!sastBr.
• A federal report con~rm5 whal mdependent sclellbsts nave been sa'l'1ng lor wooLo.,: Undersea ()!I plumes extol"'(! lor miles lrom the rvpn.HoCl well. The mper! might help measure the ettecl!veness 01 spreadIng chemicals 10 b~ak up lt1eo!l.
• The Obama admlnistrabon askEd B rlXlge 10 oolay 8 court ruling Inat overturned a lTlorat:mum on l1eYr dnlling !f' the Gull. In court oaoers. tre JUStICe [)epanment says 1/ is appeahflQ 1118 OOClSioo t:If U.S. Dlslrct ..udge Martin Feldman.
• The House ow ...... helrmngty apD~al!1ea,,",retnat
would li]l',oe sub[loena power to the prnsldenbal commISSion n"lveSbgabng the ng explO$l(II"Iancl spill.
- Auociated PIlI ••

Attachment C

Interview Form for Monsanto Corporation Superfund Site Five-Year Review
Site Name: Monsanto-Augusta Plant EPA ID No.: GAD001700699 Interviewer Name: Kevin Haborak AffIliation: Corps of Engineers Subject's Name: Burt Taylor AffIliation: Prayon Subject's Contact Infol'mation: 706-771-3421 Time: 15:00 Date: Aplil 19, 2010 Type of Interview: e-Mail Location of Intel'View: Augusta PLant
Site Owners
1. What is your overall impression of the remedial activities at the site? Good
2. What effect has this site had on the surrounding community, if any? There has been no effect on the surrounding community, and administrative controls are in place to ensure there will be no effect on the surrounding community.
3. How well do you believe the remedy currently in place is performing? The current remedy is performing as designed and remains protective of human health and the environment.
4. Are you aware of any complaints or inquiries regarding environmental issues or the remedial action from residents since implementation of the cleanup? No
5. What is the frequency of Operation & Maintenance (O&M) activities and inspections at the site? To your knowledge has the maintenance been implemented as intended? Operation of the extraction pumps is 24/7. The pumps and pipeline are inspected daily Monday - Fridays except for Plant Holidays. Yes, maintenance activities have been implemented as intended.
6. Have the institutional control requirements been implemented and enforced as designed? Yes
7. What effect has the reuse of the site had on the community? Are you aware of any changes in projected land use? The site has remained in use throughout the corrective action. There are no changes in land use projected.
8. Do you feel well informed about the site's activities and progress? Ifnot, what other methods of conveying information should EPA use? Yes.
9. Do you have any comments, suggestions, or recommendations regarding the site's management or operation? The project team does a very good job in the management and operation of the remedial action.

Interview Form for Monsanto Corporation Superfund Site Five-Year Review
Site Name: Monsanto-Augusta Plant EPA ID No.: GAD001700699 Interviewer Name: Kevin Haborak Affiliation: Corps of Engineers Subject's Name: Burt Taylo.o Affiliation: Prayon Subject's Contact Information: 706-771-3421 Time: 15:00 Date: April 19,2010 Type of Interview: e-Mail Location of Interview: Augusta Plant
O&M Contractor
1. What is your overall impression of the proj ect? Good, all remedial elements are well maintained in good working order and performing as designed.
2. Is the remedy functioning as expected? How well is the remedy performing? Yes, the remedy is functioning as expected. The remedy is performing as designed. .
3. What does the monitoring data show? Are there any trends that show contaminant levels are decreasing? The data indicates that arsenic levels in the surficial aquifers have decreased since the initiation of the corrective action.
4. Is there a continuous on-site O&M presence? If so, please describe staff and activities. If there is not a continuous on-site presence, describe staff and frequency of site inspections and activities. Pumping activity is 2417. Daily inspection· of pumps and pipelines takes place Monday - Friday except for plant holidays. Sampling and analysis of monitoring wells occurs twice per year, and is reported to the state EPD, to the down gradient industrial site, and to the local POTW.
5. Have there been any significant changes in the O&M requirements, maintenance schedules, or sampling routines since start-up or in the last five years? If so, do they affect the protectiveness or effectiveness of the remedy? Please describe changes and impacts. No significant change in the last five years.
6. Have there been unexpected O&M difficulties or costs at the site since start-up or in the last five years? If so, please give details. Not in the last five years.
7. Have there been opportunities to optimize O&M, or sampling efforts? Please describe changes and resultant or desired cost savings or improved efficiency. No significant change in the last five years.
8. Do you have any comments, suggestions, or recommendations regarding the project? No
2

Interview for Five-Year Review
Site Name: Monsanto Co"poration Intel"Viewel' Name: Linda Sta .. ks, Public Affairs Specialist, U.S. EPA Subject's Name: Do Hyong Kim Subject's Contact Information: 404-657-8685 Time: 3:00 Date: August 5,2010 Type of Intel"View: Phone
State Agency
1. What is your overall impression of the project? He has wOI'ked on this pl'oject fo .. ovel' 3 years. The facility is still maintained and eve"ything seems to be going well. They a"e still monito .. ing wells at the plant. They even checked the offsite monitOl'ing wells on the last site inspection.
2. How well do you believe the remedy currently in place is performing? He believes that the cu .... ent "emedy is working well. Still pl"Otective of the health and envi,·onment.
3. Are you comfortable with the institutional controls required for the Site and their current status of implementation? Yes. They have fences al"Ound the al·ea.
4. Are you aware of any complaints or inquiries regarding environmental issues or the remedial action from residents since implementation of the cleanup? No.
5. Has your office conducted any site-related activities or commlmications in the last five years? If so, please give purpose and results of these activities. No.
6. Do you have any comments, suggestions, or recommendations regarding the site's management or operations? Thel'e is still some al'senic contamination at the site, but it is well contained and is causing no pl·oblems. '

Interview for Five-Year Review
Site Name: Monsanto COioporation Inten'iewelo Name: Linda Stal°ks, Public Affair°s Specialist, U.S. EPA Type of Intel"View: In peloson Date: July 29,2010
Resident 1
1. What is your overall impression of the project? I have lived in the aloea fOlo 3 yea.os. I have hea.od about the Monsanto plant f.oom just living in the Augusta Aloea, but I thought it was operating as something diffe.oent now.
2. What effects have site operations had on the surrounding community. None.
3. Are you aware of any commlmity concerns regarding the Site or its operation and administration? If so, please give details. None.
4. Are you aware of any complaints or inquiries regarding environmental issues or the remedial action from residents since implementation of the cleanup? No.
5. What effective has this site had on the surrounding community? None.
6. Do you have any comments, suggestions, or recommendations regarding the site's management or operation? No.
7. Have there been any complaints, violations, or other incidents related to the Site? If so, please give details of the events and results of the responses. No.
Additional Comments: I would like to be contacted should there be anything significant that goes on with the site.

Interview for Five-Year Review
Site Name: Monsanto COI·po.-ation Intel"Viewer Name: Linda Starks, Public AfTail's Specialist, U.S. EPA Type of Intel"View: In pel'son Date: July 29, 2010
Resident 2
----------------
1. What is your overall impression of the project? I have lived in the area for 27 yeal·s. I have hea.·d about the Monsanto plant. I remember when the initial remediation started but attended no meetings because of my schedule.
2. What effects have site operations had on the surrounding community. None to my knowledge.
3. Are you aware of any community concerns regarding the Site or its operation and administration? If so, please give details. None.
4. Are you aware of any complaints or inquiries regarding environmental issues or the remedial action from residents since implementation of the cleanup? No.
5. What effective has this site had on the surrounding community? None.
6. Do you have any comments, suggestions, or recommendations regarding the site's management or operation? No.
7. Have there been any complaints, violations, or other incidents related to the Site? If so, please give details of the events and results of the responses. No.

Interview for Five-Year Review
Site Name: Monsanto COI'pol"3tion Intel"Viewe.· Name: Linda Stal'ks, Public Affairs Specialist, U.S. EPA Type of Intel"View: In person Date: July 29,2010
Resident 3
1. What is your overall impression of the proj ect? I have lived in the a.·ea fOI' 25 yeal·s. I have heal'd about the Monsanto plant and I am awa.·e of the activities conceming the contamination.
2. What effects have site operations had on the surrounding community. None.
3. Are you aware of any community concerns regarding the ·Site or its operation and administration? If so, please give details. None.
4. Are you aware of any complaints or inquiries regarding environmental issues or the remedial action from residents since implementation of the cleanup? No.
5. What effective has this site had on the surrounding community? Once we found out the water was in no dangel' of poisoning them they wel'e fine.
6. Do you have any comments, suggestions, or recommendations regarding the site'~ management or operation? No. But we hadn't heard anything about Monsanto in a long time so they felt evel-ything was fine.
7. Have there been any complaints, violations, or other incidents related to the Site? If so, please give details of the events and results of the responses. No.

Interview for Five-Year Review
Site Name: Monsanto COI'pol'ation Interviewel' Name: Linda Stal'ks, Public Affairs Specialist, U.S. EPA Type of Intel-view: In pel'son Date: July 29, 2010
Resident 4
1. What is your overall impression of the project? I have lived in the al'ea for 2 yeal's. I have heal'd nothing about the Monsanto plant.
2. What effects have site operations had on the surrounding community. N/A
3. Are you aware of any commwlity concerns regarding the Site or its operation and administration? If so, please give details. N/A
4. Are you aware of any complaints or inquiries regarding environmental issues or the remedial action from residents since implementation of the cleanup? N/A
5. What effective has this site had on the surrounding community? N/A
6. Do you have any comments, suggestions, or recommendations regarding the si te' s management or operation? N/A
7. Have there been any complaints, violations, or other incidents related to the Site? If so, please give details of the events and results of the responses. NI A
Attachment D
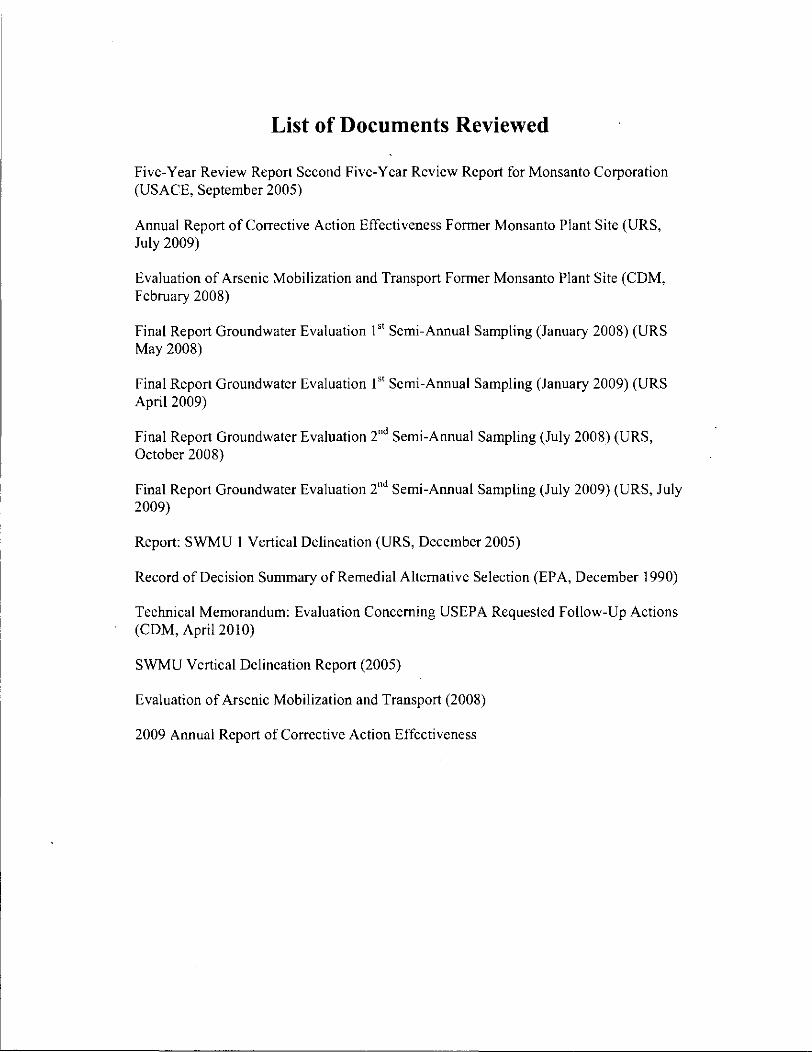
List of Documents Reviewed
Five-Year Review Report Second Five-Year Review Report for Monsanto Corporation (USACE, September 2005)
Annual Report of Corrective Action Effectiveness Former Monsanto Plant Site (URS, July 2009)
Evaluation of Arsenic Mobilization and Transport Fornler Monsanto Plant Site (CDM, February 2008)
Final Report Groundwater Evaluation 151 Semi-Annual Sampling (January 2008) CURS May 2008)
Final Report Groundwater Evaluation 151 Semi-Annual Sampling (January 2009) (URS April 2009)
Final Report Groundwater Evaluation 2nd Semi-Annual Sampling (July 2008) CURS, October 2008)
Final Report Groundwater Evaluation 2nd Semi-Annual Sampling (July 2009) (URS, July 2009)
Report: SWMU 1 Vertical Delineation (URS, December 2005)
Record of Decision Summary of Remedial Alternative Selection (EPA, December 1990)
Technical Memorandum: Evaluation Concerning USEPA Requested Follow-Up Actions (CDM, April 2010)
SWMU Vertical Delineation Report (2005)
Evaluation of Arsenic Mobilization and Transport (2008)
2009 Annual Report of Corrective Action Effectiveness
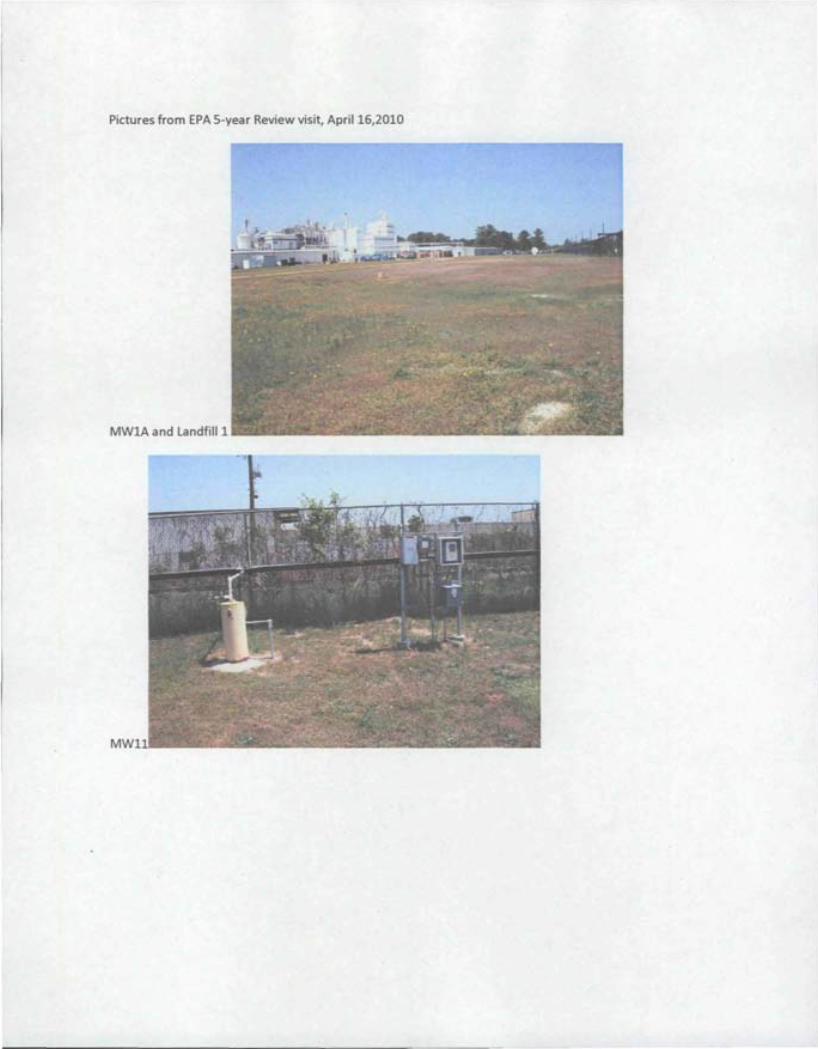
Pictures from EPA 5-year Review visit, April 16,2010
MW1A and Landfill 1
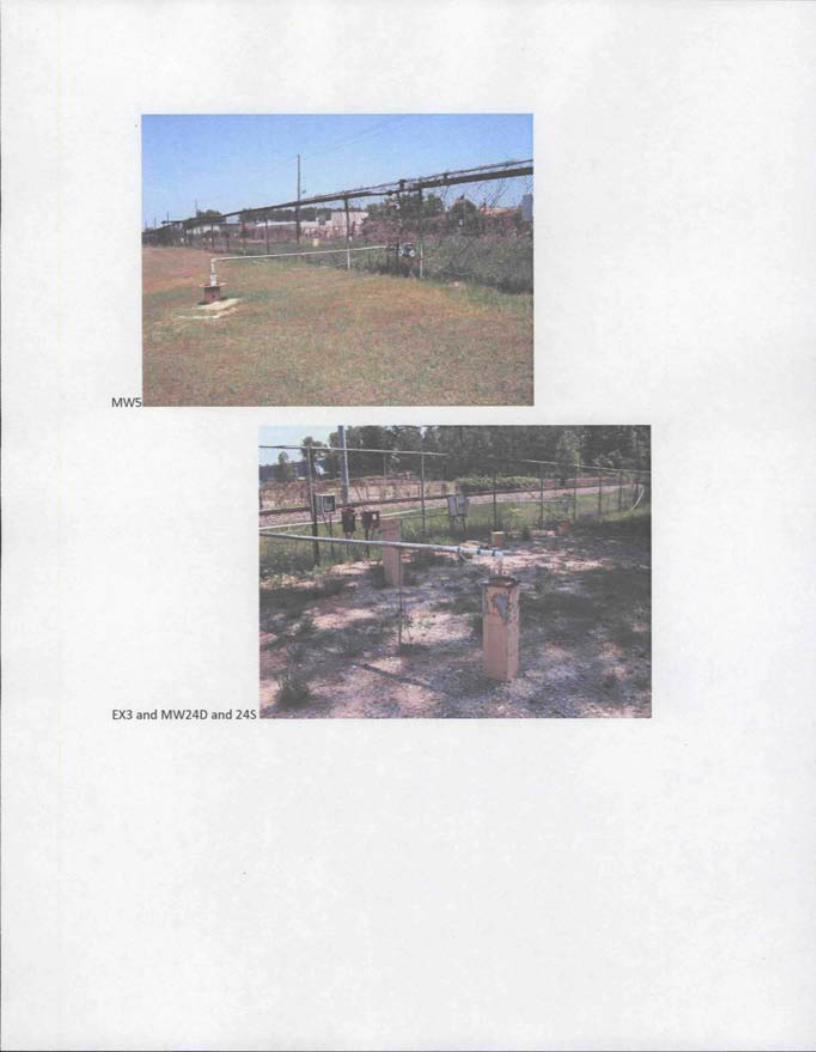
EX3 and MW24D and 24S

Landfill 2
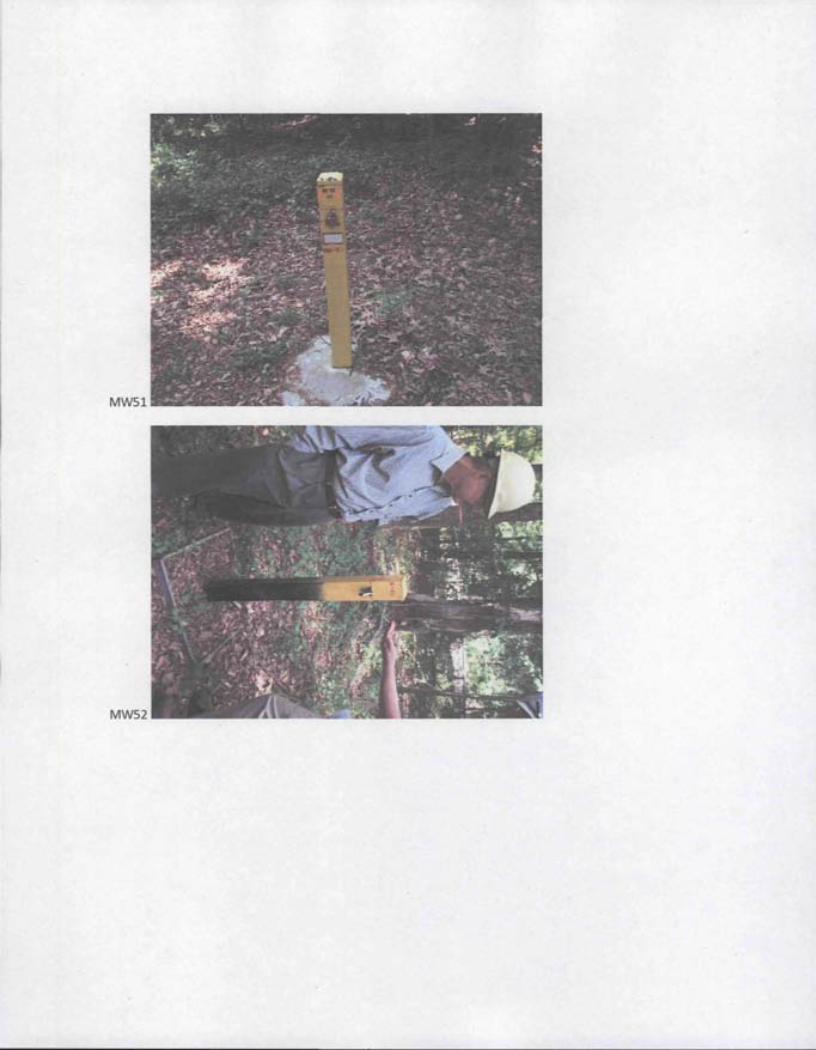
MW51
MW52
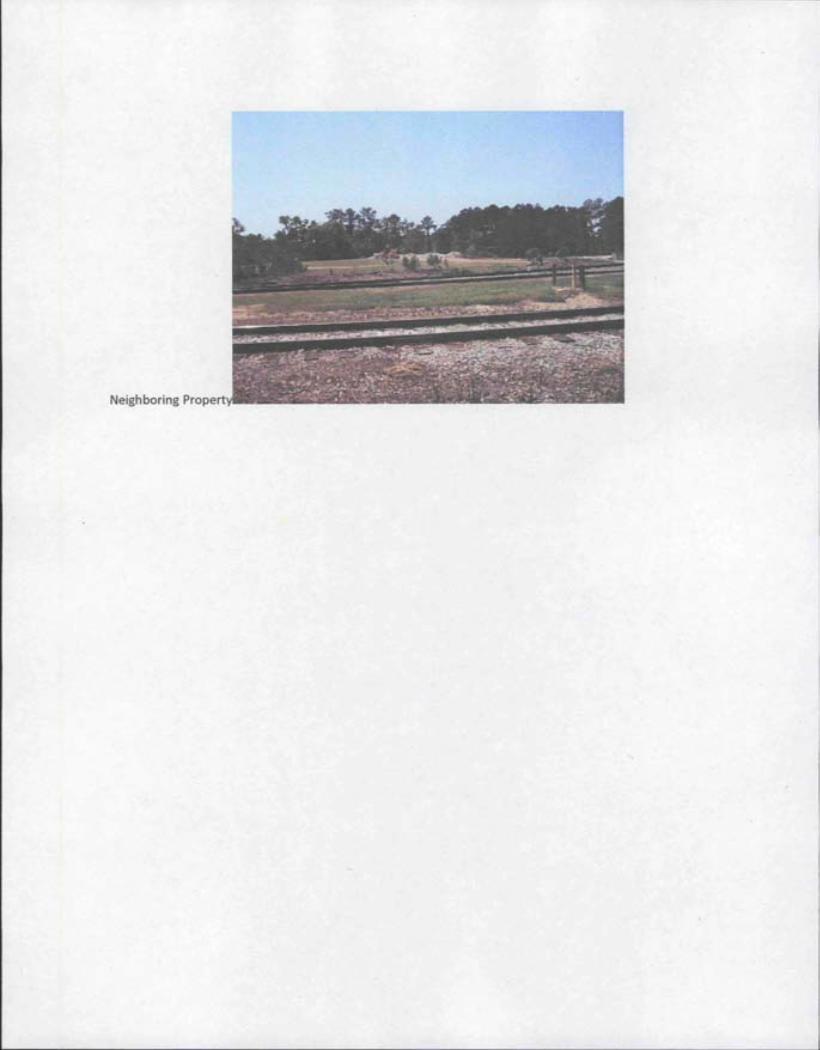
Neighboring Pro

Attachment F

Site Inspection Checklist
I. SITE INFORMATION
Site name:
Remedy Includes: (Check all that apply) • Landfill cover/containment .Access controls • Institutional controls .; • Groundwater pwnp and treatment • Surface water collection and treatment
EPAID:
Weather/temperature: . l.
• Monitored natural attenuation • Groundwater containment • Vertical barrier walls
.Other ______________________________________________________________ __
Attachments: • Inspection team roster attached ttached
1. O&M site manager -:!~LL..L---..L.!!"""J~~------_
_ ~l Na Interviewe~. at office • by phone P one no. ______ ---:
Problems, sug stions; • Report attached ---;~=.L.I.----_"""'9--:-''-'--':.L.-=--=-=--==-==...--,,-~_=7-!d-
2. O&M staff __________ _ Name Date
Interviewed. at site • at office • by phone -E~fte'-rmr~ __ -,¥---/-,Problems, suggestions; • Re:1lOI~mR:n

3.
4.
Local regulatory authorities and response agencies (i.e., State and Tribal offices, emergency response office, police department, office of public health or environmental health, zoning office, recorder of deeds, or other city and county offices, etc.) Fill in all that apply.
/ /
Agency ______________________ ___
Conrnct ________ ~----------------Name Title Date
Problems; suggestions; _ Report attac
Agency ________________ ~~~~~
Contact ---.,-------------F--'---f---Name ./ Phone no.
Problems; suggestions; - Report att~lhed -------~,.L-------------------------------/
i '.
Agency ________________________ ~ Conrnct ____________________ ~~--
Name Title Date Phone no.
Agency ______ ~~---------------CODrnct ____ ~--------------------
Title Phone no. Date
.I~.

III. ON-SITE DOCUMENTS & RECORDS VERIFIE,!!. (Check all that apply)
1. O&M Documents • Re,dily mil'hle/.UP to date .N'/ ~ .O&M manual
• As-built drawings • Readily availabl:/.. Up to date • NI • Maintenance logs W • Readily a vailabl • Up to date • NI A Remarks T" t..1r. ,1-.. .,AIL&.'"-hr.r- 17 L{~ , ,
2. Site-Specific Health and Safety Plan • Readily available • Up to date .N/~ • Contingency plan/emergency response plan • Readily available .Up to date .N/~
Remarks
3. O&M and OSHA Training Records • Readily available .Up to date .N/~ Remarks
4. Permits and Service Agreements ~ • Air discharge permit • Readily available .Up to date .N/~
• Effluent discharge • Readily available .Up to date .NI • Waste disposal, POTW • Readily available .Up to date .N/~-
• Other permits • Readily available .Up to date .N/AV--Remarks
5. Gas Generation Records • Readily available .Up to date .N/~ Remarks
6. Settlement Monument Records • Readily available .Up to date .NI~ Remarks
~
7. Groundwater Monitoring Records • Readily available V .Up to date .N/A Remarks
8. Leachate Extraction Records • Readily available • Up to date .N/AV-Remarks
9. Discharge Compliance Records .N/~ .Air • Readily available .Up to date
• Water (effluent) • Readily available .Up to date .N/A Remarks
10. Daily Access/Security Logs j':;J AI" • Readily avaA1le"""""" .Up to date .N/A Remarks s.~*" ,j..,. I P;- £"A -I", r~
L ~ I

IV. O&M COSTS
1. O&M Organization • State in-house / • Contractor for State • PRP in-house • Contractor for PRP • Federal Facility in-house • Contractor for Federal Facility • Other
2. O&M Cost Recory ./11, 'I( (.. ~kJ' ~ 0{ Svh hit ;:~j/;~ ro • Readily available • Up to date
q'i I- e's-/.'-",-"'<-' ldtJ"Il'r-• Funding mechanism/agreement in place Original O&M cost estimate • Breakdown attached k~r loff~-.. ~
Totahnnual '0," by Y'" fonevi,w p,riod if availobl< /"" ,,;) "" ~ tI~ From To • Breakdown attached ~f r~ ~
Date Date Total cost to kr/w"-. From To • Breakdown attached
Date Date Total cost From To • Breakdown attached
Date Date Total cost From To • Breakdown attached
Date Date Total cost From To • Breakdown attached
Date Date Total cost
3. Unanticipated or Unusually High O&M Costs During Review Period Describe costs and reasons:
I!I£ v. ACCESS AND INSTITUTIONAL CONTROLS .Applicable .N/A
A. Fencing
./
1. Fencing dkied • Location shown on site map . • Gates se1ed V. . NI ~ Remarks r::. 1::4:;( 'iAu' rtA ~ ~ C~'l.rof! • ~ A:.< k -£
I r T . 'l ~.
B. Other Access Restrictions
I. Signs and other security measures • Location shown on site map .N/A V--Remarks

C. Institutional Controls (lCs)
l. Implementation and enforcement .Y,h~/A Site conditions imply ICs not properly implemented Site conditions imply ICs not being fully enforced .Yes.N .N/A - ", ..
Type of monitoring (e.g., self-reporting, drive by) --------_ ..
Frequency ---Responsible party/agency ---Contact ----Name Title Date Phone no.
Reporting is up-to-date .Yes .No .N/A~ Reports are verified by the lead agency • Yes .No .N/A
Specific requirements in deed or decision documents have been met .Yes .N/.N/A/ Violations have been reported .Yes .No .N/A Other problems or suggestions: • Report attached
t4 I~ ~ort,k=- --
2. Adequacy .ICs are adequate 0./" .ICs are inadequate .N/A Remarks d.rtl<' ~ -Il./iuL
I
D. General
1. Vandalism/trespassing • Location shown on site map .No vandalism evident V Remarks
2. Land use changes on site .NlV Remarks
3. Land use changes offsite.N/AV Remarks
VI. GE.!)---n SITE CONDITIONS
A. Roads • Applicable .N/A/
1. Roads damaged • Location shown on site map • Roads adequate. N/ A Remarks
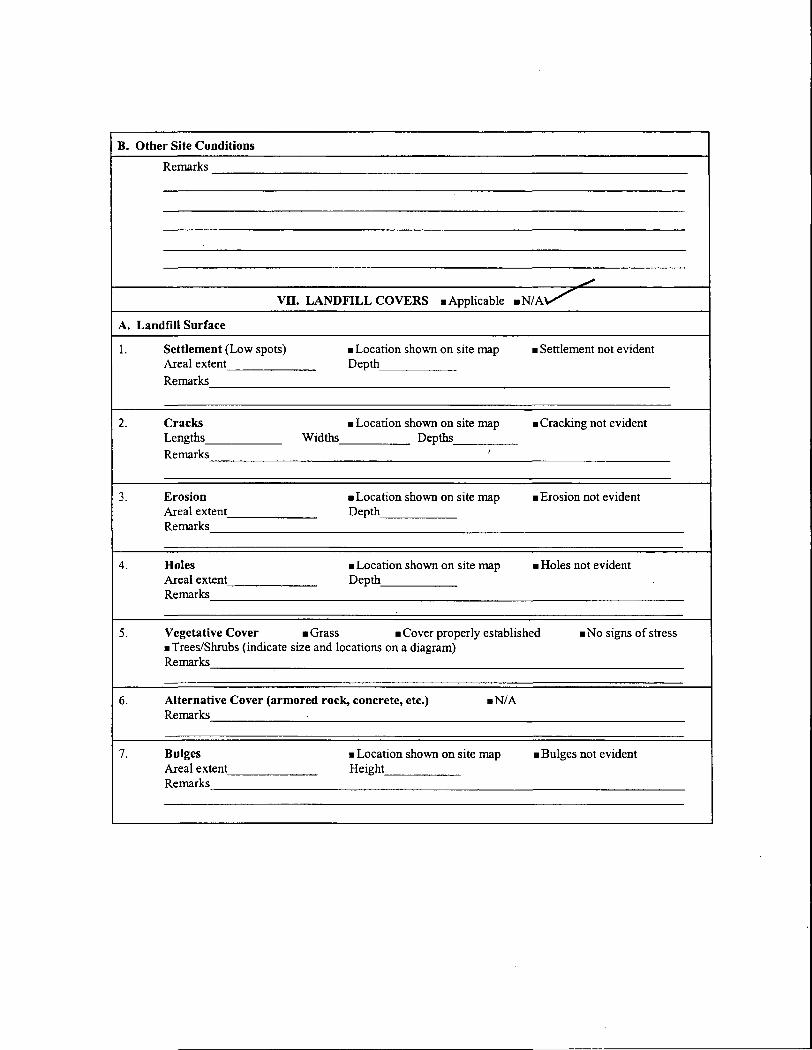
B. Other Site Conditions
Remarks
,/
YD. LANDFILL COVERS • Applicable .N/AV"
A. Landfill Surface
1. Settlement (Low spots) • Location shown on site map • Settlement not evident Areal extent Depth
Remarks
2. Cracks • Location shown on site map • Cracking not evident Lengths Widths Depths Remarks !
3. Erosion • Location shown on site map • Erosion not evident Areal extent Depth Remarks
4. Holes • Location shown on site map • Holes not evident Areal extent Depth Remarks
5. Vegetative Cover • Grass • Cover properly established • No signs of stress • Trees/Shrubs (indicate size and locations on a diagram) Remarks
6. Alternative Cover (armored rock, concrete, etc.) .N/A Remarks
7. Bulges • Location shown on site map • Bulges not evident Areal extent Height Remarks
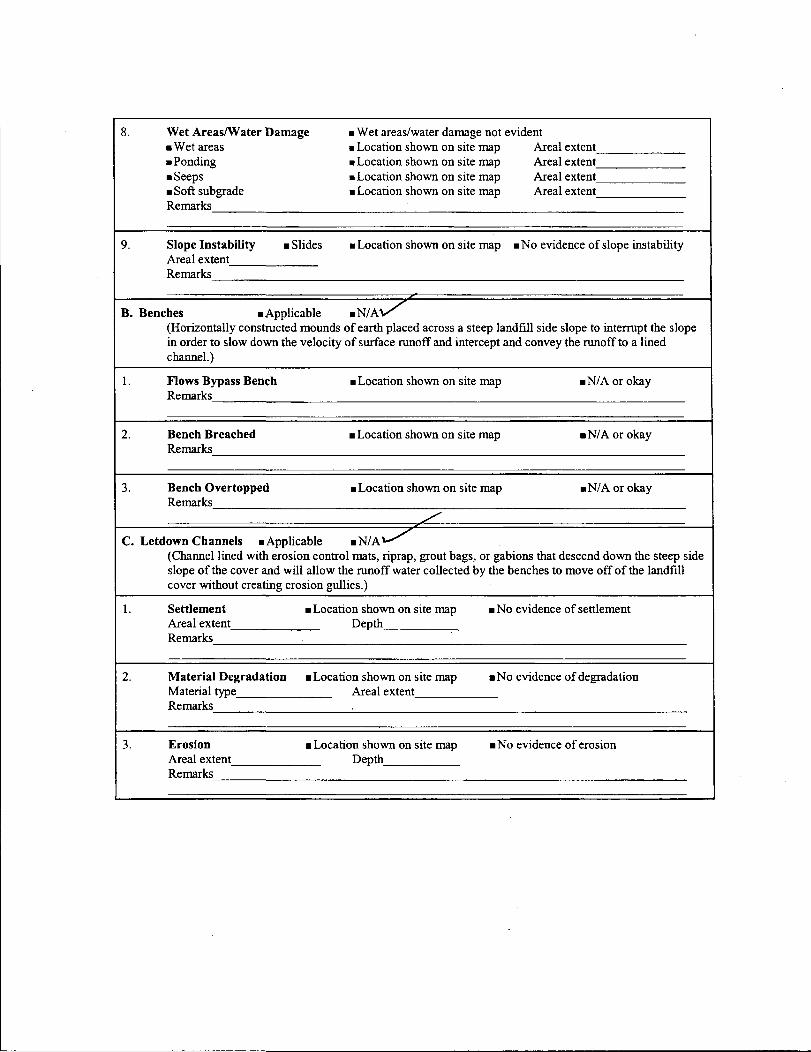
8. Wet Areas/Water Damage • Wet areas/water damage not evident .Wet areas • Location shown on site map Areal extent .Ponding • Location shown on site map Areal extent • Seeps • Location shown on site map Areal extent • Soft subgrade • Location shown on site map Areal extent Remarks
9. Slope Instability • Slides • Location shown on site map • No evidence of slope instability Areal extent Remarks
B. Benches • Applicable .N/AV (Horizontally constructed mounds of earth placed across a steep landfill side slope to interrupt the slope in order to slow down the velocity of surface runoff and intercept and convey the runoff to a lined channel.)
1. Flows Bypass Bench • Location shown on site map .N/A or okay Remarks
2. Bench Breached • Location shown on site map .N/A or okay Remarks
3. Bench Overtopped • Location shown on site map .N/A or okay Remarks
/"
C. Letdown Channels • Applicable .N/A~ (Channel lined with erosion control mats, riprap, grout bags, or gabions that descend down the steep side slope of the cover and will allow the runoff water collected by the benches to move off of the landfill cover without creating erosion gullies.)
1. Settlement • Location shown on site map • No evidence of settlement Areal extent Depth Remarks
2. Material Degradation • Location shown on site map .No evidence of degradation Material type Areal extent Remarks
3. Erosion • Location shown on site map • No evidence of erosion Areal extent Depth Remarks

4. Undercutting • Location shown on site map • No evidence of undercutting Areal extent Depth Remarks
5. Obstructions Type .No obstructions • Location shown on site map Areal extent Size Remarks
6. Excessive Vegetative Growth Type • No evidence of excessive growth • Vegetation in channels does not obstruct flow • Location shown on site rnap Areal extent Remarks
./ D. Cover Penetrations • Applicable .N/AV
1. Gas Vents .Active .Passive • Properly secured/locked .Functioning • Routinely sampled • Good condition • Evidence of leakage at penetration .Needs Maintenance .N/A Remarks
2. Gas Monitoring Probes • Properly secured/locked • Functioning • Routinely sampled • Good condition • Evidence ofleakage at penetration .Needs Maintenance .N/A Remarks
3. Monitoring Wells (within surface area of landfill) • Properly securedllocked • Functioning • Routinely sampled • Good condition • Evidence of leakage at penetration • Needs Maintenance .N/A
Remarks
4. Leachate Extraction Wells • Properly secured/locked • Functioning • Routinely sampled • Good condition • Evidence of leakage at penetration .Needs Maintenance .N/A Remarks
5. Settlement Monuments • Located • Routinely surveyed .N/A Remarks
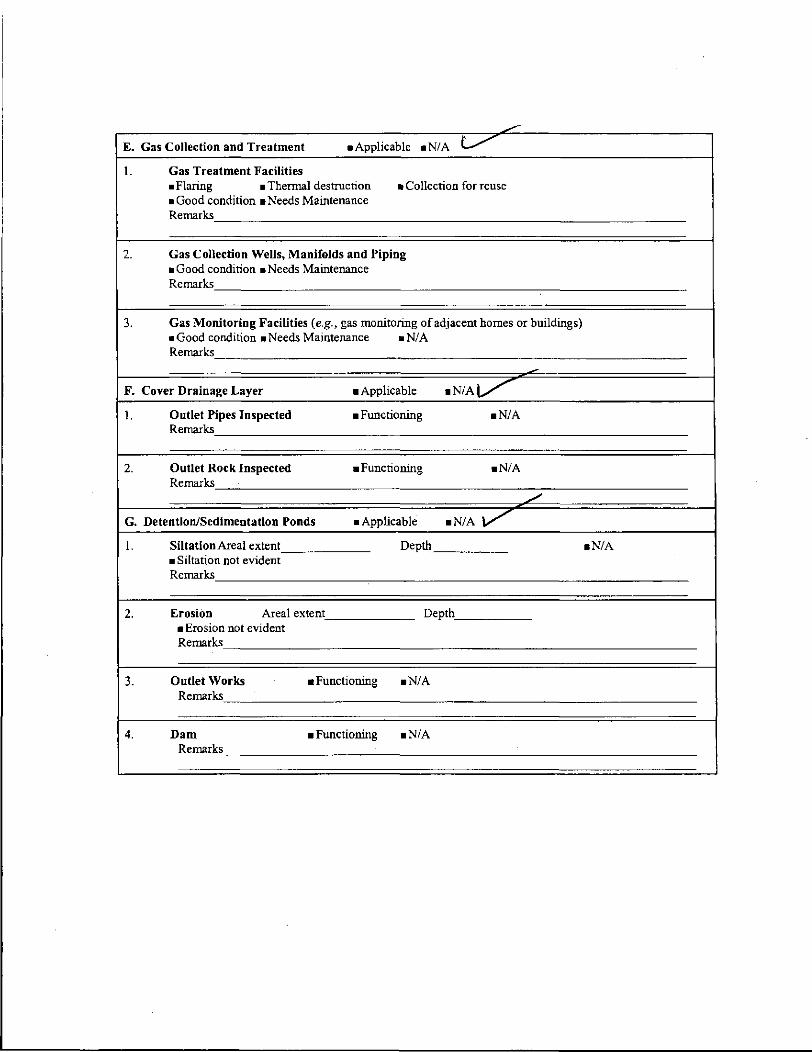
~
E. Gas Collection and Treatment • Applicable .N/A t.,./
l. Gas Treatment Facilities • Flaring • Thermal destruction • Collection for reuse • Good condition • Needs Maintenance Remarks
2. Gas Collection Wells, Manifolds and Piping • Good condition • Needs Maintenance Remarks
3. Gas Monitoring Facilities (e.g., gas monitoring of adjacent homes or buildings) • Good condition. Needs Maintenance .N/A Remarks
F. Cover Drainage Layer • Applicable .N/AV
l. Outlet Pipes Inspected • Functioning .N/A Remarks
2. Outlet Rock Inspected • Functioning .N/A Remarks
./
G. Detention/Sedimentation Ponds • Applicable .N/AV
l. Siltation Areal extent Depth .N/A • Siltation not evident Remarks
2. Erosion Areal extent Depth • Erosion not evident Remarks
3. Outlet Works • Functioning .N/A Remarks
4. Dam • Functioning .N/A Remarks
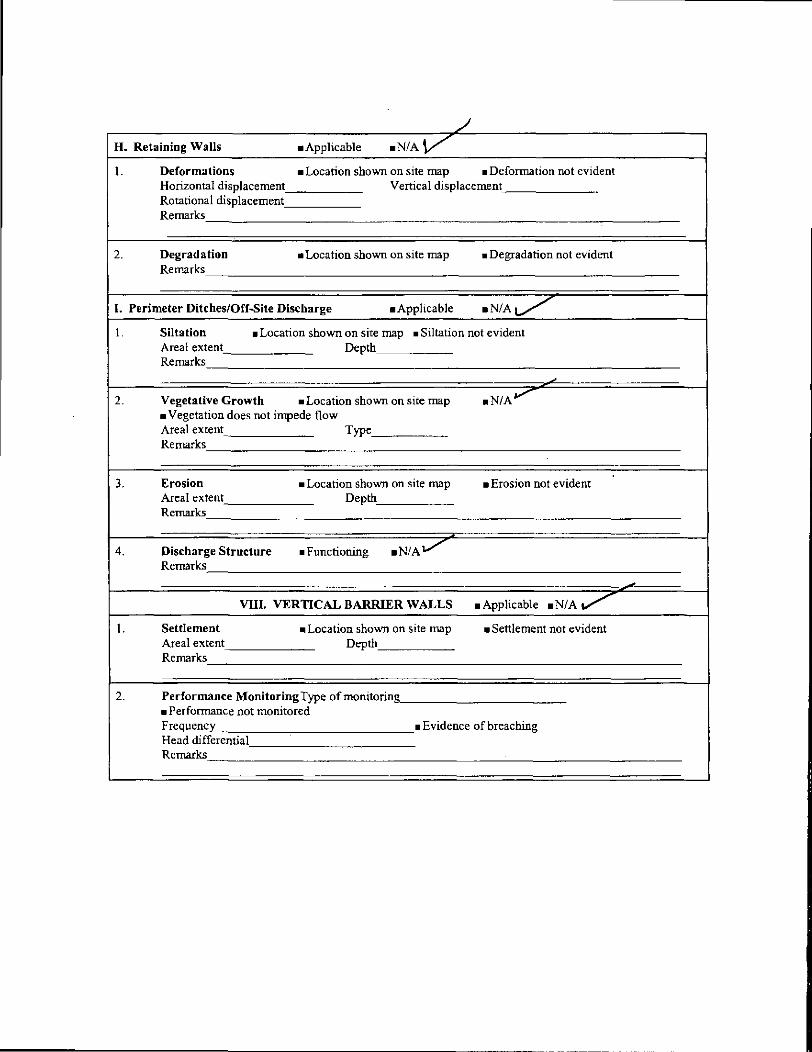
/' H. Retaining Walls • Applicable .N/AV
1. Deformations • Location shown on site map • Deformation not evident Horizontal displacement Vertical displacement Rotational displacement Remarks
2. Degradation • Location shown on site map • Degradation not evident Remarks
I. Perimeter Ditches/Off-Site Discharge • Applicable .N/AV'"
1. Siltation • Location shown on site map • Siltation not evident Areal extent Depth Remarks
2. Vegetative Growth • Location shown on site map .N/Av • Vegetation does not impede flow Areal extent Type Remarks
3. Erosion • Location shown on site map • Erosion not evident Areal extent Depth Remarks
4. Discharge Structure • Functioning .N/AV Remarks
.,
VIII. VERTICAL BARRIER WALLS • Applicable .N/A v'" 1. Settlement • Location shown on site map • Settlement not evident
Areal extent Depth Remarks
2. Performance Monitoring Type of monitoring • Performance not monitored Frequency • Evidence of breaching Head differential Remarks
--------------------------------------~-~- -------
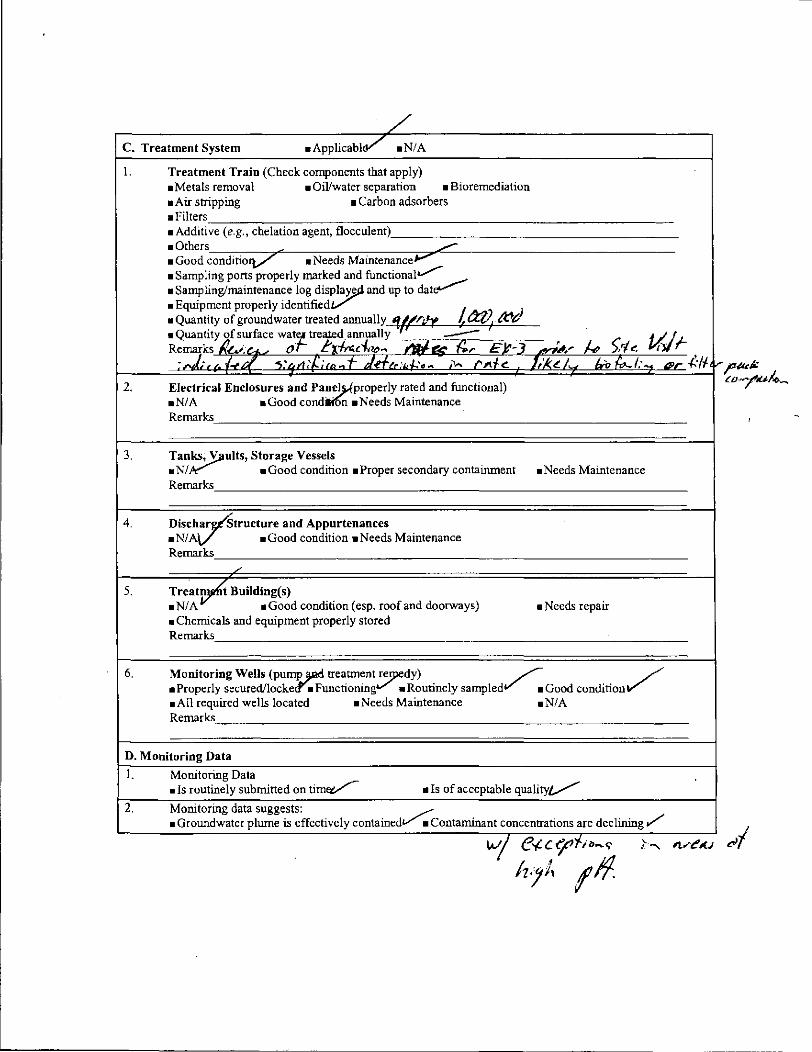
/ c. Treatment System • Applicabl~ .N/A
l. Treatment Train (Cbeck components tbat apply) • Metals removal • Oil/water separation • Bioremediation
• Air stripping • Carbon adsorbers • Filters • Additive (e.g., chelation agent, flocculent) .Otbers
"" .L" • Good conditiorv • Needs MaintenanceV' • Sampling ports properly marked and functional~ • Sampling/maintenance log diS~ and up to dat~ • Equipment properly identified • Quantity of groundwater treated annually 11!h"ilt t~aJd • Quantity of surface watr- trea1ed.annually f ___
),r{t:.. t(JI-Re:ts'~~'~'U 0 f'X~d"l"'" nJI..~ (;.,. Er-J ~~#' ~ . (,-,...1 ... ,,;;1 4)'£1;1,'/:';£/:,,,, fd-efb"':IJ.J...'~... M ('Aft:.. J,'k.~/~ 170 ~/.'_ ~r .(:/1 Ir
2. Electrical Enclosures and pa~properlY rated and functional) .N/A • Good condo 'on .Needs Maintenance Remarks
3. Tan~ultS, Storage Vessels • NI • Good condition. Proper secondary containment • Needs Maintenance Remarks
4. Disch~tructure and Appurtenances .N/A .Good condition .Needs Maintenance Remarks
" 5. Treat~ Building(s)
.N/A .Good condition (esp. roof and doorways) • Needs repair • Chemicals and equipment properly stored Remarks
6. Monitoring Wells (Pu~ treatrnen?,dY) /. /' • Properly secured/locke • Functionin • Routinely sampled • Good condition • All required wells located • Needs Maintenance .N/A Remarks
D. Monitoring Data
1. Monitoring Data .Is routinely submitted on tim~ • Is of acceptable quality~
2. Monitoring data suggests: ~ • Groundwater plume is effectively contained • Contaminant concentrations are declining,/"
WI e-t C e;:'i-/ l»-...~ \... .'. " 'l~~1U
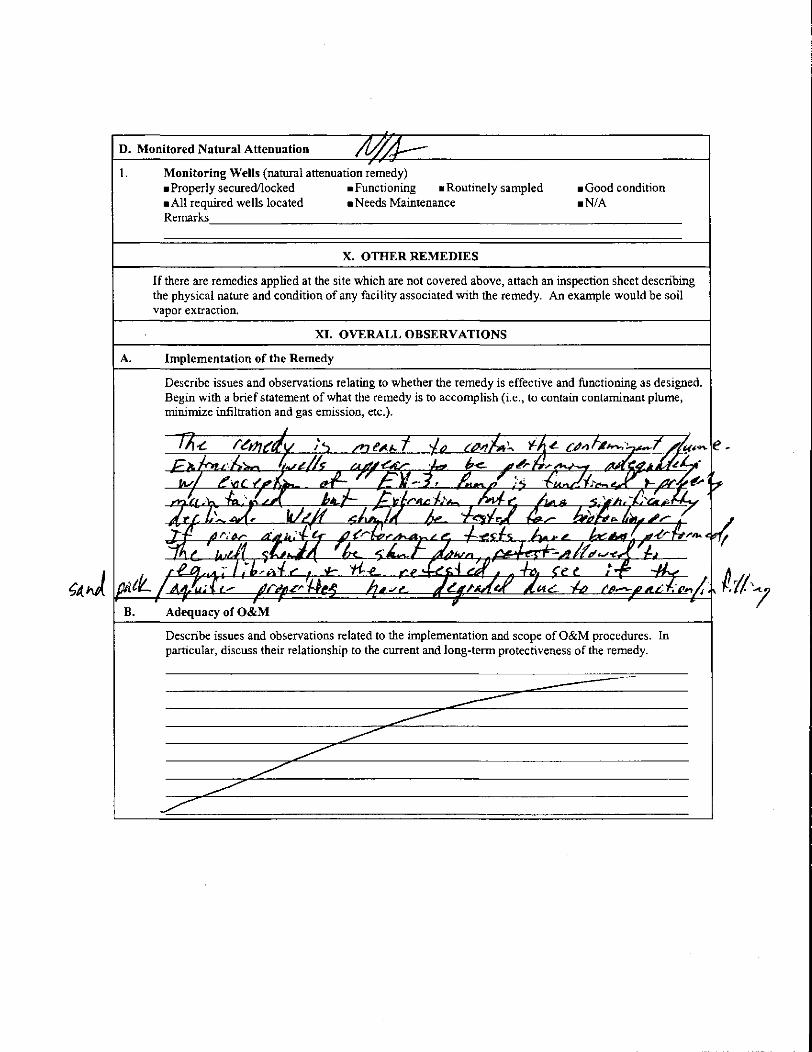
D. Monitored Natural Attenuation
I. Monitoring Wells (natural attenuation remedy) • Properly securedllocked • Functioning • Routinely sampled • All required wells located • Needs Maintenance
• Good condition .N/A
Remarks, __________________________________________________________________ __
X. OTHER REMEDIES
If there are remedies applied at the site which are not covered above, attach an inspection sheet describing the physical nature and condition of any facility associated with the remedy. An example would be soil vapor extraction.
XI. OVERALL OBSERV A nONS
A. Implementation of the Remedy
Describe issues and observations relating to whether the remedy is effective and functioning as designed. Begin with a brief statement of what the remedy is to accomplish (i.e., to contain contaminant plume, minimize infiltration and gas emission, etc.).
B. Adequacy of O&M
Describe issues and observations related to the implementation and scope of O&M procedures. In particular, discuss their relationship to the current and long-tenn protectiveness of the remedy.

c. Early Indicators of Potential Remedy Problems
Describe issues and observations such as unexpected changes in the cost or scope of O&M or a high frequency of unscheduled repairs, that suggest that the protectiveness of the remedy may be compromised in the future.
cklv-tlt I-i~ ~l..r- ~Add~b &-~-3
t4~ S"-~
D. Opportunities for Optimization
Describe possible opportunities for optimization in monitoring tasks or the operation of the reml:dy . ...........
-.-------- :;::::> ~-
------------------------------~
/