fix paul gd doping 2
TRANSCRIPT
7/24/2019 Fix Paul Gd Doping 2
http://slidepdf.com/reader/full/fix-paul-gd-doping-2 1/6
Magnetic property study of Gd doped TiO2 nanoparticles
Susmita Paul, Biswajit Choudhury, Amarjyoti Choudhury ⇑
Department Of Physics, Tezpur University, Napaam 784028, Tezpur, Assam, India
a r t i c l e i n f o
Article history:
Received 22 December 2013Received in revised form 6 February 2014
Accepted 14 February 2014Available online 22 February 2014
Keywords:
Oxide materialsSol–gel processesExchange and superexchangeImpurities in semiconductorsLuminescenceMagnetic measurements
a b s t r a c t
In this work we have studied the magnetic properties of sol–gel synthesized Gd doped TiO2 nanoparticles.The Gd concentration varying from 0.03 to 0.07 mol. Structural, morphological and compositional anal-
yses have been monitored with X-ray diffraction, transmission electron microscope (TEM), Raman spec-troscopy and energy dispersive X-ray (EDX) spectroscopy. XPS spectra establish that Gd ions are in the +3oxidation state. Photoluminescence intensity enhances at 0.03 and 0.05 mol and then quenches at 0.07.This is likely due to the formation of emission quenching centers. All the samples exhibit paramagnetismat room temperature as well as at 10 K. It is observed that due to the shielding of 4 f shell of Gd3+ ions by6s5d shell the direct exchange interaction of these Gd3+ ions with other Gd3+ ions is weak. These non-interacting and localized magnetic spins of Gd3+ induce only paramagnetism. The high magnetizationexhibited by the samples at 10 K is due to minimization of the thermal randomization of the magneticspins. Antiferromagnetic interaction persists at 0.03 mol and it gets stronger at 0.07 mol. Antiferromag-netism appears due to strong superexchange interaction of Gd3+ ions via O2 ions.
2014 Elsevier B.V. All rights reserved.
1. Introduction
Diluted magnetic semiconductors (DMS) represent a synergeticcollaboration between charge based semiconductors and spinbased magnetism [1–3]. Following the success of (Ga, Mn) As,many DMS materials have been discovered which exhibit roomtemperature ferromagnetism (RTMF). In particular, theoreticalstudies predicted and experiments verified that some wide bandgap semiconductors such as ZnO and TiO2 doped with transitionmetals are effective DMS [4]. Magnetism in oxide based DMS areoften inadequate owing to low doping concentration and poor con-ductivity, both disfavoring the carrier based mechanism [5]. Fur-thermore, precipitates of doped magnetic elements andinadvertent contaminations complicate experimental findings.
TiO2 is a transparent wide band gap semiconductor. Transition
metal doping has been proposed to introduce magnetism in TiO2
nanoparticles [6]. The magnetic properties of doped TiO2 arestrongly sensitive to preparation condition, morphology and pres-ence of defects. Bhattacharya et al. synthesized Mn doped TiO2
nanoparticles by one pot RAPET technique (reaction under auto-genic pressure at elevated temperature) and reported ferromag-netic behavior up to 1%. However, with the increase in dopantconcentration up to 5% and 7% the system showed paramagneticbehavior [7]. Peng et al. observed ferromagnetism in Mn doped
TiO2 nanoparticles prepared by a simple sol–gel method[8]. Sellers
and Seebauer reported room temperature ferromagnetism in Mndoped TiO2 nanopillars prepared by atomic layer deposition meth-od [9].Thus, synthesis condition and morphology has a profoundeffect in modulating the magnetic property in TiO2. Presence of de-fects and annealing condition is also reported to affect the magne-tism. Choudhury et al. observed paramagnetism in air annealed codoped TiO2 nanoparticles while the same material exhibited ferro-magnetism on calcination under vacuum. This contrasting natureof the magnetic property in the same system under two differentannealing conditions is attributed to the formation of high densityof oxygen defects under vacuum annealing [10].
Recently rare-earth doped DMS have caught up great interestsbecause of their unique fluorescence properties and due to the highemission quantum yields. In transition metal magnetic moment
arises from partially filled outermost 3d electrons, whereas in rareearth ions magnetic moment arises from the inner 4 f incompletesub-shell. In transition metal ions the strength of the spin–orbitalcoupling is much smaller than the crystal field energy and hence,the orbital momentum is quenched and only spin moment contrib-utes towards magnetism [11]. In contrast in rare earth ions the 4 f
electrons are shielded by the 5d6s electrons and the strength of spin–orbital coupling is much greater than the crystal field energy[11]. These 4 f electrons undergo indirect exchange interactions via5d or 6s conduction electrons yielding high magnetic moment peratoms due to high orbital momentum [12]. Theoretical analysishave been carried out to explain the ferromagnetism in Gd doped
http://dx.doi.org/10.1016/j.jallcom.2014.02.070
0925-8388/ 2014 Elsevier B.V. All rights reserved.
⇑ Corresponding author. Tel.: +91 3712267120; fax: +91 371222345.
E-mail address: [email protected] (A. Choudhury).
Journal of Alloys and Compounds 601 (2014) 201–206
Contents lists available at ScienceDirect
Journal of Alloys and Compounds
j o u r n a l h o m e p a g e : w w w . e l s e v i e r . c o m / l o c a t e / j a l c o m

7/24/2019 Fix Paul Gd Doping 2
http://slidepdf.com/reader/full/fix-paul-gd-doping-2 2/6
GaN [13,14]. Dalpian and Wei reported that the direct coupling be-tween the Gd atoms was antiferromagnetic in nature in Gd dopedGaN [13]. The ferromagnetic phase was stabilized by the electronsdue to the mixing of Gd f with host s states. Liu et al., however, re-ported that the room temperature ferromagnetism in Gd dopedGaN was due to the interaction of Gd 4 f spins via p–d couplinginvolving holes introduced by the intrinsic defects [14].
In the present study our objective is to investigate the struc-tural, morphological and magnetic properties of TiO2 nanoparticlesdue to doping of gadolinium. The structural and morphologicalcharacterizations are done with X-ray diffraction, Raman, HRTEM.The valence state of Gd in the host matrix is characterized by XPS.This manuscript describes the magnetism in Gd doped TiO2 nano-particles. To the best of our knowledge there are no reports onmagnetism in Gd dopedTiO2 nanoparticles. Unlike transition metaldoped TiO2 where magnetism is initiated by dopants and oxygendefects, the similar situation is not encountered in this system.Although Gd is ferromagnetic, doping of this ion does not initiateferromagnetism in TiO2. It is observed that the unpaired spins inGd 4 f does not undergo direct exchange interaction with nearestGd3+ ions nor do they take part in carrier mediated ferromagne-tism. We have observed paramagnetism which is due to the pres-ence of localized non-interacting spins present in 4 f shell of Gd3+.
2. Experimental methods
2.1. Material s ynthesis
Gd doped TiO2 nanoparticles with three different nominal concentrations of Gd(0.03mol, 0.05mol and 0.07 mol) were synthesized employing a simple sol–gelmethod. The precursors for dopant and host were taken to be gadolinium nitratehexahydrate and titanium iso-propoxide respectively. 5 ml of titanium isopropox-ide and 15 ml of 2 propanol were added to a 100 ml conical flask under constantstirring,followed by theadditionof 1 ml of water to initiate thehydrolysis reaction.To the white sol of titanium isopropoxide, the dopant precursor solution wereadded and stirred for 7–8 h. During such process first a sol was formed which ulti-mately transformed into a gel. The gel was then centrifuged in water followed byethanol for 4 times. The centrifuged product was dried at 80 C. The resulting prod-
uct was finally annealed at 450
C to obtain crystalline gadolinium doped anataseTiO2 nanoparticles.
2.2. Characterization details
The structure of all the samples are determined using RigakuMiniflex CD 10041XRD unit with copper target and k = 0.154 nm at a scanning rate of 1/min and inthe scanning range of 10–80. High resolution transmission electron microscopeimages for morphology and particle size determination are observed with JEM-2100, 200 kV JEOL. The elemental compositions are known from energy dispersiveX-ray analysis (EDX) equipped with a JEOL JSM 6390 LV scanning electron micro-scope (SEM). Raman spectra of the samples are acquired with Renishaw in via Spec-trometer. An Argon-ion laser of 514.5 nm is used as the excitation source. Theoxidation state of the samples are studied with the help of X-ray photoelectronspectroscopy (XPS) is recorded on KRATOS-AXIS 165 instrument equipped withdual aluminium–magnesium anodes using the Mg Ka radiation (hm ¼ 1253:6 eV)operated at 5 kV. Photoluminescence (PL) measurements at room temperatureare recorded with Perkin Elmer LS 55 fluorescence spectroscopy. Magnetic mea-surements are carried out in a vibratingsample magnetometer (VSM) usinga selec-tion of Varian and Walker electromagnets.
3. Results and discussions
3.1. Structural and morphological study
The phase structure is investigated by XRD and the results areshown in Fig. 1. All the diffraction peaks correspond to the tetrag-onal anatase phase (JCPDS-782486). A small amount of brookitephase is detected in between 27 and 31 (JCPDS-761934). Thesizes (d) of the nanocrystal are calculated by using Scherrer’sformula
d ¼ 0:9k
bCosh ð1Þ
where k = wavelength of the X-ray source used; b ¼ full width athalf maximum (FWHM),h = Bragg’s diffraction angle. The crystallite
size is calculated to be 7.8 nm for pristine (0.00 mol) and 5.9 nm,5.45 nm, 5.42 nm for 0.03, 0.05 and 0.07 mol of Gd respectively.The width of the diffraction peaks increases with the increase indoping concentration. The widening of the diffraction peaks indi-cates systematic decrease in grain size and degradation of the struc-tural quality after doping. Because of the moderately large sizeincongruity with Ti4+ (0.68 Å), Gd3+ (0.94 Å) ions are not expectedto inhabit sites in the lattice of TiO2 [15]. They possibly stay onthe particle surface and on the grain boundaries and produce astrain in those regions. This result in the enhancement of the repul-sive interaction between the Gd3+ ions, prevent the coalescence of nanocrystallites and thereby inhibits the growth by the formationof Gd–O–Ti bond [16]. It is observed that with increase in Gd dopingconcentration the intensity of diffraction peak is increasing. The dif-
fraction peak intensities are affected by the change in electron den-sity due to substitution of foreign (dopant) atoms. Through dopingwe change the element that is we change the mean atomic scatter-ing factor. Doping with light atom might results in lowering of dif-fraction intensity. However doping with a larger Gd3+ results inmore scattering centers and hence, results in increased peak inten-sity [20]. The diffraction pattern does not show any peak of second-ary phases of gadolinium such as Gd2O3. However, slight shifting of the peaks to lower angle is noticed with the changes in the gadolin-ium concentration. We have also calculated the d spacing of all thesamples considering (004) peak. The values are calculated to be0.23586, 0.23595, 0.23615 and 0.23622 nm for undoped and(0.03, 0.05, 0.07 mol) Gd doped TiO2 nanoparticle. The change is d
spacing is not prominent inferring that very few percentage of the
total gadolinium impurity ions are actually substituting Ti4+
onthe lattice interior and the others may be located on the surface.
The transmission electron microscope images of the undopedand Gd doped TiO2 nanoparticles are shown in Fig. 2(a–d). As ob-served from the micrographs, the undoped system comprises of spherical size particles of 18 nm size as shown in Fig. 2a. Fig 2bshows the corresponding high resolution image of pure TiO2. Thedistinct lattice fringes with inter planar spacing of 3.52 Å, corre-sponding to the (101) plane of anatase TiO2 displays highly crys-talline nature of the samples [17]. Fig. 2c shows the TEM imageof 0.03 mol Gd doped TiO2. The average particle size is calculatedto be 12 nm. The interplanar spacing shown as shown in Fig. 2dis found to be 3.57 Å. The interplanar spacing of the doped andundoped TiO2 nanoparticles do not show much variation, further
confirming incorporation of only few gadolinium ions on the TiO2lattice. It may be mentioned here that we have obtained
Fig. 1. X-ray diffraction spectra of pure and Gd doped TiO2 nanoparticles.
202 S. Paul et al. / Journal of Alloys and Compounds 601 (2014) 201–206

7/24/2019 Fix Paul Gd Doping 2
http://slidepdf.com/reader/full/fix-paul-gd-doping-2 3/6
differences in the size calculated from XRD and TEM. The magni-tude of the crystallite and particle size compliments each otherin case of stable, monodisperse, single crystals and hard spheresand deviation from this criteria leads to variationin measured sizes[18]. A nanoparticle of polycrystalline aggregates compose of grains of several sizes. Scherrer’s formula determines the size of coherently diffracting grain size. Moreover, the size determinedby Scherrer formula is affected by instrumental broadening, crys-talline strain, defects, etc. On the other hand TEM provide directevidences of the nanoparticle size, shape. Due to the polycrystal-line nature containing several grain sizes the crystallite size isnot generally the same as the particle size [19,20]. The composi-tional analysis is performed with EDX analysis. The spectrum ismarked with the signals obtained from Ti, O, Gd.
Raman spectroscopy is used for characterizing local structure,defects, crystallinity, etc. Fig. 3 shows the Raman spectra of pureand Gd doped TiO2 nanoparticles. Group theory calculation pre-dicts that anatase phase contains six active Raman modes ( A1g + 2-B1g + 3E g) [21]. Ohsaka reported six allowed Raman active modesfor anatase TiO2 at 144 cm1 (E g), 197 cm1 (E g), 399 cm1 (B1g),513 cm1 ( A1g + B1g) and 639 cm1 [22]. From the Raman spectra
it is evident that both undoped and doped TiO2 are in anatasephase and a small peak in the region of 240 cm1 and 320 cm1
are attributed to the brookite phase [23]. No impression of impu-rity related modes in the Raman spectra are seen in the doped sam-ples. This is in agreement with the XRD result obtained. It has beenreported that the E g is mainly caused by symmetric stretchingvibration of O–Ti–O in TiO2, the B1g is caused by symmetric bend-ing vibration of O–Ti–O bond and the A1g is due to the antisymmet-ric bending vibration of O–Ti–O bond [24]. In undoped TiO2 the E gpeak appears at 144 cm1, whereas in 0.03 mol Gd doped TiO2 thepeak is shifted to 147 cm1. With the increase in Gd3+ ion concen-tration up to 0.05 mol and 0.07 mol the E g peak position at147 cm1, however, remains the same. In some transition andother rare earth doped TiO2 nanoparticles it has been reported thatdoping generates oxygen vacancies and shifts the peak position tohigher wavenumber [25,26]. But inourcase the shiftingof the peakposition to higher wavenumber is not occurring gradually at eachdopant concentration. This behavior may be due to the presenceof very few numbers of gadolinium ions substituting Ti4+ in theTiO2 lattice. A large population of Gd3+ ions remains at the surfaceand therefore, no appreciable shifting in the peak position is ob-served with increase in dopant concentration. The small peak shift-ing in the doped samples is likely due to the structural disorderbrought about by the substitution of few gadolinium ions in theTiO2 lattice.
3.2. X-ray photoelectron spectroscopy (XPS) study
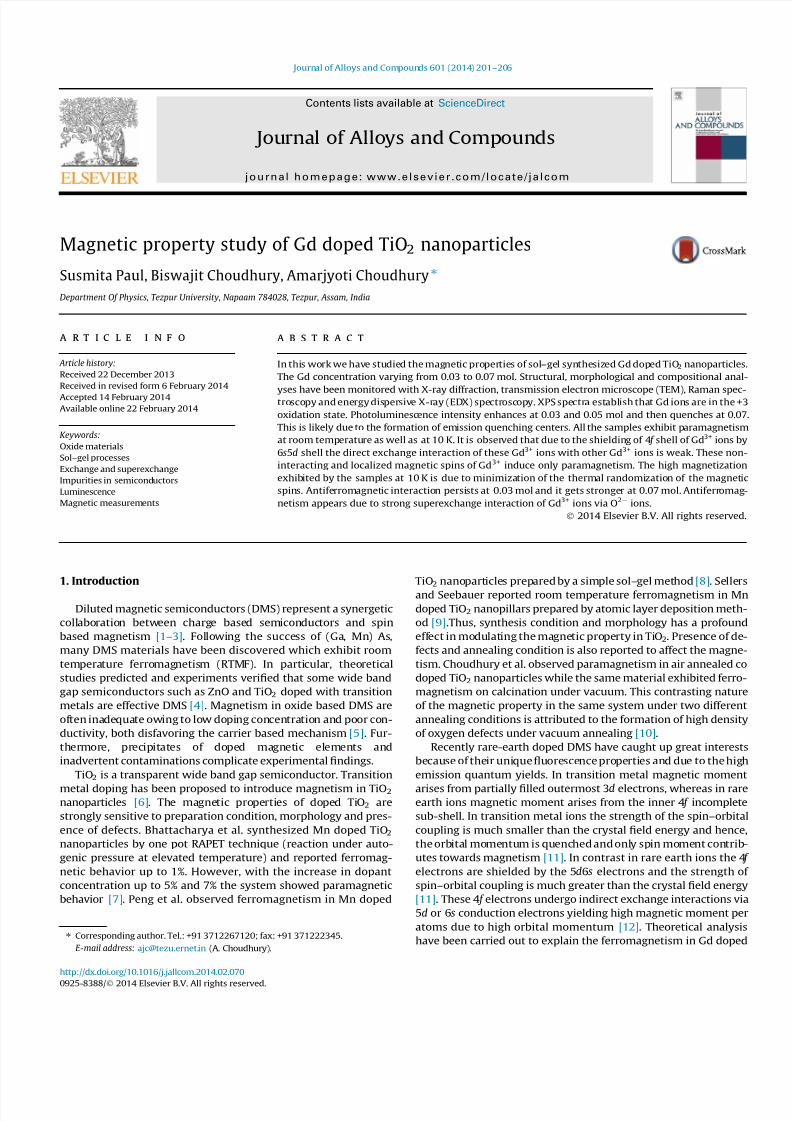
The XPS spectrum of 0.07 mol Gd doped TiO2 is investigated toknow the oxidation state of the dopant ions. Ti 2 p, O 1s and Gd 4d
core level of the highest doped samples is shown in Fig. 4a–c. Thecore level binding energies of Ti 2 p3/2 and Ti 2 p1/2 (Fig. 4a) are atroughly 459.31 eV and 464.90 eV. The variation of 5.59 eV indi-cates a valence of +4 for Ti in TiO2 [27]. The core level XPS O 1s
spectra are also analysed. Fig. 4b displays the XPS spectrum of O1s. The spectra specifies presence of at least two kinds of chemicalstates that include crystal lattice oxygen (OL ) and chemisorbedoxygen (OH). The OL peak appears around 530.08 eV and the OH
peak at 531.32 eV [28]. In Fig. 4c, the Gd 4d3/2 peak at 143 eV cor-responds to +3 oxidation state of Gd ion [29].
Fig. 2. TEM images of (a) undoped (c) 0.03 mol Gd doped TiO2; high resolution images showing the lattice fringes of (b) undoped and (d) doped TiO2 nanoparticles (e) EDXanalysis of 0.03mol Gd doped TiO2 the doped sample.
Fig. 3. Raman spectra of pure and Gd doped TiO2 nanoparticles.
S. Paul et al./ Journal of Alloys and Compounds 601 (2014) 201–206 203
7/24/2019 Fix Paul Gd Doping 2
http://slidepdf.com/reader/full/fix-paul-gd-doping-2 4/6
3.3. PL measurements
PL spectra are obtained by exciting the doped and undoped TiO2
at 320 nm. Fig. 5 shows the emission spectra of pure and Gd dopedTiO2 nanoparticles. The spectra are deconvoluted into five emissionpeaks with the help of Gaussian fitting (r 2 = 0.998). All the samplesexhibit a UV emission peak at 398 nm, violet emission peak at
429 nm, two blue emission peak at 457 nm and 488 nm and onegreen emission peak at 537 nm. The UV emission peak is the bandedge emission of host TiO2 arising from X1b transition to C3 [30].The 429 nm peak can be attributed to self trapped excitons (STE)originated by interactions of conduction band electrons localizedon the Ti 3d orbital with holes present in the O 2p orbital of TiO2
[31]. The peaks at 457 nm and 537 nm are due to the oxygen va-cancy related defect centers present below the conduction band.The intrinsic defects in wide band gap semiconductors are ex-pected to introduce deep energy levels inside the band gap[31,32]. The signature of peak at 488 nm is due to charge transfertransition from Ti3+ to oxygen anion in a TiO2
6 complex associatedwith oxygen vacancy [33]. The emission spectrumdoes not containany Gd3+ related emission peaks and the emission spectra of dopedand undoped TiO
2are alike. It is the intensity of the emission peaks
which are affected on doping. Photoexcitation of Gd doped TiO2 at320 nm results in above band gap excitation of electrons to theupper lying band states in conduction band. These electrons first jump to the lower of the conduction band in non-radiative way.From the lowest of the conduction band edge the electrons either jump directly to the valence band or initially jump to defects orto intermediate Gd states and then emit light. Non-existence of Gd emission peak indicates that the Gd 4 f levels are possibly atthe same height as that of oxygen defect states. The significant con-tribution of Gd is seen in the intensity of the emission peaks. Theemission intensity gradually increases on incorporation of 0.03 mol and 0.05 mol Gd and then there is sudden quenching of the emission intensity on adding 0.07 mol Gd. The emission inten-sity of 0.07 mol Gd doped TiO2 is even less than that of pure TiO2.
At lower dopant concentration the interactions between ions aretoo weak to have an effect on the energy levels of each dopantion. But at higher dopant concentration the distance between ionsand defects decreases. Decrease in the distance increases the inter-actions between the ions. The emission energy is transferred fromone ion to another ions or defects and the energy is dissipated non-radiatively resulting in the quenching of emission intensity. Wehave calculated the average shortest distance (known as the criti-cal distance) between ions at which the emission energy transferoccurs, using the equation [34].
RC ¼ 2 3V
4p xc N
1=3
ð2Þ
V = volume of the unit cell = a2
c = 0.135 nm3
, where a = 0.3785 nm;c = 0.9424 nm. xc = critical concentration of the dopant (= 0.07),
N = Number of Z ions in the unit cell, Rc = the critical transfer dis-tance. Putting the values the critical distance (Rc ) for 0.07mol is cal-culated to be 0.9731 nm.
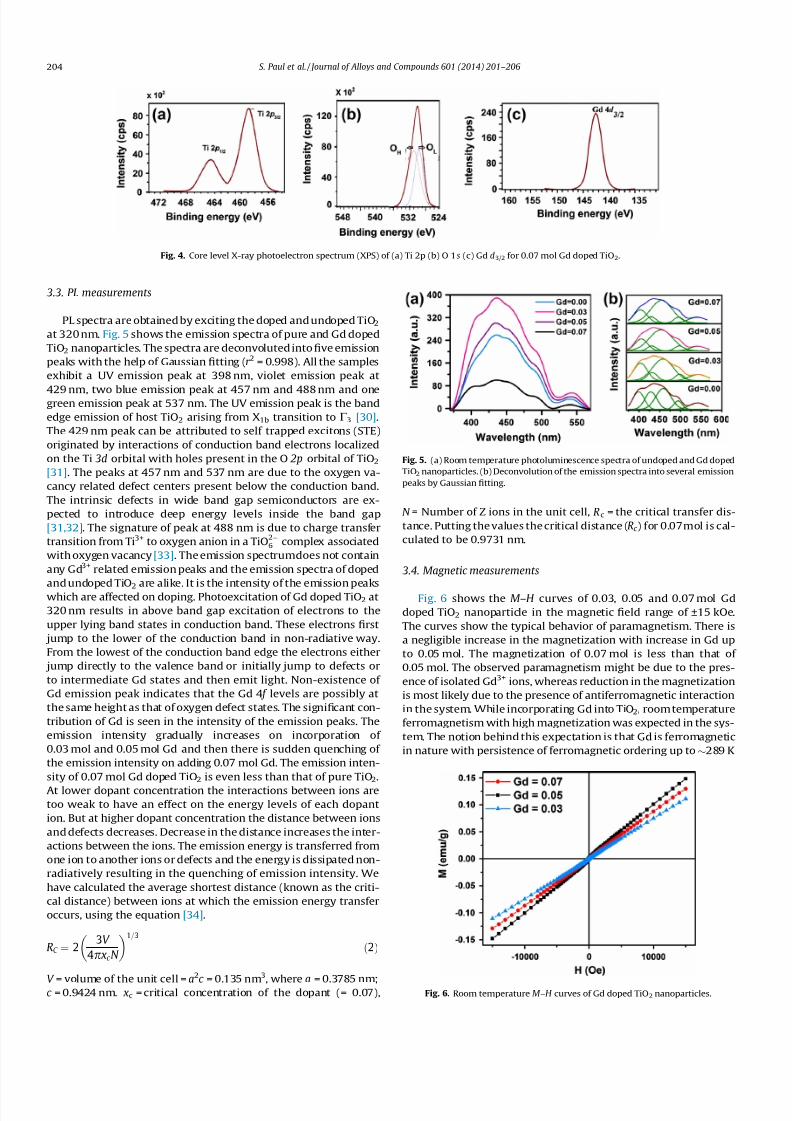
3.4. Magnetic measurements
Fig. 6 shows the M –H curves of 0.03, 0.05 and 0.07 mol Gddoped TiO2 nanoparticle in the magnetic field range of ±15 kOe.The curves show the typical behavior of paramagnetism. There isa negligible increase in the magnetization with increase in Gd upto 0.05 mol. The magnetization of 0.07 mol is less than that of 0.05 mol. The observed paramagnetism might be due to the pres-ence of isolated Gd3+ ions, whereas reduction in the magnetizationis most likely due to the presence of antiferromagnetic interactionin the system. While incorporating Gd into TiO2, roomtemperatureferromagnetism with high magnetization was expected in the sys-tem. The notion behind this expectation is that Gd is ferromagneticin nature with persistence of ferromagnetic ordering up to289 K
Fig. 4. Core level X-ray photoelectron spectrum (XPS) of (a) Ti 2p (b) O 1s (c) Gd d3/2 for 0.07 mol Gd doped TiO2.
Fig. 5. (a) Room temperature photoluminescence spectra of undoped and Gd dopedTiO2 nanoparticles. (b) Deconvolution of the emission spectra into several emissionpeaks by Gaussian fitting.
Fig. 6. Room temperature M –H curves of Gd doped TiO2 nanoparticles.
204 S. Paul et al. / Journal of Alloys and Compounds 601 (2014) 201–206

7/24/2019 Fix Paul Gd Doping 2
http://slidepdf.com/reader/full/fix-paul-gd-doping-2 5/6
[35]. The electronic configuration of Gd3+ is [Xe] 6s25d14 f 7 with 7unpaired electrons in the 4 f shell. These unpaired 4 f electronspolarize the 6s and 5d valence electrons resulting in a magneticmoment of 7.63 lB/Gd3+ [36]. However, because of the shieldingof this 4 f shell by 6s5d valence shell electrons, the interaction of these unpaired spins with the outermost ligands or other Gd3+ isexpected to be weak. These non-interacting and localized magneticspins of Gd3+ induce only paramagnetic moment [35,36]. Paramag-netism at room temperature has been reported in pure Gd2O3 aswell as in Gd doped oxide semiconductors such as TiO2, SnO2,and ZnO [35–40]. Opera et al. in his work on Gd doped ZnO re-ported ferromagnetism and attributed it to the intra-ion 4 f –5d ex-change interaction followed by inter-ion 5d–5d coupling mediatedby charge carriers [41]. In Gd doped ZnO films, Ney et al. reportedparamagnetic behavior of the samples with magnetic moment of 7.63 lB=Gd3þ with a small lattice distortion, the results were inagreement with the first-principles density-functional theory cal-culations. They detected presence of secondary oxide phases of Gd2O3 or other antiferromagnetic phase of Gd3+ contributing tothe reduction in the paramagnetic behavior [42]. Adhikari et al.in Gd doped SnO2 observed absence of ferromagnetism due to sur-face spin effect and enhanced Gd–O–Gd interactions [39]. Mag-netic properties of rare earth doped (RE = Nd, Sm, Gd, Tb, Er andDy) CeO2 have been investigated by Dimri et al. [43]. The originof magnetism in this sample is reported due to the presence of oxy-gen vacancies created due to the rare-earth dopants [43]. Wanget al. studied the magnetic property of pure and Gd doped HfO2
and reported very weak ferromagnetism in the sample, attributingit to either impure target materials or signal from the substrates[44]. For further confirmation of the nature of magnetism in thesystem, we carried out temperature dependent magnetic measure-ments (M –T ) for 0.03 mol and 0.07 mol Gd doped TiO2. Fig. 7a–bshows the susceptibility (v) vs. temperature (T ) curves in the tem-perature range of 10–300 K at an applied field of 200 Oe. The zerofield cooling (ZFC) and field cooling (FC) curves are completelyoverlapped up to 300 K and the nature of the curves followthe Cur-
ie–Weiss behavior of paramagnetism. The rise in magnetization atlow temperature is because of the decrease in the thermal random-ization of fluctuating magnetic spins present in isolated Gd3+ ions.The temperature dependent susceptibility (v) curves were fittedwith modified Curie–Weiss law-
v ¼ v0þ
C
T h ð3Þ
where v0 is diamagnetic susceptibility, C is Curie constant and h isCurie–Weiss temperature. For 3 mol% Gd doped TiO2 the Curie–Weiss fitting gives the following results, v0 = 8.37 106,C = 0.0018,h = () 0.2044. For 0.07 mol Gddoped TiO2 the fitted val-ues for v0, C and h are 2.96 106, 0.0019 and () 0.3025
respectively. The small negative value of Curie–Weiss temperatureindicates presence of antiferromagnetic interaction in the system.As compared to 0.03 mol Gd, the value of h is higher at 0.07 mol.
The large negative value of h confirms large antiferromagnetic inter-action among dopant ions at higher doping level. Therefore, fromthe results of M –H and M –T it is anticipated that both paramagneticand antiferromagnetic phases are present in the system. During dis-cussion on XRD and Raman it is mentioned that with increase indoping concentration, a large number of Gd3+ resides on the surface.Doping at higher level decreases the separation among Gd3+ ions.During discussion on PL it was stated that the distance betweenGd3+ ions is 0.9731 nm when Gd3+ doping level is 0.07 mol. TheseGd3+ ions at this distance apart may undergo superexchange inter-action with each other via O2 ions. This results in antiparallelalignment of the magnetic spins of Gd 4 f shell present in the nearestneighbor. The antiferromagnetic interaction is even stronger at0.07 mol and that is why the Curie–Weiss temperature is more neg-
ative at 0.07 mol than at 0.03 mol. We also carried out magneticmeasurements of 0.03 and 0.07 mol Gd doped TiO2 at 10 K (Fig. 8)and at magnetic field of ±45 kOe. It is observed that even at 10 Kand at such a high applied field the nanoparticles of Gd dopedTiO2 do not show any ferromagnetic ordering. The magnetic curvesare nearly linear with magnetic field exhibiting the characteristic of paramagnetism. However, unlike the linear M –H curves of the sam-ples measured at room temperature, the magnetic curves at 10 Kare trying to get the shape of hysteresis. But the magnetization isnot saturated even at 45 KOe. The slight bent in the M –H curve islikely due to the minimization of the thermal randomization of the magnetic spins at 10 K. It if further noticed that the magnetiza-tion at 0.07 mol is slightly higher than at 0.03 mol. Decrease in thethermal randomization and contribution of large numbers of
Fig. 7. Susceptibility (v) vs. temperature (T ) curves (a) 0.03 mol and (b) 0.07 mol doped TiO2 nanoparticles.
Fig. 8. M –H curves of 0.03 mol and 0.07 mol Gd doped TiO2 measured at 10 K.
S. Paul et al./ Journal of Alloys and Compounds 601 (2014) 201–206 205

7/24/2019 Fix Paul Gd Doping 2
http://slidepdf.com/reader/full/fix-paul-gd-doping-2 6/6
localized non-interacting magnetic spins of Gd3+ may be the reasonfor the higher magnetization in 0.07 mol.
4. Conclusion
In summary, we have prepared Gd doped TiO2 nanoparticles bysol–gel method with different concentration of Gd. X-ray diffrac-
tion and Raman studies reveal that Gd doping has little influenceon the internal structure of TiO2. Photoluminescence intensityquenches when TiO2 is loaded with 0.07 mol. This is likely due tothe formation of emission quenching centers. All the doped sam-ples exhibit paramagnetism at room temperature. Due to the local-ized and non-interacting nature Gd3+ ions could not undergostrong ferromagnetic exchange interaction with the nearest ionsand thus, induce only paramagnetism. The magnetization carriedout at 10 K tries to get the shape of hysteresis and attain very highmagnetization. This is expected due to the reduction of thermalrandomization of magnetic spins so that large numbers of localizednon-interacting magnetic spins of Gd3+ contribute towards para-magnetism. The samples exhibit negative Curie–Weiss tempera-ture and thus, it is believed that the samples exhibitantiferromagnetic interaction. Presence of antiferromagneticordering is because of the superexchange interaction of nearestGd3+ ions via O2 ions on the surface.
Acknowledgements
We are thankful to, Sophisticated Analytical Instrument Facility(SAIF), NEHU, Shillong for helping us in providing the HRTEMimages, IIT Kanpur for helping us in providing the magnetic mea-surement results and IICT Hyderabad for XPS datas. We are alsothankful to UGC for financial support to the Project F.No. 42-785/2013 (SR).
References
[1] G.Z. Xing, J.B. Yi, J.G. Tao, T. Liu, L.M. Wong, Z. Zhang, G.P. Li, S.J. Wang, J. Ding,T.C. Sum, C.H.A. Huan, T. Wu, Adv. Mater. 20 (2008) 3521–3527.
[2] S.A. Wolf, D.D. Awschalom, R.A. Buhrman, J.M. Daughton, S. von Molnar, M.L.Roukes, A.Y. Chtchelkanova, D.M. Treger, Science 294 (2001) 1488–1495.
[3] I. Zutic, J. Fabian, S.D. Sarma, Rev. Mod. Phys. 76 (2004) 323–410 .[4] Y. Matsumoto, M. Murakami, T. Shono, T. Hasegawa, T. Fukumra, M. Kawasaki,
P. Ahmet, T. Chikyow, S. Koshihara, H. Koinuma, Science 291 (2001) 854–856.[5] R. Janisch, P. Gopal, N.A. Spaldin, J. Phys. -Condens. Mater. 17 (2005) R657–
R689.[6] D. Chu, Y.P. Zeng, D. Jiang, Y. Masuda, Sci. Adv. Mater. 1 (2009) 227–229 .[7] S. Bhattacharyya, A. Pucci, D. Zitoun, A. Gedanken, Nanotechnology 19 (2008)
495711 (8pp).[8] D. Peng, L.F. Min, Z.C. Cang, Z.W. Wu, Z. Huan, C.L. Gang, Z.L. Gui, Chin. Phys. B
19 (2010) 118102 (6pp).
[9] M.C.K. Sellers, E.G. Seebauer, Mater. Lett. 114 (2014) 44–47.[10] B. Choudhury, A. Choudhury, A.K.M. Maidul Islam, P. Alagarsamy, M.
Mukherjee, J. Magn. Magn. Mater. 323 (2011) 440–446.[11] http://www.uni-stuttgart.de/gkmr/lectures/lectures_WS_0203/
crystalfield.PDF.[12] G.M. Dalpian, S.-H. Wei, Phys. Rev. B 72 (2005) 115201–115206 .[13] S. Dhar, O. Brandt, M. Ramsteiner, V.F. Sapega, K.H. Ploog, Phys. Rev. Lett. 94
(2005). 037205–037205.[14] L. Liu, P.Y. Yu, Z. Ma, S.S. Mao, Phys. Rev. Lett. 100 (2008) 127203–127207 .[15] N.D. Abazovic, M.B. Radoicic, T.D. Savic, I.A. Jankovic, M.I. Comor, Dig. J.
Nanomater Biosci. 8 (2013) 871–875.[16] Q. Chen, T. Lu, M. Xu, C. Meng, Y. Hu, K. Sun, I. Shlimak, Appl. Phys. Lett. 98
(2011) 073103 (3pp).[17] L. Nagaveni, M.S. Hegde, N. Ravishankar, G.N. Subbanna, G. Madras, Langmuir
20 (2004) 2900–2907.[18] M. Baalousha, Y.J. Nam, P.A. Cole, B. Gaiser, T.F. Fernandes, J.A. Hriljac, M.M.A.
Jepson, V. Stone, C.R. Tyler, J.R. Lead, Environ. Toxicol. Chem. 31 (2012) 983–993.
[19] B. Choudhury, B. Borah, A. Choudhury, Mater. Sci. Eng. B – Adv. 178 (2013)239–247.
[20] P.K. Sharma, R.K. Dutta, R.J. Choudhary, A.C. Pandey, Cryst. Eng. Commun. 15(2013) 4438–4447.
[21] M. Popa, L. Diamendescu, F. Vasiliu, C.M. Teodorescu, V. Cosoveanu, M. Baia, M.Feder, L. Baia, V. Danciu, J. Mater. Sci. 44 (2009) 358–364 .
[22] T. Ohsaka, F. Izumi, Y. Fujikim, J. Raman spectrosc. 7 (1978) 321–324.[23] M.P. Moret, R. Zallen, D.P. Vijay, S.B. Desu, Thin Solid Films 366 (2000)
8–10.[24] F. Tian, Y. Zhang, J. Zhang, C. Pan, J. Phys. Chem. C 116 (2012) 7515–7519 .[25] S. Paul, P. Chetri, A. Choudhury, J. Alloys Comp. 583 (2014) 578–586.[26] M. Pal, U. Pal, J.M. Gracia, Y. Jiménez, F.P. Rodríguez, Nanoscale Res. Lett. 7
(2012) 1–12.[27] C. Rath, P. Mohanty, A.C. Pandey, N.C. Mishra, J. Phys. D: Appl. Phys. 42 (2009)
205101 (6pp).[28] L. Jhing, B. Xin, F. Yuan, L.P. Xue, B. Wang, H. Fu, J. Phys. Chem. B 110 (2006)
17860–17865.[29] D. Raiser, J.P. Deville, J. Electron Spectrosc. Relat. Phenom. 57 (1991) 91–97.[30] N. Serpone, D. Lawless, R. Khairutdinov, J. Phys. Chem. 99 (1995) 16646–
16654.[31] W.Y. Wu, Y.M. Chang, J.M. Ting, Cryst. Growth Des. 10 (2010) 1646–1651 .[32] N. Serpone, J. Phys. Chem. B 110 (2006) 24287–24293.[33] J.C. Yu, J. Yu, W. Ho, Z. Jiang, L. Zhang, Chem. Matter. 14 (2002) 3808–3816 .[34] D. Wang, Q. Yin, Y. Li, M. Wang, J. Lumin. 97 (2002) 1–6.[35] H.T. Wong, H.L.W. Chan, J.H. Hao, Appl. Phys. Lett. 95 (2009) 022512.[36] M. Petersen, J. Hafner, M. Marsman, J. Phys.: Condens. Matter. 18 (2006) 7021–
7043.[37] L.G. Jacobsohn, B.L. Bennett, R.E. Muenchausen, S.C. Tornga, J.D. Thompson, O.
Ugurlu, D.W. Cooke, A.L. Sharma, J. Appl. Phys. 103 (2008) 104303 .
[38] H.S. Hafez, M. Saif, J.T. McLeskey Jr, M.S.A. Abdel-Mottaleb, I.S. Yahia, T. Story,W. Knoff, Int. J. Photoenergy 2009 (2009) 240402.
[39] R. Adhikari, A.K. Das, D. Karmakar, J. Ghatak, J. Magn. Magn. Mater. 322 (2010)3631–3637.
[40] S. Ghosh, G.G. Khan, K. Mandal, ACS Appl. Mater. Interfaces 4 (2012) 2048–2056.
[41] O. Oprea, O.R. Vasile, G. Voicu, L. Craciun, E. Andronescu, Dig. J. NanomaterBiosci. 7 (2012) 1757–1766.
[42] V. Ney, S. Ye, T. Kammermeier, K. Ollefs, F. Wilhelm, A. Rogalev, S. Lebegue, A.L.da Rosa, A. Ney, Phys. Rev. B 85 (2012) 235203–235207.
[43] M.C. Dimri, H. Khanduri, H. Kooskora, J. Subbi, I. Heinmaa, A. Mere, J. Krustok,R. Stern, Phys. Status Solidi A 209 (2012) 353–358.
[44] W. Wang, Y. Hong, M. Yu, B. Rout, Gary A. Glass, J. Tang, J. App. Phys. 99 (2006)(3pp).
206 S. Paul et al. / Journal of Alloys and Compounds 601 (2014) 201–206