fixed-length feature vectors for biometric template
TRANSCRIPT
Master’s Thesis
Fixed-Length Feature Vectors forBiometric Template Protection of
Fingerprint Data
Department of Computer ScienceHochschule Darmstadt
&University of Wisconsin - Platteville
Jan Hirzel
Filling Date : September 20, 2010
Committee Chair : Prof. Dr. Christoph Busch Hochschule DarmstadtCommittee Member : Prof. Dr. Harald Baier Hochschule DarmstadtCommittee Member : Prof. Dr. Mike Rowe UW - Platteville

Commitee Chair - ( Prof. Christoph Busch )
Commitee Member - ( Prof. Harald Baier )
Commitee Member - ( Prof. Mike Rowe )
Date of Thesis Defense: 30th of August, 2010

I hereby certify, that this masters thesis together with the corresponding sourcecode has been created by me autonomously. No other sources than those men-tioned were used.
Gjøvik, September 20, 2010
( Jan Hirzel )
3

Acknowledgement
It is a pleasure to thank those who made this thesis possible.
First of all I want to thank my advisor Prof. Dr. Christoph Busch whose en-couragement, guidance and support from start to the very end allowed me todevelop and understand the subject as well as making it possible to write thethesis at NISLab in Norway. I also want to thank Daniel Hartung for his eager-ness to help, the self-evident support on every day of the week and the will topush me towards my limits.
Various other persons have contributed to the completion of this thesis. I wouldlike to show my gratitude to my friend Tobias Noll who spent a considerable timeanswering a myriad of questions about Latex as well as his enlightening discus-sions about algorithms, mathematics and personal matters during the time. I alsowant to thank my cousin Cliff Zimsen who always had an open ear for my variousexplanations about fingerprint recognition and the staff of NISLab who was al-ways willing to exchange ideas and giving thoughts to current problems. Finally Iwant to thank my friends and my family who provided me with assistance duringmy stay in Gjøvik.
You all made this thesis possible!

Contents
1. Introduction 8
2. State of the Art 112.1. Minutiae Matching . . . . . . . . . . . . . . . . . . . . . . . . . . 122.2. Fingerprint Correlation . . . . . . . . . . . . . . . . . . . . . . . . 162.3. Finger Pattern Matching . . . . . . . . . . . . . . . . . . . . . . . 18
3. Biometric Performance 20
4. Pattern Matching Using Co-Sinusoidal Triplets 244.1. Image Pre-Processing . . . . . . . . . . . . . . . . . . . . . . . . . 244.2. Cellular Partitioning . . . . . . . . . . . . . . . . . . . . . . . . . 254.3. Spectral Component Selection . . . . . . . . . . . . . . . . . . . . 264.4. Candidate Matrix . . . . . . . . . . . . . . . . . . . . . . . . . . . 304.5. Processing Pipeline . . . . . . . . . . . . . . . . . . . . . . . . . . 324.6. Comparison of Triplet Sets . . . . . . . . . . . . . . . . . . . . . . 33
4.6.1. Direct Comparison Method (DCM) . . . . . . . . . . . . . 344.6.2. Weighted Direct Comparison Method (WCM) . . . . . . . 344.6.3. Neighborhood Comparison Method (NCM) . . . . . . . . . 36
4.7. Cell Size Benchmark . . . . . . . . . . . . . . . . . . . . . . . . . 384.8. Parameter Evaluation . . . . . . . . . . . . . . . . . . . . . . . . . 394.9. Algorithm Improvements . . . . . . . . . . . . . . . . . . . . . . . 41
5. Biometric Template Protection 425.1. Introduction . . . . . . . . . . . . . . . . . . . . . . . . . . . . . . 425.2. Template Protection Schemes . . . . . . . . . . . . . . . . . . . . 445.3. Helper Data Scheme . . . . . . . . . . . . . . . . . . . . . . . . . 465.4. Error Correcting Codes . . . . . . . . . . . . . . . . . . . . . . . . 485.5. Data Preprocessing . . . . . . . . . . . . . . . . . . . . . . . . . . 495.6. Tests . . . . . . . . . . . . . . . . . . . . . . . . . . . . . . . . . . 51
5.6.1. BCH Code Triplets . . . . . . . . . . . . . . . . . . . . . . 515.6.2. N-Tuple Combination . . . . . . . . . . . . . . . . . . . . . 525.6.3. Optimum Cell Size . . . . . . . . . . . . . . . . . . . . . . 545.6.4. Layer-Based Order . . . . . . . . . . . . . . . . . . . . . . 54
5

Contents
5.6.5. Multiple Verification Samples . . . . . . . . . . . . . . . . 55
6. Conclusion 57
7. Further Steps 58
Bibliography 60
8. Glossary 63
9. Appendix 64
A. Parameter Evaluation 65
B. Cellsize Evaluation 73
C. HDS Test Results 82
6

Abstract:This thesis is focused on fingerprint ridge pattern comparison in combination withbiometric template protection (BTP). The feature extraction algorithm describedis based on the information of the fingerprint ridges as a whole and not just sin-gular, unique points. There are numerous ways how the pattern can be examined,one of the most prominent ones though is described in the ISO standard of 2009[fS06b] and will be discussed herein. The approach investigated in this thesis hasthe advantage that features - unlike finger minutiae data - can be easily trans-formed to a fixed length feature vector which is required for further processingsuch as template protection methods. In the second part of the thesis, the refer-ence architecture for biometric template protection is introduced. The integrationof the developed feature extractor into the biometric template protection processaccording to the Helper Data Scheme is investigated and tested.
1. Introduction
What is Biometry?The word biometry is derived from the Greek language and translates to ”theobservation of characteristics of the human body for the purpose of identification(recognition)”. Hence, it addresses the identification or verification of humanbeings based on what they are or how they act. It is further defined as
”Automated recognition of individuals based on their behavioraland biological characteristics.” [fS08]
Human individuals have a wide range of measurable characteristics like height,weight, facial expression, fingerprints, veins, iris patterns, etc. but not all of thosemodalities fulfill the needs for automatic recognition. A biometric modality shouldbe universal, i.e. it is measurable on all individuals equally. It needs to be uniquefor each participant and up to a certain degree, persistent over time. Furthermore,it needs to be measurable, convenient in use, acceptable for the targeted audience,provide a certain degree of security, and achieve a good biometric performance.
Why use Biometrics?Identity authentication can be categorized into three different classes. It can beknowledge based (for example a password or a PIN), possession based (for ex-ample a token or a key) or determined by what the individual is (for example abody characteristics or behavior). The problem with knowledge and possessionbased systems is, that the secret or token can be lost, forgotten or forwarded toother individuals, whereas biometric characteristics cannot be.There are two ways how a biometric system can work. It can identify or verifyindividuals. Identification is the ability to recognize an individual amongst allenrolled subjects of a system, while verification is the comparison of a personwith who he claims to be.
History of Fingerprint AuthenticationFingerprints, as a unique biometric characteristic [PPJ01], have been used foridentification and verification purposes since centuries and have been proven tobe reliable ever since. Even though it cannot be formally proven that they areunique for each individual, there is no record of any two persons having the same
8

1. Introduction
fingerprint. Albeit widely used in criminalistics, since the spreading of fingerprintsensors in home computers and laptops they gained a never seen before popular-ity.
In order to identify an individual it is not necessary to compare each and everypart of the fingerprint but it is sufficient to use a subset of features that allowa positive identification. In traditional approaches like in Jain et al. [JHPB97a]these features are the minutiae, the ridge endings and bifurcations of the epider-mal ridges of a finger. Each minutia consists of a location (x, y) and an orientation.For each fingerprint image a set of minutiae is extracted and when comparingthem, the decision is made depending on their correlation. There are alternativeapproaches to this method which do not rely on minutiae, like fingerprint corre-lation [BCP�03] or finger pattern comparison [Hup07].
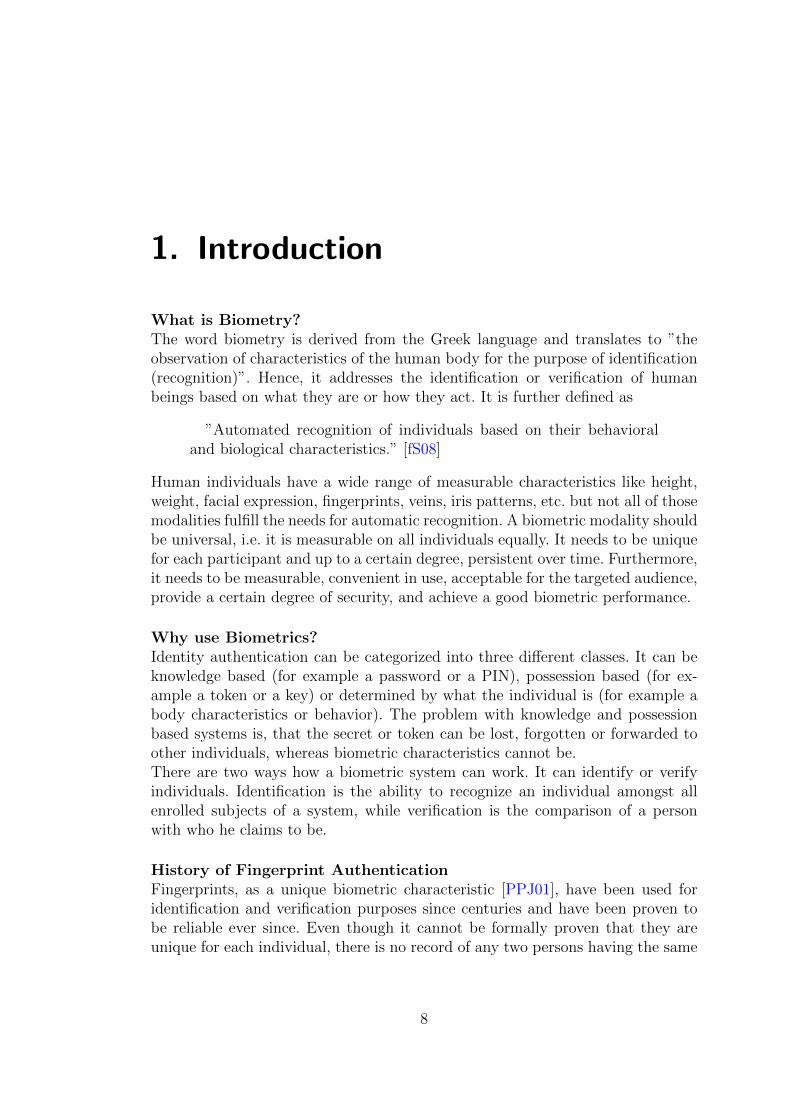
What are Fingerprint ImagesA fingerprint image is a digital 2D representation of the epidermal fingerprintridges on a finger captured by a sensor. Fingerprint sensors, no matter on whathardware they are based on, will generate a gray scale image like the one in Figure1.1. The dark lines in the image are called ridges and are a planar copy of theepidermal ridges found on a finger. The white components within the fingerprintare called valleys. In traditional fingerprint recognition as described by FrancisGalton [Gal92], the identification is based on points which, as a set of points orpoint cloud, uniquely describe a fingerprint. Those points reside on the ridgesof the fingerprint image and therefore a good projection of the 3 dimensional,epidermal ridges to the 2 dimensional image is the base for reliable fingerprintrecognition.
Importance of SecurityWith the high distribution of fingerprint sensors and the coalescence and ad-vancements of computer systems, new threats appear as well. Advantages aretaken from the additional information that is typical for certain biometric char-acteristics and that are encoded in biometric data. Through cross referencing overdifferent applications or even different databases new dangers arise. The only wayto effectively protect a biometric system against fraudulent use and the privacyof the user is by using cryptographic counter-measures that will ensure the safetyof the stored biometric data.
Identity theft is still one of the biggest challenges of law enforcement and accord-ing to [Cen10] only 1.2% of all purloined identitiy data had either encryption orother security features protecting exposed data. With digital paperwork on the
9
1. Introduction
Figure 1.1.: A fingerprint image as captured by a fingerprint sensor. Source:Newsweek (http://current.newsweek.com/budgettravel/fingerprint.jpg) & FVC DB2002 DB1 a File: 1 1.tif
rise and more and more user accounts mandatory in each sector of everyday lives,it is clear that a high level of protection is inevitable especially for such personaldata like biometric templates.
10

2. State of the Art
As mentioned in Chapter 1, there is a wide variety of different fingerprint recog-nition systems and techniques currently established on the market. All of thebiometric systems work on the same simplified principle as shown in Figure 2.1.A prerequisite to use a biometric system is that a user has to be enrolled in thesystem first. The enrollment step is mandatory in all systems; no matter whatbiometric characteristic, which sensor or feature extraction algorithm is used. Theenrollment only has to be done once and a biometric reference will be createdwhich is used for authentication. The verification of users operates very similarto the enrollment. In the enrollment step, a sensor takes a biometric sample andpasses it to the feature extraction stage. The feature extraction will generate thebiometric data that will comprise the biometric reference. If the biometric datais of sufficient quality, it will be store as the reference in the database. All verifi-cations (or in the case of an identification system, identifications) will be basedon this reference, therefore it is very important that it is of utmost quality. Afterthis step the user may authenticate at the system as often as desired. For the au-thentication (or verification), the user presents the same biometric characteristicas used for the enrollment to a sensor. The sensor then takes a biometric sampleand passes it to the feature extractor. The feature extractor gathers the biomet-ric data from the sample and passes it to a comparison and decision unit. Thecomparison and decision unit also takes the biometric reference which is storedin the database as an input and depending on the outcome of the examinationthe user is accepted or rejected.
Currently there are three different, well established techniques on the marketto extract features from fingerprint samples, namely Minutiae Matching (see[JHPB97a]), Fingerprint Correlation (see [BVG�00]) and Cell Pattern Matching(introduced in Chapter 4). In this chapter, each of the three different techniqueswill be introduced.
11

2. State of the Art
Figure 2.1.: The base of each fingerprint identification or verification system.
2.1. Minutiae Matching
The technique of minutiae matching is based on the unique points located onthe fingerprints, called minutiae. A minutia is a significant point on a fingerprint,either a bifurcation of a ridge or a ridge ending (see Figure 2.2). A minutia isdescribed by its position on the fingerprint and its orientation. Those minutiaepoints are sufficient to uniquely describe a fingerprint since the amount of minu-tiae, their positions, orientations and classifications vary from finger to fingerand of course person to person. A typical minutia based fingerprint comparisonalgorithm works as follows:
1. Image Preprocessing
2. Feature extraction
3. Count corresponding minutiae
4. Determine comparison score
Image Preprocessing: The image preprocessing step has a big impact on the per-formance of the system and should not be underestimated. When processing im-ages of low quality, it is very likely that less minutiae points will be extracted andtherefore, the probe will have fewer conformances with a reference consequentlyleading to a lower score. The three most important image preprocessing methods
12

2. State of the Art
Figure 2.2.: The minutiae points on a fingerprint. On the left is a typical ridgeending, on the right a typical bifurcation. Source: [JHPB97b]
are histogram stretching, normalization and image smoothing.
Histogram stretching, as explained by Alparslan and Fuatince [AF81], is a con-trast enhancing technique based on the intensity histogram of the fingerprintimage. By simply rearranging the present gray scale values, one can increase thedistance between neighboring brightness ranges. This leads, in cases of low con-trast images, to significant improvements.
Normalization is a mathematical tool that, when applied to the brightness chan-nel of an image, leads to a better contrast. It projects a co-domain onto another,allowing further increase in contrast to suit specific needs of following algorithms.One of the most renowned normalizations is the binarization, where all presentvalues will be projected to 0 or 1.
Image smoothing is a low-pass filter in the spatial domain of the image and allowsminimizing the presence of noise and outliers. This can be achieved by looking ata neighborhood (for example 3x3) of a pixel and calculating the median or aver-age of that area. Another famous representative for image smoothing techniquesis the Gaussian Blur.
The feature extraction can be broken down into five small steps: creation of adirectional image, extraction of the region of interest, detection of the singularitypoints, skeletonizing, and minutia detection.
A directional image assigns an orientation to each pixel of an image. For a finger-print image this is the direction in which the ridges flow at the specific position.The directional image can be retrieved with techniques explained in [MMKC87]and will be used to determine the orientation of the minutiae later.
In general, when a sensor captures a fingerprint, there are some areas that contain
13

2. State of the Art
ridges and areas that do not hold any information. This is for example the casewhen the area of the fingerprint is smaller than the area that is captured by thesensor (see Figure 2.3). In order to be more efficient and reduce errors, the regionthat does not contain any information about the fingerprint will be discarded.The area that does not contain any information is also called background and thearea that holds information is called foreground. There are numerous ways howthis can be achieved - one way is by analyzing the certainty field of the orientationmap (as described in [JHPB97b]) or by image contrast analysis.
Figure 2.3.: The captured fingerprint image on the left and the fingerprint withdiscarded background information on the right. Source: [Hup07]
The next step is the detection of singularity points, namely the core and deltapoints. Depending on the fingerprint class, there can be up to two core points.Core and delta points can be used as reference points in the fingerprint imageand are used to help building up point relations for minutiae. See Figure 2.4 forexamples of core and delta points in a fingerprint image.
A core point is defined by [fS06a] as ”A singular point in the fin-gerprint, where the curvature of the ridges reaches a maximum”
A delta point is defined by [fS06a] as ”structure where three fieldsof parallel ridge lines meet”
With the orientation image already present, it is easy to extract the core anddelta points from it with the help of the Poincare index (see [HJ99]).
Skeletonizing or thinning is the process of reducing the ridges (or black lines)in the fingerprint image to the minimum width of one pixel. The lines will be
14

2. State of the Art
Figure 2.4.: The two different reference points on a fingerprint. There areclasses of fingerprints that do not have a delta and others thathave two cores. Source: http://geradts.com/anil/ij/vol_002_
no_001/papers/paper005.html
reduced to the center of the ridges. With that, the minutiae can be detected onpixel level. Skeletonizing can be achieved through ridge line tracing algorithms ingray scale images or simple erosion algorithms in binary images.
Finally the minutiae points can be detected in the resulting image. The localiza-tion can be achieved by looking at N4 neighborhoods for each pixel. A point on aridge with at least one white pixel in its neighborhood is called a border pixel andis thus a potential candidate for a minutia point. As mentioned above, ridge end-ings and bifurcations are possible minutiae points. In order to determine whichof the two the border point is, further investigations have to be made. Whenfollowing the dominant ridge flow direction which can be obtained from the ori-entation image, the center of orthogonal crossing lines leave a clear path whenthey meet the border. Then the best minutia position is found and the point is aridge ending. Bifurcations can be detected by following the dominant ridge flow(as when detecting a ridge ending) and when the center paths of three branchesmeet in a single point or form a small triangle within a ridge at the border point,a bifurcation has been found. The center-of-mass of this triangle is the best po-sition of the minutia.
15

2. State of the Art
After the minutiae are detected, a quality check that counts the number of minu-tiae will decide whether they are enough to distinctively describe the fingerprint(see Figure 2.5 for an example of detected minutiae points). If the user is in theenrollment phase, the minutiae points will be stored in the reference archive. Oth-erwise, the minutiae points will be compared to the points from the reference.Correlations between the point clouds will be determined by looking at deltaneighborhoods around each minutia point. In the case that enough points fromthe probe correlate to points in the reference, the comparison will result in amatch for the user.
Figure 2.5.: The detected minutiae points marked in a fingerprint image.Source: http://fingerchip.pagesperso-orange.fr/biometrics/types/fingerprint_algo.htm
2.2. Fingerprint Correlation
The fingerprint correlation method was introduced due to the problems of minu-tiae based matching that arise with bad image quality. When a fingerprint imageis of low quality through low contrast or distortion which cannot be correctedby image processing algorithms, the minutiae based approach may fail due tothe fact that it simply cannot extract enough minutiae points. The correlation
16

2. State of the Art
method introduced by [BVG�00] is based on the gray level information presentin the image. Even when an image is of bad quality, the gray levels of the imagestill contain enough discriminatory information to allow verification.
The correlation approach creates small cells on the fingerprint that will containenough information to uniquely identify a fingerprint. Here, a template consistsof a sufficient number of these small areas which, in the verification, will be com-pared to the areas at the same positions. Bazen suggests three different methodson how to select the cells. Minutia based template selection, coherence basedtemplate selection and correlation based template selection.
Minutia based template selection extracts minutiae points similar to the approachin the previous chapter. Instead of saving the minutiae points directly, it selectsan area around the minutiae points and stores the area. This will only be done inthe enrollment. In the verification phase, the areas will be taken from the refer-ence and the comparison algorithm will look for this area in the probe. Of coursethe problems that arise with minutiae matching are also affecting this approachduring the enrollment and therefore it is not the recommended template selectionapproach.
In the coherence based template selection approach, the areas that will representthe fingerprint will be chosen by looking for areas of low coherence. The coherenceof an area is defined as the measure of how many of the ridges passing throughflow in the same direction. For example a high coherence is present when allridges flow in the same direction, whereas low coherence is at hand when ridgesare flowing in different directions in the same area. Areas of high coherence arenot very distinctive since they contain only little to no unique information. Asa matter of fact, the areas that are most suitable are located around minutiaepoints, even though the minutiae are not explicitly extracted beforehand.
Correlation based matching selects the template areas according to the follow-ing approach. An area is selected and then it will be compared against all otherpossible cell positions on the fingerprint. If there is another position that is verysimilar or exactly the same to the selected one, the selected area is not very dis-tinctive. If the area can only be found once it is very individual for the printand a good candidate for an area that can substitute the print. This process isrepeated with different areas until sufficient distinctive cells have been found.This approach produces the most suitable results since it satisfies the templaterequirements best. The drawback, of course, is that the approach costs a lot ofresources which makes it less attractive.
17

2. State of the Art
Bazel suggests a hybrid approach for the template selection, combining all threemethods. After the user is enrolled, the system can verify the user by using thepreselected areas from the reference and comparing them to the areas that willbe found at those positions on the probe. Naturally, in order to be able to com-pare the same positions, the probe has to be aligned with the reference. Thisis achieved by sliding the templates over the probe and finding the position atwhich the distance of the squared gray levels is smallest. This is of course alsovery costly on resources, but the advantage is that it makes the system less errorprone to distortions. Besides, the process can be speedup when the image is nor-malized to the range of [0 1]. Then a convolution or a filter can be used to findthe best position for the area. Furthermore, if the size of the fingerprint is chosencorrect, a 2D Fast Fourier Transformation can be used.
2.3. Finger Pattern Matching
Finger pattern algorithms are based on spectral information that is present in fin-gerprints rather than certain local point patterns. What all finger pattern match-ing algorithms have in common is, that the fingerprint will be divided into smallcells and each cell will be represented by a substitute. Depending on the used al-gorithm, the substitute consists of different parameters for the employed models.
The fingerprint image is divided into cells (tessellation) of variable size and shape.The cells do not have to cover the whole information, but usually cover the wholeRegion of Interest (ROI) of a fingerprint, i.e. parts of the image where ridges arepresent. There are three different ways proposed by [fS06b] on how to encode thespectral information of the cells, Gabor filters, Discrete Fourier Transformation(DFT) or Quantized Co-Sinusoidal Triplets (QCT). The encoding of the spectralinformation of each cell is based on the given underlying mathematical model thatallows the representation of the whole cell through a small set of parameters. Thecomplete ensemble of cells will be stored as the biometric reference.
In the enrollment phase, the fingerprint image is taken and an image preprocess-ing, like in Chapter 2.1, is carried out if required. The image is then divided intothe cells and the spectral information is extracted. The resulting parameters willbe stored in the reference archive.
For the verification, a probe image is taken from a sensor, preprocessed and thenthe image has to be aligned to the reference. The alignment needs to cover trans-lations as well as rotations and deformations. This can be a challenging task andis still subject of current research. It can be performed through a global or local
18
2. State of the Art
alignment. A global alignment will translate and rotate the probe according toa reference that can be extracted from the fingerprint image (for example coreor delta points). A local alignment can be done on cellular basis, where the in-formation in the cells from the references will be used to align the probe. Afterthe alignment, the fingerprint is tessellated and the information from the cellsextracted. The cells of the reference and the probe will be compared and if theyare sufficiently conforming, result in a match.
In respect of the topic of this thesis, the creation of fixed-length feature vec-tors, the finger pattern matching algorithms are the most promising approaches.They do not rely on volatile data like minutiae points or stable areas but alreadyoffer the opportunity to fix the amount of template data for all participants.Furthermore the QCT approach has been chosen as the spectral data extractionmechanism since it has already been proven by Bioscrypt Inc. at the FVC 2000to provide reliable results (see [Bio10] for more information). According to the’Introduction’ chapter of [fS06b], the Quantized Co-Sinusoidal Triplet methodhas been patented by Bioscrypt Inc.
19
3. Biometric Performance
To determine how well a system performs, it is necessary to have metrics that canobjectively quantify the ”how well”. Biometric metrics were introduced to pro-vide an objective and universal method to compare the performance of biometricsystems, no matter on which modality they are based upon. The result of a com-parison of two biometric samples is a comparison score that can be projected tothe range of r0, 1s. The closer the score is to 1, the higher is the probability thatthe samples originated from the same source. The closer the comparison score isto 0, the smaller is the certainty of the system that the samples originated fromthe same source. The decision whether the comparison leads to a match or a non-match, is made based on a threshold parameter t. Is a comparison score equal to,or above the threshold, the comparison is considered a match. Is it below t it isregarded a non-match.
A biometric system can commit two different types of errors. It can falsely deter-mine two samples to be from different biometric sources, even though they arefrom the same and it can falsely ascertain that two samples are from the samebiometric source, even though they are from different sources. These errors can becaused by several reasons and therefore the classification can be further narroweddown and are defined in the Harmonized Biometric Vocabulary [fS08].
Failure to Capture (FTC): Errors that occur during the capturing of the biomet-ric sample. This includes errors that are caused by the user (e.g. the finger is notplace properly on the sensor), errors caused by the image sensor, but also samplesrejected by an automated quality control method.
Failure to Extract(FTX): FTX errors occur if the feature extraction algorithm isnot able to generate features for the biometric template from the provided source.This could be either caused by the fact, that the feature extraction was not ableto identify an adequate amount of features or that the processing time exceededthe specified limits.
Failure to Enroll (FTE): When a system is not capable of creating a biometricreference for verification, a failure to enroll error occurred. This metric describes
20

3. Biometric Performance
the amount of persons that are unable to participate in the system. This can becaused by non-existence of the biometric characteristic on an individual or bythe disability to generate a template of sufficient quality from the individual’scharacteristics.
Failure to Acquire (FTA): The FTA is the inability to generate biometric featuresfrom a probe during the verification process. Therefore, it combines the FTC andFTX during the verification phase.
The phases in which the errors will be introduced can be seen in Figure 3.1. Withevery advancement towards the enrollment (or verification) the error possibilitiesaccumulate.
Figure 3.1.: Phases in which errors can be introduced into the system
False Match Rate (FMR): The FMR is the number of cases in which the systemfalsely accepts a user, even though he is not enrolled in the system or is enrolledas a different user (impostor). The FMR is not associated to the above mentionedfailure rates and therefore only evaluates the intrinsic algorithm. This metric issystem critical, since it is concerned with the security of the system.
False Accept Rate (FAR): like the FMR, the FAR also measures the cases wherea user is falsely accepted in a system. Additionally to the intrinsic algorithm italso considers the extrinsic parameters that are defined by the above mentionederrors (FTC, FTX, FTE and FTA).
21
3. Biometric Performance
False Non Match Rate (FNMR): The FNMR is the number of cases in which auser was falsely rejected even though he is a valid user of the system (Genuine).The FNMR is, like the FMR, not associated with any other error rates and there-fore evaluates the intrinsic algorithm rather than the whole system. The FNMRis considered a comfort criterion, since no further harm can be done from a falselyrejected user.
False Reject Rate (FRR): The false reject rate is, same as the FNMR, a measureof how many users are falsely rejected from the system. Same as the FAR, it isbased on the performance of the intrinsic algorithms and the extrinsic parametersof the system (FTC, FTX, FTE and FTA).
The FAR and FRR are typically used to evaluate the performance of a wholebiometric system, since they also take errors caused by users and sensors into ac-count. Thereupon, the FAR and FRR are highly dependent on the user group andthe hardware, whereas the FMR and FNMR exclude all sensor and user depen-dent errors and thus are perfect for comparing different algorithmic approachesand are the key to system testing. Typically, the FAR and the FRR are drawninto a single plot for further evaluation (see Figure 3.3). That way, it is easy todetermine how the system performs for different applications and how the thresh-old t should be chosen.
Equal Error Rate (EER): The EER is reached when the FAR and the FRR areexactly the same. This allows a comparison between different biometric systemsand algorithms without considering the threshold t that significantly affects theview on the performance of a biometric system. It also allows comparison ofbiometric systems that utilize different biometric modalities, thus making it themost important metric for evaluating algorithms and systems. The EER can beobtained from the ROC Curve. It is at the point where the axis bisection inter-sects with the curve.
Receiver Operating Characteristic (ROC): The ROC curve combines the infor-mation of the FMR and the FNMR in a single plot which allows fast insight intothe behavior of the system in different applications (see Figure 3.2). Usually atleast one of the axes is plotted in the logarithmic scale.
22

3. Biometric Performance
Figure 3.2.: The Receiver Operating Characteristic (ROC) Curve with both axesin logarithmic scale.
Figure 3.3.: Score Distribution with threshold t on the x axis and the probabilityon the y axis. The green curve indicates the genuine access attempts,the red curve the impostor attempts.
23

4. Pattern Matching UsingCo-Sinusoidal Triplets
The first step in the generation of a fingerprint template is the conversion of thefingerprint to spectral data. The steps suggested in the ISO standard [fS06b] areas follows:
• Image Pre-Processing
• Cellular Partitioning
• Spectral Component Selection
The image preprocessing step is optional but can have a great effect on the results,since poor image quality leads to missing and spurious features.
4.1. Image Pre-Processing
Due to the nature of the individual characteristic of a human finger (scars, medicalskin condition, etc.) and the fact that a fingerprint image taken by a sensor isspoiled by the current condition (dry, wet, oily, etc.) of the finger, the imagequality may differ drastically depending on the time of the acquisition. Moreover,the image might also be differently distorted, when different sensors are used(for example contact based or contactless). This leads to fingerprint images withwidely varying qualities as can be seen in Figure 4.1. In order to overcome thisproblem and increase the biometric performance of the system, the quality of theimages provided by a fingerprint sensor might be enhanced before any features areextracted. A basic improvement that does not consume much processing poweris the histogram normalization of the fingerprint image (as for example proposedby Alparslan and Fuatince [AF81]) which already leads to a more consistentimage quality. Further enhancements include Gabor filtering [YLJF03], imagesegmentation [HJ04], binarization [Tha03], and thinning [Tha03] of the fingerprintimages.
24

4. Pattern Matching Using Co-Sinusoidal Triplets
Figure 4.1.: Fingerprint images with different image qualities. The quality de-pends on the characteristic and condition of the finger, the imagesensor, and the pressure used when obtaining the image. Source:http://www.secugen.com/images/faq03.gif
4.2. Cellular Partitioning
Figure 4.2.: The tesselation of a fingerprint with an optional X- and Y-Offset.
After image preprocessing, a tessellation of the fingerprint image has to be done.Therefore, the fingerprint will be divided by a grid into cells of size w�w. The ISOstandard [fS06b] does not give any recommendation about the specific size of thecells but when using quantized co-sinusoidal triplets for the spectral componentselection it is suggested to have a maximum of approximately two ridges per cell.Thus, it varies depending on the resolution of the sensor how big the cells should
25

4. Pattern Matching Using Co-Sinusoidal Triplets
be. Vannfalt and Astrom [Vs06] suggested in their thesis a cell size of 5�5 pixelsfor a sensor resolution of 250ppi.
If there is space at the top and left border that does not contain any fingerprintinformation, an offset can be chosen to get a maximum coverage of the fingerprintarea. Any cells that cannot be fully filled with image information (the rightmostand bottommost cells) will be discarded.
4.3. Spectral Component Selection
Next, the spectral information of each cell needs to be approximated. Thereare three different, already established retrieval methods. They are: Quantizedco-sinusoidal triplets, Discrete Fourier Transformation (DFT) and Gabor fil-ters. There are numerous publications about the use of the DFT (like Bracewell[Bra89], Nussbaumer [Nus82] or Winograd [Win76]) as well as the use of Gaborfilters (like Yang [YLJF03] or Huppmann [Hup07]) but only the master’s thesis ofVannfalt and Astrom [Vs06] was concerned with QCT, even though an algorithmusing QCT won the FVC of 2000. It is proven to produce reliable results andis rather simple to implement, hence the quantized co-sinusoidal triplet methodwas chosen as the spectral component selector.
Quantized Co-Sinusoidal Triplets
The method of quantized co-sinusoidal triplets is based on the approximation ofeach finger pattern cell through a cosine triplet (θ, λ, and δq. As seen in Figure4.3, the three parameters describe an angle of propagation, the wavelength andthe frequency. The range of the parameters can be restricted to a minimum andmaximum to get the highest variance without repeating structures.
Angle of propagation θ: represents the directional information of a cell. The an-gle of propagation is measured perpendicular to the crest of the co-sinusoidalfunction. If the crest is parallel to the vertical axis x, the angle is 0 and it in-creases with counter-clockwise rotation. It is specified in radians and thereforethe interval r0, πr describes all possible orientations of the function.
Wavelength λ: describes the occurrence of ridges and the distance between themfor one cell. The valid interval is: sminimum spatial wavelength,8r, whose lowerend is in practice limited by twice the length of the longest diagonal for a cell.The frequency f is directly related to this parameter since it is defined as λ � 1
f.
The range of the frequency is r0,maximal spatial frequencyr where the maximalspatial frequency is the Nyquist frequency (as described for signal theory by
26

4. Pattern Matching Using Co-Sinusoidal Triplets
Figure 4.3.: Left: A cell taken from the fingerprint. Right: The approximationthrough the co-sinusoidal triplets. The δ parameter is defined as δ �d{λ � 360
Grenander [Gre59]. For 2D signal processing the Nyquist frequency is equal tothe length of the image diagonal divided by two.
Phase δ: describes the distance of the first crest to origin of the cell. It is specifiedin angular coordinates and therefore is in the interval of r0, 360s. It is defined asδ � d
λ� 360�, where d is the distance.
The 2D co-sinusoidal function to approximate the cell is defined as follows:
Cellθ,λ,δps, tq � cospP � 2π � f � δq, (4.1)
where P � s � cospθq � t � sinpθq,
and f �1
λ
The parameters s and t of the function describe the position of each pixel in-side the cell and the valid interval for s and t respectively is defined as s �r1, image widths and t � r1, image heights where s, t P N. The resulting valuesof the function will be quantized and are accurate enough to reconstruct theridges of the fingerprint depending on the precision for each parameter. The ISOstandard [fS06b] suggests a linear distribution for the quantization and is definedfor each value. The chosen values are arranged such that they lie in the definedintervals. The amount of possible values of the quantization (bit-depth) dependshighly on the cell size. The smaller the cells are the less information is necessaryto approximate a cell adequately. However, smaller cells also denote that morecells are necessary in order to reproduce the fingerprint image. Therefore, it isnecessary to find a suitable bit-depth depending on the resolution of the cells.The bit-depth determines the precision of the approximation, where a higher bit-depth gives more information that can be used to recreate the original image (seeFigure 4.4 for an example).
27

4. Pattern Matching Using Co-Sinusoidal Triplets
Figure 4.4.: On the left is the original fingerprint image, on the right is the syn-thetic resemblance using the previously gathered triplets. Source:FVC2000 DB 1a
In order to select the most suitable triplet to approximate the cell, the followingapproach is chosen. First a normalization of the fingerprint values to the range [-1,1] is done. Afterwards, the distance between the fingerprint cell and all possiblesynthetic cells (depending on the chosen bit-depths) will be calculated and thesynthetic cell structure with the minimum distance will be used to represent theinformation of the fingerprint cell. The euclidian distance function (see Equation4.2) is used as suggested in the standard, even though different distance functions(like for example hamming distance) can be used.
D � |A1,1 �B1,1| � |A1,2 �B1,2| � � � � � |Am,n �Bm,n| (4.2)
For A being the set of all pixels in the fingerprint cell and B being the set of allpixels in the candidate cell structures.
In the case that there is more than one cell with the same distance, the followingprioritization shall be employed.
1. The triplet with the lowest frequency (δ) value shall be chosen
2. The triplet with the highest wavelength (λ) value shall be chosen
3. The triplet with the lowest angle of propagation (θ) value shall be chosen
Concluded, the number of the possible cells is dependent on the bit-depth chosenfor the parameters and is calculated as follows 2l�m�n where l, m and n respec-tively define the bit depth for θ, λ,and δ. This is further specified in Table 4.1,4.2 and 4.3.
28

4. Pattern Matching Using Co-Sinusoidal Triplets
Value (l-bits) θ
0. . . 000 0
0. . . 001 12l� 180
0. . . 010 22l� 180
. . . . . .
1. . . 110 2l�22l
� 180
1. . . 111 2l�12l
� 180
Table 4.1.: l-bit representation for the angle of propagation θ. Source: [fS06b]
Value (m-bits) f λ
0. . . 000 0 8
0. . . 001 12m
� Nyquist 1f
0. . . 010 22m
� Nyquist 1f
. . . . . . . . .
1. . . 110 2m�22m
� Nyquist 1f
1. . . 111 2m�12m
� Nyquist 1f
Table 4.2.: m-bit representation for the wavelength λ. Source: [fS06b]
Value (n-bits) δ
0. . . 000 0
0. . . 001 12n� 360
0. . . 010 22n� 360
. . . . . .
1. . . 110 2n�22n
� 360
1. . . 111 2n�12n
� 360
Table 4.3.: n-bit representation for the phase δ. Source: [fS06b]
29

4. Pattern Matching Using Co-Sinusoidal Triplets
4.4. Candidate Matrix
When following the algorithm with a precision of 3 bits for l, 3 bits for m, and3 bits for n then the resulting cell candidates can be seen in Figure 4.5 whenconcatenated. After selecting the triplets with the closest distance to a fingerprintcells, the resulting synthetic print looks like Figure 4.6(b). The original print canbe seen in Figure 4.6(a) and the synthetic print when using a lower precision(2 bits for each parameter) in Figure 4.6(c). This was achieved by calculatingthe synthetic cells at the respective positions. The size of the cells was 5x5 assuggested by [Vs06].
Figure 4.5.: This is a candidate Matrix, where θ increases in each 8x8 quadrant,λ increase in every row and δ increase in every column.
30

4. Pattern Matching Using Co-Sinusoidal Triplets
(a)Original Print: The image asit was captured by the sensor
(b)Synthetic Print (High Qual-ity): After back projection ofthe triplets. Bit-depth for θ �4, λ � 5, δ � 4.
(c)Synthetic Print (Low Qual-ity): After back projection ofthe triplets. Bit-depth for allparameters was 2.
Figure 4.6.: The original fingerprint and two synthetic restorations.
31

4. Pattern Matching Using Co-Sinusoidal Triplets
4.5. Processing Pipeline
The following processing pipeline was used which summarizes the mandatorysteps to transform a fingerprint image into the co-sinusoidal triplet representa-tion. With the premise to support an unknown number of fingerprint scannerswhich use different types of fingerprint image formats and different scales, imagepreprocessing is inevitable. Since the focus of this thesis is on fixed-length featurevectors, image preprocessing will be handled by the VeriFinger SDK 1.In order to produce a fixed set of feature vectors, the information gathered froma fingerprint must be limited to a mutual size. The most obvious approach is, tofind a reference point in the fingerprint that is stable for all occurrences. There areseveral points in a fingerprint that fulfill this definition, namely the core pointand the delta. Cores are the most common used reference points even thoughthere are fingerprint classes, that do not contain a core (plain arch) and somethat contain more than one. However, the plain arch type has a likelihood ofoccurrence of less than 5% and therefore is still a prudent selection as a referencepoint. A different promising approach is introduced by [AJ07] which selects thepoint of the highest curvature as the reference point. This method will result ina single point for plain arches as well as a single point for double loops, whichhave two cores.
1. After the reference point is extracted, the fingerprint image will be trans-lated and rotated according to the position and orientation of the referencepoint. The result of the transformation will be a rotated image with thereference point at the center of the image.
2. The rotated and translated image is then segmented at the reference pointaccording to the tessellation pattern.
3. Triplets for each cell of the segmentation are extracted.
As can be seen in Figure 4.7 an already preprocessed fingerprint enters the pro-cessing pipeline. Several enhancement algorithms are introduced in Chapter 4.1but the whole preprocessing step is done by VeriFinger as mentioned earlier. Thisincludes a contrasts enhancement, image smoothing, binarization, and core pointdetection.
The fingerprint will be translated according to the position of the core so the coreis in the center of the image. Furthermore, the image will be rotated around theorientation of the core therefore reducing the rotation problem to a minimum.
1http://www.neurotechnology.com/verifinger.html
32
4. Pattern Matching Using Co-Sinusoidal Triplets
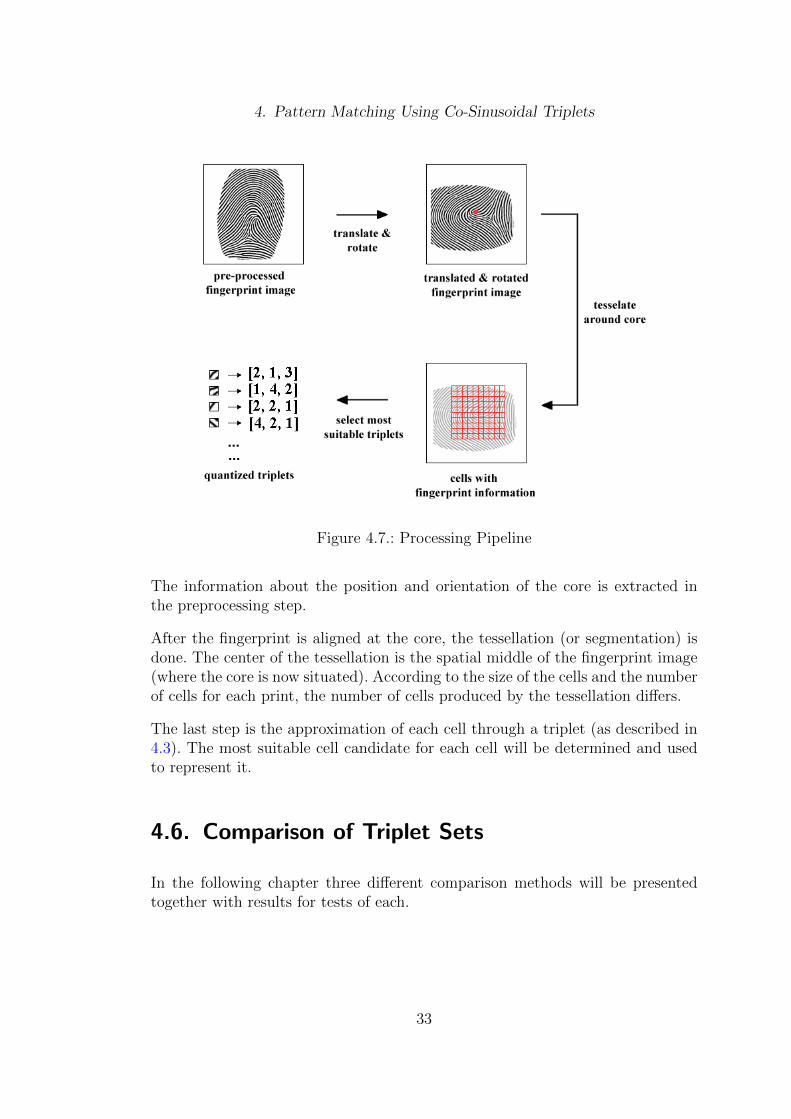
Figure 4.7.: Processing Pipeline
The information about the position and orientation of the core is extracted inthe preprocessing step.
After the fingerprint is aligned at the core, the tessellation (or segmentation) isdone. The center of the tessellation is the spatial middle of the fingerprint image(where the core is now situated). According to the size of the cells and the numberof cells for each print, the number of cells produced by the tessellation differs.
The last step is the approximation of each cell through a triplet (as described in4.3). The most suitable cell candidate for each cell will be determined and usedto represent it.
4.6. Comparison of Triplet Sets
In the following chapter three different comparison methods will be presentedtogether with results for tests of each.
33

4. Pattern Matching Using Co-Sinusoidal Triplets
4.6.1. Direct Comparison Method (DCM)
There are various approaches on how to compare two co-sinusoidal triplet sets.One way is to directly compare one cell of a probe with the corresponding cellof the reference. The distance is calculated by using the difference between eachparameter of each cell of the biometric reference with the ones from the biometricprobe. So for example the angle of propagation θ of the first cell in the first rowof the probe will be compared to the angle of propagation of the first cell in thefirst row of the reference. The difference of these values will be divided by themaximum possible distance for this parameter and then subtracted from 1, so theresult is a similarity score between 0 and 1.
The density of the similarity scores can be plotted for genuine and impostorcomparisons as described in [BCP�03]. The resulting genuine and impostor scoredistribution can be seen in Figure 4.8. The data was raised by using the FVC2000 DB1 a which consists of 800 individual prints where 717 could be processedby VeriFinger. Images which are below the quality threshold of VeriFinger couldnot be processed due to the lack of a reference point. The whole set consists of atotal of 800 fingerprint images from 100 different users with 8 sessions for each.The test was conducted with the cell size of 8x8 and a precision of 5, 4 and 5 bitsfor theta, lambda and gamma as proposed by [Vs06].
When looking at the plot it can be deducted that this approach does not giveenough information to successfully distinguish between an impostor and gen-uine comparison without excluding a high percentage of genuine access attempts.Therefore, it is not possible to specify a threshold that allows for a useful distinc-tion. In order to draw the right conclusion the test has to be widened to a differentrange of precisions, cell sizes, and tessellation but a first deduction suggests touse a different, more complex comparison approach.
4.6.2. Weighted Direct Comparison Method (WCM)
A more complex approach can have different weights depending on the signifi-cance of the parameter and its probability to be affected by noise. According to[Vs06] the significance of each parameter varies very strongly. He showed that forexample the frequency part of a triplet is less substantial than the orientation ofthe cell.
scorepi, jq � Γθ � scoreθpi, jq � Γδ � scoreδpi, jq � Γλ � scoreλpi, jq
34

4. Pattern Matching Using Co-Sinusoidal Triplets
Figure 4.8.: The comparison scores for the first approach. The density on theY-Axis is given as a relative frequency. The similarity score on theX-Axis is given as a value between 0 and 1. The genuine and impostorapproaches are superimposed.
35

4. Pattern Matching Using Co-Sinusoidal Triplets
4.6.3. Neighborhood Comparison Method (NCM)
A typical problem with the direct matching is, that occasionally a cell produces amatch, even though its surrounding neighborhood does not match and vice versa,therefore introducing errors to a homogeneous area (see Figure 4.9). In order toenhance the accuracy of the results further, the neighborhood around each cellis taken into account as well. When considering for example the orientation partθ of the triplet in a vector field, a single misaligned cell will be surrounded bya neighborhood of matching cells. Therefore, a decision about the matching of acell is not solely based on each individual cell, but the cell plus the surroundingN8 neighborhood reducing the error due to the presence of outliers and noise.
Figure 4.9.: Neighborhood problem: Where the homogeneous area in the left iscorrectly captured, an error is introduced in the probe that will leadto a non-match at this position.
As can be seen in Equation 4.3, for the comparison of the angle of propagationθ, the neighborhood at the point θpi, jq is considered and if enough surroundingcells match as well, an extra weight is added to stabilize the decision.
θneighborhoodpi, jq �i�1
u�i�1
j�1
v�j�1
#1 if |θreferencepu, vq � θprobepu, vq| ¤ Γθ1
0 if |θreferencepu, vq � θprobepu, vq| ¡ Γθ1
θscorepi, jq �
$''''&''''%
2 if |θreferencepi, jq � θprobepi, jq| ¤ Γθ2 ^ θneighborhoodpi, jq ¡ Γθ3
1 if |θreferencepi, jq � θprobepi, jq| ¤ Γθ2
0 if θneighborhoodpi, jq ¡ Γθ3
� 1 else(4.3)
Where Γθ1 is the threshold used to determine if each individual neighboring cellmatches, Γθ2 is the threshold used to determine if the currently investigated cellmatches, and Γθ3 is the threshold used to determine if the neighborhood of θ(i,j)as a whole matches.
36

4. Pattern Matching Using Co-Sinusoidal Triplets
The approach to calculate the absolute difference between the neighboring cellsis also applied to the wavelength parameter λ. If enough of the surrounding areamatches, λ(i,j) gets an extra weight (see Equation 4.4).
λneighborhoodpi, jq �i�1
u�i�1
j�1
v�j�1
#1 if |λreferencepu, vq � λprobepu, vq| ¤ Γλ1
0 if |λreferencepu, vq�λprobepu, vq| ¡ Γλ1
λscorepi, jq �
$''''&''''%
2 if |λreferencepi, jq � λprobepi, jq| ¤ Γλ2 ^ λneighborhoodpi, jq ¡ Γλ3
1 if |λreferencepi, jq � λprobepi, jq| ¤ Γλ2
0 if λneighborhoodpi, jq ¡ Γλ3
� 1 else(4.4)
Where Γλ1 is the threshold used to determine if each individual neighboring cellmatches, Γλ2 is the threshold used to determine if the currently investigated cellmatches, and Γλ3 is the threshold used to determine if the neighborhood of λ(i,j)as a whole matches.
According to Vannfalt and Astrom [Vs06], unlike the orientation and frequency,the phase is shifting very rapid which makes absolute differences between cellsunsuitable. This was supported by additional tests (see Figure 4.10 where a di-rect comparison of similar triplets produces reliable results in the orientation andwavelength, but fails for the phase. Instead of the comparison of absolute val-ues, relative differences will be used which are based on the difference of eachneighboring cell to the center.
δneighborhoodpi, jq �i�1
u�i�1
j�1
v�j�1
$''''&''''%
1 if ||δreferencepi, jq � δreferencepu, vq|�
|δprobepi, jq � δprobepu, vq|| ¤ Γδ1
0 if ||δreferencepi, jq � δreferencepu, vq|�
|δprobepi, jq � δprobepu, vq|| ¡ Γδ1
λscorepi, jq �
#1 if δneighborhoodpi, jq ¥ Γδ2
0 if δneighborhoodpi, jq Γδ2(4.5)
37

4. Pattern Matching Using Co-Sinusoidal Triplets
Figure 4.10.: The reference is compared with the probe with direct comparisonfor each parameter. Th differences for each cell are shown in thebottom three images. Where a black cell is equivalent to a smalldifference between the reference and the probe at this position forthe specific parameter.
4.7. Cell Size Benchmark
In order to investigate the influence of the cell size, the False Match Rate (FMR),the False Non Match Rate (FNMR) and the Equal Error Rate (EER) for cell sizesin the range of 5 � 5 pixels up to 18 � 18 pixels were studied. The comparisonalgorithm used is based on the similarity of the cell triplets in the reference andthe probe. Each cell triplet of the probe will be compared to the correspondingcell triplet in the reference.
After conducting a research on the dimension for each quantized co-sinusoidaltriplet, the following results were discovered. The acquisition is based on the
38

4. Pattern Matching Using Co-Sinusoidal Triplets
FVC 2000 database DB1 A. The results show the EERs for each cell size. Thefull evaluation can be found in the Appendix (B). The full evaluation consists ofa score distribution, a Receiver Operating Characteristic (ROC) curve and theEqual Error Rate (EER) for the corresponding cell size over the whole dataset.The analysis was conducted for each individual parameter and thus results inthree score distributions, ROC curves and EERs for each cell size. For comparison,the VeriFinger performance based on minutiae matching and the implementationof the Xu/Veldhuis approach from Martin Olsen are included as well.
For the tests, all images were preprocessed by the VeriFinger SDK 6.0. Differentimage enhancement filters followed by a binarization led to results as those in Fig-ure 4.11. Additionally the orientations and positions of the cores were extractedin order to overcome translation and orientation problems. Images with no corespresent and images that VeriFinger could not process were excluded from thetest. Therefore, not the whole set of the databases could be used. The chosenbit-depths were 5 the angle of propagation θ, 4 for the wavelength λ and 5 forthe phase δ.
Figure 4.11.: Fingerprint Image 1 1.tif of the FVC2002 DB1 A set. The inputimage to VeriFinger can be seen on the left, the output image fromVeriFinger on the right.
As can be seen in Figure 4.12, the cell size that results in the least average errorrate and therefore the optimal cell size for the FVC dataset DB1 a is 16.
4.8. Parameter Evaluation
After selecting the most suitable cell size (in this case 16 x 16) depending onthe resolution of the sensor, the influence of the different parameters on the
39

4. Pattern Matching Using Co-Sinusoidal Triplets
Figure 4.12.: Evaluation of the EERs for different cell sizes. Blue dots indicate θEERs, red dots indicate λ EERs, and green dots indicate δ EERs
unambiguity was investigated. The EERs for each parameter were compared tothe EERs of all different combinations of the parameters. The entire outcome ofthis can be found in Appendix (A).
Parameter Combination EERθ 0.1803λ 0.2379δ 0.1639
θ and λ 0.1946θ and δ 0.1691λ and δ 0.2036θ, λ and δ 0.1886
Table 4.4.: Influence of the three parameters on the equal error rate. The data ofFVC2000 DB1 A was used to conduct the evaluation.
The summary of this examination is shown in table 4.4. The single use of δprovides the lowest equal error rate. The most fruitful combination is between θand δ, where the equal error rate is only slightly above the use of δ alone. The useof two parameters instead of one can help to stabilize the results when employedon different datasets, therefore a combination of θ and δ is suggested.
40

4. Pattern Matching Using Co-Sinusoidal Triplets
Figure 4.13.: The Gauss Bell will increase the weight for values close to the middleand decrease the weight for values further away from it.
4.9. Algorithm Improvements
When running the tests, it was noticeable that the triplet creation algorithm takesa considerable time to process. This is mainly due to the problem that the ISOstandard [fS06b] suggests to compare each cell with all possible cell candidates.The algorithm can be speed up by calculating the cell candidates upfront andkeeping them in the memory for the usage of the triplet creation.
To further improve the speed, the complexity for the searching of the most suitabletriplet can be reduced. This is achieved by calculating a orientation image for thefingerprint like described in [MMKC87]. With the help of the orientation imageit is possible to predict the orientation value of a cell. This is done by averagingall orientations of ridge pixels in a cell. There are two ways how the search forthe optimal triplet can be enhanced. The first option is to simply round theorientation value to the nearest orientation quantization value and then searchthrough all combinations of λ and δ for this orientation. The second option is toround the orientation down and up to the next orientation quantization valuesand look for both orientations through all combinations of λ and δ. This limitsthe search to 21�m�n or 22�m�n instead of 2l�m�n where l, m and n is the bitdepth of θ, λ and δ.
Another conspicuousness when analyzing the results, especially when looking atthe synthetic prints was, that the disparity of two genuine triplet sets increasedwith increasing distance from the core. As a result, the comparison of two genuinetriplet sets can be enhanced by using a Gauss Bell (see Figure 4.13. This leads to astronger weight for values closer to the core and a weaker weight for values at thecorners and borders of the triplet set. However, this will also affect the comparisonof impostors as well and may lead to a higher similarity score for them too. Itneeds to be evaluated whether the effect on the similarity is beneficial for thecomparison.
41

5. Biometric Template Protection
5.1. Introduction
When using a biometric fingerprint system the biometric feature (template) rep-resenting a fingerprint needs to be somehow digitally stored. Traditional systems,like the ones described in chapter 1, store them unencrypted in a database. There-fore, anyone with access to the database is able to gain access to the fingerprintdata stored for each user. The Chaos Computer Club [Clu10] has proven thatwith the help of this data it is possible to create a fake fingerprint which can beused for profiling (for example medical conditions can be extracted) or to gainaccess to the biometrically secured asset. As template forgery being the securityrisk, the involved privacy risk is not just identity theft, but also profiling andnon-cooperative usage. For example an attacker is able to link information ofdifferent databases together with the one piece of information that undeniablyidentifies him as one and the same person, the biometric characteristic. An ex-ample for non-cooperative usage is tracking or surveillance using biometrics (likeit was tested at Mainzer Hauptbahnhof1).
The basic principle of the problem can be compared to a regular login system,like any e-mail system. The password for a user is not stored in plain text in adatabase, but rather as an encrypted hash of the word originally used as the pass-word. By using a mathematical one-way function, like a hash function, a personwith access to the database, may it be an attacker or a legitimate user of thesystem, will not be able to retrieve the password from the hash. This is caused bythe strong causality underlying the hash function, where slightly different inputvalues lead to completely different output values.The requirements for secure biometric templates are defined in [BBGK08], whereofthe main demands are the following:
Protected Templates: It shall be impossible to retrieve or decode the original bio-metric sample from the secure biometric features,
1http://www.heise.de/newsticker/meldung/Foto-Fahndung-im-Mainzer-Hauptbahnhof-169943.
html
42

5. Biometric Template Protection
Revocable: As opposed to passwords, biometric characteristics cannot be changedor altered if necessary due to the nature of being a behavioral or, as in the caseof fingerprints, biological characteristic of a person. Once a biometric template iscompromised it cannot be simply renewed. Therefore, one of the biggest demandsfor biometric templates is the ability to renew or revoke them. When incorporat-ing this requirement, cross reference matching is also suppressed since it allowsdifferent protected templates from the same characteristic, ultimately leading todiversification.
Interoperability: The biometric system shall be based on a predefined format andmethod that should be compatible with a wide range of sensor types and featureextraction components.
The most practical procedure is a two-stage approach where at first a biometricsample is converted to the preexisting biometric feature data formats and thenthe data is converted to a protected template.
In order to prevent the misuse of biometric features, they need to be encrypted tofacilitate security even when retrieved by an attacker. The aim of BTP is to havea similar performance in comparison to traditional biometric systems that do notemploy BTP. The performance does not need to be better and can be slightlyworse, since the gain in security through protected templates can outweigh theloss in performance. The following chapter will introduce the most renownedtemplate protection schemes and describe the Helper Data Scheme, which wasimplemented, in detail .
Why standard cryptography is not enoughAny cryptographic system has to face the threats of disclosure and tampering.Biometric systems however enclose additional threats that endanger the securityof the biometric templates. First and foremost there is the possibility of crossreference matching or cross comparison, which establishes unwanted links be-tween different applications or different databases. As stated above, biometriccharacteristics are unchangeable and cannot be revised. So once compromised,the characteristic is compromised forever. With standard encryption systems, allbiometric characteristics can be recovered if the databases secret key is compro-mised.
The biggest problem of the combination of cryptography and biometrics is thedifference of what cryptographic parameters should be and what biometric tem-plates are. Biometric data is fuzzy, continuous and to a high degree uncertain,whereas cryptographic parameters need to be discrete and demand zero uncer-
43

5. Biometric Template Protection
tainty. Biometric templates are at best similar but never equal. Therefore, therequirements to cryptography for biometric template protection as developed by[BBGK08] are as follows:
Secrecy: Biometric templates shall be stored encrypted in the database withoutthe need to be decrypted for comparison.
Diversifiability: It shall be possible to derive different protected biometric tem-plates from the very same characteristic.
Noise-Robustness: Due to the high noise that occurs when acquiring a biometrictemplate, the cryptographic system needs to allow a certain degree of variationin the comparison.
Privacy Preserving: It shall be impossible to retrieve data about the original bio-metric sample from the binary string representation. Furthermore it shall prohibitleakage conjugation, i.e. typical weak spots of certain biometric characteristicsshall not be revealed.
5.2. Template Protection Schemes
The computation of cryptographic keys from biometric data was first proposedby Bodo [Bod94] in 1998 and evolved over the time according to the recent con-straints. Today there are numerous different template protection schemes in re-search like Pseudo Identities, Cancelable Biometrics, Fuzzy Vault, Fuzzy Extrac-tors, Helper Data Scheme, Fuzzy Commitment, Biometric Encryption, Shield-ing Functions, Secure Syndrome, Biocryptics, Extended PIR or Secure Sketch toname but a few. All of these schemes are represented in a consistent architecture,the ”Reference Architecture for Biometric Template Protection based on PseudoIdentities” [BBGK08].
Reference ArchitectureThe reference architecture as described in [BBGK08] is technology neutral, thus
providing a generic framework for biometric template protection. It is designed tofacilitate the requirements described in Chapter 5.1. The reference architectureis based on so called pseudo identities (PI). PIs are diversifiable, protected iden-tity verification strings. A PI does not reveal any information about the originalbiometric measurement data, the biometric template or the identity of its ownerand does not allow retrieval of such. The PI life cycle can be defined in 4 steps.
44

5. Biometric Template Protection
Creation: First, a biometric capture device retrieves a biometric sample (like afingerprint sensor acquiring a fingerprint image). Then a feature extractor cre-ates biometric features from the captured sample (like QCT). In the last step,a pseudo identity encoder (PIE) generates a pseudo identity and if necessary,additional auxiliary data (AD). The PIE takes supplementary data (SD) as aninput which is used for security enhancement. The SD can be a possession orknowledge-based secret by the user or a system specific secret. The SD is notstored with the template.
As an output of the PIE, the combination of PI and AD is the protected tem-plate. There are three different ways how to store the PI and AD, each providingdifferent benefits and drawbacks. They are: central storage, local storage and hy-brid storage. Central storage keeps both, PI and AD in a database, whereas localstorage keeps both on a token. Hybrid storage keeps either one in the databaseand the other one on a token. The big advantages that arise with hybrid storageare blacklist and audit functionalities as well as easy revocation.
Figure 5.1.: Reference Architecture based on Pseudo Identities. This Figure showsthe PIR approach.
Verification: There are two different classes of verification processes with onlysubtle differences. The Pseudo Identity Recorder (PIR) approach and the Pseudoidentity Verification approach. The PIR approach is based on recreation of a
45

5. Biometric Template Protection
pseudo identity. A new PI* is created by going through the three phases of tripletcreation (biometric sample retrieval, feature extraction, PI encoding). The newlycreated PI* is transferred to a Pseudo Identity Comparator (PIC) which comparesthe PI* to the PI that is stored in the database and if and only if they are exactlyequal, the result of the verification is a match. An overview of this approach canbe found in Figure 5.1.
The Pseudo Identity Verifier (PIV) approach is not based on recreation of a PI*but rather on direct verification of a PI based on a provided recognition sample.The PIV takes the protected template, a sample from a biometric sensor and theSD as an input and provides a verification result. The benefit of this techniqueover the PIR is that no exchange of template information is required when thePIV and the protected template are implemented on the same device.
Expiration: The expiration of a protected template can be caused by differentreasons, where the most prominent one is a compromised template. Apart fromthat, the system may require renewal of the reference from time to time, forexample due to the impact of aging effects (like face recognition).
Revocation: The revocation of a biometric reference is as easy as deleting the PIfrom the database. If the subject is still a legitimate user of the system, a newbiometric reference has to be created (reenrollment).
5.3. Helper Data Scheme
The Helper Data Scheme is based on the reference architecture described in Chap-ter 5.2 and consists of two different phases. In order to be able to use the system,a person has to be enrolled first. The work flow of the Helper Data Scheme canbe seen in Figure 5.2 for the enrollment and verification.
EnrollmentWhen enrolling, the biometric sensor will take multiple samples and the featureextractor will obtain biometric features of constant length for each sample.
In the binarization step, the average feature vector for the whole population ofenrollees µ is calculated and through the case differentiation 5.1 with the createdfeature vectors combined.
QpXpi, jqq �
#0, if Xpi, jq ¤ µ
1, if Xpi, jq ¡ µ(5.1)
46

5. Biometric Template Protection
Xpi, jq is the extracted feature j for the selected user i where j ranges from 1 toM , and M is the number of feature vectors. This will create a bit matrix (QBV)for each feature vector with the information if the current position of the featurevector was above or below the average.The Reliable Bit Selector (RBS) will then select the k most stable features forthis enrollee according to the multiple feature vectors that were extracted. k isthe length of the codeword and the most stable positions for this enrollee. Aposition is called stable if a feature for all sessions is equal. For users with lessthan k reliable components, soft components can be defined, where less than allsessions are equal. These k stable components are called Auxiliary Data 1 (AD1)and can be stored unencrypted in the database. The order of the positions canalso be randomized, making it harder to gather information from AD1. Then theRBS selects the most reliable components, RBV, from the QBV.
Meanwhile, a Random Number Generator (RNG) will create a Secret Binary Vec-tor (SBV). First, a mathematical one-way function (Hash Function) will createan encrypted version of the SBV that will be stored in the database as the PI.Additionally, the SBV will be combined with an Error Correcting Code (ECC)that will be used to add redundancy to correct possible errors which will be in-troduced by the biometric sample. The resulting Code Binary Vector (CBV) willbe selected to have the same length as the RBV. The CBV and RBV will becombined with an XOR and the result will be stored in the database as AuxiliaryData 2 (AD2). Through the combination with an XOR, it is impossible to re-trieve neither the secret in the CBV nor the biometric information of the samplewithout the knowledge of one or the other.
VerificationFor the verification, a new (single) biometric sample is taken from a sensor andthe features will be extracted. In the binarization step of the verification, thereal-valued feature vectors will be compared against the mean value of the wholepopulation and a binarized bit vector QBV’ is passed to the RBS. The RBS ofthe verification will then select the most reliable bits, RBV’, of QBV’ with thehelp of AD1 from the database. Afterwards, the RBV’ will be combined withAD2 from the database with an XOR, leading to CBV’. The ECC will then takecare of potential bit errors which might be introduced in the noisy fingerprintimages. The result of the ECC, SBV’ will then be converted to PI’ through thehash function. If and only if PI’ is consistent with the PI from the database, theresult of the comparison is a match. If PI’ and PI are different in any element, itwill result in a non-match for this access attempt. Additional to the security inthe database, the binary outcome of the comparison has the advantage to preventhill-climbing attacks [MDFAAF�06].
47

5. Biometric Template Protection
Figure 5.2.: Helper Data Scheme Verification and Enrollment
RevocationWhen a protected template is revoked, a new SBV needs to be created and com-bined with one new feature vector. From that, AD2 and PI will be recalculated.Is it not necessary to recalculate the reliable positions for the same biometriccharacteristic.
5.4. Error Correcting Codes
In coding theory, Error Correcting Codes (ECC) are techniques that allow reli-able transfer of data over an error prone medium. ECCs deal with error detectionand error correction, where error detection is limited to the exposure of exist-ing errors, whereas error correction is able to reconstruct the original signal whenerrors occurred. Error detection is indispensable in any form of digital data trans-fer and storage. Error detection and correction is achieved by adding redundantinformation to the useful information which will be used to determine that anerror occurred and, in error correction, where it occurred. Error correction can behandled in two ways, with Automatic Repeat Request (ARQ) or Forward ErrorCorrection (FEC). ARQ is a technique where a detected error in a transmittedmessage leads to retransmission of the whole message. It is therefore also calledbackward error correction. A FEC is present when the sender already adds infor-mation to correct possible errors to a message. Hybrid approaches exist, where
48
5. Biometric Template Protection
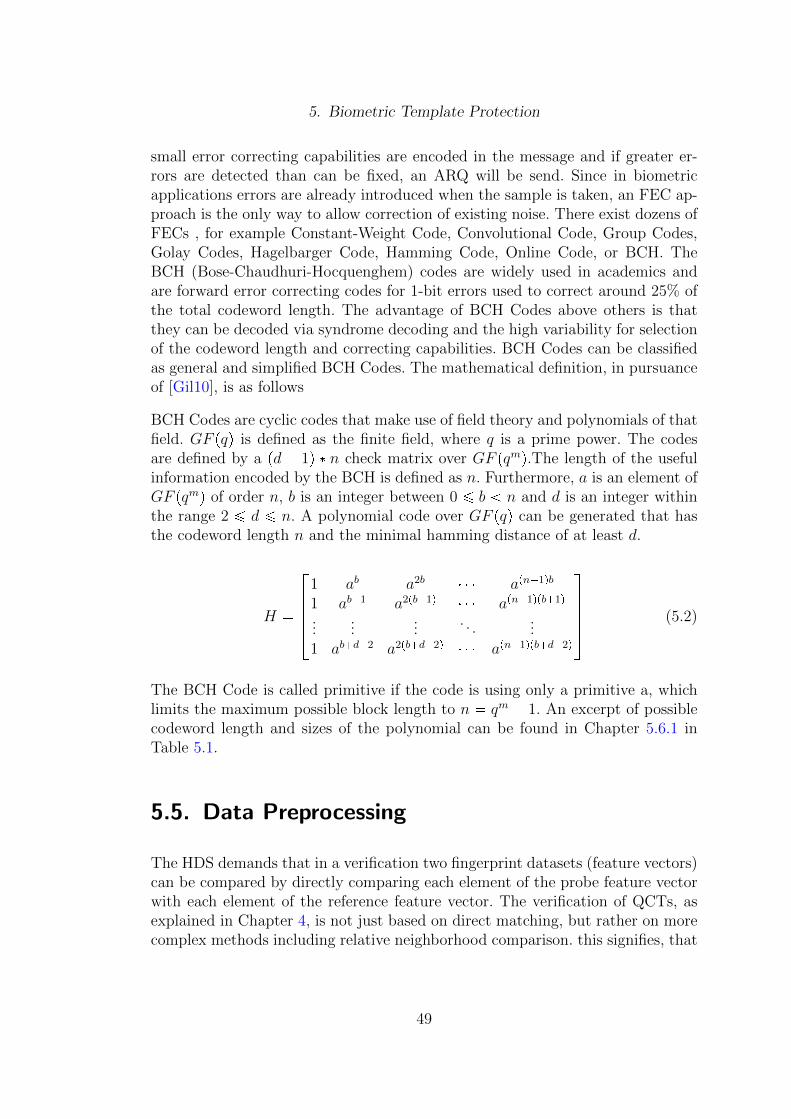
small error correcting capabilities are encoded in the message and if greater er-rors are detected than can be fixed, an ARQ will be send. Since in biometricapplications errors are already introduced when the sample is taken, an FEC ap-proach is the only way to allow correction of existing noise. There exist dozens ofFECs , for example Constant-Weight Code, Convolutional Code, Group Codes,Golay Codes, Hagelbarger Code, Hamming Code, Online Code, or BCH. TheBCH (Bose-Chaudhuri-Hocquenghem) codes are widely used in academics andare forward error correcting codes for 1-bit errors used to correct around 25% ofthe total codeword length. The advantage of BCH Codes above others is thatthey can be decoded via syndrome decoding and the high variability for selectionof the codeword length and correcting capabilities. BCH Codes can be classifiedas general and simplified BCH Codes. The mathematical definition, in pursuanceof [Gil10], is as follows
BCH Codes are cyclic codes that make use of field theory and polynomials of thatfield. GF pqq is defined as the finite field, where q is a prime power. The codesare defined by a pd � 1q � n check matrix over GF pqmq.The length of the usefulinformation encoded by the BCH is defined as n. Furthermore, a is an element ofGF pqmq of order n, b is an integer between 0 ¤ b n and d is an integer withinthe range 2 ¤ d ¤ n. A polynomial code over GF pqq can be generated that hasthe codeword length n and the minimal hamming distance of at least d.
H �
�����
1 ab a2b � � � apn�1qb
1 ab�1 a2pb�1q � � � apn�1qpb�1q
......
.... . .
...1 ab�d�2 a2pb�d�2q � � � apn�1qpb�d�2q
����� (5.2)
The BCH Code is called primitive if the code is using only a primitive a, whichlimits the maximum possible block length to n � qm � 1. An excerpt of possiblecodeword length and sizes of the polynomial can be found in Chapter 5.6.1 inTable 5.1.
5.5. Data Preprocessing
The HDS demands that in a verification two fingerprint datasets (feature vectors)can be compared by directly comparing each element of the probe feature vectorwith each element of the reference feature vector. The verification of QCTs, asexplained in Chapter 4, is not just based on direct matching, but rather on morecomplex methods including relative neighborhood comparison. this signifies, that
49
5. Biometric Template Protection
the values created by the quantized co-sinusoidal triplets method need to be con-verted to a utilizable format that allows direct comparison.
Converting the angle of propagation θ: With the method of co-sinusoidal triplets,the similarity of two angles is restricted. When considering a ridge orientation asa vector, it is clear that the orientation of the vector is irrelevant when approx-imating the cell with the co-sinusoidal triplet. An angle of 180� is equivalent tothe angle of 0�, so is 181� equivalent to 1�, 182� to 2�, and so forth. Additionally,a maximum dissimilarity is reached at 90� and everything above is increasing thesimilarity of the two angles. In order to allow the direct match as described above,the absolute value of the sine of θ is used resulting in: |sinpθq|
In order to consider the surrounding neighborhood, an average of the N8 neigh-borhood around each cell is calculated and used as the value of the center. Thisshould lower the impact of noise and outliers in a homogeneous area and will havea blurring effect on edges. At the borders of the fingerprint where no completeN8 neighborhood is present, only the available neighbours are used to determinethe average. The formula is as follows:
Cell(i,j) �i�1
u�i�1
j�1
v�j�1
θreferencepu, vq{9
Converting the frequency λ: Same as the angle of propagation θ the neighborhoodof λ is calculated as an average of the surrounding N8 neighborhood.
Cell(i,j) �i�1
u�i�1
j�1
v�j�1
λreferencepu, vq{9
Converting the phase δ: Tbe similarity of the phase, as calculated in chapter 4.6.3is dependant on the relative distance of the neighborhood to its center. Thereforethe conversion of the phase is slightly different to the calculation of the calculationof the parameters above.
Cell(i,j) �i�1
u�i�1
j�1
v�j�1
|δreferencepi, jq � δreferencepu, vq|{8
When the three parameters plus the three neighborhoods have been converted,they are concatenated to a single feature vector of the length (number of cells) �6.Further improvements to the HDS input data will be explained in the followingChapter 5.6.
50
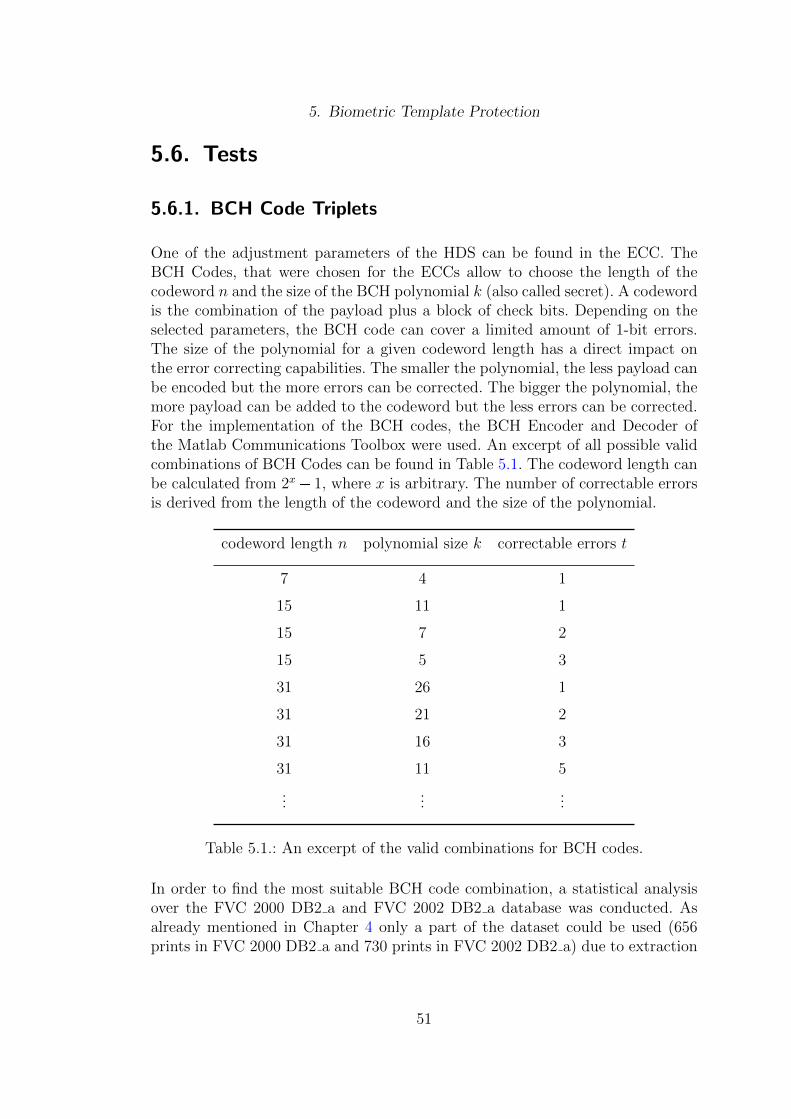
5. Biometric Template Protection
5.6. Tests
5.6.1. BCH Code Triplets
One of the adjustment parameters of the HDS can be found in the ECC. TheBCH Codes, that were chosen for the ECCs allow to choose the length of thecodeword n and the size of the BCH polynomial k (also called secret). A codewordis the combination of the payload plus a block of check bits. Depending on theselected parameters, the BCH code can cover a limited amount of 1-bit errors.The size of the polynomial for a given codeword length has a direct impact onthe error correcting capabilities. The smaller the polynomial, the less payload canbe encoded but the more errors can be corrected. The bigger the polynomial, themore payload can be added to the codeword but the less errors can be corrected.For the implementation of the BCH codes, the BCH Encoder and Decoder ofthe Matlab Communications Toolbox were used. An excerpt of all possible validcombinations of BCH Codes can be found in Table 5.1. The codeword length canbe calculated from 2x� 1, where x is arbitrary. The number of correctable errorsis derived from the length of the codeword and the size of the polynomial.
codeword length n polynomial size k correctable errors t
7 4 1
15 11 1
15 7 2
15 5 3
31 26 1
31 21 2
31 16 3
31 11 5
......
...
Table 5.1.: An excerpt of the valid combinations for BCH codes.
In order to find the most suitable BCH code combination, a statistical analysisover the FVC 2000 DB2 a and FVC 2002 DB2 a database was conducted. Asalready mentioned in Chapter 4 only a part of the dataset could be used (656prints in FVC 2000 DB2 a and 730 prints in FVC 2002 DB2 a) due to extraction
51
5. Biometric Template Protection
problems of VeriFinger. This lead to roughly 7 sessions per user (originally 8). Allusers were enrolled with the HDS approach where 5 sessions per user have beenused for the statistical analysis of the stable components and the remaining 2sessions were used for identification. All feature vectors have been encoded (andlater decoded) with all possible combinations of BCH codes from a codewordlength of 7 up to 511. The results of this test can be seen in Figure C.1.
It was observed, that the majority (90.16%) of the scatter plot is located at they-axis which is equivalent to a FMR of 0. Since the FMR is a system criticalcriterion, it is desirable to have it as low as possible. When searching for a goodcodeword length, the assumption is made that the best codewords will be foundwhere the FMR is 0. The codeword lengths with the lowest FNMRs for the fixedFMR of 0 were retrieved for each cell size. The codewords that led to the threelowest FNMRs for each cellsize were selected and plotted against each other as canbe seen in Figure C.2. The most stable codeword length for any given cell size is63. This codeword length was present in 43% of all the lowest three FNMR values.Of course the worst case has to be observed as well. Thus, the three codewordlengths that produced the highest FMRs for each cell size were examined andthe results can be seen in Figure C.3. The results with the worst FMRs consistpredominantly of low codeword lengths (66.66% for codeword lengths 7 and 15).
Of course the codeword length itself is not the only parameter of the BCH code.The size of the polynomial also has to be considered and therefore the resultswere further investigated. As before, the polynomial sizes that led to the lowestFNMRs with the FMR fixed at 0 were considered to provide the best results.They were also calculated for all cellsizes between 1 and 14. The best resultsare shown in Figure C.4 and the worst in Figure C.5. Polynomials of small sizeproved to be unfeasible, which is expected since they do not manage to storeenough unique information about a fingerprint. It was observed over the wholefield of BCH codeword lengths, that polynomial sizes ¤ 5 are accountable foraround 66% of the worst FMR to FNMR rates. All of the three worst results foreach cellsize had a polynomial size of ¤ 10. The polynomial sizes that caused thebest results were between 15 and 18, which were responsible for 66.66% of thebest results.
5.6.2. N-Tuple Combination
In order to find the parameters that are most feasible, all combinations of thethree QCT parameters as well as their neighborhoods were investigated. This wayit is possible to examine which parameters are stable and which parameters havea high fluctuation. The HDS automatically selects parameters with the lowest
52
5. Biometric Template Protection
intra-class variability and the highest inter-class variability as part of the biomet-ric template. This means that a position in the feature vector that is measuredwith the same amplitude on different sessions of the same user and at the sametime has a high variance between different users is preferential to a feature thatdeviates from this definition. The position is considered stable if fulfills the abovedefinition.
In order to evaluate the significance of the different parameters, θ, λ, δ, the θneighborhood, the λ neighborhood, and the δ neighborhood were concatenatedand used as a single feature vector. After the HDS selected the most suitablepositions in the feature vector, the positions can be projected back to the originalparameters. As can be seen in the result of this test in Figure C.6, the θ parameterproved to be most reliable. In fact, when looking at the exact numbers the twomost stable positions are without exception always θ parameters. As explainedin Chapter 4 the delta parameter is unsteady and is hence the least stable. Thefact that the neighborhoods cover an area and are combined to a single value inthe preprocessing step makes them an averaging function for the surroundings ofa cell. Naturally, an averaging function projects a wide range to a narrow rangewhich leads to a lower inter-class variability of the neighborhood parameters. Thisexplains why the neighborhoods are not considered the most stable positions.
Two practical problems arise with these results that need to be considered. First,when the HDS is scanning for stable positions and finds two equally stable po-sitions, the one that is found first in the feature vector will be considered morestable. For example all positions for θ have the same maximum possible intra-class variability (between 0 and 1), so it is very likely that two or more equallystable positions exist. This problem is existent for all parameter groups. As aresult, the order of the parameters in the feature vector is important.
The second problem is, that positions that do not contain any fingerprint in-formation (areas without ridges), are considered very stable since they have themaximum intra-class variability and typically a high inter-class variability. In or-der to cope with this problem, the helper data will be rearranged after the HDSselected the stable positions. Positions that do not contain fingerprint informationwill be pushed back to the end of the helper data, thus making them the leaststable ones. The results of this is shown in Figure C.7. As can be seen, previouslystable positions of θ and λ moved to the end, improving the least stable θ and λvalues by more than 100%.
53
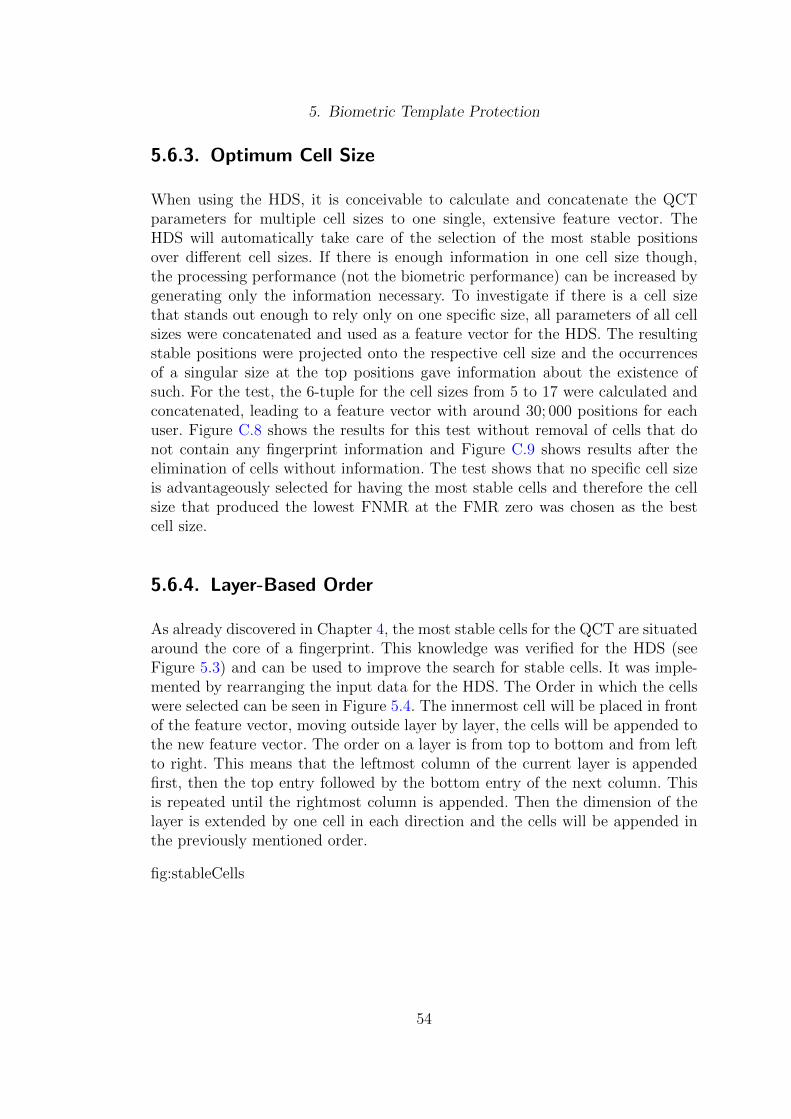
5. Biometric Template Protection
5.6.3. Optimum Cell Size
When using the HDS, it is conceivable to calculate and concatenate the QCTparameters for multiple cell sizes to one single, extensive feature vector. TheHDS will automatically take care of the selection of the most stable positionsover different cell sizes. If there is enough information in one cell size though,the processing performance (not the biometric performance) can be increased bygenerating only the information necessary. To investigate if there is a cell sizethat stands out enough to rely only on one specific size, all parameters of all cellsizes were concatenated and used as a feature vector for the HDS. The resultingstable positions were projected onto the respective cell size and the occurrencesof a singular size at the top positions gave information about the existence ofsuch. For the test, the 6-tuple for the cell sizes from 5 to 17 were calculated andconcatenated, leading to a feature vector with around 30; 000 positions for eachuser. Figure C.8 shows the results for this test without removal of cells that donot contain any fingerprint information and Figure C.9 shows results after theelimination of cells without information. The test shows that no specific cell sizeis advantageously selected for having the most stable cells and therefore the cellsize that produced the lowest FNMR at the FMR zero was chosen as the bestcell size.
5.6.4. Layer-Based Order
As already discovered in Chapter 4, the most stable cells for the QCT are situatedaround the core of a fingerprint. This knowledge was verified for the HDS (seeFigure 5.3) and can be used to improve the search for stable cells. It was imple-mented by rearranging the input data for the HDS. The Order in which the cellswere selected can be seen in Figure 5.4. The innermost cell will be placed in frontof the feature vector, moving outside layer by layer, the cells will be appended tothe new feature vector. The order on a layer is from top to bottom and from leftto right. This means that the leftmost column of the current layer is appendedfirst, then the top entry followed by the bottom entry of the next column. Thisis repeated until the rightmost column is appended. Then the dimension of thelayer is extended by one cell in each direction and the cells will be appended inthe previously mentioned order.
fig:stableCells
54
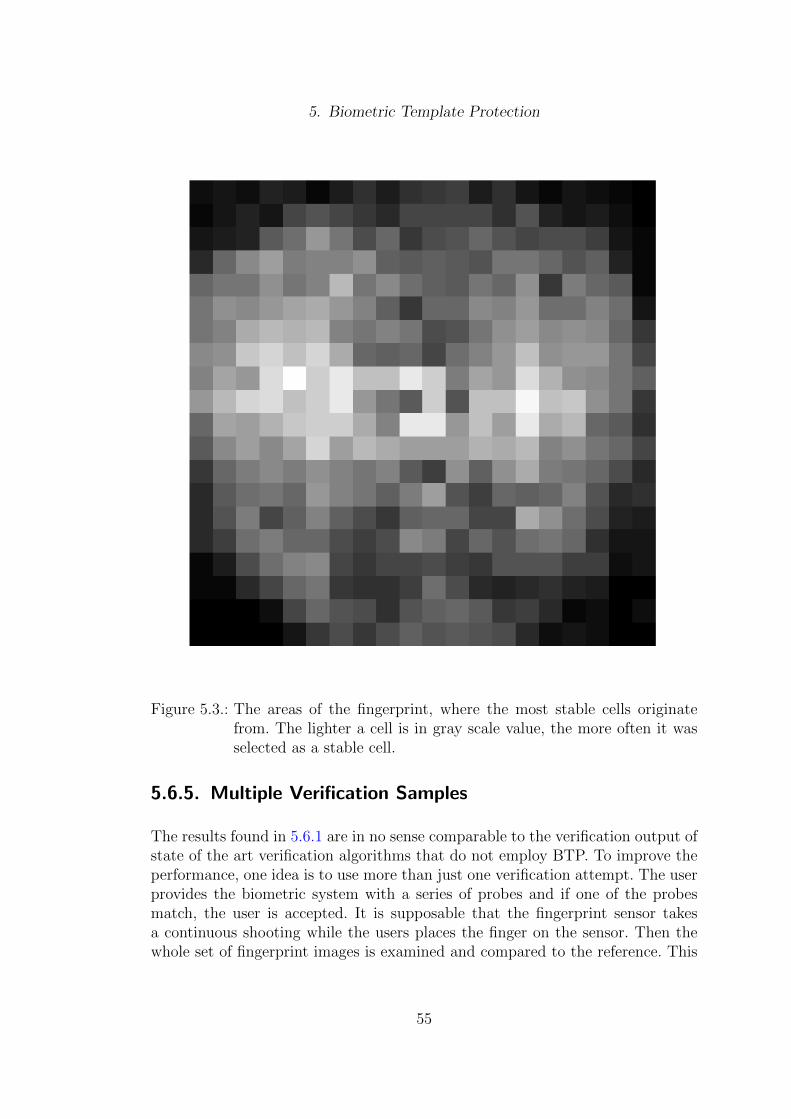
5. Biometric Template Protection
Figure 5.3.: The areas of the fingerprint, where the most stable cells originatefrom. The lighter a cell is in gray scale value, the more often it wasselected as a stable cell.
5.6.5. Multiple Verification Samples
The results found in 5.6.1 are in no sense comparable to the verification output ofstate of the art verification algorithms that do not employ BTP. To improve theperformance, one idea is to use more than just one verification attempt. The userprovides the biometric system with a series of probes and if one of the probesmatch, the user is accepted. It is supposable that the fingerprint sensor takesa continuous shooting while the users places the finger on the sensor. Then thewhole set of fingerprint images is examined and compared to the reference. This
55

5. Biometric Template Protection
Figure 5.4.: Rearranging the QCT, the cells in the middle will be copied to thefirst positions of the feature vector, going layer by layer to the outsidecells. The order is from top to bottom and from left to right.
was tested by using 3 or 5 of the 7 sessions per user for enrollment and later use 4or 2 of the sessions for one verification. This allows a maximum performance boostby 100% of the prior accepted users (when 5 sessions were used for enrollment).Therefore, if the FNMR is at around 70%, it can be lowered to a maximum of40% FNMR when using 2 sessions for enrollment. In worst case there will be nochange in the results at all. A thing that should be kept in mind is, that thisis only valid if the FMR is exactly zero. Otherwise it will increase all impostorattempts, leading to a much higher FMR. Since the selected BCH Code producesresults for both FVC databases (FVC2000 DB2 a and FVC2002 DB2 a) with zeroFMR, this is a sound approach. The results (see Figure C.10 and Figure C.11)illustrate the decrease of the minimum FNMR from 68.83% to only 62.34%.
56
6. Conclusion
The QCT approach was implemented and the biometric performance was com-pared to state of the art system that do not employ BTP (namely NeuroTechnol-ogy’s VeriFinger software and Spectral Minutiae). Different comparison methodswere implemented to further deepen the understanding of biometric fingerprintverification and the necessities of a successful fingerprint verification system. Thefeatures produced by the QCT were converted to a fixed-length feature vectorwhich is mandatory to employ BTP. The HDS was implemented as the BTPsystem and the results investigated and documented. Since there was only verylimited literature available on the QCT approach, the requirements had to be es-tablished and tested first. The biometric performance of the HDS is significantlydependent on solid fixed-length feature vectors. The biometric performance ofthe commercial software VeriFinger, which is based on the traditional minutiaedetection (see Chapter 2.1), could not be reached in the tests with the QCT. Theresults were slightly below the spectral minutiae approach (refer to Appendix B)which were a solid foundation for the HDS. The challenges that arise with theHDS lie in the trivial comparison method for two feature vectors. The more com-plex comparison logic that could be used in the QCT verification could not besimply projected onto unidimensional feature vectors. All improvement methodsthat were implemented (see Chapter 5.6 for more details) did not lead to a betterbiometric performance which can compete with VeriFinger or the Spectral Minu-tiae method. Nevertheless, the combination of QCT and HDS has the potentialto perform at an acceptable rate, based on the analysis in this thesis. Furtherimprovements as mentioned in Chapter 7 can help to increase the biometric per-formance to a level at which it is comparable to commercial products which donot utilize BTP.
57
7. Further Steps
There are are numerous possibilities that need to be investigated in order to com-pletely explore the topic of QCT in combination with the HDS. The preprocessingof the QCT for the HDS as explained in Chapter 5.5 is a crucial step and hasa considerable impact on the biometric performance of the whole BTP system.Therefore, one of the most promising sections to review and improve is the pre-processing of the QCT. Different combination possibilities of the parameters canbe employed for example to the δ parameter that performed especially for duringQCT comparisons but performed poor for the HDS. Furthermore, the parameterscan receive a different weight, depending on their position of the fingerprint bystretching the original co-domain.
Another idea is to use different cell sizes on different regions of the fingerprint.For example on areas that are known to produce very stable results (for examplearound the core) the grid could be refined, whereas the outer regions can have arougher approximation allowing to cover for more noise. Also different cell sizescould be used for the different parameters. If there is a significant difference in theperformance of singular parameters in one cell size over another, one parametercould be used as a feature from a different cell size, then another.
Another idea is to use a different tessellation of the fingerprint. Huppmann sug-gested in his thesis [Hup07] about Gabor Filters a circular tessellation (see Figure7.1). This approach requires a more sophisticated and complex triplet selectionprocess but instead of the suggested brute force triplet selection, the values couldbe mathematically derived from the ridges in the cells with the Hough transform[Hou59].
More research can be done in the statistics part of the HDS. The amount of finger-prints necessary to determine the stable positions is not specifically defined andshould be further investigated. The maximum possible number of fingerprintsthat could be used for enrollment was 5 and it is not certain that it providesenough information for the statistics module to choose the most stable positions.
Different ECCs then the BCH can be used to encode and decode that protected
58

7. Further Steps
Figure 7.1.: A circular tessellation automatically provides a finer grid for areasaround the reference point.
data. The BCH code can only handle 1-bit errors well. If fingerprints should bepredominantly error prone to block errors, the BCH code will fail to cover thenoise. At last, the co-sinusoidal function itself could be improved or extended tospecifically generate features that work well together with the HDS.
59

Bibliography
[AF81] E. Alparslan and M. Fuatince. Image enhancement by local his-togram stretching. IEEE Transactions on Systems Man and Cy-bernetics, 11:376–385, 1981.
[AJ07] S. Choomchuay A. Julasayvake. An algorithm for fingerprint corepoint detection. Proc. of Int. Symp. on Signal Processing and itsApplications 2007, 2007.
[BBGK08] J. Breebaart, C. Busch, J. Grave, and E. Kindt. A ReferenceArchitecture for Biometric Template Protection based on PseudoIdentities. Proc. BIOSIG, pages 25–38, 2008.
[BCP�03] Ruud Bolle, Jonathan Connell, Sharanthchandra Pankanti,Nalini Ratha, and Andrew Senior. Guide to Biometrics (SpringerProfessional Computing). Springer, 1 edition, 11 2003.
[Bio10] BioLab. FVC2002 Algorithm PA15 results. http://bias.csr.
unibo.it/fvc2002/participants/PA15.asp, July 2010.
[Bod94] A. Bodo. Method for producing a digital signature with aid of abiometric feature. German Patent, 42(43):908, 1994.
[Bra89] R.N. Bracewell. The fourier transform. Scientific American,260(6):86–95, 1989.
[BVG�00] A. M. Bazen, G. T. B. Verwaaijen, S. H. Gerez, L. P. J. Veelen-turf, and B. J. van der Zwaag. A correlation-based fingerprint ver-ification system. In 11th Annual Workshop on Circuits Systemsand Signal Processing (ProRISC), Veldhoven, the Netherlands,pages 205–213, Netherlands, November 2000. STW TechnologyFoundation.
[Cen10] Identity Theft Resource Center. Identity Theft Resource Cen-ter Breaches 2009. http://www.idtheftcenter.org/artman2/
publish/lib_survey/Breaches_2009.shtml, July 2010.
60

Bibliography
[Clu10] Chaos Computer Club. Wie konnen Fingerabdrucke nachgebildetwerden? http://www.ccc.de/de/campaigns/aktivitaeten_
biometrie/fingerabdruck_kopieren, July 2010.
[fS06a] International Organization for Standardization. Biometric datainterchange formats, 2006.
[fS06b] International Organization for Standardization. Biometric datainterchange formats - part 3: Finger pattern spectral data, 2006.
[fS08] International Organization for Standardization. Harmonized Bio-metric Vocabulary. International Organization for Standardiza-tion, August 2008.
[Gal92] S.F. Galton. Finger prints. Macmillan and Co., 1892.
[Gil10] John Gill. EE 387 Notes #7 - BCH and Reed-Solomon codes:definitions and properties. http://www.stanford.edu/class/
ee387/handouts/notes7.pdf, July 2010.
[Gre59] Ulf Grenander. Probability and statistics: the Harald Cramer vol-ume. Almqvist and Wiksell, 1959.
[HJ99] L. Hong and A. Jain. Classification of fingerprint images. InProceedings of the Scandinavian Conference on Image Analysis,volume 2, pages 665–672, 1999.
[HJ04] L. Hong and A. Jain. Fingerprint enhancement. Automatic Fin-gerprint Recognition Systems, pages 127–143, 2004.
[Hou59] P.V.C. Hough. Machine analysis of bubble chamber pictures. InInternational Conference on High Energy Accelerators and In-strumentation, volume 73, 1959.
[Hup07] Markus Huppmann. Fingerprint Recognition by Matching of Ga-bor Filter-based Patterns. Technische Universitat Munchen, 2007.
[JHPB97a] AK Jain, L. Hong, S. Pankanti, and R. Bolle. An identity-authentication system using fingerprints. Proceedings of theIEEE, 85(9):1365–1388, 1997.
[JHPB97b] A.K. Jain, L. Hong, S. Pankanti, and R. Bolle. An identity-authentication system using fingerprints. Proceedings of theIEEE, 85(9):1365–1388, 1997.
61

Bibliography
[MDFAAF�06] M. Martinez-Diaz, J. Fierrez-Aguilar, F. Alonso-Fernandez,J. Ortega-Garcia, and JA Siguenza. Hill-climbing and brute-forceattacks on biometric systems: A case study in match-on-card fin-gerprint verification. Proc. IEEE of ICCST, page 151–159, 2006.
[MMKC87] BM Mehtre, NN Murthy, S. Kapoor, and B. Chatterjee. Segmen-tation of fingerprint images using the directional image. PatternRecognition, 20(4):429–435, 1987.
[Nus82] HJ Nussbaumer. Fast Fourier Transform and Convolution Algo-rithms. Springer Series in Information Sciences, 2, 1982.
[PPJ01] Sharath Pankanti, Salil Prabhakar, and Anil K. Jain. On the indi-viduality of fingerprints. IEEE Transactions on Pattern Analysisand Machine Intelligence, 24:1010–1025, 2001.
[Tha03] R. Thai. Fingerprint image enhancement and minutiae extrac-tion. The University of Western Australia, 2003.
[Vs06] A. Vannfalt and A. Astrom. Fingerprint Spectral Matching –Quantized Co-Sinusoidal Triplets. Chalmers University of Tech-nology, 2006.
[Win76] S. Winograd. On computing the discrete Fourier transform. Pro-ceedings of the National Academy of Sciences of the United Statesof America, 73(4):1005, 1976.
[YLJF03] J. Yang, L. Liu, T. Jiang, and Y. Fan. A modified Gabor fil-ter design method for fingerprint image enhancement. PatternRecognition Letters, 24(12):1805–1817, 2003.
62

8. Glossary
Enrollment: The registration in a biometric system. During the enrollment, areference of the biometric data will be stored that is necessary for later authen-tication.Verification: Verification is the comparison of a person with who he claims tobe.Identification: Identification is the ability to recognize an individual amongstall enrolled subjects of a system.Protected Templates: biometric data that is secured against exploitation by aBTP system.BTP: Biometric Template ProtectionPI: Pseudo IdentifierAD: Auxiliary DataSD: Supplementary DataPIE: Pseudo Identity EncoderQCT: Quantized Co-Sinusoidal TripletsPIC: Pseudo Identity ComparatorPIV: Pseudo Identity VerifierPIR: Pseudo Identity RecorderFTC: Failure-to-CaptureFTX: Failure-to-ExtractFTE: Failure-to-EnrollFTA: Failure-to-AcquireFMR: False-Match-RateFAR: False-Acceptance-RateFNMR: False-Non-Match-RateFRR: False-Reject-RateECC: Equal Error RateROC: Receiver Operating CharacteristicFEC: Forward Error CorrectionARQ: Automated Resend RequestBCH: A group of cyclic, error correcting block codes named after their discov-erers Bose, Chaudhuri and Hocquenghem
63

9. Appendix
64

A. Parameter Evaluation
65
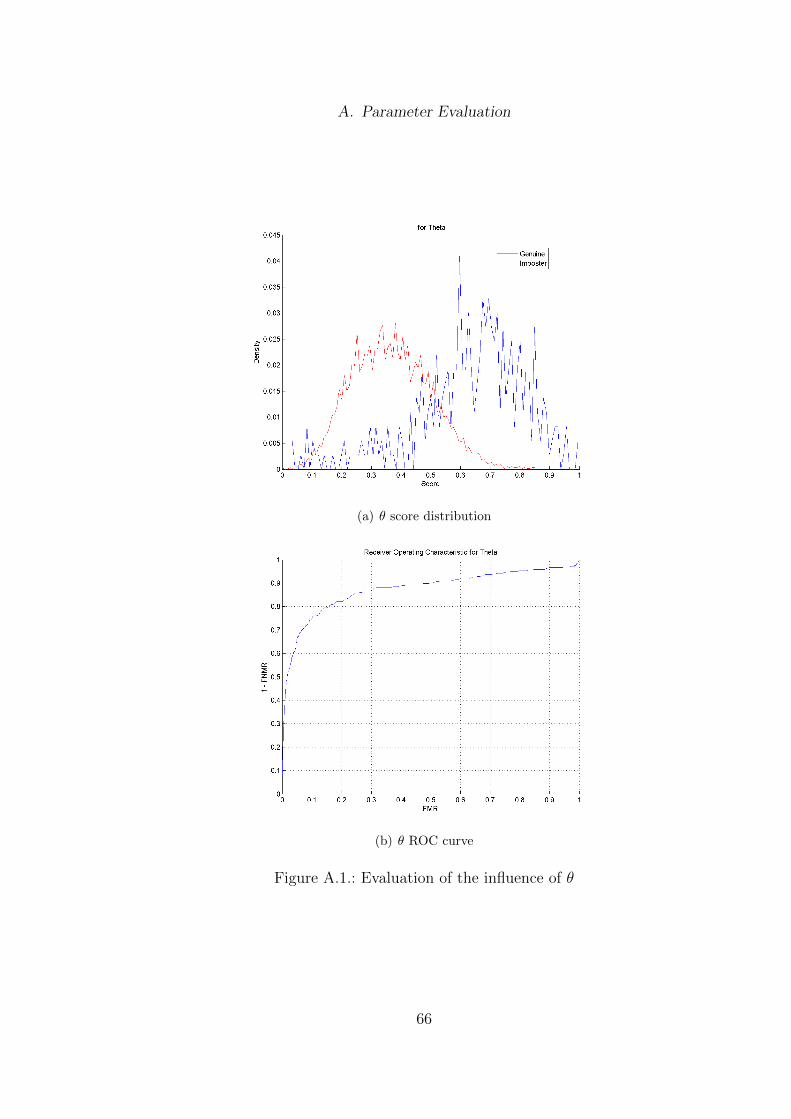
A. Parameter Evaluation
(a) θ score distribution
(b) θ ROC curve
Figure A.1.: Evaluation of the influence of θ
66

A. Parameter Evaluation
(a) λ score distribution
(b) λ ROC curve
Figure A.2.: Evaluation of the influence of λ
67

A. Parameter Evaluation
(a) δ score distribution
(b) δ ROC curve
Figure A.3.: Evaluation of the influence of δ
68
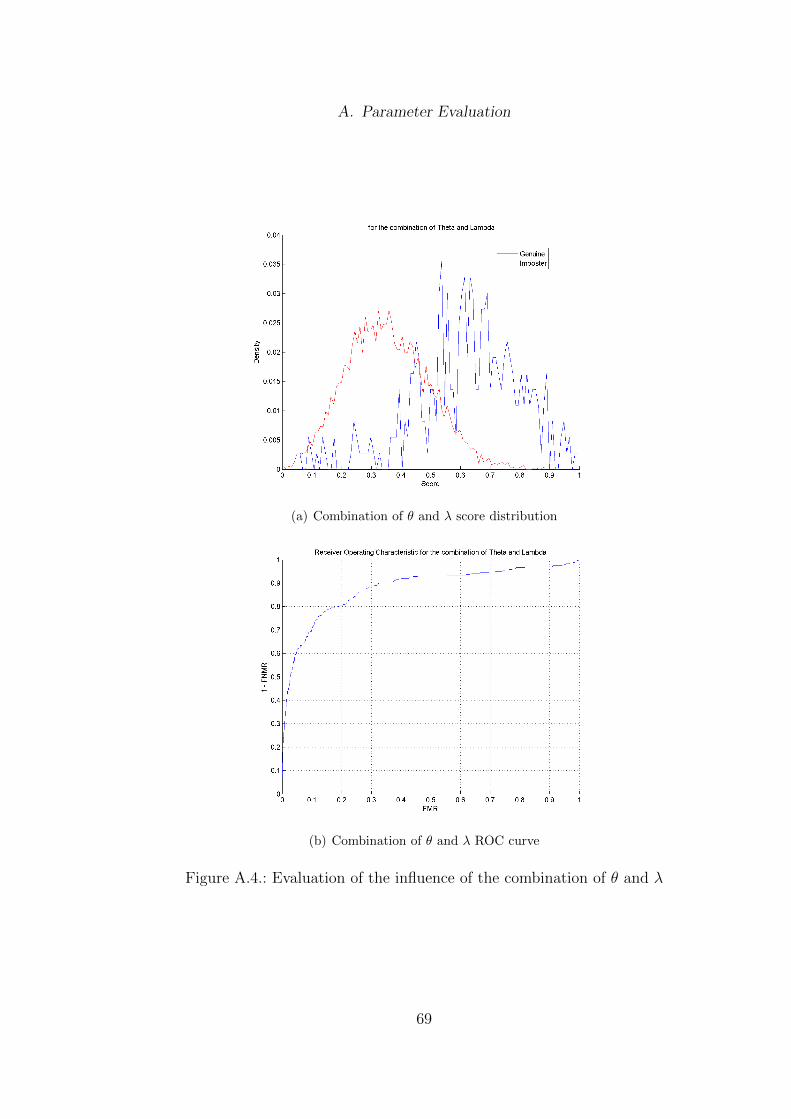
A. Parameter Evaluation
(a) Combination of θ and λ score distribution
(b) Combination of θ and λ ROC curve
Figure A.4.: Evaluation of the influence of the combination of θ and λ
69

A. Parameter Evaluation
(a) Combination of θ and δ score distribution
(b) Combination of θ and δ ROC curve
Figure A.5.: Evaluation of the influence of the combination of θ and δ
70

A. Parameter Evaluation
(a) Combination of λ and δ score distribution
(b) Combination of λ and δ ROC curve
Figure A.6.: Evaluation of the influence of the combination of λ and δ
71

A. Parameter Evaluation
(a) Combination of θ, λ and δ score distribution
(b) Combination of θ, λ and δ ROC curve
Figure A.7.: Evaluation of the influence of the combination of θ, λ and δ
72

B. Cellsize Evaluation
73

B. Cellsize Evaluation
Figure B.1.: The evaluation of the VeriFinger software as well as the Xu/Veldhuisapproach
Figure B.2.: Score distribution, ROC curve and EERs for the cell size 5 x 5
74

B. Cellsize Evaluation
Figure B.3.: Score distribution, ROC curve and EERs for the cell size 6 x 6
Figure B.4.: Score distribution, ROC curve and EERs for the cell size 7 x 7
75
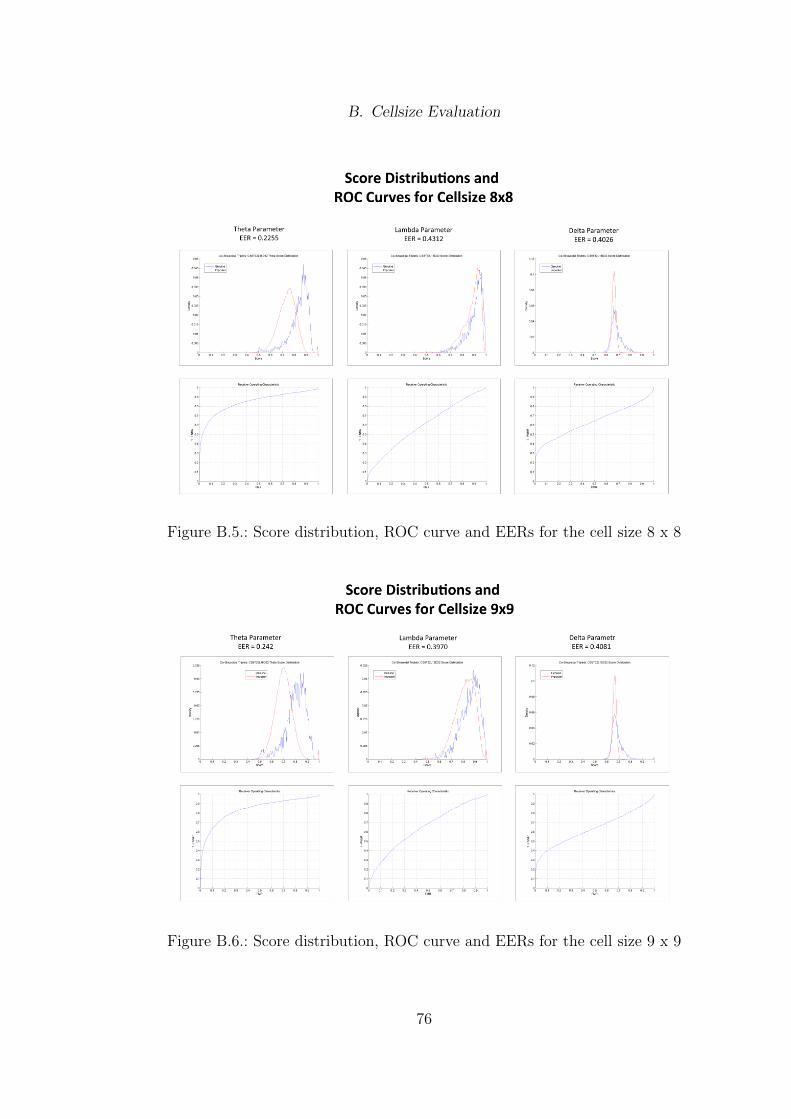
B. Cellsize Evaluation
Figure B.5.: Score distribution, ROC curve and EERs for the cell size 8 x 8
Figure B.6.: Score distribution, ROC curve and EERs for the cell size 9 x 9
76

B. Cellsize Evaluation
Figure B.7.: Score distribution, ROC curve and EERs for the cell size 10 x 10
Figure B.8.: Score distribution, ROC curve and EERs for the cell size 11 x 11
77

B. Cellsize Evaluation
Figure B.9.: Score distribution, ROC curve and EERs for the cell size 12 x 12
Figure B.10.: Score distribution, ROC curve and EERs for the cell size 13 x 13
78

B. Cellsize Evaluation
Figure B.11.: Score distribution, ROC curve and EERs for the cell size 14 x 14
Figure B.12.: Score distribution, ROC curve and EERs for the cell size 15 x 15
79

B. Cellsize Evaluation
Figure B.13.: Score distribution, ROC curve and EERs for the cell size 16 x 16
Figure B.14.: Score distribution, ROC curve and EERs for the cell size 17 x 17
80

B. Cellsize Evaluation
Figure B.15.: Score distribution, ROC curve and EERs for the cell size 18 x 18
81

C. HDS Test Results
Figure C.1.: Codeword Evaluation for the BCH ECC. The analysis was con-ducted for different cell sizes and BCH codeword lengths of7, 15, 31, 63, 127, 255, 511 and all possible error correcting capabili-ties of those parameters.
82

C. HDS Test Results
Figure C.2.: The three codeword lengths for each individual cell size that pro-duced the best FNMRs.
83

C. HDS Test Results
Figure C.3.: The three codeword lengths for each individual cell size with theworst FMRs
84

C. HDS Test Results
Figure C.4.: The three polynomial sizes for each individual cell size that producedthe best FNMRs.
85

C. HDS Test Results
Figure C.5.: The three polynomial sizes for each individual cell size with the worstFMRs
86
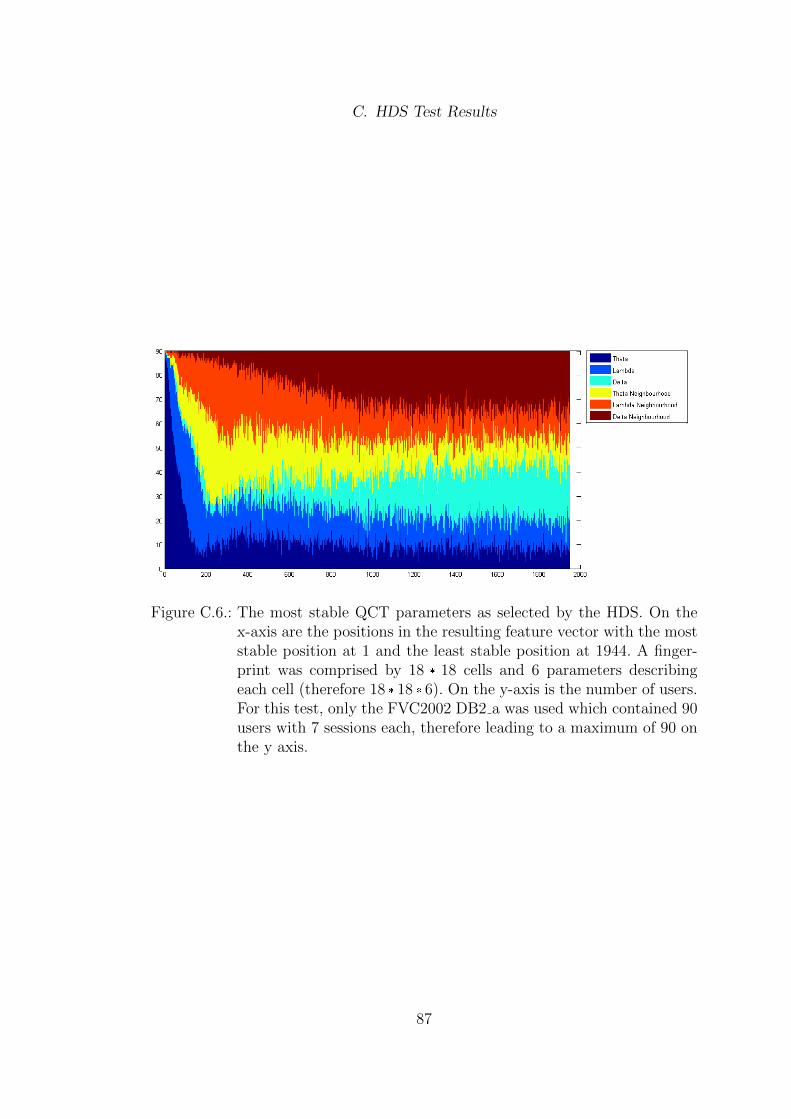
C. HDS Test Results
Figure C.6.: The most stable QCT parameters as selected by the HDS. On thex-axis are the positions in the resulting feature vector with the moststable position at 1 and the least stable position at 1944. A finger-print was comprised by 18 � 18 cells and 6 parameters describingeach cell (therefore 18 � 18 � 6). On the y-axis is the number of users.For this test, only the FVC2002 DB2 a was used which contained 90users with 7 sessions each, therefore leading to a maximum of 90 onthe y axis.
87

C. HDS Test Results
Figure C.7.: The most stable QCT parameters as selected by the HDS. The areaswith no ridge information were pushed back to the end of the featurevector. On the x-axis are the positions in the resulting feature vectorwith the most stable position at 1 and the least stable position at1944. A fingerprint was comprised by 18 � 18 cells and 6 parametersdescribing each cell (therefore 18�18�6). On the y-axis is the numberof users. For this test, only the FVC2002 DB2 a was used whichcontained 90 users.
88
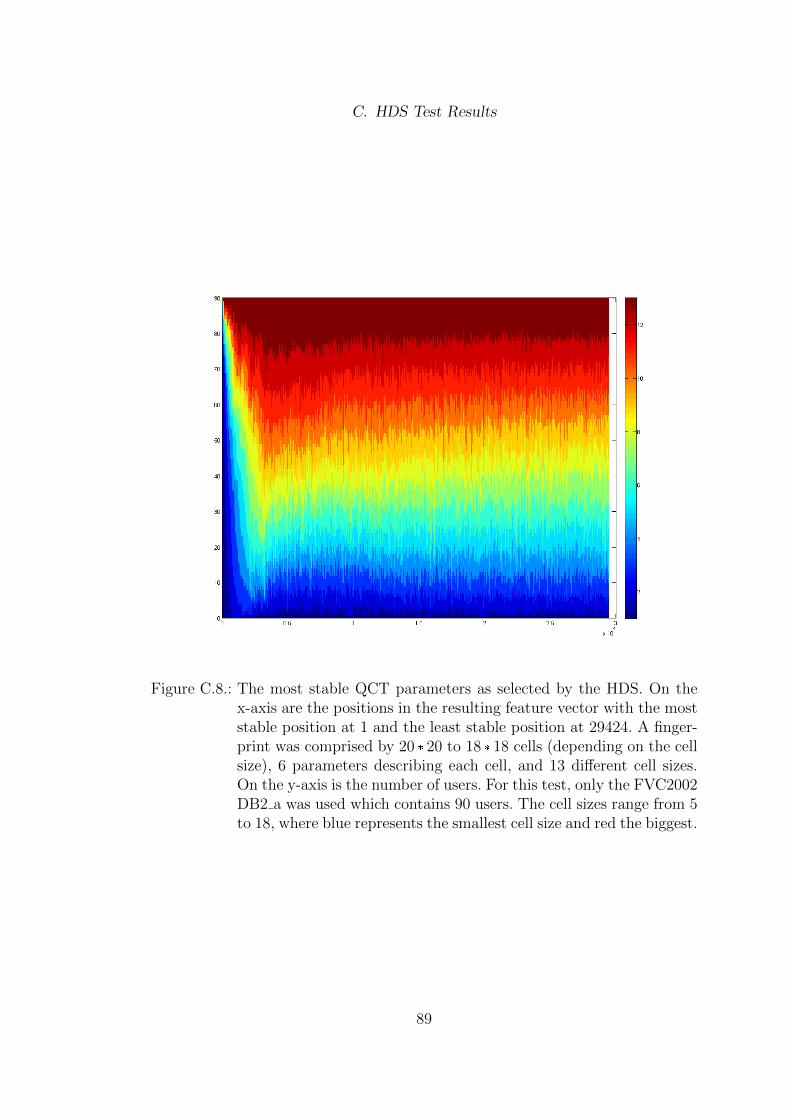
C. HDS Test Results
Figure C.8.: The most stable QCT parameters as selected by the HDS. On thex-axis are the positions in the resulting feature vector with the moststable position at 1 and the least stable position at 29424. A finger-print was comprised by 20 � 20 to 18 � 18 cells (depending on the cellsize), 6 parameters describing each cell, and 13 different cell sizes.On the y-axis is the number of users. For this test, only the FVC2002DB2 a was used which contains 90 users. The cell sizes range from 5to 18, where blue represents the smallest cell size and red the biggest.
89

C. HDS Test Results
Figure C.9.: The most stable QCT parameters as selected by the HDS. The areaswith no ridge information were pushed back to the end of the fea-ture vector. On the x-axis are the positions in the resulting featurevector with the most stable position at 1 and the least stable posi-tion at 29424. A fingerprint was comprised by 20 � 20 to 18 � 18 cells(depending on the cell size), 6 parameters describing each cell, and13 different cell sizes. On the y-axis is the number of users. For thistest, only the FVC2002 DB2 a was used which contained 90 users.The cell sizes range from 5 to 18, where blue represents the smallestcell size and red the biggest.
90

C. HDS Test Results
Figure C.10.: The verification outcome of all cell sizes with all BCH codewordcombinations. Only one probe was used for the verification.
91

C. HDS Test Results
Figure C.11.: The verification outcome of all cell sizes with all BCH code-word combinations. Multiple (4 and 2) samples were used for theverification.
92