flare monitoring using visr technology
TRANSCRIPT

Spring 2018
Flare Monitoring
Using VISR Technology
Instructor: Yousheng Zeng, PhD, PE
Providence Photonics
Baton Rouge, Louisiana

OUTLINE
Introduction
Working principle of Video Imaging Spectral Radiometer (VISR) as it applies to flare monitoring
Features of VISR flare monitor
Validation of VISR flare monitoring technology
Flare monitoring regulations
Topics on VISR flare monitoring applications▪ For fixed installations
▪ For short-term flare studies
▪ For methane emission quantification
Questions and answers
2

INTRODUCTION
3

INTRODUCTION
Introduction to class attendees
Historical background
▪ Flare as a safety device
▪ Evolved into a dual-purpose device: safety and emissions control
▪ 1986: EPA promulgated emission standard for flare under NSPS
Subpart A (40 CFR 60.18). Amended 1998 and 2000.
o No visible emissions – determined by EPA Method 22
o Presence of flame (pilot)
o Vent gas net heating value (VG NHV) must be 300 Btu/scf or greater for
assisted flare, and 200 Btu/scf or greater for non-assisted flare
o Flare tip velocity must be less than 60 ft/sec or determined by formula
4

INTRODUCTION
Historical background (cont’d)
▪ 2000 Texas Air Quality Study (TexAQS) and 2006/2007 TexAQS II
▪ 2010 TCEQ Flare Study
▪ 2014-2015: EPA residual risk and technology review (RTR) for
refinery sector required by Clean Air Act, including 2011 EPA
information collection request (ICR)
▪ Multiple flare consent decrees (CD)
5

INTRODUCTION
Historical background (cont’d)
▪ December 2015: EPA promulgated new emission standards for flare
under NESHAP Subpart CC (40 CFR 63.670)
o Effective date: February 1, 2016
o Compliance deadline: January 30, 2019
oMost significant changes
• Continuous monitoring
• From vent gas net heating value (VG NHV) to combustion zone net heating value
(CZNHV)
6

INTRODUCTION
Fundamental problem – Flare burns in open air. No practical
method to monitor flare performance (… until now)
▪ Flare is probably the only process unit at refineries and chemical
plants for which operators have no feedback on how the unit is
working
▪ Flare is regulated based on surrogate parameters on what is fed to
the flare, not how the flare is performing – more discussion later
The answer to this problem – VISR flare monitor
7

WORKING PRINCIPLE OF VISR
8

WORKING PRINCIPLE OF VISR
Video Imaging Spectral Radiometer (VISR) – What’s in the name?
▪ “Video Imaging”o Not a point or path measurement. It images the entire flame
o Video frame rate - ~30 frames per second (or 30 Hz)
▪ “Spectral”: capturing images in multiple spectral bands to target different species in the flame
▪ “Radiometer”: meaning the measurement in each spectral band is calibrated to the same radiometry standard, enabling quantitative analysis of the images
Commercial VISR product is made and marketed by Providence Photonics under the brand “Mantis”
9

WORKING PRINCIPLE OF VISR
VISR is different from other flare measurement methods
▪ Extractive
▪ Passive FTIR (or PFTIR)
10
Extractive Sampling
- Point measurement
- Not suitable for routine
monitoring
PFTIR
- Path measurement
(the path is reduced
to a point)
- Not suitable for
routine monitoring
VISR
- 3-D measurement (3-D
flame is reduced to a 2-D
image)
- Suitable for autonomous
monitoring or short-term
study

WORKING PRINCIPLE OF VISR
11
Differences between VISR and PFTIR
VISR PFTIR
Mode of
operation
Entire flame is imaged
• No aiming
• Autonomous operation
Path measurement:
• Must be aimed at certain region of the flame
• Results could be different when aimed at different
regions of the flame
• Operator needs to constantly chase the flame
Data
acquisition
cycle
Frame rate is 30 Hz. Actual integration
time is even shorter. Analogy: High
speed camera taking a picture of fast
moving object (flame) → clear picture.
1 Hz or longer, assumes flame is not moving during
that time. Analogy: a camera with shutter setting of
1 sec to catch a fast moving object → picture
blurred
Spectral
resolution
Low, but adequate for the intended
purpose
High, but unnecessary, and undesirable for
autonomous and continuous monitoring – too much
data
Data
reduction
No spectral deconvolution. Each spectral
band is measured independently
Complicated spectral deconvolution

WORKING PRINCIPLE OF VISR
Each pixel represents a
column of gases in the
flame
Unburned hydrocarbons
and combustion product
(CO2) in the flame are
measured separately
and simultaneously
If there is no unburned
hydrocarbon, CE=100%
for that pixel
12

WORKING PRINCIPLE OF VISR
Flare CE is determined only on
the “combustion envelope” of
the flame where combustion
has ceased
Flare CE is spatially averaged
over pixels on the combustion
envelope, and then averaged
temporally across all frames
captured in one second
13
Flame footprint
Combustion envelope
FEATURES OF VISR FLARE MONITOR
14

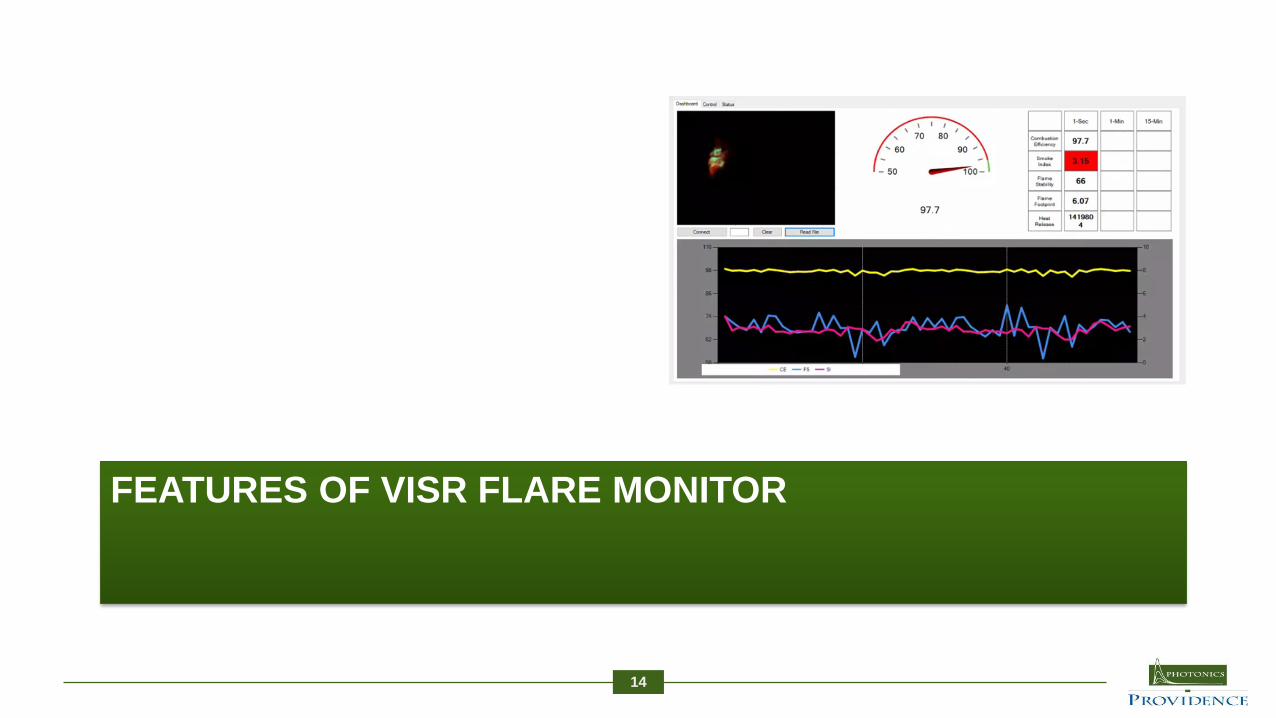
FEATURES OF A VISR FLARE MONITOR
VISR flare monitor remotely, directly, autonomously, and continuously monitors the following flare performance metrics:▪ Combustion Efficiency (CE)
▪ Smoke Index (SI)
▪ Flame Stability (FS)
▪ Flame Footprint (FF)
▪ Heat Release (HR)
All metrics are averaged spatially across the combustion envelope, and temporally to 1-sec (and other average periods as desired)
Results can be streamed to other process control systems through industry standard protocols (e.g., Modbus TCP)
15

VISR ENABLED FLARE MONITORING
Continuously monitor flare performance
16
▪ Red: CO2
▪ Green:
unburned HC
▪ White/blue:
smokeUp to 1000 ft.

COMBUSTION EFFICIENCY (CE)
Example TP11
17
VISR flame image Flame footprint Combustion envelope
For this Test Point 11▪ CE=99.1% (Ex)
▪ CE=98.7% (VISR)
▪ SI=1.22
▪ FS=93
▪ FF=217 sq. ft.
▪ HR=3,171 Btu/min

SMOKE INDEX (SI)
Smoke Index (SI) is derived from radiance of carbon particles in the flame▪ SI=0: no smoke
▪ SI=10: Highest rating for smoke
▪ SI ~ 1-1.5 begin to see visible smoke
Examples
18
TP01
SI = 5.6
TP06
SI = 1.58
TP11
SI = 1.22

SMOKE INDEX (SI)
Examples – visible and VISR images
19
TP01
SI = 5.6
TP11
SI = 1.22
▪ Red: CO2
▪ Green: unburned HC
▪ White/blue: smoke

FLAME STABILITY (FS)
Flame Stability (FS) is a measurement of consistency in terms of thermal energy released by the flare. It is measured in the range of 0 to 100:▪ FS=0: most unstable
▪ FS=100: most stable
Examples:
20
TP11, FS=93
TP12, FS=92
TP13, FS=64
TP14, FS=28

FLAME STABILITY (FS)
VISR images of stable and unstable flames
21
TP11
FS = 93
TP13
FS = 64

FLAME FOOTPRINT (FF)
Flame Footprint (FF) is a measure of the size of the flame. The default measure is the cross section area perpendicular to the direction of VISR flare monitor line of sight. In addition, the length of the major axis of the flame can also be reported to provide a measure of flame length.
A significant portion of the flame is not visible to the naked eye, but is part of the flame and detectable by VISR
22
TP11, Frame 1
FF = 238.5 sq. ft.
(Flame length = 37.8 ft.
TP27, Frame 1
FF = 38.1 sq. ft.
(Flame length = 13.3 ft.)

HEAT RELEASE (HR)
Heat Release (HR) is a measure of the amount of thermal
energy, in Btu/min, released by the flare due to combustion.
HR represents only a portion of the thermal energy in the
wavelength of VISR flare monitor’s spectral range (within 3-5
μm).
HR is expected to be correlated with the total heat released
(Btu/min) from the flare under similar conditions.
23

HEAT RELEASE (HR)
24
Test data has shown HR correlates with Btu input from vent gas
The correlation is weaker when there is significant smoke or a significant portion of the hydrocarbon is not combusted
Potential to use VISR to estimate mass emission rate

VALIDATION OF VISR FLARE MONITORING TECHNOLOGY
25

VALIDATION TEST – NOV. 2014
26
Test conducted at Zeeco
Test Facility in Tulsa, OK
Three types of flares tested– QFS: air assisted, 16”
– AFDS: air assisted, 10”
– MPGF: sonic, 4”
Three types of fuel tested
– Propane and propane/nitrogen blend
– Propylene
– Natural gas
Range of fuel firing
– 237 lb/hr to 7,994 lb/hr
QFS:
Steam
assisted
flare
MPGF:
Multi-point
sonic flare
AFDS: Air
assisted
flare

VALIDATION TEST – NOV. 2014
27
Trailer for
Extractive Testing
Heated sample line
VISR Imager prototype
Each run: 30 sec.
Imager to flare
ground distance:
300 ft.
Extractive
sampling
apparatus
Test Setup

VALIDATION TEST – NOV. 2014
28
Flare Operating Conditions
AFDS air assisted 10” flare– Fuel:
• Propane: 237-7,994 lb/hr
– Air• 9,107 SCFM
constant, 33% -1,123% SA
– NHVdil• 5-1,437 Btu/sq.
ft.
MPGF sonic 4” flare– Fuel:
• Propane: 5,079 lb/hr
• Propylene: 4,952 lb/hr
• Propane/Nitrogen: 2,448 / 1,285 lb/hr
• Natural Gas: 3,300 lb/hr
QFS steam assisted 16” flare– Fuel:
• Propane: 1,537-5,105 lb/hr
• Propylene: 539-4,910 lb/hr
– Steam• 0-2,350 lb/hr
• Steam/HC ratio of 0-4.36 lb/lb
– CZNHV• 192-2,281 Btu/scf

VALIDATION TEST – NOV. 2014
29
A total of 39 test runs
– 28 runs for CE validation (9 for AFDS, 11 for QFS, and
8 for MPGF)
– 4 runs under heavy smoke conditions to evaluate
“Smoke Index” metric
– 5 runs to evaluate VISR range capability
– 2 runs to evaluate VISR ability to detect flare pilot flame

VALIDATION TEST – NOV. 2014
30
Example of extractive sampling and VISR test

VALIDATION TEST – NOV. 2014
31
VISR Performance – Accuracy
28 test runs are compared.
Average difference between the extractive method and VISR is 0.5%
The difference is smaller in the high CE range, and larger in the low CE range (e.g., when CE is in 60-80%)

VALIDATION TEST – NOV. 2014
32
Comparison of VISR, PFTIR, and Extractive Sampling Data
Data provided by Zeeco. PFTIR and VISR tests were done under the same flare op. conditions, but at different times

VALIDATION TEST – NOV. 2014
33
VISR Performance – Linearity
CE measured by VISR
correlates well with CE
measured by extractive
testing; r2 = 0.9856
based on 28 test runs
regardless of flare
types, fuel types, and
combustion conditions.

VALIDATION TEST – NOV. 2014
34
VISR Performance – Precision/Repeatability
During the test, duplicated measurements were
made for 11 test conditions (covering all three flare
types and fuel types). The difference between two
duplicated CE values was obtained:
– For extractive sampling, the average difference over the 11 paired tests was 0.07% in CE measurement.
– For VISR, the average difference over the 11 paired tests was 0.20% in CE measurement.
Very good repeatability

VALIDATION TEST – SEPT. 2016
Test conducted at Zeeco Test Facility in Tulsa, OK
– Steam flare: QFS, 16”
– Air flare: AFDS, 10”
– Fuels tested: propylene, natural gas (NG), and NG/nitrogen (N2) blend
Performance measured by Combustion Efficiency (CE)
– Extractive method
– VISR method
35
Extractive
Sampling
VISR Flare
Monitor

VALIDATION TEST – SEPT. 2016
36
28 test runs are compared; 14 on steam flare and 14 on air flare.
Average difference between the extractive method and VISR is -0.7%, excluding tests with heavy smoke and when CE is < 80%.

ALL VALIDATION TESTS
As of spring 2018, 72 validation
tests have been conducted using
extractive sampling as a reference
method, 44 of them were blind
tests administered by third party
37
Accuracy:
within 1% !!!
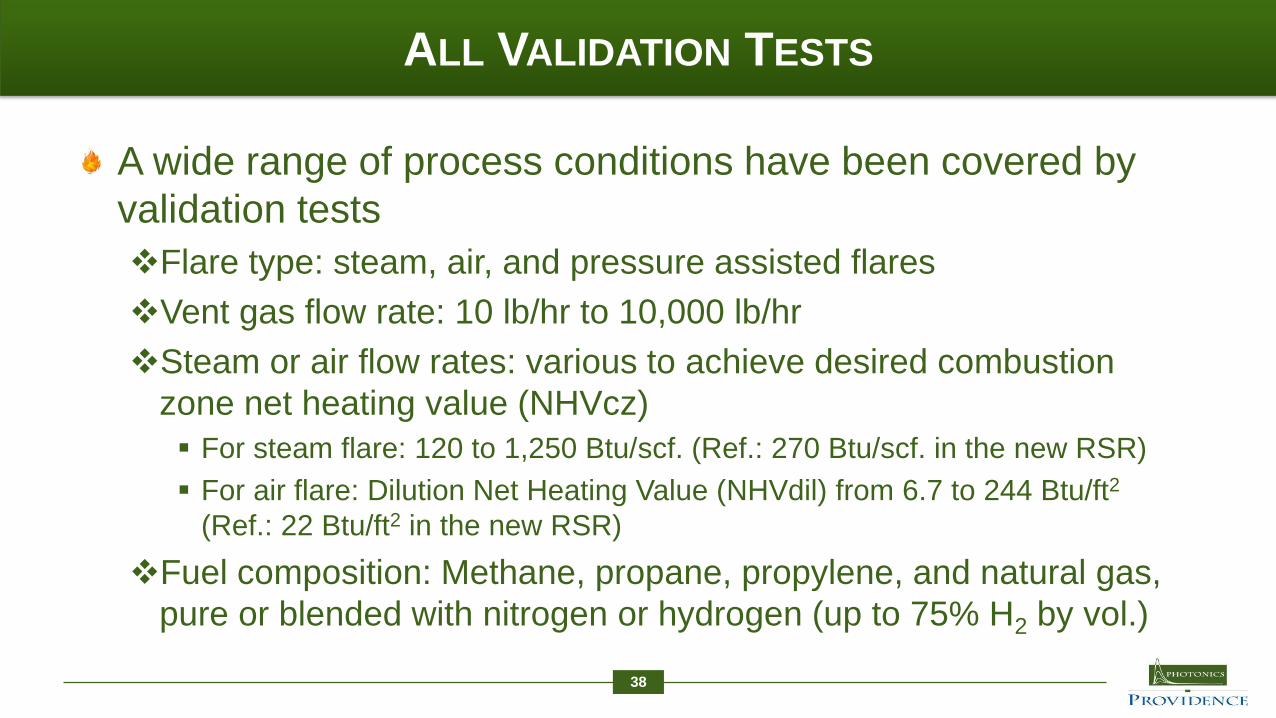
ALL VALIDATION TESTS
A wide range of process conditions have been covered by
validation tests
❖Flare type: steam, air, and pressure assisted flares
❖Vent gas flow rate: 10 lb/hr to 10,000 lb/hr
❖Steam or air flow rates: various to achieve desired combustion
zone net heating value (NHVcz)
▪ For steam flare: 120 to 1,250 Btu/scf. (Ref.: 270 Btu/scf. in the new RSR)
▪ For air flare: Dilution Net Heating Value (NHVdil) from 6.7 to 244 Btu/ft2
(Ref.: 22 Btu/ft2 in the new RSR)
❖Fuel composition: Methane, propane, propylene, and natural gas,
pure or blended with nitrogen or hydrogen (up to 75% H2 by vol.)
38

ALL VALIDATION TESTS
A wide range of environmental conditions have been covered by validation tests❖Distance: 150 – 700 ft. Any distance is acceptable as long as there
is a recognizable flame in the image
❖Wind direction (crosswind, wind oriented towards VISR imager, and wind oriented away from VISR imager)
❖Wind speed
❖Time of day (daytime, nighttime)
❖Sky (blue sky, overcast, moving clouds)
❖Sun in the field of view
❖Rain (light/moderate rain has been tested, no data under heavy rain conditions)
❖Fog (dense fog can introduce a small bias, ~1-2% in CE)
39

FLARE MONITORING REGULATIONS
40

SURROGATE PARAMETERS
41
Regulations are based on surrogate parameters to measure what goes into the flare, not necessarily how the flare performs. Two surrogate parameters are used:– Flare tip exit velocity
– Net heating value (NHV):• General flare rule (40 CFR 60.18) – Vent Gas NHV (VG NHV) must be
▪ ≥ 300 Btu/scf for assisted flare
▪ ≥ 200 Btu/scf for non-assisted flare.
• New rule for refineries [40 CFR 63.670 (e) and (f)] –▪ Combustion Zone NHV (CZNHV) must be ≥ 270 Btu/scf
▪ For flares with perimeter assist air, NHV Dilution parameter (NHVdil) must be ≥ 22 Btu/sq. ft.
▪ Compliance deadline: January 30, 2019
Do surrogate parameters track flare performance?

A CASE STUDY
Test conducted in Sept. 2016 at Zeeco Test Facility in Tulsa, OK, with the primary purpose of validating a new flare monitoring technology, Video Imaging Spectral Radiometer (VISR), with conventional extractive method used as the reference method
Flares tested:– Steam flare: QFS, 16”
– Air flare (perimeter air assist): AFDS, 10”
– Fuels tested: propylene, natural gas (NG), and NG/nitrogen (N2) blend
28 test conditions: 14 for steam flare and 14 for air flare
42
Extractive
Sampling
VISR Flare
Monitor

TEST RESULTS – STEAM FLARE, 40 CFR 60.18
40 CFR 60.18 requirements: VG NHV ≥ 300 Btu/scf
As a surrogate for combustion efficiency (CE), VG NHV worked in 12 test conditions out of 14
Failed 2 out of 14: VG NHV < 300 Btu/scf, but CE>96.5% (yellow bar with red border in the chart on right).
43

TEST RESULTS – STEAM FLARE, 40 CFR 63.670 (e)
40 CFR 63.670 (e) requirements: CZNHV ≥ 270 Btu/scf
As a surrogate for CE, CZNHV worked in 11 test conditions out of 14
Failed 3 out of 14: CZNHV < 270 Btu/scf, but CE>96.5% (yellow bar with red border in the chart on right).
44

TEST RESULTS – AIR FLARE, 40 CFR 60.18
45
40 CFR 60.18 requirements: VG NHV ≥ 300 Btu/scf
As a surrogate for CE, VG NHV worked in 7 test conditions out of 14
Failed 7 out of 14:
▪ VG NHV < 300 Btu/scf, but CE>96.5% (yellow bar with red border)
▪ VG NHV > 300 Btu/scf, but CE< 96.5% (yellow bar with purple border)

TEST RESULTS – AIR FLARE, 40 CFR 63.670 (f)
46
40 CFR 63.670 (f) requirements for perimeter air assist: NHVdil ≥ 22 Btu/sq. ft.
As a surrogate for CE, NHVdil worked in 8 test conditions out of 14
Failed 6 out of 14:
▪ NHVdil < 22 Btu/sq. ft., but CE>96.5% (yellow bar with red border)
▪ NHVdil > 22 Btu/sq. ft., but CE< 96.5% (yellow bar with purple border)

WHAT DOES THIS MEAN TO INDUSTRY?
Using CZNHV, VG NHV, or NHVdil for perimeter air assisted flare could over-regulate, i.e., CZNHV is below the required level, but flare CE is meeting or exceeding the intended targetOver-regulation means unmerited/excessive “deviations” or “violations”Unnecessarily adding supplemental fuel to bring CZNHV to 270 Btu/scf– Higher cost
– Higher emissions (e.g., higher GHG emissions)
– The monitoring methods specified in the rule further exacerbate these problems due to a long analytical cycle (e.g., 8 minutes in the 15-minute regulatory window), and supplemental fuel feed cannot be changed until the next data point.
47

FLARE MONITORING CHALLENGES
The indirect method specified in the RSR requires at least 10 instruments to derive a single surrogate parameter (combustion zone net heating value, or NHVcz) for compliance determination. It presents significant challenges:High cost – both initial capital cost and recurring O&M cost
Latency▪ Very little or no time to respond/make corrective actions within the 15 minute regulatory
window – number of compliance deviations could be very high
▪ Unnecessarily adding more supplemental fuel – higher fuel costs and more GHG emissions to be reported
System reliability and data availability issues due to the shear number of instruments involved and corrosive process stream – again, compliance risk
Scheduling challenges – installations need to coincide with scheduled turnaround or additional process shutdowns may be required
NHVcz may not reflect the true flare performance (combustion efficiency and destruction efficiency)
48

IF VISR FLARE MONITOR IS USED…
Short data cycle – 1 Hz
– Faster responses to avoid deviation in
the 15-min window
– Savings on supplemental fuel
Fewer instruments
Remote measurement
– No contact with process stream
– Minimal O&M expense
– Installation and maintenance: no need to
wait for turnaround or costly shutdown
49
1 = 10+

IF VISR FLARE MONITOR IS USED…
50
Flare 1
Mantis TM
Flare 2
DCS or
PLC
Vent GasSteam/Air
Vent GasSteam/Air
OperatorOr
Video output
Real-time data output
for CE and SI
Supplemental Fuel
Supplemental Fuel
Close loop flare operation/optimization
Less expensive than the surrogate methods
One VISR device monitors more than one flare – cost savings

IF VISR FLARE MONITOR IS USED…
51
Combination of CE and SI provides practical way to achieve incipient smoke point (ISP) and prevent flare from running off the road
CE SI

IF VISR FLARE MONITOR IS USED…
52
Pilot flame can be monitored ✓ Monitor presence of pilot flame - EPA rule 40 CFR §63.670 (b)
✓ It’s based on pilot flame, not temp.
✓ Remote monitoring – easy to maintain
Pilots
➢ Blue portion:
metal pilot hood
➢ Red portion:
pilot flame

IF VISR FLARE MONITOR IS USED…
53
All regulatory requirements could be covered by this single device!
EPA Rule 40
CFR Part 63
Purpose of Rule Can VISR
Cover It?
§63.670 (b) Presence of pilot flame Yes
§63.670 (c) No visible emissions Yes
§63.670 (d) The three requirements are
designed to ensure sufficient CE
through surrogate parameters
Yes
§63.670 (e)
§63.670 (f)

REGULATORY PATH FOR VISR
54
Approval process (EPA Guidance Document GD-022)
Submittal – Request can be submitted NOW
✓Request letter – a draft template request letter has been prepared by
Providence
✓Supporting technical documents – Providence has been working with
EPA in parallel.
Criteria:
✓Adequacy
✓Stringency
✓Both criteria have been demonstrated through validation tests and
other technical data

REGULATORY PATH FOR VISR
55
Timing issue
One-year extension under 40 CFR 63.6(i)
✓Granted by delegated authority, i.e., state/local agencies (they
can consult with EPA if they wish).
✓Justified by the implementation of VISR.
✓Providence has discussed with a state agency, and obtained
verbal approval for the extension.
✓Providence will assist early adopters with submittal for one-year
extension request.
✓Nothing to lose, lots to gain!

TOPICS ON VISR FLARE MONITOR APPLICATIONS
56

FIXED INSTALLATION
Regulatory compliance
Process automation
Better methane emission quantification – see later slides
57
Flare 1
Mantis TM
Flare 2
DCS or
PLC
Vent GasSteam/Air
Vent GasSteam/Air
OperatorOr
Video output
Real-time data output
for CE and SI
Supplemental Fuel
Supplemental Fuel

FIXED INSTALLATION
Optimal distance to flareAdditional range can be achieved using site-specific lens or a dual-lens configurationPossible to monitor more than one flare with one Mantis flare monitorFactory calibrated, good for at least a yearRoutine maintenance –very minimal: clean the enclosure window if dust accumulates
58

BENEFITS OF USING VISR
59
Much simpler operation, more reliable, and less headaches
Cost savings
Reduce capital costs by ~50% (or more if one VISR device is used to monitor more than one flare)
Virtually eliminate annual O&M costs
More cost savings when VISR is also used for monitoring visible emissions and pilot flame
Reduce costs associated with unscheduled shutdowns, deviation/non-compliance, etc.
Eliminate/reduce costs for compliance with visible emission requirements
1 = 10+

BENEFITS OF USING VISR
60
Closed-loop control of flare
Incipient Smoke Point (ISP) operations
Fast response (one second data resolution with no latency vs. 8-12 minute data resolution for GC)
Minimizing deviations within the 15-min regulatory compliance time window
Supplemental fuel savings
Remote sensing
No need to interrupt process for installation or maintenance
No contact with potentially corrosive process streams – low maintenance
No calibration gases and other routine maintenance tasks associated with indirect method

SHORT-TERM OR TEMPORARY USE
Mantis flare monitor can be used on a short-term or temporary basis for:
▪ Compliance planning and readiness assessment
▪ Temporary coverage for other flare monitoring instruments
▪ Troubleshooting
▪ Engineering or design study
▪ Flare research
▪ Enclosed combustor or any open flame or hot combustion gases (temp ~1,000 F or higher)
61

SHORT-TERM OR TEMPORARY USE
Setup
62
Or
On vehicleOn tripod

SHORT-TERM OR TEMPORARY USE
No site preparation
Line of sight to the flare at distances from 100 ft. to 1,000 ft.
Powered by single 110 V/10A supply, portable generator or vehicle with an power inverter
Set up time is 15 min. or less
Test can be conducted day or night
Flare metrics available immediately, no need for data reduction or post processing
63

FRAME-BY-FRAME STUDY – GOOD COMBUSTION
64
A parcel of fuel gas is combusted in about 0.47 sec. (14 frames)
Frame 166Frame 167…
Frame 170…
Frame 173…
Frame 176…
Frame 179Frame 180
Fuel
CO2
Color in images:
Green: Hydrocarbon
Red: CO2Fuel
CO2

FRAME-BY-FRAME STUDY – SEVERE OVER-STEAMING
65
Frame 011
Frame 012
Frame 013
Frame 015
Frame 014
Frame 016Frame 017
Frame 018
Frame 019
What is happening when flare is pulsing…
0.033 sec.
Color in the images
Green: Hydrocarbon
Red: CO2
Bluish/white: Carbon particles
or hot solid object

FRAME-BY-FRAME STUDY – SEVERE OVER-STEAMING
66
Frame 011
Frame 012
Frame 013
Frame 015
Frame 014
Frame 016Frame 017
Frame 018
Frame 019
What is happening when flare is pulsing…
0.033 sec.
Cycle time ~ 16
frames or ~0.5 sec.

FRAME-BY-FRAME STUDY – SEVERE OVER-STEAMING
67
Frame 015
Significant
amount of
unburned
hydrocarbon
(green color).
Too cold to
continue
combustion
Frame 011
Frame 012
Frame 013
Frame 015
Frame 014
Frame 016
Frame 018
Frame 017
Frame 019
Color in the images
Green: Hydrocarbon
Red: CO2
Bluish/white: Carbon particles
or hot solid object

TWO FLARES IN THE SAME FIELD OF VIEW
Technically feasible. This feature will be added in next version of the software
Two ways to monitor more than one flare with one Mantis flare monitor“Time sharing”: use a pan-and-
tilt platform with preset positions
Cover more than one flare in the same field of view. No need for pan-and-tilt platform. Algorithm will separate them.
68

A WEEK-LONG CONTINUOUS TEST
Small torches to simulate flares – the main purpose is to run
the system continuously for a longer period of time
69
Flare 2
Flare 1
VISR
Monitor

A WEEK-LONG CONTINUOUS TEST
A week-long test
with sporadic
flaring events –
an overview
▪ Repeatable
results from day
to day
▪ Same results
from two
distances
70

A WEEK-LONG CONTINUOUS TEST
A week-long test with sporadic flaring events
– zooming in to a flaring event
71
Avg CE Avg SI Avg CE Avg SI
March 22, 1:16 pm - 1:30 pm 99.4 0.0
March 22, 1:36 pm - 1:49 pm 99.2 0.0
March 22, 1:51 pm - 2:09 pm 97.5 6.4
Flare 1 Flare 2

VISR MONITOR FOR ENCLOSED COMBUSTOR
VISR can be used to test
enclosed combustors
Gas exiting from the top of
enclosed combustor must
be hot (~ 1,000 OF, which is
expected by design)
Same data will be
generated as for flare
testing
72
CE=89.0%

METHANE EMISSIONS
Methane is a Greenhouse Gas (GHG).
In recent years, there has been a lot of attention to methane emissions from Oil and Gas field.
73
Photo by WildEarth Guardians
Source: EPA

METHANE EMISSIONS
Significant portion of GHG emissions is from methane, and the methane’s contribution is much higher in the oil and gas industry, in which flares (including enclosed combustors in upstream oil and gas) make one of largest source categories
74
Source: EPA

METHANE EMISSIONS
Companies are
making
commitments to
reduce methane
emissions
75

METHANE EMISSIONS
Methane’s Global Warming Potential (GWP) is 28-36 on the 100-year scale and 84-87 on the 20-year scale. Per 2014 EPA emission factor, 25 is used for GHG reporting.
An uncertainty in flare CE can make a big difference in GHG reporting:
76
CO2
(mol)
Methane
(mol)
CO2
(g)
Methane
(g CO2e)
GHG
Emission
(g CO2e)
GHG
Emission
Change
Baseline: CE=98% 98 2 4,312 800 5,112If actual CE is 99% 99 1 4,356 400 4,756 -7.0%If actual CE is 96% 96 4 4,224 1,600 5,824 13.9%If actual CE is 90% 90 10 3,960 4,000 7,960 55.7%

ACKNOWLEDGEMENT
Providence wishes to thank Zeeco, Inc. for providing test facilities during the development of VISR technology
Providence received U.S. EPA Small Business Innovative Research (SBIR) Phase I and Phase II for the development and commercialization of the VISR technology
77

QUESTIONS AND ANSWERS
78

QUESTIONS OR COMMENTS…
79
Yousheng Zeng, PhD, PE, CEO
Jon Morris, CTO
www.providencephotonics.com
+1-225-766-7400