flare sensitivity modeling -
TRANSCRIPT

Air Quality Division • Flare Sensitivity Modeling; JS; June 23, 2009 • Page 1
Flare Sensitivity Modeling
Jim SmithSETPMTC Meeting
June 23, 2009
Air Quality Division • Flare Sensitivity Modeling; JS; June 23, 2009 • Page 2
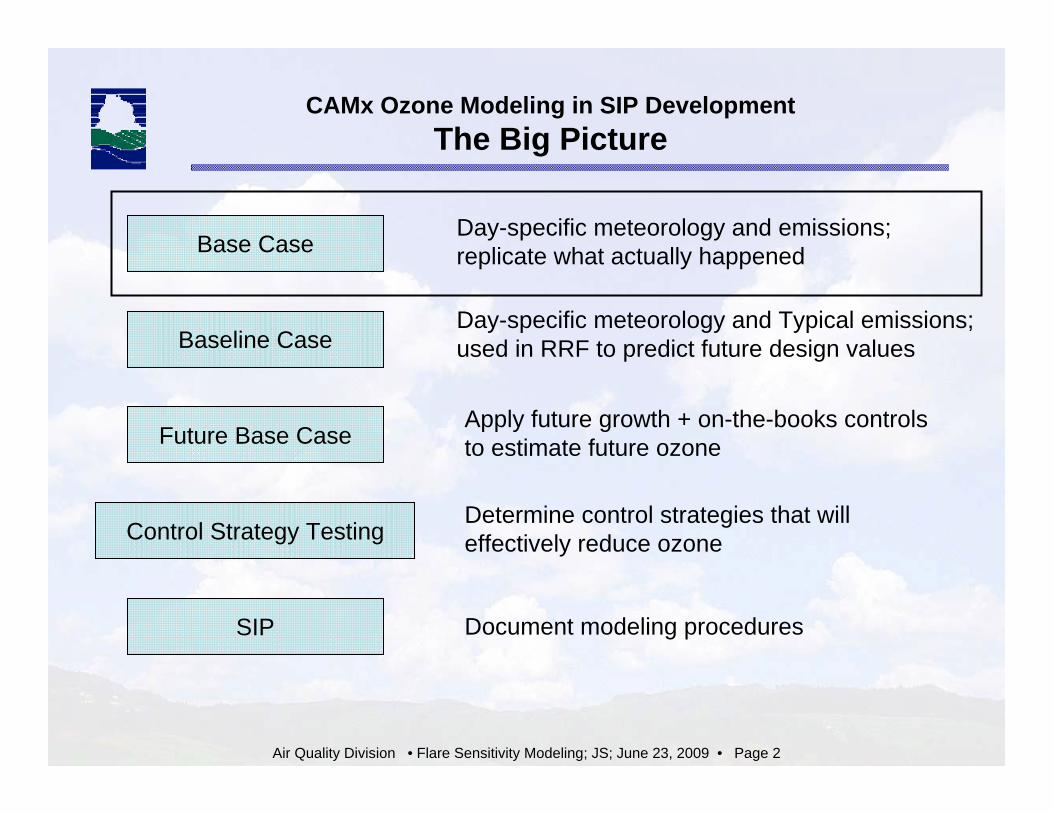
Base Case
CAMx Ozone Modeling in SIP DevelopmentThe Big Picture
Baseline Case
Future Base Case
Control Strategy Testing
SIP
Day-specific meteorology and emissions; replicate what actually happened
Day-specific meteorology and Typical emissions; used in RRF to predict future design values
Apply future growth + on-the-books controls to estimate future ozone
Determine control strategies that will effectively reduce ozone
Document modeling procedures

Air Quality Division • Flare Sensitivity Modeling; JS; June 23, 2009 • Page 3
Flare Emissions
• Recently, flares have come under scrutiny as potential sources for unreported VOC emissions, especially HRVOCs.
• Aircraft observations show HRVOC concentrations that are an order of magnitude or more greater than can be explained through reported emissions.
• Ground-based observations also show a discrepancy, but much smaller (about a factor of 2 to 3).

Air Quality Division • Flare Sensitivity Modeling; JS; June 23, 2009 • Page 4
Flare Emissions
• To better understand the role of flare emissions in the HGB airshed, we ran the base case model with flare VOC emissions increased by a factor of 10, but without the PSCF-based HRVOC reconciliation.
• Two additional sensitivity runs were also conducted: increase flare emissions of HRVOCs only by a factor of 10, and also adding a “boost” of formaldehyde to the 10X HRVOC emissions (equal to 0.1 times the mass of the extra HRVOC).

Air Quality Division • Flare Sensitivity Modeling; JS; June 23, 2009 • Page 5
Flare Emission Sensitivities
F10xHRVOC + HCHO Boost
Reg10 + 10X Flare HRVOC (no PSCF reconciliation)
Reg10 + 10X Flare VOC (no PSCF reconciliation)
2006 Reg10 (Regular Base Case, Ver. 10)
Description
23.1 tpdBase Case
9.1 tpd87.9 tpdFBoost
87.9 tpdF10xHRVOC
87.9 tpd321.6 tpd*F10xVOC
Added Flare HCHO
Added Flare HRVOC
Added Flare VOC
Added PSCF-based HRVOCRun Name
* Including 87.9 tpd of HRVOC

Air Quality Division • Flare Sensitivity Modeling; JS; June 23, 2009 • Page 6
Three Flare Sensitivities
• The modeling was conducted for all 5 2005 and 2006 episodes, but results presented here focus mainly on the 2006 TexAQS II intensive period –August 15-October 15.
• Two sub-episodes:– AQS 1: August 15 – September 14, 2006. This period
includes the Special Emissions Inventory.– AQS 2: September 15 – October 15, 2006. No Special EI,
but most aircraft data was collected during this period.– Some periods in both episodes are not included in the
analysis since no fine-grid modeling was conducted on those days.

Air Quality Division • Flare Sensitivity Modeling; JS; June 23, 2009 • Page 7
Sensitivity Results
• The following slides show scatter plots comparing observed and modeled concentrations of several species at selected surface sites:– AQS 2 episode, September 19 – October 11, excluding
dates when fine grids were not run: (September 21-24 and September 28 – October 2).
• Also shown are comparisons between data collected by the NOAA P3 aircraft and the model within the 2 km HG fine grid area:– Between August 31 and October 12, 2006. Most data
were collected during the AQS 2 episode, including some days when fine grids were not run.

Air Quality Division • Flare Sensitivity Modeling; JS; June 23, 2009 • Page 8
Ethene (CB05: ETH)

Air Quality Division • Flare Sensitivity Modeling; JS; June 23, 2009 • Page 9
Modeled vs. Observed Ethene (ETH)
Concentrations,Base Case
Lynchburg Ferry, AQS 2
Deer Park, AQS 2
NOAA P3, Sep 30 – Aug 13

Air Quality Division • Flare Sensitivity Modeling; JS; June 23, 2009 • Page 10
Modeled vs. Observed Ethene (ETH)
Concentrations, F10xVOC
NOAA P3, Sep 30 – Aug 13
Deer Park, AQS 2
Lynchburg Ferry, AQS 2

Air Quality Division • Flare Sensitivity Modeling; JS; June 23, 2009 • Page 11
Modeled vs. Observed Ethene (ETH)
Concentrations, F10xHRVOC
Deer Park, AQS 2
NOAA P3, Sep 30 – Aug 13
Lynchburg Ferry, AQS 2

Air Quality Division • Flare Sensitivity Modeling; JS; June 23, 2009 • Page 12
Modeled vs. Observed Ethene (ETH)
Concentrations,FBoost
Deer Park, AQS 2
Lynchburg Ferry, AQS 2
NOAA P3, Sep 30 – Aug 13

Air Quality Division • Flare Sensitivity Modeling; JS; June 23, 2009 • Page 13
OLE

Air Quality Division • Flare Sensitivity Modeling; JS; June 23, 2009 • Page 14
Modeled vs. Observed OLE Concentrations,
Base Case
Deer Park, AQS 2
Lynchburg Ferry, AQS 2
NOAA P3, Sep 30 – Aug 13

Air Quality Division • Flare Sensitivity Modeling; JS; June 23, 2009 • Page 15
Modeled vs. Observed OLE
Concentrations, F10xVOC
Deer Park, AQS 2
Lynchburg Ferry, AQS 2
NOAA P3, Sep 30 – Aug 13

Air Quality Division • Flare Sensitivity Modeling; JS; June 23, 2009 • Page 16
IOLE

Air Quality Division • Flare Sensitivity Modeling; JS; June 23, 2009 • Page 17
Modeled vs. Observed IOLE Concentrations,
Base Case
Deer Park, AQS 2
Lynchburg Ferry, AQS 2
NOAA P3, Sep 30 – Aug 13

Air Quality Division • Flare Sensitivity Modeling; JS; June 23, 2009 • Page 18
Modeled vs. Observed IOLE
Concentrations, F10xVOC
Deer Park, AQS 2
Lynchburg Ferry, AQS 2
NOAA P3, Sep 30 – Aug 13

Air Quality Division • Flare Sensitivity Modeling; JS; June 23, 2009 • Page 19
PAR

Air Quality Division • Flare Sensitivity Modeling; JS; June 23, 2009 • Page 20
Modeled vs. Observed PAR Concentrations,
Base Case
Deer Park, AQS 2
Lynchburg Ferry, AQS 2
NOAA P3, Sep 30 – Aug 13

Air Quality Division • Flare Sensitivity Modeling; JS; June 23, 2009 • Page 21
Modeled vs. Observed PAR Concentrations,
F10xVOC
Deer Park, AQS 2
Lynchburg Ferry, AQS 2
NOAA P3, Sep 30 – Aug 13

Air Quality Division • Flare Sensitivity Modeling; JS; June 23, 2009 • Page 22
Modeled vs. Observed PAR Concentrations,
F10xHRVOC
Deer Park, AQS 2
Lynchburg Ferry, AQS 2
NOAA P3, Sep 30 – Aug 13

Air Quality Division • Flare Sensitivity Modeling; JS; June 23, 2009 • Page 23
Formaldehyde (CB05: FORM or HCHO)

Air Quality Division • Flare Sensitivity Modeling; JS; June 23, 2009 • Page 24
Modeled vs. Observed Formaldehyde (FORM) Concentrations, Base
Case
Moody Tower, AQS 2
Lynchburg Ferry, AQS 2
NOAA P3, Sep 30 – Aug 13

Air Quality Division • Flare Sensitivity Modeling; JS; June 23, 2009 • Page 25
Modeled vs. Observed Formaldehyde (FORM)
Concentrations, F10xVOC
Moody Tower, AQS 2
Lynchburg Ferry, AQS 2
NOAA P3, Sep 30 – Aug 13

Air Quality Division • Flare Sensitivity Modeling; JS; June 23, 2009 • Page 26
Modeled vs. Observed Formaldehyde (FORM)
Concentrations, F10xHRVOC
Moody Tower, AQS 2
Lynchburg Ferry, AQS 2
NOAA P3, Sep 30 – Aug 13

Air Quality Division • Flare Sensitivity Modeling; JS; June 23, 2009 • Page 27
Modeled vs. Observed Formaldehyde (FORM)
Concentrations, FBoost
Lynchburg Ferry, AQS 2
Moody Tower, AQS 2
NOAA P3, Sep 30 – Aug 13

Air Quality Division • Flare Sensitivity Modeling; JS; June 23, 2009 • Page 28
Ozone (O3)
Air Quality Division • Flare Sensitivity Modeling; JS; June 23, 2009 • Page 29
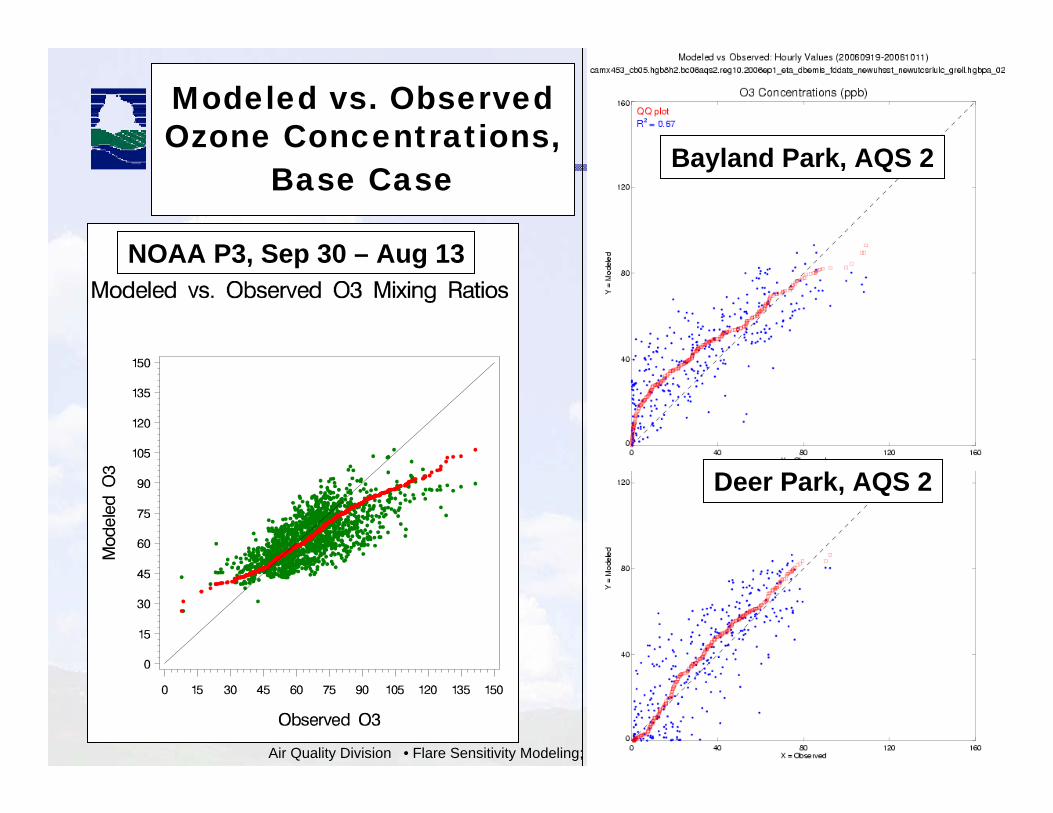
Modeled vs. Observed Ozone Concentrations,
Base Case
Deer Park, AQS 2
Bayland Park, AQS 2
NOAA P3, Sep 30 – Aug 13

Air Quality Division • Flare Sensitivity Modeling; JS; June 23, 2009 • Page 30
Modeled vs. Observed Ozone Concentrations,
F10xVOC
Deer Park, AQS 2
Bayland Park, AQS 2
NOAA P3, Sep 30 – Aug 13
Air Quality Division • Flare Sensitivity Modeling; JS; June 23, 2009 • Page 31
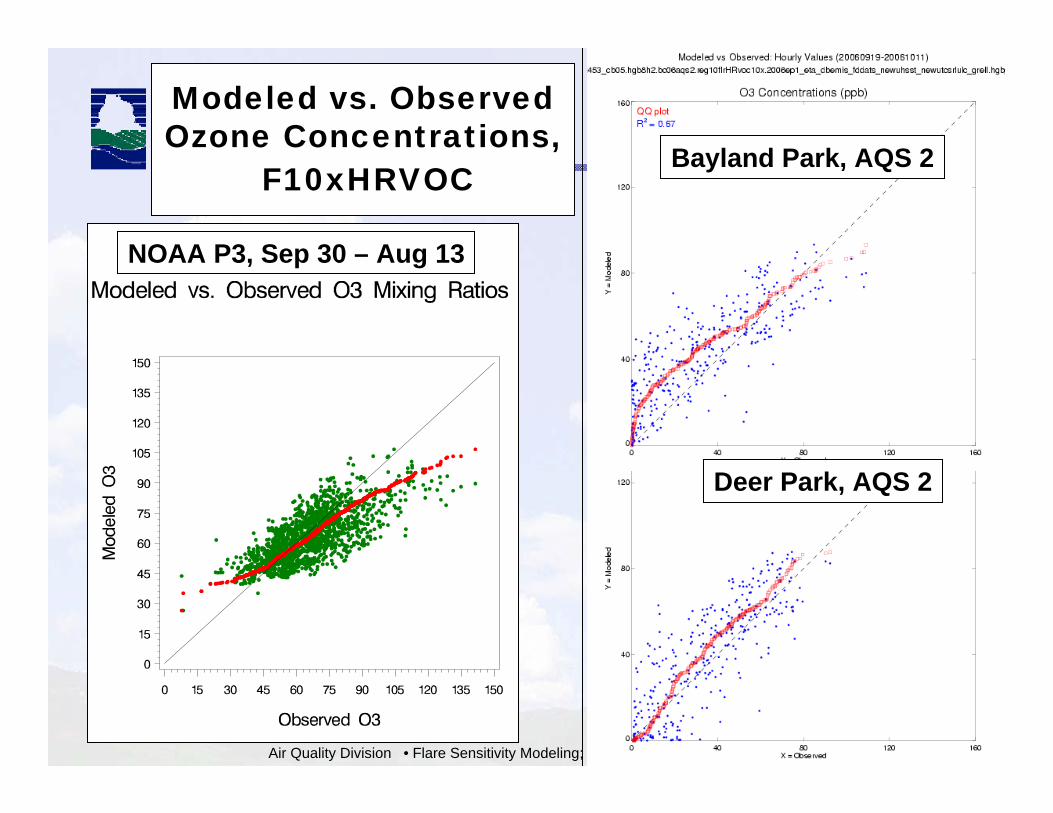
Modeled vs. Observed Ozone Concentrations,
F10xHRVOC
Deer Park, AQS 2
Bayland Park, AQS 2
NOAA P3, Sep 30 – Aug 13

Air Quality Division • Flare Sensitivity Modeling; JS; June 23, 2009 • Page 32
Modeled vs. Observed Ozone Concentrations,
FBoost
Deer Park, AQS 2
Bayland Park, AQS 2
NOAA P3, Sep 30 – Aug 13

Air Quality Division • Flare Sensitivity Modeling; JS; June 23, 2009 • Page 33
August 17, 2006 Case Study
Base Case vs. F10xVOC

Air Quality Division • Flare Sensitivity Modeling; JS; June 23, 2009 • Page 34
Base CaseAugust 17, 2006

Air Quality Division • Flare Sensitivity Modeling; JS; June 23, 2009 • Page 35
10X Flare VOCAugust 17, 2006

Air Quality Division • Flare Sensitivity Modeling; JS; June 23, 2009 • Page 36
10X Flare VOC – Base CaseAugust 17, 2006
Air Quality Division • Flare Sensitivity Modeling; JS; June 23, 2009 • Page 37
August 17, 2006 Case Study
F10xVOC vs. F10xHRVOC

Air Quality Division • Flare Sensitivity Modeling; JS; June 23, 2009 • Page 38
10X Flare VOCAugust 17, 2006

Air Quality Division • Flare Sensitivity Modeling; JS; June 23, 2009 • Page 39
10X Flare HRVOCAugust 17, 2006

Air Quality Division • Flare Sensitivity Modeling; JS; June 23, 2009 • Page 40
10X Flare HRVOC - 10X Flare VOCAugust 17, 2006

Air Quality Division • Flare Sensitivity Modeling; JS; June 23, 2009 • Page 41
August 17, 2006 Case Study
F10xHRVOC vs. FBoost

Air Quality Division • Flare Sensitivity Modeling; JS; June 23, 2009 • Page 42
10X Flare HRVOCAugust 17, 2006

Air Quality Division • Flare Sensitivity Modeling; JS; June 23, 2009 • Page 43
HCHO BoostAugust 17, 2006

Air Quality Division • Flare Sensitivity Modeling; JS; June 23, 2009 • Page 44
HCHO Boost - 10X Flare HRVOCAugust 17, 2006

Air Quality Division • Flare Sensitivity Modeling; JS; June 23, 2009 • Page 45
October 6, 2006 Case Study
Base Case vs. F10xVOC

Air Quality Division • Flare Sensitivity Modeling; JS; June 23, 2009 • Page 46
Base CaseOctober 6, 2006
Air Quality Division • Flare Sensitivity Modeling; JS; June 23, 2009 • Page 47
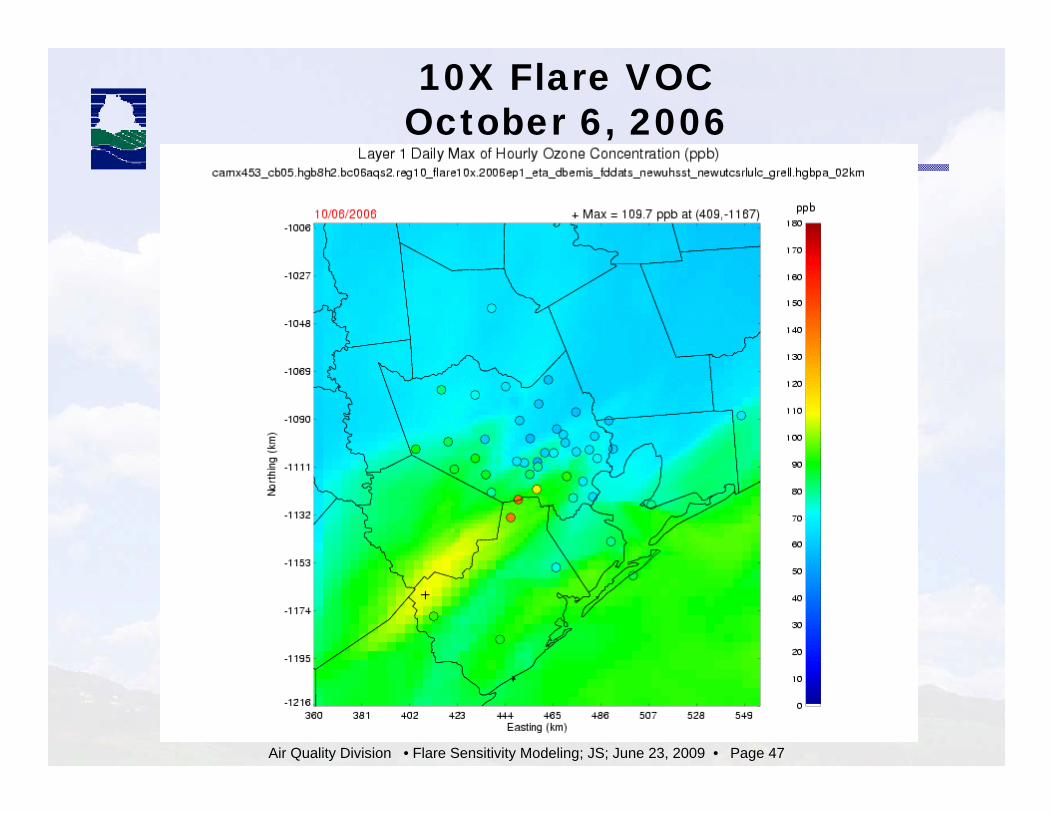
10X Flare VOCOctober 6, 2006

Air Quality Division • Flare Sensitivity Modeling; JS; June 23, 2009 • Page 48
10X Flare VOC – Base Case October 6, 2006

Air Quality Division • Flare Sensitivity Modeling; JS; June 23, 2009 • Page 49
October 6, 2006 Case Study
F10xVOC vs. F10xHRVOC

Air Quality Division • Flare Sensitivity Modeling; JS; June 23, 2009 • Page 50
10X Flare VOCOctober 6, 2006

Air Quality Division • Flare Sensitivity Modeling; JS; June 23, 2009 • Page 51
10X Flare HRVOCOctober 6, 2006

Air Quality Division • Flare Sensitivity Modeling; JS; June 23, 2009 • Page 52
10X Flare HRVOC - 10X Flare VOCOctober 6, 2006

Air Quality Division • Flare Sensitivity Modeling; JS; June 23, 2009 • Page 53
October 6, 2006 Case Study
F10xHRVOC vs. FBoost

Air Quality Division • Flare Sensitivity Modeling; JS; June 23, 2009 • Page 54
10X Flare HRVOCOctober 6, 2006

Air Quality Division • Flare Sensitivity Modeling; JS; June 23, 2009 • Page 55
HCHO BoostOctober 6, 2006

Air Quality Division • Flare Sensitivity Modeling; JS; June 23, 2009 • Page 56
HCHO Boost –10X Flare HRVOCOctober 6, 2006

Air Quality Division • Flare Sensitivity Modeling; JS; June 23, 2009 • Page 57
Model Performance Summary
• The following slides show episode average maximum eight-hour ozone concentrations for Reg10 Base Case and the three flare sensitivities, compared with observed, for five important sites. Days with observed ozone concentrations < 50 ppb were excluded from the averages.

Air Quality Division • Flare Sensitivity Modeling; JS; June 23, 2009 • Page 58
Average Modeled 8-Hour Peak O3 by Episode for 2006 Base Case and Three Flare Sensitivities
Bayland Park
40
50
60
70
80
90
100
May05 Jun05 Jul05 Jun06 AQS-1 AQS-2Episode
Aver
age
Peak
8-H
our
O3 C
once
ntra
tion
(pp
b)
OBS Reg10 F10xVOC F10xHRVOC FBoost

Air Quality Division • Flare Sensitivity Modeling; JS; June 23, 2009 • Page 59
Average Modeled 8-Hour Peak O3 by Episode for 2006 Base Case and Three Flare Sensitivities
Deer Park
40
50
60
70
80
90
100
May05 Jun05 Jul05 Jun06 AQS-1 AQS-2Episode
Aver
age
Peak
8-H
our
O3 C
once
ntra
tion
(pp
b)
OBS Reg10 F10xVOC F10xHRVOC FBoost

Air Quality Division • Flare Sensitivity Modeling; JS; June 23, 2009 • Page 60
Average Modeled 8-Hour Peak O3 by Episode for 2006 Base Case and Three Flare Sensitivities
Aldine
40
50
60
70
80
90
100
May05 Jun05 Jul05 Jun06 AQS-1 AQS-2Episode
Aver
age
Peak
8-H
our
O3 C
once
ntra
tion
(pp
b)
OBS Reg10 F10xVOC F10xHRVOC FBoost

Air Quality Division • Flare Sensitivity Modeling; JS; June 23, 2009 • Page 61
Average Modeled 8-Hour Peak O3 by Episode for 2006 Base Case and Three Flare Sensitivities
Monroe
40
50
60
70
80
90
100
May05 Jun05 Jul05 Jun06 AQS-1 AQS-2Episode
Aver
age
Peak
8-H
our
O3 C
once
ntra
tion
(pp
b)
OBS Reg10 F10xVOC F10xHRVOC FBoost

Air Quality Division • Flare Sensitivity Modeling; JS; June 23, 2009 • Page 62
Average Modeled 8-Hour Peak O3 by Episode for 2006 Base Case and Three Flare Sensitivities
Wallisville
40
50
60
70
80
90
100
May05 Jun05 Jul05 Jun06 AQS-1 AQS-2Episode
Aver
age
Peak
8-H
our
O3 C
once
ntra
tion
(pp
b)
OBS Reg10 F10xVOC F10xHRVOC FBoost
Air Quality Division • Flare Sensitivity Modeling; JS; June 23, 2009 • Page 63
Summary
• Replacing the PSCF-based HRVOC reconciliation with a 10X flare VOC increase:– Greatly improves ETH and OLE concentrations compared
with aircraft data, but causes some over-prediction at Deer Park and Lynchburg Ferry
– Improves IOLE and FORM performance overall– Exaggerates over-prediction of PAR– Increases episode average peak eight-hour ozone
concentrations at monitors between 0.5 and 4 ppb– Intensifies ozone plumes emanating from industrial areas

Air Quality Division • Flare Sensitivity Modeling; JS; June 23, 2009 • Page 64
Summary
• Compared with the 10x VOC increase, the 10xHRVOC increase:– Has little effect on modeled concentrations of HRVOC
species – Reduces modeled PAR and FORM concentrations– Decreases episode average eight-hour modeled ozone
concentrations, usually by < 0.5 ppb

Air Quality Division • Flare Sensitivity Modeling; JS; June 23, 2009 • Page 65
Summary
• Compared with the 10x HRVOC increase, the HCHO Boost:– Has little effect on modeled concentrations of any
hydrocarbon species– Increases modeled FORM concentrations, improving
performance except at Moody Tower where highest concentrations are over-predicted
– Increases modeled episode average eight-hour ozone concentrations, usually by < 0.5 ppb
– Intensifies ozone plumes emanating from industrial areas

Air Quality Division • Flare Sensitivity Modeling; JS; June 23, 2009 • Page 66
Summary
• Overall, the flare sensitivities improve performance for most species measured by the P3, but cause some over-estimation at surface sites
• Some future research topics:– Investigate improved vertical mixing algorithms– Investigate plume heights for HRVOC emission sources– Investigate new PSCF-based reconciliation using
elevated sources