flash and smash: rapid freezing of muscle fibers activated by
TRANSCRIPT

Biophysical Journal Volume 65 July 1993 397-408
Flash and Smash: Rapid Freezing of Muscle Fibers Activated byPhotolysis of Caged ATP
Keiko Hirose, Thomas D. Lenart,* John M. Murray, Clara Franzini-Armstrong, and Yale E. Goldman*Department of Cell and Developmental Biology, *Biochemistry and Biophysics, tPhysiology, and Pennsylvania Muscle Institute, Universityof Pennsylvania, Philadelphia, Pennsylvania 19104 USA
ABSTRACT A new approach was used to study transient structural states of cross-bridges during activation of muscle fibers.Rabbit skinned muscle fibers were rapidly and synchronously activated from the rigor state by photolysis of caged ATP in thepresence of Ca2+. At several different times during the switch from rigor to fully active tension development, the fibers wererapidly frozen on a liquid helium-cooled metal block, freeze-substituted, and examined in an electron microscope. The limitsof structural preservation and resolution with this technique were analyzed.We demonstrate that the resolution of our images is sufficient to draw the following conclusions about cross-bridge structure.
Rigor cross-bridges point away from the Z-line and most of them are wider near the thin filaments than near the backbone ofthe thick filaments. In contrast, cross-bridges in actively contracting fibers stretch between the thick and thin filaments at avariable angle, and are uniformly thin. Diffraction patterns computed from contracting muscle show layer lines both at 38 and43 nm indicating that active cross-bridges contribute mass to both the actin- and myosin-based helical periodicities. The imagesobtained from fibers frozen 20 ms after release ofATP show a mixture of rigor and active type cross-bridge configurations. Thereis little evidence of cross-bridges with the rigor shape by 50 ms, and the difference in configurations between 50 and 300 msafter photolysis is surprisingly subtle.
INTRODUCTION
Force development and shortening of muscle result from acyclic interaction between myosin heads and actin filaments.A useful hypothesis about this interaction is that structuralchanges in cross-bridges (myosin heads attached to actin fil-aments) underlie mechanochemical transduction during thecross-bridge cycle (1, 2). The structure and disposition ofcross-bridges in static states has been studied by x-ray dif-fraction and electron microscopy (EM). Longitudinal viewsof chemically fixed muscle in the rigor state (no ATP) showangled cross-bridges (1, 3-5). In insect muscle, the rigorcross-bridges are regularly arranged with a strong actin-filament-based periodicity (38.5 nm). The actin periodicityis present also in vertebrate, though weaker than in insect.This configuration is suggested to occur at the end of thepower stroke (6) and is dictated by a fixed angle of interactionbetween myosin heads and actin monomers (7-11). Musclefibers in other attached states, for example those in the pres-ence of the nonhydrolyzable ATP analogue adenosine 5'-(03,y-imino)triphosphate (AMP-PNP) show different config-urations (12, 13). However, there is no direct evidence thatthese structural states occur in the physiologically relevantcross-bridge cycle.
Recently, the structure of cross-bridges in muscle fibersduring steady-state contraction was preserved by rapid freez-ing and freeze-substitution, and conformational differencesbetween rigor and active cross-bridges were detected by EM(14-16). Cross-bridges in active fibers show highly variableshapes and angles with an average angle of -90° to the
Received for publication 28 December 1992 and in final form 17 March1993.C 1993 by the Biophysical Society0006-3495/93/07/397/12 $2.00
filament axis. Active cross-bridges maintain the myosin-based 14.3-nm periodicity. Some in vitro studies of isolatedmyosin heads bound to actin filaments in the presence ofATPalso show variable angles (Refs. 17-20, but see Pollard et al.(21)).
However, interpreting these images is difficult because theactive cross-bridges in these experiments are probably dis-tributed among all of the states of the biochemical and me-chanical cycles. Although each configuration of the cross-bridge may correspond to one specific state, the relationshipbetween structural, biochemical, and mechanical states is notclear. In order to progress in establishing this correlation,structural studies are required in conditions where the pop-ulations of mechano-chemical states are either known or atleast altered from the steady-state mixture.
Here we developed a new device that activates skinnedmuscle fibers by photolysis of caged ATP in the presence ofCa2 , while monitoring tension, and then rapidly freezes thefibers at selected times after photolysis to trap the structuralstates in the transient condition. The initial biochemical andmechanical condition of the cross-bridges (rigor) is the mostwell understood and their structure is fairly homogeneous.The relationship between the mechanical condition and thebiochemical state immediately after photolysis is thought tobe relatively simple and partially synchronized (22). "Snap-shot" images of the cross-bridges at several different timepoints during activation can be obtained by this approach.Some of the results have been briefly reported (23, 24).
MATERIALS AND METHODS
Experimental setupThe experimental setup is shown in Fig. 1. It is a "Cryo-Press" (Med-Vac,Inc., St. Louis, MO) modified to enable laser photolysis and tension meas-
397

Volume 65 July 1993
LIQUIDHEUUM
DELRINCLAMP
FIGURE 1 Top, a diagram of the freezing apparatus (modified from Cry-opress, Med-Vac Inc. (25)). The freezing head falls onto a liquid-helium-cooled block of copper coated with gold. An optical sensor triggers afrequency-doubled ruby laser for photolysis of caged ATP at preselectedtime points (20, 50, 80, or 300 ms before freezing). The time interval be-tween the laser pulse and freezing is adjusted by changing the positions ofthe optical sensor and the mirror. Bottom, a more detailed diagram of thefreezing head. Small bundles of one to five skinned fibers are wrapped withT-clips at both ends, and mounted between a hook connected to the tensiongauge (Akers 801, protected from excessive deflections (26)) and a clampon the freezing head.
urement. Samples were mounted on a freezing head attached to a plunger.The head was released to descend by gravity, and the sample was slammedonto a metal block cooled with liquid helium. The head was modified toincorporate attachment for the muscle fibers and a tension transducer. Thisallows us to monitor the tension up to the time of freezing. A semiconductorstrain gauge (Akers AE801) was extended by a thin carbon rod. A steel hookwas attached to the carbon rod 2.5 mm from the end of the strain gauge. Thetransducer housing provided mechanical limitation to the motion of thestrain gauge to protect it from breakage during the freezing event. The metalblock was ultrapure copper polished to a mirror finish and plated with gold.In order to provide clearance for the transducer protection cap and fixedmounting clamp, the diameter of the top part of the block was reduced to10 mm. A specimen mount was made from an appropriately trimmed, easilyremovable aluminum disk (25, 26). Two plastic spacers (0.5-mm thick) anda block of 2.5% agar (0.5- to 0.75-mm thick, 5 mm long) were glued with
cyanoacrylate ester to the disk. The agar served as a cushion behind the fiber.A thin smear of vacuum grease around the free edges of the disk preventedsolution leakage. Segments of muscle fibers equal in length to the agarcushion were wrapped with T-clips at both ends (27). The T-clips were madewith long tails that fit into the delrin-fixed clamp at one end and over theforce transducer hook at the other end of the freezing head.
An auxiliary device was made to exchange solutions. Several small,shallow wells (diameter, -8 mm) made of Teflon were embedded in analuminum plate. Each well had a magnetic stirrer. The freezing head witha sample was attached to a bridge above the well with the sample side down.The head was gently lowered so that the sample was immersed in the so-lution. The surface of the solution (- 100 ,il/well) was higher than the edgeof the well. In this way only the muscle fibers were immersed in a solutionand the other parts (e.g., transducer) were kept dry.A frequency-doubled ruby laser was used to produce the laser pulse for
photolysis (30 ns, at 347 nm) (28). Aiming of the laser beam was done bychanging the position and orientation of the mirror. The time for descent ofthe head was -200 ms. Thus, for time intervals shorter than -200 ms, cagedATP was photolyzed while samples were dropping toward the metal block.During the fall, a flag attached to the plunger passed through an opticalsensor and thus triggered the laser pulse. Timing of the trigger was controlledby changing the height of the optical sensor. For the longer time points adigital pulse generator delivered the timing pulses that triggered the laserprior to the fall of the freezing head. In a series of 20 trials with the samesettings the time interval between the laser pulse and the freezing varied byno more than 2.5 ms for a 250-ms time interval and 0.5 ms for a 20-msinterval.
Preparation of muscle fibersFiber bundles from rabbit psoas muscle were skinned in relaxing solution(104 mM potassium propionate, 5 mM MgCl2, 10 mM EGTA, 20 mM1,4-piperazinediethanesulfonic acid (PIPES), 4.6 mM ATP, 0.1 mM phen-ylmethylsulfonyl fluoride, pH 6.9) plus 0.5% Triton X-100 at 40C for 1-2h, rinsed with the same solution without Triton X-100, transferred to 50%glycerol either in relaxing solution or in rigor solution (same as relaxingsolution but without ATP), and kept at -20°C up to 1-2 days.
Single fibers or groups of two to five fibers, -5 mm long, were dissectedfrom the skinned bundles under silicone oil, attached to T-clips, and mountedon the freezing head. They were sequentially put into rigor solution withoutglycerol, into rigor solution containing calcium (1.2 mM MgCl2, 20 mMcalcium EGTA, 33 mM 1,6-diaminohexane-N,N,N'N'-tetraacetic acid(HDTA), 100 mM N-tris(hydroxymethyl)methyl-2-aminoethanesulfonicacid (TES), 10 mM glutathione, pH 7.1), and finally in the same solutionplus 10mM caged ATP. Excess solution was removed by aspiration, and thenthe fibers were frozen at a preselected time after photolysis of caged ATP.We chose to examine four time points after photolysis, 20, 50, 80, and 300ms. The range oftimes measured on actual traces were 18-25, 40-50, 75-85,280-290 ms. After freezing, the head was quickly transferred into liquidnitrogen, and the T-clips were cut using scissors. The aluminum disk withfrozen sample was detached from the head and stored in liquid nitrogen.
Electron microscopyThe samples were freeze-substituted with 2% OS04 in acetone at -800C for2 days, warmed to -200C, transferred to fresh OsO4/acetone and kept for-2 h. They were then warmed to room temperature and rinsed with acetone.The agar block with the muscle fiber was detached from the aluminum disk.The samples were stained en block with 1% uranyl acetate in acetone at roomtemperature and embedded in araldite. Sections were cut tangent to thefrozen surface, with the direction of cutting being perpendicular to the fil-ament axis. They were stained with potassium permanganate and lead citrateand examined in a Philips EM410 electron microscope. Images showing noice damage were used for analysis.
Image analysisSelected regions of the micrographs were digitized using a scanning flatbedmicrodensitometer (Perkin-Elmer IOIOG) with a step size of 50 Al for im-
Biophysical Journal398

Time-resolved EM of Muscle Fibers
ages taken at a magnification of44,400 or 25 ,ul for images at magnificationsfrom 17,700 to 33,900. Fourier transforms, filtered images, and modeledimages were calculated using the Semper image processing system (Syn-optics Ltd.) on a Sun4/330 computer.
The position of the meridional reflection at - 14 nm in the diffractionpatterns was taken as 14.3 nm, and all other spacings were scaled relativeto 14.3 nm. The images were also rotated to set the equator of the Fouriertransform horizontal and made orthogonal by lateral shearing to set themeridian (as defined by the maximum intensity of the - 14-nm meridionalspot) vertical. Power spectra of the Fourier transforms from the correctedimages were then added together to enhance the diffraction spots relativeto background.
Catalase crystalsCatalase crystals were used to investigate the resolution capabilities of ourfreeze-substitution technique. Tiny droplets of a slurry of bovine liver cat-alase crystals (Sigma Chemical Co., St. Louis, MO) were rapidly frozen byimmersing them in a liquid propane/isopentane mixture (29), freeze-substituted and embedded, sectioned and examined as described above.Lattice distortions in these images were corrected by a standard "unbending"procedure (30). Briefly, a reference unit cell was cross-correlated with theimage to be "unbent." The peaks in the resultant cross-correlation map wereindexed, thereby defining their locations in an ideal lattice. The actual andideal locations of this set of lattice points were used to construct a two-dimensional warping function. This function guided the interpolation nec-essary to remove the geometric distortion of the original image.
Modeling of cross-bridgesIn order to test the effects of the limited resolution and background densityfluctuations on visibility of cross-bridges, we produced model images ofstylized cross-bridges and treated them to mimic real EMs. The originalmodel was blurred by multiplying the Fourier transform of the image by acircular Gaussian filter function with a value of 1.0 at the origin and 0.2 at
radius corresponding to 7 and 10 nm for the model images at 7- and 10-nmresolution. This blurring is intended to simulate the loss of fine detail causedby our freeze-substitution, embedding, sectioning, and EM imaging pro-cedures. To these blurred model images we added noise to simulate theeffects of variable staining, film granularity, and other random density fluc-tuations. The spectral distribution of this added noise was taken directly fromourEM images by the following procedure. Periodic densities in the Fouriertransform from a typical EM were masked. After randomizing the phase, theinverse transform was calculated to create "noise." The blurred model im-ages with noise added were then filtered by multiplying the Fourier trans-form by a low-pass filter function that has a value 1.0 out to an appropriateradius and then falls as a Gaussian decay.
RESULTS
Structural preservation and resolution
In order to study the configuration of cross-bridges in variousfunctional states, we must insure sufficient resolution andgood preservation of the structure of the sarcomere. The spa-tial resolution of an EM image of a freeze-substituted, em-bedded, and sectioned protein array was estimated using aslurry of catalase crystals frozen in a liquid propane/isopentane mixture and processed using the same methods asthe muscle fibers. Images of regions of the sections that hap-pened to be oriented appropriately (i.e., showing clear latticelines in two directions) were digitized, unbent as describedunder the Materials and Methods section, and the Four-ier transform (FT) was calculated. We display as two-dimensional density plots the results of the FT calculation asgray scale plots of the power spectrum (magnitude squared)of the FT as a function of spatial frequency. These computedpower spectra are termed "diffraction patterns," by analogy
FIGURE 2 The diffraction pattern computed from a thinsection of freeze-substituted and embedded catalase crys-tals. The diffraction pattern was calculated from a digitizedand unbent EM image, and displayed as the ratio of pixelamplitude to local mean amplitude. The peaks significantlyabove background are marked by small circles. The samplewas a slurry of small crystals in random orientations. Thechosen image apparently included a superposition of morethan one crystallite, since at least two different lattices wereobserved, one of which is marked by the dashed line. Thelarge circle indicates a reciprocal spacing of 2.5 nm. Thepeaks on the lattice points demonstrate that the apparentresolution of the image is about 2.6 nm.
399Hirose et al.

Volume 65 July 1993
to the usual presentation of x-ray diffraction analysis. Thediffraction pattern from a digitized and unbent EM image isshown in Fig. 2. The significant peaks in the spectrum aremarked with small circles. At least two different lattices werepresent in the selected region, one of which is marked by thegrid. The large circle indicates a resolution of 2.5 nm. Latticereflections out to -2.6 nm are present in the power spectrumindicating the resolution of the periodic parts of the image isbetter than 3 nm. Power spectra of images before unbendingshowed significant lattice reflections to -3.6 nm. The re-lationship of these results on freeze-substituted catalase crys-tals to interpretation of the muscle fiber images is treatedunder the Discussion section.
Fibers frozen at short and long intervals after activationshow well-maintained lateral order of the sarcomere struc-ture and regular cross periodicities (Fig. 3). The M-lines andZ-lines are nearly perpendicular to the filament axis. In activefibers the lateral alignment is typically better with the pho-tolysis technique than we have been able to achieve whenusing activation by solution exchange. The computed dif-fraction patterns from images of rigor and active fibers showmany clear features, but the resolution apparent from thediffraction patterns was not as high as from the catalase crys-tals. Since contribution from nonperiodic features in the im-ages would mask true periodicities in the diffraction patterns,
a _ .s__.nn1KA; _i':}qt
:.:
1.0 pm
FIGURE 3 Low magnification images of muscle fibers frozen at 50 ms
(a) and at 300 ms (b) after photolysis of caged ATP, showing that thestriations remain well aligned during activation.
we summed diffraction patterns from several regions to im-prove the signal-to-noise ratio. For this analysis, the imageswere scaled and rotated to align them as described under theMaterials and Methods section. The averaged diffraction pat-tern for a set of fibers at 50 ms (Fig. 4 a) shows a numberof meridional and layer line reflections in the region from 43nm out to 7.2 nm. Fig. 4 b shows a plot of the summedintensity within a vertical band corresponding to -6 nm oneither side of the meridian using fibers in rigor and at 50 and80 ms. Several myosin-based peaks (43, 22, 14, 7.2 nm) andactin-based peaks (36, 19, 5.9 nm) are clearly evident in thelogarithmic plot of this summation. These results indicatethat the periodic structures in the fibers are preserved at leastto 6-7-nm resolution. Throughout the paper, the first actinlayer line is denoted by a definite value (36 or 38 nm), whereit could be precisely determined, or by an intermediate value(-37 nm) where it could not be measured accurately enoughto distinguish between 36 and 38 nm.
Structural changes following activation
EM images of muscle fibers in the transient structural statesduring activation from the rigor state were obtained by ul-trarapid freezing following laser photolysis of caged ATP.Tension shows a transient dip in the first 20 ms after pho-tolysis indicating cross-bridge detachment and reattachment,followed by an increase to a plateau at approximately 100 ms.
Images of longitudinal sections 40-70-nm thick showclear structural differences between fibers frozen in rigor(Fig. 5 a) and 80 ms after activation by photolysis of cagedATP (Fig. 5 b). The structure of rigor muscle is relativelyregular (Fig. 5 a); periodic striations (average spacing, 36nm) perpendicular to the filament axis are seen, suggestingregular arrangement of cross-bridges. A 36-nm periodicity isnot visually apparent in images of active fibers (Fig. 5 b).Finer striations are seen in some regions, but only verylocally. Overall the disposition of the cross-bridges is lessordered.The computed, averaged diffraction pattern from rigor fi-
bers (Fig. 6 a) shows a strong and rather broad layer line witha peak position at a spacing of 36 nm. This spacing corre-sponds to the periodicity of the lateral striations observed inthe overlap region of images of rigor fibers (Fig. 5 a). It isthought to arise from cross-bridges bound regularly alongthin filaments having a helical structure with a half-pitch of36 nm. The thick-filament-derived 43-nm layer line is visiblebut weak (Fig. 6, a and c).
In the diffraction pattern from the fibers frozen 80 ms afterphotolysis (Fig. 6 b), layer lines at 38 and 43 nm are bothclearly visible, and their intensities are similar (Fig. 6, b andd). These two layer lines are resolved only when 10 or morediffraction patterns are averaged. The peak intensity alongthe 38 nm layer line is closer to the meridian than that of the36 nm layer line in rigor. The plots of intensities integratedin the direction parallel to the equator (Fig. 6, c and d) in-dicate the existence of several additional reflections, whichare weakly seen in the two-dimensional patterns. Peaks with
Biophysical Journal400

Time-resolved EM of Muscle Fibers
a. 5Oms bt RigoR +.&sQ +oQ-m
10 7.2 5.9'I, . '0
1/ Spacing (nm)FIGURE 4 (a) An averaged diffraction pattern computed from digitized images of the fibers frozen at 50 ms after the photolysis laser pulse. Eight selecteddiffraction patterns from the overlap regions were used to calculate the average. The myosin-derived meridional layer line with a spacing of 7.2 nm is visible.(b) A graph showing density distribution of a computed, averaged diffraction pattern. An average of 82 different diffraction patterns from the overlap regionsof the fibers frozen in rigor, and at 50 and 80 ms after activation was used. The intensities in the region within - 1/6 nm-' of the meridian were added togetherin the direction parallel to the equator, as if the intensity within a narrow slit parallel to the equator was summed. The background (approximated by a seriesof linear segments) was subtracted from the logarithm of integrated intensity. The result is plotted against spatial frequency in the meridional direction.Spacings of the significant peaks were calculated assuming the strongest myosin reflection to be 14.3 nm. The approximate distances in real space are indicated.A peak at 5.9 nm is evident.
spacings that are harmonics of 43 nm (22 nm), and of 36-38nm (18-19 and 13 nm) are seen both in rigor and at 80 ms,but more clearly in the latter. The plot from rigor muscle hasa fairly strong peak at 24 nm.EM images of thinner longitudinal sections (-30 nm) in
the (1,1) planes of rigor fibers are dominated by angled cross-bridges giving the appearance of arrowheads pointed towardthe M-line (Fig. 7 a). Profiles of cross-bridges lying in theplane of the section are visualized. Most cross-bridges havea triangular shape, with the base near the thin filament andapex near the thick filament shaft (Fig. 7 a, black and whitearrowheads). We refer to cross-bridges with a triangularshape and angled orientation as the "rigor configuration."There is a fair degree of order; fine periodicities can be seenacross the A-band, although they are more difficult to see inthis thin section than in the thicker sections as shown in Fig.5. Periodic beading (increased width or density) of the thinfilament is visible due to cross-bridges arising from the outof plane thick filaments. The computed diffraction patternclearly shows the 14.3-nm myosin layer line, and the-37-nm actin layer line. The structure of fibers frozen inrigor solution plus caged ATP but without photolysis is sim-ilar to standard rigor.
At 20 ms after photolysis the tension is just beginning torise following the initial decrease. Extensive cross-bridgeattachment is observed in the EMs in most regions of theoverlap zone (Fig. 7 b), but the average cross-bridge angleis different from that in rigor, so that the arrowhead appear-ance is lost. Some cross-bridges point toward the M-line, butothers are at approximately right angles to the thin filamentsor point toward the Z-line. The fine periodicities across theA-band are visible over very short distances. Some cross-bridges are triangular as in rigor, but most are thinner andhave more uniform thickness in the interfilament space. Al-though weaker than in rigor, both the myosin 14.3-nm and
actin -37-nm layer lines are present in the computed dif-fraction pattern. Overall there is less appearance of order thanin rigor due to more variation in cross-bridge dispositions indifferent areas and less regular beading of the thin filaments.Some regions have few attached cross-bridges.
At 50 ms after photolysis, the tension has risen to ap-proximately half of the maximum isometric tension, at 80 msit is at 70-90% of maximum, and at 300 ms it has reachedthe plateau. At 50 ms the angle of the cross-bridges is vari-able, but the average angle is approximately perpendicular tothe filament axis (Fig. 7 c). In some regions a 14.3-nm axialperiodicity predominates near both myosin and actin fila-ments (15). Cross-bridges with triangular shape are rare, andmost of the cross-bridges are thinner than in rigor. With re-spect to those cross-bridges at 20 ms that are not in the rigorconfiguration, there is no obvious difference in appearancebetween 50 and 20 ms. In the computed diffraction patternat 50 ms, the 14.3-nm reflection is visible. At 80 (not shown)and 300 ms (Fig. 7 d), both the image and diffraction patternare similar to those at 50 ms.
Averaged diffraction patterns from 20-40 images from fi-bers at 50 ms (data not shown) clearly show lines at 38 and43 nm, such as illustrated in Fig. 6, a and d, for fibers at 80ms. Patterns from a single image however are too noisy toresolve the two lines. At 20 and 300 ms we did not have asmuch data so we did not obtain average patterns.
DISCUSSION
Flash and smash method
By combining photolysis of cagedATP and rapid freezing wecaptured transient structural states of cross-bridges in musclefibers after activation and correlated these states with forceproduction of the fibers. The tension measured on the freez-
Hirose et al. 401

Volume 65 July 1993
o 2 pm
FIGURE 5 Micrographs of longitudinal sections of a fiber in the rigor state (a) and a fiber frozen 80 ms after activation by caged ATP photolysis (b).The M-lines are in the center of the micrographs. Fine striations perpendicular to the filament axis are seen in the overlap regions, especially in the rigorfiber, indicating some regularity in the disposition of cross-bridges. The appearance of the overlap region in the active fiber is more disordered than in therigor fiber.
ing head until impact was similar to that observed previously(22). The minimum time interval between activation andfreezing (- 15 ms) and the time required for freezing (<1Ims)are short compared to the cycle time for the cross-bridgeATPase in muscle fibers (300 ms (31)). The approach hasseveral major advantages over the use of steady state con-tractions: 1) transitional states during activation of the cross-bridges can be studied; 2) the sarcomere structure obtainedis much more orderly (Fig. 2), probably because activationof the fibers is uniform and the time interval between acti-vation and freezing is short.
Several structural studies on muscle fibers have used pho-tolysis of caged ATP to partially synchronize cross-bridgesas they are rapidly activated from the well-defined rigor state.Electron paramagnetic resonance (32, 33) and fluorescencespectroscopy (34) following photolysis of caged ATP withinrigor muscle fibers have indicated a rapid disordering of thecross-bridge array before the main force development. X-raydiffraction (35) showed a rapid decrease in the ratio of equa-torial reflections II/I1o preceding tension development anda slower increase in the 14.3-nm reflection. Our approachusing electron microscopy allows observation of individualmolecules in the images, and also permits measurement of
average periodic spacings and relative mass distribution fromthe computed transforms.
Preservation and resolution
A crucial point for interpretation of the present electron mi-crographs is the degree of preservation of the native ultra-structure and the resolution at which the structure can bedetected. Freeze-substitution is known to give excellent pres-ervation of cytoplasmic structures (36, 37). Our freeze-substituted catalase crystals and rabbit muscle fibers showedresolution of periodicities smaller than 3 and 6-7 nm, re-spectively. Freeze-substitution of muscles intrinsically moreordered than rabbit showed reflections at 6-7 nm (frog mus-cle (38, 39)), and -6 nm (insect muscle (M. K. Reedy, DukeUniversity, personal communication)).
These two values (<3 nm in catalase, 6-7 nm in muscle)obviously cannot be equated directly because the proteincrystal has considerably more order than a muscle fiber. Con-tacts between the protein molecules in the crystal retain theindividual subunits on a regular lattice and at precise ori-entations. Thus periodic diffraction spots due to the regulararrangement of the molecules on a lattice are much more
402 Biophysical Joumal

Time-resolved EM of Muscle Fibers
14 d 14C, 4, I
.0
a
0-i
364,
.?
0)
0-J
13
1 / Spacing (nm) 1 / Spacing (nm)
FIGURE 6 Computed, averaged diffraction pattems from 37 selected areas of overlap regions from A-bands in the rigor state (a) and 39 selected areasof overlap regions at 80 ms (b). c and d are logarithmic plots of summed intensities in a and b, integrated in the direction parallel to the equator as in Fig.4. The diffraction pattern from rigor fibers has a strong, rather broad layer line at a spacing of 36 nm, whereas the pattem from active fibers shows twosharp layer lines at 43 and 38 nm. The 14.3-nm myosin meridional reflection is strong in both cases. In rigor, a layer line at 24 nm is fairly strong. Thislayer line is not clear in the pattern from active fibers.
intense in the crystal than in a muscle. On the other hand, ifwe consider the basic similarity in amino acid backbone andside groups away from the crystal contacts, there is no reasonto expect major differences between catalase and muscle pro-teins with respect to distortion introduced by processing.Thus small features, such as edges of the protein subunits thatresult in the observed image contrast are likely to be pre-served to a similar extent in the two types of specimen.The apparent resolution estimated from the periodic den-
sities in the diffraction patterns is worse than the true res-olution due to factors such as low long-range order of thenative structure, artifactual distortion, noise in the images, ortrue physiological variability of the disposition of the pro-teins. That some periodic features of the images are obscuredby random diffuse intensity variations induced by the abovefactors is indicated by the increased relative intensity of pe-riodic densities in averaged compared to nonaveraged dif-fraction patterns. In muscle fibers, although periodic registerin the cross-bridge arrangement is observed as striations per-pendicular to the filament axis, the register is not accuratelymaintained over the entire image (Figs. 5 and 7). Thus, itwould be more difficult to see the higher order reflections inthe diffraction patterns from muscle fibers than in the pat-terns from a crystal, even if small details were equally wellpreserved in the two samples. The intensities at spacings
smaller than 14.3 nm were usually weak in the diffractionpatterns from single half sarcomeres in thin sections of mus-cle fibers. In this case, an important limiting factor is prob-ably the intrinsic long range disorder and structural variationsin the original structure, rather than a lack of preservation ofsmall details by the freeze-substitution technique.We observed that the cross-bridges in the images obtained
following photolysis of caged ATP were very different fromthose in rigor, with considerable variation in the shape andangle. A crucial issue in interpreting these observations ofmicrographs with limited resolution and noise is the extentto which the observed variations are indicative of real struc-tural differences between cross-bridges in the muscle fibers.We have examined this issue using model images to test thereliability of detecting changes in the shape and orientationof the cross-bridges. The major shape variation is a profilethat is either uniform across the interfilament space or tri-angular, with a broad base next to the thin filament (5, 15,16, 40). Differences in orientation appear as variations in thedirection and degree of tilt of the cross-bridges relative to thefilament axis.EMs were simulated by creating a model of cross-bridges,
and then by blurring and adding "noise" created from in-tensity variations in the actual micrographs. The "noise" con-tains fluctuations derived from nonperiodic real structures in
403Hirose et al.

Volume 65 July 1993Biophysical Journal
aFreeze
Drop 4
200 ms
bFreeze
Drop ATP
I ,,
1m20 ms
Freeze d FreezeC rop I> r,DropDrop ATP . ..
50 ms
404
I.. F, -
-4*-4p - 1.
.1." 4t.,
-K
go ..... S
Time-resolved EM of Muscle Fibers
the muscle as well as resulting from specimen preparationand the imaging process (see Materials and Methods). Fig.8, e-l, shows models of cross-bridge densities with eitheruniform width or a triangular shape and with angles of 650,790, or 950 relative to the filament axis. With these angles,the axial positions of the distal end of the cross-bridges at thecenter of the thin filament are shifted by 8, 3, and -1 nm
toward the M-line from their origin on the thick filamentsurface. The axial displacement in these model densities issimilar to that previously used in a model that explainschanges in the 14.3-nm meridional x-ray reflection duringforce generation (41). The original model (Fig. 8 e) was
blurred to give a resolution either slightly worse (20% con-
trast at 7 nm, Fig. 8 g) or much worse (20% contrast at 10nm, Fig. 8 j) than the estimated lowest resolution of our
images. The blurring is intended to simulate the loss of finedetail caused by the freeze-substitution, embedding, section-ing, and EM-imaging procedures. To the blurred model im-ages we added "noise" to simulate the effect of variable stain-ing and other random density fluctuations as described underthe Materials and Methods section. The "noise" used is an
estimation of the real noise due to specimen preparation andimaging process, but also contains some density fluctuationsderived from nonperiodic real structures in the muscle. Be-cause nonperiodic, but real structural variation (e. g., cross-
bridges with variable angles) contributes to the diffuse in-tensity in the power spectrum of our real images, the "noise"added to the model images overestimates the actual truenoise. After blurring and noise addition, the model images(Fig. 8, h and k) are very similar to our unprocessed micro-graph (Fig. 8, a and b). Recognition of cross-bridge shapesand angles is made easier by low-pass filtering that removesthe very small-scale density fluctuations or random specklesmaller than the significant structural features. The results ofapplying the same low-pass filter to an original micrographsand to the noisy blurred model data is shown in Fig. 8, c andd, and Fig. 8, i and 1.
Careful examination of the images permits one to classifyreliably different individual cross-bridges as to shape andangle. The five authors of this paper tested visual discrim-ination of 120 blurred noisy model sites at 7- and 10-nm
resolution (Fig. 8, i and 1) containing either a cross-bridge or
no cross-bridge. At 7-nm resolution, a mistake in recognizinga missing cross-bridge was made in 3 ± 3% of the cases, a
mistake in assigning the right shape was made in 8 ± 3% ofthe cases, a 300 error in angle assignment was made in 4 ±
4%, and a 15° error in 27 ± 4% of the cases. At 10-nmresolution the errors were 6 ± 2, 14 ± 4, 8 ± 3, and 315%. These results show that, despite the limited resolution ofour micrographs, we can expect to resolve some shape dif-ferences (triangular versus uniformly thin) and an angulardifference of -30°. A 150 difference in angle is detected lessreliably, but still quite well at 7-nm resolution.
Structure of active and rigor cross-bridges
Cross-bridges in the fibers during steady contraction havepreviously been reported to differ from rigor cross-bridgeswith respect to their periodicities, angles, and shapes (14-16). Our images and diffraction patterns from the fibers ac-
tivated by caged ATP photolysis also show clear differencesfrom the rigor fibers. Averaging of the diffraction patternsrevealed additional features. Two layer lines were observedin the region near 40 nm, one with a 43-nm periodicity de-rived from thick filaments and another with a 38-nm thin-filament-derived periodicity (see also Ref. 14). Both of theselayer lines were also observed in rapidly frozen frog fibersactivated from the relaxed state by photolysis of caged Ca2+(39, 42). The diffraction pattern from the rigor fibers showeda layer line at 24 nm, which was previously observed in x-raydiffraction studies (43, 44). The origin of this layer line inrigor muscle is an interaction between thin and thick filamentperiodicities as described earlier (45).The changes that we observed in our images are consistent
with those previously observed in in vitro studies. Three-dimensional reconstructions of isolated filaments (9-11)show that myosin heads bound to actin filaments in rigorhave a fixed attachment angle, producing the characteristicarrowhead appearance. When myosin heads are trapped on
isolated actin filaments in the presence ofATP by either neg-ative staining or rapid freezing, they have variable config-urations, which are different from rigor (Refs. 17-20, but see
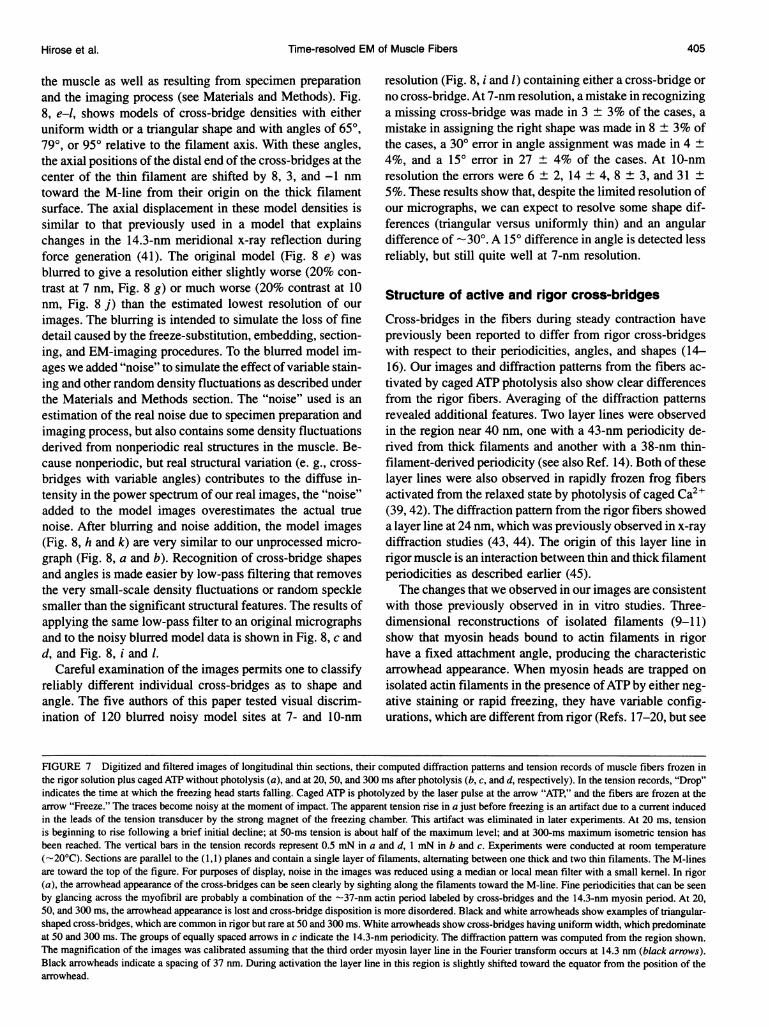
FIGURE 7 Digitized and filtered images of longitudinal thin sections, their computed diffraction patterns and tension records of muscle fibers frozen inthe rigor solution plus caged ATP without photolysis (a), and at 20, 50, and 300 ms after photolysis (b, c, and d, respectively). In the tension records, "Drop"indicates the time at which the freezing head starts falling. Caged ATP is photolyzed by the laser pulse at the arrow "ATP," and the fibers are frozen at thearrow "Freeze." The traces become noisy at the moment of impact. The apparent tension rise in a just before freezing is an artifact due to a current inducedin the leads of the tension transducer by the strong magnet of the freezing chamber. This artifact was eliminated in later experiments. At 20 ms, tensionis beginning to rise following a brief initial decline; at 50-ms tension is about half of the maximum level; and at 300-ms maximum isometric tension hasbeen reached. The vertical bars in the tension records represent 0.5 mN in a and d, 1 mN in b and c. Experiments were conducted at room temperature(-20°C). Sections are parallel to the (1,1) planes and contain a single layer of filaments, alternating between one thick and two thin filaments. The M-linesare toward the top of the figure. For purposes of display, noise in the images was reduced using a median or local mean filter with a small kernel. In rigor(a), the arrowhead appearance of the cross-bridges can be seen clearly by sighting along the filaments toward the M-line. Fine periodicities that can be seenby glancing across the myofibril are probably a combination of the -37-nm actin period labeled by cross-bridges and the 14.3-nm myosin period. At 20,50, and 300 ms, the arrowhead appearance is lost and cross-bridge disposition is more disordered. Black and white arrowheads show examples of triangular-shaped cross-bridges, which are common in rigor but rare at 50 and 300 ms. White arrowheads show cross-bridges having uniform width, which predominateat 50 and 300 ms. The groups of equally spaced arrows in c indicate the 14.3-nm periodicity. The diffraction pattern was computed from the region shown.The magnification of the images was calibrated assuming that the third order myosin layer line in the Fourier transform occurs at 14.3 nm (black arrows).Black arrowheads indicate a spacing of 37 nm. During activation the layer line in this region is slightly shifted toward the equator from the position of thearrowhead.
Hirose et al. 405

Volume 65 July 1993
a micrograph of a rigor fiber b micrograph of an active fiber=s. _ . b.. .. -...
C filtered from a d filtered from b
e original model
....
f e±+noise...... u-
g original model at 7 nm resolution
iY..
h g +noise
i filtered from h
j original model at 10 nm resolution
k I+ noise
1 filtered from k
FIGURE 8 Micrographs (a-d) and computer-calculated models (e-l)that show various cross-bridges. The M-line is toward the right side of thefigure. a and b are small portions of the micrographs of a rigor fiber andan active fiber, respectively (raw data). c and d are the low-pass filteredimages from a and b, respectively. These filtered images were calculated byweighting the Fourier transform from the original image by a low-pass filterfunction that has value 1.0 out to a resolution of 5.7 nm, then falls as a
Gaussian decay to lie at 5.4 nm. e is a model of longitudinal sections witha mixture of cross-bridges that have either triangular shape or uniform thinwidth, and an angle of either 650, 790, or 950 with respect to the filamentaxis. Inf, noise was added to the original model to imitate real EM images.The shapes and angles of the cross-bridges are still very clear in the modelimage with noise (f). In g, the resolution of the model image was set at 7nm (see Materials and Methods). In h, the same noise as used infwas addedto g. Note that the overall appearance of this model is similar to the realmicrographs. i is a low-pass filtered image from h. The low-pass filterfunction used has a value 1.0 out to 7 nm, then falls as a Gaussian decayto lie at 6.5 nm. The blurred model images were calculated also at poorer
resolution (10 nm). j, k, and 1 are the results corresponding to g, h, and i,but with 10-nm resolution. The low-pass filter function used for calculat-ing I has a value 1.0 out to 9.5 nm, and falls as a Gaussian decay to lie at9.0 nm.
Pollard et al. (21)). Spectroscopic studies also show that inrigor the cross-bridges attach with a fixed attachment angle,but during active ATPase activity, the heads have variableangles and are dynamically mobile (46-48).
In rigor fibers, cross-bridges adopt the periodicity of theactin filaments, although this is less striking in muscles ofvertebrates than in those of invertebrates (5, 49, 50). Onactivation, cross-bridges shift from thin filament periodicitytoward a stronger retention of the thick filament spacing (14,15), as confirmed here by a decrease in intensity of the actin36-nm layer line. The increase in intensity of the 43-nm layerline relative to rigor may be attributed to a greater contri-bution by cross-bridge mass along the thick filament helix.
In addition to the increase in intensity on the 43-nm layerline, we also observed the appearance of a layer line at 38nm. These results suggest that in contraction the cross-bridges adopt periodicities defined by both the thick and thinfilaments. In rigor the mass of the actin binding region ofboth heads of the myosin are constrained to attach specifi-cally to actin on target zones where the azimuthal orientationis dictated by the actin helix. This may explain the stronglayer line indexing on the 36-nm spacing of the long-pitchactin helix. If the azimuthal orientation of myosin attachedto actin during contraction is less constrained, then the regionalong the thin filament where attachments could occur wouldbe extended (45). Intensity on the 36-nm layer line would bediminished and the 14.3-nm meridional intensity, derivedfrom the thick filament, would be enhanced. We observe theformer, but we cannot confirm the latter from present data.We observed a shift in layer line position, from 36 nm with
a peak far from the meridian in rigor, to 38 nm with a peakmuch closer to the meridian in active fibers. One possibleexplanation might be that the actin helical repeat increases.However, it seems unlikely that the actin filament alone ac-counts for this change in view of the substantial shift of thepeak intensity toward the meridian (Fig. 6). A more likelyexplanation is that portions of the active cross-bridges takeup a periodicity strongly influenced by but not exactly thesame as the thin filament helix. In rigor the mass of thecross-bridges is located closer to the thin filaments and moretightly constrained by the actin periodicity. The presence ofthe 38-nm actin-based periodicity in active muscle providesstrong evidence that the active cross-bridges attach to actinat specific locations defined by the helical structure. Tsukitaand Yano (14) previously observed an -37-nm layer line infibers during steady contraction, but did not discuss the shiftfrom 36 nm in rigor to 38 nm in active fibers. In x-ray dif-fraction patterns, it has been difficult to resolve the 43-nmfrom the -37-nm layer line (51-53).
Time course of structural changes duringactivation
The time course of disappearance of the rigor configurationand development of the features of the actively force-generating cross-bridges are represented in the micrographsof fibers frozen 20, 50, 80, and 300 ms after release of ATP
406 Biophysical Journal
..- ..,... ..4.1-11-1.:__--Z 1-1 .--, a.z .
Hirose et al. Time-resolved EM of Muscle Fibers 407
from caged ATP. Based on the tension records (Fig. 7), on theknown kinetics ofATP liberation from caged ATP (-100 s-1(28)), and on the rates of cross-bridge detachment and re-attachment in rabbit fibers (22, 31), we would expect that atthe 20-ms time point, a small number of cross-bridges remainin the rigor configuration; most are not yet actively gener-ating force. Between 50 and 300 ms there is an increase inforce due to an increased number of cross-bridges activelygenerating tension.
At the 20-ms time point we observe cross-bridges in rigor-like configurations mixed with another population of cross-bridges with structures similar to fully active ones. Thesepopulations are distinguished by the triangular shape and tilttoward the Z-line of the rigor-like cross-bridges (15). Thereare few, if any, rigor-like cross-bridges in fibers frozen 50 or300 ms after photolysis. There are several possible expla-nations for this finding. One is that the active cross-bridgetakes a rigor configuration for a very short portion of thecycle, so that cross-bridges in this configuration represent avery small proportion of the population (22). Another pos-sibility is that rigor cross-bridges are double-headed, whileactive ones are single-headed (48, 54, 55), which would re-sult in a different appearance even if an individual activehead has the other attributes of the rigor cross-bridge, e. g.,attachment to a narrower target zone and tilt toward theZ-line. Finally, it is possible that the configuration of the rigorcross-bridge is never achieved by an actively cycling cross-bridge. An attached myosin head at the end of a cycle mighthave a shape different from that of a rigor head. In any caseour results indicate that the predominant cross-bridge statespopulated during active force generation are very differentfrom rigor cross-bridges, which are surprisingly rare.A second unexpected result is the general similarity in the
populations of cross-bridge configurations at 50 and 300 ms,although force approximately doubles over this interval. Onthe basis of the arguments presented earlier, we believe thestructural preservation in our samples is sufficient to havedetected major structural differences if they had been present.Mechanical and x-ray diffraction data indicate a 10-15-msdelay between cross-bridge attachment and the onset of ten-sion (56-58) suggesting that a 10-15-ms reaction step fol-lows attachment. This is an appreciable delay on the timescale of tension development in our experiments, and thus weexpected to observe separate populations of attached cross-bridges before and during generation of tension. There areseveral possible explanations for the similarity of distribu-tions of cross-bridge shapes at 50 and at 300 ms followingphotolysis: 1) the pre-tension state is of short duration, andthus that state is poorly populated. This possibility wouldrequire an alternative explanation for the onset of stiffnessand x-ray intensity changes prior to tension mentionedabove; 2) alternatively, the tension generating state is of shortduration and poorly populated; 3) the structural differencesbetween the two states are subtle, i. e., less than the variabilitybetween cross-bridges due to the periodicity mismatch be-tween the two sets of filaments and thermal motions. If thisis the case, it is puzzling how a small structural change can
slide the filaments 14 nm or more. 4) At 50 ms virtually allcross-bridges might already be in the steady distribution ofactively tension generating states. Since mechanical com-pliance at the ends of the fiber allows some sarcomere short-ening, the further tension development after 50 ms mightthen correspond to additional power strokes and filamentsliding. This further tension development might occur with-out a change in the overall distribution of cross-bridge con-figurations. However, tension development during the first300 ms is accompanied by splitting of only approximatelyone ATP molecule/cross-bridge (59), so this hypothesiswould suggest that cross-bridges can interact with severalactin monomers for each ATP molecule used (60).
We thank D. Appelt for expert assistance and discussions in developmentof the freezing system, Dr. T. Reese for advice on rapid freezing experi-ments, Dr. H. Higuchi for helpful discussions, M. Bell and J. Pili for expertelectronic and mechanical construction, X. Sun and N. Glaser for technicalassistance, and Dr. H. Takekura for help in preparing figures.Supported by an National Institutes of Health grant to the PennsylvaniaMuscle Institute, a National Science Foundation grant (to J. M. Murray), andby fellowships from the Naito Foundation and the MDA (to K. Hirose).
REFERENCES1. Reedy, M. K., K. C. Holmes, and R. T. Tregear. 1965. Induced changes
in orientation of the cross-bridges of glycerinated insect flight muscle.Nature (Lond.). 207:1276-1280.
2. Huxley, H. E. 1969. The mechanism of muscular contraction. Science(Washington D.C.). 164:1356-1366.
3. Reedy, M. K. 1968. Ultrastructure of insect flight muscle. I. Screw senseand structural grouping in the rigor cross-bridge lattice. J. Mol. Biol.31: 155-176.
4. Heuser, J. E. 1983. Structure of the myosin crossbridge lattice in insectflight muscle. J. Mol. Biol. 169:123-154.
5. Varriano-Marston, E., C. Franzini-Armstrong, and J. C. Haselgrove.1984. The structure and disposition of crossbridges in deep-etched fishmuscle. J. Muscle Res. Cell Motil. 5:363-386.
6. Lymn, R. W., and E. W. Taylor. 1971. Mechanism of adenosine tri-phosphate hydrolysis by actomyosin. Biochemistry. 10:4617-4624.
7. Moore, P. B., H. E. Huxley, and D. J. DeRosier. 1970. Three-dimensional reconstruction of F-actin, thin filaments and decorated thinfilaments. J. Mol. Biol. 50:279-295.
8. Taylor, K. A., and L. A. Amos. 1981. A new model for the geometryof the binding of myosin crossbridges to muscle thin filaments. J. Mol.Biol. 147:297-324.
9. Toyoshima, C., and T. Wakabayashi. 1985. Three-dimensional imageanalysis of the complex of thin filaments and myosin molecules fromskeletal muscle. IV. Reconstitution from minimal- and high-dose im-ages of the actin-tropomyosin-myosin subfragment- 1 complex. J. Bio-chem. 97:219-243.
10. Milligan, R. A., and P. F. Flicker. 1987. Structural relationships of actin,myosin, and tropomyosin revealed by cryo-electron microscopy. J. CellBiol. 105:29-39.
11. Milligan, R. A., M. Whittaker, and D. Safer. 1990. Molecular structureof F-actin and location of surface binding sites. Nature (Lond.). 348:217-221.
12. Reedy, M. C., M. K. Reedy, and R. S. Goody. 1987. The structure ofinsect flight muscle in the presence of AMP-PNP. J. Muscle Res. CellMotil. 8:473-503.
13. Padr6n, R., and H. E. Huxley. 1984. The effect of the ATP analogueAMP-PNP on the structure of crossbridges in vertebrate skeletal mus-cles: X-ray diffraction and mechanical studies. J. Muscle Res. CellMotil. 5:613-655.
14. Tsukita, S., and M. Yano. 1985. Actomyosin structure in contractingmuscle detected by rapid freezing. Nature (Lond.). 317:182-184.

408 Biophysical Journal Volume 65 July 1993
15. Hirose, K., and T. Wakabayashi. 1991. Conformations of crossbridgesin contracting skeletal muscle. Adv. Biophys. 27:197-203.
16. Hirose, K., and T. Wakabayashi. 1993. Structural change ofcrossbridgesof rabbit skeletal muscle during isometric contraction: J. Muscle Res.Cell Motil. In press.
17. Craig, R., L. E. Greene, and E. Eisenberg. 1985. Structure of the actin-myosin complex in the presence of ATP. Proc. Natl. Acad. Sci. USA.82:3247-3251.
18. Applegate, D., and P. Flicker. 1987. New states of actomyosin. J. Biol.Chem. 262:6856-6863.
19. Katayama, E. 1989. The effects of various nucleotides on the structureof actin-attached myosin subfragment- 1 studied by quick-freeze deep-etch electron microscopy. J. Biochem. (Tokyo). 106:751-770.
20. Frado, L.-L., and R. Craig. 1992. Electron microscopy of the actin-myosin head complex in the presence of ATP. J. Mol. Biol. 223:391-397.
21. Pollard, T. D., D. Bhandari, P. Maupin, D. Wachsstock, A. G. Weeds,and H. G. Zot. 1993. Direct visualization by electron microscopy of theweakly-bound intermediates in the actomyosin adenosine triphos-phatase. Biophys. J. 64:454-471.
22. Goldman, Y. E., M. G. Hibberd, and D. R. Trentham. 1984. Initiationof active contraction by photogeneration of adenosine-5'-triphosphatein rabbit psoas muscle fibres. J. Physiol. (Lond.). 354:605-624.
23. Hirose, K., T. D. Lenart, C. Franzini-Armstrong, and Y. E. Goldman.1991. Flash and smash: ultrastructure of rabbit muscle fibers rapidlyfrozen following photolysis of caged ATP. Biophys. J. 59:577a. (Abstr.)
24. Hirose, K., J. M. Murray, C. Franzini-Armstrong, and Y. E. Goldman.1991. Flash and smash: conformational changes ofmuscle fibers rapidlyfrozen following photolysis of caged ATP. J. Cell Biol. 115:334a.(Abstr.)
25. Heuser, J. E., T. S. Reese, M. J. Dennis, Y. Jan, L. Jan, and L. Evans.1979. Synaptic vesicle exocytosis captured by quick freezing and cor-related with quantal transmitter release. J. Cell Biol. 81:275-300.
26. Padr6n, R., L. Alamo, R. Craig, and C. Caputo. 1988. A method forquick-freezing live muscles at known instants during contraction withsimultaneous recording of mechanical tension. J. Microsc. (04). 151:81-102.
27. Goldman, Y. E., and R. M. Simmons. 1984. Control of sarcomere lengthin skinned muscle fibres of Rana temporaria during mechanical tran-sients. J. Physiol. (Lond.). 350:497-518.
28. Goldman, Y. E., M. G. Hibberd, and D. R. Trentham. 1984. Relaxationof rabbit psoas muscle fibres from rigor by photochemical generationof adenosine-5'-triphosphate. J. Physiol. (Lond.). 354:577-604.
29. Ward, R., and J. M. Murray. 1987. Natural propane cryogen for frozen-hydrated biological specimens. J. Electron Microsc. Tech. 5:275-277.
30. Henderson, R., J. M. Baldwin, K. H. Downing, J. Lepault, and F. Zem-lin. 1986. Structure ofpurple membrane from Halobacterium halobium:recording, measurement and evaluation of electron micrographs at 3.5A resolution. Ultramicroscopy. 19:147-178.
31. Goldman, Y. E. 1987. Kinetics of the actomyosin ATPase in musclefibers. Annu. Rev. Physiol. 49:637-654.
32. Fajer, P. G., E. A. Fajer, and D. D. Thomas. 1990. Myosin heads havea broad orientational distribution during isometric muscle contraction:time-resolved EPR studies using caged ATP. Proc. Natl. Acad. Sci. USA.87:5538-5542.
33. Ostap, E. M., V. A. Barnett, and D. D. Thomas. 1993. Steady-state andtransient detection of spin-labeled myosin's conformational changesduring ATP hydrolysis in the muscle fiber. Biophys. J. 64:361a.
34. Tanner, J. W., D. D. Thomas, and Y. E. Goldman. 1992. Transients inorientation of a fluorescent cross-bridge probe following photolysis ofcaged nucleotides in skeletal muscle fibres. J. Mol. Biol. 223:185-203.
35. Poole, K. J. V., Y. Maeda, G. Rapp, and R. S. Goody. 1991. DynamicX-ray diffraction measurements following photolytic relaxation and ac-tivation of skinned rabbit psoas fibres. Adv. Biophys. 27:63-75.
36. Bridgman, P. C., and T. S. Reese. 1984. The structure of cytoplasm indirectly frozen cultured cells. I. Filamentous meshworks and the cy-toplasmic ground substance. J. Cell Biol. 99:1655-1668.
37. Craig, R., L. Alamo, and R. Padr6n. 1992. Structure of the myosinfilaments of relaxed and rigor vertebrate striated muscle studied byrapid freezing electron microscopy. J. Mol. Biol. 228:474-487.
38. Lepault, J., I. Erk, G. Nicolas, and J.-L. Ranck. 1991. Time-resolved
cryo-electron microscopy of vitrified muscular components. J.Microsc. (04). 161:47-57.
39. Lenart, T. D., T. StC. Allen, R. J. Barsotti, G. C. R. Ellis-Davies, J. H.Kaplan, C. Franzini-Armstrong, and Y. E. Goldman. 1992. Mechanicsand structure of cross-bridges during contractions initiated by photol-ysis of caged Ca2 . In Mechanism of Myofilament Sliding in MuscleContraction. H. Sugi, editor. Plenum Press, New York. 475-486.
40. Bard, F., C. Franzini-Armstrong, and W. Ip. 1987. Rigor crossbridgesare double-headed in fast muscle from crayfish. J. Cell Biol. 105:2225-2234.
41. Irving, M., V. Lombardi, G. Piazzesi, and M. A. Ferenczi. 1992. Myosinhead movements are synchronous with the elementary force-generatingprocess in muscle. Nature (Lond.). 357:156-158.
42. Murray, J. M., T. D. Lenart, C. Franzini-Armstrong, and Y. E. Goldman.1993. Structural changes in cross-bridges of skinned muscle fibers ac-tivated by photolysis of caged Ca2" and rapidly frozen for electronmicroscopy. Biophys. J. 64:26a. (Abstr.)
43. Huxley, H. E., and W. Brown. 1967. The low-angle X-ray diagram ofvertebrate striated muscle and its behaviour during contraction and rig-or. J. Mol. Biol. 30:383-434.
44. Haselgrove, J. C. 1975. X-ray evidence for conformational changes inthe myosin filaments of vertebrate striated muscle. J. Mol. Biol.3 92:113-143.
45. Haselgrove, J. C., and M. K. Reedy. 1978. Modeling rigor cross-bridgepatterns in muscle. I. Initial studies of the rigor lattice of insect flightmuscle. Biophys. J. 24:713-728.
46. Cooke, R., M. S. Crowder, and D. D. Thomas. 1982. Orientation of spinlabels attached to cross-bridges in contracting muscle fibres. Nature(Lond.). 300:776-778.
47. Berger, C. L., E. C. Svensson, and D. D. Thomas. 1989. Photolysis ofa photolabile precursor of ATP (caged ATP) induces microsecond ro-tational motions of myosin heads bound to actin. Proc. Natl. Acad. Sci.USA. 86:8753-8757.
48. Stein, R. A., R. D. Ludescher, P. S. Dahlberg, P. G. Fajer, R. L. H.Bennett, and D. D. Thomas. 1990. Time-resolved rotational dynamicsof phosphorescent-labeled myosin heads in contracting muscle fibers.Biochemistry. 29:10023-10031
49. Reedy, M. K., and M. C. Reedy. 1985. Rigor crossbridge structure intilted single filament layers and flared-X formations from insect flightmuscle. J. Mol. Biol. 185:145-176.
50. Taylor, K. A., M. C. Reedy, L. C6rdova, and M. K. Reedy. 1989. Three-dimensional image reconstruction of insect flight muscle. I. The rigormyac layer. J. Cell Biol. 109:1085-1102.
51. Yagi, N. 1991. Intensification of the first actin layer-line during con-traction of frog skeletal muscle. Adv. Biophys. 27:35-43.
52. Bordas, J., G. P. Diakun, J. E. Harries, R. A. Lewis, G. R. Mant, M. L.Martin-Fernandez, and E. Towns-Andrews. 1991. Two-dimensionaltime resolved X-ray diffraction of muscle: recent results. Adv. Biophys.27:15-33.
53. Wakabayashi, K., H. Tanaka, H. Saito, N. Moriwaki, Y. Ueno, and Y.Amemiya. 1991. Dynamic X-ray diffraction of skeletal muscle con-traction: structural change of actin filaments. Adv. Biophys. 27:3-13.
54. Fajer, P. G., E. A. Fajer, N. J. Brunsvold, and D. D. Thomas. 1988.Effects of AMP-PNP on the orientation and rotational dynamics ofspin-labeled myosin heads in muscle fibers. Biophys. J. 53:513-524.
55. Berger, C. L., and D. D. Thomas. 1993. Rotational dynamics of actin-bound myosin heads in active myofibrils. Biochemistry. 32:3812-3821.
56. Ford, L. E., A. F. Huxley, and R. M. Simmons. 1986. Tension transientsduring the rise of tetanic tension in frog muscle fibres. J. Physiol.(Lond.). 372:595-609.
57. Kress, M., H. E. Huxley, A. R. Faruqi, and J. Hendrix. 1986. Structuralchanges during activation of frog muscle studied by time-resolvedX-ray diffraction. J. Mol. Biol. 188:325-342.
58. Barsotti, R. J., G. Ellis-Davies, J. H. Kaplan, and Y. E. Goldman. 1989.Kinetics of skeletal muscle fiber activation by photolysis of DM-nitrophen (caged Ca2') and caged ATP. Biophys. J. 55: 1Oa. (Abstr.)
59. Ferenczi, M. A., E. Homsher, and D. R. Trentham. 1984. The kineticsof magnesium adenosine triphosphate cleavage in skinned muscle fibresof the rabbit. J. Physiol. 352:575-599.
60. Harada, Y, K. Sakurada, T. Aoki, D. D. Thomas, and T. Yanagida. 1990.Mechanochemical coupling in actomyosin energy transduction studiedby in vitro movement assay. J. Mol. Biol. 216:49-68.