flashing yellow arrow signal indications – a case study (kingsport
TRANSCRIPT
Flashing Yellow Arrow Signal Indications – A Case Study
(Kingsport, TN)
Jason Carder, P.E. Mattern & Craig, Inc.
Southern District ITE Annual Meeting Biloxi, MS – April 2015
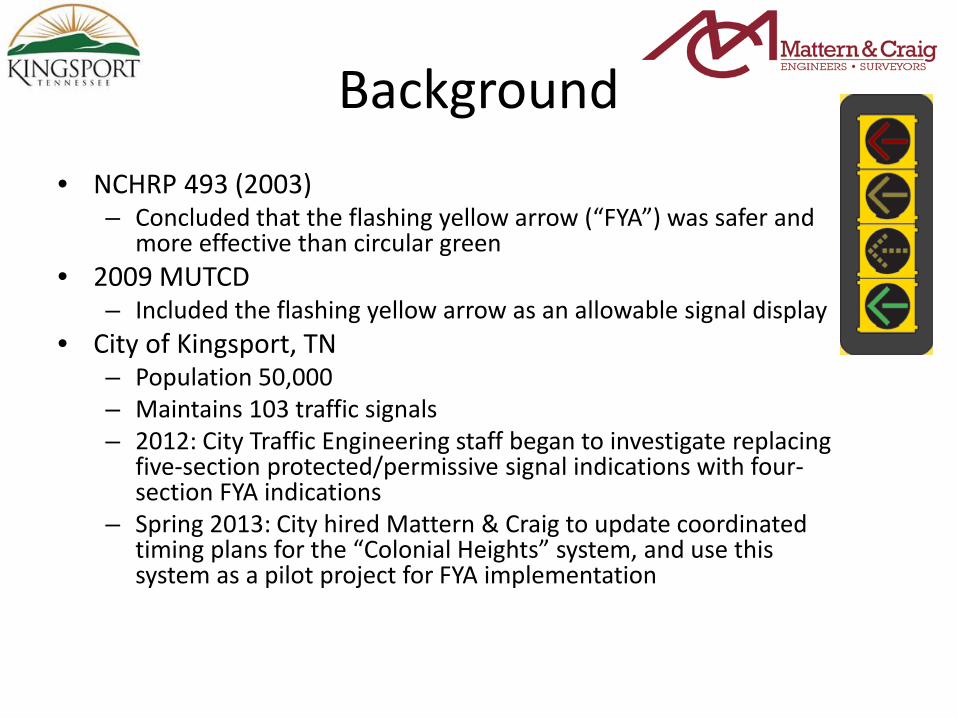
Background • NCHRP 493 (2003)
– Concluded that the flashing yellow arrow (“FYA”) was safer and more effective than circular green
• 2009 MUTCD – Included the flashing yellow arrow as an allowable signal display
• City of Kingsport, TN – Population 50,000 – Maintains 103 traffic signals – 2012: City Traffic Engineering staff began to investigate replacing
five-section protected/permissive signal indications with four-section FYA indications
– Spring 2013: City hired Mattern & Craig to update coordinated timing plans for the “Colonial Heights” system, and use this system as a pilot project for FYA implementation
Background (cont.)
• Colonial Heights system – 6 interconnected signals – Fort Henry Drive (S.R. 36), major arterial carrying
25,000 vpd – Sept. 2013: City replaced all five-section heads at
these intersections with FYA, and concurrently implemented the updated coordinated timing plans
– City staff collected travel time data along corridor shortly before and shortly after the change
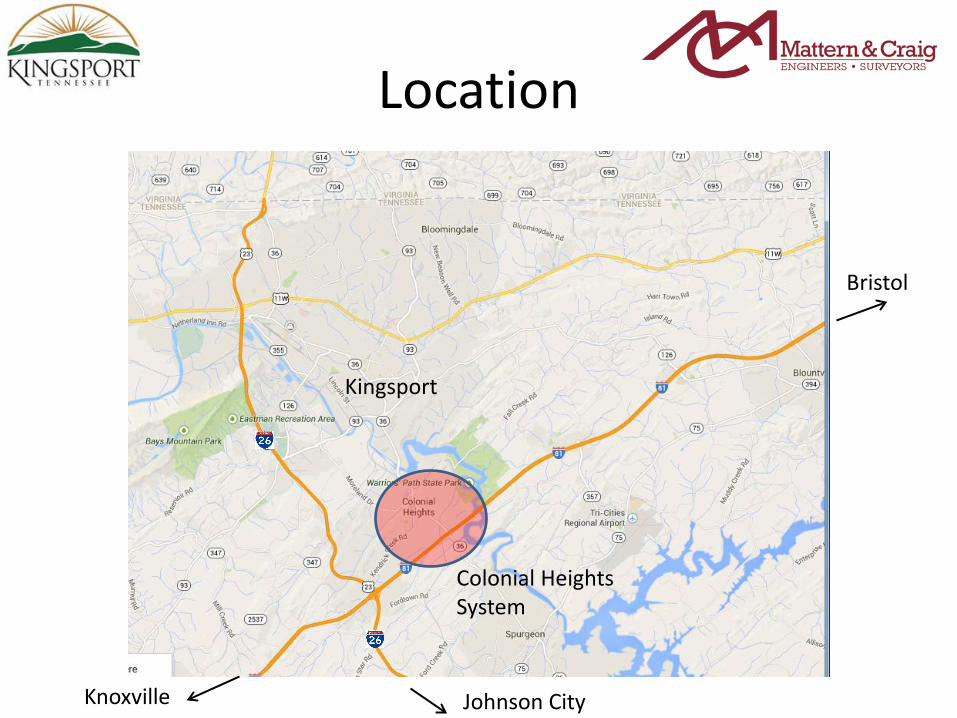
Location
Kingsport
Bristol
Knoxville Johnson City
Colonial Heights System
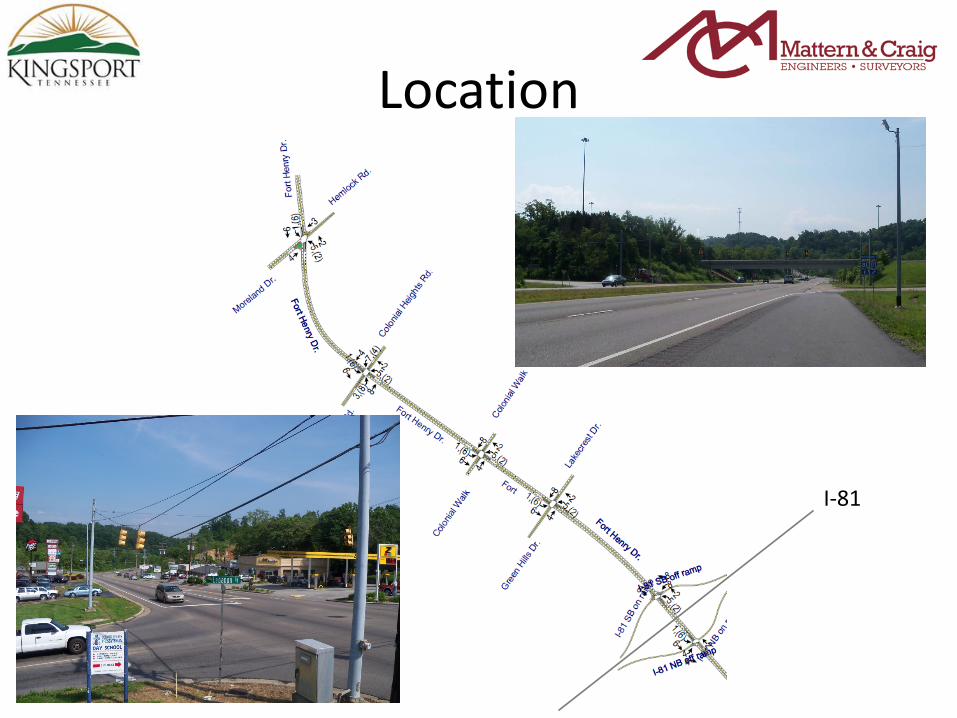
Location
I-81
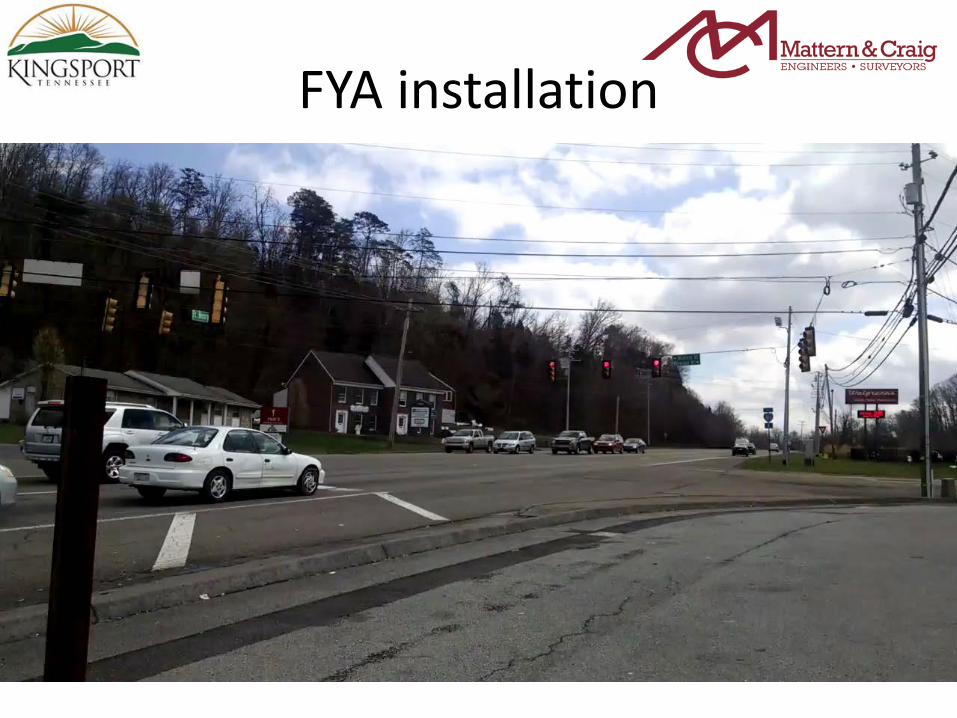
FYA installation
Crash Rate Analysis • City staff compiled crash data for the 6
intersections from Sept. 2011 to Dec. 2014 (24 months prior to implementation, 15 months after)
• At each intersection, angle crashes and rear-end crashes were tabulated, with a separate tally of angle crashes involving a left-turning vehicle on Ft. Henry Dr. and rear-end crashes involving vehicles on Ft. Henry Dr.

Before/After Crash Data
INTERSECTION
CRASHES BEFORE IMPLEMENTATION (24 MONTHS)
CRASHES AFTER IMPLEMENTATION (15 MONTHS)
ANGLE (TOTAL)
ANGLE (FT HENRY LEFT
TURN)
REAREND (TOTAL)
REAREND (FT HENRY)
ANGLE (TOTAL)
ANGLE (FT HENRY LEFT
TURN)
REAREND (TOTAL)
REAREND (FT HENRY)
I-81 NB Ramps 4 3 9 8 2 1 4 3
I-81 SB Ramps 4 1 6 6 1 1 4 4
Green Hills/Lakecrest 7 2 12 10 1 0 5 4
Colonial Walk 3 0 4 4 1 0 2 2
Lebanon/Col. Heights 3 1 20 16 3 0 8 5
Moreland/Hemlock 3 1 39 19 3 3 26 12
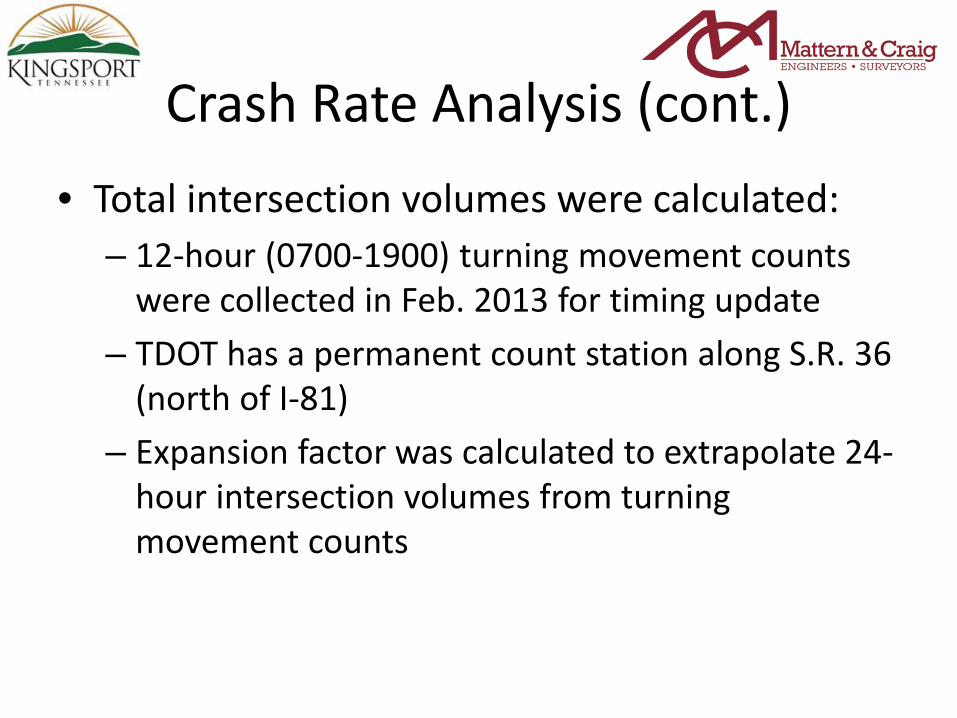
Crash Rate Analysis (cont.) • Total intersection volumes were calculated:
– 12-hour (0700-1900) turning movement counts were collected in Feb. 2013 for timing update
– TDOT has a permanent count station along S.R. 36 (north of I-81)
– Expansion factor was calculated to extrapolate 24-hour intersection volumes from turning movement counts
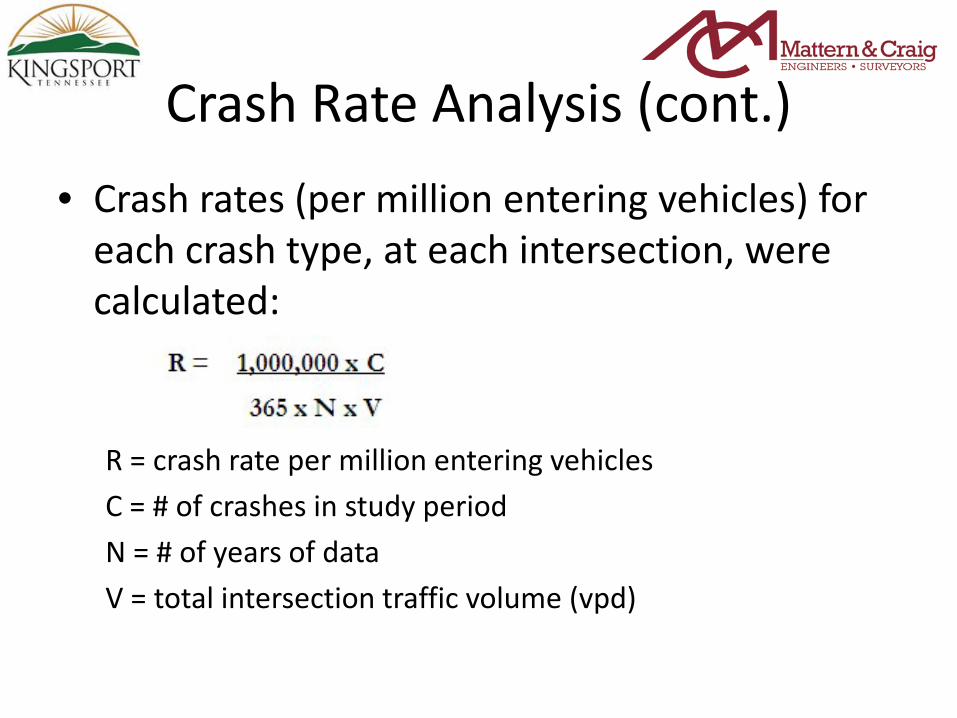
Crash Rate Analysis (cont.) • Crash rates (per million entering vehicles) for
each crash type, at each intersection, were calculated:
R = crash rate per million entering vehicles C = # of crashes in study period N = # of years of data V = total intersection traffic volume (vpd)
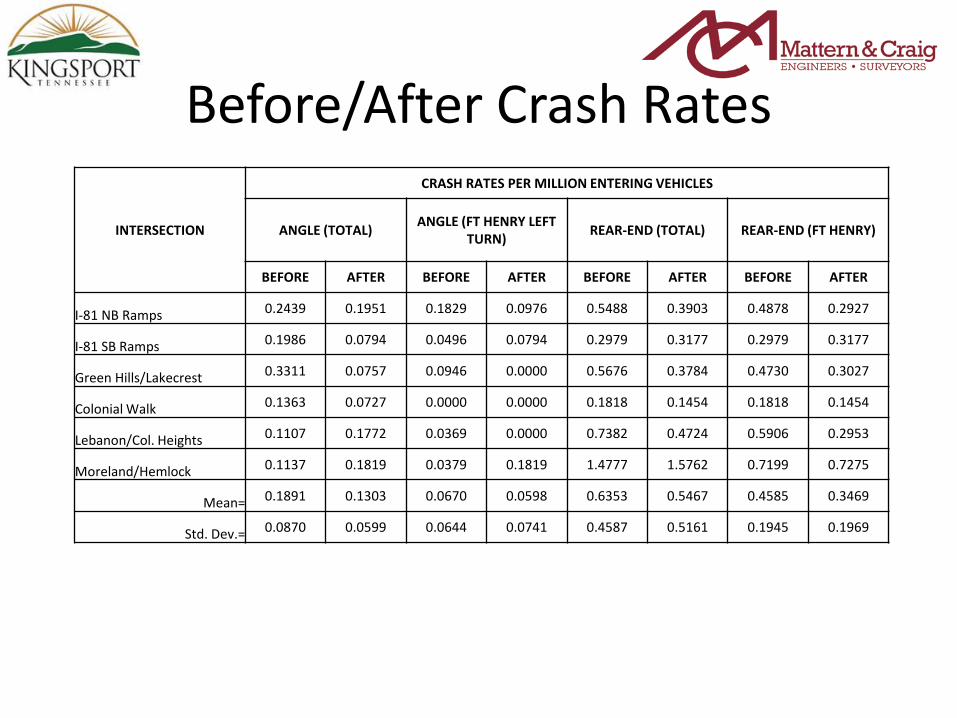
Before/After Crash Rates
INTERSECTION
CRASH RATES PER MILLION ENTERING VEHICLES
ANGLE (TOTAL) ANGLE (FT HENRY LEFT TURN) REAR-END (TOTAL) REAR-END (FT HENRY)
BEFORE AFTER BEFORE AFTER BEFORE AFTER BEFORE AFTER
I-81 NB Ramps 0.2439 0.1951 0.1829 0.0976 0.5488 0.3903 0.4878 0.2927
I-81 SB Ramps 0.1986 0.0794 0.0496 0.0794 0.2979 0.3177 0.2979 0.3177
Green Hills/Lakecrest 0.3311 0.0757 0.0946 0.0000 0.5676 0.3784 0.4730 0.3027
Colonial Walk 0.1363 0.0727 0.0000 0.0000 0.1818 0.1454 0.1818 0.1454
Lebanon/Col. Heights 0.1107 0.1772 0.0369 0.0000 0.7382 0.4724 0.5906 0.2953
Moreland/Hemlock 0.1137 0.1819 0.0379 0.1819 1.4777 1.5762 0.7199 0.7275
Mean= 0.1891 0.1303 0.0670 0.0598 0.6353 0.5467 0.4585 0.3469
Std. Dev.= 0.0870 0.0599 0.0644 0.0741 0.4587 0.5161 0.1945 0.1969

Crash Rate Analysis (cont.) • Before/after crash rates (for each type) were
analyzed for statistical significance. – Data sets were analyzed to determine if normally
distributed (done by visual observation of histograms). Data did not follow a normal distribution.
– Wilcoxon Rank-Sum test was applied to each before/after paired data set.
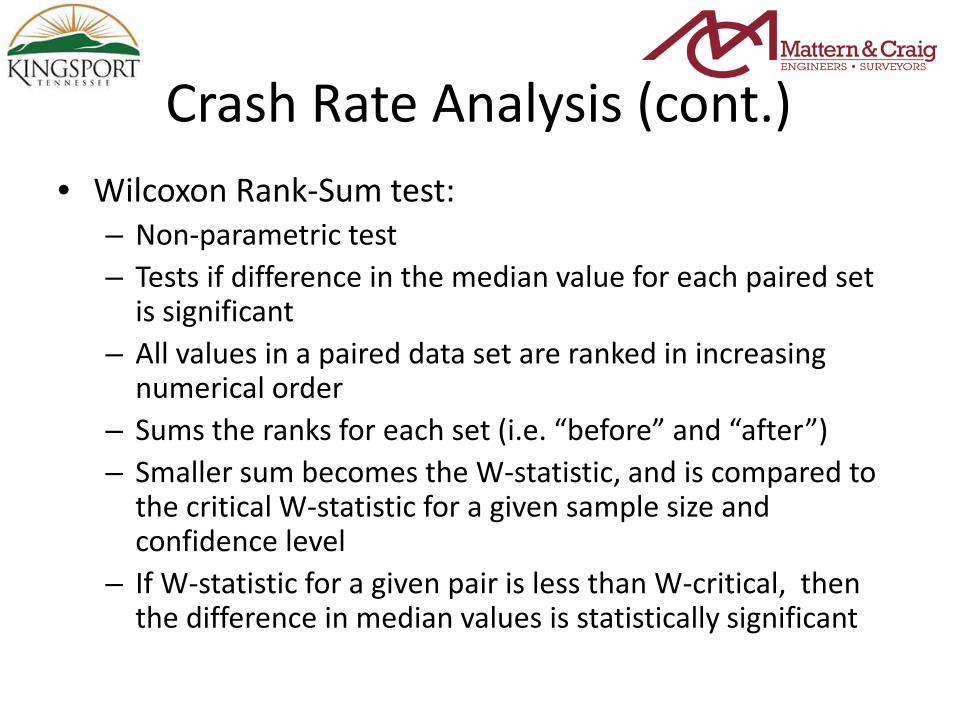
Crash Rate Analysis (cont.) • Wilcoxon Rank-Sum test:
– Non-parametric test – Tests if difference in the median value for each paired set
is significant – All values in a paired data set are ranked in increasing
numerical order – Sums the ranks for each set (i.e. “before” and “after”) – Smaller sum becomes the W-statistic, and is compared to
the critical W-statistic for a given sample size and confidence level
– If W-statistic for a given pair is less than W-critical, then the difference in median values is statistically significant
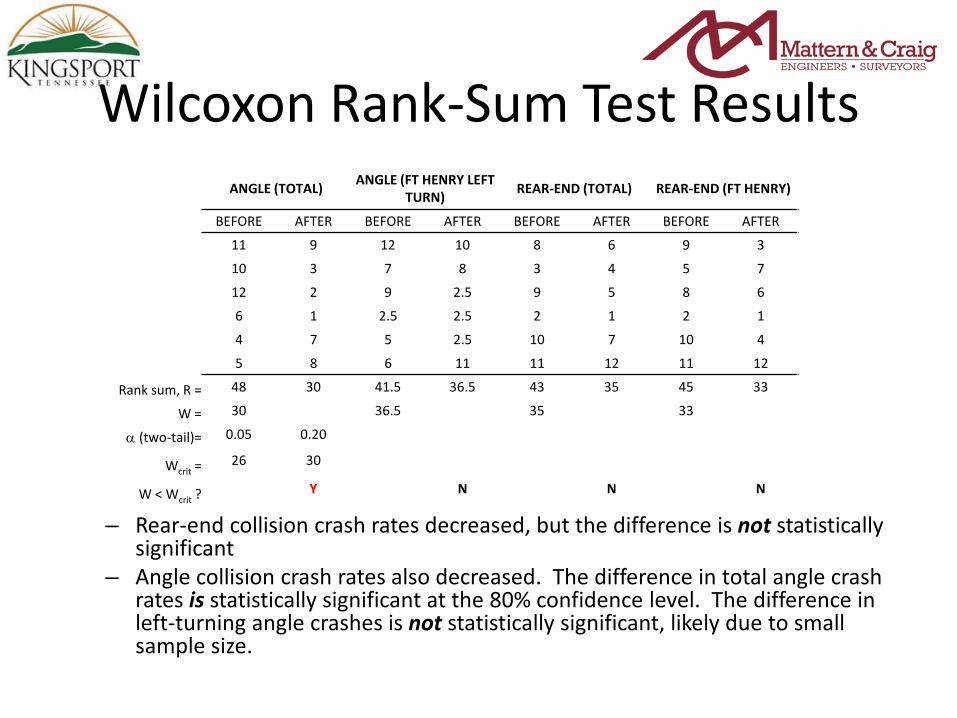
Wilcoxon Rank-Sum Test Results ANGLE (TOTAL) ANGLE (FT HENRY LEFT
TURN) REAR-END (TOTAL) REAR-END (FT HENRY)
BEFORE AFTER BEFORE AFTER BEFORE AFTER BEFORE AFTER
11 9 12 10 8 6 9 3
10 3 7 8 3 4 5 7
12 2 9 2.5 9 5 8 6
6 1 2.5 2.5 2 1 2 1
4 7 5 2.5 10 7 10 4
5 8 6 11 11 12 11 12
Rank sum, R = 48 30 41.5 36.5 43 35 45 33
W = 30 36.5 35 33
α (two-tail)= 0.05 0.20
Wcrit = 26 30
W < Wcrit ? Y N N N
– Rear-end collision crash rates decreased, but the difference is not statistically significant
– Angle collision crash rates also decreased. The difference in total angle crash rates is statistically significant at the 80% confidence level. The difference in left-turning angle crashes is not statistically significant, likely due to small sample size.

Operational Analysis • Updated coordinated timing plans for the system
were implemented in Sept. 2013. – Previous timings were developed in 2006 (also by
Mattern & Craig) – Plans employ 3 patterns (AM, mid-day, PM) for
weekday traffic; run free from 2200 to 0630 – Timing updates were minor:
• Slight (5-second) changes in cycle lengths (all are 80-100 seconds)
• Clearance intervals adjusted • Minor (1-3%) changes in splits • Lead/lag left-turn phasing employed for phases 1 & 5, varies
by time of day
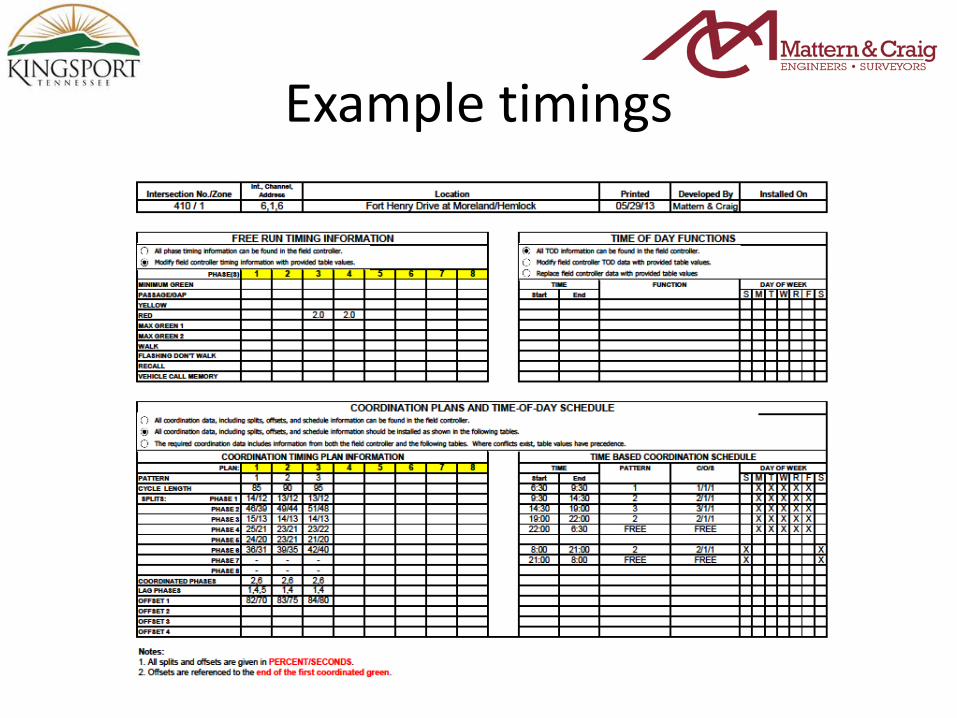
Example timings
Operational Analysis (cont.) • City staff completed travel time runs shortly
before implementation, and several months after, using the “floating car” technique
• Multiple runs in each direction and for each pattern, both before and after, were completed
• Mean travel time (“T”) and space-mean speed (“S”) were calculated
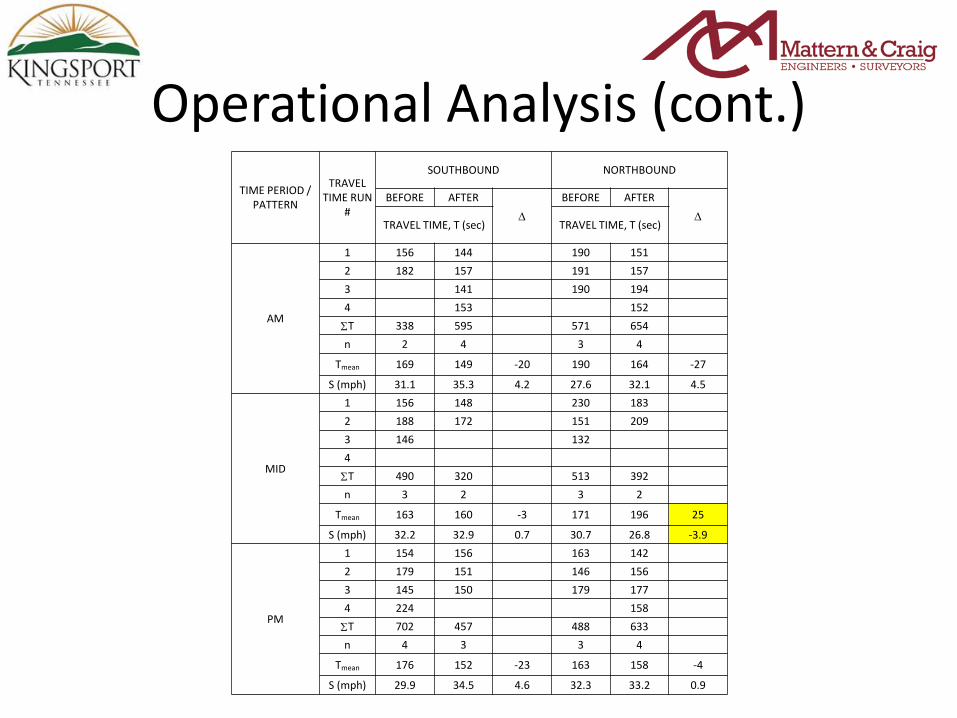
Operational Analysis (cont.) TIME PERIOD /
PATTERN
TRAVEL TIME RUN
#
SOUTHBOUND NORTHBOUND
BEFORE AFTER
∆
BEFORE AFTER
∆ TRAVEL TIME, T (sec) TRAVEL TIME, T (sec)
AM
1 156 144 190 151 2 182 157 191 157 3 141 190 194 4 153 152
ΣT 338 595 571 654 n 2 4 3 4
Tmean 169 149 -20 190 164 -27
S (mph) 31.1 35.3 4.2 27.6 32.1 4.5
MID
1 156 148 230 183 2 188 172 151 209 3 146 132 4
ΣT 490 320 513 392 n 3 2 3 2
Tmean 163 160 -3 171 196 25
S (mph) 32.2 32.9 0.7 30.7 26.8 -3.9
PM
1 154 156 163 142 2 179 151 146 156 3 145 150 179 177 4 224 158
ΣT 702 457 488 633 n 4 3 3 4
Tmean 176 152 -23 163 158 -4
S (mph) 29.9 34.5 4.6 32.3 33.2 0.9

Conclusions • Previous studies have demonstrated the safety
benefits of flashing yellow arrow indications (i.e. NCHRP web-only document 123)
• This study has shown that their implementation in Kingsport has improved both safety and operations (although statistical significance is low, due to sample size)
• Recommendations: – Study this corridor further (collect 3+ years
before/after crash data) – Study other locations in Kingsport

Acknowledgements • Tim Elsea (City of Kingsport, Traffic Engineer) • Peggy White (City of Kingsport, Traffic Aide) • Tony Armstrong (TDOT Strategic
Transportation Investments)