flathead ridge coal area southern dominion coal … · flathead ridge coal area southern dominion...
TRANSCRIPT

FLATHEAD RIDGE COAL AREA SOUTHERN DOMINION COAL BLOCK (PARCEL, 82)
SOUTHERN BRITISH COLUMIBA" (82G/7)
By D. A. Grieve and W. E. Kilby
INlRODUCTION The Dominion Coal Block consists of two parcels of federally
awned land, totalling :!(J 235 hectares in area, in the Crowsnest Coalfield of southeastern British Columbia (see Grieve and Kilby.
hectares (45,000 acres) i t i s by far the largu (Fig. 2-1). 1985). Parcel 82 i s the nore southerly of the two. and at 18 21 I .5
of Pxcel82: along Flathead Ridge in the southwest and in the Muunt The coal-bearing Kom3tendy Group crops out on two major arcas
Taylor uea in thc northeast: i t lies at depth beneath the intervening prtion.ThesuhjectofthisstudyistheFlathsadRidgepor1ionofthe parcel, which is bounded on thc northwest b f Morrissey Creek (Fig. 2-1).
an elevation of 1 980 to 2 225 metres. It has a sleep scarp face on its Flathead Ridge runs In a general northwest~sautheast direction at
southwestern flank (up to 70 per cent grade) and a relatively fentle slope on its northeastem flank. Minimum elwation in the study area i s 1 070 metres along Mlnrrissey Creek. The only readily accessible part of the study area s Morrissey Creek, which is connected to Highway 3 by approxirnatcly 5 kilometres of pod-quality second-
Figure 2-1. The Crowsnest Coalfield arca, showing locations of Parcels 13 and 82 of the Daminion Coal Blocka.
ary road. Difficult four-wheel drive access to the top of Flattcat Ridge i s available on the natural !;a'< pipeline access road. whict connects with the Lodgepole forer,tr:i road.
OBJECTIVES OF PRESENT STUDY
deposit model of the Flathead Ridge tn allow rcsource ca lcuht i~m The objectives of the current study are: to construct a di:;ital
ofA-andB-seamcoalutiliring,:xir.ti~~gdatasupplementedbymino~
history, stratigraphy, structure, an,J coal quality information. fieldwork; and to summarize avai:atde cxploration and produitiolk
We have chosen to concentratc c , n these upper scams bccrus,: exploration carried out in the study area focused a n this stratigraphit: interval and provides adequate information for a reasonable iir :dy- si*. Also. the structure of the Ic~wcr seams is more complicatrd ml not well explored.
PREVIOUS WORK Crow's Nest Pass Coal Company operated the Morrissey C d ier:i
immediately north of Morrissey Creek, outside of Parcel X ? . be- tween 1902 and 1909. This was h e shortest lived of the thre: collieries developed by the conpan) at the turn of the century 'Th: reasons for i ts early demise wcre ha:rardous mining cunditiorv mi poor coking properties of the cwal due to its high rank.
There is no evidence of major exploration activity south of : \ l o - rissey Creek prior to 1964 A t that time the British Columbia-b:.sel Pdcific Coal Limited (P.C.L.) acquired coal rights to the Flatleai Ridge portion of Parcel 82. naming their property the Fernit: C:ot I
tive was to prove up reserves of low-volatile coking coal tor the Mine. The crmpany was funded by Japanese interests; their ol,jec-
Japanese Steel industry. The first year of exploration, supcrvirfd by consultant D. D. Campbell, was focused on the Morrissey Y:, le:,. Ten diamond~drill holes. totalling approximately 1 615 mrtrr!,. wercdrilled. This programcontinued into 1965 with thecompl:tion of two mvre holes (300 metres I. 'Thi information is nut on file with the Provincial Government. Further .work in I965 was carried ut I by Nittetsu Mining Consultants Co. ,.I.td. Adits were driven f o r Ihulk samples in two of the lower seams (KI and K5) along Morr is ty Creek, and surfacc mapping &as i:arricd nut along Flathead 'Rl,igc!. A preliminary feasibility study was completed at this time. Explor;~. tion work in 1966 and 1967 was (concentrated on A- and B-scilm,. BythistimeP.C.L.hadacquir~:dco;1lri~htstoa7458-hcctaresre.~, and the scale of explaration increased considerably. Work w:is performed by Nittetsu Mininp Co.. Ltd. and Toyo Menka Krish.,, Ltd. Seven dril l holes were cvrecl fs3r a total of I 599 metres. nitte adits in A- and B-seams were driven and sampled, and more fh In : 9 kilometres of new road was built; I n m roads were along the traws #of A- and B-seams. Detailed m;lppin:, supplemented by treccrin,;, was carried outover the entire property. Dril l core and hulk sarrplts were provided to several Japam:st: s t e d concerns for t e s i lg rf washability and coking potenlial
B-seam throughout the property and A-seam locally are su1,wi,)r The general conclusions o f this assessment work welt that
BLAIRMORE GROUP I SEAM NAMES ............... K1 COALSEAM ................I COAL SEAM (LOCALLY
SANDSTONE a DEVELOPED --- .............. ...............
- 700m
- 600m
-
- 500 m
-
- 400m
- 300m
-
- 200m
-
" ..... ................ ....... HI .......... ).. ,...;
. . . . . . ........... ,.: :;..... ..... ::::
.............. .........
FORMATION
KOOTENAY GROUP
1 1 MOUNTAIN
L - 1 FORMATION I
I"I K5 I
t loom
f FORM, ATlOP . . . . . . . . . . .............. MORRISSE' t L O m FERNIE GROUP
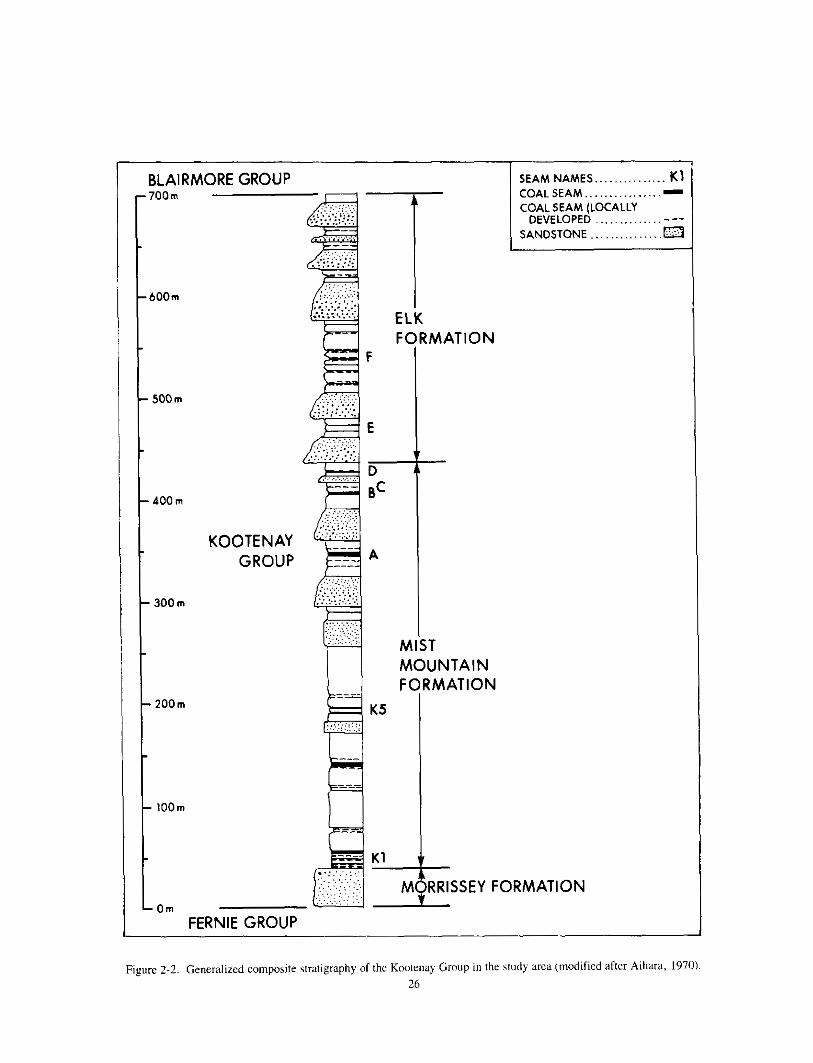
Figure 2-2. Generalized composite stratigraphy of the Koatenay Group in the sludy arcs (modified after Aihara, 1970). 26
coking coals, and that they arc prcscnt in significant quantities. A 1968 feasibility study b i Nittetsu f0rP.C.L. rcilcratcd that the coal was economically mineable and equal to other wcstcrn Canadian coking coals contracted to Japan at the timc. In 1968 or 1969. however, Nittetsu withdrew from the project and Mitsui Mining Co., Ltd. obtained peniission from P.C.L. to further cvaluatc the property. In 1969 they carried out a geological survcy, aided by trenching. A few diffexnces in structural interpretation and scam correlation were noted. Further cxploration I N a S proposcd but never carriedout. In 1971-1972 the ProvincialGovemment. atthcrcquest of the Federal Government. rcvokcd the coal rights.
Results of the exploration projects carried out hetwccn 1965 and 1969 are contained in the following reports: Nakayama. e1 nl. (1966). Harada. et 01. (1967, 1968). and Aihara (lY70). Results of the 1968 feasibility study arc containcd in Shiokawa (1968). All arc on file with theGeological Branch ofthe BrilishColumbia Ministry of Energy, Mines and Pctmlcum Resources. Individual reports w i l l not hc spccifically referenced in the following discusions.
late 1970's. Between 1977 and 1980 N . C. Ollcrcnshaw of the Two government suneys of the study arei# were carried out in the
Geological Survey of Canada mapped all of Parcel X2 at 150 000
the British Columbia Ministry of Energy. Mines and Petroleum scale (.weOllerenshaw, 19Xlb). D. E. Pearson and D. A. Grieveof
cenlrating on the surface traces of coal scams (.lee Pearson and Resuurces mapped Flathead Ridgc in 1978 at I:IO 000 scale. con-
Grieve, 1981. Sheets 3 and 4). In conjunction with this mapping. coal samples were collected for pctrographic analysis
STRATIGRAPHY
belonging to the Jurassic Fernie Group. Jurassic~Cretacevus Kootc- Flathead Ridge is underlain by a sequcnrc of sedimentary rocks
nay Group, and Lowcr Cretaceous Blairmorc Group. Marine s h a h of thc Fcmie Group ar,: in gradational contact with thc overlying littnral Morrissey Formation, h a d santl!itone of the Korrtenay Group. Morrissey Formation is abruptly overlain by the nun-marine coal-bearing Mist Mountain Formation, host 10 economic coal seams in southeast British Columbia. This in turn is gradationally overlain by the Elk Fomation. a non-marine unit which contains thin coal scams and a higher proportion of ,channel sandstoncs and conglomerates than the underlying Mist Mountain (Fig. 2-21, .The Elk is overlain by the non-marine Cadomin .Formation, basal unit of the Blairmore Group. I h e Cadomin Formation in the study arca consists of a series o f conglomcrates separated by maroon and greenish mudstones (Oilerenshaw, 19Xla). It is overlain by greenish and maroon mudstan,:s interbeddcd with sandstone and can- glomerate of the Lower Blairmore
There are two readily identified marker horirrms within the study area. One is the Marlissey Formation, ahuse outcrops form a relatively consistent bhf f : the Morrissey marks the lowcr limlt for coal occurrences (Fig. 2-21, The other is the Cadomin Formatinn, which delineates the top of the Kootendy Group. The contact be- tween the Mist Mountain and Elk Formations, which probably represents the transition from a meander plain to a braid plain environment (Gibson, 1985). is usually defined as the lowest chan- nel deposit above the Ihighcst economic i:oal seam in the Mist Mountain Formation. This horizon can be )napped with some cer- tainty throughout the study area.
in the study area and on average it contains 10 coal seams. Seams The Mist Mountain Formation is approximately 400 metres thick
were numbered upward from KI to KS. and then 4 . B. and so on
rissey Creek revealed that the rank of these seams was too high to be (Fig. 2-21, Initial quality results on seams K1 and K 5 frum blur-
attractive. This led the company to focus on two more promising searns, A and B, in the upper half of the Mist Mountain Formation (Fig. 2-2) . A-seam undwlies B-seam by 25 lo 45 metres. In outcrop
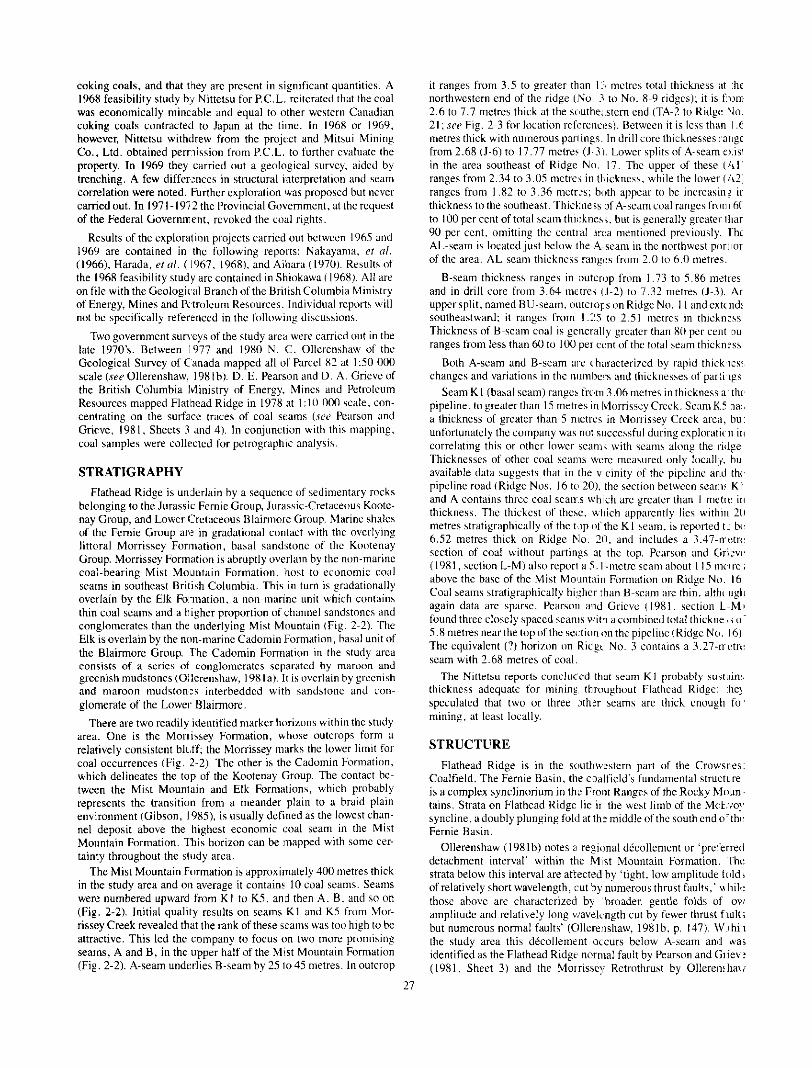
it ranges from 3.5 to grealer than li, mctrcs total thickness ;at :he northwcstcrn end of thc ridge (]Vu. 3 t o No. 8-9 ridgcs); it is f:um 2.6 to 7.7 metres thick at the scmuthe: stem end ITA-2 t o Ridgt: ' I o . 21; see Fig. 2-3 f o r location r e i c r e m s ~ , Betwccn i t is Icss than 1 . C metres thick with numerous parline?. In drill COK thicknesses rar~gc from 2.68 (5-6) to 17.77 metre: (J -3) . Lowcr splits of A-seam E>.isI in the area southeast of Ridgc Nrr. 17. Thc upper of these ( 4 1 ranges from 2.34 to 3.05 mctrc'; in thickness. while the lower Ih2: ranges from 1.82 t o 3.36 metrLs: both appcar to hc incrcarin: ir thickness tothesoutheast. Th iche i s of A-scamcoal rangcsfromh( to 100 per cent of total scam thii:kness. hut is generally greater lllar 90 pcr cent, omitting the central , m a mentioned previously. Iht AL-seam i \ locatcdjust below the A~seam in the northwest portlor of the area. AL-scam thickncss rdng1:S from 2.0 t o 6.0 metres.
and in drill care from 3.64 mitre? 15~2) to 1.32 metres (5-3) . Ar B-seam thickness ranges in outcr,,p from 1.73 to 5.86 m,?tres
uppcrsplit.namedBU-seam,oiltcro~~sonRidgeNo. Ilandcxtcnd!
Thickness of B-scam mal is generally grcater than 80 pcr cent ou southeastward: i t rangcs from I .:!5 to 2 . 5 1 mctrcs in 1hickn:ss
ranges from less than 60 111 100 per cmt ufthe total seam thickn:ss
changes and variations i n the nllmhc:-s and thickncsss of par:i lgs Both A-seam and B-seam are chmacterixd by rapid thick,lcs!
pipeline.tngreatzl-than 15metresinlvlorrisseyCreek.SeamK.C x : , Seam K I ( b a d scam) ranpcs irc8m 3.06 metres in thickness a the,
a thickness of greater than 5 net res in Morrissey Crcck area, hu unfortunately the company UdS no1 successful during exploratirn it , crlrrelating this or nthcr lower scam; with c c m n along the ridge Thicknesses of othcr coal s c a m WCK mcasurcd only locaky. bu available data suggests that in the v cinity ni tha pipeline artd thr, pipcline road (Ridge Nos. 16 tcm 20). the section betwen scan>! K t and A contains thrcc coal scans w h c h arc greater than I mctlt : i c , thickness. The thickest 11f thcsc. hllich apparently lit\ within X metres stratigraphically of thc t,.,p oi the K I scam, is reported 1: bf, 6.52 metres thick o n Ridge N o . 20, and includes a 3.47-rrt:trt: scction of Cod! %,ithour partings at the top. Pearson and Grixt , (1981,scct ionL-M)alsoreporlai~. l -n~ctrcscam~~hout115m~~lre~.
Coal seams stratigraphically hi;;hcr than B-sram ;are thin. ;dth, ~rgtl above the hasc of the Mist MoNJnt.lill Formation on Ridgc N o Ih
again data arc sparsc. Pearson and Gricvc (1981. section L ~ h l ~ found three closely spaced scanls wit? a camhincd total thickne , s ,I The equivalent (?I hori7on on Ricgt No. 3 contxins a 3 . 2 7 - n m : 5 .8nle t resncar the tapof thc \e~: t i i ,n~~nthepipe l ioe(KidgeN~~. 16)
seam with 2.68 metres of coal.
thickness adequatc for miniq throughout Flathcad Ridgc: IC! The Nittetsu report5 cuncluccd that scam K I prdxably s u s r h ! .
speculated that twu or three Jth,:r seams are thick enough fo mining. at lcast locally.
STRUCTURE Flathead Ridge is in the suuthwcstem part of the Crowrtes.
Coalfield. The Fernie Basin. the c'3alficld's fundamental stru<:ttre is a complex synclinorium in thc Front Ranpcs rrf the Rocky hlcrun Pains. Strata on Flathead Ridgc lie ir the west limb of the McE::o!, sync l ine .adnublyplun~ingfo l~ la t thsmiddleof thesouthendo ' th~~ Fernie Basin.
Ollerenshaw (1981b) notes a re:$ional decollemcnt or 'prcl'errerl detachment interval' within the M l s t Mountain Formation. Thc
of relatively short wavelength, r u t ' q numerous thrust faults,' ~ l ~ i l t : strata below this interval are aftectmed by 'tight. low amplitudc f d d ,
those above arc charactcrized b!/ 'broader. gentle folds of ow amplitudc and relatively long v:av,:lcngth cut by fcwer thrust f l u l t ; hut numerous normal faults' (Clllerenshaw, 1981h. p. 147). \V 1hi1 the study arca this decollement occurs below A-scam anli m i
identified as the Flathead Ridgv ncrnlal fault by Pearson and (;lie\,: (1981, Sheet 3) and the Morris!;cy Retrothrust by Olleren!har;
27
RIDGE NUMBER . . . . . . . . . . . . . . . . . Na16 TRACE OF COAL SEAM . . . . . . . . . . :"---, TOPOGRAPH CONTOUR
(200 m INTERVAL) . . . . . . . . . . . .-/so,,
~i~~~~ 2.3. FlatheadRidgearea, showing tracesofA andB-seams, 1966-l967drill hole locations, adit sites, ridge numbers. andsoutheastern boundary of P.C.L. holdings (afler Aihara. 1970).
28
COMBINED RESULTS OF FLOAT-SINK TESTS (R-SEAM)* TABLE 2-1
(Source: Mitsui Report)
Raw' Coal Ash 1%) Clean Coal Ash (%I
23.2 23.2 7.0
23.2 t;.(l 9.0
1.53 Calculated Yield (96) 70.0
I .60 I .6X 7:;.0 77.0
Revised Yield** (%) 65.0 70.0 72.0
S.G. (gicc)
* based on samples T B ~ ? . TB-3. T B ~ 4 . and T B ~ h ** allowing 5% dilulion during ,mining
(198lbj. Both studies ,cited traced the faulr from Morrissey Creek southeastward along thc face of Flathead Ridge to a point roughly halfway between the crcck and thc southeastern boundary of Parcel 82 (Fig. 2-3). 0llerenr.haw (p. 151) speculatcd that the Sault con- tinues through to the boundary. hut i s hidden in bedding of the Mist Mountain Formation. I'earson and Grieve concluded that the fault changes orientation suddenly, cuts rapidly up section, and affccts the continuity of A- and B-seams; in the present study no ficld evidencc was found to :,upport this interprclation and the interprcta- tion of Ollerenshaw has been adopted. Dislurbanccs in strata in the vicinity of A- and B-:.eams are considcrcd to he local in extent.
strata on Flathead Ridge is manuclinal. On the southwest face ofthe The structure ofthc upper Mist Mountain Formation and higher
ridge average strike of strata i s 130 degree>, with dips of 20 degrees
i s the same but the dip flattcns t u 10 dcgrees northwest. Minor northwest. In the area behind lnorthcast of) the ridge linc, the strike
stnlctures include prrduminantly small-scale. low displacemcnt northeast-dipping thrust and narmal fdults
In contrast. strata beneath the Morri!.sey Iault are intensely folded fold-axes trending northcast-southwest, and the strata arc also affected by northl:ast-dipping thrust faults.
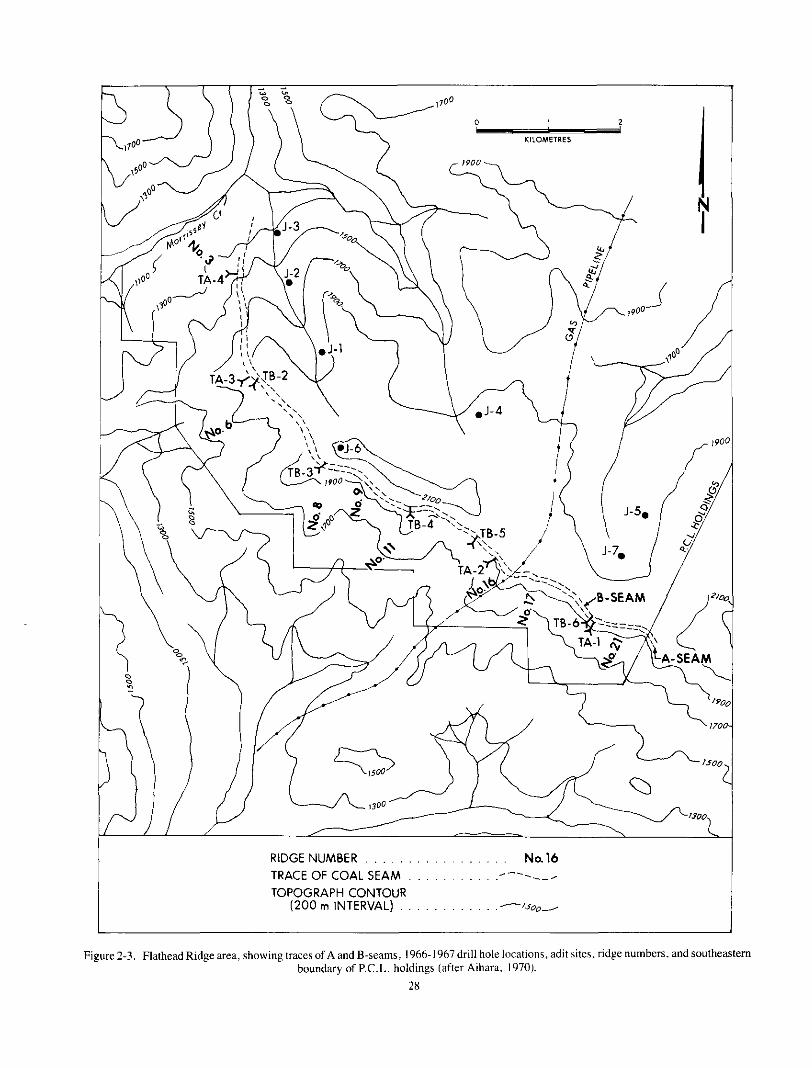
COAL QUALITY Extensive tests of Flathead Ridgc coal were carried out by up tn
six prospective purchasers in Japan. Kc!ults arc summarized in following text.
WASHABILITY
Float-sink tests of bulk samples were pcrfkmed in conjunctinn with bath the Nittetsu and Mitsui studic:,. I M B in Tahle 2-1 are
Resultsfromsamples~IB-2,3.4,and6werccombined.Yirldswere summarized from thc latter source. and deal with &scam only.
calculated on the assrmption that the plu'i 0.5~nlillimetre fraction would bc washed witt heavy medium cyclones and the minus 0 . 5 -
millimetre fraction by froth flotation, As Tahle 2- I shows, yields of 70.0,75.0.and77.0perccntarecali:ulatedhascdoncleancr1a ash contents of 7.0, 8.0. and Y.0p?rccr<t respectively. Allowing: pe- cent dilution during mining, the yields rcduce to 65.0, 70.0. ,and 72.0 per cent respectively.
STEEL MILL TESTS
for testing; the results recordcd ill (he Nittetsu rcpnrts werc M e r Six Japanese steel mills were provided with cleaned hulk sarrple I
reproduced in the Mitsui rcpurt. Srmmarles for A- and B ~ 5 t a n l samples are displayed in Tables 2 ~ 2 and 2-3.
23.3 to 19.2 per cent, dccreasing fnm southcast (TB-6) to nwth- Clean B-seam has average vl,latilr matter contents ranging I r o n ,
west (TB-2). Lowest Free Swelling Index (FSI) values (6.5 to ; . S I
range.Lowestavcragelluidity;tlsc~o~:cursatTB-2(48dialdivisi~n; are associated with TB-2, while cother sites tend to he in ttle 8.0
per minute) with thc highest k i n g at TB-4 (708 ddpm). Sul~hur valuesareinthc0.5percentra~~ge.andheatin~valucsarenear13.:i MJikg. Drum index values are all aI)ove 92 per ccnt. .The Nltlctslt report concludes that B-seam i s a s(,perior coking coal.
Clean A-seam has avcrage vdat i l c nratter contents ranginl: I'1or.l 21.2 to 17.5 per cent, dccreasing from southeast ( IA - I ) to north^
TA-4 relative to TA-I, where FSI i s 6 to 7.5. Sulphur and calc l i f i : wcst (TA-4). FSI at 3 t n 4.5 and fluidity values arc low at TA-.1 anti
values are very similar to thosc of B-scam. Drum index value; ar: low at TA-3 and TA-4, hut are equivalent to B-seam a1 TA-I. 'Th: conclusion was drawn that su/)erior quality coking coal couli b: found in the southcast end of th: ridge, but that coal at the nonhwe! t end i s semi-coking coal. Unfortun?lely TA-2 results were 1x1 re- ported. It was suggested that &sr:aln from the northwcst migllt b: blended with B-seam from the ccntrd or southcast part of thc I idg: lo increase reserves of acceptable qtmlity coking cod.
Two other seams. K1 and K5, *.:re bulk sampled at Morr !;\cy Creek. Clean coal volatile rnaltcrcmtent of K l averaged 14.4 per centat8.5percentash,whiletho!;e~fK5averagedl6.Iperc~1~1;~1 8 .Rpercen ta s l~ .FSIva lues r~ f I< I r ;~ngc~f r~~m31o4 ,whi l e r t~c re r~ f
kg, and those of K5. 32.64 MJ/kg. Averagc drum indices of ii4.2 KS rangcd from 3.5 to 5 . Hcat ng wlucs of K1 avcragcd 32.V M. /
and 84.6 per cent respectively ' w e ohtaincd. This material aol,:a~s to be potential srm-coking codal h'rst; i t might be heffcr descnbed as thermal coal, espccially in :he CJSC of K I
RANK DISTRIBUTION The Japicncsc survey KpOW; cmclude that the tendcncy of : I a n
coal volatile matter contcnls md n:lated caking properties 11 d4:- crease from southeast to northwc:,t :toward Morrissey Creek) in 211 seams rcprcsents a dcfinite t r d in carbonization. This t r m l , mor
TABLE 2-2 SUMMARY OF TEST RESULTS AT JAPANESE STEEL MILLS (A-S:EAMj*
-
Volatile Fixed
-~ ""
Sample Moist Ash Matter Carbon S Urum
9b Kcallkg F,SI
'la 'la 70 ( + 15mm) (ddpm) Index Fluidlly
89.9-94.4 I.Ys-:!~s
'la
TA- 1 I .3 iavgl 4 5 21.2 73.0 0.41 8 178 6-'7.!i 91.9 47 1.0~1.5 (range) 4.15-4.8 20.75-21.8 72.0-73.6 0.38-0.42 8 060-8 322
TA-3 1.1 6.5 20.0 72.8 0.28 X 017 3. 5-4 58.0 15 0.8-1.4 6.4-6.6 19,s-20.Y 71.3-73.9 0.27-0.29 7 900-8 230 50.0-63.9 2.451
TA-4 1 .2 6 .6 17.4 74.x 0.45 7 965 3 - 4 2 49. I I I Upper (1.X-1.4 6.4-6.x 17.2-17.7 74.475.0 (3.41-0.m 7 930-7 YYO
0.8-1.4 5.1-6.3 17.4-17.6 74.9-76.7 0.34-0.411 8010~X 050 (only value) 1.6.7
36.(3-70.2 1.4:3-:!0
TA-4 Lower
1.2 5 . 8 17.5 75.6 0.36 3-4.5 44.2 8 027 ,1
* washed coal
-~
29
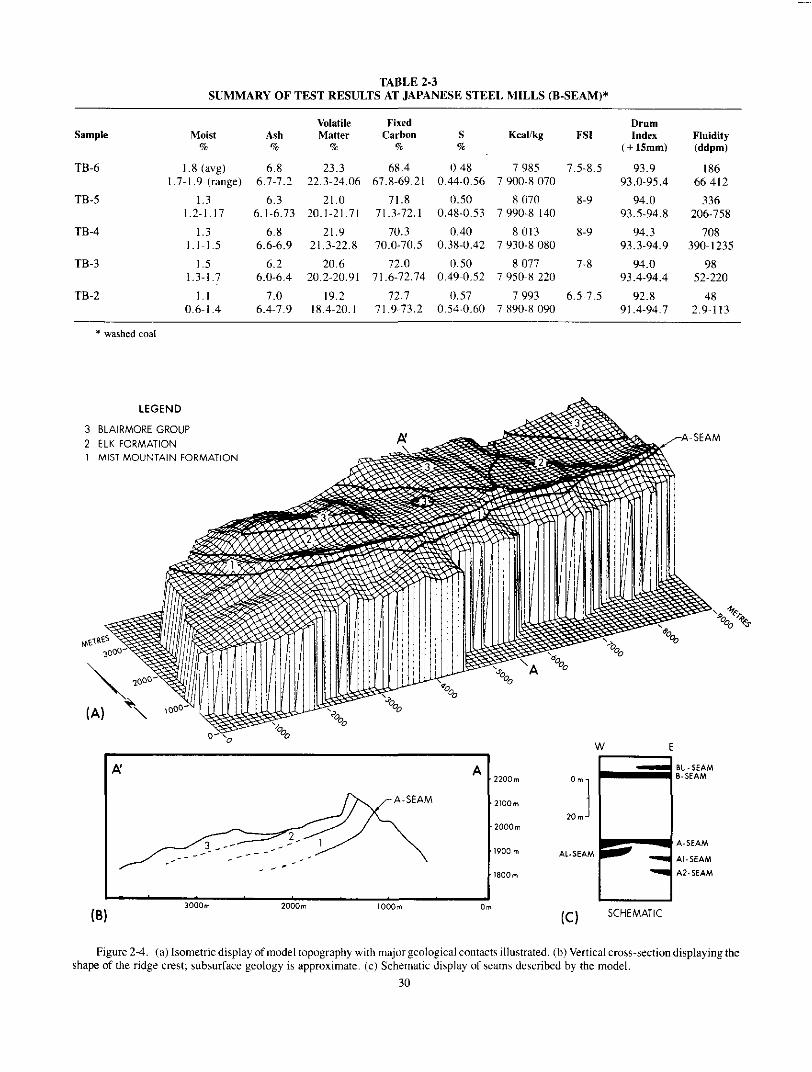
SUMMARY OF TEST RESULTS AT JAPANESE STEEL MILLS (B-SEAM)* TABLE 2-3
Volatile Sample Moist
Fixed Drum Ash Matter Carbon S
% w Kealikg FSI Index
~ ~~
70 70 w ( + 15mm)
TB-6 I . x (avg) 6.8 23.3 68.4 10.48 7 985 7.5-8.5 93.9 1.7-1.9 (range) 6.7-1.2 22.3-24.06 67.8-69.21 0.44-0.56 7 900-8 070 93.0-95.4
TB-5 1.3 6.3 21.0 71.8 0.50 X 070 8-9 93.5-94.8
94.0
TB-4 1.3 6.8 21.9 70.3 0.40 8 013 8-9 93.3-94.9
94.3
1.2-1.17 6.1-6.73 20.1-21.71 71.3-72.1 0.48-0.53 7990-X 140
1.1-1.5 6.6-6.9 21.3-22.8 70.0-70.5 0.38-0.42 7 930.8 oxo TB-3 1.5 6.2 20.6 72.0 0.50 8 077 7-8 94.0
1.3-1.7 6.0-6.4 20.2-20.91 71.6-72.74 0.49-0.52 7 Y50-X 220 93.4-94.4 TB-2 1 . 1 7.0 19.2 72.7 0.57 7993 6.5-7.5 92.8
0.6-1.4 6.4-7.9 18.4-20.1 71.9-73.2 0.54-0.60 7 X90-X 090 91.4-94.7
Fluidity (ddpm)
66-412 I 86
336 206-758
390- I235 708
52-220 98
2.9-113 48
* washed coal
I 3000m
( 6 ) 2000m IOOOrn I
2200m 8-SEAM 8U.SEAM
2100-
20 m 2OOOm
I900 m AL.SEAM A-SEAM
AI-SEAM
1800m I 1 A2-sEAM
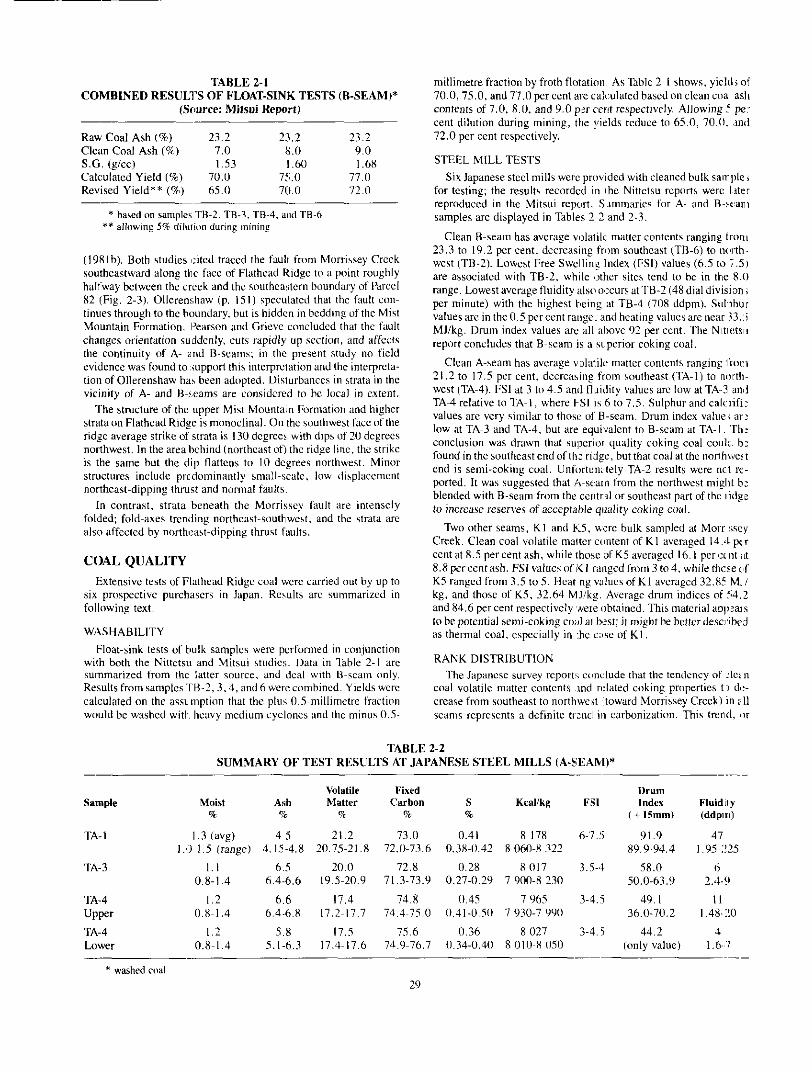
(c) SCHEMATIC
shape of the ridge crest; subsurface geology is approximate. (c) Schematic display of scams described by the model. Figure2-4. (a) Isometricdisplay ofmodel topography with majorgenloeicalcontacts illustrated. (b) Verticalcross-sectiondisplayingthe
30
rank gradient, is corroborated by the work of Pearson and Gricve (1981, 1985). Vitrinite reflectance values from cOd1 samples col- lected in the field are highest at the north end d Flathead Ridge at Morrissey Crcck; they decrcase in both directions along strikc. Rank values in the Morrissey Creek section are further enhanced by down-dip increases notcd in the Crowsnest Coalfield (Pearson and Grieve, 1985). The net result i s that essentially the entire Mist Mountain section at the level of Morrisscy Creek contains coals of low-volatile bituminous rank (R,, max>l.5l per cent). A value of 1 .X5 per cent was obtaincd on the basal seam on Ridgc No. 3, near the K I adit. R, max decreases to I . I I per cent for the same horizon atthcbaseofRidgeNo.6.andtol.62perc~:ntinthevicinityafthe pipeline. In other word!.. at least some portion o f outcropping Mist Mountain Formation i s luw-volatile in rank throughout the length of the study area. and with rank values increasing down-dip in all cases.
per cent at the southeast end of the property. 10 1.4 per cent on Kidge Reflectance in A- and B-seams ranges from approximately 1.3
No. 6, to greater than I .5 per cent in the Morrisscy Creek valley. Therefore, thesc seams are predominantly medium-volatile bi- tuminous at their outcrop locations, except at the extreme northwest end ofthe property where. because thc elevation is low. outcrops are down-dip extensions of those along the ridgi:. 'The high rank of coal
ciosure ofthe Morrissc) Colliery in 1909, and i s an important factor inklorrissey Creek wasamajorcontributin~ factorto the permanent
to consider here. Remember that A-seam is not a goad quality cukmg coal at adits Til-3 or TA-4 (or In tJrill hole J-3). 8-seam
hut unfortunately there are no sample locations north of TB-2, and appearstomaintainitsr~~talityasiarasaditTH-2(anddrillholeJ-lJ.
drill hole 1-2 did not inlrrscct B-seam. Rcsults of testing of B-ream in J-3 were nut reported
PROPOSED MINING METHOD The feasibility repo-t of the Pacific Co,~ l Limited propcrty by
exploration. The underground miningplancnvisaged themainmine Nittetsu Mining Co., Ltd. was submitted at the end of four years of
entrance to bc at elevation I 160 mctrcs on the cautheast sidc of Morrissey Creek. with thc main level developed a h g the strikc of the seam, Longwall mining was selected as the most feasible method lo exploil the dip of the seams (It) to 2 0 degrees) and to ensure maximum recotcry. ventilation, and productivity. The prop- erty is very close to rail; the proposed mine entrance described here. fur example, is lesb than 6 kilometres cast ul the Canadian Pacific Railway line. Normal itnnual production m e u'as projected to be I million tomes. The Mitsui interim report based itsrevisedrecovera- ble reserve calculation, on the assumptinn that rootn-and-pillar mining would bc utilizl:d where possible. that is. whcrc the dip was sufliciently IIW. presurnably in the Iowcst. most northeast portion of the mine.
COMPUTER DEPOSIT MODEL The Flathead Ridgc area was mudelled using the grid surface
technique in which calrh deposit characteristic of interest i s repre-
techniques were cmplcmyed t o c o n s t ~ c t the digital surface? depend- sented by a grid of va l>m covering thc whole deposit. A variety of
datacollection, grid building, anddeposit modelanalysis. Software ing upon data charactcristlcs. This section of the paper dixusses
utilized in this projcc: were the Data Handler and Grid Handler modules of Cal Data Ltd.'s Geological Analysis Package. which was donated to the Geological Branch.
area to be modelled, the resolution, and the orientation of the model The first stcp in the !modelling procedure is to celect the si7.e of
grid. In this study a 90 by 39 rectangular grid consisting of 100-
metres (Fig. 2-41, Due to the orientation ofthe strata (130 degrees). mctre grid squares was constructed which covers 35 square kiln-
the grid was oriented northwest southeast, so grid north i s actuilly 41 degrees cast of north. A new coordinate system was used dding modelling; i t was parallel to thc rn~xlel grid with the origin in !he southwcst comer of the grid. Oncc the s i x and shape of the na8dcl were selected, the required information was entered into the com- puter and corresponding surfac,:s calculated. The objective of 1 % model was to detcrmine coal tonnages and their distribution wi lhin the study arca. 'To arrive at the2 answers the following pararnet:rr were entered andlor described by grid surfaces: (I) topographic position, (2) seam elevations. (3) seam thicknesses. (4) seam areal positions, and (5) distances from nearest data points to each grid mode.
faces for each of these parameters The fulluwing section discusre, determination of the grid sur
contour map with 5-metre cortmr intervals which was prov de( Topographic data was collected from an existing 1:5000~s:ali
with the Harada. el a/ . (1968) rspmt, A digitizing tablet conne:tcr' to an I H M XT was utilized for this function. Data was digit~.cecl along lines through the centre of the columns of the model grid: ?at;, was recorded wherevcr a significant (to define al l breaks in !,lopel contour crossed the line. The value:; at the centres of each r d thr
between data points along the d gitizcd lines. The advantages o f )hi,; model grid squares was then deternined by linear interpolztiori
method are that a high degree of ;accuracy i s obtaincd for th,: values, and the raw data i s retained irl a format that is useable I f 2:riCl square sizes arc changed. The c:isad\'antagc is that data collectiln i; labour intensivc. requiring about 16 lhours of digitizing effort :n :hi; case. The resultant grid was st<,red in Grid Handler foma t .
ofmostmodellingexercises.Fi~stthegeolr~gyofthedcpositmu;tb~: Seam positioning within the 8Jeposit is thc most complex prntient
solved, thcn the configuration of thc scams digitially reprer.er~tecl and stored.
position in outcrops, borehnles, trenl:hes, and adits. Outcrop nrien~ Data used for this purposc were bedding orientation and scant
tation data was collected by mmns US the digitizing tablet with th,: COD (Coal Outcrop Digitizer) pl-ol:ram developed by one 0' th: authors (W. E. Kilby). The res~ltant information consisted t ' l a1 outcrop identifier, easting and northing coordinates, elevation, di I direction and dip of strata, formation code, and type of menst,re.l feature. This data was then st~~r,:d in Data Handler fornat. Borehole, trench, and adit data were collected manually front th: various reports. Seam name. position of thc scam top, cwal t h c k - ness, and information source type were recorded for each !car, encounteredinatrench,a~it,ol.borehole.Inaddition,thccolla'ani end of hole positions were recc~rdcd for boreholes. Six seami viers incorporated into this modcl. Two seams, A and H. are f w n J throughout the entire model a ~ a . 'The other four seams, A - (A lower), BU ( 8 upper), A I , and 1\2, are of limited extent Vig! 2-4c and 2-6).
first because i t was describcd by thc largest number of wel l - spxd 8-seam, the upper of the two cortinuous seams, was positir~ncd
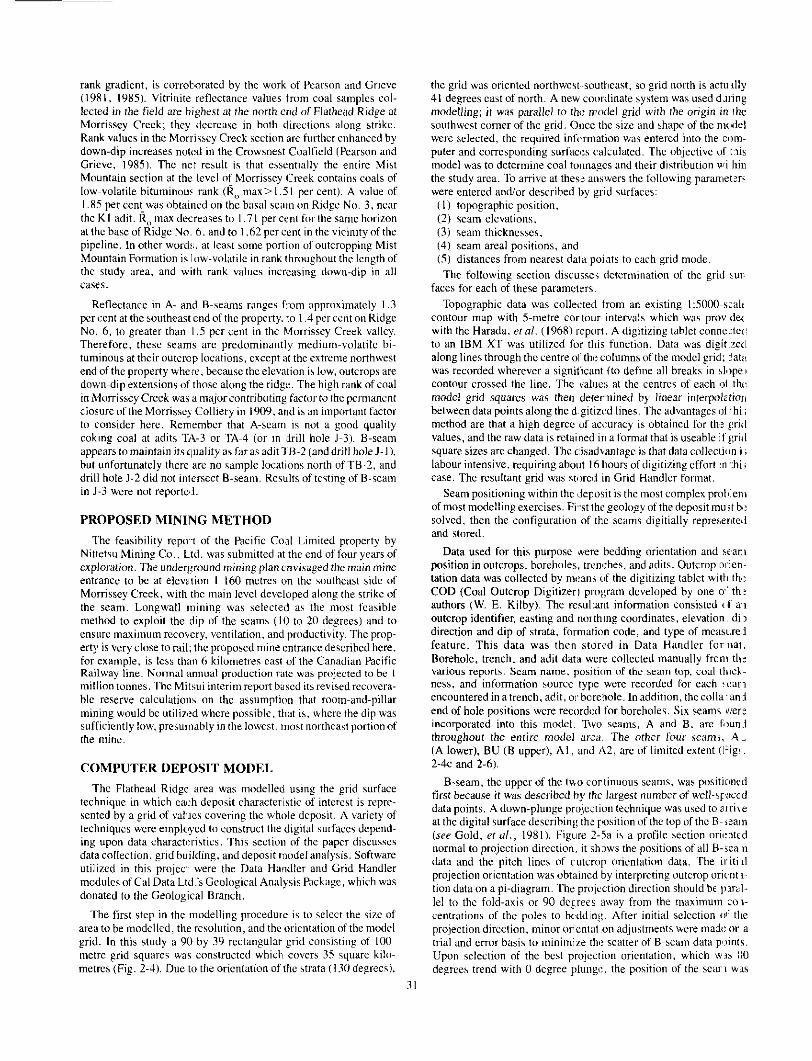
data points. A down-plunge projection technique was used to arri\e at the digital surface describinl! ths plosition ofthe top of the E:-,eam (see Gold, et a / . , 1981). Figure 2-Sa is a profile section oril:ntid
data and the pitch lines of rutcrnp orientation data. 'The i r i t i d normal to pro,jection direction, i t sh.,ws the positions of al l El-rea n
projection orientation was obt;~incd by interpreting outcrop oricnt L- lion data on a pi-diagram. The prolection direction should hc 1 1 m - le1 to the fold-axis or 90 degrees away from the maximum :o1- centrations of thc pules to bcddlnj;. After initial selection t l ' the projection direction. !minor wentat on adjustments were mad,: or a trial and error basis t u minimize thc: scatter of B-seam data piinls. Upon sclection of the best projection orientation. which 'wds I10 degrees trend with 0 degree plungc. the position of the scilr1 w l s
R I
N
~ , 1 , " ............................................ ......... .......................................... :-2~-~ ........ ...._ . .................................................... ........................................... .................. ,?5! ~ . , , ....................... . . . . . . . . . . . . . . . . . . . . . . . . . . . . . . . . . . . . . . ...................... ............................... ........................... ~ ........................... ........................... ~ ..................... .......................... .. ................ .. ............. ....._...I. . . . . . . . A,.", ................... ,~ , / x "~
......... . ." _-"- ,?i' ~ ~ ~ : : . . . . . .
- . . . . . ... ...................... .... .......................... " - ~ ~ ............- " ............................ . ...................... ~
......................... ...- - ~ . ~ . ~
~~ ~~
~~ - .. . . . . . . . . . . . . ~ - ~ ~ ~ - ,
................. ~~~~~ ~~~ . . . . . . . . . . . . . . ................. ,- . . ~.~
.., .., -~ ~ ~~ ~ .. . . . . . . . . . . . . . . . . . . . . . . . . . . . . . . . ........ . . . . . . . . . . . . . ~~~ ~~.
~. .~~ ./ . . . . . . . . . . . . .
. . ~~~~~~ ~ . . . . . . . . . . . . . . ~. ~ . . . . . . . . . . . . . .
~~ . ,-, , . : ~ ~ : . . , , , , , . . . . . . . . . . . . . ,
. . . . . . . ~~
. . . . . . ........... ................ ........................ ........................... ~ . . . .
"-;" ; , , . , ................... ............... ....A
......................... " < ~ ~ . . . . . . . . . . ,:j:e7Z.:::: ......................... .................. ..................... ................ .......................... .................
(6) PROJECTED STRUCTURALCONTOUR GRID
(C) RESIDUAL CONTOUR GRID
(D) FINAL ELEVATION GRID
Figure 2 - 5 . cal Down-plunge projection profile of B-seam data (dots) and selected outcrop orientation data (pitch lines). Interpreted B-seam position also shown. (b) B-seam structural contour grid obtained by projecting inrerpreted B-seam position line from (a1 parallel to the
grid. (dl Final 8-seam position grid obtained by subtracting the residual grid Srnm the grid displayed in (b). This grid has been trimmed at projection direction. (c) Residual grid, obtained by griddinp the difference between B-scam positional data and the B-seam structural contour
outcrop and property boundaries. 32
r manually traced onto the profile. This line was then digitized and projected pardkl t o the selected projection direction SII that i ts position at each grid ct'ntre could be calcukated. The result was a
profile and oriented parallel to the projection direction (Fig. 2-Sh). surface which had the cross-sectional shape of the seam trace on the
This surface reflects the general structure of the seam hut, bcrause i t is artificial. docs not nwrssarily coincide with any o f the B-scam data. To solve this prublcm a residual grid was constructed and added to the down-plurge projection (dpp) grid. The residuel grid was calculated by an irverrs distance squared wcighting. cmoving average algorithm. The raw deta f o r this calculatmn is the diffcrcnce
tained in the ddp grid (Fig. 2-5c). .The grid csed to make evaluation in elevation between th,: actual data position and the position con^
calculations Wdb gencrzted by adding the residual grid to the dpp grid; this resulted in a surface which retains the authors' intcrpreta- tion of the general structure hut also honuurs a11 data points (Fig. 2-Sd).
A-seam was positioned by determininp a grid of A-Team to
grid. Only four widely :;paced boreholes provided uscahle infbrma- 0-seamdistances and subtracting this grid from the 5~1cam poritian
tion for this purpose. A grid was constructccl from these mw data by the inverse dislance squared i l l @ ) moving avcragc technique.
trimmed by removing those grid squares u hiuh represented seam Once these two sca r position grids were determined. they were
positions abavc the top.~graphic surfacc. The four minor seam position grids ACT,: ohtaincd in a similar
manner except that curlstant inter-seam intcrval thickncsse, wcrc used for each scam. Thcse interval thickncsws w r c + I, ~ I . ~ 8 . and - 16 metres for B-BU. A-AL. A - A I , ;and A ~ A 2 respectlvcly. The same outcrop trim lincs were used fhr these minor seams a s for the associated continucus scanis, which ic acceptahlc due t o thc steepncss of the ridge f isc and the scalc of the model
moving average algorithm. Tot;d c t ~ a ! thickness w,ithin seams r i the. Seam thickness grids for all thc seams wcre obtained by .I l id!
than actual seam thickncsses wcre us:d in these calculations. Scmi variograms were determined fclr the thickncss data, hut due tc the, limited number and poor distritxtion of data points these plot:, be l l ! ufl i t t leusc.Themcthoduseda~:tu;~l lyrrsul t~inasmoothvcrsi~~~o' results ohtaincd by the polygon method. In one hurcholc an exc':cd ingly thick 5-seam intersection of 17.1 I metres was arhitrxd!, reduced to 1 0 metres as i t was f d t that this anomalrlus thicknes wd!,
too great an area of the model. :Some trcnch data did not cxpoii thr not depositional. but dm tu lucid sfruclurc and should not mllo'mct
entire bedm and thicknesxs were reported as a value followed ly i. ' + ' sign. Only the reportcd thickness Y ~ U C S ='ere used, thus s:an thickncss values are on the conservxivc side.
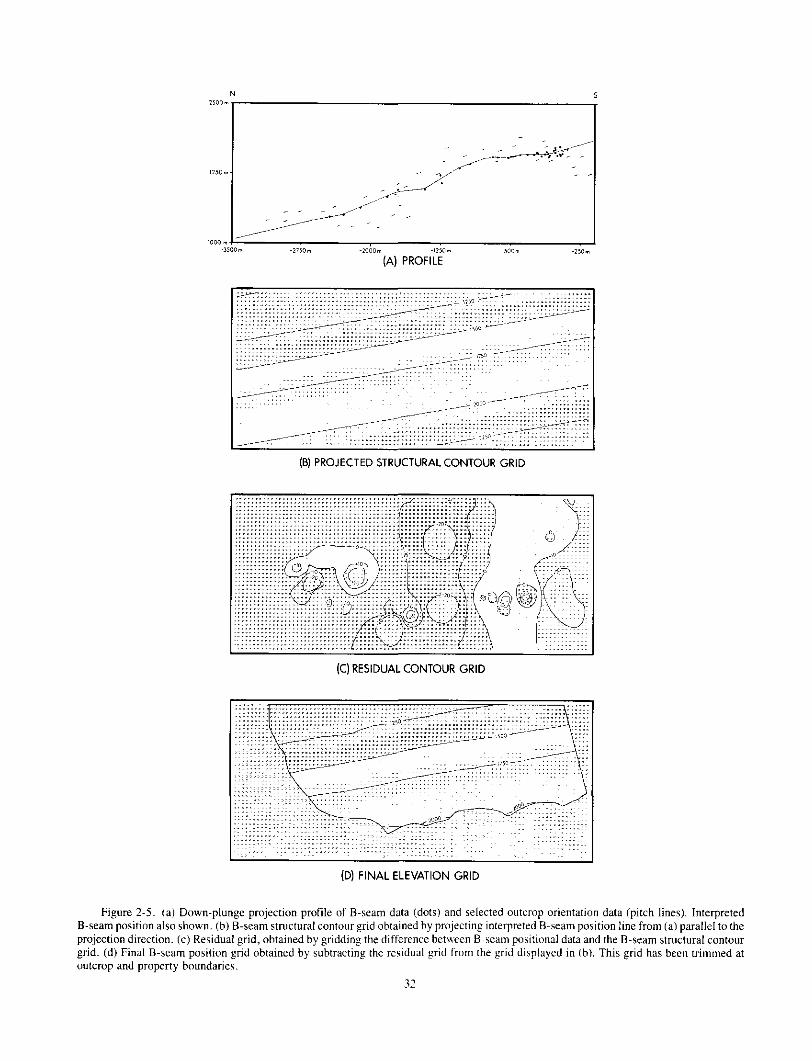
A series of grids or template!., u'hich mark the area of the mode
contained a 'I' in each grid point underlain by thc seam and a '11' ir underlain by each seam. were cons:ructed. These templatc pid!
areas where the seam was nt~t F'rescnt (Fig. 2-61. The A - i m c B-seams were only absent in areas where the seams were remcvec by erosion. The four minor seami had suhsurfdcc terminatirlnr ir addition to the erosional terminations.
Finallyaseriesofgridscontaining'hedistancetothenrarcst~l~tn point from each grid square ccn:re [or each seam were conhtruc'cd. These grids are used to categorize tonnage Y d h C S bccause &l:o- statistical parameters such as thme in Kilhy and McClymont (I C 8 : 5 ) were unabtainable: the quality of the rdw &ata was inadequ;u<: t n define thcsc parametcrs (Fig. 2~71.
Upon completion the Flathea81 R i d y model contained 31 digital surfaces describing the five deposit ~wariahles selected. Additii'ndl surfaces describing other parameters could he added to the mde l .
Figure 2.6. Areal distribution of seams uwd in the digital deposit model. A and 0-seams arc found over Ihi: whole area with only milo: differences in outcrop traces.
33
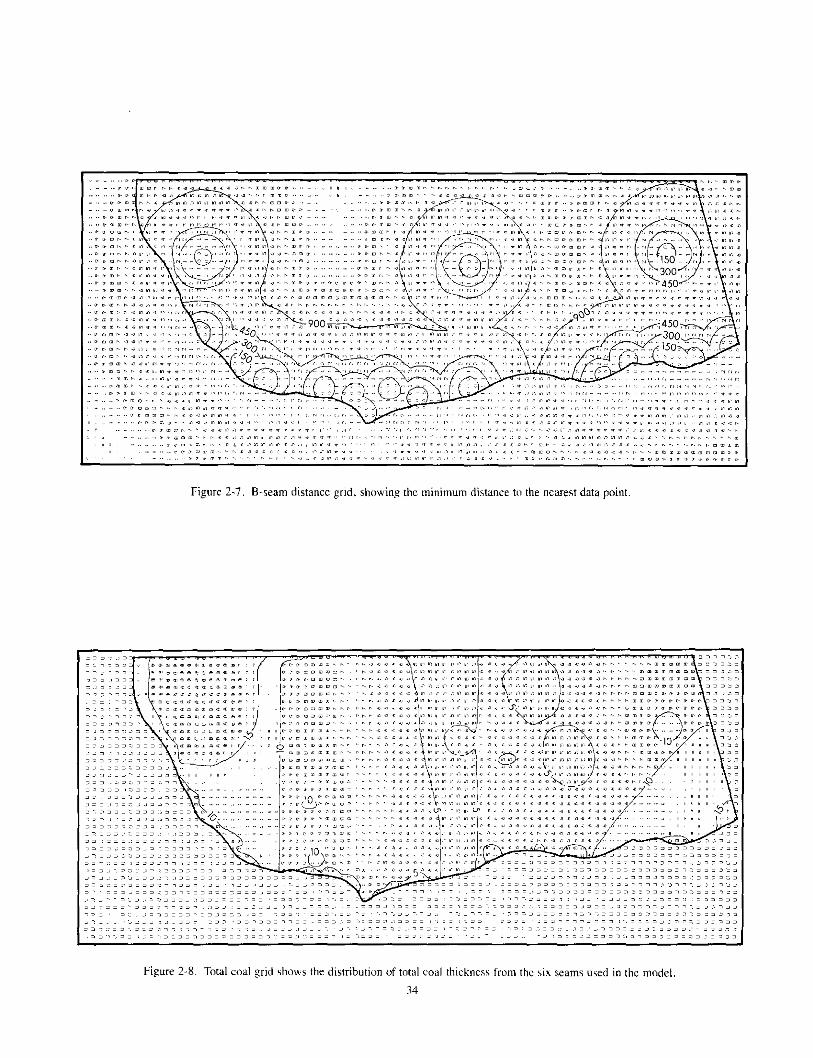
Figure 2-7. 6-seam distance grid. showing the minimum distance t o the nearest data point
MODEL ANALYSIS
The digital model d8:scribcs coal seam position, thickness, and distance from the nearest data point within the study arca. As such i t can be used to answer a variety of questions related to the coal resources. The following section describe:, the techniques used to extract these answers from the model and presents some of thc results.
How much coal i s in the deposit in the vaious confidence catego- ries? To answer this que stion the seam thickness grids for each scam were assessed. Coal thickness values at each grid square which fell within the acceptable boundaries cantaincll in the template grids, and which fell within a specified distancc from the nearest data point, contained in the distance grids, wen: summcd. A minimum seam thickness of 1.3 mctre was used in these rdlculations. The three distance intervals which werc selected to correspond with the
RESERVES AND RESOURCES, FLATHEAD RIDGE TABLE 2-4
A 6 286 130 12 815 100 86 778 OOO 105 879 000 AL I 023 340 3 253 450 17 920 200 22 197 no0 A I 673 532 I 067 230 3 283 410 s 024 170 A2 634 593 I 052 550 3 472 390 5 159 530 B 8 390 460 1 I 628 200 69 645 700 X9 664 300 BU 463 211 351 411 I 0 4 0 260 I X54 880
Total 17 471 266 30 167 941 1x2 139 960 229 778 X80
categories of measured. indicated, and inferred were 0 to 150 metres, 150 to300 metres. and::re.itrrthan 3MImctrcs rcspcctiwly. A coal specific gravity of I . 3 glcc w d s used in the calculations; (:acll grid square was I00 by 100 metres, therefore there would be 13 tK l l00 tonnes per vertical metre of cod per grid square. The results 01 :hi i calculation are presented for each seam in Table 2-4.
total-coal map. This procedure required only summing all the sfan1 Where i s the coal'? This question was answered by constructirlg :I
thickness grids. The result i s a map 01 coal thickness merthc dcpxit (Fig. 2-8).
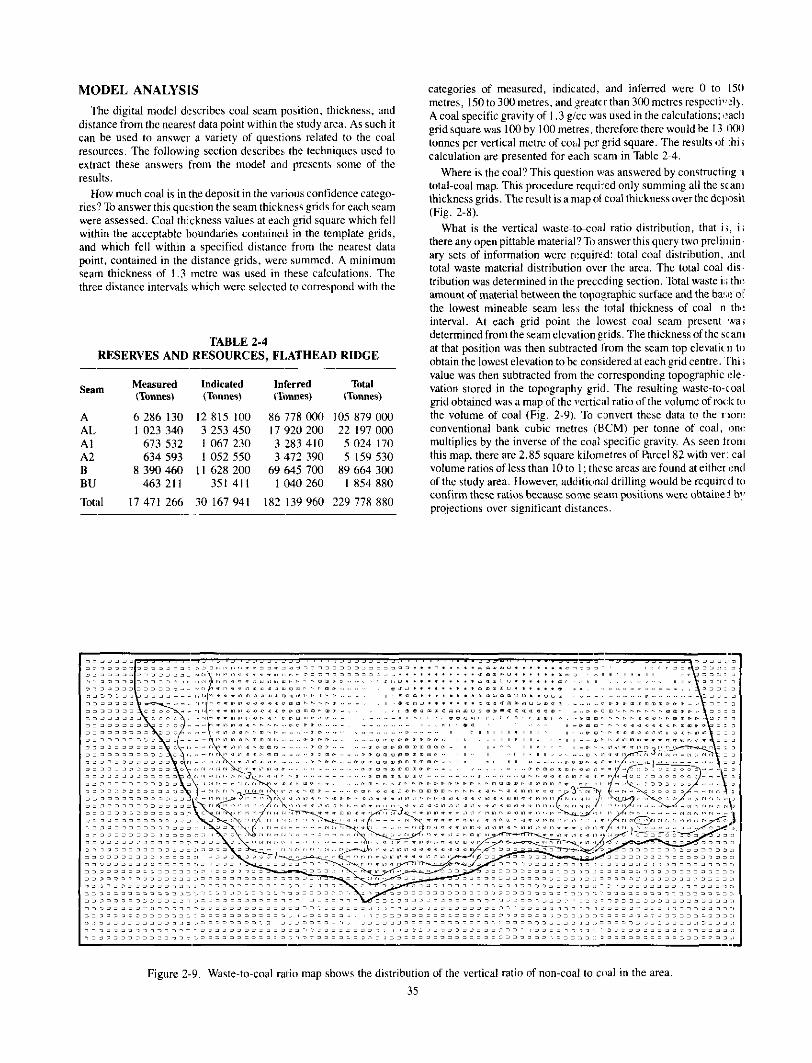
thereanyopenpittablematerial?~,answerthisquerytwopreli~r~in What i s the vertical waste-to-coal ratio distribution, that is, i;
ary sets of information were rqu i r rd : total cwal distribution, ,in11 lotdl waste material distribution ovcr the arca. The total coal (lis- tribution was determined in the preceding section. Total waste i,; tht: amount of material between the topagraphic surface and the ba!.,: O F the lowest mineable seam le% ttle total thickness of coal In thl:
determined from the seam elevation grids. The thickness of the Sean1 interval. At cach grid point :he lowest coal seam present wa;
at that position was then subtracted riom the seam top elevaticu to obtain the lowest elevation to be considered at each grid centre. '[hi ; value was then subtracted from the corresponding topographic f!le vation stored in the topography grid. The resulting waste-to-coal grid obtained was a map of the vertic;il ratio of the volumc of rod( the volume of coal (Fig. 2-9). To cmvert these data to the nor,: conventional bank cubic metres (RCM) per tonne of cnal, con(: multiplies by the inverse of the coal specific gravity. As seen Iron1 this map, there arc 2.85 square kilarnetres of Parcel 82 with w!r: cal volume ratios of less than 10 to 1; these areas are found at eithcr I:n(l of the study area. However, additional drilling would be requiri (I to confirm the% ratios because some seam positions were obtainei b!' projections ovcr significant distances.
r . . . ...... D I c l l l l r . . . . . , . . . . . . . . r a m a m m l m m m a . . , ,
...... , , " ^ _ ,, ,, . , . ,,.. ~ . . . . . . . . . . . , " ....
............................. ...>.,..2. .......................................................... ........... 777=.7.7i...==.=.=.., ...................................... ....772177..17..77.. .......... =7j. .................................................... : , > = , , ~ .................... I ".
Figure 2-9. Waste-to-coal ratio map shows the distribution of the vertical ratio of non-coal to c m l in the area
35
CONCLUSION
study indicates that the Flathead Ridge area contains considerable The model is based on limited poorly distributed data, yct the
coal resources. Significant tonnages of this cmal may already be placed in the measured and indicated categories as defined by Energy, Mines and Resources Canada and thc British Columbia Ministry of Energy, Mines and Petroleum Rcsources. In addition.
low-volatile coal that could be extractable by open pit methods. The severdl portions of the area hold significant volumcs of medium to
area i s wcll situated with respect to infrastructure.
ACKNOWLEDGMENT Digitizing of topographic data was performed by H . Oppclt.
REFERENCES Aihara. A. (1970): The lntcrim Report on the Ficld Investipation
Executed in the Flathcad Ridge P.C.I. (s ic) Property, British Columbia, Canada, Mitsui Mining G J . . Lfd. , Open File Assessment Rept., 24 pp.
Gibson. D. W, (198s): Statipraphy, Sedimenrology and Deposi- tional Enwronments of the Coal-bearing Jurassic-Cretaceous Kuotenay Group, Alberta and British Columbia, G e d sur^,., Cunadu. Bull. 357, 108 pp.
Gold, C. M.. Charlesworth. H.A.K.. and Kilby, W. E. (1981): Coal Resource Evaluation in Deformed Sequcnccs Using Digi- tal Terrain Models, Cdn. Pet. G e d . Bull.. Vol. 29. No. 2, pp. 259-266.
Grieve. D. A . and Kilby. W. E. (1985): Structural Modelling of Parts of the Northern Dominion Coal Block (Parcel 73). South- castem British Columbia (X2G/10). E.C. Minislry ofEnrryy. Minrs&Per.Rer..GeologicalFieldwark.19X4.Paper1985~1.
Harada. K . . Nakamura. E. and Hayashi, S . (1967): Report on the Second Survey of Fernie Coal Mine. British Columbia. Can- add. Nittuou Mining Co., Lrd. and RIJO Molka Korsha. Lrd., Open Filc Assessment Rept., 70 pp.
Harada, K . , Nakdmura, E, Iwamoto. N . , and Hayashi. S. (1968): Survcy Report on Fernie Coal Mine. British Columbia. Cdn- ada. Nirrrrsu Mining Co.. Lrd. and T0i.o Mrnka Krrisha, Lrd.,
Kilby, W. E. and McClymont, B. 1. (1985): An Examplc of Geo- Opcn File Assessment Rept.. 98 pp.
puter: Bullmoose Coal Mine. Northeastern British Columbia, logical Modelling and Data Manipulation with a Microcom-
Nakayama, K . . Hatta, K . , and Hatada, K . (1966): Report on the C . I . M . , Bull . . Vol. 78 , pp. 37-46.
Survey of Femie Cad Mine, British Columbia, Canada. Nit- fersu Mining Consulranrx Co.. Ltd.. Open Filc Assessment
Ollerenshaw, N. C. (1981a): Cadomin Formation, Flathead Ridge Rept., 37 pp.
Vicinity, Southeastern British Columbia, in Current Rebearch, Part A. Gml . Ssrv., Connda, Paper 81-IA, pp. 341-347.
-098Ib): Parcel 82. Dominion Coal Block, Southeastern British Columbia. in Current Research. Part B , G r d . Surv.,
Pearson, D. E. and Grieve. I). A . (1981): Geology of Crowsnest Canodn, Paper X I L I B , pp. 145.152.
Coalfield, Southern Part, B.C. M i n i n n qfEneryy, ,Mines & Per. Re.7.. Prclim. Map 42.
Pearson. D. E . and Grieve, D. A . (1985): Rank Variation, Coalification Pattern and Coal Quality in the Crowsnest Coalfield, British Columbia, C . I . M . , Bull.. Val. 78. pp. 3Y-46.
Shiokawa, K. (1968): Feasibility Report, FernieCoal Mine Project, British Columbia. Canada, Nirretsu Mining Co.. Lrd., Open File Rcpt., 27 pp.
pp. 53-65.