flexibility in cash-flow classification under ifrs
TRANSCRIPT

Elizabeth A. Gordon, Elaine Henry, Bjorn N. Jorgensen and Cheryl L. Linthicum
Flexibility in cash-flow classification under IFRS: determinants and consequences Article (Published version) (Refereed)
Original citation: Gordon, Elizabeth A., Henry, Elaine, Jorgensen, Bjorn N. and Linthicum, Cheryl L. (2017) Flexibility in cash-flow classification under IFRS: determinants and consequences. Review of Accounting Studies . pp. 1-34. ISSN 1380-6653 DOI: 10.1007/s11142-017-9387-1 Reuse of this item is permitted through licensing under the Creative Commons:
© 2017 The Authors CC BY 4.0
This version available at: http://eprints.lse.ac.uk/67367/ Available in LSE Research Online: March 2017
LSE has developed LSE Research Online so that users may access research output of the School. Copyright © and Moral Rights for the papers on this site are retained by the individual authors and/or other copyright owners. You may freely distribute the URL (http://eprints.lse.ac.uk) of the LSE Research Online website.
Flexibility in cash-flow classification under IFRS:determinants and consequences
Elizabeth A. Gordon1& Elaine Henry2 &
Bjorn N. Jorgensen3& Cheryl L. Linthicum4
# The Author(s) 2017. This article is published with open access at Springerlink.com
Abstract International Financial Reporting Standards (IFRS) allow managersflexibility in classifying interest paid, interest received, and dividends receivedwithin operating, investing, or financing activities within the statement of cashflows. In contrast, U.S. Generally Accepted Accounting Principles (GAAP)requires these items to be classified as operating cash flows (OCF). StudyingIFRS-reporting firms in 13 European countries, we document firms’ cash-flowclassification choices vary, with about 76, 60, and 57% of our sample classi-fying interest paid, interest received, and dividends received, respectively, inOCF. Reported OCF under IFRS tends to exceed what would be reported underU.S. GAAP. We find the main determinants of OCF-enhancing classificationchoices are capital market incentives and other firm characteristics, includinggreater likelihood of financial distress, higher leverage, and accessing equitymarkets more frequently. In analyzing the consequences of reporting flexibility,we find some evidence that the market’s assessment of the persistence of
Rev Account StudDOI 10.1007/s11142-017-9387-1
* Bjorn N. [email protected]
Elizabeth A. [email protected]
Elaine [email protected]
Cheryl L. [email protected]
1 Fox School of Business and Management, Temple University, 453 Alter Hall, 1801 LiacourasWalk, Philadelphia, PA 19122, USA
2 School of Business, Stevens Institute of Technology, Hoboken, NJ 07030, USA3 London School of Economics and Political Science, WC2A 2AE, London, UK4 College of Business, University of Texas at San Antonio, San Antonio, TX 78249, USA

operating cash flows and accruals varies with the firm’s classification choicesand the results of certain OCF prediction models are sensitive to classificationchoices.
Keywords Statement of cash flows .Classification shifting . IFRS .Operatingcash flows
JEL Classification M41
1 Introduction
We examine the determinants and consequences of comparative flexibility inclassification choices within the statement of cash flows. International FinancialReporting Standards (IFRS) are perceived to allow managers more flexibilitythan generally accepted accounting principles in the United States (U.S.GAAP). This increased flexibility is apparent with regard to classificationswithin the statement of cash flows. U.S. GAAP requires that firms classifyinterest paid, interest received, and dividends received as operating cash flows.In contrast, IFRS allows firms the flexibility to report these items as operatingcash flows (OCF) or as investing or financing. We describe variation in firms’cash-flow classification choices under IFRS, identify capital market incentivesand firm reporting environment characteristics associated with these choices,and document consequences of classification flexibility.
Cash flow, and particularly OCF, is well established as a basis for businessvaluation (e.g., Damodaran 2006; Imam et al. 2008),1 contracting (e.g., Dichevand Skinner 2002; Mulford and Comiskey 2005), and financial analysis (e.g.,Estridge and Lougee 2007). Although an extensive literature examines classifi-cation shifting within the income statement and the balance sheet (Engel et al.1999; Marquardt and Wiedman 2005; McVay 2006; Bartov and Mohanram2014), less attention has been given to classification variations within thestatement of cash flows (Lee 2012) and classification restatements (Hollieet al. 2011). IFRS reporting provides a setting where the accounting standardsprovide firms flexibility in classification choices within the statement of cashflows.
The effect of flexibility in cash-flow classification and its consequencesmatter because both the International Accounting Standards Board (IASB) andFinancial Accounting Standards Board (FASB) share the objective that financialinformation should enable financial statement users to better predict future cash
1 Imam et al. (2008) present evidence that discounted cash flow models and price earnings multiples are thevaluation models most preferred by analysts. Liu et al. (2007, 56), who present evidence that earningsmultiples dominate cash flow multiples in predicting share price, nonetheless note that many practitionersprefer to use cash flows rather than earnings as a basis for valuation using multiples. Practitioners, thesescholars say, argue Bthat accruals involve discretion and are often used to manipulate earnings. . . . Andexpenses such as depreciation and amortization deviate substantially from actual declines in value becausethey are based on ad hoc estimates that are, in turn, derived from potentially meaningless historical costs.^
E. A. Gordon et al.

flows.2 Furthermore, both boards articulate the importance of accrual and cashflow information in achieving this objective. The IASB articulates its positionas follows.
Information about a reporting entity’s cash flows during a period also helps usersto assess the entity’s ability to generate future net cash inflows. It indicates howthe reporting entity obtains and spends cash, including information about itsborrowing and repayment of debt, cash dividends or other cash distributions toinvestors, and other factors that may affect the entity’s liquidity or solvency.Information about cash flows helps users understand a reporting entity’s opera-tions, evaluate its financing and investing activities, assess its liquidity or sol-vency and interpret other information about financial performance.3
Despite identical objectives, standard setters have established different requirements forpresentation of certain items—interest paid, interest received, and dividends received—inthe statement of cash flows. As a consequence, the amount of OCF reported by a givenentity can differ under U.S. GAAP and IFRS. Theoretically, the appropriate classificationof these items is open to debate. Evenwhen deliberating on the adoption of the statement ofcash flows standard, Statement of Financial Accounting Standards No. 95 (SFAS 95),members of the FASB discussed the classifications of interest paid and interest received,ultimately opting to require these items be reported in the operating section.4
We initially document variation in classification choices within a hand-collectedsample of 798 nonfinancial IFRS firms in 13 European countries from 2005 to 2012.About 76, 60, and 57% of the sample classifies interest paid, interest received, anddividends received, respectively, in OCF. Only about 42% of the sample firms thatreport all three items opt to classify all three in OCF. We document significant variationin classification across industries and most countries.
The first set of analyses focuses on firms’ classification choices and theeffect on reported OCF. Results indicate that reported OCF tends to be higherunder IFRS than it would have been under U.S. GAAP. Similarly, investing and
2 In IFRS, the Conceptual Framework, Chapter 1, The Objective Of General Purpose Financial Reporting¶OB3 states: BDecisions by existing and potential investors about buying, selling or holding equity and debtinstruments depend on the returns that they expect from an investment in those instruments, for exampledividends, principal and interest payments or market price increases. Similarly, decisions by existing andpotential lenders and other creditors about providing or settling loans and other forms of credit depend on theprincipal and interest payments or other returns that they expect. Investors’, lenders’ and other creditors’expectations about returns depend on their assessment of the amount, timing and uncertainty of (the prospectsfor) future net cash inflows to the entity. Consequently, existing and potential investors, lenders and othercreditors need information to help them assess the prospects for future net cash inflows to an entity.^ In U.S.GAAP, Concepts Statement No. 8 ¶ OB3 is identical.3 IFRS Conceptual Framework, Chapter 1, ¶OB20, which is identical to U.S. GAAP, Concepts Statement No.8 ¶ OB20.4 Even though U.S. GAAP requires interest paid and interest received to be reported as operating cash flows,paragraphs 88–90 in the basis of conclusions of SFAS 95 BStatement of Cash Flows^ (FASB 1987) discuss thedebate over the classification of interest paid and interest received during the deliberation preceding theadoption of the standard. See Nurnberg and Largay (1998) for a historical perspective on aspects of the debate.SFAS 95 is now codified in the FASB Accounting Standards Codification (ASC Sections 230 Statement ofCash Flows, 830 Foreign Currency Matters, and 942 Financial Services – Depository and Lending.)
Flexibility in cash-flow classification under IFRS

financing cash flows would generally have been lower under IFRS. The pair-wise means, by firm, for the three cash flow amounts under IFRS versus U.S.GAAP differ significantly.
The second set of analyses focuses on determinants of firms’ cash-flow classificationchoices from the perspective of OCF-increasing classifications. We examine incentivesto inflate reported OCF, similar to the work of Lee (2012), including capital marketincentives, financial distress, the presence of analysts’ cash flow forecasts, and profit-ability. Furthermore, we explore characteristics associated with the reporting environ-ment, such as analyst following, classification choices of industry peers, cross-listing inthe U.S., country, and industry.
In our determinants analysis, we construct two dependent variables as proxiesfor OCF-increasing classification choices: (1) the amount of the difference inreported OCF under IFRS and a benchmark measure of what OCF would havebeen under U.S. GAAP and (2) an indicator variable signifying a classificationchoice that would increase OCF under IFRS relative to U.S. GAAP. For the firstof these variables, we create a hypothetical benchmark by adjusting each firm’sOCF to include interest paid, interest received, and dividends received (i.e.,consistent with U.S. GAAP requirements). That is, we consider a hypotheticalU.S. GAAP benchmark, assuming that managers’ real operating activities wouldhave remained the same even if cash-flow classification choices had beenrestricted. We do not assert these items are appropriately classified as OCF.Rather, we use U.S. GAAP classification as a benchmark because our mainfocus is on the differences between U.S. GAAP and IFRS. For the second ofthese dependent variables, we focus on the classification choice for one item,interest paid, which IFRS permits to be classified either in the operating or thefinancing section of the statement of cash flows. We focus on interest paidbecause it usually constitutes a relatively large amount relative to interest re-ceived and dividends received, is commonly reported, is typically reportedseparately, and is thus easier to identify. A firm may have more control overthe amount and timing of cash outflows (i.e., payments), as opposed to cashinflows (i.e., receipts), thus making interest paid more susceptible to use as anOCF-increasing item. 5 When a firm classifies interest paid as financing, itfollows that, ceteris paribus, reported OCF will be higher than if interest paidhad been classified as operating. Thus classification of interest paid as financingis an OCF-increasing classification choice.
A cross-sectional determinants analysis of all firms with consistent classificationduring the study period indicates that actually reported OCF exceeds benchmark-OCFby a greater amount for firms with weaker financial positions (i.e., greater likelihood offinancial distress, higher leverage, and lower profitability). Firms with higher amountsof equity-raising activity also make greater OCF-increasing classification choices. Forthe determinants analysis using an indicator variable signifying classification choice,we find that firms with higher leverage are more likely to make an OCF-enhancingchoice and firms cross-listed in the United States are more likely to make a classifica-tion choice that is consistent with U.S. GAAP. We find no effects related to homoge-neity of industry practice or to the presence of analysts’ cash flow forecasts.
5 We thank an anonymous reviewer for this observation.
E. A. Gordon et al.

An examination of 99 firms that change classifications during our sample periodreveals that 58% make OCF-increasing classification choices. The most commonchange is a reclassification of interest paid out of operating, an OCF-increasing choice.Analysis indicates that an OCF-increasing reclassification is more likely for firms withgreater equity issuance and less likely for firms with more analyst coverage, homoge-neity of industry practice, and a cross-listing in the U.S.
Variation in classification of cash flow items also introduces noncomparability intomeasurement of widely used metrics, such as accruals and free cash flow.6 Thereforethe final set of analyses focuses on consequences of flexibility in classification choice.The first consequence we examine pertains to the market pricing of persistence of cashflows and accruals. We examine whether the persistence of cash flows and accrualsdiffers for firms that report consistent with U.S. GAAP, compared to those makingclassification choices permitted under IFRS. We find some evidence of differences inaccrual pricing between the group of firms reporting consistent with U.S. GAAP andthose using the classification flexibility allowed under IFRS, but results are sensitive tomodel specification.
A second consequence we examine pertains to models for predicting cash flows thathave been used in accounting research. We find that differences in cash classificationchoices affect results when the cash flow prediction model is based on sales (Dechowet al. 1998; Roychowdhury 2006) but not when the cash flow prediction model is basedon cash flows (Barth et al. 2001; Givoly et al. 2009). One implication is that the lattertype of model may be more useful in the international context in which flexibility incash-flow classification exists.
Our study contributes to literature on managerial discretion in the use of non-earningsmeasures, especially in an international context. Although managerial discretion in cash-flow classification could help financial statement users, our evidence suggests thatclassification choices are associated with incentives to report higher OCF. We also findthat the likelihood of making an OCF-increasing change in classification is positivelyassociated with equity issuance but negatively associated with analysts’ coverage, con-sistent with analysts serving some deterrent role. Similarly, being cross-listed in the U.S.decreases the likelihood of making a cash-flow classification change.
Our study also contributes to the debate over costs and benefits of comparability anduniformity (De Franco et al. 2011). Flexibility in cash flow reporting may result inlower comparability and uniformity and thus may create significant costs for usersbecause of the use of cash flows in valuation and contracting.7 We provide evidencethat the market pricing of the persistence of accruals and cash flows differs, dependingon the cash-flow classification choices made. While flexibility in cash-flow
6 Accruals are sometimes measured as the difference between earnings and cash flows from operatingactivities, and free cash flow is often measured as operating cash flow minus capital expenditures. Thealternative Hribar and Collins (2002) measure of accruals based on the balance sheet, even if superior, is notalways feasible in an international setting.7 For example, Portugal Telecom reported 2006 OCF of €1,788. Interest paid of €569 was classified asfinancing, and interest received of €239 and dividends received of €36 were classified as investment activities.Overall, OCF would have been 16% lower under U.S. GAAP than as reported under IFRS. This illustrates thesignificance of cash-flow classification choices. An analyst covering Portugal Telecom and U.S. telecommu-nications companies or even other European telecommunication companies, such as Deutsche Telekom AG(which in 2006 classified dividends received, interest paid, and interest received all in operating), would havehad to address noncomparability in financial ratios and in OCF-based valuations.
Flexibility in cash-flow classification under IFRS

classification could lead to more informative OCF, our findings indicate that suchflexibility impacts the comparability of reported OCF.8
Our study should matter to various audiences. Cash-flow classificationchoices available under IFRS, but not under U.S. GAAP, potentially limit thegeneralizability of U.S. evidence relying on reported OCF.9 Researchers com-paring OCF and other performance measures should be interested in the effectsof classification on their estimates (e.g., Bernard and Stober 1989; Sloan 1996;Ashbaugh and Olsson 2002; Orpurt and Zang 2009; Barton et al. 2010).
With an increasing number of countries permitting or requiring IFRS (DeGeorge et al. 2016), our findings should inform regulators, including the U.S.SEC, which has considered potential adoption of IFRS (SEC 2011). As IFRSallows more flexibility than U.S. GAAP, U.S. regulators should note thevariation in firms’ classification choices and the factors associated with thosechoices.10 Standard setters can use an understanding of the factors associatedwith a firm’s reporting choices when crafting standards that permit alternatives.In addition, financial statement users may benefit from understanding whetherand how management’s cash flow classification choices relate to reportingincentives and firm characteristics (Carslaw and Mills 1991).
The paper is organized as follows. Section 2 discusses the motivation andresearch design. Section 3 describes our sample selection and presents acomprehensive description of cash flow classification of interest paid, interestreceived, and dividends received. Section 4 reports results of the determinantsof firms’ cash flow classification choices, while Section 5 includes the analysisof specific consequences of flexibility in classification choice. Section 6concludes.
2 Motivation and research design
2.1 Determinants of OCF classification choices
We follow Lee (2012) and explore incentives and reporting environment factors relatedto reporting higher OCF.11 Incentives for reporting higher OCF relate broadly to capitalaccess and contracting. Additionally, reporting environment factors affecting classifi-cation choice include industry and market aspects (analysts’ forecasts and cross-listing).
Because OCF is an important measure in assessing credit and default risk (Beaver1966; Ohlson 1980; DeFond and Hung 2003), we expect that firms closer to financialdistress will be motivated to report higher OCF. We create a proxy for financial distress
8 In their discussion of reasons for flexibility in financial reporting, Fields et al. (2001) note a potential benefitof flexibility is the ability for managers to provide a more informative signal; the authors also describe apragmatic justification is the cost of eliminating flexibility. Arguably, a pragmatic explanation for flexibilityacross IFRS is the increased likelihood of widespread adoption.9 See Barth et al. (1999), Piotroski (2000), Mohanram (2005), and Penman and Yehuda (2009), among others.10 Additionally, from a practical standpoint, our identification of what appears to be more than incidentalnoncompliance with classification and disclosure guidance could be relevant to standard setters and regulators.11 Under IFRS, the choice of classification on the statement of cash flows is not required to be the same as theplacement on the firm’s income statement. So income statement classification incentives do not drive cashflow reporting.
E. A. Gordon et al.

based on Altman’s Z-score (Altman and Hotchkiss 2006).12 Arguably, firms accessingequity markets more frequently have a stronger incentive to inflate OCF to increasetheir valuation and thus the amount of capital they can raise. Therefore we expect thatthese firms will be more likely to classify so as to enhance their reported OCF. Ourproxy for capital market incentives is equity issuances. We expect that, the more firmsopt to access the equity markets, the stronger their incentives to report higher OCF.Thus we expect a positive relation between equity issues and OCF-increasing classi-fication choices.
We predict that firms with contracting concerns and costs involved in renegotiatingdebt covenants will also seek to report higher OCF. Our proxy for contracting concernsis leverage, computed as total liabilities divided by total assets. We predict a positiverelation.
We expect that profitability will be associated with OCF-increasing classificationchoices. On the one hand, less profitable firms could be more likely to make OCF-increasing classification choices, managing OCF upward to compensate for weaknessin reported profits. On the other hand, more profitable firms could be likely to makeOCF-enhancing classification choices to reflect better cash flow performance consistentwith income performance. Therefore we do not predict the sign of the associationbetween profitability and OCF-increasing choices.
We examine three explanatory variables related to the firm’s information environ-ment: (1) availability of analysts’ cash flow forecasts, (2) industry practice, and (3)cross-listing in the U.S. The presence of an analyst’s cash flow forecast indicates theperceived importance of OCF and the commensurate scrutiny of reported OCF(DeFond and Hung 2003; Call et al. 2009). Evidence also suggests that analysts’ cashflow forecasts create capital market incentives to report higher OCF (DeFond and Hung2003; Brown et al. 2013; Call et al. 2013). The perceived importance of OCF andcapital markets incentives imply that firms are more likely to classify interest paid infinancing (i.e., make an OCF-enhancing choice) when analysts have issued cash flowforecasts. However, other evidence suggests that analysts’ cash flow forecasts helpmitigate earnings management (DeFond and Hung 2003; Wasley and Wu 2006;DeFond and Hung 2007; McInnis and Collins 2011), essentially serving a deterrentrole. This possible deterrence suggests that firms are less likely to make an OCF-enhancing classification choice when analysts have issued cash flow forecasts. There-fore we do not predict the sign of an association between analyst following and OCF-increasing classification choices.
Our second information-environment variable, industry practice, is relevant toclassification choice because firms could be motivated to increase cross-sectionalcomparability by making classification choices consistent with those of their peerindustry group.13 For example, when considering the choice of where to report interest
12 Because of our cross-country and cross-market setting, we use the Altman model which primarily requiresaccounting variables. An alternative, the Shumway (2001) distress model, as used by Lee (2012), is developedfor a single market and requires market-driven variables. How to extend the market-driven variables to a cross-country and cross-market setting is unclear.13 This relates to the work of Khanna et al. (2004) and Bradshaw and Miller (2008), who show that foreignfirms are more likely to choose accounting methods closer to U.S. GAAP if they cross-list in the United Statesor have product market interactions. Wang (2014) documents increased cross-country intra-industry informa-tion transfers within the EU after IFRS adoption.
Flexibility in cash-flow classification under IFRS

paid, a firm could be hurt by classifying interest paid as operating and thus reportingcomparatively lower OCF when, for example, the majority of its industry peers classifyinterest paid as financing. Alternatively, a firm could make a different choice todistinguish itself from its peers and possibly report higher OCF. In this case, OCF-increasing choices would not be expected to be associated with industry practice.Therefore we have no prediction on the sign of the homogeneity of firms’ classificationchoices within an industry.
Our third information environment variable pertains to U.S. cross-listing. Bradshawet al. (2004) argue that cross-listed firms have stronger incentives to make similarreporting choices as U.S. companies. Empirically, their data show a positive correlationbetween U.S. GAAP conformity and cross-listing. Therefore we expect that cross-listedfirms will be less likely to classify items such as interest paid in financing, which is notallowed under U.S. GAAP.
We include firm size to capture financial reporting incentives, financial reportingexpertise, and the financial reporting environment of large versus small firms. We donot have a prediction for its sign. Finally, we include indicator variables for country andindustry. The regression model is as follows:
OCF Classificationi ¼ a0 þ a1 Distress Hii þ a2 Equity Issuesi þ a3 Leverage Hiiþ a4 Profitabilityi þ a5 Analysts Cash Flow Forecastiþ a6 Industry Homogeneityi þ a7 Cross‐listed in USiþ a8 Sizei þ ei;
ð1Þ
where:OCF_Classificationi is either OCF_Reportedt less OCF_Pro forma_USGAAPt or
Interest Paid in Financing;
OCF_Reportedt less OCF_Proforma_USGAAPt
= operating cash flows as reported by the firm for year tless operating cash flows for year t adjusted to includeinterest paid, interest received, and dividends receivedin operating cash flows if these items are not alreadyreported in the operating section, averaged over thesample period;
Interest Paid in Financing = one if the firm classifies interest paid in financing cashflows as of the last year reported and zero otherwise;
Distress_Hi = one if the firm’s financial distress computed usingAltman’s Z-score is less than 1.81, indicative of highdistress, and zero otherwise;
Equity Issues = percentage change in the firm’s contributed capitalover the sample period;
Leverage_Hi = one if the firm’s ratio of total liabilities over total assetsat the beginning of the fiscal year, averaged over thesample period, is greater than the median and zerootherwise;
Profitability = the firm’s net income divided by beginning totalassets, averaged over the sample period;
E. A. Gordon et al.

Analysts Cash Flow Forecast = one if at least one analyst’s cash flow forecast isavailable on IBES and zero otherwise, averaged overthe sample period;
Industry Homogeneity = the percentage of firms within an industry that reportinterest paid in financing cash flows, with industryclassifications based on Barth et al. (1998);
Cross-listed in US = one if the firm is cross-listed in the United States andzero otherwise;
Size = the natural logarithm of the firm’s beginning of yearmarket capitalization in U.S. dollars, averaged over thesample period.
Regressions include country, industry, and year controls.We create one observation per firm summarizing data available during the sample
period to compute the variables in the model. Firms with consistent classification overtime are analyzed separately from firms that changed classification.14 To examine therelation between the variables described above and the magnitude of the effect of IFRS-permitted classification choices, we estimate an OLS regression model using thedependent variable, OCF_Reportedt less OCF_Pro forma_USGAAPt. To examine therelation between the variables described above and the likelihood of an OCF-enhancingclassification choice, we estimate a logistic regression in which the dependent variableis Interest Paid in Financing.
2.2 Determinants of OCF-increasing reclassifications
Because cross-sectional variations in the classification within the statement of cashflows might result from historical legacy for each firm, the subsample of firms thatchange classification may offer a cleaner setting to examine the determinants ofclassification choice. The Appendix presents an example of one company that changedits classifications of interest paid and interest received. In 2007, Norse Energy Corp.ASA, a Norwegian gas explorer and producer, changed its classification of interest paidto financing from operating. Norse Energy also changed its classification of interestreceived from operating to investing. The net effect of these changes was that itreported positive, rather than negative, operating cash flows in both 2007 and 2008.15
The various classification changes impact reported operating cash flow differently.To examine determinants of classification choice, we therefore focus on firms thatincreased OCF by making the classification change. We compare the OCF-increasingchangers to a control group of firms that did not make a classification change andspecifically nonchanging firms with existing classification choices that have not alreadymaximized reported OCF. (OCF would be maximized by excluding interest paid fromoperating while including both interest received and dividends received in operating.)Thus we include the nonchanging firms facing a similar decision as the OCF-enhancingchangers; that is, they face the possibility of increasing reported OCF by making achange in classification.
14 We examine these classification changers separately in Section 2.2.15 Within our sample, operating cash flows for firms reporting negative operating cash flows would becomepositive from an IFRS-allowed reclassification in about 1% of firm-year observations.
Flexibility in cash-flow classification under IFRS

To examine the relation between the determinant variables described in Section 2.1above and the likelihood of OCF-increasing classification choices, we estimate a logisticregression similar to Eq. (1) with the dependent variable OCF-Increasing ClassificationChange equal to one if the firm increased OCF bymaking a classification change and zerootherwise. Our expectations on the independent variable signs are similar.
2.3 Consequences: market pricing of the persistence of cash flows
Prior research shows that the cash flow component of earnings is more persistent thanthe accrual component. Yet market pricing does not always correctly reflect thisrelatively greater persistence (Sloan 1996; Dechow et al. 2008; Pincus et al. 2007).In the context of cash flow classification, the question remains whether investorsanticipate the persistence of reported operating cash flows and accruals similarly,regardless of where cash flow items are classified. Our analysis focuses on a compar-ison of the persistence parameters for accruals and cash flow components of earningswith the parameters that are implied by stock returns—similar to the approach of Sloan(1996) and Dechow et al. (2008).
EARNINGStþ1 ¼ α0 þ α1 ACCR Reportedt þ α2 OCF Reportedt þ Controlst
þ υt ð2Þ
Returnstþ1 ¼ β�EARNINGStþ1−α#
0 −α#1 ACCR Reportedt þ α#
2 OCF Reportedt
þ ϕ Controls�þεt;
ð3Þwhere:
EARNINGSt+1 = the amount of net income for year t divided by average of totalassets for year t;
ACCR_Reportedt = the amount of accruals, calculated as net income less reportedoperating cash flows for year t divided by average of total assetsfor year t;
OCF_Reportedt = the reported amount of operating cash flow for year t divided byaverage of total assets for year t;
Controls = Sizet, BMt, and EPt. Sizet = the natural logarithm of the firm’smarket capitalization in U.S. dollars at the beginning of year t.BMt = the firm’s book-to-market ratio, calculated as the ratio of thefirm’s shareholders’ equity divided by its market capitalization atthe beginning of year t. EPt = the firm’s net income divided by itsmarket capitalization at the beginning of year t.
Returnst+1 = annual return computed 6 months after year end.
We undertake this analysis separately for the subsample of firms with classificationchoices that reflect the flexibility under IFRS (FLEX = 1) and the subsample with
E. A. Gordon et al.

classification choices similar to those under U.S. GAAP. The coefficients α1 and α2
from the forecasting Eq. (2) indicate the persistence of the two components of earnings:accruals and cash flow. Prior research has shown that the cash flow component ofearnings is more persistent than the accruals component. We examine whether therelationship α1 > α2 holds for both subsamples. An impact of differences in classifi-cation choice would be indicated by differences in comparative persistence parametersfor accruals and OCF.
A comparison is also made between the coefficients from the market pricing
equation (α#1 and α#
2 ), and from the forecasting equation (α1 and α2). Presence of
the accrual anomaly, for example, is indicated by market underweighting cash flow (α#2
< α2) and overweighting accruals (α#1 > α1). In the international context, Pincus et al.
(2007) provide evidence of the accrual anomaly only in certain countries; therefore ourfocus is not on whether we find evidence of the accrual anomaly. Rather, we examinewhether the comparative relationships between market pricing of the cash flow andaccrual components differs for the two subsamples.
2.4 Consequences: models of OCF prediction
Next, we examine models of operating cash flow prediction. These models are usedboth to develop expected cash flows (Dechow et al. 1998; Roychowdhury 2006; Kimand Park 2014) and to determine whether accounting measures predict cash flows(Barth et al. 2001; Givoly et al. 2009; Badertscher et al. 2012). We investigate whetherthe cash flow classification choices have different implications for the prediction offuture cash flows. The first model we examine uses past sales and changes in sales topredict OCF based on Dechow et al. (1998):
OCFtþ1 ¼ γ0 þ γ1 1=TAt þ γ2 St=TAt þ γ3 FLEX � St=TAt þ γ4 ΔSt=TAt
þ γ5 FLEX �ΔSt=TAt þ γ6 FLEX þ γ7 Sizet þ γ8 BMt þ γ9 EPt þ εtþ1;
ð4Þ
where:
1/TAt = one divided by the average of total assets for year t;St/TAt = sales revenue for year t divided by the average of total assets for year t;FLEX x St/TAt
= the interaction between the indicator variable FLEX and salesrevenue for year t;
ΔSt /TAt = change in sales revenue from year t-1 to year t divided by the averageof total assets for year t;
FLEX x ΔSt/TAt
= the interaction between the indicator variable FLEX and change inannual sales divided by average of total assets for year t.
Regressions include country, industry, and year controls.In this model, the variables of interest are the FLEX interactions with sales and
changes in sales, γ3 and γ5. The coefficients on these variables will be significant if thefirm’s IFRS classification choices result in different predicted future OCF than wouldU.S. GAAP classification choices. Because OCF using FLEX classification choices ishigher on average than OCF using U.S. GAAP classification choices, we expect the
Flexibility in cash-flow classification under IFRS
FLEX interaction coefficients to be positive. If the classification does not relate to thefuture OCF, the FLEX interaction coefficients will not be significant. We expect thecoefficients on sales and changes in sales to be positive and significant, consistent withprior research.
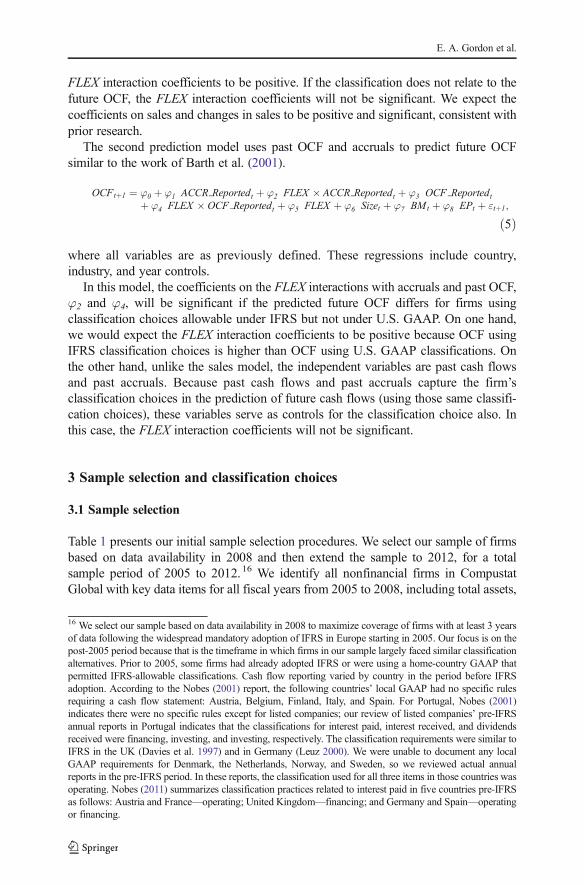
The second prediction model uses past OCF and accruals to predict future OCFsimilar to the work of Barth et al. (2001).
OCFtþ1 ¼ φ0 þ φ1 ACCR Reportedt þ φ2 FLEX � ACCR Reportedt þ φ3 OCF Reportedtþ φ4 FLEX � OCF Reportedt þ φ5 FLEX þ φ6 Sizet þ φ7 BMt þ φ8 EPt þ εtþ1;
ð5Þ
where all variables are as previously defined. These regressions include country,industry, and year controls.
In this model, the coefficients on the FLEX interactions with accruals and past OCF,φ2 and φ4, will be significant if the predicted future OCF differs for firms usingclassification choices allowable under IFRS but not under U.S. GAAP. On one hand,we would expect the FLEX interaction coefficients to be positive because OCF usingIFRS classification choices is higher than OCF using U.S. GAAP classifications. Onthe other hand, unlike the sales model, the independent variables are past cash flowsand past accruals. Because past cash flows and past accruals capture the firm’sclassification choices in the prediction of future cash flows (using those same classifi-cation choices), these variables serve as controls for the classification choice also. Inthis case, the FLEX interaction coefficients will not be significant.
3 Sample selection and classification choices
3.1 Sample selection
Table 1 presents our initial sample selection procedures. We select our sample of firmsbased on data availability in 2008 and then extend the sample to 2012, for a totalsample period of 2005 to 2012.16 We identify all nonfinancial firms in CompustatGlobal with key data items for all fiscal years from 2005 to 2008, including total assets,
16 We select our sample based on data availability in 2008 to maximize coverage of firms with at least 3 yearsof data following the widespread mandatory adoption of IFRS in Europe starting in 2005. Our focus is on thepost-2005 period because that is the timeframe in which firms in our sample largely faced similar classificationalternatives. Prior to 2005, some firms had already adopted IFRS or were using a home-country GAAP thatpermitted IFRS-allowable classifications. Cash flow reporting varied by country in the period before IFRSadoption. According to the Nobes (2001) report, the following countries’ local GAAP had no specific rulesrequiring a cash flow statement: Austria, Belgium, Finland, Italy, and Spain. For Portugal, Nobes (2001)indicates there were no specific rules except for listed companies; our review of listed companies’ pre-IFRSannual reports in Portugal indicates that the classifications for interest paid, interest received, and dividendsreceived were financing, investing, and investing, respectively. The classification requirements were similar toIFRS in the UK (Davies et al. 1997) and in Germany (Leuz 2000). We were unable to document any localGAAP requirements for Denmark, the Netherlands, Norway, and Sweden, so we reviewed actual annualreports in the pre-IFRS period. In these reports, the classification used for all three items in those countries wasoperating. Nobes (2011) summarizes classification practices related to interest paid in five countries pre-IFRSas follows: Austria and France—operating; United Kingdom—financing; and Germany and Spain—operatingor financing.
E. A. Gordon et al.

OCF, and market values. We exclude financial firms because prior research shows thatthe informativeness of these firms’ cash flow statements differs from those of nonfi-nancial firms (Beatty et al. 2016). This selection procedure yields 2815 available firms.
Because databases do not accurately report cash flow classification, we hand collectthe detailed cash flow items from the financial statements. For those countries with 100available firms or less, we select 100% of the firms. For those countries with over 100available firms, we select the greater of 100 firms or 30% of the firms with availabledata. Because of the large number of firms in the United Kingdom, we selected 15% (or146) of total potential firms to collect the cash flow data. When sampling from theavailable population of firms within a country, we use stratified sampling, first rankingwithin country by industry and size (total assets) and then selecting firms. Thisselection procedure results in a potential sample of 1204 firms. Our final sample isreduced to 798 firms primarily because of non-accessible financial statements. Thefinancial statements are either missing in Mergent Online (94% of cases) or written inlanguages other than English, German, or Danish. For the 798 sample firms, we collectall available data for the period from 2005 to 2012.
Table 1 Sample selection
Country AvailableFirmsa
NumberSelectedb
Inaccessible FinancialStatementsc
Number ofSample Firms
Number ofSample Obs.d
Austria 52 52 21 31 235
Belgium 67 67 20 47 373
Denmark 67 67 31 36 276
Finland 102 102 59 43 341
France 406 122 16 105 811
Germany 419 127 26 109 742
Italy 206 100 55 45 352
Netherlands 103 103 37 66 485
Norway 103 103 60 43 328
Portugal 38 38 18 20 160
Spain 78 78 20 58 445
Sweden 201 100 33 67 519
United Kingdom 973 146 18 128 979
Total 2,815 1,204 413 798 6,046
a Available firms are initially identified as the nonfinancial firms in Compustat Global that report under IFRS,are based in Europe, and have key financial data (total assets, operating cash flow, and market value) for fiscalyears 2005 to 2008b For those countries with 100 firms or less, we select 100% of the firms. For those countries with over 100firms, we select the greater of 100 firms or 30% of the firms with available data. Because of the large numberof firms in the United Kingdom, we select 15% of the firms, or 146, using stratified samplingc Firms with inaccessible financial reports consist primarily (94%) of firms whose annual reports are missingfrom Mergent Online Database and a smaller number of firms where the annual reports were unavailable inEnglish, German, or Danishd For the 798 firms in the resulting sample, we collect all available data for the period 2005 to 2012
Flexibility in cash-flow classification under IFRS

Table 2 presents a description of the size and profitability of the 798 firms in the finalsample and a comparison with other firms in the country that were excluded because ofinaccessible financial statements. As expected, the 798 firms in the final sample aregenerally larger (and, on average, more profitable) than the firms that were excluded.
In our data collection, we encountered an unexpected absence of interest paid,consistent with a possible noncompliance issue with regard to disclosure of interestpaid. 17 For 1347 observations, we could not locate interest paid or where it wasclassified on the statement of cash flows after searching the statement of cash flowsand the financial statement footnotes. 18 These firms may not have paid interest orinterest paid may have been immaterial. However, we confirm that 1305 (1325)observations had interest expense (long-term debt) in Compustat Global and thus likelypaid interest. Based on our review of disclosures by other firms, we determine that, ifthe interest paid had been in the investing or financing sections, it would likely haveappeared as a separate line in the section in the statement of cash flows.19 Therefore wecategorize these observations as reporting interest paid in operating for our analyses.This classification tends to understate the difference between IFRS and U.S. GAAP.
3.2 Description of classification choices
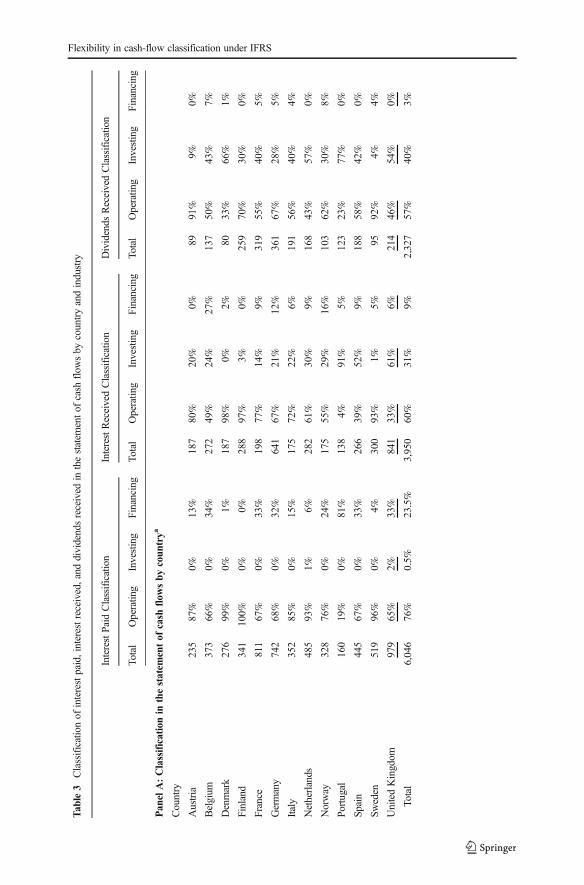
Table 3 describes the classification choices for interest paid, interest received, anddividends received—by country and industry.20 The number of observations differs ineach panel because not all firms report each item.21
The choice of where to classify interest paid in the statement of cash flows varies bycountry (Table 3, panel A). Overall, about 76% of the sample firms classify interestpaid in operating and 23.5% in financing. In our sample, all firms in Finland classifyinterest paid in the operating section. Over 95% of all Danish and Swedish firms chooseto classify interest paid in operating. In Portugal, however, about 81% of our samplefirms classify interest paid in financing. About 65% of the observations in Belgium,
17 IAS 7, Statement of Cash Flows, requires separate disclosures of cash flows from interest and dividendsreceived and interest paid, see paragraph 31 (IASB 1994).18 For each country, the percentage of nondisclosure of interest paid is as follows: Austria, 19%; Belgium,27%; Denmark, 37%; Finland, 12%; France, 27%; Germany, 8%; Italy, 23%; Netherlands, 29%; Norway,27%; Portugal, 14%; Spain, 29%; Sweden, 42%; and the United Kingdom, 11%.19 A noncompliance issue is also possible with regard to interest received and dividends received. However, wecannot check these against other financial statements items as easily because Compustat Global has incomplete data.20 U.S. GAAP also requires that taxes paid be classified as operating and dividends paid as financing. WhileIFRS allows discretion in these classifications, data on taxes paid and dividends paid for a substantial subsampleof our firms indicate that over 99% of firms classified these items consistent with U.S. GAAP. Given thehomogeneity of classification choice, we exclude income taxes paid and dividends paid from our analyses.21 IAS 7, Statement of Cash Flows, requires cash flows from interest and dividends received and paid to beclassified as either operating, investing or financing activities (IAS 7, paragraph 31). Furthermore, IAS 7,paragraph 33, states: BInterest paid and interest and dividends received are usually classified as operating cashflows for a financial institution. However, there is no consensus on the classification of these cash flows forother entities. Interest paid and interest and dividends received may be classified as operating cash flowsbecause they enter into the determination of profit or loss. Alternatively, interest paid and interest anddividends received may be classified as financing cash flows and investing cash flows respectively, becausethey are costs of obtaining financial resources or returns on investments.^ However, as shown in Table 3, wefind cases where companies do not follow this guidance.
E. A. Gordon et al.

Tab
le2
Sampledescriptionby
countryandcomparisonwith
otherfirm
sin
thecountry
Country
PanelA:To
talassetsin
U.S.d
ollars(m
illions)a
PanelB:Netincomedividedby
totalassets
a
SampleCollected
Other
Firm
sSampleCollected
Other
Firm
s
Num
ber
offirm
sMean
Median
Num
ber
offirm
sMean
Median
Num
ber
offirm
sMean
Median
Num
ber
offirm
sMean
Median
Austria
313,044
559
211,139
341
310.0123
0.0243
210.0087
0.0232
Belgium
475,558
674
201,175
198***
470.0306
0.0320
200.0247
0.0129*
Denmark
363,832
593
31285*
103***
36−0
.0592
0.0485
310.0489
0.0063***
Finland
433,979
1,609
59794**
108***
430.0432
0.0388
590.0168
0.0395
France
105
16,620
5,186
301
2,476***
129***
105
0.0285
0.0389
301
−0.0096**
0.0247***
Germany
109
21,981
2,535
310
999***
105***
109
0.0380
0.0368
310
−0.0419***
0.0235*
Italy
4514,020
5,756
161
2,237**
362***
450.0315
0.0303
161
−0.0302*
0.0099***
Netherlands
667,410
1,185
372,114**
205***
660.0121
0.0377
37−0
.0195
0.0382
Norway
434,441
635
60515***
102
430.0134
0.0308
60−0
.1419*
−0.0205***
Portugal
205,595
1,766
181,128*
271
20−0
.0145
0.0110
18−0
.0592
0.0013
Spain
5813,813
2,555
204,419*
943**
580.0318
0.0335
200.0031
0.0146
Sweden
674,187
913
134
278***
49***
670.0373
0.0461
134
−0.0582***
0.0261**
UnitedKingdom
128
4,820
919
845
2,279*
59***
128
0.0175
0.0376
845
−0.1989***
0.0049***
Total
798
9,748
1,665
2,017
1,810***
96***
798
0.0220
0.0368
2,017
−0.1032***
0.0149***
aFiscal2008
amountsareused
tocompare
netincomeandtotalassetsforsamplefirm
sto
otherfirm
s
*,**,*
**denotestatisticalsignificance
ofdifference
betweensamplefirm
sandnonselectedfirm
s
*p<0.10,*
*p<0.05,*
**p<0.01
Flexibility in cash-flow classification under IFRS

France, Germany, Spain, and the United Kingdom classify interest paid in operating.About 0.5% of the sample classifies interest paid as an investing cash flow, inconsistentwith guidance in IAS 7, Statement of Cash Flows, paragraph 33 (IASB 1994).
Classification of interest received also varies as shown in Table 3, panel A. About60, 31, and 9% classify interest received in operating, investing, and financing,respectively. Similar to the reporting of interest paid, a very high proportion of thesample firms in Denmark, Finland, and Sweden classify interest received in operating.Portugal, the United Kingdom, and Spain have the highest percentage of firms classi-fying interest received in investing, at 91, 61, and 52%, respectively. About 9% of thesample firms classify interest received as a financing cash flow, inconsistent withguidance in IAS 7, Statement of Cash Flows, paragraph 33 (IASB 1994).
Dividends received are primarily classified in operating and investing, at 57 and40%, respectively, as shown in Table 3, panel A. Over 90% of observations fromAustria and Sweden classify dividends received as operating. In contrast, only 23% ofthe Portuguese firms in our sample classify dividends received as operating, with theremaining 77% classify them as investing. About 3% of the sample classifies dividendsreceived as a financing cash flow, inconsistent with guidance in IAS 7, Statement ofCash Flows, paragraph 33.
Panel B of Table 3 shows cash flow classifications by industry.22 Classificationchoices for interest paid shows less variation across industries than across countries.Across all industries, at least two-thirds of firms classify interest paid as operating. Thepercentage of the sample classifying interest paid in financing ranges from 13% fordurable goods manufacturers to 33% for both chemicals and services and 34% in other.
For interest received, 71% of durable goods manufacturers and 70% of firms intextiles, printing, and publishing classify interest received in operating. Firms in theremaining industries are less likely to classify interest received in operating, with thelowest frequency for chemicals at 36%. Finally, for dividends received, 81% of firms inthe extractive industries report dividends received in operating, followed by durablegoods manufacturers, with 70% classifying dividends received in operating.
Table 4 presents information on common classification-choice combinations for the1925 firm-year observations that clearly disclose classification choices for all three items.The most common classification-choice combination, selected by 42%, is classifying allitems in OCF. The second most common combination is classifying interest paid infinancing and both dividends received and interest received in investing. Table 4, panelB, reports classifications by section pairs. The diagonals of the section-pair classificationsindicate similarities of classification choices, by item. For example, of the 1310 obser-vations that classify interest paid as operating, 83% (1093/1310) also classify interestreceived as operating. Interest paid and interest received are classified differently by 35%(671/1925) of observations, implying that net interest is not automatically a determinantof OCF reported under IFRS. For interest received and dividends received, 32% (624/1925) of observations classify these two items in the different sections.
The financial statement effects of cash flow classification choices are reflected in acomparison of reported OCF and pro-forma U.S. GAAP OCF. Specifically, we testwhether the operating, investing, and financing cash flows as reported would differ
22 We follow the industry definitions of Barth et al. (1998).
E. A. Gordon et al.
Tab
le3
Classificationof
interestpaid,interestreceived,and
dividendsreceived
inthestatem
entof
cash
flow
sby
countryandindustry
InterestPaid
Classification
InterestReceivedClassification
Dividends
ReceivedClassification
Total
Operatin
gInvesting
Financing
Total
Operatin
gInvesting
Financing
Total
Operatin
gInvesting
Financing
Pan
elA:Classificationin
thestatem
entof
cash
flow
sby
coun
trya
Country
Austria
235
87%
0%13%
187
80%
20%
0%89
91%
9%0%
Belgium
373
66%
0%34%
272
49%
24%
27%
137
50%
43%
7%
Denmark
276
99%
0%1%
187
98%
0%2%
8033%
66%
1%
Finland
341
100%
0%0%
288
97%
3%0%
259
70%
30%
0%
France
811
67%
0%33%
198
77%
14%
9%319
55%
40%
5%
Germany
742
68%
0%32%
641
67%
21%
12%
361
67%
28%
5%
Italy
352
85%
0%15%
175
72%
22%
6%191
56%
40%
4%
Netherlands
485
93%
1%6%
282
61%
30%
9%168
43%
57%
0%
Norway
328
76%
0%24%
175
55%
29%
16%
103
62%
30%
8%
Portugal
160
19%
0%81%
138
4%91%
5%123
23%
77%
0%
Spain
445
67%
0%33%
266
39%
52%
9%188
58%
42%
0%
Sweden
519
96%
0%4%
300
93%
1%5%
9592%
4%4%
UnitedKingdom
979
65%
2%33%
841
33%
61%
6%214
46%
54%
0%
Total
6,046
76%
0.5%
23.5%
3,950
60%
31%
9%2,327
57%
40%
3%
Flexibility in cash-flow classification under IFRS

Tab
le3
(contin
ued)
InterestPaid
Classification
InterestReceivedClassification
Dividends
ReceivedClassification
Total
Operating
Investing
Financing
Total
Operating
Investing
Financing
Total
Operatin
gInvesting
Financing
Pan
elB:Interestpa
idclassification
inthestatem
entof
cash
flow
sby
indu
stry
a
Industry
Miningandconstructio
n373
76%
1%23%
270
56%
39%
5%184
58%
42%
0%
Food
328
80%
1%19%
192
63%
31%
6%147
68%
32%
0%
Textiles,printin
g,andpublishing
494
81%
0%19%
341
70%
24%
6%211
55%
42%
3%
Chemicals
214
67%
0%33%
151
36%
39%
25%
112
65%
30%
5%
Pharmaceuticals
221
84%
0%16%
141
63%
19%
18%
4344%
56%
0%
Extractiveindustries
279
70%
1%29%
194
63%
28%
9%92
81%
12%
7%
Durablemanufacturers
724
87%
0%13%
445
71%
21%
8%214
70%
25%
5%
Com
puters
591
72%
0%28%
329
56%
43%
1%118
51%
38%
11%
Transportation
637
73%
0%27%
440
63%
33%
4%349
48%
48%
4%
Utilities
204
71%
0%29%
120
62%
36%
2%110
38%
62%
0%
Retail
510
76%
0%24%
326
54%
36%
10%
171
64%
36%
0%
Services
529
66%
1%33%
370
48%
42%
10%
154
44%
52%
4%
Other
942
76%
0%34%
631
64%
24%
12%
422
60%
39%
1%
Total
6,046
76%
0.5%
23.5%
3,950
60%
31%
9%2,327
57%
40%
3%
aThe
numberof
observations
foreach
classificatio
nchoice
reflectsthenumberof
firm
sdisclosing
amountsfortheitem
E. A. Gordon et al.

Table 4 Classification of interest paid, interest received, and dividends received in the statement of cashflows, by combination
Panel A: Classification for all items by section combinationsa
Interest Paid Interest Received Dividends Received Obs. Percent
Operating Operating Operating 804 42%
Financing Investing Investing 265 14%
Operating Operating Investing 262 14%
Operating Investing Investing 153 8%
Financing Investing Operating 86 5%
Financing Financing Operating 77 4%
Operating Investing Operating 62 3%
Financing Operating Operating 60 3%
Financing Financing Investing 52 3%
Financing Operating Investing 40 2%
Operating Operating Financing 27 1%
Other Combinations 37 2%
Total 1,925 100%
Panel B: Classification by section pairsa
Interest Paid
Operating Investing Financing Total
Operating 1,093 0 103 1,196
Interest Received Investing 213 18 351 582
Financing 4 0 143 147
1,310 18 597 1,925
Operating 868 11 225 1,104
Dividends Received Investing 415 7 357 779
Financing 27 0 15 42
1,310 18 597 1,925
Interest Received
Operating Investing Financing Total
Operating 862 157 81 1,104
Dividends Received Investing 306 425 52 779
Financing 28 0 14 42
1,196 582 147 1,925
a Includes only those observations where the firm discloses the classification choice for each of the three items
Flexibility in cash-flow classification under IFRS

significantly from cash flows under U.S. GAAP classifications. We adjust as-reportedOCF to include interest paid, interest received, and dividends received. Similarly, weadjust as-reported investing and financing cash flows to exclude these items.23 Table 5reports descriptive statistics of the as-reported cash flows and the pro forma U.S.GAAP cash flows.24 The mean (median) of reported OCF is about 2.4% (3.5%) higherthan it would have been under U.S. GAAP,25 while financing cash flows are lower.Reported investing cash flow is also higher than it would have been under U.S. GAAP,reflective of instances in which interest received, dividends, or both received are reportedas investing inflows (which is not allowed under U.S. GAAP). Means and medians ofOCF, investing cash flows, and financing cash flows in the pooled sample differ signif-icantly between as-reported amounts and pro forma U.S. GAAP amounts. Means of thepair-wise differences are significantly different for all cash flow components.
4 Results of determinants tests
4.1 OCF classification choices
Table 6, panel A, reports descriptive statistics for variables in the determinants analysis.26 The number of firms is reduced from 798 to 538 because the following are excluded:firms that changed their classification choice during the period; firms from Denmark,Finland, and Sweden (where classification choices for interest paid and interest re-ceived exhibit little or no variation); and firms missing data to compute all independentvariables.
Results of the regression using differences in OCF as the dependent variableare presented in the left columns of Table 6, panel B. A higher value of thedifferences in OCF variable, OCF_Reported less OCF_Pro forma_USGAAP,signifies a greater OCF-enhancing impact of classification choices that differfrom the hypothetical benchmark. As expected, we find that Distress_Hi (anindicator variable signifying greater likelihood of financial distress) is positivelyand significantly related to OCF_Reported less OCF_Pro forma_USGAAP. Thisfinding suggests that financially distressed firms make more OCF-increasingclassification choices. Equity Issues is also positive and significant, suggestingthat firms that access equity markets more frequently opt to make classificationchoices to report higher OCF. Leverage_Hi is also significantly positive, indi-cating that firms with greater leverage are more likely to make classificationchoices to show higher OCF. Profitability is significantly negative indicatingthat less profitable firms are more likely to make OCF-enhancing classification
23 If values are missing for any cash flow variables, we set them equal to zero in our computations.24 Variables in Table 5 are winsorized at the top and bottom percentile.25 Percentage differences are computed as (OCF_Reportedt / OCF_Pro forma_USGAAPt) -1. Untabulatedanalysis indicates that more than 80% of the observations with differences between as-reported and pro formaamounts reported OCF higher than it would have been under U.S. GAAP.26 The mean of OCF_Reported less OCF_Pro forma_USGAAP in Table 5 and the percentage reportinginterest paid in financing in Table 3, panel A, are slightly different than those reported here because Table 6summarizes observations by firm rather than firm-year.
E. A. Gordon et al.

choices. In terms of economic significance, our results indicate that one stan-dard deviation in the variables Equity Issues and Profitability corresponds to achange in the dependent var iable (OCF_Reported_less OCF_Proforma_USGAAP) of $10.0 million and $7.9 million, respectively (correspondingto approximately 0.1% of average assets). Similarly, one standard deviation inthe dichotomous variables Distress_Hi and Leverage High corresponds to achange in OCF_Reported_less OCF_Pro forma_USGAAP of $11.3 million and$8.3 million, respectively.
Finally, size is negative and significant. Neither Analysts Cash Flow Forecast,Industry Homogeneity, Cross-listed in US nor any of the industry indicator variables(not tabulated) are significant. Country indicator variables are all negative and signif-icant with p-values below 0.01.27
The right columns of Table 6, panel B, present the results of estimating the logisticregression, where the classification choice to report interest paid in financing is thedependent variable. Similar to the results of the OLS regression, Leverage_Hi ispositively and significantly associated with the choice to classify interest paid infinancing. This result implies that highly leveraged firms are 44.2% more likely tomake an OCF-increasing classification choice of interest paid as financing. In addition,27 For country (industry) fixed effects, our baseline in the intercept is Portugal (other industries). We performdiagnostic tests and find no evidence of multicollinearity. Condition indices are less than 3 for main variables.
Table 5 Comparison of reported to pro forma U.S. GAAP operating, investing, and financing cash flows
Number of firm-year observations 6046 Mean Std.Dev. Median
OCF_Reportedt 0.0882 0.0631 0.0824
INV_Reportedt −0.0666 0.0635 −0.0532FIN_Reportedt −0.0282 0.0725 −0.0215OCF_Pro forma_USGAAPt 0.0861 0.0639 0.0796
INV_Pro forma_USGAAPt −0.0679 0.0638 −0.0541FIN_Pro forma_USGAAPt −0.0157 0.0766 −0.0191OCF_Reportedt - OCF_Pro forma_USGAAPt 0.0022*** 0.0059 0**
INV_Reportedt - INV_Pro forma_USGAAPt 0.0007*** 0.0017 0*
FIN_Reportedt - FIN_Pro forma_USGAAPt −0.0028*** 0.0062 0***
* p < 0.10, ** p < 0.05, *** p < 0.01
Variable Definitions:
OCF_Reportedt = operating cash flows as reported by the firm for year t
OCF_Pro forma_USGAAPt = operating cash flows for year t adjusted to include interest paid, interestreceived, and dividends received in operating cash flows if these items are not already reported in theoperating section
INV_Reportedt = investing cash flows as reported by the firm for year t
INV_Pro forma_USGAAPt = investing cash flows for year t adjusted to exclude interest paid, interestreceived, and dividends received
FIN_Reportedt = financing cash flows as reported by the firm for year t
FIN_Pro forma_USGAAPt = financing cash flows for year t adjusted to exclude interest paid, interestreceived, and dividends received
All firm subscripts are omitted. All variables are scaled by the firm’s total assets
Flexibility in cash-flow classification under IFRS

Table 6 Descriptive statistics and regressions of the difference in operating cash flows and interest paid infinancing on incentives and reporting environment
Panel A: Descriptive statisticsa
Variable Mean Std. Dev. Median
Number of firms n = 538
OCF_Reportedt less
OCF_Pro forma_USGAAPt −0.0007 0.0502 0.0003
Interest Paid Reported in Financing 0.2379 0.4262 0.0000
Distress_Hi 0.4329 0.4149 0.3750
Equity Issues 0.1142 0.2099 0.0408
Leverage_Hi 0.5260 0.4998 1
Profitability 0.0394 0.0466 0.0358
Analysts Cash Flow Forecast 0.4830 0.3478 0.5714
Industry Homogeneity 0.7005 0.0700 0.7185
Cross-listed in U.S. 0.0576 0.2332 0
Size 6.5950 1.9596 6.3279
Panel B: Regressions
OCFClassificationi ¼ a0 þ a1 DistressHii þ a2 Equity Issuesi þ a3 LeverageHi þ a4 Profitabilityiþ a5 Analysts Cash Flow Forecasti þ a6 Industry Homogeneityiþ a7 Cross−listed in USi þ a8 Sizei þ ei
Dependent Variable OCF_Reportedt less
OCF_Pro forma_USGAAPt
Interest Paid in Financing
Number of firms n = 538 Expected Sign Estimate Std. Error p-value Estimate Std. Error p-value
Intercept −0.4024 0.5978 0.5011 −122.0000 212.4000 0.5656
Distress_Hi + 0.0028 0.0013 0.0156** 0.1535 0.3599 0.3349
Equity Issues + 0.0049 0.0026 0.0297** 0.7526 0.7817 0.1678
Leverage_Hi + 0.0017 0.0009 0.0245** 0.3661 0.2534 0.0743*
Profitability ? −0.0173 0.0104 0.0478** −0.6005 3.0771 0.8453
Analysts Cash Flow Forecast ? 0.0015 0.0013 0.1297 −0.1532 0.3710 0.6797
Industry Homogeneity ? 0.0058 0.0083 0.2416 1.7099 2.9559 0.5630
Cross-listed in US − 0.0005 0.0018 0.7746 −0.8163 0.5666 0.0748*
Size ? −0.0007 0.0003 0.0258** 0.0723 0.0907 0.4254
F-value 4.19 Goodness of Fit Chi-Square p-value
(p-value) <0.0001 Likelihood
Adjusted R2 0.1475 Ratio 71.5 0.0001
Wald 51.1 0.0069
a Sample excludes 99 firms that changed their classification choices during the period (2005 to 2012), firmsfrom three countries with little variation in the classification of interest paid (Denmark, Finland, and Sweden),and firms missing data to compute all variables in regression
* p < 0.10, ** p < 0.05, *** p < 0.01. p-values are one-tailed for variables with directional hypotheses andtwo-tailed for all others. Standard errors are clustered by firm. Country controls and industry controls areincluded
Variable Definitions:
OCF_Reportedt less OCF_Pro forma_USGAAPt = the average by firm of operating cash flows as reported bythe firm for year t less operating cash flows for year t adjusted to include interest paid, interest received, anddividends received in operating cash flows if these items are not already reported in the operating section
E. A. Gordon et al.

Cross-listed in US is negative and significant, indicating that firms with cross-listingsare more likely to follow the classification choices permitted for US firms. Specifically,US cross-listed firms in our sample classify interest paid under financing activities with55.8% lower likelihood than non-US cross-listed firms.28
Neither Distress_Hi, Equity Issues, Profitability, Analysts Cash Flow Forecast,Industry Homogeneity, Size nor any of the industry indicator variables (not tabulated)are statistically significant. Country indicator variables are all negative and significantwith p-values lower than 0.01. The finding that country predicts classification choicewhile industry does not could reflect firms’ view of their relevant peer group. Despitepolitical and accounting-standard union, country membership dominates as a predictorof accounting choice within allowable alternatives.
4.2 Changes in OCF classification choices
In our sample, 99 firms, or 12%, reclassify interest paid, interest received, ordividends received within the statement of cash flows during the sample period.Table 7, panel A, shows that the 99 changers represent all countries except Portugal.The most changers were in the United Kingdom (24) and Germany (17), and thehighest percentages of firms making a change (26%) were in Norway (11 of 43firms) and Spain (15 of 58 firms). The majority of firms (58%) increase OCF in theyear of the change, increasing OCF by 1.20% (0.78%) at the mean (median).Companies in all industries, except chemicals, made changes, with the greatestnumber in services (14) (not tabulated). Among the reclassifications affecting OCF,the greatest number move interest paid out of OCF. As shown in Table 7, panel B,the majority of these firms (49) changed OCF through reclassifying interest out ofOCF.
28 The estimated 44.2% increase and 55.8% decrease arise from e0.3661 = 1.442 and e-0.8163 = 0.442 in theprobit regression in Panel B of Table 6, respectively.
Interest Paid in Financing = one if the firm classifies interest paid in financing cash flows as of the last yearreported and zero otherwise
Distress_Hi = one if the firm’s financial distress computed using Altman’s Z-score is less than 1.81, indicativeof high distress and zero otherwise
Equity Issues = percentage change in the firm’s contributed capital over the sample period
Leverage_Hi = one if the firm’s ratio of total liabilities over total assets at the beginning of the fiscal year,averaged over the sample period, is greater than the median and zero otherwise
Profitability = the firm’s net income divided by beginning total assets, averaged over the sample period
Analysts Cash Flow Forecast = one if at least one analyst’s cash flow forecast for the period is available onIBES and zero otherwise, averaged over the sample period
Industry Homogeneity = the percentage of firms within an industry that report interest paid in financing cashflows, with industry classifications based on Barth et al. (1998)
Cross-listed in US = one if the firm is cross-listed in the United States and zero otherwise
Size = the natural logarithm of the firm’s beginning of year market capitalization in U.S. dollars, averaged overthe sample period
Flexibility in cash-flow classification under IFRS

The various classification changes impact reported operating cash flow differently. Toexamine determinants of classification choice, we therefore focus only on the 57 firms thatincreased OCF by making the classification change. We compare the OCF-increasingchangers to a control group of firms that did not make an OCF-increasing classificationchange and specifically nonchanging firms with existing classification choices that have notalready maximized reported OCF. (OCF would be maximized by excluding interest paidfrom operating while including both interest received and dividends received in operating.)Thus we include the nonchanging firms facing a similar decision as the OCF-enhancingchangers; that is, they face the possibility of increasing reported OCF bymaking a change inclassification. This restriction left 109 firms, all of which are included as a control sample.
In the left side of Table 8, panel A, we compare the 57 OCF-increasingchanger sample to itself over time—before and after the reclassification for
Table 7 Description of firms changing classification of interest paid, interest received, or dividends receivedin the statement of cash flows
Panel A: Reclassifications by country, change in OCF, and percentage difference in operating cash flowsin year of change
Change in OCF Results in: OCF-Increasing No Change OCF-Reducing Total firms
Austria 2 0 1 3
Belgium 7 0 0 7
Denmark 0 0 1 1
Finland 0 1 0 1
France 7 0 2 9
Germany 11 4 2 17
Italy 3 0 0 3
Netherlands 4 0 2 6
Norway 8 1 2 11
Spain 5 5 5 15
Sweden 2 0 0 2
United Kingdom 8 8 8 24
Total 57 (58%) 19 (19%) 23 (23%) 99
Percentage difference in operating cash flows in year of change
Mean 0.0120 0 −0.0042 0.0060
Median 0.0078 0 −0.0021 0.0015
Panel B: Classification before and after change, by change in operating cash flow
Interest Paid Interest Received Dividend Received
Firms Percent Firms Percent Firms Percent
Into Operating 7 7% 16 16% 4 4%
Out of Operating 49 49% 27 37% 5 5%
No Change in Operating 43 43% 56 57% 90 91%
99 100% 99 100% 99 100%
*, **, *** denote statistical significance of difference between firms that do not change classification and firmsthat change classification (Bchanger^)
* p < 0.10, ** p < 0.05, *** p < 0.01
E. A. Gordon et al.

Table 8 Analyses of OCF-enhancing classification change on incentives and reporting environment
Panel A: Comparison of OCF-increasing firms (before and after change) with control sample
OCF-increasing Changer (n = 57 firms)
Pre-Change Post-Changea Control (n = 109 firms)b
Variable Mean Median Mean Median Mean Median
OCF_Reportedt less
OCF_Pro forma_USGAAPt* 0.0008 0.0001 0.0118*** 0.0081*** −0.0115 −0.0013***
Interest Paid Reported inFinancing
0.0414 0 0.7716*** 1*** 0* 0**
Distress_Hi 0.4438 0.3333 0.4708 0.2857 0.3562 0.1250
Equity Issues 0.2500 0.1380 0.1236*** 0.0734* 0.1673* 0.0926
Leverage_Hi 0.5263 1 0.5790 1 0.4954 0
Profitability 0.0587 0.0447 0.0316* 0.0405* 0.0457 0.0447
Analysts Cash FlowForecast
0.2357 0 0.5937*** 0.6667*** 0.4791*** 0.6000***
Industry Homogeneity 0.6901 0.6976 0.6901 0.6976 0.6975 0.7185
Cross-listed in US 0.0175 0 0.0175 0 0.0275 0*
Size 6.9109 6.6955 6.9597 6.6955 6.6029 zz6.123
Panel B: Dependent variable: OCF-increasing classification change
OCF‐increasing ClassificationChangei ¼ a0 þ a1 DistressHii þ a2 Equity Issuesi þ a3 LeverageHii
þ a4 Profitabilityi þ a5 Analysts Cash Flow Forecastiþ a6 Industry Homogeneityi þ a7 Cross‐listed in USi þ a8 Sizei þ ei
ExpectedSign
Estimate Std. Error p-value
(n = 166 firms)c
Intercept 10.3129 7.1011 0.1464
Distress_Hi + 0.7159 0.6742 0.1442
Equity Issues + 1.3219 0.9750 0.0876*
Leverage_Hi + −0.2031 0.4951 0.3408
Profitability ? 5.4415 3.4679 0.1166
Analysts Cash FlowForecast
? −3.1941 0.8008 <.0001***
Industry Homogeneity ? −0.1657 0.0961 0.0847*
Cross-listed in US − −2.7321 1.8925 0.0744*
Size ? 0.1707 0.1985 0.3900
Goodness of Fit Chi-Square p-valueLikelihood Ratio 68.0 0.0001
Wald 31.7 0.3319
a Compares statistical significance of means and medians of pre-change and post-change variablesb Compares statistical significance of means and medians of pre-change and control samplesc Consists of 57 firms that made an OCF-increasing change and 109 firms that are not currently maximizingreported OCF but did not make a classification change
* p < 0.10, ** p < 0.05, *** p < 0.01. p-values are one-tailed for variables with directional hypotheses andtwo-tailed for all others. Standard errors are clustered by firm. Country controls and industry controls areincluded
Variable Definitions: OCF-increasing classification change = one if a firm made an OCF-increasing classi-fication firm and zero otherwise. See Table 6 for the remaining variable definitions
Flexibility in cash-flow classification under IFRS

variables similar to those in the cross-sectional regression. For variables createdas averages over the sample period, averages are based on the periods before andafter the reclassification. The significantly positive differences in the means andmedians of the difference in OCF (reported minus pro forma) and interest paidreported in financing are a function of the criteria for inclusion as an OCF-increasing changer. In addition, we find that equity issues and analysts’ forecastcoverage are higher in the period after the change. The mean and medianprofitability of changers is significantly lower after the change.
On the right side of Table 8, panel A, we compare the 57 OCF-increasingchangers to the control sample. We find significant differences in the means,medians or both of the difference in OCF (reported minus pro forma), interestpaid reported in financing, equity issues, analysts’ forecast coverage, cross-listed in the US, and industry.
Table 8, panel B, presents results of a logistic regression with the dependentvariable OCF-Increasing Classification Change equal to one if the firm in-creased OCF by making a classification change and zero otherwise. Resultsindicate that firms with greater equity issuance are more likely to make OCF-increasing choices. Any valuation enhancement related to higher reported OCFwould increase equity issuance proceeds, but the relation is not direct, partic-ularly as equity issuance is measured historically. We find that analyst forecastcoverage is negatively associated with changing, consistent with analysts’ cashflow forecasts serving some deterrent role. Similarly, those firms that havegreater industry homogeneity and are cross-listed in the US are less likely tomake an OCF-increasing classification change. These firms appear to beresponding to external forces to maintain current OCF reporting choices.
4.3 Additional analyses and variables
Data on auditors indicate that 88% of our full sample of 798 firms are audited by aBig Four auditor (Deloitte, Ernst & Young, KPMG, or PricewaterhouseCoopers).To consider the possibility that classification choice is driven by the auditor, were-estimate our regressions including an indicator variable for each of theseauditors. Results show that none of the indicator variables are significant (nottabulated). Thus we do not find evidence that classification choice is associatedwith auditor choice.
We also examine the effect of including the following other variables, but none aresignificant: credit risk, average market-to-book ratio, average returns, an indicatorvariable for earnings that are just positive, variability of OCF (computed as the standarddeviation of the firm’s OCF over the sample period), and capital intensity, whichcaptures structure of operations and potential financing needs.
When we include only observations with interest paid located on the face of or in thefootnotes to the financial statements (about 70% of the sample), regression resultsresemble the overall reported results.
We also reviewed the classification choices of a larger set of cross-listed firms todetermine whether the results on the cross-listing variable are generalizable to a broaderset of cross-listing firms. We collected data on 83 European Union cross-listed firms in2006 (including some of the 40 cross-listed firms in our sample), and we find the
E. A. Gordon et al.
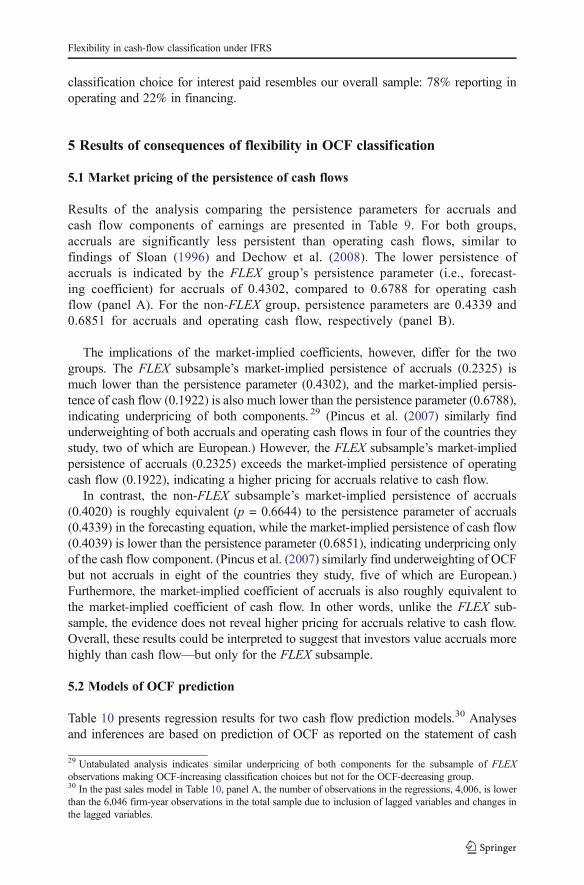
classification choice for interest paid resembles our overall sample: 78% reporting inoperating and 22% in financing.
5 Results of consequences of flexibility in OCF classification
5.1 Market pricing of the persistence of cash flows
Results of the analysis comparing the persistence parameters for accruals andcash flow components of earnings are presented in Table 9. For both groups,accruals are significantly less persistent than operating cash flows, similar tofindings of Sloan (1996) and Dechow et al. (2008). The lower persistence ofaccruals is indicated by the FLEX group’s persistence parameter (i.e., forecast-ing coefficient) for accruals of 0.4302, compared to 0.6788 for operating cashflow (panel A). For the non-FLEX group, persistence parameters are 0.4339 and0.6851 for accruals and operating cash flow, respectively (panel B).
The implications of the market-implied coefficients, however, differ for the twogroups. The FLEX subsample’s market-implied persistence of accruals (0.2325) ismuch lower than the persistence parameter (0.4302), and the market-implied persis-tence of cash flow (0.1922) is also much lower than the persistence parameter (0.6788),indicating underpricing of both components. 29 (Pincus et al. (2007) similarly findunderweighting of both accruals and operating cash flows in four of the countries theystudy, two of which are European.) However, the FLEX subsample’s market-impliedpersistence of accruals (0.2325) exceeds the market-implied persistence of operatingcash flow (0.1922), indicating a higher pricing for accruals relative to cash flow.
In contrast, the non-FLEX subsample’s market-implied persistence of accruals(0.4020) is roughly equivalent (p = 0.6644) to the persistence parameter of accruals(0.4339) in the forecasting equation, while the market-implied persistence of cash flow(0.4039) is lower than the persistence parameter (0.6851), indicating underpricing onlyof the cash flow component. (Pincus et al. (2007) similarly find underweighting of OCFbut not accruals in eight of the countries they study, five of which are European.)Furthermore, the market-implied coefficient of accruals is also roughly equivalent tothe market-implied coefficient of cash flow. In other words, unlike the FLEX sub-sample, the evidence does not reveal higher pricing for accruals relative to cash flow.Overall, these results could be interpreted to suggest that investors value accruals morehighly than cash flow—but only for the FLEX subsample.
5.2 Models of OCF prediction
Table 10 presents regression results for two cash flow prediction models.30 Analysesand inferences are based on prediction of OCF as reported on the statement of cash
29 Untabulated analysis indicates similar underpricing of both components for the subsample of FLEXobservations making OCF-increasing classification choices but not for the OCF-decreasing group.30 In the past sales model in Table 10, panel A, the number of observations in the regressions, 4,006, is lowerthan the 6,046 firm-year observations in the total sample due to inclusion of lagged variables and changes inthe lagged variables.
Flexibility in cash-flow classification under IFRS

flows, not prediction of real economic OCF, which is unobservable. In panel A,operating cash flows are regressed on prior year’s sales and change in sales. Thecoefficients on the interaction terms with sales and change in sales are both positiveand significant, implying that the classification choices matter when predicting futureOCF. The positive sign is consistent with OCF using IFRS classification choice beinghigher on average that OCF using U.S. GAAP classification choices. The estimated
Table 9 Simultaneous estimation of persistence parameters for accruals and operating cash flow and theparameters implied by stock returns, for subsamples making alternative classification choices
EARNINGStþ1 ¼ α0 þ α1 ACCR Reportedt þ α2 OCF Reportedt þ Controlst þ υt
Returnstþ1 ¼ β EARNINGStþ1−α#0 −α
#1 ACCR Reportedt þ α#
2 OCF Reportedt þ ϕ Controlst� �
þ εt
Forecasting Coefficients Valuation Coefficients
Parameter Coefficient estimate(standard error)
Parameter Coefficient estimate(standard error)
Test of market efficiencyai = ai
#
Wald statistic (p-value)
Panel A: FLEX = 1 (n = 1,425)
a1 0.4302 α#1 0.2325 3.5127
(0.0273) (0.1019) (0.0609)**
a2 0.6788 α#2 0.1922 19.8111
(0.0259) (0.1062) (0.0000)***
β 1.9164
(0.1862)
Controlsa Yes Controls Yes
Panel B. FLEX = 0 (n = 2581)
a1 0.4339 α#1 0.4020 0.1882
(0.0233) (0.0699) (0.6644)
a2 0.6851 α#2 0.4039 17.3206
(0.0207) (0.0643) (0.0000)***
β 2.1548
(0.1271)
Controlsa Yes Controls Yes
aControlst Control variables included are: Sizet, BMt, and EPt*p < 0.10, ** p < 0.05, *** p < 0.01. p-values are two-tailed
Variable Definitions:
EARNINGSt+1 = net income for year t divided by average total assets for year t
ACCR_Reportedt = the amount of accruals, calculated as net income less reported operating cash flows foryear t divided by average total assets for year t
OCF_Reportedt = the reported amount of operating cash flow for year t divided by average total assets for year t
Returnst+1 = annual return computed 6 months after year end
Sizet = the natural logarithm of the firm’s market capitalization in U.S. dollars at the beginning of year t
BMt = the firm’s book-to-market ratio, calculated as the ratio of the firm’s shareholders’ equity divided by itsmarket capitalization at the beginning of year t
EPt = the firm’s net income divided by its market capitalization at the beginning of year t
E. A. Gordon et al.

Table 10 Regressions with reported future operating cash flows as dependent variable
Estimate Std. Error p-value
Panel A: Regression of future operating cash flows on sales and change in sales
OCFtþ1 ¼ γ0 þ γ11=TAt þ γ2St=TAt þ γ3FLEX � St=TAt þ γ4ΔSt=TAt þγ5FLEX �ΔSt=TAt
þ γ6FLEX þ γ7Sizet þ γ8BMt þ γ9EPt þ εtþ1
(n = 4006a)
Intercept 0.0543 0.0180 0.0025***
1/TAt −0.3690 0.1158 0.0015***
St/TAt 0.0963 0.0630 0.0634*
FLEX x St/TAt 0.1307 0.0794 0.0998*
ΔSt/TAt −0.0161 0.0552 0.7709
FLEX x ΔSt/TAt 0.0932 0.0660 0.0791*
FLEX 0.0267 0.0100 0.0077***
Sizet 0.0008 0.0005 0.0632*
BMt −0.0152 0.0012 <.0001***
EPt 0.1309 0.0074 <.0001***
F-value 15.88
(p-value) <0.0001
R2 0.1351
Panel B: Regression of future operating cash flows on current accruals and cash flows
OCFtþ1 ¼ φ0 þ φ1AACR Reportedt þ φ2FLEX � ACCR Reportedt þ φ3OCF Reportedt þ φ4FLEX�OCF Reportedt þ φ5FLEX þ φ6Sizet þ φ7 þ BMt þ φ8EPt þ εtþ
(n = 5128 a)
Intercept 0.0251 0.0056 <.0001***
ACCR_Reportedt 0.2373 0.0165 <.0001***
FLEX x ACCR_Reportedt 0.0019 0.0164 0.9098
OCF_Reportedt 0.7809 0.0148 <.0001***
FLEX x OCF_Reportedt 0.0230 0.0191 0.2302
FLEX −0.0019 0.0023 0.4236
Sizet 0.0007 0.0004 0.0906*
BMt −0.0015 0.0009 0.0935*
EPt 0.0067 0.0058 0.2493
F-value 141.21
(p-value) <0.0001
R2 0.5132
a The number of observations is based on the availability of accounting and market data to compute variables,including lagged variables, in the model
* p < 0.10, ** p < 0.05, *** p < 0.01. p-values are two-tailed. Errors are clustered by firm. Regressions includecountry, industry, and year controls
Variable definitions:
1/TAt = one divided by average total assets for year t
St /TAt = sales revenue for year t divided by average total assets
FLEX x St /TAt is the interaction between the indicator variable FLEX and sales revenue for year t
ΔSt /TAt is change in annual sales revenue from year t-1 to year t divided by average total assets
FLEX xΔSt /TAt is the interaction between the indicator variable FLEX and change in annual sales revenue foryear t divided by average total assets
See Table 9 for remaining variable definitions
Flexibility in cash-flow classification under IFRS

coefficient on sales is positive and significant as expected. However, the coefficient onchanges in sales is not significant.
In the past cash flows and accruals models in Table 10, panel B, the FLEXinteraction with OCF and accruals is not significant, indicating that the classificationchoices do not contribute to the prediction of future OCF in this model. This finding isconsistent with past OCF and accruals also controlling for the firm’s classificationchoices. Furthermore, this finding suggests that this type of model may be more usefulin the international context in which flexibility in cash flow classification exists.
5.3 Additional analyses
Our market tests do not provide evidence consistent with the accrual anomaly. Pincuset al. (2007) provide evidence that the accrual anomaly occurs in common lawcountries and not code law countries. Given that code law countries comprise 12 ofthe 13 countries in our sample, this finding is consistent. In the United Kingdom, theonly common law country in our sample, we also find no evidence of the accrualanomaly. We explore whether the results of our market tests are sensitive to modelspecification. We find that results of our market pricing analysis in Table 9 are sensitiveto model specification. 31 In particular, when the forecasting and valuation modelsexclude firm-specific control variables (Sizet, BMt, and EPt), the overall conclusionsare similar for both subsamples. These conclusions, based on untabulated resultsexcluding the control variables, are as follows. 1) Accruals are significantly lesspersistent than operating cash flows as in the base analysis. 2) The market-impliedcoefficients reflect underpricing of both accruals and operating cash flow as in the baseanalysis. 3) But the comparative magnitude of the market-implied coefficients showsno indication of the accrual anomaly (i.e., the coefficient on accruals does not exceedthe coefficient on operating cash flow), regardless of the firm’s cash-flow classificationchoice.
6 Conclusion
Cash flow, and particularly OCF, is used in business valuation and contracting.However, OCF can be measured differently under IFRS and U.S. GAAPbecause of classification alternatives available only under IFRS. While previousinternational accounting research focuses on IFRS versus U.S. GAAP differ-ences in earnings and shareholders’ equity, little attention has been given topotential differences in OCF under the two sets of standards.
Using an international setting, we build on and extend certain findings from theU.S.-only setting of Lee (2012). We find that firms with a higher likelihood of financialdistress as well as those that issue more equity, have higher leverage, and are lessprofitable are more likely to make OCF-increasing classification choices. Our findingsfurther suggest that cross-listed firms tend to make classification choices consistent
31 The exploration of the accrual anomaly for various subpopulations is an area for potential future research.
E. A. Gordon et al.

with U.S. GAAP. Firms are more likely to make OCF-increasing classification changeswhen they have issued equity and less likely to change when they are followed byanalysts, have more peers making similar choices, and are cross-listed in the U.S.Overall, OCF-enhancing classification choices are associated with both financial andinformational factors.
The flexibility under IFRS also has consequences. We provide evidence thatthe market’s assessment of the persistence of OCF and accruals differs forgroups of firms making different classification choices. However, our resultsare sensitive to model specification. We also show that results of certain OCFprediction models differ for firms making different classification choices. WhenOCF prediction is based on past sales, results differ for firms making alterna-tive classification choices. However, when OCF prediction is based on pastOCF and accruals, results do not differ significantly for firms making alterna-tive classification choices, likely because past OCF and accruals also control forfirms’ classification choices. Overall, the consequences of classification choices,such as market reaction to OCF surprise/earnings surprise around earningsannouncements, offer an avenue for future research.
Our paper contributes to the international accounting literature exploring theconsequences of IFRS adoption and reporting. Given the recent adoption ofIFRS in more than 120 countries and the consideration of IFRS by U.S.regulators, our evidence is important. Our results show that cash flow classifi-cation flexibility within IFRS creates a noncomparability that is absent underthe more rigid requirements of U.S. GAAP. Flexibility in classification of cashflow items introduces potential noncomparability into measurement of widelyused metrics, such as accruals and free cash flow. Understanding the impact ofnoncomparability under IFRS on such metrics will facilitate appropriate infer-ences from research incorporating these metrics.
Acknowledgements We thank seminar participants for comments received at Bocconi, BostonCollege, HEC Paris, Hong Kong University of Science and Technology, Keele University, LondonBusiness School, Oxford, Stockholm School of Economics, University of Virginia Darden School ofBusiness, the 2013 American Association Annual Meeting, the 2013 European Accounting Asso-ciation Annual Congress, the 2013 International Accounting Section Midyear Meeting, and the2013 Joint Meeting of the Accounting Section of the German Academic Association for BusinessResearch and the International Association for Accounting Education and Research. We gratefullyacknowledge the comments of Mary Barth, Larry Brown, Giorgio Gotti, Bret Johnson, Chika Saka,and Ann Tarca, Stata assistance from Judson Caskey’s website, and the research assistance of JeanBradley, Byung Hoon Jin, Sung JinPark, Sam Liu, Troy Pollard, and Hakjoon Song.
Appendix
EXAMPLE OF EFFECTS OF RECLASSIFICATION ON OPERATING CASHFLOWS
Norse Energy Corp. ASA, a Norwegian gas explorer and producer, changed itsclassifications of interest paid and interest received in 2007. It changed its classificationof interest paid to financing from operating. It changed its classification of interest
Flexibility in cash-flow classification under IFRS

received to investing from operating. The net effect of these changes was to reportpositive, rather than negative, operating cash flows in both 2007 and 2008. Theexample below illustrates the computation of the net effect of the reclassifications.
Open Access This article is distributed under the terms of the Creative Commons Attribution 4.0 InternationalLicense (http://creativecommons.org/licenses/by/4.0/), which permits unrestricted use, distribution, and repro-duction in any medium, provided you give appropriate credit to the original author(s) and the source, provide alink to the Creative Commons license, and indicate if changes were made.
References
Altman, E. I., & Hotchkiss, E. (2006). Corporate financial distress and bankruptcy (3rd ed.). Hoboken: Wiley.Ashbaugh, H. S., & Olsson, P. (2002). An exploratory study of the valuation properties of cross-listed firms’
IAS and US-GAAP earnings and book values. The Accounting Review, 77(1), 107–126.Badertscher, B. A., Collins, D. W., & Lys, T. Z. (2012). Discretionary accounting choices and the predictive
ability of accruals with respect to future cash flows. Journal of Accounting and Economics, 53(1), 330–352.
Barth, M. E., Beaver, W. H., Hand, J. R., & Landsman, W. R. (1999). Accruals, cash flows, and equity values.Review of Accounting Studies, 4(3–4), 205–229.
Barth, M. E., Beaver, W. H., & Landsman, W. R. (1998). Relative valuation roles of equity book value and netincome as a function of financial health. Journal of Accounting and Economics, 25(1), 1–34.
Barth, M.A., Beaver, W.H., & Landsman, W.R. (2001). The relevance of the value relevance literature forfinancial accounting standard setting: another view. Journal of Accounting and Economics, 31(1-3), 77–104.
Barton, J., Hansen, T. B., & Pownall, G. (2010). Which performance measures do investors around the worldvalue the most—and why? The Accounting Review, 85(3), 753–789.
Bartov, E., & Mohanram, P. S. (2014). Does income statement placement matter to investors? The case ofgains/losses from early debt extinguishment. The Accounting Review, 89(6), 2021–2055.
Beaver, W. H. (1966). Financial ratios as predictors of failure. Journal of Accounting Research,4(Supplement), 71–111.
Beatty, A., Nicoletti, A. K., & Tian, X. (2016). Differential informativeness of the cash flow statement for thebanking industry: evidence from debt and equity markets. Working paper, Ohio State University.
Bernard, V. L., & Stober, J. L. (1989). The nature and amount of information in cash flows and accruals. TheAccounting Review, 64(4), 624–651.
Table 11 Norse Energy Corp.: Computation of the Net Effects of the Reclassifications
As reportedfollowing 2007 reclassification
Adjustments, if no re-classificationa Pro formaif no reclassification
2008 2007 2008 2007 2008 2007
Operating $5.3 $2.8 ($13.7) ($14.4) ($8.4) ($11.6)
Investing $0.9 ($56.8) ($9.0) ($3.5) ($8.1) ($60.3)
Financing ($16.6) $34.5 $22.7 $17.9 $6.1 $52.4
Total ($10.40) ($19.50) $0 $0 ($10.40) ($19.50)
a The adjustments reverse the addition of interest received to investing and instead add it to operating. Theadjustments also reverse the deduction of interest paid from financing and instead subtract it from operating
E. A. Gordon et al.

Bradshaw, M. T., Bushee, B. J., & Miller, G. S. (2004). Accounting choice, home bias, and U.S. investment innon-U.S. firms. Journal of Accounting Research, 42(5), 795–841.
Bradshaw, M. T., &Miller, G. S. (2008). Will harmonizing accounting standards really harmonize accounting?Evidence from non-U.S. firms adopting US GAAP. Journal of Accounting, Auditing and Finance, 23(2),233–264.
Brown, L. D., Huang, K., & Pinello, A. S. (2013). To beat or not to beat? The importance of analysts’ cashflow forecasts. Review of Quantitative Finance and Accounting, 41(4), 723–752.
Call, A. C., Chen, S., & Tong, Y. H. (2009). Are analysts’ earnings forecasts more accurate when accompaniedby cash flow forecasts? Review of Accounting Studies, 14(2–3), 358–391.
Call, A. C., Chen, S., & Tong, Y. H. (2013). Are analysts’ cash flow forecasts naïve extensions of their ownearnings forecasts? Contemporary Accounting Research, 30(2), 438–465.
Carslaw, C. A., & Mills, J. R. (1991). Developing ratios for effective cash flow statement analysis. Journal ofAccountancy, 172(5), 63–70.
Damodaran, A. (2006).Damodaran on valuation: Security analysis for investment and corporate finance (2nded.). Hoboken: Wiley.
Davies, M., Paterson, R., & Wilson, A. (1997). UK GAAP: Generally accepted accounting practice in theUnited Kingdom (5th ed.). London: Macmillan Reference Ltd..
De George, E. T., Li, X., & Shivakumar, L. (2016). A review of the IFRS-adoption literature. Review ofAccounting Studies, 21(3), 898–1004.
Dechow, P. M., Kothari, S. P., &Watts, R. L. (1998). The relation between earnings and cash flows. Journal ofAccounting and Economics, 25(1), 133–168.
Dechow, P. M., Richardson, S. A., & Sloan, R. G. (2008). The persistence and pricing of the cash componentof earnings. Journal of Accounting Research, 46(3), 537–566.
De Franco, G., Kothari, S. P., & Verdi, R. S. (2011). The benefits of financial statement comparability. Journalof Accounting Research, 49(4), 895–931.
DeFond, M. L., & Hung, M. (2003). An empirical analysis of analysts’ cash flow forecasts. Journal ofAccounting and Economics, 35(1), 73–100.
DeFond, M. L., & Hung, M. (2007). Investor protection and analysts’ cash flow forecasts around the world.Review of Accounting Studies, 12(2–3), 377–419.
Dichev, I. D., & Skinner, D. J. (2002). Large-sample evidence on the debt covenant hypothesis. Journal ofAccounting Research, 40(4), 1091–1123.
Engel, E., Erickson, M., & Maydew, E. (1999). Debt-equity hybrid securities. Journal of AccountingResearch, 37(2), 249–274.
Estridge, J., & Lougee, B. A. (2007). Measuring free cash flows for valuation: pitfalls and possible solutions.Journal of Applied Corporate Finance, 19(2), 60–71.
Fields, T. D., Lys, T. Z., & Vincent, L. (2001). Empirical research on accounting choice. Journal of Accountingand Economics, 31, 255–307.
Financial Accounting Standards Board (FASB). (1987). Statement of Financial Accounting Standards No. 95:Statement of Cash Flows. Stamford, Conn. SFAS 95 is now codified in the FASB Accounting StandardsCodification (ASC Sections 230 Statement of Cash Flows, 830 Foreign Currency Matters, and 942Financial Services – Depository and Lending).
Givoly, D., Hayn, C., & Lehavy, R. (2009). The quality of analysts’ cash flow forecasts. The AccountingReview, 84(6), 1877–1911.
Hollie, D., Nichols, C., & Zhao, Q. (2011). Effects of cash flow statement reclassifications pursuant to theSEC’s one-time allowance. Journal of Accounting and Public Policy, 30(6), 570–588.
Hribar, P., & Collins, D. W. (2002). Errors in estimating accruals: implications for empirical research. Journalof Accounting Research, 40(1), 105–134.
Imam, S., Barker, R., & Clubb, C. (2008). The use of valuation models by UK investment analysts. EuropeanAccounting Review, 17(3), 503–535.
International Accounting Standards Board (IASB). (1994) (as amended). International Accounting Standard 7.Statement of Cash Flows. London, UK.
Khanna, T., Palepu, K. G., & Srinivasan, S. (2004). Disclosure practices of foreign companies interacting withU.S. markets. Journal of Accounting Research, 42(2), 475–508.
Kim, Y., & Park, M. S. (2014). Real activities manipulation and auditors' client-retention decisions. TheAccounting Review, 89(1), 367–401.
Lee, L. F. (2012). Incentives to inflate reported cash from operations using classification and timing. TheAccounting Review, 87(1), 1–33.
Leuz, C. (2000). The development of voluntary cash flow statements in Germany and the influence ofinternational reporting standards. Schmalenbach Business Review, 52(2), 182–207.
Flexibility in cash-flow classification under IFRS

Liu, J., Nissim, D., & Thomas, J. (2007). Is cash flow king in valuations? Financial Analysts Journal, 63(2),56–68.
Marquardt, C., & Wiedman, C. (2005). Earnings management through transaction structuring: contingentconvertible debt and diluted earnings per share. Journal of Accounting Research, 43(2), 205–243.
McInnis, J., & Collins, D. W. (2011). The effect of cash flow forecasts on accrual quality and benchmarkbeating. Journal of Accounting and Economics, 51(3), 219–239.
McVay, S. E. (2006). Earnings management using classification shifting: an examination of core earnings andspecial items. The Accounting Review, 81(3), 501–531.
Mohanram, P. S. (2005). Separating winners from losers among low book-to-market stocks using financialstatement analysis. Review of Accounting Studies, 10(2–3), 133–170.
Mulford, C. W., & Comiskey, E. E. (2005). Creative cash flow reporting: Uncovering sustainable financialperformance. Hoboken: Wiley.
Nobes, C. W. (2001). GAAP 2001: a survey of national accounting rules benchmarked against internationalaccounting standards. Available at: www.iasplus.com/en/binary/resource/gaap2001.pdf.
Nobes, C. W. (2011). International variations in IFRS adoption and practice. Association of CharteredCertified Accountants, Research Report 124. London.
Nurnberg, H., & Largay, J. A. (1998). Interest payments in the cash flow statement. Accounting Horizons,12(4), 407–418.
Ohlson, J. A. (1980). Financial ratios and the probabilistic prediction of bankruptcy. Journal of AccountingResearch, 18(1), 109–131.
Orpurt, S. F., & Zang, Y. (2009). Are direct cash flow disclosures informative? A revisit. The AccountingReview, 84(3), 893–935.
Penman, S. H., & Yehuda, N. (2009). The pricing of earnings and cash flows and an affirmation of accrualaccounting. Review of Accounting Studies, 14(4), 453–479.
Pincus, M., Rajgopal, S., & Venkatachalam, M. (2007). The accrual anomaly: international evidence. TheAccounting Review, 82(1), 169–203.
Piotroski, J. D. (2000). Value investing: the use of historical financial statement information to separatewinners from losers. Journal of Accounting Research, 38(Supplement), 1–41.
Roychowdhury, S. (2006). Earnings management through real activities manipulation. Journal of Accountingand Economics, 42(3), 335–370.
Securities and Exchange Commission (SEC). (2011). Work plan for the consideration of incorporating IFRSinto the financial reporting system for U.S. issuers a comparison of U.S. GAAP and IFRS: A SEC StaffPaper. Available at http://www.sec.gov/spotlight/globalaccountingstandards/ifrs-work-plan-paper-111611-practice.pdf.
Shumway, T. (2001). Forecasting bankruptcy more accurately: a simple hazard model. Journal of Business,74(1), 101–124.
Sloan, R. G. (1996). Do stock prices fully reflect information in accruals and cash flows about future earnings?The Accounting Review, 71(3), 289–315.
Wasley, C. E., & Wu, J. S. (2006). Why do managers voluntarily issue cash flow forecasts? Journal ofAccounting Research, 44(2), 389–429.
Wang, C. (2014). Accounting standards harmonization and financial statement comparability: evidence fromtransnational information transfer. Journal of Accounting Research, 52(4), 955–992.
E. A. Gordon et al.