flexible learning approach to physics ÊÊÊ a wave
TRANSCRIPT

F L E X I B L E L E A R N I N G A P P R O A C H T O P H Y S I C S
FLAP P6.1 Light1—1a wave phenomenonCOPYRIGHT © 1998 THE OPEN UNIVERSITY S570 V1.1
Module P6.1 Light1—1a wave phenomenon1 Opening items
1.1 Module introduction1.2 Fast track questions1.3 Ready to study?
2 The wave model of light2.1 Light in a vacuum2.2 Polarization2.3 Light in materials
3 Propagation and Huygens’ principle3.1 The propagation of an unrestricted wavefront3.2 The propagation of a restricted wavefront1
—1diffraction3.3 Propagating wavefronts and rays of light3.4 The reflection of light3.5 The refraction of light
4 Illumination and the inverse square law4.1 Intensity4.2 The inverse square law of illumination
5 Interference and the superposition principle5.1 The superposition principle5.2 Young’s two-slit experiment5.3 Coherence1—1a necessary condition for
interference5.4 Interference of light reflected from thin films5.5 The diffraction grating5.6 Fraunhofer diffraction at a single slit
6 Closing items6.1 Module summary6.2 Achievements6.3 Exit test
Exit module

FLAP P6.1 Light1—1a wave phenomenonCOPYRIGHT © 1998 THE OPEN UNIVERSITY S570 V1.1
1 Opening items
1.1 Module introductionLight is vital to life. There would be no life on Earth without the energy from the Sun and much of that energy istransferred by visible light. How is the energy transmitted through space and how it is delivered on arrival?Are each of these processes analogous to the passage of particles (like bullets from a gun) or waves (like waveson a beach)? Experiments must decide which is the more appropriate mechanism, waves or particles, but let uslook at the alternatives for a moment.
Particles might be expected to travel in straight lines and to form sharp edged shadows, but waves are able totravel around obstacles and might therefore blur the edges of shadows. Particles would be expected to travellarge distances carrying their energy with them, but a wave usually results from the coordinated local motion ofmany neighbouring parts that pass energy from one to another1—1the parts themselves don’t usually travel veryfar, and what movements they do make may take place in any direction relative to the direction of energy flow.Despite these gross differences between waves and particles, the battle over the true nature of light raged for avery long time. Isaac Newton (1642–1727), for example, favoured a sophisticated form of particle, whileChristiaan Huygens (1629–1695) favoured the wave mechanism.

FLAP P6.1 Light1—1a wave phenomenonCOPYRIGHT © 1998 THE OPEN UNIVERSITY S570 V1.1
The matter finally appeared settled in 1801 when a British physician, Thomas Young (1773–1829), detectedclear signs of wave-like behaviour. It only remained, it seemed, for those who came after to elaborate the wavemodel and to determine the nature of the waves.
This was achieved in 1864, by James Clerk Maxwell (1831–1879), when he showed that oscillating electric andmagnetic fields can propagate (i.e. travel) as an electromagnetic wave through space or various materials.But even these discoveries were later to be seen in a new way as the development of quantum theory allowed thedebate to continue into the 20th century.
It is not only physicists who have been fascinated for hundreds of years by the nature of light. Almost everyonehas marvelled at the way the colours of a peacock’s tail, or of an oil film on water, change as they are viewedfrom different angles. In this module you will see how both these observations provide powerful clues to thenature of light.

FLAP P6.1 Light1—1a wave phenomenonCOPYRIGHT © 1998 THE OPEN UNIVERSITY S570 V1.1
This module describes the wave model of light. Section 2 will introduce you to Maxwell’s electromagneticwaves and show how they account for various properties of light such as colour and polarization. Section 3 setsout Huygens’ principle, an idea that predates Maxwell’s work but which is nonetheless able to provide insightinto the transmission or propagation of light, including such important phenomena as diffraction, reflection andrefraction. In Section 4 the intensity of light waves is defined. This leads to a discussion of the transfer of energyby light and of the inverse square law of illumination. Finally, in Section 5, the superposition principle isintroduced and used to explain various aspects of interference, including Young’s experiment, reflection fromthin films, the operation of diffraction gratings and the phenomenon of Fraunhofer diffraction at a single slit.It is this final section that deals with the oil film and the peacock’s tail.
Study comment Having read the introduction you may feel that you are already familiar with the material covered by thismodule and that you do not need to study it. If so, try the Fast track questions given in Subsection 1.2. If not, proceeddirectly to Ready to study? in Subsection 1.3.

FLAP P6.1 Light1—1a wave phenomenonCOPYRIGHT © 1998 THE OPEN UNIVERSITY S570 V1.1
1.2 Fast track questions
Study comment Can you answer the following Fast track questions?. If you answer the questions successfully you needonly glance through the module before looking at the Module summary (Subsection 6.1) and the Achievements listed inSubsection 6.2. If you are sure that you can meet each of these achievements, try the Exit test in Subsection 6.3. If you havedifficulty with only one or two of the questions you should follow the guidance given in the answers and read the relevantparts of the module. However, if you have difficulty with more than two of the Exit questions you are strongly advised tostudy the whole module.
Question F1
Draw diagrams to show how Huygens’ principle may be used to demonstrate the laws of reflection andrefraction of light.
Question F2
Light of wavelength 550 1nm in a vacuum, passes into a block of glass where its speed is 2.10 × 1081m1s−1.
What is the frequency and wavelength of the light in the glass?

FLAP P6.1 Light1—1a wave phenomenonCOPYRIGHT © 1998 THE OPEN UNIVERSITY S570 V1.1
Question F3
What is meant by polarized light? Give your answer in terms of the directions of the electric and magnetic fields.What is unpolarized light?
Question F4
In a particular Young’s two-slit experiment, light of wavelength 6001nm is used. Find the separation of the slitsif the first order interference maximum appears at an angle of 0.15°.
Question F5
What is meant by the term diffraction? Describe the essential characteristics of a diffraction grating.

FLAP P6.1 Light1—1a wave phenomenonCOPYRIGHT © 1998 THE OPEN UNIVERSITY S570 V1.1
Study comment Having seen the Fast track questions you may feel that it would be wiser to follow the normal routethrough the module and to proceed directly to Ready to study? in Subsection 1.3.
Alternatively, you may still be sufficiently comfortable with the material covered by the module to proceed directly to theClosing items.

FLAP P6.1 Light1—1a wave phenomenonCOPYRIGHT © 1998 THE OPEN UNIVERSITY S570 V1.1
1.3 Ready to study?
Study comment In order to study this module you will need to be familiar with the following terms: Cartesiancoordinates, displacement, direction (of a vector), electric field, energy, magnetic field, magnitude (of a vector), oscillation,power, SI units, speed and vector. You will also need an everyday notion of what constitutes wave motion. The mathematicalrequirements include the use of radians to measure angles, the basic geometry of triangles, and basic trigonometry. If you areuncertain about any of these terms, or how to use them, refer to the Glossary which will indicate where in FLAP they areexplained. The following Ready to Study questions will help you to check that you have the required level of skills andknowledge.

FLAP P6.1 Light1—1a wave phenomenonCOPYRIGHT © 1998 THE OPEN UNIVERSITY S570 V1.1
Question R1
Describe in one sentence what is meant by an oscillation.
Question R2
How would you detect the presence of an electric field in some region of space?
Question R3
If the village of Smallplace is 20 miles north of the city of Bigplace, what is the magnitude and direction of thedisplacement vector from Smallplace to Bigplace?

FLAP P6.1 Light1—1a wave phenomenonCOPYRIGHT © 1998 THE OPEN UNIVERSITY S570 V1.1
2 The wave model of light
2.1 Light in a vacuumIn his pioneering investigation of electric and magnetic fields James Clerk Maxwell was able to construct atheory of electromagnetism which made a crucial prediction. ☞ This was that oscillating electric and magneticfields could travel through space as an electromagnetic wave1—1a pattern of fluctuating electric and magneticfields that could tumble together through a vacuum at a speed equal to the known speed of light.
The German physicist Heinrich R. Hertz (1857–1894) succeeded in generating electromagnetic waves (of thetype we now call radiowaves) in 1888. He showed that they behaved like light in many respects and that theirspeed was indeed the same as the speed of light. ☞ This confirmed Maxwell’s prediction and helped toestablish the idea that light itself is an electromagnetic wave phenomenon.
The nature of an electromagnetic wave needs careful consideration. Various kinds of waves are important inphysics but few are as subtle as electromagnetic waves. For many sorts of waves it is easy to visualize what isactually ‘waving’. In the case of sound waves in air, for example, the density or pressure of the air varies asindividual molecules oscillate back and forth along the path of the sound wave. In the case of the waves thattravel along a horizontal rope being shaken at one end, it is the rope itself that moves as its various parts oscillateat right angles to the direction of the travelling wave.

FLAP P6.1 Light1—1a wave phenomenonCOPYRIGHT © 1998 THE OPEN UNIVERSITY S570 V1.1
Electromagnetic waves are rather different; nothing moves as such, but at every point along the path of the wavethere will be an oscillating electric field E and an oscillating magnetic field B. Both of these fields are vectorquantities, so each has its own magnitude and direction that may change from place to place and from onemoment to the next. It is these magnitudes and directions that vary during the passage of an electromagneticwave, just as the air pressure at a point varies during the passage of a sound wave.

FLAP P6.1 Light1—1a wave phenomenonCOPYRIGHT © 1998 THE OPEN UNIVERSITY S570 V1.1
λy
direction of oscillation of electric field vector E
direction of oscillation of magnetic field vector B
z
x direction of wave propagation
Figure 1 3
An instantaneous snapshotshowing the varyingmagnitude and direction ofthe electric field E andmagnetic field B at pointsalong the path of thes i m p l e s t k i n d o felectromagnetic wave.
The oscillating fields in an electromagnetic wave always have to be related in a very particular way.This is indicated in Figure 1 which shows a snapshot of the simplest kind of electromagnetic wave at a particularinstant of time. There are several points to notice about this wave:

FLAP P6.1 Light1—1a wave phenomenonCOPYRIGHT © 1998 THE OPEN UNIVERSITY S570 V1.1
λy
direction of oscillation of electric field vector E
direction of oscillation of magnetic field vector B
z
x direction of wave propagation
Figure 1 3
An instantaneous snapshotshowing the varyingmagnitude and direction ofthe electric field E andmagnetic field B at pointsalong the path of thes i m p l e s t k i n d o felectromagnetic wave.
o The wave is travelling along a fixed direction known as the direction of propagation. In this case we havechosen to make it the z-axis of a system of Cartesian coordinates.

FLAP P6.1 Light1—1a wave phenomenonCOPYRIGHT © 1998 THE OPEN UNIVERSITY S570 V1.1
o The wave is travelling at the speed of light. In a vacuum this is defined to be 299179214581m1s−1. ☞It is customary to represent this speed by c and it is worth noting that to three significant figures
c = 3.00 × 1081m1s−1 (in a vacuum)

FLAP P6.1 Light1—1a wave phenomenonCOPYRIGHT © 1998 THE OPEN UNIVERSITY S570 V1.1
λy
direction of oscillation of electric field vector E
direction of oscillation of magnetic field vector B
z
x direction of wave propagation
Figure 1 3
An instantaneous snapshotshowing the varyingmagnitude and direction ofthe electric field E andmagnetic field B at pointsalong the path of thes i m p l e s t k i n d o felectromagnetic wave.
o At every point on the z-axis the electric and magnetic fields are at right angles to the direction ofpropagation1—1electromagnetic waves are therefore said to be transverse waves.

FLAP P6.1 Light1—1a wave phenomenonCOPYRIGHT © 1998 THE OPEN UNIVERSITY S570 V1.1
λy
direction of oscillation of electric field vector E
direction of oscillation of magnetic field vector B
z
x direction of wave propagation
Figure 1 3
An instantaneous snapshotshowing the varyingmagnitude and direction ofthe electric field E andmagnetic field B at pointsalong the path of thes i m p l e s t k i n d o felectromagnetic wave.
o At every point on the z-axis the electric and magnetic fields are at right angles to one another. In this casewe have chosen to orientate the axes so that the electric and magnetic fields oscillate along the x and y-axes,respectively.

FLAP P6.1 Light1—1a wave phenomenonCOPYRIGHT © 1998 THE OPEN UNIVERSITY S570 V1.1
λy
direction of oscillation of electric field vector E
direction of oscillation of magnetic field vector B
z
x direction of wave propagation
Figure 1 3
An instantaneous snapshotshowing the varyingmagnitude and direction ofthe electric field E andmagnetic field B at pointsalong the path of thes i m p l e s t k i n d o felectromagnetic wave.
If you look along the direction of propagation (i.e. the z-axis in Figure 1), a clockwise rotation of 90° isneeded to go from the electric field direction to the magnetic field direction at any instant of time.

FLAP P6.1 Light1—1a wave phenomenonCOPYRIGHT © 1998 THE OPEN UNIVERSITY S570 V1.1
λy
direction of oscillation of electric field vector E
direction of oscillation of magnetic field vector B
z
x direction of wave propagation
Figure 1 3
An instantaneous snapshotshowing the varyingmagnitude and direction ofthe electric field E andmagnetic field B at pointsalong the path of thes i m p l e s t k i n d o felectromagnetic wave.
o The electric and magnetic fields vary sinusoidally and they do so together (i.e. they are in phase).A characteristic property of each field is its maximum magnitude. This is called its amplitude and may bedenoted by E0 and B0 for the electric and magnetic fields, respectively.

FLAP P6.1 Light1—1a wave phenomenonCOPYRIGHT © 1998 THE OPEN UNIVERSITY S570 V1.1
λy
direction of oscillation of electric field vector E
direction of oscillation of magnetic field vector B
z
x direction of wave propagation
Figure 1 3
An instantaneous snapshotshowing the varyingmagnitude and direction ofthe electric field E andmagnetic field B at pointsalong the path of thes i m p l e s t k i n d o felectromagnetic wave.
Although it is not obvious from the figure, the ratio of the field magnitudes, E/B at any point, is fixed and in avacuum is equal to the speed of light, so
E/B = E0/B0 = c (in a vacuum)

FLAP P6.1 Light1—1a wave phenomenonCOPYRIGHT © 1998 THE OPEN UNIVERSITY S570 V1.1
λy
direction of oscillation of electric field vector E
direction of oscillation of magnetic field vector B
z
x direction of wave propagation
Figure 1 3
An instantaneous snapshotshowing the varyingmagnitude and direction ofthe electric field E andmagnetic field B at pointsalong the path of thes i m p l e s t k i n d o felectromagnetic wave.
o Both the electric and the magnetic fields are characterized by a common wavelength λ which is equal to thedistance between corresponding parts of the wave (e.g. from one peak to the next).

FLAP P6.1 Light1—1a wave phenomenonCOPYRIGHT © 1998 THE OPEN UNIVERSITY S570 V1.1
λy
direction of oscillation of electric field vector E
direction of oscillation of magnetic field vector B
z
x direction of wave propagation
Figure 1 3
An instantaneous snapshotshowing the varyingmagnitude and direction ofthe electric field E andmagnetic field B at pointsalong the path of thes i m p l e s t k i n d o felectromagnetic wave.
o Since the wave has a particular wavelength and moves with a known speed the number of wavelengths thatwill pass a fixed point in one second is easy to calculate. That number per second is called the frequency fof the wave and is given by f = c/λ. Thus, in a vacuum
c = fλ (in a vacuum)

FLAP P6.1 Light1—1a wave phenomenonCOPYRIGHT © 1998 THE OPEN UNIVERSITY S570 V1.1
λy
direction of oscillation of electric field vector E
direction of oscillation of magnetic field vector B
z
x direction of wave propagation
Figure 1 3
An instantaneous snapshotshowing the varyingmagnitude and direction ofthe electric field E andmagnetic field B at pointsalong the path of thes i m p l e s t k i n d o felectromagnetic wave.
o Since f determines the number of wavelengths that pass a fixed point in one second, the time required forone wavelength to pass a fixed point will be 1/f. This time is called the period T of the wave and is given by
T = 1/f

FLAP P6.1 Light1—1a wave phenomenonCOPYRIGHT © 1998 THE OPEN UNIVERSITY S570 V1.1
✦ (a) The SI unit of frequency is the hertz (Hz), where 1 Hz = 11s–1. What is the SI unit of period T?
(b) The SI unit of electric field strength (i.e. magnitude) is the volt per metre (V1m–1) where11V1m–1 = 11kg1m1s–2
1C–1, and the SI unit of magnetic field strength is the tesla (T), where 11T = 11kg1s–11C–1.
Confirm that the ratio of electric and magnetic field amplitudes, E0/B0, can be measured in the same units asthe speed of light in a vacuum, c, as implied above.
FLAP P6.1 Light1—1a wave phenomenonCOPYRIGHT © 1998 THE OPEN UNIVERSITY S570 V1.1
gamma X-rays ultraviolet infrared microwaves radiowaves
wavelength, λ/m
radiowaves
microwaves
infrared
ultraviolet
X-rays
gamma raysv
isi
ble
frequency, f/Hz
10 −12 10 −9 10 −6 10 −3 1 10 3
10 21 10 18 10 15 10 12 10 9 10 6(a)
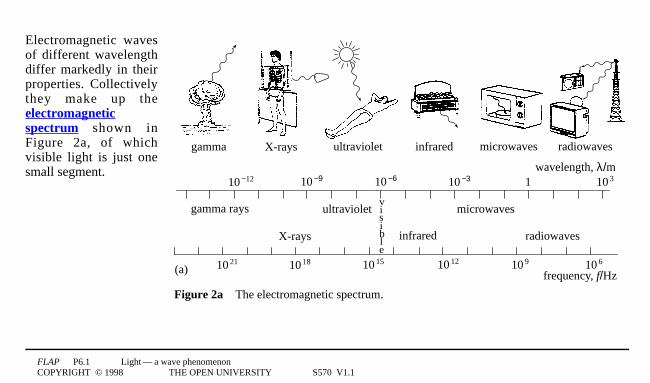
Figure 2a3The electromagnetic spectrum.
Electromagnetic wavesof different wavelengthdiffer markedly in theirproperties. Collectivelythey make up theelectromagneticspectrum shown inFigure 2a, of whichvisible light is just onesmall segment.

FLAP P6.1 Light1—1a wave phenomenonCOPYRIGHT © 1998 THE OPEN UNIVERSITY S570 V1.1
gamma X-rays ultraviolet infrared microwaves radiowaves
wavelength, λ/m
radiowaves
microwaves
infrared
ultraviolet
X-rays
gamma raysv
isi
ble
frequency, f/Hz
10 −12 10 −9 10 −6 10 −3 1 10 3
10 21 10 18 10 15 10 12 10 9 10 6(a)
Figure 2a3The electromagnetic spectrum.
Those parts of thespectrum with shorterwavelengths than visiblelight are notorious forthe i r powers o fpenetration and theirpotential for causingbiological damage. Theyinclude the gamma raysassociated with nuclearphenomena, the X-raysused in hospitals and theultraviolet radiationassociated with a goodsun-tan or a bad skincancer.

FLAP P6.1 Light1—1a wave phenomenonCOPYRIGHT © 1998 THE OPEN UNIVERSITY S570 V1.1
gamma X-rays ultraviolet infrared microwaves radiowaves
wavelength, λ/m
radiowaves
microwaves
infrared
ultraviolet
X-rays
gamma raysv
isi
ble
frequency, f/Hz
10 −12 10 −9 10 −6 10 −3 1 10 3
10 21 10 18 10 15 10 12 10 9 10 6(a)
Figure 2a3The electromagnetic spectrum.
On the other side ofvisible radiation, at thelong wavelength end ofthe spectrum, are themore benign regions ofinfrared and microwaveradiation that assist us incooking, and theradiowaves that provideus with entertainmentand worldwidecommunications.

FLAP P6.1 Light1—1a wave phenomenonCOPYRIGHT © 1998 THE OPEN UNIVERSITY S570 V1.1
viol
et
blue
gree
nye
llow
oran
ge
red
4 × 10 −7 7 × 10 −7
4.3 × 10147.5 × 1014 f/Hz
λ/m
(b)
Figure 2b3The part of theelectromagnetic spectrumcorresponding to visible light.
Notice that the wavelength and frequency scales in Figure 2a arelogarithmic (i.e. they involve powers of ten) so the range covered byvisible light (shown expanded in Figure 2b) really is very narrow indeed.
The human eye senses different frequencies of light as different colours.We usually define the colours by the corresponding wavelengths invacuum and the sensible unit to use is the nanometre (11nm = 10 1−191m).Light in the range 4001–5001nm is usually perceived as ‘blue’,5001–5601nm as ‘green’, 5601–16001nm as ‘yellow’ and 6001–7501nm as‘red’. You may be aware that the eye is most sensitive to small wavelengthchanges as colour differences in the centre of the visible range, at around5501nm; the trained eye can see a colour difference corresponding to a101nm change at around 5501nm but few can do this at around 6501nm.Evolution has equipped us with an eye which is perfectly tuned tosunlight! ☞
Question T1
Hertz measured the frequency of his electromagnetic waves to be 1001MHz. Calculate the wavelength of theradiation he generated.3❏

FLAP P6.1 Light1—1a wave phenomenonCOPYRIGHT © 1998 THE OPEN UNIVERSITY S570 V1.1
λy
direction of oscillation of electric field vector E
direction of oscillation of magnetic field vector B
z
x direction of wave propagation
Figure 1 3
An instantaneous snapshotshowing the varyingmagnitude and direction ofthe electric field E andmagnetic field B at pointsalong the path of thes i m p l e s t k i n d o felectromagnetic wave.
2.2 Polarization
For any electromagnetic wave the E and B vectors at any point must always be mutually perpendicular and mustalways lie in a plane which is perpendicular to the direction of propagation. Figure 1 illustrated a simpleexample in which the electric field vector E was confined to oscillate only in the x-direction and the magneticfield vector B only in the y-direction, but more complicated arrangements are also possible.

FLAP P6.1 Light1—1a wave phenomenonCOPYRIGHT © 1998 THE OPEN UNIVERSITY S570 V1.1
λy
direction of oscillation of electric field vector E
direction of oscillation of magnetic field vector B
z
x direction of wave propagation
Figure 1 3
An instantaneous snapshotshowing the varyingmagnitude and direction ofthe electric field E andmagnetic field B at pointsalong the path of thes i m p l e s t k i n d o felectromagnetic wave.
For instance, it is easy to imagine a wave travelling in the z-direction in which the E and B vectors are mutuallyperpendicular and confined to the (x , y) plane, but in which their orientation within that plane changescontinuously along the z-axis. In such a wave the electric and magnetic fields would wind around the direction ofpropagation and, in contrast to Figure 1, there would be no unique direction associated with either field.

FLAP P6.1 Light1—1a wave phenomenonCOPYRIGHT © 1998 THE OPEN UNIVERSITY S570 V1.1
An electromagnetic wave that does have a unique direction associated with its electric field vector is said to belinearly polarized or plane polarized. For such a wave:
The plane of polarization is the plane that contains the direction of the electric field vector and thedirection of propagation.

FLAP P6.1 Light1—1a wave phenomenonCOPYRIGHT © 1998 THE OPEN UNIVERSITY S570 V1.1
λy
direction of oscillation of electric field vector E
direction of oscillation of magnetic field vector B
z
x direction of wave propagation
Figure 1 3
An instantaneous snapshotshowing the varyingmagnitude and direction ofthe electric field E andmagnetic field B at pointsalong the path of thes i m p l e s t k i n d o felectromagnetic wave.
✦ What is the plane of polarization of the wave in Figure 1?

FLAP P6.1 Light1—1a wave phenomenonCOPYRIGHT © 1998 THE OPEN UNIVERSITY S570 V1.1
Linearly polarized light is very special and rather artificial. Light from ordinary sources is more likely to beunpolarized; this means that the direction of the electric field within the plane perpendicular to the direction ofpropagation varies rapidly and unpredictably (usually over a time interval of the order of 101−9
1s), and in such away that on average there is no preferred direction of oscillation for the electric field. Processes such asreflection can cause unpolarized light to become polarized, so much of the light we see in everyday life isactually partially polarized1—1there is a preferred direction of oscillation for E but it is not as pronounced as itwould be in the case of linearly polarized light. However, in any light wave, whatever its state of polarization,the instantaneous electric and magnetic fields are always perpendicular to each other and to the direction ofpropagation.
It is possible to produce linearly polarized light by passing a beam of unpolarized light through a polarizingfilter or polaroid. These filters are often made by aligning certain long-chain molecules in one direction within aplastic sheet. This arrangement will preferentially absorb those light waves in which the electric field isoscillating parallel to the axis of alignment. Light emerging from a polarizing filter will then be polarizedperpendicular to the aligned molecules. In polaroid sunglasses such filters are mounted so as to absorb lightwhich is horizontally polarized; the light reflected from horizontal surfaces is partially polarized in this directionso polaroid sunglasses can reduce the glare from roads and swimming pools by preferentially removing thiscomponent of the light.

FLAP P6.1 Light1—1a wave phenomenonCOPYRIGHT © 1998 THE OPEN UNIVERSITY S570 V1.1
Question T2
A certain beam of partially polarized light is composed of equal amounts of vertically polarized light(with electric field amplitude E0) and unpolarized light. In what direction is the beam polarized and what will bethe average electric field measured over a period of a few seconds? (Think carefully!)3❏

FLAP P6.1 Light1—1a wave phenomenonCOPYRIGHT © 1998 THE OPEN UNIVERSITY S570 V1.1
2.3 Light in materialsNow we will consider the nature of light in different (transparent) materials.
When an electromagnetic wave travels through a transparent material its speed ☞ is always less than c
(the speed in a vacuum). For light travelling through air the difference is only 0.03% but the speed of light inglass or water is about two-thirds or three-quarters of c, respectively. We define the ratio of the speed of light ina vacuum to the speed of light in a material to be the refractive index of the material. The refractive index isusually represented by µ (the Greek letter ‘mu’), so
µ = speed of light in a vacuumspeed of light in the material
(1)

FLAP P6.1 Light1—1a wave phenomenonCOPYRIGHT © 1998 THE OPEN UNIVERSITY S570 V1.1
Table 13The speed of light in variousmaterials.
Material Speed/108 1m1s−1
Refractiveindex
air 3.00 1.00*
water 2.26 1.33
glass† 1.6 to 2.0 1.9 to 1.5
diamond 1.24 2.42
The speed of visible light and the corresponding refractive index forvarious common materials is given in Table 1.
* 1.0003 is a more accurate value for air.
† For a range of glass types.
For any given material, µ is found to vary with the wavelength of thelight; different wavelengths travel at different speeds. Thus, the refractiveindices in Table 1 are really averages taken over a range of wavelengths,though the variations are rather small. Other optical properties ofmaterials vary even more strikingly with wavelength. Some materials aretransparent at one wavelength and opaque at another.

FLAP P6.1 Light1—1a wave phenomenonCOPYRIGHT © 1998 THE OPEN UNIVERSITY S570 V1.1
When light passes from one material into another, its speed usually changes. Since the speed is always given bythe product of the wavelength and the frequency, it is interesting to ask whether it is the wavelength or thefrequency which changes, or do both change?
To answer this, consider what happens at the boundary of the two materials. The fields on both sides of thisboundary must oscillate in the same way, so they must have a common frequency. The wavelength and speed oflight may vary across the boundary, but the frequency must remain the same.
λ material = λ vacuum
µ(2)
Question T3
The refractive index µ of a glass block is 1.50 for light of frequency 6.00 × 10141Hz. Find the wavelength of the
light in a vacuum and inside the block.3❏

FLAP P6.1 Light1—1a wave phenomenonCOPYRIGHT © 1998 THE OPEN UNIVERSITY S570 V1.1
3 Propagation and Huygens’ principle
3.1 The propagation of an unrestricted wavefrontThe electromagnetic wave model introduced in Section 2 can provide a complete account of the propagation oflight that includes details of its behaviour at surfaces which reflect or transmit the light that falls upon them.However, the full theory is mathematically complicated and rather cumbersome. Fortunately it is possible toobtain a good deal of insight into the propagation of light by means of a much simpler approach introduced inthe 17th century by the Dutch physicist Christiaan Huygens.
In its modern version, Huygens’ approach makes use of wavefronts. In a region occupied by waves, a wavefrontis a line (in two dimensions) or a surface (in three dimensions) that only passes through points at which the waveis at the same stage (or phase) in its oscillatory cycle. For instance, in the case of the waves spreading out from apoint of disturbance on the surface of a pond, the wavefronts would be concentric circles that might, forexample, run along the crests (or troughs) of the waves at some instant. These circular wavefronts would expandoutwards, along with the waves until some obstruction was encountered. In the absence of such restrictions thewavefront through any point will be perpendicular to the direction of propagation of the wave at that point.

FLAP P6.1 Light1—1a wave phenomenonCOPYRIGHT © 1998 THE OPEN UNIVERSITY S570 V1.1
Note In this module we will often use lines or curves to represent wavefront surfaces in three dimensions. We can safely dothis when there is an obvious symmetry in the situation. For example, in the case of waves expanding outwards uniformlyfrom a point in three-dimensional space, the wavefronts will be spherical surfaces centred on the source point but, thanks tothe spherical symmetry, they can safely be indicated diagramatically by circles drawn around the source point. Also note thatwhen using wavefronts it is usual to draw them at intervals of one wavelength. Thus, if one wavefront passes only throughpoints at which the wave is reaching its maximum, the next wavefront will normally have the same property.

FLAP P6.1 Light1—1a wave phenomenonCOPYRIGHT © 1998 THE OPEN UNIVERSITY S570 V1.1
(a) (b)
Figure 33The Huygens’constructions for an unrestrictedwavefront (shown in twodimensions) in the case of (a) aspherical wavefront and (b) a planewavefront.
Huygens realized that it is possible to predict how a given wavefront willadvance by means of geometrical constructions similar to those of Figure 3.These constructions are based on the following principle:
Huygens’ principle
Each point on a wavefront may be treated as a source of secondarywavelets that expand radially from their source with the same speed asthe original wave.
In practice it is only necessary to select as sources a set of points that areseparated by about one wavelength. After a short period of time (typicallyabout the period of the wave) the new wavefront can be constructed bydrawing a smooth line that just touches each wavelet.
Figure 3 shows how this works for a wave expanding from a point source inthree dimensions when the wavefront is unrestricted. In Figure 3a we arelooking near the source, and the time interval for the construction is the waveperiod, so a circular (i.e. spherical) wavefront creates a new circular(i.e. spherical) wavefront that has expanded by one wavelength.

FLAP P6.1 Light1—1a wave phenomenonCOPYRIGHT © 1998 THE OPEN UNIVERSITY S570 V1.1
(a) (b)
Figure 33The Huygens’ constructionsfor an unrestricted wavefront (shown intwo dimensions) in the case of(a) a spherical wavefront and(b) a plane wavefront.
In Figure 3b we are looking at the situation far away from the source;now the radii of the wavefronts are so large that any small part of thewavefront will appear to be a flat plane and will give rise to other planesas it advances.
Note A point source is ideally one of zero size. A real source acts as a pointsource when its size is less than a wavelength of light. In practice a source canoften be treated as a point source if the distance to the source is very largecompared to the size of the source.
Thus, Figure 3a depicts an expanding spherical wave with sphericalwavefronts and Figure 3b a plane wave with plane wavefronts.At sufficiently large distances from a point source any expandingspherical wave approximates a plane wave, as the radius of curvature ofthe wavefronts become very large.

FLAP P6.1 Light1—1a wave phenomenonCOPYRIGHT © 1998 THE OPEN UNIVERSITY S570 V1.1
w
Figure 43The Huygens’construction for diffractionat an aperture of widthequal to five wavelengths.
3.2 The propagation of a restricted wavefront1—1diffraction ☞Figure 4 shows a plane wavefront propagating to the right, through an aperture.In this case the aperture is a slit of width w, where w happens to be five times thewavelength of the light. This aperture represents a significant restriction to thepassage of the wavefront since its width is comparable to the wavelength. In usingHuygens’ construction to determine the form of the wavefront to the right of the slitwe must include only those secondary wavelets originating from points within theaperture since all the others are blocked off by the slit walls. The striking feature ofthe resulting wavefront, shown in Figure 4, is that near the edges of the slit thewavefronts are curved, corresponding to waves moving away from the originaldirection of propagation. The curvature arises as a result of the missing contributionswhich are now blocked off by the walls of the slit. The inescapable conclusion is thatthe beam, which initially was travelling parallel to the axis, has been spread out bythe restriction imposed by the slit. This spreading effect is known as diffraction.
Note You may be wondering why, in the Huygens’ construction, we only consider theexpanding secondary wavelets travelling in the direction of the original wave, rather than alsoin the opposite direction. If so, you deserve congratulations! This is one of the flaws in theHuygens’ approach and it needs Maxwell’s theory to resolve it.

FLAP P6.1 Light1—1a wave phenomenonCOPYRIGHT © 1998 THE OPEN UNIVERSITY S570 V1.1
The extent to which light is diffracted by a slit depends on the size of the slit. If the slit width is very largecompared to the wavelength then the diffraction effect is rather insignificant, unless we look very close to theshadow region near the edge of the slit. On the other hand, if the slit width is made narrower than fivewavelengths, the diffraction becomes more significant. If the slit width were less than one wavelength then itwould act essentially as a line of point sources with circular wavefronts beyond the slit, corresponding to thebeam having been spread out uniformly over all angles. The diffraction of light by narrow apertures is a strikingphenomenon and provides a strong indication that light is a wave phenomenon. ☞
Home experiment3If you have access to a pair of binoculars, mask one of the large front lenses using card toproduce a narrow slit about 11mm wide. Look through the eyepiece and focus on a distant street lamp at night.You should see a wider image of the slit and several subsidiary images1—1the former effect is clear evidence ofdiffraction, the latter is explained in Subsection 5.6.
Diffraction has been described as a consequence of restricting an infinite wavefront by interposing a narrowaperture. Alternatively we could have demonstrated diffraction by placing a narrow obstacle in front of theinfinite wavefront. Either a hair or a narrow slit is an equally suitable object with which to produce diffractionfrom an infinite wavefront.

FLAP P6.1 Light1—1a wave phenomenonCOPYRIGHT © 1998 THE OPEN UNIVERSITY S570 V1.1
Diffraction is the spreading of a propagating wavefront away from its original direction of propagation thatoccurs whenever the wavefront encounters an aperture or an obstacle. The effects are especially significantwhen they are caused by an object whose size is comparable with the wavelength of light.
✦ In terms of Huygens’ principle the diffraction of plane waves by a narrow slit can be attributed to theabsence of the secondary wavelets from points outside the slit. How can you explain the diffraction of light by ahair?

FLAP P6.1 Light1—1a wave phenomenonCOPYRIGHT © 1998 THE OPEN UNIVERSITY S570 V1.1
3.3 Propagating wavefronts and rays of lightBefore going on to discuss reflection and refraction we will introduce the convenient concept of a ray of light.Light rays are directed lines (i.e. they have arrowheads on them) used to show the direction in which the light ispropagating. They are drawn at right angles to propagating wavefronts. In our example of the spherical wave thelight rays are straight lines spreading radially from the source, and in the case of the plane wave they are straightparallel lines, perpendicular to the wavefronts.
In any uniform medium, rays travel in straight lines and it is very convenient to use rays to track the passage oflight through a system1—1but we must remember that we are dealing with a wave phenomenon, that the raysrepresent propagating wavefronts and that diffraction will spread the beam when restrictions (apertures orobstacles) are involved. Apertures are always involved to some extent since we can never work with an infinitewavefront! Therefore, we should really draw our rays not as sharp lines but as ‘bands’ of increasing width, as thewavefronts spread out. In fact this is never done on ray diagrams and the convention is rather that ray diagramsare not used where diffraction effects are significant. Fortunately there are many cases where the aperturesinvolved are much greater than the wavelength, so the diffraction effects are insignificant and we can safelyrepresent the passage of light by rays. The range of topics that can be adequately treated by methods based onthe use of rays constitutes the field of geometrical optics, and the territory where rays are inadequate and afuller version of the wave model must be used constitutes physical optics.
FLAP P6.1 Light1—1a wave phenomenonCOPYRIGHT © 1998 THE OPEN UNIVERSITY S570 V1.1
incidentray
normal
reflectedray
material 1
material 2
refractedray
θi θR
θr
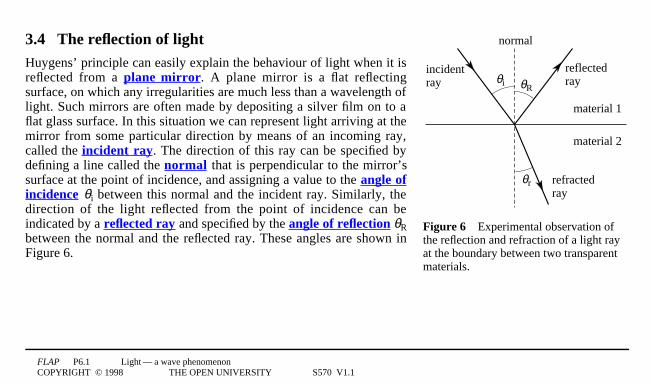
Figure 63Experimental observation ofthe reflection and refraction of a light rayat the boundary between two transparentmaterials.
3.4 The reflection of lightHuygens’ principle can easily explain the behaviour of light when it isreflected from a plane mirror. A plane mirror is a flat reflectingsurface, on which any irregularities are much less than a wavelength oflight. Such mirrors are often made by depositing a silver film on to aflat glass surface. In this situation we can represent light arriving at themirror from some particular direction by means of an incoming ray,called the incident ray. The direction of this ray can be specified bydefining a line called the normal that is perpendicular to the mirror’ssurface at the point of incidence, and assigning a value to the angle ofincidence θi between this normal and the incident ray. Similarly, thedirection of the light reflected from the point of incidence can beindicated by a reflected ray and specified by the angle of reflection θRbetween the normal and the reflected ray. These angles are shown inFigure 6.

FLAP P6.1 Light1—1a wave phenomenonCOPYRIGHT © 1998 THE OPEN UNIVERSITY S570 V1.1
incidentray
normal
reflectedray
material 1
material 2
refractedray
θi θR
θr
Figure 63Experimental observation ofthe reflection and refraction of a light rayat the boundary between two transparentmaterials.
Experiments support the following:
Law of reflection
o The reflected ray, the incident ray and the normal all lie in the same plane.
o The angle of reflection is always equal to the angle of incidence: θR = θi

FLAP P6.1 Light1—1a wave phenomenonCOPYRIGHT © 1998 THE OPEN UNIVERSITY S570 V1.1
Nθ i θ R
normalto mirror
C'A
C
B
A'
B '
Figure 53The reflection of a wavefront. Note that theangles marked θi and θR are not themselves the angles ofincidence and reflection, but they are equal to thoseangles.
The Huygens’ construction that accounts for this is shownin Figure 5. The line ABC is part of an extensive planewavefront (where AC >> λ ), moving in the directionshown by the arrows and beginning to arrive at the planemirror at an angle of incidence θi. Point A on thewavefront is just arriving at the mirror. Points on thewavefront corresponding to B and C will arrive later, atpoints N and C′ on the mirror. Secondary waveletsproduced at the same time from points A, B and C willexpand outwards from these points, all travelling at thesame speed. In the time taken for the wavelet produced atC to reach the mirror at point C′ , the wavelet from A willhave covered an equal distance and will be arriving at A′while that from B will be arriving at B′ having alsocovered the same distance (BN + NB′).The resulting wavefront, after reflection at the mirror, will be the line A ′B′C′ that is tangential to each of thewavelets. Now, the right-angled triangles ACC′ and AA′C′ are identical, so the lines ABC and A′B′C′ make thesame angle with the mirror surface. Since the light rays are perpendicular to the wavefronts it follows that theseangles are also equal to the angles of incidence θi and reflection θR, respectively, so these two angles areequal1—1in accord with observation.

FLAP P6.1 Light1—1a wave phenomenonCOPYRIGHT © 1998 THE OPEN UNIVERSITY S570 V1.1
Nθ i θ R
normalto mirror
C'A
C
B
A'
B '
Figure 53The reflection of a wavefront. Note that theangles marked θi and θR are not themselves the angles ofincidence and reflection, but they are equal to thoseangles.
Question T4
Using a ruler, compasses and protractor construct adiagram similar to Figure 5 but with the angle
CA ′C = 20°.
What is the angle of reflection on your figure?3❏

FLAP P6.1 Light1—1a wave phenomenonCOPYRIGHT © 1998 THE OPEN UNIVERSITY S570 V1.1
incidentray
normal
reflectedray
material 1
material 2
refractedray
θi θR
θr
Figure 63Experimental observation ofthe reflection and refraction of a light rayat the boundary between two transparentmaterials.
3.5 The refraction of lightIf you place a pencil into a glass of water, you will observe that thepencil appears to be bent at the surface of the water. This effect is dueto the refraction of light rays at the air–water surface. In general, whena light ray passes from one transparent material into another there willbe both a reflected ray and a refracted ray which passes into thesecond material, having been bent or refracted at the surface. This isillustrated in Figure 6. The direction of the refracted ray can bespecified by the angle of refraction θr between the refracted ray andthe normal drawn in the second material.

FLAP P6.1 Light1—1a wave phenomenonCOPYRIGHT © 1998 THE OPEN UNIVERSITY S570 V1.1
incidentray
normal
reflectedray
material 1
material 2
refractedray
θi θR
θr
Figure 63Experimental observation ofthe reflection and refraction of a light rayat the boundary between two transparentmaterials.
Experiments support the following:
Law of refraction
o The incident ray, the refracted ray and the normal all liein the same plane.
o The angle of incidence and the angle of refraction arerelated by
sin θ i
sin θ r= constant ☞ (3)
where the constant depends on the two materials involvedand on the wavelength of the light.

FLAP P6.1 Light1—1a wave phenomenonCOPYRIGHT © 1998 THE OPEN UNIVERSITY S570 V1.1
θ iθ rA
B
A'
C
C'B''
B'v t2
v t1
material 1
wave speed =v 1
material 2
wave speed =v2
Figure 73The refraction of a wavefront (reflection not shown).Note that the angles marked θi and θr are not themselves theangles of incidence and refraction, but they are equal to thoseangles.
We can use the Huygens’ construction to explainthese observations. The argument follows closelyalong the lines used in Subsection 3.4.
In Figure 7 ABC is part of an extensive planewavefront (where AC >> 1λ), moving in thedirection shown by the arrows and beginning toarrive at the boundary between the two materials.It is now possible for light to travel in eithermaterial, though if the materials have differentrefractive indices, µ1 and µ2 say, the light mustchange speed as it moves from one material tothe other. Let us suppose that in material 1 thespeed of light is v1 = c/µ1 and that in material 2 itis v2 = c /µ2. Now, consider what happens tosecondary wavelets emitted simultaneously frompoints A, B and C on the incident wavefront.

FLAP P6.1 Light1—1a wave phenomenonCOPYRIGHT © 1998 THE OPEN UNIVERSITY S570 V1.1
θ iθ rA
B
A'
C
C'B''
B'v t2
v t1
material 1
wave speed =v 1
material 2
wave speed =v2
Figure 73The refraction of a wavefront (reflection not shown).Note that the angles marked θi and θr are not themselves theangles of incidence and refraction, but they are equal to thoseangles.
In the time taken for the wavelet from C to travelat speed v1 through material 1 to the point C′, thewavelet from A will have travelled at speed v2through material 2 to A′ and the wavelet from Bwill have travelled first with speed v1 to B′′ andthen at speed v2 to B′. (Figure 7 shows this forthe situation where v2 < v1, (i.e. µ2 > µ1) but wecould equally well have dealt with the case wherev2 > v1.) As usual the propagated wavefront istangential to the secondary wavelets, so in thiscase it is the line A′B′C′. As you can see this newwavefront is not parallel to the original wavefrontABC1—1the waves have been refracted. We canfind the relationship between the angles θi and θrby equating the time required for the wavelet inmaterial 1 to cover the distance CC′ with the timerequired for the wavelet in material 2 to cover thedistance AA′,

FLAP P6.1 Light1—1a wave phenomenonCOPYRIGHT © 1998 THE OPEN UNIVERSITY S570 V1.1
θ iθ rA
B
A'
C
C'B''
B'v t2
v t1
material 1
wave speed =v 1
material 2
wave speed =v2
Figure 73The refraction of a wavefront (reflection not shown).Note that the angles marked θi and θr are not themselves the anglesof incidence and refraction, but they are equal to those angles.
recalling that the wavelets travel at differentspeeds we obtain
C ′Cc µ1
= A ′Ac µ2
☞
i.e.C ′CA ′A
= µ2
µ1
The triangles ACC′ and AA′C′ are both right-
angle triangles, where the angle CA ′C = θi and
′A ′C A = θ r, so we can use the trigonometricrelations
sin1θi = CC′/AC′3sin1θr = AA′/AC′3and
3 sin1θi /sin1θr = CC′/AA′3to give
sin θ i
sin θ r= µ2
µ1(4)

FLAP P6.1 Light1—1a wave phenomenonCOPYRIGHT © 1998 THE OPEN UNIVERSITY S570 V1.1
sin θ i
sin θ r= µ2
µ1(Eqn 4)
Equation 4 is now known as Snell’s law. It shows that the constant in Equation 3
sin θ i
sin θ r= constant (Eqn 3)
is just the ratio of the refractive indices of the two materials and thus explains why it depends on the materialsthemselves and on the wavelength of the light. This association of µ with refraction also explains why µ is calledthe refractive index. ☞

FLAP P6.1 Light1—1a wave phenomenonCOPYRIGHT © 1998 THE OPEN UNIVERSITY S570 V1.1
θ iθ rA
B
A'
C
C'B''
B'v t2
v t1
material 1
wave speed =v 1
material 2
wave speed =v2
Figure 73The refraction of a wavefront (reflection not shown).Note that the angles marked θi and θr are not themselves theangles of incidence and refraction, but they are equal to thoseangles.
Question T5
Using a ruler, compasses and protractor,construct a diagram similar to Figure 7 but withθi = 20° (take µ1 = 1.0 and µ2 = 1.5). Find θr andcompare it with the theoretical prediction fromSnell’s law.3❏

FLAP P6.1 Light1—1a wave phenomenonCOPYRIGHT © 1998 THE OPEN UNIVERSITY S570 V1.1
It is interesting to contrast the account of refraction given by Huygens’ wave model of light with that ofNewton’s particle model. The particle model had to claim that particles of light were ‘attracted’ by the higherrefractive index material so as to bend them towards the normal. The mechanism of this attraction was unknownbut the consequence of the attraction would be an increase in the speed of light in the higher refractive indexmaterial. The wave model made exactly the opposite prediction, that the speed of light is reduced in the higherrefractive index material. It is difficult to measure the speed of light and this issue was not settled until themid-19th century, when the French physicist Jean Foucault (1819–1868) made a precise measurement of thespeed of light in a vacuum and also in various transparent materials (see Table 1). This confirmed the predictionof the wave theory.
The variation of refractive index with wavelength leads to the phenomenon of dispersion, that is the variation ofthe speed of light in a transparent material with wavelength. Its occurrence implies that the angle through whicha given incident ray is refracted by a particular material will generally depend on the wavelength. This effectwas first used systematically by Isaac Newton when he employed a triangular glass prism to study the spectrumof colours which make up white light from the Sun. Sometimes the term dispersion is specifically used todescribe the separation of a beam of light into its constituent wavelengths when it is refracted by a materialwhose refractive index depends on wavelength.

FLAP P6.1 Light1—1a wave phenomenonCOPYRIGHT © 1998 THE OPEN UNIVERSITY S570 V1.1
4 Illumination and the inverse square law
beam A
Figure 83An idealized uniform parallelbeam of light passing through area A of aplane perpendicular to the direction ofpropagation.
4.1 IntensityAs the warmth of sunlight proves, light can carry energy through space.The general study of the transfer of energy by light is very complicated;in this section we describe some simple cases and discuss the way inwhich the wave model accounts for the phenomenon of energy transferby light.
Figure 8 shows a plane drawn perpendicular to an idealized uniformparallel beam of light. If the rate at which the beam transfers energyacross the area A is denoted by P (for power) ☞ then the intensity ofthe beam passing through the plane is given by
I = P/A (5)
According to the electromagnetic wave model of light, a uniform light beam of the kind shown in Figure 8 maybe represented by a uniform plane wave, that is a plane wave in which the electric field has the sameinstantaneous magnitude E at all points on any given wavefront.

FLAP P6.1 Light1—1a wave phenomenonCOPYRIGHT © 1998 THE OPEN UNIVERSITY S570 V1.1
Remember, at any given point on the path of an electromagnetic wave the magnitude (and direction) of theelectric field changes with time, varying between zero and E01— 1the amplitude of the electric field.Now, according to the theory of electromagnetic waves, a uniform plane wave transfers energy in the directionof propagation at a rate that is proportional to the square of its electric field amplitude. Thus we may define theintensity of such a wave by
I = kE02
where k is an appropriate constant of proportionality. The form of this relationship should not come as too muchof a surprise to you since the energy of oscillating systems is often proportional to the square of the amplitude.
✦ If the above definition of the intensity of a uniform plane wave is to be consistent with the definition of theintensity of a uniform beam of light, what are suitable SI units for k?

FLAP P6.1 Light1—1a wave phenomenonCOPYRIGHT © 1998 THE OPEN UNIVERSITY S570 V1.1
beam A
Figure 83An idealized uniform parallelbeam of light passing through area A of aplane perpendicular to the direction ofpropagation.
While it is convenient to define intensity in terms of the idealizedsituation shown in Figure 8, in all real cases a beam is never perfectlyparallel nor perfectly uniform; it always diverges to some extent, and itsintensity varies over its cross section. An important practical lightsource that at least approximates the idealized case is the laser.The beam from a laser is very nearly parallel, though its intensity is notuniform over the cross section. The finite width of the beam impliesthat it must spread a little due to diffraction since it behaves as thoughdiffracted by an aperture of width equal to the diameter of the beam1—1the narrower the beam the more it spreads. A small helium–neon laser(which has a red beam) might typically radiate 11mW of power in a11mm diameter beam, the edges of which diverge from one another atan angle of only one milliradian.
Question T6
Use the figures given above to calculate the average intensity of this laser (a) at the laser itself and(b) at a distance of 1001m from the laser. In (b) you may assume that the laser acts as a point source, but with thefull divergence given above.3❏

FLAP P6.1 Light1—1a wave phenomenonCOPYRIGHT © 1998 THE OPEN UNIVERSITY S570 V1.1
4.2 The inverse square law of illuminationReal light sources produce a diverging beam for which the intensity (i.e. the rate at which energy is transferredacross a unit area perpendicular to the direction of propagation) must decrease with distance from the source.It is often important to know the intensity of a beam at its point of arrival but to predict this we need to knowhow the intensity decreases with distance from the source. For the idealized case of a perfectly parallel beam theanswer is that the intensity is independent of the distance, but such a case never occurs in practice1—1even thelaser has an intensity which decreases with distance, as you saw in Question T6.
Fortunately, we can predict how the intensity will decrease with distance for the idealized case of a point sourceradiating uniformly in all directions, producing spherical waves and spherical wavefronts. This is often a verygood approximation to real sources, particularly at distances much greater than the size of the source. ☞
Consider a point source (located in a vacuum) that consumes power P and radiates all of that power, uniformlyin all directions, at visible wavelengths. Suppose that the source is at the centre of an imaginary sphere of radiusr. The rate at which energy flows across the whole imaginary spherical surface must also be P and since thispower is spread uniformly across the surface each part of the sphere will receive the same power per unit area.

FLAP P6.1 Light1—1a wave phenomenonCOPYRIGHT © 1998 THE OPEN UNIVERSITY S570 V1.1
This power per unit area on the surface is the intensity at the surface and, since the surface area of the sphere is4πr12, it must be given by
I (r ) = P
4πr2(6)
Equation 6 shows that the intensity due to a uniformly radiating point source decreases as the inverse square ofthe distance from the source. This is known as the inverse square law of illumination. In deriving this we haverelied only on the principle of energy conservation and on the geometry of a sphere. The inverse square law alsoholds in the case of a spherical source of any size, providing it radiates uniformly in all directions and providedthe distance r (measured from the centre of the sphere) is much larger than the radius of the source.
Question T7
On a clear dark night an average person can just see the light from a 401W tungsten bulb at a distance of 301km.Estimate the minimum intensity that the human eye can detect (remember the inefficiency of the tungsten bulb).Assuming the aperture (pupil) of the eye has radius 21mm calculate the minimum power that the eye can detect.In terms of power suggest why a telescope increases the range of visibility.3❏

FLAP P6.1 Light1—1a wave phenomenonCOPYRIGHT © 1998 THE OPEN UNIVERSITY S570 V1.1
Question T8
Taking the intensity of sunlight as 1.41kW1m−2 at the Earth’s orbital distance (1.5 × 10111m), estimate the total
power transferred into space from the Sun by sunlight.3❏
As a consequence of geometry and conservation, inverse square laws arise in many areas other thanillumination. For example, gamma radiation from small radioactive sources is emitted uniformly in alldirections so the intensity of the radiation decreases as the inverse square of the distance from the source.A person standing at a distance of 101m from a source will receive a radiation dose 1% of that received by aperson 11m away, over the same time interval. (This calculation neglects the small absorption of gammaradiation by the air.) The inverse square law is the best and most reliable radiation shield we have!

FLAP P6.1 Light1—1a wave phenomenonCOPYRIGHT © 1998 THE OPEN UNIVERSITY S570 V1.1
5 Interference and the superposition principleIn Subsection 3.2 we described diffraction and explained that this strongly indicates that light travels as a wave.In this section we describe interference, which provides even clearer evidence of wave-like behaviour.
If two beams of light of equal intensity come together at a point in space, what will be the intensity at theintersection point? If the beams are thought of as streams of particles, each carrying its own small share of theenergy, the expected answer is obvious. The intensity must be twice the intensity of each beam alone, since thetotal number of particles will be equal to the sum of the numbers in each beam1— it’s as easy as ‘1 + 1 = 2’.However, experimentally it is found that under the right circumstances the resulting light intensity can beanything from zero to four times the intensity of a single beam1—1the outcome depends critically on the sourceof the two beams and is not determined by their intensities alone. This extraordinary phenomenon, firstdemonstrated by Thomas Young in 1801, is easily explained by a wave model of light but is almost impossibleto account for in terms of particles. Its discovery provided convincing evidence that light was a wavephenomenon even though many decades were to pass before Maxwell uncovered the electromagnetic nature ofthose waves.

FLAP P6.1 Light1—1a wave phenomenonCOPYRIGHT © 1998 THE OPEN UNIVERSITY S570 V1.1
5.1 The superposition principleA property which is common to all waves, and which can be used to find their combined effect, is enshrined inthe following principle.
The superposition principle
If two or more waves meet in a region of space, then at each instant of time the net disturbance they cause at
any point is given by the sum of the disturbances caused by each of the waves individually. ☞
By ‘disturbance’ we mean the change in whatever physical quantity is marking the passage of the wave.For water waves it would be the vertical displacement of the wave from the normal water level; for sound wavesit would be the change in air pressure from its undisturbed value; for light waves it would be the change in thetransverse electric and magnetic fields at each point.

FLAP P6.1 Light1—1a wave phenomenonCOPYRIGHT © 1998 THE OPEN UNIVERSITY S570 V1.1
−y max
y max
0λ 2λ 3λ
y(t)
x
resultant
(a)
Figure 9a3Superposition of two waves with both waves instep (zero phase difference or in phase)
In general, if at time t two waves individually createdisturbances y1(t) and y2(t) ☞ at a particular point thentheir superposition will create a disturbancey(t)2=2y1(t)2+2y2(t) at that point. This is illustrated inFigure 9a where two waves of equal amplitude andwavelength (shown by differently dashed curves), bothpropagating in the x-direction, are combined to form aresultant (shown by a solid line). In Figure 9a thewaves being combined are exactly in step (or in phase)and, in accordance with the superposition principle,their resultant causes twice the disturbance of theindividual waves. Note in particular that the amplitudeymax of the resultant is twice the amplitude of each ofthe original waves.
FLAP P6.1 Light1—1a wave phenomenonCOPYRIGHT © 1998 THE OPEN UNIVERSITY S570 V1.1
y(t)
x0
resultant
−y max
y max
0
y(t)
x
resultant
(b)
(c)
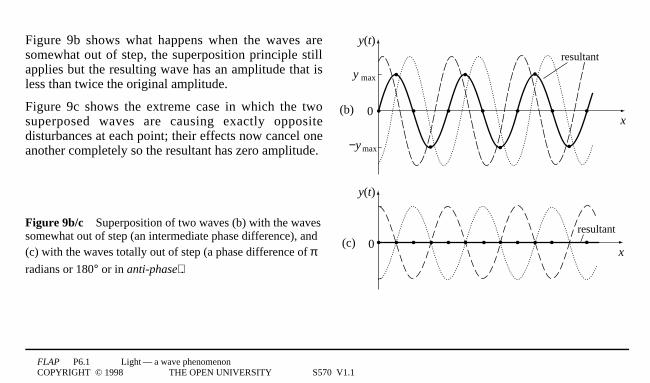
Figure 9b shows what happens when the waves aresomewhat out of step, the superposition principle stillapplies but the resulting wave has an amplitude that isless than twice the original amplitude.
Figure 9c shows the extreme case in which the twosuperposed waves are causing exactly oppositedisturbances at each point; their effects now cancel oneanother completely so the resultant has zero amplitude.
Figure 9b/c3Superposition of two waves (b) with the wavessomewhat out of step (an intermediate phase difference), and(c) with the waves totally out of step (a phase difference of πradians or 180° or in anti-phase).

FLAP P6.1 Light1—1a wave phenomenonCOPYRIGHT © 1998 THE OPEN UNIVERSITY S570 V1.1
−y max
y max
0λ 2λ 3λ
y(t)
x
resultant
(a)
Figure 9a3Superposition of two waves (a) with bothwaves in step (zero phase difference or in phase).
The key point to note in this case is that the resultant ineach part of Figure 9 has an amplitude that depends onthe extent to which the waves being combined are out ofstep. This latter concept can be expressed quantitativelyin terms of the phase difference φ between the waves.Phase difference is usually quoted as an angle, either indegrees (0 to 360) or radians (0 to 2π), and indicates thefraction of a wavelength (or period) by which the wavesare out of step. For example, if at some particularinstant two waves of identical wavelength that occupythe same region of space both cause their maximumdisturbance at the same place (as in Figure 9a) then thephase difference between them is zero and we say theyare in phase.

FLAP P6.1 Light1—1a wave phenomenonCOPYRIGHT © 1998 THE OPEN UNIVERSITY S570 V1.1
y(t)
x0
resultant(c)
Figure 9c3Superposition of two waves (c) with thewaves totally out of step (a phase difference of π radians
or 180° or in anti-phase).
If on the other hand the peaks of one wave are separatedfrom those of the other wave by half a wavelength (as inFigure 9c) the phase difference is π radians or 180° andthe waves are said to be totally out of phase or in anti-phase. Any other fraction of a wavelength separating thepeaks would be described by the corresponding fractionof 2π radians or 360°.

FLAP P6.1 Light1—1a wave phenomenonCOPYRIGHT © 1998 THE OPEN UNIVERSITY S570 V1.1
−y max
y max
0
y(t)
x
resultant
(b)
Figure 9b3Superposition of two waves with the wavessomewhat out of step (an intermediate phase difference).
✦ Estimate the phase difference φ between the twowaves being combined in Figure 9b.
When dealing with waves it is important to rememberthat the disturbances they cause vary from place toplace and from one moment to the next. Thus, althoughwe have just been discussing the phase differencebetween two waves at some particular instant, wemight equally well have chosen to discuss thedifference in phase between the oscillations that thewaves caused at some particular point (or even at a pairof different points). If so, the phase difference betweenthe waves would correspond to a fraction of a periodrather than a fraction of a wavelength, but the essentialidea would remain the same. It is hard tooveremphasize the importance of realizing that wavesinvolve changes in time and space and that along thepath of a wave there is an oscillation taking place atevery point.

FLAP P6.1 Light1—1a wave phenomenonCOPYRIGHT © 1998 THE OPEN UNIVERSITY S570 V1.1
Mathematically, if at some particular point ☞ the oscillations caused by two different waves with the samewavelength can be described by expressions of the form y1(t)2=2A1sin1(ω1t) and y2(t)2=2B1sin1(ωt2+2φ) where A, B,ω, and φ are constants and t represents time, then the phase difference between those waves is φ.
The term constructive interference is used to describe the condition in which two waves combine to produce aresultant with an amplitude which exceeds that of either of the original waves; fully constructive interference iswhen the waves are in phase and the amplitude of the resultant is the sum of the amplitudes of the combinedwaves. Destructive interference describes the condition in which two waves combine to produce a resultantwith an amplitude which is less than that of either of the original waves; fully destructive interference is whenthe waves are totally out of phase and the amplitude of the resultant wave is the modulus of the difference in theamplitudes of the individual waves. ☞
In all cases of interference, the intensity of the resultant is given by the square of its amplitude(see Subsection 4.1). It follows that this intensity is not generally equal to the sum of the intensities of the twoindividual waves.
FLAP P6.1 Light1—1a wave phenomenonCOPYRIGHT © 1998 THE OPEN UNIVERSITY S570 V1.1
−y max
y max
0λ 2λ 3λ
y(t)
x
resultant
(a)
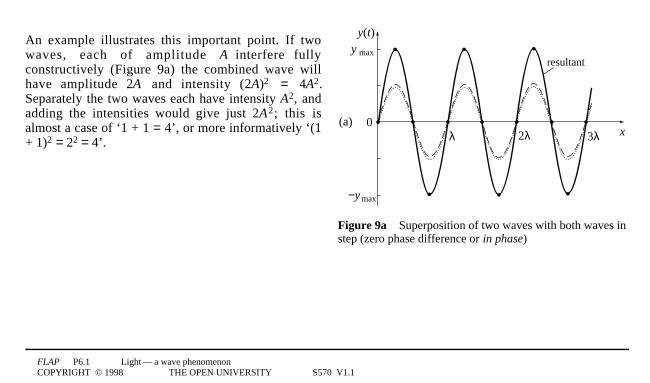
Figure 9a3Superposition of two waves with both waves instep (zero phase difference or in phase)
An example illustrates this important point. If twowaves, each of amplitude A interfere fullyconstructively (Figure 9a) the combined wave willhave amplitude 2A and intensity (2A)2 = 4A2.Separately the two waves each have intensity A2, andadding the intensities would give just 2A2; this isalmost a case of ‘1 + 1 = 4’, or more informatively ‘(1+ 1)2 = 22 = 4’.

FLAP P6.1 Light1—1a wave phenomenonCOPYRIGHT © 1998 THE OPEN UNIVERSITY S570 V1.1
y(t)
x0
resultant(c)
Figure 9c3Superposition of two waves with the wavestotally out of step (a phase difference of π radians or 180°or in anti-phase).
More striking still is the case of two waves, each ofamplitude A, interfering fully destructively (Figure 9c).Here the superposition has both amplitude and intensityequal to zero. Thus, when dealing with energytransported by waves we have the possibility of twoenergy flows combining to give zero energy flow at oneplace and maximum energy flow at another!
Question T9
For the more general case, where the two waves of equal amplitude and wavelength interfere with a phasedifference φ, the amplitude of the resultant is 2A1cos1(φ/2).
Prove this result by taking y1(t) = A1sin1(ω1t) andy2(t) = A1sin1(ω1t + φ) and then showing that y1(t) + y2(t) = 2A1cos1(φ/2)1sin1(ω1t + φ/2). ☞3❏

FLAP P6.1 Light1—1a wave phenomenonCOPYRIGHT © 1998 THE OPEN UNIVERSITY S570 V1.1
5.2 Young’s two-slit experiment
source S1
S2
D3
D2
D1
D−1
D−2
D−3
B2
B1
B0
B−1
B−2
C
view ofscreen
dark
light
screen
We are now in a position to considerYoung’s experiment, performed firstin 1801 by Thomas Young; itremains an excellent demonstrationof interference as it highlights all theconditions necessary for interferenceeffects to be observed ☞.The schematic layout is shown inFigure 10.
Figure 103Young’s two-slit experiment.Wavefronts from a narrow source andsecondary wavelets from the double slitsS1 and S2 are shown, along with aschematic representation of theinterference fringes produced on thescreen. (Not to scale.)

FLAP P6.1 Light1—1a wave phenomenonCOPYRIGHT © 1998 THE OPEN UNIVERSITY S570 V1.1
source S1
S2
D3
D2
D1
D−1
D−2
D−3
B2
B1
B0
B−1
B−2
C
view ofscreen
dark
light
screen
Figure 103Young’s two-slit experiment. Wavefronts from a narrow source and secondary wavelets from the double slits S1and S2 are shown, along with a schematic representation of the interference fringes produced on the screen. (Not to scale.)
A narrow slit is placed in front of asource of light such as a sodium lamp(you will have seen such lamps as theyellow monochromatic street lamps)or an ordinary (white) incandescentlamp with a filter to select a singlecolour (i.e. wavelength) of light.Light from this slit illuminates adouble slit which is placed acentimetre or so from the single slit.Each of the three slits is sufficientlynarrow to act as a line of pointsources or as a line source, withdiffraction producing expandingcylindrical wavefronts (shown ascircular in the two-dimensional plot)beyond the slits.

FLAP P6.1 Light1—1a wave phenomenonCOPYRIGHT © 1998 THE OPEN UNIVERSITY S570 V1.1
source S1
S2
D3
D2
D1
D−1
D−2
D−3
B2
B1
B0
B−1
B−2
C
view ofscreen
dark
light
screen
Figure 103Young’s two-slit experiment. Wavefronts from a narrow source and secondary wavelets from the double slits S1and S2 are shown, along with a schematic representation of the interference fringes produced on the screen. (Not to scale.)
The two expanding sets ofwavefronts from the double slitoverlap on a screen, placed about ametre away, where they interfere. ☞The next subsection discusses whythis particular arrangement isadopted, but first let us consider theobservations.
The interference pattern seen on thescreen includes regions where thelight intensity is high, signifyingconstructive interference, separatedby regions where the intensity is low,where destructive interference ☞occurs. These light and dark regionstake the form of linear bands, calledinterference fringes (see Figure 10).

FLAP P6.1 Light1—1a wave phenomenonCOPYRIGHT © 1998 THE OPEN UNIVERSITY S570 V1.1
source S1
S2
D3
D2
D1
D−1
D−2
D−3
B2
B1
B0
B−1
B−2
C
view ofscreen
dark
light
screen
Figure 103Young’s two-slit experiment. Wavefronts from a narrow source and secondary wavelets from the double slits S1and S2 are shown, along with a schematic representation of the interference fringes produced on the screen. (Not to scale.)
We can use Huygens’ constructionand the principle of superposition tofollow the light through the apparatusand to explain these observations.Each wavefront from the source slitarrives at S1 and S2 simultaneously sothat these act as independent linesources emitting secondary waveletsthat are in phase. The secondarywavelets expand as semicircles andthe net wave disturbance at any pointon the screen is calculated by addingthe contributions from S1 and S2 .The intensity at that point is thencalculated from the square of theamplitude of the resultantdisturbance.

FLAP P6.1 Light1—1a wave phenomenonCOPYRIGHT © 1998 THE OPEN UNIVERSITY S570 V1.1
source S1
S2
D3
D2
D1
D−1
D−2
D−3
B2
B1
B0
B−1
B−2
C
view ofscreen
dark
light
screen
Figure 103Young’s two-slit experiment. Wavefronts from a narrow source and secondary wavelets from the double slits S1and S2 are shown, along with a schematic representation of the interference fringes produced on the screen. (Not to scale.)
Consider Figure 10 and look first atwhat happens at position B0 on thescreen. Wavefronts leaving S1 and S2simultaneously always arrive at B0 atthe same time so they are still inphase and there is fully constructiveinterference with an amplitude whichis double that from a single slit; thisproduces a bright fringe with anintensity four times that from eitherslit alone.Similar situations exist at points B1,B−1 , B2 and B−2 where the twowavelets still arrive in phase despitethe fact that the wave from one slithas travelled an additional distance ofone or two complete wavelengthsrelative to that from the other slit.

FLAP P6.1 Light1—1a wave phenomenonCOPYRIGHT © 1998 THE OPEN UNIVERSITY S570 V1.1
source S1
S2
D3
D2
D1
D−1
D−2
D−3
B2
B1
B0
B−1
B−2
C
view ofscreen
dark
light
screen
Figure 103Young’s two-slit experiment. Wavefronts from a narrow source and secondary wavelets from the double slits S1and S2 are shown, along with a schematic representation of the interference fringes produced on the screen. (Not to scale.)
The difference in the distances fromeach slit to any point on the screen iscalled the path difference.An additional path difference of oneor more complete wavelengthsbetween the two wavelets arriving atB1, B−1, B2 and B−2 corresponds to anextra phase difference equal to somemultiple of 2π, and this will not harmthe fully constructive interferencethat occurs at each of those points.(This can also be seen in Figure 9awhere it is impossible to tell whetherone wave leads the other by zero,one, two or several wholewavelengths.)

FLAP P6.1 Light1—1a wave phenomenonCOPYRIGHT © 1998 THE OPEN UNIVERSITY S570 V1.1
source S1
S2
D3
D2
D1
D−1
D−2
D−3
B2
B1
B0
B−1
B−2
C
view ofscreen
dark
light
screen
Figure 103Young’s two-slit experiment. Wavefronts from a narrow source and secondary wavelets from the double slits S1and S2 are shown, along with a schematic representation of the interference fringes produced on the screen. (Not to scale.)
If we ignore the tiny difference inamplitude arising from the slightlydifferent distances from the slits, theintensity of the light at B1, B−1, B2and B−2 will also be four times theintensity due to each slit acting alone.
Now consider what happens atpositions D1, D−1, D2 and D−2 on thescreen. D1 and D−1 correspond topoints on the screen for which thereis a path difference from the slits ofone-half wavelength and so thewavelets from each slit arrive totallyout of phase at the screen, interferingdestructively to give zero intensityand a dark fringe.

FLAP P6.1 Light1—1a wave phenomenonCOPYRIGHT © 1998 THE OPEN UNIVERSITY S570 V1.1
source S1
S2
D3
D2
D1
D−1
D−2
D−3
B2
B1
B0
B−1
B−2
C
view ofscreen
dark
light
screen
Figure 103Young’s two-slit experiment. Wavefronts from a narrow source and secondary wavelets from the double slits S1and S2 are shown, along with a schematic representation of the interference fringes produced on the screen. (Not to scale.)
Dark fringes are also produced at D2and D−2, where the path difference isone and a half wavelengths.At position C the situation isintermediate, where there is apartially constructive interference ofthe two waves.

FLAP P6.1 Light1—1a wave phenomenonCOPYRIGHT © 1998 THE OPEN UNIVERSITY S570 V1.1
S1
S2
d θθ
D
O
Pscreen
N
Figure 113The path lengths from theslits to a distant screen.
It is straightforward to calculate the positions on the screen where fullyconstructive and fully destructive interference take place. In Figure 11the path lengths from the two slits to a point P on the screen are shown.☞ The distance D is much greater than the slit separation d so that theangle θ from the ‘straight-through’ direction to point P is very small.Under these conditions the two paths S1P and S2P are essentiallyparallel and are at the same small angle, θ, to the straight-throughdirection.
For fully constructive interference the path difference must be anintegral number of wavelengths, nλ, where n is an integer, so
S2P − S1P = NS2 = nλ 3with n = 0, ±1, ±2, ±3, …
For fully destructive interference the path difference is
S2P − S1P = NS2 = (n + 1/2)λ 3with n = 0, ±1, ±2, ±3, …
Look at the right-angled triangle S1NS2. The angle S2S1N also equals θ so that NS2 = d sin1θ.

FLAP P6.1 Light1—1a wave phenomenonCOPYRIGHT © 1998 THE OPEN UNIVERSITY S570 V1.1
S1
S2
d θθ
D
O
Pscreen
N
Figure 113The path lengths from theslits to a distant screen.
The condition for fully constructive interference then becomes:
d1sin1θ = nλ3with n = 0, ±1, ±2, ±3, … (7)
and the condition for fully destructive interference becomes:
d1sin1θ = (n + 1/2)λ3with n = 0, ±1, ±2, ±3, … (8)
From Figure 11 the distance OP is given by OP = D1tan1θ .
Since θ is small, sin1θ1 ≈ tan1θ ≈ θ = OP/D and the condition for brightfringes is therefore
OP = Dθ = nDλ/d3with n = 0, ±1, ±2, ±3, …
The condition for dark fringes is
OP = (n +1/2)Dλ/d3with n = 0, ±1, ±2, ±3, …
The whole number n determines the order of interference for the bright fringes.

FLAP P6.1 Light1—1a wave phenomenonCOPYRIGHT © 1998 THE OPEN UNIVERSITY S570 V1.1
Equation 7
d1sin1θ = nλ3with n = 0, ±1, ±2, ±3, … (Eqn 7)
has n = 0 for θ = 0, the zero order or ‘straight-through’ intensity maximum. Similarly n = ±1 defines the first
order maxima, n = ±2 the second order maxima, and so on. ☞
In some situations it is necessary to take into account the refractive index, µ, of the material through which lightpasses. The conditions for constructive/destructive interference arises from the path difference, expressed interms of the wavelength in the material and this will generally differ from the wavelength in a vacuum by afactor of the refractive index, as we saw in Subsection 2.3:
λmaterial = λvacuum/µ (Eqn 2)
Interference conditions in a material can be expressed in terms of the optical path length in the material, andthe wavelength in a vacuum. The optical path length is defined as
optical path length = µ × geometrical path length (9)
The next question should help to make clear the value of this concept.

FLAP P6.1 Light1—1a wave phenomenonCOPYRIGHT © 1998 THE OPEN UNIVERSITY S570 V1.1
Question T10
The space between the slits and the screen in a Young’s two-slit experiment is filled with glass of refractiveindex µ. Show that the angles of the interference maxima are given by sin1θ = nλ/µd.3❏
5.3 Coherence1—1a condition necessary to observe interferenceOur discussion of interference so far has ignored an important condition which is necessary to observeinterference. This condition is known as coherence and it determines how predictable the phase difference isbetween two waves. The production of an observable interference fringe requires that the conditions forconstructive or destructive interference (set by the phase relationships) should persist long enough in time topermit an observation, and extend far enough in space for the fringe to have some observable width. If the twointerfering waves were both ideal plane waves with exactly the same wavelength or frequency then perfectcoherence would be possible and knowledge of their phase difference at one point and time would ensure thatthe phase difference at any other point and time could be predicted1— the waves would have perfecttemporal coherence and spatial coherence. Unfortunately the reality for actual light sources are quite different.

FLAP P6.1 Light1—1a wave phenomenonCOPYRIGHT © 1998 THE OPEN UNIVERSITY S570 V1.1
o No source really produces light of a single frequency (i.e. monochromatic light) but rather a range ofdifferent frequencies1—1so when we superimpose these the phase differences of the waves are no longerperfectly defined. The frequency of light is so high (about 5 × 10¹⁴
1Hz) that even a tiny spread offrequencies produces a range of phase differences. In practical terms each frequency in the source producesits own independent set of fringes and when these are superimposed the visibility of all the fringes will beimpaired since each set of intensity maxima will be at a different position. (There is an exception to thiswhen all wavelengths give a minimum at the point of observation1—1then a ‘black fringe’ will be produced.)
o No source is a true point source1—1so when we collect light from different points to make a beam there willinevitably be different path lengths involved and consequently a range of phase differences. In practicalterms each point on the source produces its own independent set of fringes and when these aresuperimposed the visibility of the fringes will again be impaired. Even for a monochromatic source thevisibility of the fringes will be compromised by the size of the source.
Both of these problems contribute to the phase uncertainties in any interference experiment and the coherence islimited by the source available. A source with high coherence is said to be coherent and one with very lowcoherence is said to be incoherent. When two coherent waves add together they do so by the superpositionprinciple, their displacements are added and the resultant amplitude must be squared to give the intensity.If the waves are incoherent then the two waves act independently and the resultant intensity is just the sum of thetwo separate intensities. The reason for this is that any interference condition holds only instantaneously and theaverage over time at any point becomes the sum of the separate intensities.

FLAP P6.1 Light1—1a wave phenomenonCOPYRIGHT © 1998 THE OPEN UNIVERSITY S570 V1.1
A point monochromatic source would give perfect coherence but such a situation is unattainable. ☞Despite this, we can obtain reasonable fringes, as in Young’s experiment, by using a coloured filter to isolate anarrow frequency range (providing adequate temporal coherence) and narrow slits to restrict the source size(providing adequate spatial coherence). In this process we gain coherence at the expense of light intensity andwe must seek a compromise between these two to produce the most visible fringes.
τµ
θ i
P
point on source
eye
Figure 123Rays reflected from a thinfilm.
5.4 Interference of light reflected from thin filmsWhen light of a given wavelength from a point on a source falls on to athin film the wavefronts reflected from the top and bottom surfaces ofthe film are coherent, so if these two sets of wavefronts are thenbrought together there will be interference. It is convenient to discussthis problem in terms of the ray representation, since we are notintending to restrict the wavefronts significantly and the ray paths givethe optical path lengths, path differences and hence the phasedifferences. Figure 12 shows a ray of light of a given wavelengthleaving a point P on a source and having an angle of incidence θi to athin film of transparent material of thickness τ and refractive index µ.(If a white light source is used the discussion that follows can beapplied to each separate wavelength in the light from P.)

FLAP P6.1 Light1—1a wave phenomenonCOPYRIGHT © 1998 THE OPEN UNIVERSITY S570 V1.1
τµ
θ i
P
point on source
eye
Figure 123Rays reflected from a thinfilm.
τ
θ i
θrθr
θ i
CA
D
B
Figure 133The details of thereflection and refraction at the thinfilm.
The ray arriving at the film ispartially reflected at the top andbottom surfaces of the film toproduce two parallel rays whichcan be made to converge on ascreen by means of a lens.The lens of a human eye is shownto emphasize that the effects canbe viewed directly. We willassume that the film has refractiveindex µ > 1.0 and that elsewhereµ = 1.0. A soap film in air wouldbe an example.
The details of the reflection and refraction are shown in Figure 13.

FLAP P6.1 Light1—1a wave phenomenonCOPYRIGHT © 1998 THE OPEN UNIVERSITY S570 V1.1
τ
θ i
θrθr
θ i
CA
D
B
Figure 133The details of thereflection and refraction at the thinfilm.
From Equation 9
optical path length = µ × geometrical path length (Eqn 9)
the optical path difference x between the two rays reflected from the top andbottom of the film is
x = µ(AB + BC) − AD
If θr is the angle of refraction and τ is the film thickness, trigonometry gives☞
x = 2µτ1cos1θr (10)
You might expect that the condition for constructive interference, when thetwo waves are recombined by the lens, is x = nλ; but this is wrong! It turns out that the reflection of one of the rays from the upper surface(such as at A in Figure 13) where the refractive index increases along thedirection of propagation introduces an additional phase difference of π. (Thereflection from the lower surface, such as at B, where the refractive index isdecreasing, doesn’t produce any compensating phase difference.) ☞

FLAP P6.1 Light1—1a wave phenomenonCOPYRIGHT © 1998 THE OPEN UNIVERSITY S570 V1.1
The condition for fully constructive interference when one reflection introduces the π phase difference is then
x = (n + 1/2)λ3with n = 1, 2, 3, …
and for fully destructive interference
x = nλ3with n = 1, 2, 3, …
Substitution in Equation 10
x = 2µτ1cos1θr (Eqn 10)
then gives:
The interference conditions when one reflection introduces the π phase difference:
2µτ1cos1θr = (n + 1/2)λ for constructive interference (11)
and 2µτ1cos1θr = nλ for destructive interference (12)
If the film is illuminated by an extended source of monochromatic light then an interference pattern will be seenin the film with bright fringes wherever Equation 11 is satisfied.

FLAP P6.1 Light1—1a wave phenomenonCOPYRIGHT © 1998 THE OPEN UNIVERSITY S570 V1.1
In practice changes in film thickness τ are usually more significant than changes in the refraction angle θr, so thefringes follow contours of equal film thickness. If the monochromatic light source is replaced by an extendedsource of white light that contains many different wavelengths then what is seen will be the result of addingtogether many interference patterns and will consist of a pattern of coloured bands. This is why a soap film or anoil film on water appears coloured when viewed in daylight ☞ .
Alternatively, if a parallel beam of white light is incident then, at a fixed angle of view, the reflected lightappears white to the eye but closer examination reveals that it is deficient in those particular wavelengths whichhave suffered destructive interference from the film.
Question T11
Green light is reflected at normal incidence (θi = θr = 90°) from a film of soap solution in air. Calculate thesmallest thickness at which constructive interference takes place. (Assume λ = 5501nm and µ = 1.30)3❏

FLAP P6.1 Light1—1a wave phenomenonCOPYRIGHT © 1998 THE OPEN UNIVERSITY S570 V1.1
There are many important applications of these principles in optical technology. First, the process describedabove can be used to remove a particular wavelength by passing light through an interference filter, made byapplying a thin transparent coating to a glass base. Second, anti-reflection coatings applied to the many air–glass surfaces in a multi-component camera lens can reduce the amount of light reflected at each of thosesurfaces to well below the usual 4% of the incident intensity. This coating material has a refractive indexintermediate between glass and air; magnesium fluoride (µ = 1.38) is a common choice because of its durability.The film thickness is set to give destructive interference for light reflected from the front and back surfaces ofthe coating and there is then minimum reflected light and maximum transmitted light. In this case the reflectionsat the upper and lower surfaces of each coating occur where the refractive index is increasing and so eachreflection involves the π phase difference. Thus the relevant conditions are:
The interference conditions when both reflections (or neither) introduce the π phase difference:
2µτ1cos1θr = nλ for constructive interference (13)
and 2µτ1cos1θr = (n + 1/2)λ for destructive interference (14)
Destructive interference at normal incidence (cos1θr = 1) then requires a minimum film thickness (n = 0) givenby τ = λ/4µ. ☞

FLAP P6.1 Light1—1a wave phenomenonCOPYRIGHT © 1998 THE OPEN UNIVERSITY S570 V1.1
Question T12
Calculate the minimum thickness of a magnesium fluoride anti-reflection coating required for a camera lens.(Assume λ is about 5501nm.)3❏
Another application of thin film technology is the production of a high reflectivity mirror for a particularwavelength. This is done by coating glass with several layers and adjusting the thickness of each layer to givereinforcement of the front and back reflections. Mirrors of this type may have very many transparent layers, withalternating high and low refractive index, and can reflect more than 99% of the incident intensity at the selectedwavelength1—1far more than can be achieved by a single coating of silver on glass (which gives about 80%).

FLAP P6.1 Light1—1a wave phenomenonCOPYRIGHT © 1998 THE OPEN UNIVERSITY S570 V1.1
5.5 The diffraction gratingThe diffraction grating is a very important device which is used in the analysis of the wavelength componentsof a beam of light. It is found in all student physics laboratories and research laboratories and its performance issuperior to that of a glass prism. Rather than ‘diffraction grating’ a better name would be ‘interference grating’since it functions like Young’s slits except that it is has thousands of slits rather than two. Instead of twointerfering sources the diffraction grating is a multiple beam interference device, which produces much sharperinterference maxima than the double slit. To understand the diffraction grating we will return to the two-slitexperiment and ask what happens to the interference pattern as the number of slits is increased.

FLAP P6.1 Light1—1a wave phenomenonCOPYRIGHT © 1998 THE OPEN UNIVERSITY S570 V1.1
4 slits
16
5 slits
25
Figure 143The interferencepatterns produced by sets of 2,3, 4 and 5 equally spacednarrow slits.
Figure 14 shows the interference patterns produced by monochromatic (i.e.single wavelength) light passing through sets of 2, 3, 4 and 5 equally spacednarrow (line source) slits. You should note particularly that:o The main maxima or principal maxima occur at the same positions for any
number of slits.o The principal maxima become more intense and sharper as the number of
slits increases.o Smaller maxima or subsidiary maxima appear between the principal
maxima when there are more than two slits.o The subsidiary maxima become more numerous but relatively smaller and
less intense as the number of slits increases.
2 slits
relativeintensity
4
sinθ
9
3 slits

FLAP P6.1 Light1—1a wave phenomenonCOPYRIGHT © 1998 THE OPEN UNIVERSITY S570 V1.1
4 slits
16
5 slits
25
Figure 143The interferencepatterns produced by sets of 2,3, 4 and 5 equally spacednarrow slits.
A more detailed examination of Figure 14 or a theoretical analysis of the patternreveals two additional points, both of which play a vital part in making thediffraction grating so important:o The peak intensity of the principal maxima rises with the square of the
number of slits.o The width of the principal maxima decreases linearly with the number of
slits.
2 slits
relativeintensity
4
sinθ
9
3 slits

FLAP P6.1 Light1—1a wave phenomenonCOPYRIGHT © 1998 THE OPEN UNIVERSITY S570 V1.1
These two additional points can be justified, without too much mathematics, in the following way. From whatwas said in Subsections 5.2 and 5.4 you will know that at a point of fully constructive interference the intensitydue to the coherent super-position of waves from two slits is four times that from a single slit. It is reasonabletherefore that the coherent superposition of waves from N slits provides N2 times the intensity from one slit.The width is a little more tricky but this too can be deduced from energy considerations. The total amount ofenergy reaching the screen from N identical slits must be N times that from one slit. If we neglect all lightoutside the principal maxima and remember that these have peak intensities rising as N2 then they must narrowin proportion to N so that the product of their width and peak intensity (i.e. their area and the total energy theypass) can increase as N.

FLAP P6.1 Light1—1a wave phenomenonCOPYRIGHT © 1998 THE OPEN UNIVERSITY S570 V1.1
intensity
n = −1 n = 1
n = −2 n = 2
n = −3 n = 3
n = −4 n = 4
0
sin θ
− λd
λd
−4λd
−3λd
−2λd
2λd
3λd
4λd
Figure 153The intensity distribution from a diffraction grating with a slit separation ofabout four times the width of the slits. ☞
Figure 15 shows thesituation for a realdiffraction grating, withm o r e t h a n 1 0 0 0equispaced slits. In thisfigure the intensity isplotted on the vertical axisand sin1θ a long thehorizontal axis, where d,the grating spacing, is thedistance between thecentres of adjacent slits.The angle θ is defined asin Figure 11 for Young’sslits. With so many slits,only the principal maximaare now significant andthey are so sharp that theycan be drawn as verticallines.

FLAP P6.1 Light1—1a wave phenomenonCOPYRIGHT © 1998 THE OPEN UNIVERSITY S570 V1.1
intensity
n = −1 n = 1
n = −2 n = 2
n = −3 n = 3
n = −4 n = 4
0
sin θ
− λd
λd
−4λd
−3λd
−2λd
2λd
3λd
4λd
Figure 153The intensity distribution from a diffraction grating with a slit separation ofabout four times the width of the slits. ☞
The plot of Figure 15emphasizes that Equation7 is just as valid forlocating the principalmaxima of a diffractiongrating as it was in thetwo-slit case. Regardlessof the number of slits it isstill true that at eachprincipal maximum
d1sin1θ = nλ 3with n = 0,±1, ±2, ±3, … (Eqn 7)
Though in the case of adiffraction grating theinteger n is often referredto as the order ofdiffraction rather than theorder of interference.

FLAP P6.1 Light1—1a wave phenomenonCOPYRIGHT © 1998 THE OPEN UNIVERSITY S570 V1.1
intensity
n = −1 n = 1
n = −2 n = 2
n = −3 n = 3
n = −4 n = 4
0
sin θ
− λd
λd
−4λd
−3λd
−2λd
2λd
3λd
4λd
Figure 153The intensity distribution from a diffraction grating with a slit separation ofabout four times the width of the slits. ☞
A new and perhapssurprising feature can beseen in Figure 15. Thevarious principal maximano longer have the sameintensity, as they did inFigure 14. This is becausethese slits cannot be takenas line sources. Theirwidth is about a quarter oftheir separation in thiscase. The diffraction fromthese slits is less than itwould be from ideal linesources, so less lightreaches large angles andthe principal maxima athigher values of n, have areduced intensity.

FLAP P6.1 Light1—1a wave phenomenonCOPYRIGHT © 1998 THE OPEN UNIVERSITY S570 V1.1
In practice, of course, the slits must not be too narrow if sufficient light is to be passed to see the orders! In thenext subsection we will consider the diffraction pattern from a single slit when the slit is appreciably wider thana line source, and then we can return to this point. Meanwhile, it is important to remember that although therelative intensity of the principal maxima depends on details of the slit geometry they always appear at angles θngiven by a rearrangement of Equation 7:
sin θn = nλd3with n = 0, ±1, ±2, … (15) ☞
In practice, a typical grating has several thousand slits, each just a few micrometres from its nearest neighbours.Any particular principal maximum will be very narrow and will cover a very tiny range of angles around thevalue of θn given by Equation 15. Nonetheless, that range of angles is finite and given its value we could useEquation 15 to work out the various different wavelengths that might have principal maxima within that narrowangular range. This is an interesting quantity because it corresponds to the range of wavelengths that cannot beclearly distinguished from one another at that particular principal maximum. In practice this range ofwavelengths is very small; it might well be less than 0.11nm at the first order maximum for light of wavelength5501nm. It is the narrowness of these maxima that gives the diffraction grating its great ability to separate lightwaves with only slightly different wavelengths.

FLAP P6.1 Light1—1a wave phenomenonCOPYRIGHT © 1998 THE OPEN UNIVERSITY S570 V1.1
So far we have described a diffraction grating as an array of slits which transmit light; this type is properlydescribed as a transmission diffraction grating. The essential feature of a diffraction grating is that it is adevice which imposes a periodic variation onto an incident wavefront. Producing a periodic spatial variation intransmitted intensity is just one way of achieving this. There are several other possibilities, including reflectingthe wavefront from a surface of periodic reflectivity. For example, a regular array of narrow lines etched onto amirror surface produces a reflection diffraction grating. This will produce several reflected orders ofdiffraction for any incident beam. The zero order maximum obeys the usual law of reflection, having an angle ofreflection equal to the angle of incidence, but higher order maxima may be seen on either side of this zero ordermaximum. ☞
Some diffraction gratings occur naturally. For example, the regular spacing of the atoms in a crystal is about0.11nm and the separate atomic layers in a crystal act as a very good reflection diffraction grating for X-rays,which have wavelengths in this region. There are also naturally-occurring diffraction gratings for visible light,which brings us to the peacock’s tail!

FLAP P6.1 Light1—1a wave phenomenonCOPYRIGHT © 1998 THE OPEN UNIVERSITY S570 V1.1
Question T13
The feathers of a peacock’s tail contain layers of cells in a regular pattern, repeating at intervals of about 500 1nm.This forms a natural reflection diffraction grating for light. If white light is shining at normal incidence on to thetail, show that only the green to violet part of the spectrum can appear with first order interference maxima.Explain briefly why the reflected colours change slightly as the viewing angle changes.
(Hint: Equation 15 is valid at normal incidence for a reflection grating.) 3❏
sin θn = nλd3with n = 0, ±1, ±2, … (Eqn 15)

FLAP P6.1 Light1—1a wave phenomenonCOPYRIGHT © 1998 THE OPEN UNIVERSITY S570 V1.1
5.6 Fraunhofer diffraction at a single slitFinally in this module, we consider in more detail the diffraction pattern from a single slit when the slit is widecompared with a line source. In Subsection 3.2 we showed that when light is diffracted by a single slit thediffraction increases as the slit width is reduced. We can now investigate the intensity pattern on the screen asthe slit width changes. If the slit were less than one wavelength wide then the light would be spread uniformlyover the screen, but what is the diffraction pattern from a slit of width w when w is considerably greater than λ?The following discussion shows that this topic is correctly placed here, in the section on interference.

FLAP P6.1 Light1—1a wave phenomenonCOPYRIGHT © 1998 THE OPEN UNIVERSITY S570 V1.1
θO
P
w
A
A'
B
B'
N
Figure 163Fraunhofer diffraction at asingle slit.
We can demonstrate what is called Fraunhofer diffraction at a widesingle slit by using an arrangement similar to that for Young’s two-slitexperiment (Figure 10), except that the slits S1 and S2 are replaced bythe single slit. This wide slit must be sufficiently far from the source thatit is illuminated by a plane wavefront and the screen needs to be about ametre from the wide slit. ☞ Figure 16 shows the wide slit and thescreen, although the distance to the screen has been reduced for ease ofillustration; the angle θ is actually very small.

FLAP P6.1 Light1—1a wave phenomenonCOPYRIGHT © 1998 THE OPEN UNIVERSITY S570 V1.1
intensity
−λw
λw
λw
λw
λw
2 3λ−2−3w
sin θ
Figure 173The observed intensity distribution on thescreen for Fraunhofer diffraction at a slit.
Figure 17 shows the intensity on the distant screen for theFraunhofer diffraction from a slit of width w plotted againstsin1θ. Notice the following features of this plot:
o As expected there is a central maximum, the width ofwhich increases as the wavelength increases or as theslit width decreases.
o There are several subsidiary maxima which are muchless intense and only about half as wide as the centralmaximum.
o The first minimum on either side of the centralmaximum occurs at an angle given by sin1θ = ±λ /w.
Notice that the last point is in sharp contrast with the interference pattern of a diffraction grating or a double slit,where the first maximum appears at sin1θ = ±λ /d. The reason for this difference will be apparent from theanalysis that follows.
Our aim now is to calculate the positions of all the minima in this diffraction pattern, using secondary waveletsfrom all points along the slit. The task of locating the subsidiary maxima is beyond the scope of this module,except that it is clear they are about mid-way between the adjacent minima.

FLAP P6.1 Light1—1a wave phenomenonCOPYRIGHT © 1998 THE OPEN UNIVERSITY S570 V1.1
θO
P
w
A
A'
B
B'
N
Figure 163Fraunhofer diffraction at asingle slit.
First, referring to Figure 16, consider wavelets from point A at the topedge of the slit and from point B in the centre. Following our treatmentof Young’s two-slit experiment, the path difference from these twopoints to point P on the screen is (w/2)1sinθ. Consequently, there will be(first order) fully destructive interference between these wavelets at P if
w
2sin θ = λ
23i.e. when3sin θ = λ
w
Now, this is exactly the location of the first minimum in the Fraunhoferdiffraction pattern, but so far we have considered only the waveletscoming from two of the many points within the slit. Is there any reasonto suppose that a location of fully destructive interference for these twocontributions might also be a location of fully destructive interferencefor all the contributions from within the slit? Indeed there is; the symmetry of the situation tells us thatdestructive interference must also take place at P for wavelets from any pair of points such as A′ and B′ that areseparated by w/2, and we can uniformly fill the entire slit with such pairs. Thus, every wavelet from within theslit that arrives at P interferes destructively with a wavelet from another part of the slit, and we can conclude thatthe amplitude at P is zero and hence the intensity there is also zero. This accounts for the first minimum in theFraunhofer diffraction pattern.

FLAP P6.1 Light1—1a wave phenomenonCOPYRIGHT © 1998 THE OPEN UNIVERSITY S570 V1.1
intensity
−λw
λw
λw
λw
λw
2 3λ−2−3w
sin θ
Figure 173The observed intensity distribution on thescreen for Fraunhofer diffraction at a slit.
We can also divide the aperture into quarters rather thanhalves and perform the same analysis with pairs of points adistance w/4 apart. In this case the values of sin1θ at whichfully destructive interference takes place are given by
w
4sin θ = λ
23i.e. when3sin θ = 2λ
w
dividing further into eighths, sixteenths, etc. gives thegeneral expression for intensity minima in Fraunhoferdiffraction:
sin θn = nλw3with n = 1, 2, 3, … (16)
The straight-through position, θ = 0, is always a maximum in intensity because constructive interference takesplace between wavelets from pairs of points placed symmetrically about the centre of the slit (e.g. A′ and B′).Equation 16 tells us that the minima in the diffraction pattern are equally spaced with sin1θ in units of λ /w fromthe central maxima, as is shown in Figure 17. A more complicated calculation confirms that the subsidiarymaxima are much less intense than the central maximum.

FLAP P6.1 Light1—1a wave phenomenonCOPYRIGHT © 1998 THE OPEN UNIVERSITY S570 V1.1
intensity
n = −1 n = 1
n = −2 n = 2
n = −3 n = 3
n = −4 n = 4
0
sin θ
− λd
λd
−4λd
−3λd
−2λd
2λd
3λd
4λd
Figure 153The intensity distribution from a diffraction grating with a slit separation ofabout four times the width of the slits. ☞
Question T14
If the angle θ is small,show that the positions ofthe Fraunhofer diffractionminima, on a screen placeda distance D from theaperture, are given by
OP = nλD
w3❏
Finally we can return tothe diffraction grating andto Figure 15 to explainwhy the intensity of theprincipal maxima decreasewith order as they do.

FLAP P6.1 Light1—1a wave phenomenonCOPYRIGHT © 1998 THE OPEN UNIVERSITY S570 V1.1
intensity
−λw
λw
λw
λw
λw
2 3λ−2−3w
sin θ
Figure 173The observed intensity distribution on thescreen for Fraunhofer diffraction at a slit.
Diffraction effects from finite slit widths are important in adiffraction grating because the slits have width, w, althoughthis must be smaller than the slit separation d. Each slitproduces an identical diffraction pattern, of the form shownin Figure 17, which must be wider than the separation of theinterference peaks because w < d. The net effect is that thecommon single slit diffraction pattern forms an overallenvelope of intensity for the interference pattern.

FLAP P6.1 Light1—1a wave phenomenonCOPYRIGHT © 1998 THE OPEN UNIVERSITY S570 V1.1
intensity
n = −1 n = 1
n = −2 n = 2
n = −3 n = 3
n = −4 n = 4
0
sin θ
− λd
λd
−4λd
−3λd
−2λd
2λd
3λd
4λd
Figure 153The intensity distribution from a diffraction grating with a slit separation ofabout four times the width of the slits. ☞
This is shown as thedashed curve in Figure 15.The first diffractionminimum shown in Figure15 lies just beyond thefourth order interferencemaximum, confirming thatd ≈ 4w in our example.The dashed curve in Figure15 begins to rise againafter n = ±4, since a single-slit diffraction pattern hassmaller subsidiary maximabeyond the first minima oneach side.

FLAP P6.1 Light1—1a wave phenomenonCOPYRIGHT © 1998 THE OPEN UNIVERSITY S570 V1.1
6 Closing items
6.1 Module summary1 Transverse electromagnetic waves, in which mutually perpendicular electric and magnetic fields oscillate at
right angles to the direction of propagation, are able to account for many of the observed features of light.In a vacuum such waves travel at the speed of light (c = 3.00 × 10⁸
1m1s−1) and are characterized by theiramplitude and their wavelength λ or frequency f, where c = fλ. The wavelengths corresponding to light arejust a small part of the full electromagnetic spectrum.
2 An electromagnetic wave that has a unique direction associated with its electric field is said to be linearlypolarized. For such a wave the plane of polarization is the plane that contains the direction of the electricfield vector and the direction of propagation.
3 In a transparent material the speed and wavelength of light are smaller than they are in a vacuum by a factorcalled the refractive index, µ:
µ = speed of light in a vacuumspeed of light in the material
(Eqn 1)
4 Huygens’ construction predicts the behaviour of propagating wavefronts by treating each point on thewavefront as a source of secondary wavelets in accordance with Huygens’ principle.

FLAP P6.1 Light1—1a wave phenomenonCOPYRIGHT © 1998 THE OPEN UNIVERSITY S570 V1.1
5 Diffraction is the spreading of a propagating wavefront away from its original direction of propagation thatoccurs whenever the wavefront encounters an aperture or an obstacle. It is an observed property of light andits effects are especially significant when they are caused by an object whose size is comparable with thewavelength of light. When diffraction effects are insignificant the advance of the wavefront can berepresented by a ray.
6 The wave model of light can also explain the law of reflection (θi = θR) and
the law of refraction (Snell’s law) sin θ i
sin θ r= µ2
µ1(Eqn 4)
7 The intensity of a uniform beam of light is the power transferred per unit area perpendicular to the beam.The intensity of a uniform plane electromagnetic wave is proportional to the square of its electric fieldamplitude. The intensity of light from a uniformly radiating point source decreases as the inverse square ofthe distance from the source.
8 According to the superposition principle if two or more waves meet in a region of space, then at eachinstant of time the net disturbance they cause at any point is given by the sum of the disturbances caused byeach of the waves individually.

FLAP P6.1 Light1—1a wave phenomenonCOPYRIGHT © 1998 THE OPEN UNIVERSITY S570 V1.1
9 Light from a coherent source can interfere constructively or destructively. This is demonstrated by thepattern of interference fringes seen in Young’s two-slit experiment. With slits separated by distance d andmonochromatic light of wavelength λ, the directions of maximum intensity at order n are given by
sin θn = nλd
(Eqn 15)
10 Interference is responsible for the colours seen in reflection from thin transparent films such as soap or oilfilms. It also has many practical applications, such as its use in low-reflectivity coatings for lenses and high-reflectivity coatings for mirrors.
11 The interference of monochromatic light from a diffraction grating results in sharply defined intensitymaxima at angles that are again given by Equation 15. Diffraction gratings are important in themeasurement of wavelength.
12 The Fraunhofer diffraction pattern from a single slit of width w consists of a central intensity maximum,with several minima on either side at angles given by
sin θn = nλw
(Eqn 16)

FLAP P6.1 Light1—1a wave phenomenonCOPYRIGHT © 1998 THE OPEN UNIVERSITY S570 V1.1
6.2 AchievementsWhen you have completed this module, you should be able to:
A1 Define the terms that are emboldened and flagged in the margins of the module.
A2 Draw a sketch indicating the instantaneous electric and magnetic fields in a linearly polarized plane waveand discuss the way in which the properties of such waves relate to properties of light such as speed ofpropagation, colour and intensity.
A3 State Huygens’ principle (in your own words), relate it to the electromagnetic wave model of light, and useit to explain the propagation, diffraction and interference of light, including the laws of reflection andrefraction.
A4 Recall and use the laws of reflection and refraction (Snell’s law).
A5 Relate the intensity of a uniform parallel light beam to the power of its source and, for a point-like source,derive, interpret and use the inverse square law of illumination.
A6 Describe Young’s two-slit experiment and the pattern of interference fringes that it produces. Use thesuperposition principle and the wave model of light to account for the origin of the fringes and to deriveformulae relating the angles of interference maxima and minima to the slit separation and the wavelength.

FLAP P6.1 Light1—1a wave phenomenonCOPYRIGHT © 1998 THE OPEN UNIVERSITY S570 V1.1
A7 Explain the meaning of coherence and its significance in the observation of interference.
A8 Describe and explain how interference can be observed in reflection from thin transparent films. Derive anduse the formulae which give the conditions for constructive or destructive interference in terms of the angleof refraction, the film thickness and the wavelength (given the expression for the optical path difference).
A9 Explain the physical principles of anti-reflection coatings and high-reflectivity coatings, and be able tocalculate the thickness required for these, given the wavelength and the relevant refractive indices.
A10 Describe and explain the principles of the diffraction grating, as used in transmission and in reflection.
A11 Recall and use the diffraction grating relation between the angles of the interference maxima, thewavelength and the slit separation.
A12 Describe Fraunhofer diffraction at a single slit and recall how the angles of the minima depend on thewavelength and on the slit width.
Study comment You may now wish to take the Exit test for this module which tests these Achievements.If you prefer to study the module further before taking this test then return to the Module contents to review some of thetopics.

FLAP P6.1 Light1—1a wave phenomenonCOPYRIGHT © 1998 THE OPEN UNIVERSITY S570 V1.1
6.3 Exit test
Study comment Having completed this module, you should be able to answer the following questions each of which testsone or more of the Achievements.
Question E1
(A2)3An electromagnetic wave of wavelength 5501nm is travelling along the z-axis with its electric field ofamplitude 0.101V1m−1 oscillating along the x-axis. What is the frequency of the wave? What is the direction ofpolarization? What is the amplitude and direction of the magnetic field?
Question E2
(A3 and A4)3Make sketches showing how Huygens’ secondary wavelets predict (a) diffraction at a slit, and (b)Snell’s law of refraction.

FLAP P6.1 Light1—1a wave phenomenonCOPYRIGHT © 1998 THE OPEN UNIVERSITY S570 V1.1
Question E3
(A5)3Estimate the distance from Earth of the furthest star which is visible to the unaided eye. (Make the drasticassumptions that the power of the Sun (4 × 1026 W) is typical of all stars, that the minimum intensity detectableby the human eye is 7.1 × 10–110
1W1m–2 and that there is no absorption of energy in space!)
Question E4
(A5) The intensity of light from a small source decreases as the inverse square of the distance from the source.What does this imply about how the amplitudes of the oscillating electric and magnetic fields change withdistance from the source?

FLAP P6.1 Light1—1a wave phenomenonCOPYRIGHT © 1998 THE OPEN UNIVERSITY S570 V1.1
Question E5
(A6)3Green light of wavelength 546.11nm is used in a Young’s two-slit experiment where the slits are 1.5 mmapart.(a) Find the angles of the first and second order interference maxima.(b) If the screen is placed 21m from the slits, find the distance on the screen between the second order minimum
and the zero order maximum.(c) What colour of light should be used so that its second order maximum appears at the same angle as the
second order minimum for the green light?
Question E6
(A7)3What is meant by ‘a coherent light source’? Why does the production of interference fringes requirecoherence? How is coherence achieved (a) in a Young’s two-slit apparatus? (b) in thin film interference?

FLAP P6.1 Light1—1a wave phenomenonCOPYRIGHT © 1998 THE OPEN UNIVERSITY S570 V1.1
Question E7
(A8 and A9)3A film of oil of refractive index µ = 1.40 covers the surface of a pool of water (µ = 1.33) to adepth of 3001nm. Find the angles (θr) at which blue (λ = 4501nm), green (λ = 5501nm) and red (λ = 6501nm) lightare reflected with maximum intensity in first order (i.e. n = 1).
Question E8
(A10 and A11)3A diffraction grating has 121000 slits ruled regularly on to a glass plate 21cm wide. Find theangles of the first and second order interference maxima for the two yellow wavelengths λ = 589.01nm andλ = 589.61nm (sodium light)1—1remember to use four significant figures throughout your calculation.

FLAP P6.1 Light1—1a wave phenomenonCOPYRIGHT © 1998 THE OPEN UNIVERSITY S570 V1.1
Question E9
(A12)3An aperture of width w is illuminated by plane waves of wavelength 589.01nm. Find the three values ofw such that the first diffraction minima appear at 20°, 40° and 60°, respectively. At each of the three calculatedvalues of w find the angles of the first diffraction minimum for green light of wavelength 546.11nm.
Study comment This is the final Exit test question. When you have completed the Exit test go back to Subsection 1.2 andtry the Fast track questions if you have not already done so.
If you have completed both the Fast track questions and the Exit test, then you have finished the module and may leave ithere.