flood-inundation maps for the saddle river from rochelle ... · flood-inundation maps for the...
TRANSCRIPT

U.S. Department of the InteriorU.S. Geological Survey
Scientific Investigations Map 3221
Prepared in cooperation with the New Jersey Department of Environmental Protection
Flood-Inundation Maps for the Saddle River from Rochelle Park to Lodi, New Jersey, 2012
Pamphlet to accompany

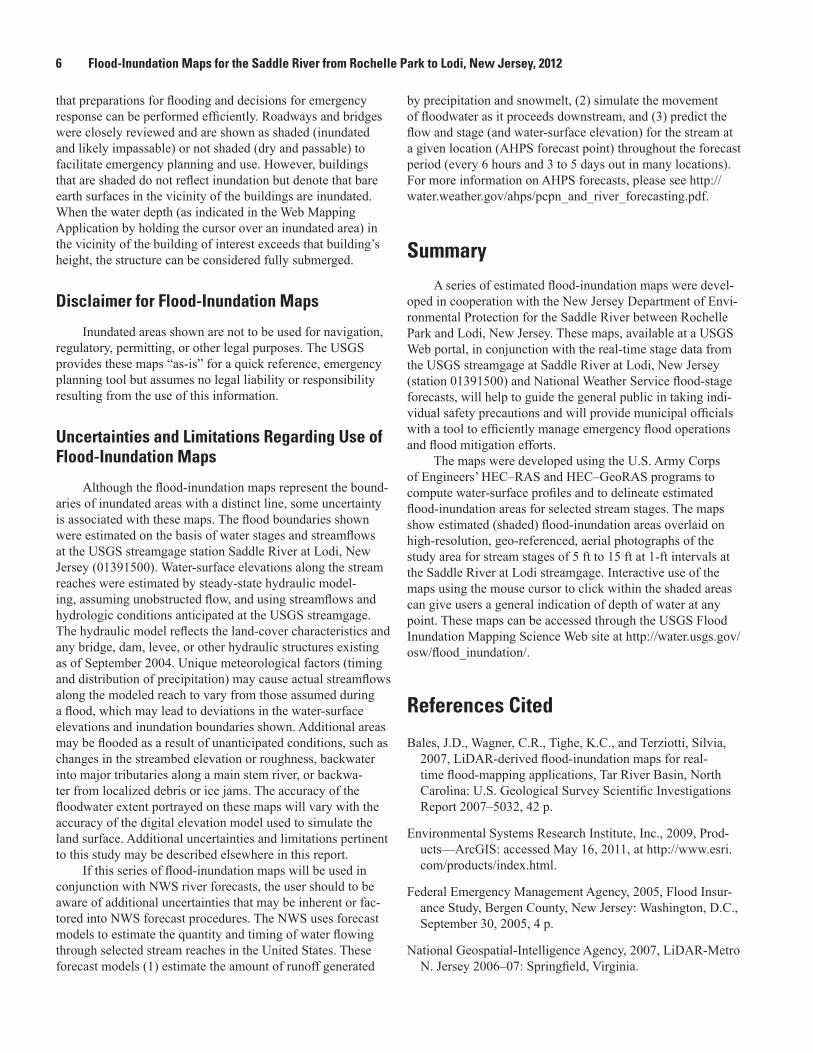
Cover. The August 2011 flood event on the Saddle River in Lodi, New Jersey. (Photograph by John J. Trainor, U.S. Geological Survey)

Flood-Inundation Maps for the Saddle River from Rochelle Park to Lodi, New Jersey, 2012
By Heidi L. Hoppe and Kara M. Watson
Prepared in cooperation with New Jersey Department of Environmental Protection
Scientific Investigations Map 3221
U.S. Department of the InteriorU.S. Geological Survey

U.S. Department of the InteriorKEN SALAZAR, Secretary
U.S. Geological SurveyMarcia K. McNutt, Director
U.S. Geological Survey, Reston, Virginia: 2012
For more information on the USGS—the Federal source for science about the Earth, its natural and living resources, natural hazards, and the environment, visit http://www.usgs.gov or call 1–888–ASK–USGS.
For an overview of USGS information products, including maps, imagery, and publications, visit http://www.usgs.gov/pubprod
To order this and other USGS information products, visit http://store.usgs.gov
Any use of trade, product, or firm names is for descriptive purposes only and does not imply endorsement by the U.S. Government.
Although this report is in the public domain, permission must be secured from the individual copyright owners to reproduce any copyrighted materials contained within this report.
Suggested citation:Hoppe, H.L. and Watson, K.M., 2012, Flood-inundation maps for the Saddle River from Rochelle Park to Lodi, New Jersey, 2012: U.S. Geological Survey Scientific Investigations Map 3221, 7 p., 11 sheets, scale 1:12,000. Available online at http://pubs.usgs.gov/sim/3221.

iii
AcknowledgmentsThe authors wish to thank the many local, State, and Federal agencies that have cooper-
ated in the funding for the operation and maintenance of the streamgage used for this study, especially the New Jersey Department of Environmental Protection and the U.S. Army Corps of Engineers, New York District. Special thanks are given to National Technological Hazards Management Consulting, Inc., for their cooperation in providing the hydrologic model for this study and to the National Weather Service for their continued support of the U.S. Geological Survey flood-inundation mapping initiative.

iv
Contents
Acknowledgments ........................................................................................................................................iiiAbstract ...........................................................................................................................................................1Introduction.....................................................................................................................................................1
Purpose and Scope ..............................................................................................................................2Study Area Description ........................................................................................................................2Previous Studies ...................................................................................................................................4
Constructing Water-Surface Profiles .........................................................................................................4Hydrologic and Steady Flow Data ......................................................................................................4Topographic/Bathymetric Data ..........................................................................................................4Energy Loss Factors .............................................................................................................................4Model Calibration and Performance .................................................................................................4Development of Water-Surface Profiles ...........................................................................................5
Inundation Mapping ......................................................................................................................................5Saddle River, New Jersey, Flood-Inundation Maps on the Internet ............................................5Disclaimer for Flood-Inundation Maps .............................................................................................6Uncertainties and Limitations Regarding Use of Flood-Inundation Maps ..................................6
Summary..........................................................................................................................................................6References Cited............................................................................................................................................6
Figures 1. Map showing location of study reach for the Saddle River at Lodi, New Jersey,
and location of U.S. Geological Survey streamgage and National Weather service forecast point ................................................................................................................................3
Tables 1. U.S. Geological Survey streamgage and miscellaneous site information
for study basin, Saddle River, New Jersey ...............................................................................2 2. 1.0-percent annual exceedance probability peak-discharge estimates,
drainage areas, and percentage of total discharge for selected locations on the Saddle River, New Jersey ...............................................................................................4
3. Stages and water-surface elevations for the Saddle River at Lodi, New Jersey, streamgage with corresponding discharge estimates at 0.5 mile downstream from Interstate 80 along the Saddle River, New Jersey, for selected simulated water-surface profiles. ................................................................................................................5

v
Sheets 1. Flood-inundation map for the Saddle River from Rochelle Park to Lodi, New Jersey
corresponding to a gage height of 5.0 feet and an elevation of 29.0 feet at the U.S. Geological Survey streamgage 01391500 Saddle River at Lodi, New Jersey.
2. Flood-inundation map for the Saddle River from Rochelle Park to Lodi, New Jersey corresponding to a gage height of 6.0 feet and an elevation of 30.0 feet at the U.S. Geological Survey streamgage 01391500 Saddle River at Lodi, New Jersey.
3. Flood-inundation map for the Saddle River from Rochelle Park to Lodi, New Jersey corresponding to a gage height of 7.0 feet and an elevation of 31.0 feet at the U.S. Geological Survey streamgage 01391500 Saddle River at Lodi, New Jersey.
4. Flood-inundation map for the Saddle River from Rochelle Park to Lodi, New Jersey corresponding to a gage height of 8.0 feet and an elevation of 32.0 feet at the U.S. Geological Survey streamgage 01391500 Saddle River at Lodi, New Jersey.
5. Flood-inundation map for the Saddle River from Rochelle Park to Lodi, New Jersey corresponding to a gage height of 9.0 feet and an elevation of 33.0 feet at the U.S. Geological Survey streamgage 01391500 Saddle River at Lodi, New Jersey.
6. Flood-inundation map for the Saddle River from Rochelle Park to Lodi, New Jersey corresponding to a gage height of 10.0 feet and an elevation of 34.0 feet at the U.S. Geological Survey streamgage 01391500 Saddle River at Lodi, New Jersey.
7. Flood-inundation map for the Saddle River from Rochelle Park to Lodi, New Jersey corresponding to a gage height of 11.0 feet and an elevation of 35.0 feet at the U.S. Geological Survey streamgage 01391500 Saddle River at Lodi, New Jersey.
8. Flood-inundation map for the Saddle River from Rochelle Park to Lodi, New Jersey corresponding to a gage height of 12.0 feet and an elevation of 36.0 feet at the U.S. Geological Survey streamgage 01391500 Saddle River at Lodi, New Jersey.
9. Flood-inundation map for the Saddle River from Rochelle Park to Lodi, New Jersey corresponding to a gage height of 13.0 feet and an elevation of 37.0 feet at the U.S. Geological Survey streamgage 01391500 Saddle River at Lodi, New Jersey.
10. Flood-inundation map for the Saddle River from Rochelle Park to Lodi, New Jersey corresponding to a gage height of 14.0 feet and an elevation of 38.0 feet at the U.S. Geological Survey streamgage 01391500 Saddle River at Lodi, New Jersey.
11. Flood-inundation map for the Saddle River from Rochelle Park to Lodi, New Jersey corresponding to a gage height of 15.0 feet and an elevation of 39.0 feet at the U.S. Geological Survey streamgage 01391500 Saddle River at Lodi, New Jersey.

vi
Conversion Factors and Datums
Inch/Pound to SI
Multiply By To obtainLength
inch (in.) 25.4 millimeter (mm)foot (ft) 0.3048 meter (m)mile (mi) 1.609 kilometer (km)
Areasquare foot (ft2) 0.09290 square meter (m2)square mile (mi2) 2.590 square kilometer (km2)
Flow ratecubic foot per second (ft3/s) 0.02832 cubic meter per second (m3/s)
Hydraulic gradientfoot per mile (ft/mi) 0.1894 meter per kilometer (m/km)
Vertical coordinate information is referenced to the North American Vertical Datum of 1988 (NAVD 88).
Horizontal coordinate information is referenced to the North American Datum of 1983 (NAD 83).

Abstract
Digital flood-inundation maps for a 2.75-mile reach of the Saddle River from 0.2 mile upstream from the Interstate 80 bridge in Rochelle Park to 1.5 miles downstream from the U.S. Route 46 bridge in Lodi, New Jersey, were created by the U.S. Geological Survey (USGS) in cooperation with the New Jersey Department of Environmental Protection (NJDEP). The inundation maps, which can be accessed through the USGS Flood Inundation Mapping Science Web site at http://water.usgs.gov/osw/flood_inundation/, depict estimates of the areal extent and depth of flooding corresponding to selected water levels (stages) at the USGS streamgage at Saddle River at Lodi, New Jersey (station 01391500). Current conditions for estimating near real-time areas of inundation using USGS streamgage information may be obtained on the Internet at http://waterdata.usgs.gov/nwis/uv?site_no=01391500. The National Weather Service (NWS) forecasts flood hydro-graphs at many places that are often collocated with USGS streamgages. NWS-forecasted peak-stage information may be used in conjunction with the maps developed in this study to show predicted areas of flood inundation.
In this study, flood profiles were computed for the stream reach by means of a one-dimensional step-backwater model. The model was calibrated using the most current stage-discharge relations at the Saddle River at Lodi, New Jersey streamgage and documented high-water marks from recent floods. The hydraulic model was then used to determine 11 water-surface profiles for flood stages at the Saddle River streamgage at 1-ft intervals referenced to the streamgage datum, North American Vertical Datum of 1988 (NAVD 88), and ranging from bankfull, 0.5 ft below NWS Action Stage, to the extent of the stage-discharge rating, which is approxi-mately 1 ft higher than the highest recorded water level at the streamgage. Action Stage is the stage which when reached by a rising stream the NWS or a partner needs to take some type of mitigation action in preparation for possible significant hydrologic activity. The simulated water-surface profiles were then combined with a geographic information system 3-meter
(9.84-ft) digital elevation model (derived from Light Detec-tion and Ranging (LiDAR) data) in order to delineate the area flooded at each water level.
The availability of these maps, along with Internet infor-mation regarding current stage from USGS streamgages and forecasted stream stages from the NWS, provide emergency management personnel and residents with information that is critical for flood response activities, such as evacuations and road closures, as well as for post-flood recovery efforts.
IntroductionThe Borough of Lodi is an urban community with an
estimated population of 24,136 and a population density of 10,657.6 persons per square mile (U.S. Bureau of Census, 2012). Lodi has experienced severe flooding numerous times, most notably in 2011 (Hurricane Irene), 1999 (Tropical Storm Floyd), and 1971. Damage costs not adjusted for inflation within Lodi for these floods were reported to be $6,599,425 in 2011 and $4,049,052 in 1999 (New Jersey Department of Environmental Protection, State National Flood Insurance Program Coordinators Office, written commun., 2012). Dam-age costs for the 1971 flood are not available because Lodi Borough did not join the National Flood Insurance Program (NFIP) until February 15, 1978. Most of the flood damages have occurred along the Saddle River and the Stink Creek tributary, both of which flow through the Borough of Lodi. Floodplains within Lodi are highly developed and contain a mix of residential and commercial structures.
Prior to this study, Lodi officials relied on several infor-mation sources (all of which are available on the Internet) to make decisions on how to best alert the public and mitigate flood damages. One source is the Federal Emergency Manage-ment Agency (FEMA) Flood Insurance Study (FIS) for Bergen County dated September 30, 2005 (Federal Emergency Man-agement Agency, 2005). A second source of information is the U.S. Geological Survey (USGS) Saddle River at Lodi, New Jersey, streamgage (station 01391500), from which current or
Flood-Inundation Maps for the Saddle River from Rochelle Park to Lodi, New Jersey, 2012
By Heidi L. Hoppe and Kara M. Watson

2 Flood-Inundation Maps for the Saddle River from Rochelle Park to Lodi, New Jersey, 2012
historical water levels (stage) can be obtained. A third source is the National Weather Service (NWS) forecast of peak stage at the USGS streamgage through the Advanced Hydrologic Prediction Service (AHPS) site. Although information on USGS current stage and NWS forecast stage is particularly useful for residents in the immediate vicinity of a streamgage, it is of limited use to residents farther upstream or downstream because the water-surface elevation is not constant along the entire stream channel. Also, FEMA and State emergency man-agement mitigation teams or property owners typically lack information related to how deep the water is at locations other than near USGS streamgage or NWS flood-forecast points.
Purpose and Scope
The purpose of this report is to describe the development of a series of estimated flood-inundation maps for the Saddle River from Rochelle Park to Lodi, New Jersey. The maps and other useful flood information are available on the USGS Flood Inundation Mapping Science Web site at http://water.usgs.gov/osw/flood_inundation/. Internet users can select esti-mated inundation maps that correspond to (1) current stages at the USGS streamgage, (2) the NWS forecasted peak stage, or (3) other desired stream stages.
The scope of the study was limited to a 2.75-mile reach of the Saddle River from 0.2 mile upstream from the Interstate 80 bridge in Rochelle Park to 1.5 miles downstream from the U.S. Route 46 bridge in Lodi (fig. 1). Tasks specific to development of the maps were (1) analysis of data from the Saddle River at Lodi streamgage (table 1), (2) collection of topographic data and geometric data (for structures/bridges) throughout the study reach, (3) verification of energy-loss factors (roughness coefficients) in the stream channel and floodplain and steady-flow data from previous studies (4) com-putation of water-surface profiles using the U.S. Army Corps of Engineer’s HEC–RAS computer program (U.S. Army Corps of Engineers, 2010), (5) production of estimated flood-inundation maps at various stream stages using the U.S. Army Corps of Engineer’s HEC–GeoRAS computer program (U.S. Army Corps of Engineers, 2009) and a geographic informa-tion system (GIS), and (6) development of a Web interface that links to USGS real-time streamgage information and NWS
forecasted peak stage to facilitate the display of user-selected flood-inundation maps on the Internet.
Methods used are generally cited from previously published reports. If techniques varied substantially from previously documented methods owing to local hydrologic conditions or available data, they are described in detail in this report. Maps were produced for water levels referenced to the stage at Saddle River at Lodi, New Jersey, and ranging from approximately bankfull, 0.5 foot (ft) below NWS Action Stage, to the extent of the stage-discharge rating, approxi-mately 1 ft higher than the maximum observed water level at the streamgage. Action Stage is the stage which when reached by a rising stream, lake, or reservoir represents the level where the NWS or a partner/user needs to take some type of mitigation action in preparation for possible significant hydro-logic activity (National Weather Service, 2010).
Study Area Description
The Saddle River is in northeast New Jersey in the Piedmont physiographic province. The drainage area ranges from 54.6 square miles (mi2) at the Saddle River at Lodi streamgage to 59.8 mi2 at the downstream extent of the study reach. The headwaters originate in Rockland County, in southern New York State, and the stream flows gener-ally southward before entering the borough limits of Lodi in Bergen County, New Jersey. Stink Creek is a major tribu-tary to the Saddle River that joins the main stem as it flows through Lodi. The Saddle River drains into the Passaic River 1.1 miles downstream from Lodi, New Jersey. The basin terrain is moderately hilly. The study reach is approximately 2.75 miles long and has an average top-of-bank channel width of 109 ft and an average channel slope of 8.5 feet per mile (ft/mi). About 81.2 percent of the land contiguous to the study reach is classified as urban or developed, 11.2 percent as forest, and 0.5 percent as cropland (New Jersey Department of Environmental Protection, 2010). The basin is still under development, and population has increased 0.7 percent from 23,971 to 24,136 during the period 2000 to 2010 (U.S. Census Bureau, 2012). Six major road crossings or other structures are located within the main channel of the study reach or the adjacent floodplain.
Table 1. U.S. Geological Survey streamgage and miscellaneous site information for study basin, Saddle River, New Jersey.
Station nameStation number
Drainage area (square miles)
Latitude Longitude Period of recordMaximum recorded stage
at gage (feet) and date
Saddle River at Lodi, NJ 01391500 54.6 40°53′25″ 74°04′50″ Oct 1923 to 2012 (current year)
13.94Sep 17, 1999

Introduction 3
Lodi BoroughLodi Borough
Rochelle Park TownshipRochelle Park Township
Saddle BrookTownshipSaddle BrookTownship
Garfield CityGarfield City
OUTWATER LANE
OUTWATER LANE
0139150001391500
74°04'30"5'5'30"74°06'
40°53'30"
53'
52'30"
40°52'
Studyarea
NEW JE
RSEY
0 0.25 0.5 MILE
0 0.25 0.5 KILOMETER
Base from U.S. Geological Survey digital data North American Datum of 1983 (NAD83)
46
80
Sa
dd
l e
Ri v
er
Sa
dd
l e
Ri v
er
S t ink C r e e kSt ink C r e e k
PASSAIC STREET
PASSAIC STREET
17
MARKET STREETMARKET STREET
EXPLANATION
Flood-inundation area
Study area extent
Township boundary
Flow arrow—Indicates direction of water flow
U.S. Geological Survey streamgage and number, collocated with National Weather Service forecast point
U.S. route marker
Interstate route marker
State route marker
0139150001391500
46
80
17
Figure 1. Location of study reach for the Saddle River at Lodi, New Jersey, and location of U.S. Geological Survey streamgage and National Weather service forecast point.

4 Flood-Inundation Maps for the Saddle River from Rochelle Park to Lodi, New Jersey, 2012
Previous Studies
The current FIS for Lodi (Federal Emergency Manage-ment Agency, 2005) was completed by Natural and Techno-logical Hazards Management Consulting, Inc., (NTHMC) in 2004. That study provided information on the 1.0- and 0.2-per-cent annual exceedance probability water-surface profiles and associated floodplain maps for the Saddle River. Estimates of the peak discharges for the 1.0-percent annual exceedance probability flood along the Saddle River, as shown in table 2 below for the study reach, were described by FEMA (2005).
Constructing Water-Surface ProfilesThe water-surface profiles used to produce the 11 flood-
inundation maps in this study were computed using HEC–RAS, version 4.1.0 (U.S. Army Corps of Engineers, 2010). HEC–RAS is a one-dimensional step-backwater model for simulation of water-surface profiles with steady-state (gradu-ally varied) or unsteady-state flow computation options. The HEC–RAS analysis for this study was done using the steady-state flow computation option.
Hydrologic and Steady Flow Data
The study area hydrologic network consists of one streamgage (fig. 1; table 1). This streamgage already existed prior to this study. Water level (stage) is measured continu-ously and continuous records of streamflow are computed at this site. All water-surface elevations are referenced to North American Vertical Datum of 1988 (NAVD 88). The streamgage is equipped with a satellite radio transmitter that allows data to be transmitted routinely on the Internet within an hour of collection.
Steady-flow data consist of flow regime, boundary conditions (normal depth, as per the original model, with the rating curve added at the streamgage cross section), and peak discharge information. The peak discharge data for the study reach were obtained from field measurements and the stage-discharge relation that was developed by the USGS at the Saddle River at Lodi, New Jersey streamgage.
Topographic/Bathymetric Data
Channel cross sections were developed from NTHMC field surveys that were conducted in 2004; these cross sections provide detailed channel elevation data below the water sur-face and were collected using hydroacoustic instrumentation to measure depth and Differential Global Positioning System (DGPS) instrumentation to determine horizontal position. Light Detection and Ranging (LiDAR) data were used to provide 3-meter (9.84-ft) digital elevation data for the portions of the cross sections that were above the water surface at the time of the surveys. The LiDAR data were collected during 2006–07, and post-processing of these data was completed by U.S. National Geospatial-Intelligence Agency (NGA) in 2007.
Various man-made drainage structures (bridges, culverts, roadway embankments, levees, and dams) in and along the stream affect or have the potential to affect water-surface elevations during floods along the stream. To properly account for these features in the model, structural dimensions for six bridges were measured and surveyed in the field concurrently with the stream-channel surveys. A detailed description of the methods used to acquire and process the topographic and bathymetric data can be found in Bales and others (2007).
Energy Loss Factors
Field observations and high-resolution aerial photographs were used to select initial (pre-calibration) Manning’s rough-ness coefficients (“n” values) for energy (friction) loss calcula-tions. The final Manning’s n values used ranged from 0.025 to 0.08 for the main channel and 0.020 to 0.10 for the overbank areas modeled in this analysis.
Model Calibration and Performance
The hydraulic model was calibrated to the most cur-rent stage-discharge relation at the Saddle River at Lodi streamgage. The measured peak discharge for the 2011 flood was 5,740 cubic feet per second (ft3/s) at a stage of 13.50 ft at the streamgage. The measured peak discharge for the 1999 flood was 5,330 ft3/s (stage of 13.94 ft). Model calibra-tion was accomplished by adjusting Manning’s n values and,
Table 2. 1.0-percent annual exceedance probability peak-discharge estimates, drainage areas, and percentage of total discharge for selected locations on the Saddle River, New Jersey. (From Federal Emergency Management Agency, 2005)
Location on Saddle RiverDrainage area (square miles)
Peak-discharge estimate (cubic feet per second)
Percentage of total discharge
At Outwater Lane, Saddle River at Lodi, NJ, streamgage 54.6 5,440 100

Inundation Mapping 5
in some cases, changing the channel cross section or slope until the results of the hydraulic computations closely agreed with the known flood discharge and stage values. Differences between measured and simulated water levels for measured or rated flows at USGS streamgage Saddle River at Lodi (sta-tion 01391500) were equal to or less than 0.13 ft. The results demonstrate that the model is capable of simulating accurate water levels over a wide range of flows in the basin. Details on techniques used in model development and calibration can be found in Bales and others (2007).
Development of Water-Surface Profiles
Profiles were developed for a total of 11 stages at 1-ft intervals from 5.0 ft to 15.0 ft as referenced to the Saddle River at Lodi, New Jersey (station 01391500). Discharges corresponding to the various stages were obtained from the most current stage-discharge relation (rating no. 33) at the Saddle River streamgage. Discharges for all profiles (table 3) at locations upstream and downstream from station 01391500 on the Saddle River were selected with the assumption that the percentage contribution to the total flow was the same as that assumed for the 2005 FIS (table 2).
Inundation MappingFlood-inundation maps were created for the USGS
Saddle River at Lodi streamgage (station 01391500), which has been designated as a NWS flood-forecast point (as of December 1973). The maps were created in a geographic information system by combining the water-surface profiles and digital elevation model data. The 3-meter (9.84-ft) digital elevation model data were derived from LiDAR data obtained from the NGA (National Geospatial-Intelligence Agency, 2007). Each digitized cross-section line used for the study area was attributed with a HEC-RAS calculated water-surface elevation for each of the 11 profiles (table 3). The flood surfaces were generated using an iterative finite-difference interpolation technique found in the ArcGIS, TopoToRaster tool. This tool is unique because it is the only ArcGIS interpo-lation routine designed to work intelligently with contour data, and it combines locally efficient interpolation methods with global surface-continuity routines (Environmental Systems Research Institute, Inc., 2009). Inputs into the tool are contour data using the digital cross sections attributed with the NAVD 88 elevation, in feet, and boundary data using the study-area polygon. Depth of water grids were generated by subtracting the flood water-surface elevation from the study-area digital elevation model (DEM). (Roland and Hoffman, 2011) The map products show estimated flood-inundated areas overlaid on high-resolution, geo-referenced, aerial photographs of the study area for each of the water-surface profiles that were generated by the hydraulic model.
Saddle River, New Jersey, Flood-Inundation Maps on the Internet
The flood-inundation maps and current study docu-mentation are available online at the U.S. Geological Survey Publications Warehouse (http://pubs.usgs.gov/sim/2012/3221). Also, a Flood Inundation Mapping Science Web site has been established to provide a portal for USGS flood-inundation study information for the public at http://water.usgs.gov/osw/flood_inundation/. That Web portal has a link (http://wim.usgs.gov/FIMI/FloodInundationMapper.html) to interactive online map libraries that can be downloaded in several commonly used electronic file formats. In the latter link, each stream reach displayed contains further links to the USGS National Water Information System (NWISWeb) graphs of the cur-rent stage and streamflow at the USGS Saddle River at Lodi streamgage (station 01391500) to which the inundation maps are referenced. A link also is provided to the NWS AHPS site (http:/water.weather.gov/ahps/) so that the user can obtain applicable information on forecasted peak stage. The estimated flood-inundation maps are displayed in sufficient detail to note the extent of flooding with respect to individual structures so
Table 3. Stages and water-surface elevations for the Saddle River at Lodi, New Jersey, streamgage (station 01391500) with corresponding discharge estimates at 0.5 mile downstream from Interstate 80 along the Saddle River, New Jersey, for selected simulated water-surface profiles.
[NAVD 88, North American Vertical Datum of 1988]
Map sheet
number
Stage, in feet above gage datum
Elevation, in feet above
NAVD 88
Estimated discharge, in cubic feet per second
1 5 29 1,4302 6 30 1,9003 7 31 2,3604 8 32 2,8005 9 33 3,3106 10 34 3,8207 11 35 4,3608 12 36 4,9009 13 37 5,460
10 14 38 6,02011 15 39 6,600
6 Flood-Inundation Maps for the Saddle River from Rochelle Park to Lodi, New Jersey, 2012
that preparations for flooding and decisions for emergency response can be performed efficiently. Roadways and bridges were closely reviewed and are shown as shaded (inundated and likely impassable) or not shaded (dry and passable) to facilitate emergency planning and use. However, buildings that are shaded do not reflect inundation but denote that bare earth surfaces in the vicinity of the buildings are inundated. When the water depth (as indicated in the Web Mapping Application by holding the cursor over an inundated area) in the vicinity of the building of interest exceeds that building’s height, the structure can be considered fully submerged.
Disclaimer for Flood-Inundation Maps
Inundated areas shown are not to be used for navigation, regulatory, permitting, or other legal purposes. The USGS provides these maps “as-is” for a quick reference, emergency planning tool but assumes no legal liability or responsibility resulting from the use of this information.
Uncertainties and Limitations Regarding Use of Flood-Inundation Maps
Although the flood-inundation maps represent the bound-aries of inundated areas with a distinct line, some uncertainty is associated with these maps. The flood boundaries shown were estimated on the basis of water stages and streamflows at the USGS streamgage station Saddle River at Lodi, New Jersey (01391500). Water-surface elevations along the stream reaches were estimated by steady-state hydraulic model-ing, assuming unobstructed flow, and using streamflows and hydrologic conditions anticipated at the USGS streamgage. The hydraulic model reflects the land-cover characteristics and any bridge, dam, levee, or other hydraulic structures existing as of September 2004. Unique meteorological factors (timing and distribution of precipitation) may cause actual streamflows along the modeled reach to vary from those assumed during a flood, which may lead to deviations in the water-surface elevations and inundation boundaries shown. Additional areas may be flooded as a result of unanticipated conditions, such as changes in the streambed elevation or roughness, backwater into major tributaries along a main stem river, or backwa-ter from localized debris or ice jams. The accuracy of the floodwater extent portrayed on these maps will vary with the accuracy of the digital elevation model used to simulate the land surface. Additional uncertainties and limitations pertinent to this study may be described elsewhere in this report.
If this series of flood-inundation maps will be used in conjunction with NWS river forecasts, the user should to be aware of additional uncertainties that may be inherent or fac-tored into NWS forecast procedures. The NWS uses forecast models to estimate the quantity and timing of water flowing through selected stream reaches in the United States. These forecast models (1) estimate the amount of runoff generated
by precipitation and snowmelt, (2) simulate the movement of floodwater as it proceeds downstream, and (3) predict the flow and stage (and water-surface elevation) for the stream at a given location (AHPS forecast point) throughout the forecast period (every 6 hours and 3 to 5 days out in many locations). For more information on AHPS forecasts, please see http://water.weather.gov/ahps/pcpn_and_river_forecasting.pdf.
SummaryA series of estimated flood-inundation maps were devel-
oped in cooperation with the New Jersey Department of Envi-ronmental Protection for the Saddle River between Rochelle Park and Lodi, New Jersey. These maps, available at a USGS Web portal, in conjunction with the real-time stage data from the USGS streamgage at Saddle River at Lodi, New Jersey (station 01391500) and National Weather Service flood-stage forecasts, will help to guide the general public in taking indi-vidual safety precautions and will provide municipal officials with a tool to efficiently manage emergency flood operations and flood mitigation efforts.
The maps were developed using the U.S. Army Corps of Engineers’ HEC–RAS and HEC–GeoRAS programs to compute water-surface profiles and to delineate estimated flood-inundation areas for selected stream stages. The maps show estimated (shaded) flood-inundation areas overlaid on high-resolution, geo-referenced, aerial photographs of the study area for stream stages of 5 ft to 15 ft at 1-ft intervals at the Saddle River at Lodi streamgage. Interactive use of the maps using the mouse cursor to click within the shaded areas can give users a general indication of depth of water at any point. These maps can be accessed through the USGS Flood Inundation Mapping Science Web site at http://water.usgs.gov/osw/flood_inundation/.
References Cited
Bales, J.D., Wagner, C.R., Tighe, K.C., and Terziotti, Silvia, 2007, LiDAR-derived flood-inundation maps for real-time flood-mapping applications, Tar River Basin, North Carolina: U.S. Geological Survey Scientific Investigations Report 2007–5032, 42 p.
Environmental Systems Research Institute, Inc., 2009, Prod-ucts—ArcGIS: accessed May 16, 2011, at http://www.esri.com/products/index.html.
Federal Emergency Management Agency, 2005, Flood Insur-ance Study, Bergen County, New Jersey: Washington, D.C., September 30, 2005, 4 p.
National Geospatial-Intelligence Agency, 2007, LiDAR-Metro N. Jersey 2006–07: Springfield, Virginia.

References Cited 7
National Weather Service, 2010, National Weather Service Manual 10-950, accessed May 31, 2012, at http://www.nws.noaa.gov/directives/sym/pd01009050curr.pdf.
Natural and Technological Hazards Management Consulting, Inc., 2004, Final hydrology: Riverine flood insurance stud-ies in FEMA Region II New Jersey FY-03: Saddle River, New Jersey, 107 p.
New Jersey Department of Environmental Protection, 2010, NJDEP 2007 landuse/landcover update, State of New Jer-sey, accessed May 16, 2011, at http://www.nj.gov/dep/gis/lulc07shp.html.
Roland, M.A., and Hoffman, S.A., 2011, Development of flood-inundation maps for the West Branch Susquehanna River near the Borough of Jersey Shore, Lycoming County, Pennsylvania: U.S. Geological Survey Scientific Investiga-tions Report 2010–5057, 9 p.
U.S. Army Corps of Engineers, Hydrologic Engineering Cen-ter, 2009, HEC-GeoRAS, GIS tools for support of HEC–RAS using ArcGIS, User’s manual, version 4.2, [variously paged].
U.S. Army Corps of Engineers, Hydrologic Engineering Center, 2010, HEC–RAS River Analysis System, Hydraulic reference manual, version 4.1, [variously paged].
U.S. Bureau of Census, 2012, Census 2010 state and county quick facts, accessed April 23, 2012, at http://quickfacts.census.gov/qfd/states/34/3441100.html.


For additional information, write to:
Director, New Jersey Water Science CenterU.S. Geological Survey810 Bear Tavern Road, Suite 206West Trenton, NJ 08628
or visit our Web site at:http://nj.usgs.gov/
Document prepared by the West Trenton Publishing Service Center

Hoppe and Watson—
Flood-Inundation Maps for the Saddle River from
Rochelle Park to Lodi, New
Jersey, 2012—Scientific Investigations M
ap 3221