flood risk and climate change: global and regional...
TRANSCRIPT

This article was downloaded by: [71.218.166.9]On: 07 January 2014, At: 06:31Publisher: Taylor & FrancisInforma Ltd Registered in England and Wales Registered Number: 1072954 Registered office: Mortimer House,37-41 Mortimer Street, London W1T 3JH, UK
Hydrological Sciences JournalPublication details, including instructions for authors and subscription information:http://www.tandfonline.com/loi/thsj20
Flood risk and climate change: global and regionalperspectivesZbigniew W. Kundzewiczab, Shinjiro Kanaec, Sonia I. Seneviratned, John Handmere, NevilleNichollsf, Pascal Peduzzig, Reinhard Mechlerh, Laurens M. Bouwerij, Nigel Arnellk, KatharineMachl, Robert Muir-Woodm, G. Robert Brakenridgen, Wolfgang Krono, Gerardo Benitop,Yasushi Hondaq, Kiyoshi Takahashir & Boris Sherstyukovs
a Institute for Agricultural and Forest Environment, Polish Academy of Science, Poznań,Polandb Potsdam Institute for Climate Impact Research, Potsdam, Germanyc Department of Mechanical and Environmental Informatics, Tokyo Institute of Technology,Tokyo, Japand Institute for Atmospheric and Climate Science, ETH, Zürich, Switzerlande School of Mathematical and Geospatial Sciences, RMIT University, Melbourne, Australiaf Monash Weather and Climate, Monash University, Melbourne, Australiag Global Change & Vulnerability Unit, UNEP/GRID-Geneva, Geneva, Switzerlandh International Institute for Applied Systems Analysis (IIASA), Laxenburg, Austriai Institute for Environmental Studies, Vrije Universiteit Amsterdam, The Netherlandsj Deltares, Delft, The Netherlandsk Walker Institute for Climate System Research, University of Reading, Reading, UKl Carnegie Institution for Science, Stanford, California, USAm Risk Management Solutions, London, UKn CSDMS, INSTAAR, University of Colorado, Boulder, Colorado, USAo Munich Re, Munich, Germanyp Museo Nacional de Ciencias Naturales, CSIC, Madrid, Spainq Faculty of Health and Sport Sciences, University of Tsukuba, Tsukuba, Japanr National Institute for Environmental Studies, Tsukuba, Japans Russian Institute for Hydrometeorological Information, Obninsk, RussiaPublished online: 20 Dec 2013.
To cite this article: Zbigniew W. Kundzewicz, Shinjiro Kanae, Sonia I. Seneviratne, John Handmer, Neville Nicholls,Pascal Peduzzi, Reinhard Mechler, Laurens M. Bouwer, Nigel Arnell, Katharine Mach, Robert Muir-Wood, G. RobertBrakenridge, Wolfgang Kron, Gerardo Benito, Yasushi Honda, Kiyoshi Takahashi & Boris Sherstyukov , Hydrological SciencesJournal (2013): Flood risk and climate change: global and regional perspectives, Hydrological Sciences Journal, DOI:10.1080/02626667.2013.857411
To link to this article: http://dx.doi.org/10.1080/02626667.2013.857411
PLEASE SCROLL DOWN FOR ARTICLE
Taylor & Francis makes every effort to ensure the accuracy of all the information (the “Content”) contained inthe publications on our platform. Taylor & Francis, our agents, and our licensors make no representations or

warranties whatsoever as to the accuracy, completeness, or suitability for any purpose of the Content. Versionsof published Taylor & Francis and Routledge Open articles and Taylor & Francis and Routledge Open Selectarticles posted to institutional or subject repositories or any other third-party website are without warrantyfrom Taylor & Francis of any kind, either expressed or implied, including, but not limited to, warranties ofmerchantability, fitness for a particular purpose, or non-infringement. Any opinions and views expressed in thisarticle are the opinions and views of the authors, and are not the views of or endorsed by Taylor & Francis. Theaccuracy of the Content should not be relied upon and should be independently verified with primary sourcesof information. Taylor & Francis shall not be liable for any losses, actions, claims, proceedings, demands,costs, expenses, damages, and other liabilities whatsoever or howsoever caused arising directly or indirectly inconnection with, in relation to or arising out of the use of the Content.
This article may be used for research, teaching, and private study purposes. Any substantial or systematicreproduction, redistribution, reselling, loan, sub-licensing, systematic supply, or distribution in anyform to anyone is expressly forbidden. Terms & Conditions of access and use can be found at http://www.tandfonline.com/page/terms-and-conditions
Taylor & Francis and Routledge Open articles are normally published under a Creative Commons AttributionLicense http://creativecommons.org/licenses/by/3.0/. However, authors may opt to publish under a CreativeCommons Attribution-Non-Commercial License http://creativecommons.org/licenses/by-nc/3.0/ Taylor & Francisand Routledge Open Select articles are currently published under a license to publish, which is based upon theCreative Commons Attribution-Non-Commercial No-Derivatives License, but allows for text and data mining ofwork. Authors also have the option of publishing an Open Select article under the Creative Commons AttributionLicense http://creativecommons.org/licenses/by/3.0/. It is essential that you check the license status of any given Open and Open Select article to confirmconditions of access and use.
Dow
nloa
ded
by [
71.2
18.1
66.9
] at
06:
31 0
7 Ja
nuar
y 20
14

Flood risk and climate change: global and regional perspectives
Zbigniew W. Kundzewicz1,2, Shinjiro Kanae3, Sonia I. Seneviratne4, John Handmer5, NevilleNicholls6, Pascal Peduzzi7, Reinhard Mechler8, Laurens M. Bouwer9,10, Nigel Arnell11, KatharineMach12, Robert Muir-Wood13, G. Robert Brakenridge14, Wolfgang Kron15, Gerardo Benito16,Yasushi Honda17, Kiyoshi Takahashi18 and Boris Sherstyukov19
1Institute for Agricultural and Forest Environment, Polish Academy of Science, Poznań, [email protected] Institute for Climate Impact Research, Potsdam, Germany3Department of Mechanical and Environmental Informatics, Tokyo Institute of Technology, Tokyo, Japan4Institute for Atmospheric and Climate Science, ETH, Zürich, Switzerland5School of Mathematical and Geospatial Sciences, RMIT University, Melbourne, Australia6Monash Weather and Climate, Monash University, Melbourne, Australia7Global Change & Vulnerability Unit, UNEP/GRID-Geneva, Geneva, Switzerland8International Institute for Applied Systems Analysis (IIASA), Laxenburg, Austria9Institute for Environmental Studies, Vrije Universiteit Amsterdam, The Netherlands10Deltares, Delft, The Netherlands11Walker Institute for Climate System Research, University of Reading, Reading, UK12Carnegie Institution for Science, Stanford, California, USA13Risk Management Solutions, London, UK14CSDMS, INSTAAR, University of Colorado, Boulder, Colorado, USA15Munich Re, Munich, Germany16Museo Nacional de Ciencias Naturales, CSIC, Madrid, Spain17Faculty of Health and Sport Sciences, University of Tsukuba, Tsukuba, Japan18National Institute for Environmental Studies, Tsukuba, Japan19Russian Institute for Hydrometeorological Information, Obninsk, Russia
Received 19 October 2012; accepted 28 August 2013; open for discussion until 1 July 2014
Editor D. Koutsoyiannis
Citation Kundzewicz, Z.W., et al., 2012. Flood risk and climate change: global and regional perspectives. Hydrological SciencesJournal, 59 (1), 1–28.
Abstract A holistic perspective on changing rainfall-driven flood risk is provided for the late 20th and early 21stcenturies. Economic losses from floods have greatly increased, principally driven by the expanding exposure ofassets at risk. It has not been possible to attribute rain-generated peak streamflow trends to anthropogenic climatechange over the past several decades. Projected increases in the frequency and intensity of heavy rainfall, basedon climate models, should contribute to increases in precipitation-generated local flooding (e.g. flash flooding andurban flooding). This article assesses the literature included in the IPCC SREX report and new literaturepublished since, and includes an assessment of changes in flood risk in seven of the regions considered in therecent IPCC SREX report—Africa, Asia, Central and South America, Europe, North America, Oceania and Polarregions. Also considering newer publications, this article is consistent with the recent IPCC SREX assessmentfinding that the impacts of climate change on flood characteristics are highly sensitive to the detailed nature of
Hydrological Sciences Journal – Journal des Sciences Hydrologiques, 2013http://dx.doi.org/10.1080/02626667.2013.857411
1
© 2013 The Author(s). Published by Taylor & Francis.This is an Open Access article. Non-commercial re-use, distribution, and reproduction in any medium, provided the original work is properly attributed, cited, andis not altered, transformed, or built upon in any way, is permitted. The moral rights of the named author(s) have been asserted.
Dow
nloa
ded
by [
71.2
18.1
66.9
] at
06:
31 0
7 Ja
nuar
y 20
14
those changes and that presently we have only low confidence1 in numerical projections of changes in floodmagnitude or frequency resulting from climate change.
Key words floods; climate change; global change; attribution; uncertainty
Le risque d’inondation et les perspectives de changement climatique mondial et régionalRésumé Cet article trace une perspective globale de l’évolution des risques d’inondation d’origine pluviale pourla fin du 20ème et le début du 21ème siècle. Les pertes économiques dues aux inondations ont fortementaugmenté, principalement en raison de l’exposition croissante des actifs à risque. Il n’a pas été possibled’attribuer les tendances de débits de pointe au changement climatique d’origine anthropique au cours desdernières décennies. Les augmentations prévues de la fréquence et de l’intensité des précipitations extrêmes,basées sur des modèles climatiques, devraient contribuer à une augmentation des inondations locales (parexemple, des crues éclairs et des inondations en milieu urbain) provoquées par les pluies. Nous avons évaluéla littérature incluse dans le rapport SREX du GIEC et celle qui a été publiée depuis, afin d’estimer l’évolutiondes risques d’inondation dans les sept régions considérées dans le rapport récent du SREX du GIEC, à savoirl’Afrique, l’Asie, l’Amérique centrale et du Sud, l’Europe, l’Amérique du Nord, l’Océanie et les régions polaires.Tenant compte des publications les plus récentes, le présent article rejoint la récente évaluation SREX du GIECselon laquelle les impacts du changement climatique sur les caractéristiques des crues sont très sensibles auxdétails de ces changements, et qu’à l’heure actuelle nous ne pouvons avoir qu’une confiance limitée dans lesprojections numériques de l’évolution de l’amplitude ou de la fréquence des inondations résultant du changementclimatique.
Mots clefs inondations; changement climatique; changement global; attribution; incertitude
1 INTRODUCTION
The Special Report on “Managing the Risks ofExtreme Events and Disasters to Advance ClimateChange Adaptation” of the Intergovernmental Panelon Climate Change (IPCC), here abbreviated toSREX report (Field et al. 2012), critically assessedthe recent scientific literature on climate change andthe impacts from extreme events. The report was theproduct of a multi-national and multi-disciplinaryauthorship from Working Groups I and II of theIPCC, assisted by a large pool of academic andgovernment experts involved in the multi-stagereview process. A very wide range of information,opinions and hypotheses were assessed and a prior-itization of topics established, with respect to theirimportance, likelihood and confidence. Most authorsof the present article were also authors of one of twochapters of the SREX report, namely, Chapter 3,“Changes in climate extremes and their impacts onthe natural physical environment” (Seneviratne et al.2012, hereafter referred to as S12), and Chapter 4,“Changes in impacts of climate extremes: humansystems and ecosystems” (Handmer et al. 2012, here-after referred to as H12). The present article providesa holistic perspective on the key conclusions of theSREX report concerning changing flood risk,extended, where appropriate, with references fromeven more recent literature.2 However, it should benoted that, although most authors of the current arti-cle were authors of the SREX report, this article isNOT an IPCC report. While we believe our conclu-sions are congruent with the IPCC report, the views
expressed in this article are those of the authors onlyand do not represent, in any way, an IPCC report orsupplement. This article also includes complementaryinformation and materials, which supplement andrefine the conclusions from the SREX report.
In the glossary of the IPCC SREX report, floodsare defined as: “the overflowing of the normal confinesof a stream or other body of water or the accumulationof water over areas that are not normally submerged.Floods include river (fluvial) floods, flash floods, urbanfloods, pluvial floods, sewer floods, coastal floods, andglacial lake outburst floods.” These various classes offloods are generated by different mechanisms. The pre-sent article does not address coastal flooding caused bystorm surges.
As noted by Bates et al. (2008), floods are affectedby various characteristics of the climatic system, mostnotably precipitation (intensity, duration, amount, tim-ing, phase—rain or snow), but also temperature patterns(responsible for such phenomena as soil freezing, snowand ice melt and ice jam formation). Floods are alsoaffected by drainage basin conditions, such as pre-exist-ing water levels in rivers, the snow and ice cover, thesoil character and status (permeability, soil moisturecontent and its vertical distribution), the rate of urbani-zation, and the presence of dikes, dams and reservoirs.Close to sea level, river flooding may be concurrentwith storm surge or extreme tide events (Brakenridgeet al. 2013).
Intense and long-lasting rain is the most com-mon cause of river (fluvial) floods in large riverbasins, but high-latitude regions are subject to snowmeltfloods (sometimes enhanced by rain or ice jams).
2 Zbigniew W. Kundzewicz et al.
Dow
nloa
ded
by [
71.2
18.1
66.9
] at
06:
31 0
7 Ja
nuar
y 20
14

Floods in small basins may be generated by short-dura-tion, highly intense rainfall. The relationship betweenthe amount of rainfall and flood response in a catchmentcan be complex. Antecedent conditions can determinethe response to an input of rainfall, while the floodresponse is often controlled by where in the catchmentthe rain falls. Other natural factors that may inducefloods include landslides, reduced channel conveyanceand the sudden failure of inhibiting structures, such asthe collapse of landslide dams, ice jams or glaciersblocking glacial lakes. Infrequently, the catastrophicfailure of an artificial dam can be the direct cause ofintense downstream flooding. Within a flooding event,the extent of inundation can be influenced by dikebreaches and the blockage of bridges and culverts bydebris (Kundzewicz et al. 2012).
While most large floods are rare events, at somesites, extensive inundations, following the definitionof flood in the IPCC SREX glossary (Field et al.2012), are “climatological normal” occurrences, forexample, occurring every spring during snowmelt(Kundzewicz 2012), or during an annual monsoon.
The antecedent conditions of a river basin prede-termine flooding potential (e.g. S12). Should storage belimited because groundwater levels are elevated andsoil moisture is at maximum capacity, then even mod-erate amounts of rain can generate a large flood.However, the development of a very dry, crusted soilafter a prolonged period without rain, or after a wildfireassociated with severe drought conditions, can alsorapidly convert rainfall to runoff (because the runoffcoefficient is higher), resulting in a flash flood.
Flood-associated damage is a function not onlyof the depth, speed and persistence of the water, butalso of the dissolved and suspended load that theflood waters carry, including when the flood becomesa debris flow. Sediment and solid and liquid material,including raw sewage and a wide range of pollutants,can affect the flooded area, often posing a serioushealth hazard (Kundzewicz et al. 2012).
Floods have been singled out from the SREXreport as they cause very large amounts of materialdamage and casualties worldwide, and may raise thebroad interest of many readers of HydrologicalSciences Journal. This issue is very timely andimportant since, these days, many a large flood isattributed by some to climate change.
2 FLOODS TODAY
Large and damaging floods occur every year. Heavyfloods visited Pakistan, India and China in the
summer of 2010, Colombia from October toDecember 2010 and Australia during the austral sum-mer 2010/11. The maximum estimated annualdamage caused by river floods in one country wasrecorded in China in 2010, where a total loss of US$51 billion was reported. In 2010, there were nearly2000 immediate fatalities from monsoonal floodingin Pakistan (Syvitski and Brakenridge 2013).
In 2011, severe floods were reported inMozambique, Namibia, South Africa and Uganda inAfrica; Brazil, Columbia, Mexico and the United Statesin the Americas; and Cambodia, China, India, Korea,Pakistan, the Philippines and Thailand in Asia, withfatalities in each flood exceeding 50 (over 1000 in thePhillippines and Colombia) and high material damage,in particular in the developed countries from the listabove (Kundzewicz et al. 2012). In 2012, “killerfloods,” inducing more than 50 fatalities each, occurredin Madagascar, Niger and Nigeria in Africa;Bangladesh, China, India, North and South Korea, thePhillippines and Russia in Asia; and Argentina, theUnited States and Haiti in the Americas.
The international loss databases with globalcoverage such as EM-DAT, NatCatSERVICE andSigma (maintained by the Centre for theEpidemiology of Disasters, Munich Re and SwissRe, respectively, see the following websites: http://www.emdat.be/, https://www.munichre.com/touch/naturalhazards/en/natcatservice/default.aspx, http://www.swissre.com/sigma/) show an increase inreported flood disasters and flood losses throughtime. However, part of this increase may be attrib-uted to improvements in reporting (Peduzzi et al.2009, 2012), population increase and urbanizationin flood-prone areas, increase of property value anddegraded awareness about natural risks (due to lessnatural lifestyle). For the period 1980–2011, reportedflood losses (adjusted for inflation) have increasedfrom an average of US$7 billion per year in the1980s to some US$24 billion per year in the period2001–2011, of which an average of 9% was insured(data from Munich Re, NatCatSERVICE, September2012). Over this same period, the average number offatalities has been in thousands per year, with thehighest flood mortalities in South and Southeast Asia.
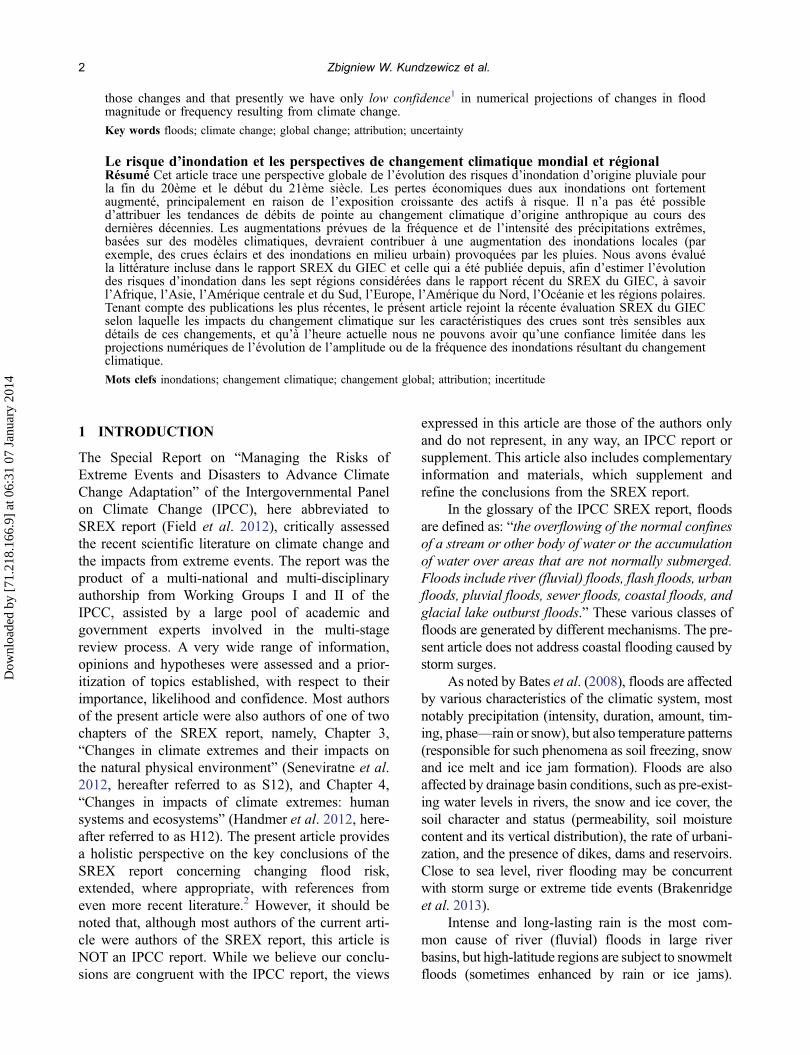
The map in Fig. 1 indicates the location of 3713flood events during 1985–2010 recorded in the pub-lic global database maintained by G.R. Brakenridgeat the Dartmouth Flood Observatory (http://floodob-servatory.colorado.edu). The map illustrates a clearlink between flood reporting and concentrations ofpopulation. In addition, regions with few reported
Flood risk and climate change 3
Dow
nloa
ded
by [
71.2
18.1
66.9
] at
06:
31 0
7 Ja
nuar
y 20
14
floods include the great deserts and high mountainsof western North America, southern South America,northern Africa, central Asia and Australia. It is notknown if areas of Amazonia actually lack largefloods or if instead the online-accessible reporting issparse; the same holds true for portions of Russia.
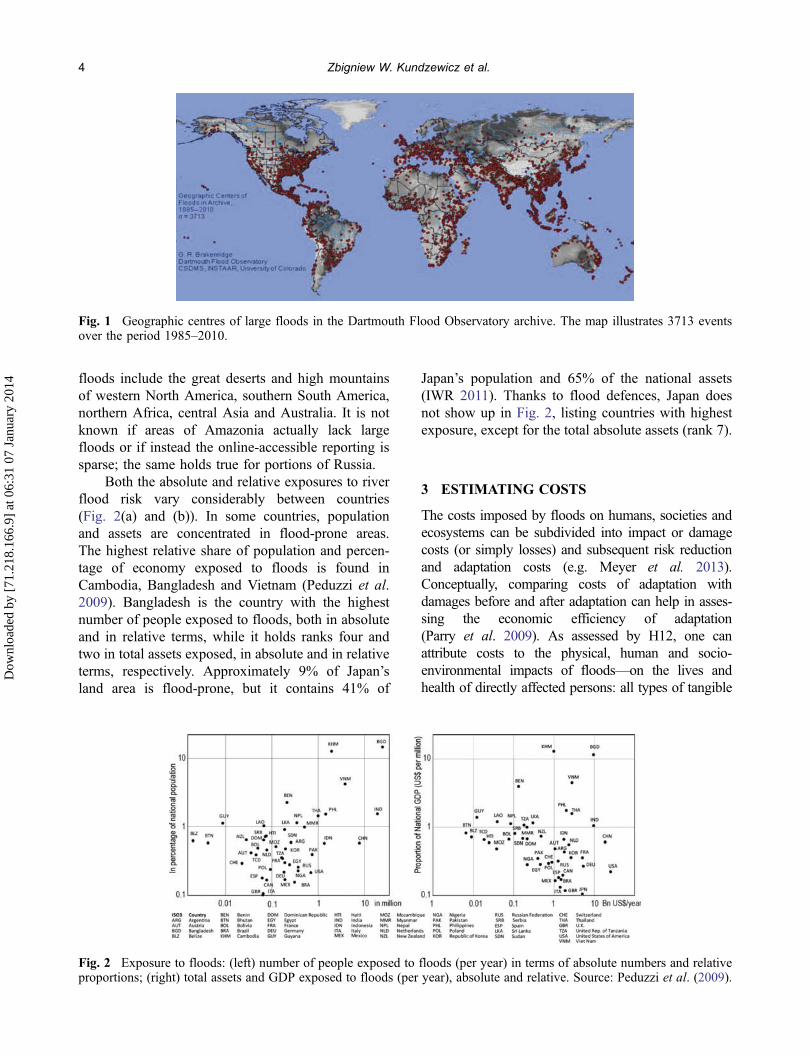
Both the absolute and relative exposures to riverflood risk vary considerably between countries(Fig. 2(a) and (b)). In some countries, populationand assets are concentrated in flood-prone areas.The highest relative share of population and percen-tage of economy exposed to floods is found inCambodia, Bangladesh and Vietnam (Peduzzi et al.2009). Bangladesh is the country with the highestnumber of people exposed to floods, both in absoluteand in relative terms, while it holds ranks four andtwo in total assets exposed, in absolute and in relativeterms, respectively. Approximately 9% of Japan’sland area is flood-prone, but it contains 41% of
Japan’s population and 65% of the national assets(IWR 2011). Thanks to flood defences, Japan doesnot show up in Fig. 2, listing countries with highestexposure, except for the total absolute assets (rank 7).
3 ESTIMATING COSTS
The costs imposed by floods on humans, societies andecosystems can be subdivided into impact or damagecosts (or simply losses) and subsequent risk reductionand adaptation costs (e.g. Meyer et al. 2013).Conceptually, comparing costs of adaptation withdamages before and after adaptation can help in asses-sing the economic efficiency of adaptation(Parry et al. 2009). As assessed by H12, one canattribute costs to the physical, human and socio-environmental impacts of floods—on the lives andhealth of directly affected persons: all types of tangible
Fig. 1 Geographic centres of large floods in the Dartmouth Flood Observatory archive. The map illustrates 3713 eventsover the period 1985–2010.
Fig. 2 Exposure to floods: (left) number of people exposed to floods (per year) in terms of absolute numbers and relativeproportions; (right) total assets and GDP exposed to floods (per year), absolute and relative. Source: Peduzzi et al. (2009).
4 Zbigniew W. Kundzewicz et al.
Dow
nloa
ded
by [
71.2
18.1
66.9
] at
06:
31 0
7 Ja
nuar
y 20
14
and intangible assets, including private dwellings, andagricultural, commercial and industrial stocks and facil-ities; infrastructure (e.g. transport facilities such asroads, railways, bridges and ports, energy and watersupply lines, and telecommunications); public facilities(e.g. hospitals, schools); and natural resources and theenvironment. Indirect impact costs arise due to thedisruption of the flow of goods and services (and there-fore economic activity) because of a disaster and aresometimes termed consequential or secondary impacts,as the losses typically flow from the direct impact of aclimate event (ECLAC 2003, World Bank 2010).Indirect damages may be caused by the directdamage to physical infrastructure or sources of live-lihoods, or because reconstruction pulls resourcesaway from production. Indirect damages includeadditional costs incurred because of the need touse alternative and potentially inferior means ofproduction and/or distribution of normal goods andservices (Cavallo and Noy 2009). Healthimpacts are typically seen as intangible and maybe direct or indirect depending on the circum-stances. Increasingly, health impacts are measuredthrough the cost of medical treatment and loss ofproductive time. This is shifting the impacts fromintangible to tangible, although the “market”requirement for tangible may not be satisfied.
Heavy precipitation and field flooding in agri-culture delay spring planting, increase soil compac-tion and cause crop losses through anoxia and rootdiseases. For ecosystems, flooding can be both ablessing (e.g. an advantageous “flood pulse” bringingan abundance of water and fertile solids) and a curse,leading to erosion and temporary or even permanentloss of habitat (as with the desert rodents studied byThibault and Brown 2008). Before the constructionof the High Aswan Dam, Nile floods sustained agri-culture in Lower Egypt. Inundations replenished wet-lands and aquifers, brought fertile sediments tocultivated areas and enhanced ecosystem services.
Floods are not bad for everyone: flood risks andbenefits are distributed very unevenly across socie-ties. The public sector, households and small busi-nesses bear most of the risk, whereas some elementsof the private sector benefit from land developmentin floodplains or reconstruction after floods (seeHandmer 2008).
Handmer et al. (2012; H12) assessed that direct,tangible impacts are comparatively easy to measure,but costing approaches are not necessarily standar-dized and assessments are often incomplete, whichcan make it difficult to aggregate and compare results
across the literature. In some countries, flood impactassessment has long been standardized, for examplein Britain and parts of the United States. Intangiblelosses can be estimated using various valuation tech-niques (see H12 for a review and list of relevantliterature). Estimates of impacts that account for tan-gibles and intangibles are expected to be much largerthan those that consider tangible impacts only(Handmer et al. 2002, Parry et al. 2009).
Typically, excluded impacts include loss ofhuman lives, cultural heritage, ecosystem servicesand indirect effects (impacts on the flows of tradeand finance that make up economies). However, eco-nomic activity may simply be displaced. For somecountries, informal or undocumented activity canmake up more than half a nation’s economy, butthis is rarely included in loss estimates. These aspectsare very important for developing consistent data-bases (see Kron et al. 2012).
4 CHANGES IN FLOOD RISK OVER TIME
4.1 Changes in heavy precipitation, river flowand floods
The SREX report assessed that it is likely that there havebeen statistically significant increases in the number ofheavy precipitation events in more regions than therehave been statistically significant decreases, but alsothat there are strong regional and sub-regional varia-tions in these trends. This assessment is somewhatweaker than that contained in the previous Fourthassessment report of the IPCC (AR4; Trenberth et al.2007; see also Nicholls and Seneviratne 2013). Overall,as highlighted in Alexander et al. (2006) and assessedin the SREX report (S12), observed changes in preci-pitation extremes have been found to be much lessspatially coherent and less statistically significant com-pared to observed changes in temperature extremes,despite the identification of global or large-scale signals(e.g. Zhang et al. 2007). Thus, global-scale changeshave been found not to map directly into regional-scale changes, where changes of opposite signal caneven be found in the same region.
Regarding the attribution of observed changes inheavy precipitation, the SREX report assessed thatthere is medium confidence that anthropogenic influ-ence has contributed to changes in extreme precipita-tion at the global scale, on the basis of, for instanceMin et al. (2008, 2011). However, the report alsonoted that the relevant scientific literature is too
Flood risk and climate change 5
Dow
nloa
ded
by [
71.2
18.1
66.9
] at
06:
31 0
7 Ja
nuar
y 20
14

sparse to attribute changes in extreme precipitationon a seasonal or regional scale (S12).
As highlighted in the SREX report (S12), theinfluence of anthropogenic climate change has beendetected in some variables that contribute to thehydrological cycle in affecting floods, includingmean precipitation (Zhang et al. 2007), heavy pre-cipitation and snowpack (Barnett et al. 2008), thougha direct statistical link between anthropogenic climatechange and trends in the magnitude/frequency offloods has not been established. In climates whereseasonal snow storage and melting play a significantrole in annual runoff, the hydrological regime isaffected by changes in temperature, and there isabundant evidence for changes in the timing (earlieroccurrence) of spring peak flows in snowmelt- andglacier-fed rivers (high confidence). However, not allsuch areas are experiencing changes in the magnitudeof peak flow.
Hence, the SREX report (S12) corroboratesRosenzweig et al. (2007) and Bates et al. (2008) instating that no gauge-based evidence has been iden-tified for a clear climate-driven, globally widespread,observed change in the magnitude/frequency of riverfloods during the last decades. There is thus lowconfidence regarding the magnitude/frequency andeven the sign of these changes.
This low confidence directly reflects the limitedevidence in many regions. Available instrumentalrecords of floods at stream gauge stations are oftensparse in space and short or interrupted in time.Moreover, changes in land use and river engineeringfurther hamper the identification of climate-driventrends. No doubt, long-term records can tell usmuch about persistence and natural variability.However, despite needing the long-term record forall sorts of reasons, we should not assume that thislong-term record is the best predictor of the future.Perhaps the more recent record is. Hence, one shouldbe extremely careful with projecting past trends for-ward in time.
Even without a change (such as gradual trend),there are extended departures of flood records fromlong-term average conditions. Among their possiblesources are quasi-periodic unforced oscillations ofthe ocean–atmosphere system. For instance, the prob-ability of flooding in particular regions is related toEl Niño or La Niña phases of the ENSO (El NiñoSouthern Oscillation) cycle (e.g. Wells 1990) or theAMO (Atlantic Multi-decadal Oscillation) phase (e.g.Bouwer et al. 2008). There is a long-term persistenceof flooding that could be viewed in the sense of Hurst
(see Koutsoyiannis 2011) and Mandelbrot’s Noaheffect, referring to the biblical pharaoh’s dream, andclustering of wet and dry years, creating flood-richand flood-poor episodes. For instance, on the Danubein Vienna, grouping of five of the six largest floods inthe 19th century was observed in the last two decadesof the century, illustrating pronounced clustering ofextreme events (Blöschl and Montanari 2010).Climate models do not adequately represent long-termpersistence that is observed in real data, and the effect istypically ignored in climate studies (Koutsoyiannis andMontanari 2007). The implications are not fully under-stood or recognized. Acceptance of the long-term per-sistence hypothesis would lead to a dramatic increase inuncertainty in statistical estimation. This thwarts thetrend detection.
Because the length of river gauge record is lim-ited, there is no information about the largest eventsthat occurred in the past, that is beyond the recentexperience based on instrumental records, as well asabout return periods of extreme floods and theirtendency for clustering. Hence, acquiring informationon pre-instrumental events is a very welcome way ofextending river records. This underpins the impor-tance of palaeohydrology or palaeoflood hydrology,using information encapsulated in geophysicalarchives and historical hydrology, dealing mainlywith documentary evidence about hydrologicalevents (Brázdil and Kundzewicz 2006, Brázdil et al.2006). The optimal merging of instrumental, histor-ical and palaeo-information is of considerable impor-tance for understanding flood hazard and significanceof multi-decadal climate variability of floodincidence.
4.2 Observed trends in costs of flooding
There is persuasive evidence that the costs ofextreme weather events, with flooding as amajor contributor, have been exhibiting a signifi-cant upward trend (UNISDR 2011). The numberof reported hydrological events (floods and land-slides) worldwide associated with major losseshas considerably increased in the last three dec-ades (Fig. 3) at a rate greater than the number ofreported geophysical events. This difference in therate between geophysical/seismic events andhydrological events underpins that vulnerabilityand exposure may not develop in a similar man-ner over time (Bouwer 2011).
It is acknowledged that reporting on hydro-meteor-ological disasters has improved significantly because of
6 Zbigniew W. Kundzewicz et al.
Dow
nloa
ded
by [
71.2
18.1
66.9
] at
06:
31 0
7 Ja
nuar
y 20
14

a denser satellite network, the Internet and internationalmedia, whereas earthquakes were recorded globallyfrom terrestrial stations (Peduzzi et al. 2012). Theseimprovements have introduced a bias in informationaccess through time, which needs to be addressed intrend analysis (Peduzzi et al. 2012). Although manyloss records exhibit biases, the record since 1980, pre-sented here in Fig. 3, is more robust for both types ofevents, as it only contains large events, and events since1980 have been well documented. However, a portionof this difference may be related to changes in weatherpatterns and rainfall characteristics. Yet, there are indi-cations that population and assets exposed to floodshave increased more rapidly than overall population oreconomic growth (Bouwer et al. 2007, Di Baldassareet al. 2010, Bouwer 2011, Jongman et al. 2012).
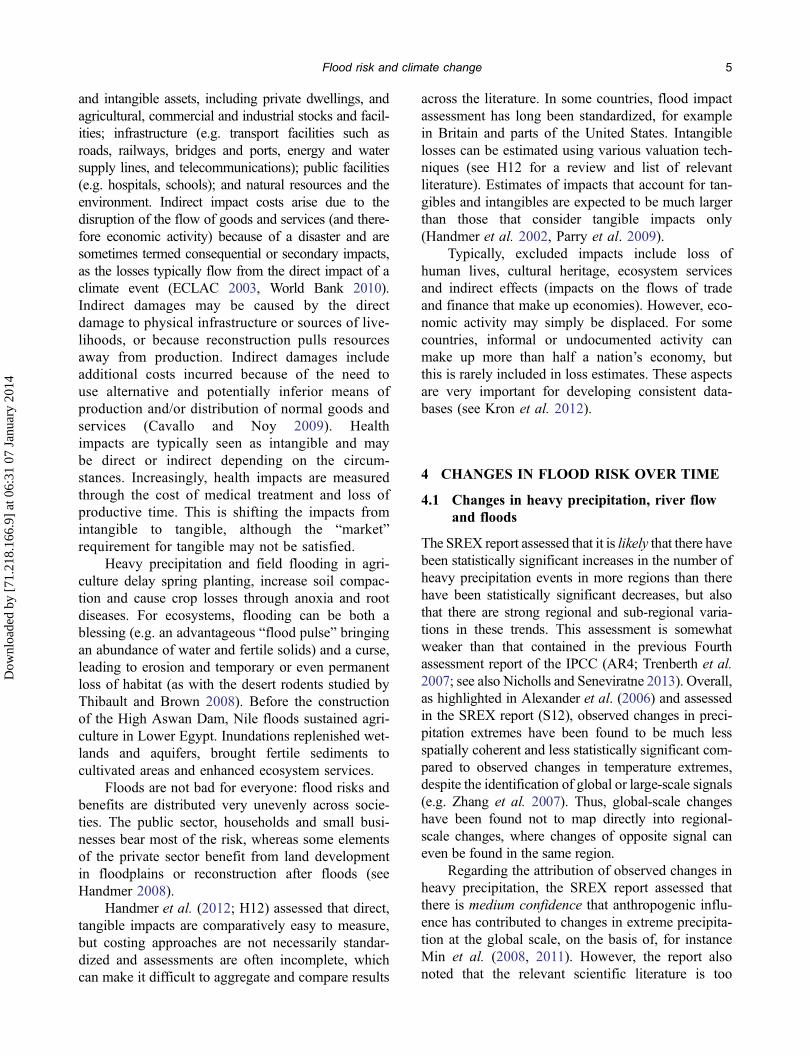
The SREX report assessed that there is highconfidence, based on high agreement and mediumevidence, that economic losses from weather- andclimate-related disasters have increased (see refer-ences in H12). Increases in total and insured lossesfrom flood disasters are illustrated in Fig. 4. Todetermine whether trends in such losses can be attrib-uted to climate change, losses over time need to becontrolled for changes in the value of what isexposed and its inherent vulnerability. When this isdone, normalizing loss records for changes over time
in exposure and wealth, most studies using longitu-dinal disaster loss data attribute the observed increasein losses over time to increasing exposure of peopleand assets in at-risk areas (Miller et al. 2008, Bouwer2011). Social, demographic, economic and politicaltrends may also be important in shaping vulnerabilityto impacts (Pielke et al. 2005, Bouwer et al. 2007).There is medium evidence and high agreement that“long-term trends in normalized losses have not beenattributed to natural or anthropogenic climatechange” (see references in H12).
Results from studies of a range of regions didnot show a flood signal related to anthropogenicclimate change (Pielke and Downton 2000,Downton et al. 2005, Barredo 2009, Hilker et al.2009, Neumayer and Barthel 2011, Barredo et al.2012). Although this is the general picture, a fewstudies observed a partial relationship between recentincreases in flood losses and (short-term) changes inintense rainfall events (Fengqing et al. 2005, Changet al. 2009, Barthel and Neumayer 2012), and somestudies suggest an increase in damages related toflash floods and a changing incidence in extremeprecipitation (Changnon 2001). However, a Swissstudy of normalized losses from flash floods andlandslides failed to identify any significant trends(Hilker et al. 2009).
©2013 Munich Re, Geo Risks Research, NatCatSERVICE
Hydrological eventsGeophysical events
% o
f tre
nd v
alue
in 1
980
Fig. 3 Relative number of hydrological and geophysical events 1980–2012. Base: value of trend lines for absolutenumbers in 1980. Source: Munich Re NatCatSERVICE, June 2013.
Flood risk and climate change 7
Dow
nloa
ded
by [
71.2
18.1
66.9
] at
06:
31 0
7 Ja
nuar
y 20
14
4.3 Reasons for a perceived increase in flood risk
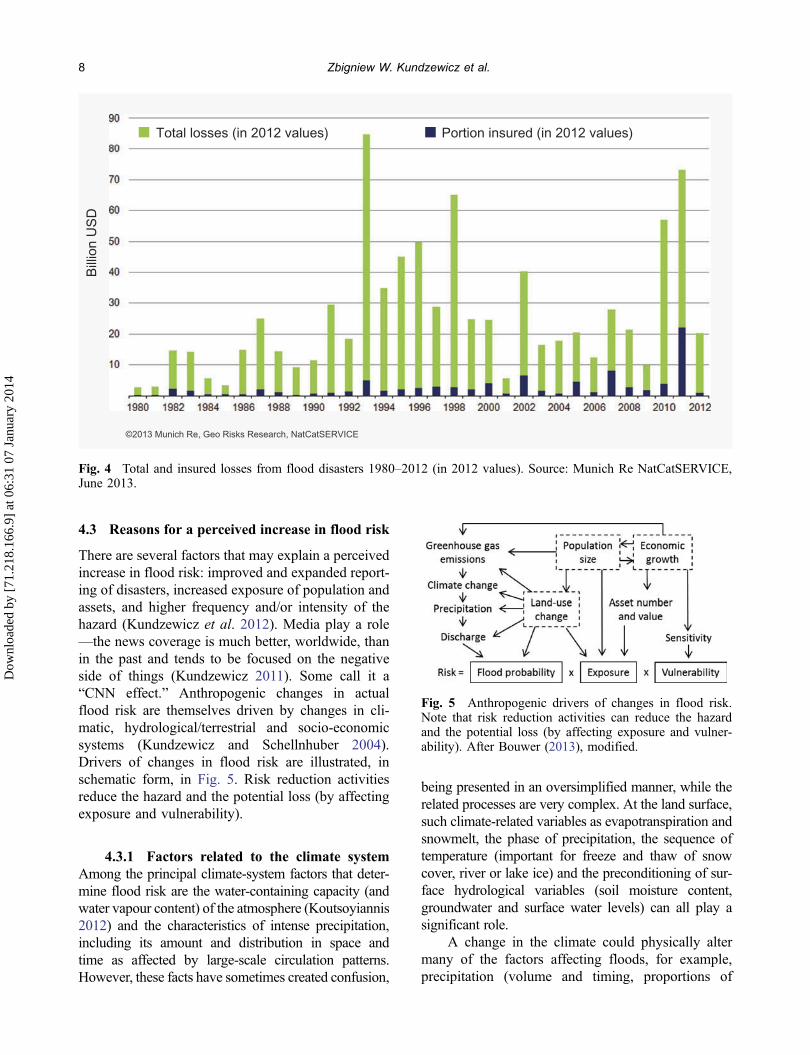
There are several factors that may explain a perceivedincrease in flood risk: improved and expanded report-ing of disasters, increased exposure of population andassets, and higher frequency and/or intensity of thehazard (Kundzewicz et al. 2012). Media play a role—the news coverage is much better, worldwide, thanin the past and tends to be focused on the negativeside of things (Kundzewicz 2011). Some call it a“CNN effect.” Anthropogenic changes in actualflood risk are themselves driven by changes in cli-matic, hydrological/terrestrial and socio-economicsystems (Kundzewicz and Schellnhuber 2004).Drivers of changes in flood risk are illustrated, inschematic form, in Fig. 5. Risk reduction activitiesreduce the hazard and the potential loss (by affectingexposure and vulnerability).
4.3.1 Factors related to the climate systemAmong the principal climate-system factors that deter-mine flood risk are the water-containing capacity (andwater vapour content) of the atmosphere (Koutsoyiannis2012) and the characteristics of intense precipitation,including its amount and distribution in space andtime as affected by large-scale circulation patterns.However, these facts have sometimes created confusion,
being presented in an oversimplified manner, while therelated processes are very complex. At the land surface,such climate-related variables as evapotranspiration andsnowmelt, the phase of precipitation, the sequence oftemperature (important for freeze and thaw of snowcover, river or lake ice) and the preconditioning of sur-face hydrological variables (soil moisture content,groundwater and surface water levels) can all play asignificant role.
A change in the climate could physically altermany of the factors affecting floods, for example,precipitation (volume and timing, proportions of
Bill
ion
US
D
Total losses (in 2012 values) Portion insured (in 2012 values)
©2013 Munich Re, Geo Risks Research, NatCatSERVICE
Fig. 4 Total and insured losses from flood disasters 1980–2012 (in 2012 values). Source: Munich Re NatCatSERVICE,June 2013.
Fig. 5 Anthropogenic drivers of changes in flood risk.Note that risk reduction activities can reduce the hazardand the potential loss (by affecting exposure and vulner-ability). After Bouwer (2013), modified.
8 Zbigniew W. Kundzewicz et al.
Dow
nloa
ded
by [
71.2
18.1
66.9
] at
06:
31 0
7 Ja
nuar
y 20
14
precipitation falling as snow and rain), snow cover,antecedent soil moisture content, surface water levels,sea level, glacial lake conditions and vegetation, andthus may change the characteristics of floods.
Seneviratne et al. (2012; S12) assesses that it “islikely that there have been statistically significantincreases in the number of heavy precipitation events(e.g. 95th percentile of precipitation totals of all dayswith precipitation) in more regions than there havebeen statistically significant decreases, but there arestrong regional and subregional variations in thetrends.” Even if 95th percentile does not representan extreme event, taking a higher, say, 99th percen-tile, we would have to deal with a much smallersample size; hence, there is a trade-off between thepercentile and the sample size.
4.3.2 Factors related to terrestrial/hydrologicalsystems The characteristics of terrestrial/hydrologicalsystems play a pivotal part in driving flood risk. Themost pertinent are catchment size, geology, landscape,topography and soils; the latter are often strongly mod-ified by human intervention. River discharge is an inte-grated result of processes in the drainage basin—fromprecipitation to runoff.
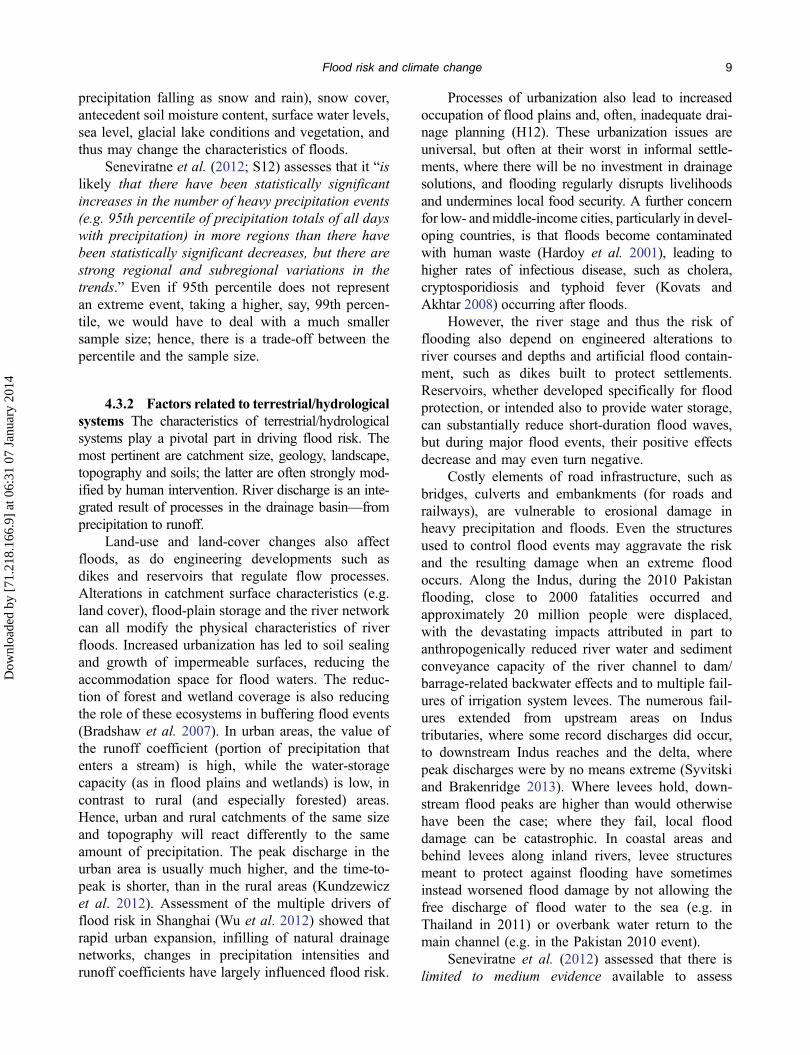
Land-use and land-cover changes also affectfloods, as do engineering developments such asdikes and reservoirs that regulate flow processes.Alterations in catchment surface characteristics (e.g.land cover), flood-plain storage and the river networkcan all modify the physical characteristics of riverfloods. Increased urbanization has led to soil sealingand growth of impermeable surfaces, reducing theaccommodation space for flood waters. The reduc-tion of forest and wetland coverage is also reducingthe role of these ecosystems in buffering flood events(Bradshaw et al. 2007). In urban areas, the value ofthe runoff coefficient (portion of precipitation thatenters a stream) is high, while the water-storagecapacity (as in flood plains and wetlands) is low, incontrast to rural (and especially forested) areas.Hence, urban and rural catchments of the same sizeand topography will react differently to the sameamount of precipitation. The peak discharge in theurban area is usually much higher, and the time-to-peak is shorter, than in the rural areas (Kundzewiczet al. 2012). Assessment of the multiple drivers offlood risk in Shanghai (Wu et al. 2012) showed thatrapid urban expansion, infilling of natural drainagenetworks, changes in precipitation intensities andrunoff coefficients have largely influenced flood risk.
Processes of urbanization also lead to increasedoccupation of flood plains and, often, inadequate drai-nage planning (H12). These urbanization issues areuniversal, but often at their worst in informal settle-ments, where there will be no investment in drainagesolutions, and flooding regularly disrupts livelihoodsand undermines local food security. A further concernfor low- andmiddle-income cities, particularly in devel-oping countries, is that floods become contaminatedwith human waste (Hardoy et al. 2001), leading tohigher rates of infectious disease, such as cholera,cryptosporidiosis and typhoid fever (Kovats andAkhtar 2008) occurring after floods.
However, the river stage and thus the risk offlooding also depend on engineered alterations toriver courses and depths and artificial flood contain-ment, such as dikes built to protect settlements.Reservoirs, whether developed specifically for floodprotection, or intended also to provide water storage,can substantially reduce short-duration flood waves,but during major flood events, their positive effectsdecrease and may even turn negative.
Costly elements of road infrastructure, such asbridges, culverts and embankments (for roads andrailways), are vulnerable to erosional damage inheavy precipitation and floods. Even the structuresused to control flood events may aggravate the riskand the resulting damage when an extreme floodoccurs. Along the Indus, during the 2010 Pakistanflooding, close to 2000 fatalities occurred andapproximately 20 million people were displaced,with the devastating impacts attributed in part toanthropogenically reduced river water and sedimentconveyance capacity of the river channel to dam/barrage-related backwater effects and to multiple fail-ures of irrigation system levees. The numerous fail-ures extended from upstream areas on Industributaries, where some record discharges did occur,to downstream Indus reaches and the delta, wherepeak discharges were by no means extreme (Syvitskiand Brakenridge 2013). Where levees hold, down-stream flood peaks are higher than would otherwisehave been the case; where they fail, local flooddamage can be catastrophic. In coastal areas andbehind levees along inland rivers, levee structuresmeant to protect against flooding have sometimesinstead worsened flood damage by not allowing thefree discharge of flood water to the sea (e.g. inThailand in 2011) or overbank water return to themain channel (e.g. in the Pakistan 2010 event).
Seneviratne et al. (2012) assessed that there islimited to medium evidence available to assess
Flood risk and climate change 9
Dow
nloa
ded
by [
71.2
18.1
66.9
] at
06:
31 0
7 Ja
nuar
y 20
14

climate-driven observed changes in the magnitudeand frequency of floods at regional scales.However, the available instrumental records of floodsat gauge stations are limited in space and time andbecause of the confounding effects of changes in landuse and engineering. Furthermore, there is low agree-ment in this evidence and thus overall low confidenceat the global scale regarding even the sign of thesechanges. Changing flood risk is especially proble-matic in semi-arid regions where spate occurrenceand magnitudes can be highly erratic.
4.3.3 Factors related to socio-economic systemsChanges in population size and development, and levelof protection, strongly influence changes in exposure toflood hazards.
Over time, population has increased in most flood-prone areas, and the accumulation of assets has increasedexposure to loss. There are indications that exposedpopulation and assets have increased more rapidly thanoverall population or economic growth (Bouwer et al.2007, Bouwer 2011) because of increasing concentrationin flood-prone areas.
At the same time, improved flood protection andflood management measures have reduced losses inmany flood-prone areas, particularly in high-incomeareas. Investment in flood warning and evacuation pro-cedures may reduce the number of flood fatalities, whilehaving less effect on the levels of material damage.
Based on data from 1970 to 2010, the number offatalities caused by floods has decreased globally,despite an increase in exposure. This decrease ismostly attributable to fast-paced urbanization inChina. Worldwide, economic losses continue to risebcause of a significant increase in the exposure inflood plains fuelled by rapid economic growth. Also,even in China, the lethal flooding in parts of Beijingin the summer of 2012, which claimed ~80 lives,indicates that urbanization itself can increase floodimpacts locally.
4.3.4 Difficulty in identification of climatesignals Assessing the causes of changes in floodhazard is complex (S12, H12); they may be relatedto both climatic and non-climatic factors, which canbe difficult to distinguish in the instrumental record.In particular, those rivers that threaten towns andcities are typically not in their natural state, makingit difficult to separate changes in the flow data relatedto climate from ongoing alterations in land-usechange (including urbanization) and altered river reg-ulation. These effects in combination are difficult to
quantify, and, for instance, in the case of land coverchanges, even the sign of imposed hydrologicalchanges is partly uncertain (e.g. Gerten et al. 2008,Pitman et al. 2009, Teuling et al. 2010, Oliveira et al.2011). Land-use effects on flood risk can only beconvincingly demonstrated through model-basedanalysis; there are simply too many confoundingfactors for empirically-based attribution except atvery local, plot or experimental scales.
Finally, flood frequency analysis deals with dis-charge records, as commonly obtained via river stage(level) conversions to discharge at gauging stations via arating curve.Where channel aggradation (ordegradation)is occurring, however, the stage/discharge relation is notstable, and flooding may increase (or decrease), withhigher (or lower) river levels occurring with the sameflood discharge. Indeed, many sites worldwide makeregular revisions of the rating curve to account for thechannel changes, but rating curve estimates are particu-larly problematic for semi-arid wadi systems, whereflows may be short-lived and high-magnitude, and thechannel cross-section is changing during each floodevent. As regards flooding and climate change, however,the focus is on whether meteorology-derived flood peakdischarges or flood water volumes are changing.
5 A GLOBAL PERSPECTIVE ON FUTUREFLOOD RISK
5.1 Introduction
Future changes in flood risk are expected to be drivenby a combination of potential changes in climate(especially precipitation), catchment conditions andexposure to loss. Interpretation of changes has beenthe focus of the new Panta Rhei decade of theInternational Association of Hydrological Sciences(IAHS) (Montanari et al. 2013). Eloquent, philoso-phical discussion of multi-scale changes, backing thePanta Rhei notion, was given by Koutsoyiannis(2013), including climacograms spanning manyorders of magnitude of time units.
This section considers first how precipitationmay change in the future, then reviews how riverflows and flood frequencies may change, beforeexamining potential changes in exposure to floodingand future flood costs.
5.2 Flood-generating precipitation
The assessment of projected changes in heavy pre-cipitation events is of key relevance when attributing
10 Zbigniew W. Kundzewicz et al.
Dow
nloa
ded
by [
71.2
18.1
66.9
] at
06:
31 0
7 Ja
nuar
y 20
14
related variations in flood risk, as discussed in somedepth in S12. The following paragraphs provide asummary of this material.
The SREX report (S12) concluded that it is likelythat the frequency of heavy precipitation or the propor-tion of total rainfall from intense events will increase inthe 21st century over many areas of the globe, and thatthis is particularly the case in the high latitudes andtropical regions and in winter in the northern mid-lati-tudes (S12). The report also concluded that heavy rain-falls associated with tropical cyclones are likely toincrease with continued warming and that there is med-ium confidence that, in some regions, increases in heavyprecipitation will occur despite projected decreases intotal precipitation. The stronger CO2 emissions scenar-ios (A1B andA2) lead to stronger projected increases inthe probability (i.e. decreases in the return period) ofevents considered extreme with respect to the end of20th century climate (Fig. 6), as well as higher percen-tage increases in the absolute magnitude of heavy pre-cipitation events with a 20-year return period. TheSREX assessment (S12) is comparable with the assess-ment from the AR4 (Christensen et al. 2007), thoughslightly weaker (“many areas” instead of “most areas”and “likely” instead of “very likely”; see also Nichollsand Seneviratne 2013 for details). The weaker SREXassessment reflects post-AR4 studies, indicating largeuncertainties in the projection of precipitation extremesassociated with uncertainties in models, downscalingtechniques and natural variability (Nicholls andSeneviratne 2013). The current generation of GCMsdo not even preserve mass in the global water balance(see Liepert and Previdi 2012), so one should be cau-tious about projected changes in precipitation extremesat smaller-than-global scales (see Anagnostopouloset al. 2010). Selection of daily precipitation as an impor-tant measure, yet not “the”measure, is backed by broadexperience in various regions. For instance, in Japan,daily precipitation is a good index for flood defenceplanning for river basins from a few to 10 000 km2.
Figure 6 displays the projected return periods forlate-20th century “20-year return values” of annual max-imum daily precipitation rates in the mid-21st century(on the left of each plot) and in the late-21st century (onthe right of each plot) under three different emissionsscenarios, SRESB1, A1B andA2. The late-20th centurydata set was obtained from simulations of the 20thcentury climate (20C3M) validated with four reanalysisdata sets, and return values were estimated froma generalized extreme value distribution fitted at everygrid point to samples of precipitation extremes (Kharinet al. 2007). Although there are exceptions, the analyses
display an overall tendency for a decrease in returnperiods. Medians fall below the late-20th century returnperiod for all regions except the Sahara (Region 14). The50% central (inter-quartile) range (coloured boxes ineach plot) for the end-of-21st century projections gener-ally falls below the late-20th century return period,except for Southern Europe and the Mediterranean(Region 13), Central America and Mexico (Region 6),and the Sahara (Region 14). For such regions as Alaska/NWCanada and SE Asia, there is the strongest decreaseof the median for 2081–2100 (nearly fourfold—froma return period of 20 years to slightly over 5 years,for A2). For the Sahara region (14), the median increasesslightly for A2, whereas whiskers range from 5 to 56years (i.e. some models indicate that the 20-year heavyprecipitation in the control period may become aboutfour times more frequent, but other models project that itmay become nearly three times less frequent in 2081–2100). The uncertainty is very high in that region, evenregarding the direction of change, let alone its magni-tude. Hence, this analysis illustrates the strong regionaldependency of the projected changes, with overall largerchanges in the high-latitude and tropical regions andoverall larger uncertainty in drier regions such as theSahara, Central America and Mexico, as well asSouthern Europe and the Mediterranean.
With respect to projected future changes inheavy precipitation events, the SREX report (S12)assessed that there is medium confidence (based onphysical reasoning) that projected increases in heavyrainfall would contribute to increases in local flood-ing in some catchments or regions, and thus theseregional variations in projections of changes in heavyprecipitation should play an important role in chan-ging flood occurrence at the regional scale.
Stephens et al. (2010) report little skill in pre-cipitation calculated at individual grid cells, using theexpression “dreary state of precipitation in globalmodels.” Models produce more frequent and lessintense precipitation. Problems of representation ofprecipitation in climate models from the viewpoint ofhydrology are discussed by Koutsoyiannis et al.(2008, 2011) and Kundzewicz and Stakhiv (2010).
5.3 River flows and floods
As highlighted in the SREX report (S12), the numberof regional- or continental-scale studies of projectedchanges in river floods is still very limited. Recently,however, a few studies for Europe (Lehner et al.2006, Dankers and Feyen 2008) and a global study(Hirabayashi et al. 2008) have projected expected
Flood risk and climate change 11
Dow
nloa
ded
by [
71.2
18.1
66.9
] at
06:
31 0
7 Ja
nuar
y 20
14
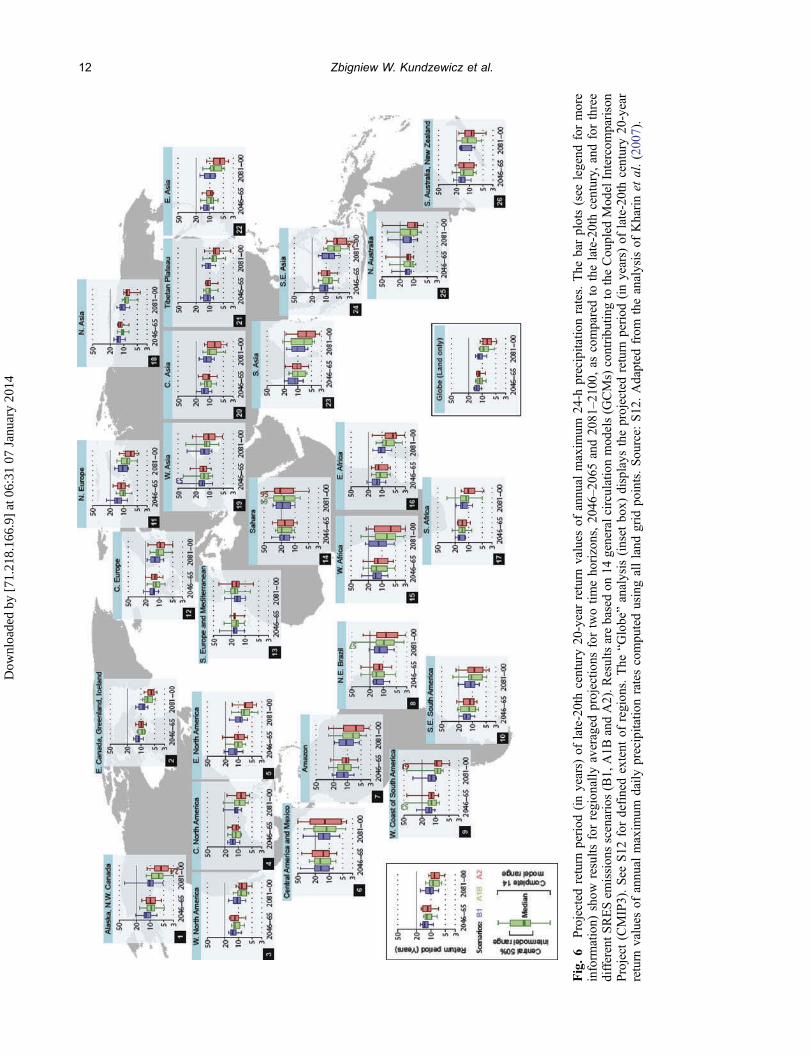
Fig.6
Projected
return
period
(inyears)
oflate-20thcentury20-yearreturn
values
ofannual
maxim
um24-h
precipitatio
nrates.The
barplots(see
legend
formore
inform
ation)
show
results
forregionally
averaged
projectio
nsfortwotim
ehorizons,2046
–2065and2081
–2100,
ascomparedto
thelate-20thcentury,
andforthree
differentSRESem
issionsscenarios(B1,
A1B
andA2).R
esultsarebasedon
14generalcirculationmodels(G
CMs)contributin
gto
theCoupled
ModelIntercom
parison
Project
(CMIP3).See
S12
fordefinedextent
ofregions.The
“Globe”analysis(inset
box)
displays
theprojectedreturn
period
(inyears)
oflate-20thcentury20-year
return
values
ofannual
maxim
umdaily
precipitatio
nratescomputedusingallland
grid
points.Source:
S12.Adapted
from
theanalysisof
Kharinet
al.(2007).
12 Zbigniew W. Kundzewicz et al.
Dow
nloa
ded
by [
71.2
18.1
66.9
] at
06:
31 0
7 Ja
nuar
y 20
14
changes in the frequency and/or magnitude of floodsin the 21st century at a large scale and employingdaily river discharges calculated from regional cli-mate model (RCM) or global climate model (GCM)outputs linked with hydrological models. There arerelatively few projections of flood changes at thescale of river basins in the scientific literature; mostof them apply to Europe and North America (seereview in S12).
Hirabayashi et al. (2013) evaluated the spatiallydistributed flood risk over the globe for the end of the21st century, based on outputs of 11 climate modelsand a global river routing model. For an ensemble ofprojections under a high-concentration scenario(RCP8.5), an event corresponding to a 20th century100-year flood is projected to be exceeded morefrequently in 42% and less frequently in 18% of theland grid cells. Using the inter-model median, a largeincrease in flood hazard was projected in South Asiaand Southeast Asia, as well as in parts of Africa andSouth America, but a decrease in flood hazard wasalso projected in certain areas.
5.4 Exposure to flood hazard
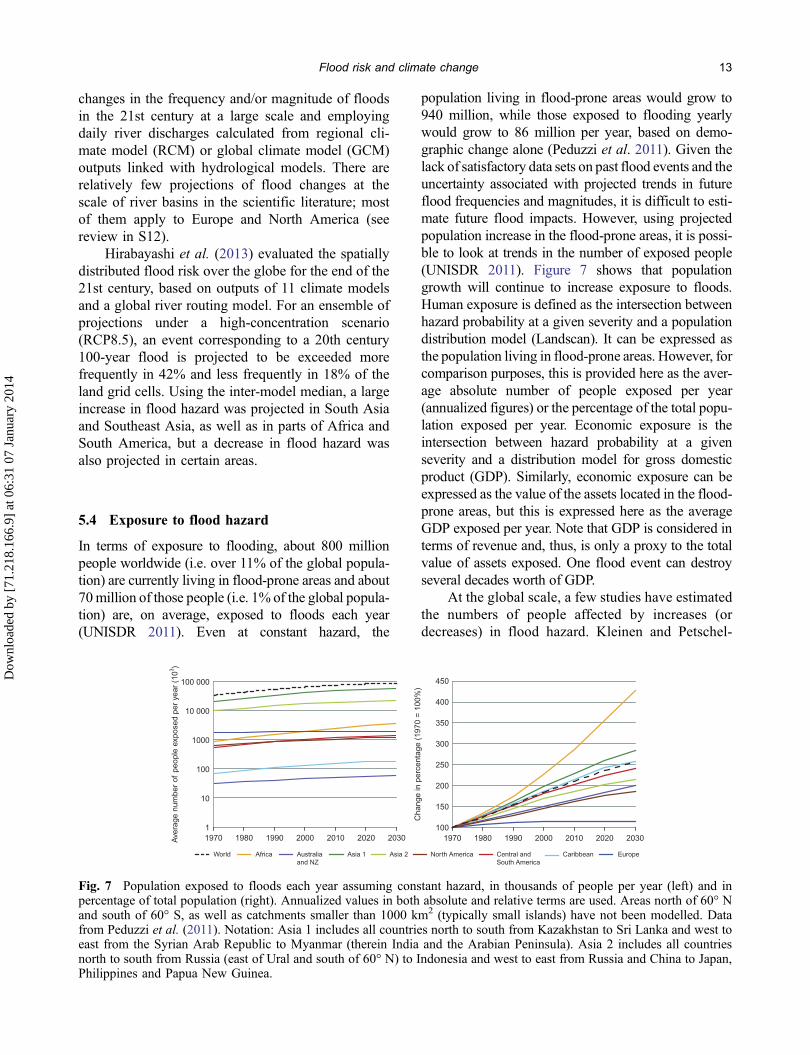
In terms of exposure to flooding, about 800 millionpeople worldwide (i.e. over 11% of the global popula-tion) are currently living in flood-prone areas and about70million of those people (i.e. 1% of the global popula-tion) are, on average, exposed to floods each year(UNISDR 2011). Even at constant hazard, the
population living in flood-prone areas would grow to940 million, while those exposed to flooding yearlywould grow to 86 million per year, based on demo-graphic change alone (Peduzzi et al. 2011). Given thelack of satisfactory data sets on past flood events and theuncertainty associated with projected trends in futureflood frequencies and magnitudes, it is difficult to esti-mate future flood impacts. However, using projectedpopulation increase in the flood-prone areas, it is possi-ble to look at trends in the number of exposed people(UNISDR 2011). Figure 7 shows that populationgrowth will continue to increase exposure to floods.Human exposure is defined as the intersection betweenhazard probability at a given severity and a populationdistribution model (Landscan). It can be expressed asthe population living in flood-prone areas. However, forcomparison purposes, this is provided here as the aver-age absolute number of people exposed per year(annualized figures) or the percentage of the total popu-lation exposed per year. Economic exposure is theintersection between hazard probability at a givenseverity and a distribution model for gross domesticproduct (GDP). Similarly, economic exposure can beexpressed as the value of the assets located in the flood-prone areas, but this is expressed here as the averageGDP exposed per year. Note that GDP is considered interms of revenue and, thus, is only a proxy to the totalvalue of assets exposed. One flood event can destroyseveral decades worth of GDP.
At the global scale, a few studies have estimatedthe numbers of people affected by increases (ordecreases) in flood hazard. Kleinen and Petschel-
100 000 450
400
350
300
250
200
150
100
10 000
1000
100
Ave
rage
num
ber
of p
eopl
e ex
pose
d pe
r ye
ar (
103 )
Cha
nge
in p
erce
ntag
e (1
970
= 10
0%)
10
11970
World Africa Australiaand NZ
Asia 1 Asia 2 North America Central andSouth America
Caribbean Europe
1980 1990 2000 2010 2020 2030 1970 1980 1990 2000 2010 2020 2030
Fig. 7 Population exposed to floods each year assuming constant hazard, in thousands of people per year (left) and inpercentage of total population (right). Annualized values in both absolute and relative terms are used. Areas north of 60° Nand south of 60° S, as well as catchments smaller than 1000 km2 (typically small islands) have not been modelled. Datafrom Peduzzi et al. (2011). Notation: Asia 1 includes all countries north to south from Kazakhstan to Sri Lanka and west toeast from the Syrian Arab Republic to Myanmar (therein India and the Arabian Peninsula). Asia 2 includes all countriesnorth to south from Russia (east of Ural and south of 60° N) to Indonesia and west to east from Russia and China to Japan,Philippines and Papua New Guinea.
Flood risk and climate change 13
Dow
nloa
ded
by [
71.2
18.1
66.9
] at
06:
31 0
7 Ja
nuar
y 20
14

Held (2007) calculated the percentage of the globalpopulation living in river basins in which the returnperiod of the current 50-year flood event becomesshorter, for three climate models and a range ofwarming scenarios. For an increase in global meantemperature of 2°C above late-20th century tempera-tures, they found that between 5 and 27% of theworld’s population would live in river basins wherethe current 50-year return period flood occurs at leasttwice as frequently. Hirabayashi and Kanae (2009)used a different metric, counting each year the num-ber of people living in grid cells where the floodpeak exceeded the (current) 100-year magnitude,using runoff as simulated by a high-resolution cli-mate model fed through a river routing model. Theyprojected increases in the number of people affectedby substantial flooding. Finally, Hirabayashi et al.(2013) asserted that the global exposure to floodswould increase, depending on the degree of warm-ing, but that inter-annual variability of exposure isstrong.
5.5 Future costs of flooding
Several studies have addressed future expected eco-nomic losses from river floods, most of which arefocused on Europe (Bouwer 2013) (see Table 1).These studies combine a range of approaches forarriving at estimates of future losses. They accountfor changes in hazard on the basis of projectedclimate change and use loss model estimates. Theyall project an increase in economic flood losses,albeit to different extents. Furthermore, it is
important to note that some studies also assessedthe combined effects owing to both exposure(related to on-going socio-economic changes) andanthropogenic climate change resulting from green-house gas emissions.
These studies generally show that the com-bined effect of climate change and changes in expo-sure is higher, but also that exposure (increase inthe number of assets and their value) is of similarmagnitude to changes in climate over this timeperiod. At the same time, these numbers must beconsidered with care, as uncertainties in these pro-jections are high, the studies use different methodsand approaches (Bouwer 2013), and many localfactors are included in the projections that preventextrapolation to other regions or the global level.Nevertheless, they provide an indication of futureflood risk trends and thereby can support theassessment of future risks.
Economic, including insured, flood disasterlosses are higher in developed countries, while rela-tive fatality rates and economic losses expressed as aproportion of GDP are higher in developing countries(high confidence).
6 REGIONAL PERSPECTIVES
The SREX report also assessed changes in flood riskin seven regions: Africa, Asia, Central and SouthAmerica, Europe, North America, Oceania and thePolar regions, drawing from H12 and S12. Europeand North America have very good data and analyses
Table 1 Projected increase in disaster losses in 2040 under projected climate change and exposure change,relative to 2000, from available impact studies including median estimates.
Study Hazard type Region Projected loss increase (%) in 2040
Min Max Mean Median
Impact of projected anthropogenic climate change, exposure held constantBouwer et al. (2010) River flooding Netherlands 46 201 124 83Feyen et al. (2009) River flooding Europe 83ABI (2009) River flooding United Kingdom 3 11 7Te Linde et al. (2011) River flooding Rhine Basin 57 213 135Feyen et al. (2009) River flooding Spain (Madrid) 36Schneider et al. (2000) Local flooding Australia 67 514 361Hoes (2007) Local flooding Netherlands 16 70 47
Impact of projected exposure change, climate held constantBouwer et al. (2010) River flooding Netherlands 35 172 104Te Linde et al. (2011) River flooding Rhine Basin 10 36 23Feyen et al. (2009) River flooding Spain (Madrid) 349Hoes (2007) Local flooding Netherlands 4 72 29
Source: Adapted from Bouwer (2013).
14 Zbigniew W. Kundzewicz et al.
Dow
nloa
ded
by [
71.2
18.1
66.9
] at
06:
31 0
7 Ja
nuar
y 20
14

compared with the other regions, where uncertaintiesare stronger.
6.1 Africa
The periods of extreme rainfall and recurrent floodsappear to correlate with the El Niño phase of ENSOevents (e.g. 1982–1983, 1997–1998 and 2006–2007)and generate significant economic and human losses.In 2000, floods in Mozambique, particularly alongthe valleys of the rivers Limpopo, Save and Zambezi,resulted in 700 reported deaths and about half amillion homeless. The floods had a devastating effecton livelihoods, destroying agricultural crops, disrupt-ing electricity supplies and demolishing basic infra-structure (Osman-Elasha et al. 2006).
There is low to medium confidence in regionaltrends in heavy precipitation in Africa due to thescarcity of both previous studies and observationaldata (see Conway et al. (2009) reviewing the evi-dence for hydrological change in sub-SaharanAfrica), as well as reflecting the lack of consistencyin those patterns reported in some regions.
Di Baldassarre et al. (2010) found no evidencethat the magnitude of African floods has increasedduring the 20th century. Yet, projections byHirabayashi et al. (2008) indicate an expectedincrease in the risk of floods in tropical Africa.
Heavy precipitation may induce landslides anddebris flows in tropical mountain regions, with poten-tial impacts for human settlements. In the arid andsemi-arid areas of countries in the Horn of Africa,extreme rainfall events are often associated with ahigher risk of the vector and epidemic diseases ofmalaria, dengue fever, cholera, Rift Valley fever andhantavirus pulmonary syndrome (Anyamba et al.2006, McMichael et al. 2006).
However, floods can be highly beneficial inAfrican drylands (e.g. the Sahara and Namib deserts),since the floodwaters infiltrate and recharge alluvialaquifers along ephemeral river pathways, extendingwater availability to dry seasons and drought years(Morin et al. 2009, Benito et al. 2010) and support-ing riparian systems and human communities.
6.2 Asia
Globally, the most devastating flood disasters, killingthousands of people, continue to occur in Asia. Thegeographical distribution of flood risk is heavily con-centrated in Bangladesh and the two countries with thegreatest population—China and India—causing high
human and material losses (Bouwer et al. 2007, Dashet al. 2007, Shen et al. 2008, Douglas 2009).
Bangladesh is perhaps the most flood-pronecountry, globally. As noted in the final report forthe Ministry of Environment and Forest (2005) ofthe People’s Republic of Bangladesh, flooding inBangladesh is a normal, frequently recurrent phe-nomenon and includes flash floods from the over-flowing of upland rivers; rain floods due to poordrainage; monsoon floods in the flood plains ofmajor rivers; and coastal floods following stormsurge. In a normal year, river overflows and drainagecongestions cause the inundation of 20–25% of thecountry’s area, while 10-, 50- and 100-year floods areprojected to flood 37, 52 and 60% of the total coun-try’s area, respectively. On three occasions in12 years, in 1987, 1988 and 1998, floods inundatedmore than 60% of the country, demonstrating thatwhat used to be considered a “100-year flood” mayalready have become more frequent. The 1998 floodalone led to 1100 deaths, caused inundation of nearly100 000 km2, left 30 million people homeless andsubstantially damaged infrastructure (H12).
Severe flooding occurred in Mumbai, India, inJuly 2005, after 944 mm of rain fell in a 24-hourperiod (Kshirsagar et al. 2006). The consequentflooding affected households, even in more affluentneighbourhoods. Poor urban drainage systems inmany parts of India tend to become blocked withdebris. Ranger et al. (2011) analysed risk fromheavy rainfall in the city of Mumbai and concludedthat total losses (direct plus indirect) for a 1-in-100year event could treble by the 2080s (SRES A2scenario) compared with the present (increasingfrom US$700 million to US$2305 million) and thatadaptation could help reduce future damages.
Rapid economic development has not only sig-nificantly increased the exposure in flood plains, butalso influenced investment in flood-risk managementinfrastructure. There have been increases in floodimpacts associated with changes in surroundingenvironments. Flooding has increased over the pastfew decades in the Poyang Lake, South China,because of levee construction protecting a largerural population. These levees reduce the area for-merly available for floodwater storage, resulting inhigher lake stages during the summer flood seasonand the potential for catastrophic levee failures(Shankman et al. 2006).
Heavy rainfall and flooding also affect environ-mental health in urban areas, because surface watercan be quickly contaminated. In Dhaka, Bangladesh,
Flood risk and climate change 15
Dow
nloa
ded
by [
71.2
18.1
66.9
] at
06:
31 0
7 Ja
nuar
y 20
14

the severe flood in 1998 was associated with anincrease in diarrhoea among those from a lowersocio-economic group and not using tap water(Hashizume et al. 2008).
A record-breaking, destructive flood occurred inThailand (Fig. 8), where the 2011 monsoon seasonwas exceptionally heavy and led to extensive andlong-lasting flooding in the Chao Phraya andMekong river basins. Flooding was exacerbated bythe rapid expansion of urban areas into flood plains.The flooding lasted from July 2011 to mid-January2012 and was the costliest natural disaster in thecountry’s history, with direct damages estimated atUS$45 billion. As a result, Thailand’s annual 2011economic growth was slashed to 1.5% from a pre-flood estimate of 3.5–4%. In part, the severity of thisevent was due to failure of flood control structures andsystems that had effectively alleviated the damagefrom smaller events in the past. The 2011 flood inThailand caused the most expensive insurance lossever, worldwide, caused by a flood, with the totalliability estimated at ~US$15 billion.
Seasonal accelerated cycles of ice-melting haveaffected the stability of glacial lakes in the Himalayas,
increasing the potential risk of glacial lake outburstfloods (GLOF) in the region (Ives et al. 2010).A small but not statistically significant increase ofGLOF events was observed in the Himalayas since1940 until the end of the 20th century (Richardsonand Reynolds 2000), with a greater risk to water infra-structures and socio-economic damage on riverine set-tlements (Rosenzweig et al. 2007).
There is low to medium confidence in trends inrecorded heavy precipitation in Asia. No systematicspatially coherent trends in the frequency and dura-tion of extreme precipitation events have been foundover much of Asia, although statistically significanttrends were observed at sub-regional scales (forreview, see S12).
Different flooding trends have been detected andprojected in various catchments, but the evidence forbroader regional trends is limited.
In the Asian monsoon region, heavy precipitationis projected to increase, notably in Bangladesh and inthe Yangtze River basin, because of the intensifiedconvergence of water vapour flux in summer. Basedon a Japanese GCM, heavy precipitation is projected toincrease substantially in South Asia (Kamiguchi et al.2006). Projections by Hirabayashi et al. (2008) show anincrease in the risk of floods in most humid-affectedAsian monsoon regions. However, GCMs generallycannot adequately reproduce observed links betweenSST anomalies and the strength of the South Asianmonsoon (see Annamalai et al. 2007).
6.3 Central and South America
Extreme rainfall episodes have caused disasters inparts of South America, with hundreds to thousandsof fatalities in mudslides and landslides, as typified,for example, by the December 1999 incident inVenezuela (Lyon 2003). However, there is low tomedium confidence in observed and in projectedchanges in heavy precipitation in the region.
In the Amazon region in South America, the July2009 flood set record highs in the 106 years of datafor the Rio Negro at the Manaus gauge site (Marengoet al. 2012). Recent increases have also been reportedin flood frequency of some other river basins inSouth America (Camilloni and Barros 2003, Barroset al. 2004).
Outbreaks of malaria were associated withchanges in habitat after the 1991 floods in CostaRica’s Atlantic region (Saenz et al. 1995).
In the Andes, glacier retreat in the Patagonian icefields has caused repeated outburst floods, although
Fig. 8 Flooding in Southeast Asia as mapped by MODISsatellite imaging between 2 November and 4 December,2011 (red); light red: previous flooding during 2011. Thecoastal city of Bangkok is shown near the left margin,centre, and is where an unprecedented US$15 billion totalinsurance loss is estimated.
16 Zbigniew W. Kundzewicz et al.
Dow
nloa
ded
by [
71.2
18.1
66.9
] at
06:
31 0
7 Ja
nuar
y 20
14
there remains a debate as to whether this reflects adirect relationship with increased global temperatures(Dussaillant et al. 2010).
As assessed in the SREX report (S12), spatiallyvarying trends in extreme rainfall events have beenobserved in Central and South America (low to med-ium confidence). This reflects an increased frequencyof heavy events in many areas, but also a decreasedfrequency of heavy events in some areas for CentralAmerica and northern South America. For the wes-tern coast of South America, there has been adecrease in extreme rainfall in many areas, but anincrease in a few areas.
Simulations with a single RCM (PRECIS) underIPCC emissions scenarios SRES A2 and B2 projectan increase in the intensity of extreme precipitationevents over most of southeastern South America andwestern Amazonia in 2071–2100, whereas inNortheast Brazil and eastern Amazonia, smaller orno changes are projected (Marengo et al. 2009).
6.4 Europe
Despite much investment in flood protection, floodingremains a serious problem throughout the continent.Large parts of Europe have been hit by major floods inrecent decades, with multiple fatalities and averagemulti-billion (in US$ or Euro) material damages eachyear (Kundzewicz et al. 2012). Economic losses fromflood hazards in Europe have increased considerablyover previous decades (Lugeri et al. 2010), drivenprincipally by the increasing exposure of people andeconomic assets (Barredo 2009).
The SREX report assessed that there is mediumconfidence in trends for heavy precipitation inEurope, observed to date, because of partly inconsis-tent signals across studies and regions, especially insummer. Increasing trends in high percentiles of dailywinter precipitation were found (Moberg et al. 2006),confirmed by several more detailed country-basedstudies (see S12, Hattermann et al. 2013). In southernEurope and the Mediterranean region, there is lowconfidence in the trends, with opposite signals in theobserved records (Benito and Machado 2012). Arecent study (Zolina et al. 2010) has indicated thatthere has been an increase by about 15–20% in thepersistence of wet spells over most of Europe overthe last 60 years, which was not associated with anincrease of the total number of wet days.
There are many national flood studies in Europe(see reviews by S12 and 14 national and regional chap-ters in the book edited by Kundzewicz 2012), but
geographically organized patterns of climate-drivenchanges in the flood magnitude/frequency cannot bedetected. Yet, an increase in the number of large floodsin Europe in 1985–2010 has been demonstrated byKundzewicz et al. (2013).
Using daily statistics from various models forEuropean sub-regions under the IPCC SRES A2 sce-nario, Boberg et al. (2009, 2010) projected a clearincrease in the contribution to total precipitation frommore intense events. For 2071–2100, projectedEuropean precipitation extremes in high-resolutionstudies tend to increase in northern Europe, espe-cially during winter.
However, the projected increase in frequency andintensity of heavy precipitation over large parts ofEurope may increase the probability of floods, and inparticular flash floods, which pose the highest risk offatality (EEA2004). If climatic projections are correct, anotable—and beneficial—decrease in the probability offloods that generally corresponds to lower flood peaksis expected for northeastern Europe in the late 21stcentury, because of a reduction in snow accumulation(Dankers and Feyen 2008, Hirabayashi et al. 2008).
The SREX report (H12) assessed combinationsof estimates of current and future damage potential(as represented by a relationship between flooddamage and flood magnitude) with estimates of cur-rent and future flood frequency curves to determinedamages. A wide range in projected average annualdamage was found in the UK Foresight FutureFlooding and Coastal Defence project (Evans et al.2004, Hall et al. 2005), which calculated averageannual damage in 2080 of £1.5 billion, £5 billionand £21 billion under similar climate scenarios butdifferent socio-economic futures (current averageannual damage was estimated at £1 billion). TheForesight project represented the effect of climatechange on flood frequency by altering the shape ofthe flood frequency curve using precipitation outputsfrom climate models and rainfall–runoff models for asample of UK catchments.
A more recent UK study (Ramsbottom et al.2012, data tables FL6b and FL7b, Appendix 8) statedthat river flood damages for England and Wales (in2010 prices, with consideration of climate changeonly; without change in exposure) are projected toincrease from a baseline of £0.8 billion (1961–1990climate, 2008 population) to the following levels in2050: £0.85 billion (+6.3%), £1.9 billion (+138%),and £3 billion (+275%), for low, medium and highclimate change, respectively, under assumption of ayear-2008 population.
Flood risk and climate change 17
Dow
nloa
ded
by [
71.2
18.1
66.9
] at
06:
31 0
7 Ja
nuar
y 20
14

The EU-funded Projection of Economic impacts ofclimate change in Sectors of the European Union basedon bottom-up Analysis (PESETA) project (Ciscar 2009,Feyen et al. 2009) used a hydrological model to simu-late river flows, flooded areas and flood-frequencycurves from climate scenarios derived from RCMs,but—in contrast to the UK Foresight project—assumedno change in economic development and in populationin flood-prone areas. There are strong regional varia-tions in impact, with particularly large projectedincreases in both the number of people flooded andeconomic damages (over 200%) in Central andEastern Europe, while in parts of northeastern Europe,average annual flood damages decrease. Maaskantet al. (2009) addressed future loss of life from floodingand projected up to a fourfold increase in potential floodvictims in The Netherlands by the year 2040, whenpopulation growth is also accounted for.
Apart from newly developed urban areas, linearinfrastructure, such as roads, railroads and undergroundrails with inadequate drainage, will probably suffermore flood damage (Defra 2004, Arkell and Darch2006, ASC 2012). Increased runoff volumes mayincrease risk of dam failure with high environmentaland socio-economic damages (Rico et al. 2008). Inglaciated areas of Europe, glacial lake outburst floods,although infrequent, have the potential to produceimmense socio-economic and environmental impacts,even at long distances downstream from the hazardsource area (Haeberli et al. 2001, Huggel et al. 2004).
6.5 North America
There have been a number of disastrous floods in thelast two decades. In 1993, approximately 3.3 millionha of American Midwest soybean and corn fields wereflooded, leading to a 50% decrease in corn yields inIowa, Minnesota andMissouri and a 20–30% decreasein three other states (Changnon 1996). Flood impactsalso included significant damage to transportationinfrastructure. Flooding in the Mississippi Valley con-tinues to constitute a risk to the central USA economy.In May 2011, the cities of Baton Rouge and NewOrleans, and numerous oil refineries and chemicalplants, narrowly escaped catastrophic inundation bythe Lower Mississippi. The combined Missouri–Mississippi basin includes large areas, as well, wherespring snowmelt can cause severe local flooding andcontribute to an eventual high peak far downstream.
As assessed in the SREX report (S12), there hasbeen a likely increase in heavy precipitation in manyareas of North America since 1950, with projections
suggesting further increases in heavy precipitation insome regions.
Recent studies on past and current changes ofprecipitation extremes in North America, some ofwhich are included in the recent assessment of theUSA Climate Change Science Program (CCSP)report (Kunkel et al. 2008), have reported an increas-ing trend over the last half century. On the basis ofstation data from Canada, the United States andMexico, Peterson et al. (2008) reported that heavyprecipitation, as well as the average amount of pre-cipitation falling on days with precipitation, has beenincreasing in the study interval of 1950–2004. For thecontiguous United States, DeGaetano (2009) showeda 20% reduction in the return period for extremeprecipitation of different return levels over 1950–2007; Gleason et al. (2008) reported an increasingtrend in the area experiencing a much above-normalproportion of heavy daily precipitation from 1950 to2006 and Pryor et al. (2009) provided evidence ofincreases in the intensity of precipitation eventsabove the 95th percentile during the 20th century,with a larger magnitude increase at the end of thecentury. Overall (S12), the evidence indicates a likelyincrease in observed heavy precipitation in manyregions of North America, despite statistically nonsigni-ficant trends and some decreases in some sub-regions.
In the United States and Canada during the 20thcentury and in the early 21st century, there is nocompelling evidence for climate-driven changes inthe magnitude/frequency of floods (Lins and Slack1999, McCabe and Wolock 2002, Cunderlik andOuarda 2009, Villarini et al. 2009). A study in theUnited States (Choi and Fisher 2003) constructedregression relationships between annual flood lossand socio-economic and climate drivers, concludingthat a 1% increase in average annual precipitationwould, other things being equal, lead to an increasein annual national flood loss of around 6.5%.However, the conclusions are highly dependent onthe methodology and the spatial scale of analysis.
Wang and Zhang (2008) investigated possiblechanges in North American extreme winter precipita-tion comparing 1949–1999 with 2050–2099. Theirresults suggested a strong increase in extreme preci-pitation over the south and central United States, butdecreases over the Canadian prairies. Also, Gutowskiet al. (2008) showed that, for the Upper MississippiRiver Basin region during October–March, the inten-sity of extreme precipitation is projected to increase.
Flooding and heavy precipitation events have avariety of significant human health impacts (Ebi et al.
18 Zbigniew W. Kundzewicz et al.
Dow
nloa
ded
by [
71.2
18.1
66.9
] at
06:
31 0
7 Ja
nuar
y 20
14

2008). Heavy precipitation events are strongly corre-lated with the outbreak of waterborne illnesses in theUnited States, and 51% of waterborne disease out-breaks were preceded by precipitation events in thetop decile (Curriero et al. 2001). In addition, heavyprecipitation events in North America have beenlinked to outbreaks of vector-borne diseases, suchas hantavirus and plague (Engelthaler et al. 1999,Parmenter et al. 1999, Hjelle and Glass 2000).There is a risk of extreme floods causing majortoxic chemical spills into flooded areas.
6.6 Oceania
The SREX report assessed that there has likely been adecrease in heavy precipitation inmany parts of southernAustralia and New Zealand. However, there were statis-tically significant increases in the proportion of annual/seasonal rainfall stemming from heavy rain daysbetween two periods, 1911–2008 and 1957–2008, innorthwest Australia (Gallant and Karoly 2010).Extreme summer rainfall over the northwest of theSwan-Avon River basin in Western Australia increasedover 1950–2003, while extreme winter rainfall over thesouthwest of the basin decreased (Aryal et al. 2009). InNew Zealand, the trends are positive in the westernNorth and South Islands and negative in the east of thecountry (Mullan et al. 2008).
Since the SREX report was prepared, there hasbeen record-breaking flooding across parts of easternAustralia. Flooding in the states of Victoria andQueensland (including parts of the capital city,Brisbane) during the austral summer of 2010/11resulted in major economic impacts and subsequentpublic enquiries (Wilby and Keenan 2012). Wide-ranging recommendations on most aspects of flood-risk management, including land-use planning toreduce exposure, have followed (e.g. Goode et al.2011). There have been improvements in flood map-ping and warnings. However, development pressuresmake implementation of other measures more chal-lenging (Wenger et al. 2013).
As shown in Fig. 6, the return period of the 20thcentury 20-year return value of annual maximum 24-hprecipitation is projected to decrease in the Oceaniaregion in the future, but there is generally low to med-ium confidence in projections of heavy precipitationbecause of a lack of consistency between models(Alexander and Arblaster 2009). Floods are NewZealand’s most frequently experienced hazard(OCDESC 2007), affecting both agricultural andurban areas. Being long and narrow, New Zealand is
characterized by small river catchments and, accord-ingly, shorter time-to-peak and shorter flood warningtimes, posing a difficult preparedness challenge.Projected increases in heavy precipitation are expectedto cause greater erosion of land surfaces, more land-slides and a decrease in the protection afforded bylevees (Hennessy et al. 2007).
6.7 Polar regions
Polar regions in the IPCC classification cover high-latitude areas in both the Northern and Southernhemispheres, characterized by low population densi-ties. From the mid-1960s to the beginning of the1990s, winter runoff in the three largest rivers ofSiberia (Yenisei, Lena and Ob), jointly contributingapproximately 70% of the total river runoff to theArctic Ocean, increased by 165 km3 (Savelieva et al.2004). Rivers in Arctic Russia experience floods, buttheir frequency, stage and incidence are differentacross this large region, depending on flood forma-tion conditions. Floods on the Siberian rivers can beproduced by a high peak in the spring flood, by rareheavy rain, by a combination of snow and rain, aswell as by ice jams, hanging dams and combinationsof factors (Semyonov and Korshunov 2006).
Maximum river discharge was found to decreasefrom the mid-20th century through 1980 in WesternSiberia and the Far East (except for the Yenisei andthe Lena rivers). However, since the 1980s, maxi-mum streamflow values began to increase over muchof Russia (Semyonov and Korshunov 2006).Snowmelt and rain continue to be the most frequentcauses of hazardous floods on the rivers in theRussian Arctic (85% of all hazardous floods in thepast 15 years), while ice jams and wind tides makeup 10% and 5% of the total number of hazardousfloods, respectively. Pomeranets (2005) suggests thatthe probability of catastrophic ice jam-related floodsincreased in the early 21st century.
Although changes in flood magnitude/frequencymight be expected in regions where temperaturechange affects precipitation type (i.e. rain/snowseparation), as well as snowmelt and ice cover, wide-spread evidence of such climate-driven changes infloods is not available. For example, there is noevidence of widespread common trends in the mag-nitude of floods based on the daily river discharge of139 Russian gauge stations, though a significant shiftof spring discharge to earlier dates has been found(Shiklomanov et al. 2007). However, for 19 largerivers encompassing the entire Arctic region over
Flood risk and climate change 19
Dow
nloa
ded
by [
71.2
18.1
66.9
] at
06:
31 0
7 Ja
nuar
y 20
14

the period 1977–2007, Overeem and Syvitski (2010)found a consistent increase in annual discharge overthe entire region (+9.8%). Combined change in wateroutflux is significantly higher than previous recon-structions for the Canadian Arctic (+2% over 1964–2000) and Eurasia (+7% over 1936–1999). However,the period of 30 years used by Overeem and Syvitski(2010) is short for evaluation of changes in flooding,as at such a time scale climate oscillations can beexpected to be dominant.
7 ATTRIBUTION AND UNCERTAINTYASPECTS
The SREX report concluded that there was a lack ofstudies identifying, in a persuasive way, an influenceof anthropogenic climate change on rain-generatedpeak streamflow trends. Overall, there is low confi-dence (due to limited evidence) that anthropogenicclimate change has already affected the magnitude/frequency of floods, though it has detectably influ-enced several components of the hydrological cycle,such as precipitation and snowmelt, which impact onfloods. The assessment of causes behind changes inflooding behaviour is inherently complex anddifficult.
Using 200 long-term (85–127 years of record)stream gauge flow series in the coterminous UnitedStates in locations with little or no regulation orurban development, Hirsch and Ryberg (2012) didnot find strong statistical evidence for flood magni-tudes increasing with increasing global mean carbondioxide concentration (GMCO2) in any of the fourregions defined in this study. One region, the south-west, showed a statistically significant negativerelationship between GMCO2 and flood magnitudes.
A recent model-based study by Pall et al. (2011)showed that increasing global anthropogenic green-house-gas emissions could have increased the risk ofrainfall-dominated flood occurrence in the floodingof some river basins in England and Wales, asobserved in autumn (September–November) 2000and as associated with a displacement in the NorthAtlantic jet stream. This study showed that there isnow about 50% chance that an anthropogenic influ-ence can be detected for UK extreme precipitation inwinter, but the likelihood of the detection in otherseasons is very small (Fowler and Wilby 2010).
Trenberth (2012) postulated a link between recordhigh sea-surface temperatures (SSTs) and subsequentoccurrence of floods in affected adjacent areas.According to this postulate, the presence of record
high SSTs might be related to floods in China, Indiaand Pakistan in the summer of 2010, Queensland inAustralia in the austral summer 2010/11 (Evans andBoyer-Souchet 2012), Colombia in October–December 2010, and the United States in spring2011 (although the very strong La Niña event of2010/11 may have played the major role in some ofthese events).
The SREX report (H12) assessed that theexposure of people and economic assets has beenthe major cause of long-term increases in economiclosses from floods. Long-term trends in economicdisaster losses, adjusted for wealth and populationincreases, have not been attributed to climatechange. The attribution of economic disaster lossesis subject to a number of limitations in studies todate, including data availability (most data areavailable for standard economic sectors in devel-oped countries) and the processes used to normal-ize loss data over time. Published studies haveused different approaches to normalization, whichtake account of changes in exposure of people andassets, but use only limited, if any, measures ofchanges in vulnerability (Bouwer 2011). Differentapproaches are also used to handle variations in thequality and completeness of data on impacts overtime. Finding a trend or “signal” in a system char-acterized by large variability or “noise” is difficultand requires lengthy records (Kundzewicz et al.2005). A general area of uncertainty in the studiesconcerns the impacts of floods on the livelihoodsand people of informal settlements and economicsectors, especially in developing countries. Someone billion people live in settlements developedoutside government planning and building systems(UNISDR 2011) and over half the economy insome developing countries is informal or undocu-mented (Schneider et al. 2010).
In many regions, the monitoring network is verysparse, resulting in considerable uncertainty in theestimates of extreme precipitation. There are alsoknown biases in precipitation measurements, mostlyleading to rain undercatch. As highlighted in theSREX report, little evidence of pre-instrumentalchanges in heavy precipitation is available to placerecent variations in context (S12).
The SREX report (S12) assessed that the projec-tion of precipitation extremes is associated with largeuncertainties, contributed by climatic models and bynatural variability of the climate. The underestima-tion of rainfall extremes by the models (oftenobserved when models simulate historical data) may
20 Zbigniew W. Kundzewicz et al.
Dow
nloa
ded
by [
71.2
18.1
66.9
] at
06:
31 0
7 Ja
nuar
y 20
14
be related to the coarse spatial resolution used in themodel simulations, suggesting that projections offuture changes in rainfall extremes in response toanthropogenic global warming may also beunderestimated.
All GCM projections of precipitation extremesmust come with a heavy caveat, because of the fun-damental limitations, such as, for example, omissionof land-cover feedbacks, failure to conserve the glo-bal water balance, or poor representation of plane-tary-scale teleconnections effecting monsoon regions.
River discharge simulation under a changingclimate scenario requires a set of GCM or RCMoutputs (e.g. precipitation and surface air tempera-ture) and a hydrological model (S12). Alternativehydrological models may yield quantitatively differ-ent river discharges, but they may not yield differentsigns of the trend if the same GCM/RCM outputs areused. So the ability of models to simulate floods, andin particular the signs of past and future trends,depends on the ability of the GCM/RCM to simulateprecipitation changes. The ability of a GCM/RCM tosimulate temperature is also important for river dis-charge simulations in snowmelt- and glacier-fed riv-ers. Worldwide instrumental records of floods atgauge stations are limited in spatial coverage and intime, and only a very limited number of gauge sta-tions have data that span a time period of 100 yearsor more (Rodier and Roche 1984).
There is strong uncertainty in the projectedchanges in the magnitude and frequency of floods,while the GCM remains the largest source of uncer-tainties in hydrological projections for the forthcom-ing decades at the river-basin scale. Model skill inreproducing extreme storm events and trends inextreme storm events, given some change in forcing,is not yet persuasive. Uncertainties from emissionsscenarios and downscaling methods are also relevant,but likely smaller in magnitude (Graham et al. 2007,Leander et al. 2008). However, the relative uncer-tainty mix depends on the future time horizon, asuncertainties from emissions scenarios assumegreater importance further into the future. Varioustechniques of downscaling and/or bias-correctionare applied to GCM/RCM outputs (e.g. precipitationand temperature) before hydrological simulations areconducted. We cannot judge which approach is thebest, hence the selection of downscaling or bias cor-rection is a source of uncertainty.
Furthermore, the choice of hydrological modelswas found to be relevant but less important (Tayeet al. 2011). However, the relative importance of
downscaling, bias-correction and the choice ofhydrological models may depend on the selectedregion/catchment, the selected downscaling andbias-correction methods and the selected hydrologicalmodels (Wilby et al. 2008).
Upon reviewing the estimates to date, the costingof flood losses and estimation of adaptation costs isstill preliminary, incomplete and subject to a numberof assumptions, with the result that considerableuncertainty remains (Agrawala and Fankhauser2008, Parry et al. 2009). This is largely due touncertainties in projected climate change and asso-ciated damage estimates, as well as methodologicalshortcomings. Such costing is further limited by theinteraction between numerous adaptation options andassumptions about future exposure and vulnerabil-ities, social preferences and technology, as well aslevels of resilience in specific societies. Anothermajor knowledge gap is changing flood risk withinurban areas (under climate change), since most modelstudies refer to “natural” basins.
Potentially, remote sensing may offer a cost-effective solution for monitoring precipitation, butfor now, these records are short and the issue ofexploring trends when there is a major change inmeasurement method is a very serious one. Satellitesensors provide a synoptic and global coverage. Thecollection and archives of data can be automated,thus providing a rapid update for monitoring, withlittle human intervention in relation to the area cov-ered. In remote locations, it is often the only sourceof information. Satellite sensors, however, cannotreplace ground meteorological stations. First, theground stations are needed for calibrating the sensors;second, ground stations provide a much longer periodof records, which is needed for climate change stu-dies; hence, their network should be maintained.Remote sensing has the potential to be increasinglyimportant as the method for interpretation of floodlevels and inundated areas.
8 CONCLUDING REMARKS
Based on the evidence recently assessed in the SREXreport (S12), one can assess at present that it is likelythat there have been statistically significant increasesin the number of heavy precipitation events (e.g. 95thpercentile of 24-h precipitation totals of all days withprecipitation) in more regions than there have beenstatistically significant decreases, but there are strongregional and sub-regional variations in the trends,both between and within regions. Based on
Flood risk and climate change 21
Dow
nloa
ded
by [
71.2
18.1
66.9
] at
06:
31 0
7 Ja
nuar
y 20
14

cumulative evidence, there is additionally mediumconfidence that anthropogenic influence has contrib-uted to the intensification of heavy precipitation atthe global scale, though attribution at the regionalscale is not feasible at present. Projected changesfrom both global and regional studies indicate thatit is likely that the frequency of heavy precipitation,or the proportion of total rainfall from heavy falls,will increase in the 21st century over many areas ofthe globe, especially in the high-latitude and tropicalregions and northern mid-latitudes in winter. Heavyprecipitation is projected to increase in some (but notall) regions with projected decreases of total precipi-tation (medium confidence).
Despite the diagnosed extreme-precipitation-based signal, and its possible link to changes in floodpatterns, no gauge-based evidence had been found fora climate-driven, globally widespread change in themagnitude/frequency of floods during the last dec-ades. As assessed in the SREX report, projected tem-perature and precipitation changes imply changes infloods, although overall there is low confidence inprojections of changes in fluvial floods, due to limitedevidence and because the causes of regional changesare complex. There is medium confidence (based onphysical reasoning) that projected increases in heavyrainfall would contribute to increases in rain-generatedlocal flooding in some areas. Earlier spring peak flowsin snowmelt- and glacier-fed rivers are very likely, butthere is low confidence (due to limited evidence) intheir projected magnitude.
There are not many projections of flood magni-tude/frequency changes at regional and continentalscales. Projections at the river-basin scale are also notabundant, especially for regions outside Europe andNorth America. In addition, considerable uncertaintyremains in the projections of changes in flood magni-tude and frequency. Therefore, there is low confidencein future changes in flood magnitude and frequencyderived from river discharge simulations.
Kundzewicz et al. (2007, 2008) and Bates et al.(2008) argued that climate change (i.e. observedincrease in precipitation intensity and other observedclimate changes) might already have had an impacton floods and that physical reasoning suggests thatprojected increases in heavy rainfall in some catch-ments or regions would contribute to increases inrain-generated local floods (medium confidence).They argued that more frequent heavy precipitationevents projected over most regions would affect therisk of rain-generated floods (e.g. flash flooding andurban flooding).
Changes in precipitation totals, frequency andintensity, along with snow cover, snowmelt and soilmoisture, are all relevant for causing changes infloods. However, confidence in the magnitude ofchange of one of these components alone (and—over some regions—even in the sign of change)may not be sufficient to confidently project changesin flood occurrence.
According to UNISDR (2011), the global mor-tality risk from floods increased from 1980 to 2000,but is now stabilizing and even reducing, because ofa compensation of the increase in exposure bya significant decrease in vulnerability. However, theglobal trend is largely influenced by developments inChina (in particular around vertical urbanization). IfChina is removed from the data set, the mortality riskis increasing (UNISDR 2011). Economic losses fromfloods have increased considerably (H12), but withlarge spatial and inter-annual variability (high confi-dence, based on high agreement, medium evidence).Global flood disaster losses reported over the last fewdecades reflect mainly monetized direct damages toassets. Trends in the vulnerability of what is exposedare variable by location, and the global picture isstrongly influenced by China, where vulnerability tofloods has decreased over the past decade. Currentstudies indicate that increasing exposure of popula-tion and assets, and not anthropogenic climatechange, is responsible for the past increase in floodlosses. While early warning systems can successfullyreduce mortality risk through evacuation of the popu-lation, crops and infrastructures remain in place, andhence the significant increase in infrastructures hasled to a drastic increase in economic risk (Bouwer2011, UNISDR 2011). Studies that project futureflood losses and casualties indicate that, when noadaptation is undertaken, future anthropogenic cli-mate change is likely to lead to increasing floodlosses, alongside the increase in exposure linked toongoing economic development (H12). Where rapidurbanization brings inadequately engineered in-citydrainage infrastructure as well, its effect can promoterather than decrease losses to both the economy andhuman lives. In general, human modifications ofwatersheds, changing their runoff characteristics(e.g. urbanization, deforestation, building of floodwalls and dams, and artificial land drainage), lead toflood risk changes.
The impacts of changes in flood characteristicswill be highly dependent on how climate changes inthe future, and there is low confidence in specificprojections of changes in flood magnitude or
22 Zbigniew W. Kundzewicz et al.
Dow
nloa
ded
by [
71.2
18.1
66.9
] at
06:
31 0
7 Ja
nuar
y 20
14
frequency. However, even in the absence of increasedflood risk owing to increased heavy precipitation orother modifications of the climate system, flood riskwill generally increase as exposure continues to rise.Hence, flood adaptation strategies need to jointlyconsider landscape changes that affect floodresponse, the location and protection of people andproperty at risk, as well as changes in flood risk dueto changes in climate. All three are of critical impor-tance to the future of flood hazards and economiclosses due to flooding.
There are at least two ways of interpreting thenotion of “early flood warning” (Kundzewicz 2013).The more common interpretation of the notion refersto a short-term flood preparedness system, wherea flood warning contains specific timely information,based on a reliable forecast, that a high water level isexpected at a particular location and time. A warningshould be issued sufficiently early before the poten-tial inundation to allow adequate preparation and toensure that emergency actions, such as strengtheningdikes or evacuation, can be undertaken, so that flooddamage to people and property is reduced. Theappropriate timeframe is affected by the catchmentsize relative to the vulnerable zones. The warningshould be expressed in a way that persuades peopleto take appropriate action. The solutions lie in thearea of improved weather and hydrological forecast-ing, better weather and hydrologic networks andbetter real-time risk communication.
The other interpretation of “early flood warning”is a statement that a high water level or discharge islikely to occur more (or less) frequently in a timescale of decades. Technically, this constitutes a “pre-diction” of a change in flood frequency compared toa reference period. An early warning of this typecould, for example, predict that at a site of concern,the current 100-year flood (river flow exceeded oncein 100 years on average in the reference period) maybecome a 50-year flood in a defined future timehorizon. Despite the inherent uncertainty, such anearly warning would be an important signal for deci-sion-makers that the required level of protection isunlikely to be maintained in the future unless floodpreparedness is improved.
The linkages between enhanced greenhouse for-cing and flood phenomena are highly complex and,up to the present, it has not been possible to describethe connections well, either by empirical analysis orby the use of models. It is clear that current trends inhuman activity on the landscape continue to cause anincrease in flood damages. Decreasing or reversing
this trend will require substantial attention from gov-ernments, private citizens, scientists and engineers,and the actions needed to accomplish this are largelythe same regardless of the nature of the greenhousegas–flood linkage. If anything, the state of thescience of regarding this linkage should cause deci-sion-makers to take a more cautious approach toflood adaptation because of the added uncertaintythat enhanced greenhouse forcing has introduced.There is such a furore of concern about the linkagebetween greenhouse forcing and floods that it causessociety to lose focus on the things we already knowfor certain about floods and how to mitigate andadapt to them. Blaming climate change for floodlosses makes flood losses a global issue that appearsto be out of the control of regional or national institu-tions. The scientific community needs to emphasizethat the problem of flood losses is mostly about whatwe do on or to the landscape and that will be the casefor decades to come.
The climate change issue is very important toflooding, but we have low confidence about thescience. What should the science community, engi-neers, citizens or governments do with that? The pre-cautionary principle is a right choice. Doing the rightthings should not depend on waiting for the answers tothe greenhouse forcing–flood issue. The continuationof empirical and model-based science and a “noregrets” strategy for limiting flood losses should beencouraged. However, work towards improvements inGCMs to bring us to a point where all of this is madeclear is much needed, and this may take much time(Kundzewicz and Stakhiv 2010).
Although media reports of both floods and glo-bal flood damage are on the increase, there is still noMauna-Loa-like record (see Vörösmarty 2002) thatshows a global increase in flood frequency ormagnitude.
Acknowledgements The authors thank all theauthors of the myriad references assessed in theIPCC Special Report on Managing the Risks ofExtreme Events and Disasters to Advance ClimateChange Adaptation. Much of the material draws fromchapters 3 and 4 of this Special Report. The reader isreferred to the original report (Field et al. 2012) forthe extensive list of publications that were subject toassessment. Support of work on this article is grate-fully acknowledged. Constructive and useful com-ments by three referees (two eponymous reviewers:Dr Robert Hirsch and Professor Robert Wilby, and
Flood risk and climate change 23
Dow
nloa
ded
by [
71.2
18.1
66.9
] at
06:
31 0
7 Ja
nuar
y 20
14

one anonymous referee), as well as ProfessorDemetris Koutsoyiannis, HSJ Co-editor, are grate-fully acknowledged. Some of these comments indeedhelped the authors improve their article.
Funding The contribution of ZWK has been sup-ported by the project (PSPB no. 153/2010), FLOodRISk on the nothern foothills of the Tatra Mountains(FLORIST), supported by a grant from Switzerlandthrough the Swiss Contribution to the enlargedEuropean Union. This research was also supportedby the Environment Research and TechnologyDevelopment Fund (S-10) of the Ministry of theEnvironment, Japan.
Notes1. Calibrated language is used herein to characterize the
degree of certainty authors have in statements about thestate of current scientific understanding, following the gui-dance used in the IPCC SREX (Mastrandrea et al. 2010).Author teams of IPCC assessments were charged withapplying expert judgement, following from their compre-hensive assessment of the literature. Confidence in thevalidity of a finding is based on the type, amount, qualityand consistency of evidence (e.g. mechanistic understand-ing, theory, data, models and expert judgement) and thedegree of agreement. Levels of confidence are expressedqualitatively through five qualifiers: very low, low, medium,high and very high. This guidance framework includessummary terms to describe the available evidence: limited,medium or robust, and the degree of agreement: low, med-ium or high. Where quantified measures of uncertainty in afinding can be expressed probabilistically (based on statis-tical analysis of observations or model results, or expertjudgement), a finding can include calibrated likelihoodlanguage. The likelihood terms and their correspondingprobability ranges are as follows: virtually certain, 99–100% probability; very likely, 90–100% probability; likely,66–100% probability; about as likely as not, 33–66% prob-ability; unlikely, 0–33% probability; very unlikely, 0–10%probability; and exceptionally unlikely, 0–1% probability.The great strength of the common use of calibrated lan-guage is that comparisons can be made across the findingsof the IPCC SREX so that readers of the statements mayunderstand the degree to which understanding is well-established or still reflects competing explanations. Theuse of calibrated uncertainty language is strongly inter-twined with the value the assessment process adds to theabundant literature on which it is based.
2. To be included in the SREX report, references had to beaccepted for publication by the cut-off date of 31 May 2011.
REFERENCES
Agrawala, S. and Fankhauser, S., eds., 2008. Economic aspects ofadaptation to climate change, costs, benefits and policy instru-ments. Paris: OECD.
Alexander, L.V., et al., 2006. Global observed changes in dailyclimate extremes of temperature and precipitation. Journal ofGeophysical Research—Atmospheres, 111, D05109.
Alexander, L.V. and Arblaster, J.M., 2009. Assessing trends inobserved and modelled climate extremes over Australia inrelation to future projections. International Journal ofClimatology, 29 (3), 417–435.
Anagnostopoulos, G.G., et al., 2010. A comparison of local andaggregated climate model outputs with observed data.Hydrological Sciences Journal, 55 (7), 1094–1110.
Annamalai, H., Hamilton, K., and Sperber, K.R., 2007. The SouthAsian summer monsoon and its relationship with ENSO in theIPCC AR4 simulations. Journal of Climate, 20, 1071–1092.
Anyamba, A., et al. 2006. Developing global climate anomaliessuggest potential disease risks for 2006–2007. InternationalJournal of Health Geographics, 5, 60.
Arkell, B.P. and Darch, G.J.C., 2006. Impact of climate change onLondon’s transport network. In: Proceedings of the Institution ofCivil Engineers:municipal engineer, 159. London:ME4, 231–237.
Aryal, S.K., et al., 2009. Characterizing and modeling temporal andspatial trends in rainfall extremes. Journal ofHydrometeorology, 10 (3), 241–253.
ASC (Adaptation Sub-Committee), 2012. Climate change—is theUK preparing for flooding and water scarcity? AdaptationSub-Committee Progress Report 2012.
Barnett, T.P., et al., 2008. Human-induced changes in the hydrologyof the western United States. Science, 319 (5866), 1080–1083.
Barredo, J.I., 2009. Normalised flood losses in Europe: 1970–2006.Natural Hazards and Earth System Sciences, 9, 97–104.
Barredo, J.I., Sauri, D., and Llasat, M.C., 2012. Assessing trends ininsured losses from floods in Spain 1971–2008. NaturalHazards and Earth System Sciences, 12, 1723–1729.
Barros, V., et al., 2004. The major discharge events in the ParaguayRiver. Journal of Hydrometeorology, 5 (6), 1161.
Barthel, F. and Neumayer, E., 2012. A trend analysis of normalizedinsured damage from natural disasters. Climatic Change, 113(2), 215–237.
Bates, B.C., et al., 2008. Climate change and water. Technical paperof the Intergovernmental Panel on Climate Change. Geneva:IPCC Secretariat.
Benito, G., et al., 2010. Management of alluvial aquifers in twosouthern African ephemeral rivers: implications for IWRM.Water Resources Management, 24, 641–667.
Benito, G. and Machado, M.J., 2012. Floods in the Iberian Peninsula.In: Z.W. Kundzewicz, ed. Changes in flood risk in Europe.IAHS Special Publications 10. Wallingford: IAHS Press andCRC Press/Balkema, 372–383.
Blöschl, G. and Montanari, A., 2010. Climate change impacts—throwing the dice? Hydrological Processes, 24 (3), 374–381.doi:10.1002/hyp.7574
Boberg, F., et al., 2009. Improved confidence in climate change projec-tions of precipitation evaluated using daily statistics from thePRUDENCE ensemble. Climate Dynamics, 32 (7–8), 1097–1106.
Boberg, F., et al., 2010. Improved confidence in climate changeprojections of precipitation further evaluated using daily statis-tics from the ENSEMBLES models. Climate Dynamics, 35 (7–8), 1509–1520.
Bouwer, L.M., 2011. Have disaster losses increased due to anthro-pogenic climate change? Bulletin of the AmericanMeteorological Society, 92, 39–46.
Bouwer, L.M., 2013. Projections of future extreme weather lossesunder changes in climate and exposure. Risk Analysis, 33 (5),915–930.
Bouwer, L.M., Bubeck, P., and Aerts, J.C.J.H., 2010. Changes infuture flood risk due to climate and development in a Dutchpolder area. Global Environmental Change, 20, 463–471.
Bouwer, L.M., Vermaat, J.E., and Aerts, J.C.J.H., 2008. Regionalsensitivities of mean and peak river discharge to climate varia-bility in Europe. Journal of Geophysical Research—Atmospheres, 113, D19103.
24 Zbigniew W. Kundzewicz et al.
Dow
nloa
ded
by [
71.2
18.1
66.9
] at
06:
31 0
7 Ja
nuar
y 20
14
Bouwer, L.M., et al., 2007. Confronting disaster losses. Science, 318,753.
xBradshaw, C.J.A., et al., 2007. Global evidence that deforestationamplifies flood risk and severity in the developing world.Global Change Biology, 13, 1–17.
Brakenridge, G.R., et al., 2013. Global mapping of storm surges, 2002–present and the assessment of coastal vulnerability. NaturalHazards, 66 (3), 1295–1312. doi:10.1007/s11069-012-0317-z
Brázdil, R. and Kundzewicz, Z.W., 2006. Historical hydrology—editorial. Hydrological Sciences Journal, 51 (5), 733–738.
Brázdil, R., Kundzewicz, Z.W., and Benito, G., 2006. Historicalhydrology for studying flood risk in Europe. HydrologicalSciences Journal, 51 (5), 739–764.
Camilloni, I.A. and Barros, V.R., 2003. Extreme discharge events inthe Paraná River and their climate forcing. Journal ofHydrology, 278 (1–4), 94–106.
Cavallo, E. and Noy, I., 2009. The economics of natural disasters: asurvey [online]. RES Working Papers 4649, Inter-AmericanDevelopment Bank, Research Department. Available from:http://ideas.repec.org/p/idb/wpaper/4649.html [Accessed 22November 2013].
Chang, H., Franczyk, J., and Kim, C., 2009. What is responsible forincreasing flood risks? The case of Gangwon Province, Korea.Natural Hazards, 48, 399–354.
Changnon, S., ed., 1996. The great flood of 1993. Boulder, CO:Westview Press.
Changnon, S.A., 2001. Damaging thunderstorm activity in theUnited States. Bulletin of the American MeteorologicalSociety, 82, 597–608.
Choi, O. and Fisher, A., 2003. The impacts of socioeconomic devel-opment and climate change on severe weather catastrophelosses: Mid-Atlantic Region (MAR) and the US. ClimaticChange, 58 (1–2), 149–170.
Christensen, J.H., et al., 2007. Regional climate projections. In:S. Solomon, et al., eds. Climate change 2007: the physicalscience basis. Contribution of Working Group I to the FourthAssessment Report of the Intergovernmental Panel on ClimateChange. Cambridge: Cambridge University Press, 847–940.
Ciscar, J.C., ed., 2009. Climate change impacts in Europe. Finalreport of the PESETA research project. EUR 24093 EN–2009. Luxembourg: European Communities.
Conway, D., et al., 2009. Rainfall and water resources variability insub–Saharan Africa during the twentieth century. Journal ofHydrometeorology, 10 (1), 41–59.
Cunderlik, J.M. and Ouarda, T.B.M.J., 2009. Trends in the timingand magnitude of floods in Canada. Journal of Hydrology, 375(3–4), 471–480.
Curriero, F.C., et al., 2001. The association between extreme pre-cipitation and waterborne disease outbreaks in the UnitedStates, 1948–1994. American Journal of Public Health,91 (8), 1194–1199. doi:10.2105/AJPH.91.8.1194
Dankers, R. and Feyen, L., 2008. Climate change impact on floodhazard in Europe: an assessment based on high resolutionclimate simulations. Journal of Geophysical Research—Atmospheres, 113, D19105.
Dash, S., et al., 2007. Some evidence of climate change in twentieth-century India. Climatic Change, 85, 299–321.
Defra (Department for Environment, Food and Rural Affairs), 2004.Scientific and technical aspects of climate change, includingimpacts and adaptation and associated costs. London: Defra.
DeGaetano,A.T., 2009.Time-dependent changes in extreme-precipitationreturn-period amounts in the Continental United States. Journal ofApplied Meteorology and Climatology, 48, 2086–2099.
Di Baldassare, G., et al., 2010. Flood fatalities in Africa: from diagnosisto mitigation. Geophysical Research Letters, 37, L22402.
Douglas, I., 2009. Climate change, flooding and food security insouth Asia. Food Security, 1 (2), 127–136.
Downton, M.W., Miller, J.Z.B., and Pielke, R.A., 2005. Reanalysisof US National Weather Service flood loss database. NaturalHazards Review, 6, 13–22.
Dussaillant, A., et al., 2010. Repeated glacial–lake outburst floods inPatagonia: an increasing hazard? Natural Hazards, 54 (2),469–481.
Ebi, K.L., et al., 2008. Effects of global change on human health. In:J.L. Gamble, ed. Analyses of the effects of global change onhuman health and welfare and human systems. Report by theUS Climate Change Science Program and the Subcommitteeon Global Change Research. Washington, DC: USEnvironmental Protection Agency, 2-1–2-78.
ECLAC, 2003. Handbook for estimating the socio-economicand environmental effects of disaster [online]. MexicoCity: ECLAC, LC/MEX/G.5. Available from: http://www.eclac.org/publicaciones/xml/4/12774/lcmexg5i_VOLUME_Ia.pdf [Accessed 22 November 2013].
EEA (European Environment Agency), 2004. Impacts of Europe’schanging climate. An indicator-based assessment. Copenhagen:EEA Report no. 2/2004, European Environment Agency.
Engelthaler, D.M., et al., 1999. Climatic and environmental patternsassociated with hantavirus pulmonary syndrome, Four Cornersregion, United States.Emerging Infectious Diseases, 5 (1), 87–94.
Evans, E.R. and Ashley, G.B.O., 2004. Foresight future flooding:scientific summary. Future risks and their drivers. London:Office of Science and Technology.
Evans, J.P. and Boyer-Souchet, I., 2012. Local sea surface tempera-tures add to extreme precipitation in northeast Australia duringLa Niña. Geophysical Research Letters, 39, L10803.doi:10.1029/2012GL052014
Fengqing, J., et al., 2005. Magnification of flood disasters and its relationto regional precipitation and local human activities since the 1980sin Xinxiang, Northwestern China. Natural Hazards, 36, 307–330.
Feyen, L., Barredo, J.I., and Dankers, R., 2009. Implications ofglobal warming and urban land use change on flooding inEurope. Water and urban development paradigms—towardsan integration of engineering. In: J. Feyen, K. Shannon, andM. Neville, eds. Design and management approaches. BocaRaton, FL: CRC Press, 217–225.
Field, C.B., et al., eds., 2012. Managing the risks of extreme events anddisasters to advance climate change adaptation. Special Report ofWorking Groups I and II of the Intergovernmental Panel onClimate Change (IPCC). Cambridge: Cambridge University Press.
Fowler, H.J. and Wilby, R.L., 2010. Detecting changes in seasonalprecipitation extremes using regional climate model projec-tions: Implications for managing fluvial flood risk. WaterResources Research, 46, W0525.
Gallant, A.J.E. and Karoly, D.J., 2010. A combined climate extremesindex for the Australian region. Journal of Climate, 23 (23),6153–6165.
Gerten, D., et al., 2008. Causes of change in 20th century global riverdischarge. Geophysical Research Letters, 35, L20405.
Gleason, K.L., et al., 2008. A revised U.S. climate extremes index.Journal of Climate, 21 (10), 2124–2137.
Goode, N., et al., 2011. Review of recent Australian disaster inquiries[online]. Monash University. Available from: http://www.em.gov.au/AboutAGD/Authorityandaccountability/Committeesandcouncils/Documents/Review%20of%20Recent%20Australian%20Disaster%20Inquiries%20-%20final%20report.PDF [Accessed 15June 2013].
Graham, L.P., Andreasson, J., and Carlsson, B., 2007. Assessing climatechange impacts on hydrology from an ensemble of regional climatemodels, model scales and linking methods—a case study on theLule River basin. Climatic Change, 81 (suppl. 1), 293–307.
Gutowski, W.J., et al., 2008. Changes in extreme, cold–seasonsynoptic precipitation events under global warming.Geophysical Research Letters, 35, L20710.
Flood risk and climate change 25
Dow
nloa
ded
by [
71.2
18.1
66.9
] at
06:
31 0
7 Ja
nuar
y 20
14
Haeberli, W., et al., 2001. Prevention of outburst floods from peri-glacial lakes at Grubengletscher, Valais, Swiss Alps. Journal ofGlaciology, 47, 111–122.
Hall, J.W., Sayers, P.B., and Dawson, R.J., 2005. National-scaleassessment of current and future flood risk in England andWales. Natural Hazards, 36 (1–2), 147–164.
Handmer, J., 2008. Risk creation, bearing and sharing on Australianfloodplains. International Journal of Water ResourcesDevelopment, 24, 527–540.
Handmer, J., Reed, C., and Percovich, O., 2002. Disaster lossassessment guidelines. Brisbane: Department of EmergencyServices, State of Queensland, 117 p.
Handmer, J., et al., 2012. Changes in impacts of climate extremes:human systems and ecosystems. In: C.B. Field, et al., eds.Managing the risks of extreme events and disasters toadvance climate change adaptation. Special Report ofWorking Groups I and II of the Intergovernmental Panelon Climate Change (IPCC). Cambridge: CambridgeUniversity Press, 231–290.
Hardoy, J.E., Mitlin, D., and Satterthwaite, D., 2001. Environmentalproblems in an urbanizing world: finding solutions for cities inAfrica, Asia and Latin America. London: Earthscan.
Hashizume, M., et al., 2008. Factors determining vulnerability todiarrhoea during and after severe floods in Bangladesh.Journal of Water Health, 6 (3), 323–332.
Hattermann, F.F., et al., 2013. Climatological drivers of changes inflood hazard in Germany. Acta Geophysica, 61 (2), 463–477.
Hennessy, K., et al., 2007. Australia and New Zealand. In:M.L. Parry,et al., eds.Climate change 2007: impacts, adaptation and vulner-ability. Contribution of Working Group II to the FourthAssessment Report of the Intergovernmental Panel on ClimateChange. Cambridge: Cambridge University Press, 507–540.
Hilker, N., Badoux, A., and Hegg, C., 2009. The Swiss flood andlandslide damage database 1972–2007. Natural Hazards EarthSystem Sciences, 9, 913–925.
Hirabayashi, Y., et al., 2008. Global projections of changing risks offloods and droughts in a changing climate. HydrologicalSciences Journal, 53 (4), 754–772.
Hirabayashi, Y., et al., 2013. Global flood risk under climate change.Nature Climate Change, 3, 816–821. doi:10.1038/nclimate1911
Hirabayashi, Y. and Kanae, S., 2009. First estimate of the future globalpopulation at risk of flooding.Hydrology Research Letters, 3, 6–9.
Hirsch, R.M. and Ryberg, K.R., 2012. Has the magnitude of floodsacross the USA changed with global CO2 levels? HydrologicalSciences Journal, 57 (1), 1–9.
Hjelle, B. and Glass, G.E., 2000. Outbreak of hantavirus Infection inthe Four Corners Region of the United States in the Wake ofthe 1997–1998 El Niño–Southern Oscillation. The Journal ofInfectious Diseases, 181 (5), 1569–1573.
Hoes, O.A.C., 2007. Aanpak wateroverlast in polders op basis vanrisicobeheer. Thesis (PhD), Delft University of Technology, (inDutch). Available from: http://repository.tudelft.nl/assets/uuid:69de94f9–385c–4c50–beff–8cc7b955beba/ceg_hoes_20070319.pdf
xHuggel, C., et al., 2004. An assessment procedure for glacialhazards in the SwissAlps. Canadian Geotechnology Journal,41, 1068–1083.
Ives, J.D., Shrestha, R.B., and Mool, P.K., 2010. Formation ofglacial lakes in the Hindu Kush–Himalayas and GLOF RiskAssessment. Kathmandu: ICIMOD.
IWR (Institute for Water Resources, US Army Corps of Engineers),2011. Flood risk management approaches as being practicedin Japan, Netherlands, United Kingdom, and United States.IWR Report no. 2011–R–08, 124 pp.
Jongman, B., Ward, P.J., and Aerts, J.C.J.H., 2012. Global exposureto river and coastal flooding: long term trends and changes.Global Environmental Change, 22 (4), 823–835.
Kamiguchi, K., et al., 2006. Changes in precipitation–basedextremes indices due to global warming projected by a global20-km-mesh atmospheric model. SOLA, 2, 64–67.
Kharin, V., et al., 2007. Changes in temperature and precipitationextremes in the IPCC ensemble of global coupled model simu-lations. Journal of Climate, 20 (8), 1419–1444.
Kleinen, T. and Petschel-Held, G., 2007. Integrated assessment ofchanges in flooding probabilities due to climate change.Climatic Change, 81 (3), 283–312.
Koutsoyiannis, D., 2011. Hurst-Kolmogorov dynamics and uncer-tainty. Journal of the American Water Resources Association,47 (3), 481–495.
Koutsoyiannis, D., 2012. Reply to the Comment by T. López-Arias on“Clausius-Clapeyron equation and saturation vapour pressure: sim-ple theory reconciled with practice”. European Journal of Physics,33, L13–L14. doi:http://dx.doi.org/10.1088/0143-0807/33/3/L13
Koutsoyiannis, D., 2013. Hydrology and change. HydrologicalSciences Journal, 58 (6), 1177–1197. doi:http://dx.doi.org/10.1080/02626667.2013.804626
Koutsoyiannis, D., et al., 2008. On the credibility of climate predic-tions. Hydrological Sciences Journal, 53 (4), 671–684.
Koutsoyiannis, D., et al., 2011. Scientific dialogue on climate: is itgiving black eyes or opening closed eyes? Reply to “A blackeye for the Hydrological Sciences Journal” by D. Huard.Hydrological Sciences Journal, 56 (7), 1334–1339.
Koutsoyiannis, D. and Montanari, A., 2007. Statistical analysis ofhydroclimatic time series: uncertainty and insights. WaterResources Research, 43 (5), W05429.
Kovats, R.S. and Akhtar, R., 2008. Climate, climate change and humanhealth in Asian cities. Environment and Urbanization, 20 (1),165–175. doi:10.1177/0956247808089154
Kron, W., et al., 2012. How to deal properly with a natural cata-strophe database—analysis of flood losses. Natural Hazardsand Earth System Sciences, 12, 535–550.
Kshirsagar, N., Shinde, R., and Mehta, S., 2006. Floods in Mumbai:impact of public health service by hospital staff and medicalstudents. Journal of Postgraduate Medicine, 52 (4), 312.
Kundzewicz, Z.W., 2011. Nonstationarity in water resources—Central European perspective. Journal of the American WaterResources Association (JAWRA), 47 (3), 550–562. doi:10.1111/j.1752-1688.2011.00549.x
Kundzewicz, Z.W., ed., 2012. Changes in flood risk in Europe.Wallingford: IAHS Press.
Kundzewicz, Z.W., 2013. Floods: lessons about early warning sys-tems. In: EEA (European Environment Agency), ed. Latelessons from early warnings: science, precaution, innovation.EEA Report no. 1/2013. Copenhagen: European EnvironmentAgency, 347–368.
Kundzewicz, Z.W., Pińskwar, I., and Brakenridge, G.R., 2013. Largefloods in Europe, 1985–2009. Hydrological Sciences Journal,58 (1), 1–7.
Kundzewicz, Z.W. and Schellnhuber, H.-J., 2004. Floods in theIPCC TAR perspective. Natural Hazards, 31, 111–128.
Kundzewicz, Z.W. and Stakhiv, E.Z., 2010. Are climate models“ready for prime time” in water resources management appli-cations, or is more research needed? Editorial. HydrologicalSciences Journal, 55 (7), 1085–1089.
Kundzewicz, Z.W., et al., 2005. Trend detection in river flow time-series: 1. Annual maximum flow. Hydrological SciencesJournal, 50 (5), 797–810.
Kundzewicz, Z.W., et al., 2007. Freshwater resources and theirmanagement. In: M.L. Parry, et al., eds. Climate change2007: impacts, adaptation and vulnerability. Contribution ofWorking Group II to the Fourth Assessment Report of theIntergovernmental Panel on Climate Change. Cambridge:Cambridge University Press.
26 Zbigniew W. Kundzewicz et al.
Dow
nloa
ded
by [
71.2
18.1
66.9
] at
06:
31 0
7 Ja
nuar
y 20
14
Kundzewicz, Z.W., et al., 2008. The implications of projected cli-mate change for freshwater resources and their management.Hydrological Sciences Journal, 53 (1), 3–10.
Kundzewicz, Z.W., et al., 2012. Flood risk in Europe—setting thestage. In: Z.W. Kundzewicz, ed. Changes in flood risk inEurope. Wallingford: IAHS Press, 11–26.
Kunkel, K.E., et al., 2008. Observed changes in weather andclimate extremes. In: T.R. Karl, et al., eds. Weather andclimate extremes in a changing climate. Regions of focus:North America, Hawaii, Caribbean, and US Pacific Islands.Report by the US Climate Change Science Program and theSubcommittee on Global Change Research, Washington,DC, 222.
Leander, R., et al., 2008. Estimated changes in flood quantiles of theriver Meuse from resampling of regional climate model output.Journal of Hydrology, 351 (3–4), 331–343.
Lehner, B., et al., 2006. Estimating the impact of global change onflood and drought risks in Europe: a continental, integratedanalysis. Climatic Change, 75 (3), 273–299.
Liepert, B.G. and Previdi, M., 2012. Inter-model variability andbiases of the global water cycle in CMIP3 coupled climatemodels. Environmental Research Letters, 7. doi:10.1088/1748–9326/7/1/014006
Lins, H.F. and Slack, J.R., 1999. Streamflow trends in the UnitedStates. Geophysical Research Letters, 26 (2), 227–230.
Lugeri, N., et al., 2010. River flood risk and adaptation in Europe—assessment of the present status. Mitigation and AdaptationStrategies for Global Change, 15 (7), 621–639.
Lyon, B., 2003. Enhanced seasonal rainfall in northern Venezuelaand the extreme events of December 1999. Journal of Climate,16, 2302–2306.
Maaskant, B., Jonkman, S.N., and Bouwer, L.M., 2009. Future riskof flooding: an analysis of changes in potential loss of life inSouth Holland (The Netherlands). Environmental Science andPolicy, 12, 157–169.
Marengo, J., et al., 2012. Extreme climatic events in the Amazonbasin. Theoretical and Applied Climatology, 107, 73–85.doi:10.1007/s00704-011-0465-1
Marengo, J.A., et al., 2009. Future change of temperature and pre-cipitation extremes in South America as derived from thePRECIS regional climate modelling system. InternationalJournal of Climatology, 29 (15), 2241–2255.
Mastrandrea, M.D., et al., 2010. Guidance note for lead authors ofthe IPCC Fifth Assessment Report on consistent treatment ofuncertainties [online]. Intergovernmental Panel on ClimateChange (IPCC). Available from: http://www.ipcc.ch[Accessed 18 October 2012].
McCabe, G.J. and Wolock, D.M., 2002. A step increase in stream-flow in the conterminous United States. Geophysical ResearchLetters, 29 (24), 2185.
McMichael, A.J., Wooddruff, R.E., and Hales, S., 2006. Climatechange and human health: present and future risks. Lancet,367, 859–869.
Meyer, V., et al., 2013. Assessing the costs of natural hazards: stateof the art and knowledge gaps. Natural Hazards and EarthSystem Sciences, 13, 1351–1373.
Miller, S., Muir-Wood, R., and Boissonnade, A., 2008. Anexploration of trends in normalised weather–related cata-strophe losses. In: H.F. Diaz and R.J. Murnane, eds.Climate extremes and society. Cambridge: CambridgeUniversity Press, 225–247.
Min, S.-K., et al., 2011. Human contribution to more intense pre-cipitation extremes. Nature, 470 (7334), 378–381.
Min, S.-K., Zhang, X., and Zwiers, F., 2008. Human-induced arcticmoistening. Science, 320 (5875), 518–520.
Ministry of Environment and Forest, 2005. National AdaptationProgramme of Action (NAPA), Final Report. Dhaka:Government of the People’s Republic of Bangladesh.
Moberg, A., et al., 2006. Indices for daily temperature and precipita-tion extremes in Europe analyzed for the period 1901–2000.Journal of Geophysical Research—Atmospheres, 111(D22),D22106.
Montanari, A., et al., 2013. “Panta Rhei—everything flows”: changein hydrology and society—the IAHS Scientific Decade 2013–2022. Hydrological Sciences Journal, 58 (6), 1256–1275. doi:http://dx.doi.org/10.1080/02626667.2013.809088
Morin, E., et al., 2009. Flood routing and alluvial aquifer rechargealong the ephemeral arid Kuiseb River, Namibia. Journal ofHydrology, 368, 262–275.
Mullan, B., et al., 2008. Climate change effects and impacts assess-ment: a guidance manual for local government in NewZealand. Wellington: Ministry for the Environment.
Neumayer, E. and Barthel, F., 2011. Normalizing economic loss fromnatural disasters: a global analysis. Global EnvironmentalChange, 21, 13–24.
Nicholls, N. and Seneviratne, S.I., 2013. Comparing IPCCAssessments: how do the AR4 and SREX assessments ofchanges in extremes differ? Climatic Change. doi:10.1007/S10854-013-018-0
OCDESC (Official Committee for Domestic and External SecurityCoordination), 2007. National hazardscape report. Wellington:Official Committee for Domestic and External SecurityCoordination, Department of the Prime Minister and Cabinet.
Oliveira, P.J.C., et al., 2011. Vegetation-mediated impacts of trendsin global radiation on land hydrology: a global sensitivitystudy. Global Change Biology, 17, 3453–3467.
Osman-Elasha, B., et al., 2006. Impacts, vulnerability and adapta-tion to climate change in Africa. Background paper for theAfrican Workshop on Adaptation Implementation of Decision1/CP.10 of the UNFCCC Convention Accra, 21–23 September,Ghana.
Overeem, I. and Syvitski, J.P.M., 2010. Shifting discharge peaks in ArcticRivers, 1997–2007. Geografiska Annaler, 92 (2), 285–296.
Pall, P., et al., 2011. Anthropogenic greenhouse gas contribution toflood risk in England and Wales in autumn 2000. Nature, 470(7334), 382–385. doi:10.1038/nature09762
Parmenter, R., et al., 1999. Incidence of plague associated withincreased winter–spring precipitation in New Mexico. AmericanJournal of Tropical Medicine and Hygiene, 61 (5), 814–821.
Parry, M., et al., 2009. Assessing the costs of adaptation to climatechange: a review of the UNFCCC and other recent estimates.London: International Institute for Environment andDevelopment and Grantham Institute for Climate Change.
Peduzzi, P., et al., 2009. Assessing global exposure and vulnerabilitytowards natural hazards: the Disaster Risk Index. NaturalHazards and Earth System Sciences, 9, 1149–1159.
Peduzzi, P., et al., 2011. Preview Global Risk Data Platform,[online], UNEP/GRID Geneva, UNISDR, World Bank.Available from: http://preview.grid.unep.ch/index.php?preview=tools&cat=1&lang=eng [Accessed 18 October 2012].
Peduzzi, P., et al., 2012. Global trends in tropical cyclones risk.Nature Climate Change, 2 (4), 289–294.
Peterson, T.C., et al., 2008. Why weather and climate extremesmatter. In: T.R. Karl, et al., eds. Weather and climate extremesin a changing climate. Regions of focus: North America,Hawaii, Caribbean, and US Pacific Islands. Washington,DC: US Climate Change Science Program.
Pielke Jr., R.A., et al., 2005. Clarifying the attribution of recentdisaster losses: a response to Epstein and McCarthy. Bulletinof the American Meteorological Society, 86, 1481–1483.
Flood risk and climate change 27
Dow
nloa
ded
by [
71.2
18.1
66.9
] at
06:
31 0
7 Ja
nuar
y 20
14

Pielke Jr., R.A. and Downton, M.W., 2000. Precipitation and dama-ging floods: trends in the United States, 1932–1997. Journal ofClimate, 13 (20), 3625–3637.
Pitman, A.J., et al., 2009. Uncertainties in climate responses to pastland cover change: first results from the LUCID intercompar-ison study. Geophysical Research Letters, 36 (14), L14814.
Pomeranets, K.S., 2005. Three centuries of floods in St Petersburg.St Petersburg: Iskusstvo.
Pryor, S.C., et al., 2009. How spatially coherent and statistically robustare temporal changes in extreme precipitation in the contiguousUSA? International Journal of Climatology, 29 (1), 31–45.
Ramsbottom, D., Sayers, P., and Panzeri, M., 2012.Climate change riskassessment for the floods and coastal erosion sector [online]. UKClimate Change Risk Assessment. Defra, London. Availablefrom: http://www.defra.gov.uk/environment/climate/government/risk-assessment/#sectors [Accessed 15 June 2013].
Ranger, N., et al., 2011. An assessment of the potential impact ofclimate change on flood risk in Mumbai. Climatic Change,104, 139–167.
Richardson, S.D. and Reynolds, J.M., 2000. An overview of glacialhazards in the Himalayas. Quaternary International, 65, 31–47.
Rico, M., et al., 2008. Reported tailings dam failures. A review ofthe European incidents in the worldwide context. Journal ofHazardous Materials, 152, 846–852.
Rodier, J.A. andRoche,M., 1984.World catalogue ofmaximumobservedfloods. IAHS Publication No. 143. Wallingford: IAHS Press.
Rosenzweig, C., et al., 2007. Assessment of observed changes andresponses in natural and managed systems. In: M.L. Parry,et al., eds. Climate change 2007: impacts, adaptation andvulnerability. Contribution of Working Group II to the FourthAssessment Report of the Intergovernmental Panel on ClimateChange. Cambridge: Cambridge University Press.
Saenz, R., et al., 1995. Post-disaster malaria in Costa Rica.Prehospital Disaster Medicine, 10 (3), 154–160.
Savelieva, N.I., et al., 2004. Climate change in the northern Asia inthe second half of the 20th century. Pacific Oceanography, 2(1–2), 74–84.
Schneider, F., et al., 2010. Shadow economies all over the world: Newestimates for 162 countries from 1999 to 2007 [online]. TheWorldBank Development Research Group, Poverty and Inequality Team& Europe and Central Asia Region, Human DevelopmentEconomics Unit. Available from: http://wwwwds.worldbank.org/external/default/WDSContentServer/IW3P/IB/2010/10/14/000158349_20101014160704/Rendered/PDF/WPS5356.pdf [Accessed18 October 2012].
Semyonov, V.A. and Korshunov, A.A., 2006. Floods on the Russianrivers in the late 20th century and the early 21st century. Issuesof Geography and Geo-ecology, 5, 6–12.
Seneviratne, S.I., et al., 2012. Changes in climate extremes and theirimpacts on the natural physical environment. In: C.B. Field, et al.,eds. Managing the risks of extreme events and disasters toadvance climate change adaptation. Special Report of WorkingGroups I and II of the Intergovernmental Panel on ClimateChange (IPCC). Cambridge: Cambridge University Press.
Shankman, D., et al., 2006. Flood frequency in China’s Poyang LakeRegion: trends and teleconnections. International Journal ofClimatology, 26, 1255–1266.
Shen, C., et al., 2008. Characteristics of anomalous precipitationevents over eastern China during the past five centuries.Climate Dynamics, 31 (4), 463–476.
Shiklomanov, A.I., et al., 2007. Temporal and spatial variations inmaximum river discharge from a new Russian data set. Journalof Geophysical Research—Biogeosciences, 112, G04S53.doi:10.1029/2006JG000352
Stephens, G.L., et al., 2010. Dreary state of precipitation in globalmodels. Journal of Geophysical Research, 115, D24211.doi:10.1029/2010JD014532
Syvitski, J.P.M. and Brakenridge, G.R., 2013. Causation and avoid-ance of catastrophic flooding along the Indus River, Pakistan[online]. GSA Today, 23 (1). doi: 10.1130/GSATG165A.1.Available from: http://www.geosociety.org/gsatoday/archive/23/1/article/i1052-5173-23-1-4.htm [Accessed 22 November2013].
Taye, M.T., et al., 2011. Assessment of climate change impact onhydrological extremes in two source regions of the Nile RiverBasin. Hydrology and Earth System Sciences, 15 (1), 209–222.
Te Linde, A.H., et al., 2011. Future flood risk estimates along theriver Rhine. Natural Hazards Earth System Sciences, 11,459–473.
Teuling, A.J., et al., 2010. Contrasting response of European forestand grassland energy exchange to heatwaves. NatureGeoscience, 3, 722–727.
Thibault, K.M. and Brown, J.H., 2008. Impact of an extremeclimatic event on community assembly. PNAS, 105 (9),3410–3415.
Trenberth, K.E., 2012. Framing the way to relate climate extremes toclimate change. Climatic change [online]. Available from: http://www.cgd.ucar.edu/cas/Trenberth/trenberth.papers/Framing_ClimCh12.pdf [Accessed 18 October 2012].
Trenberth, K.E., et al., 2007. Observations: surface and atmosphericclimate change. In: S. Solomon, et al., eds. Climate change2007: the physical science basis. Contribution of WorkingGroup I to the Fourth Assessment Report of theIntergovernmental Panel on Climate Change. Cambridge:Cambridge University Press.
UNISDR (United Nations International Strategy for DisasterReduction), 2011. Revealing risk, redefining development.Geneva: UNISDR.
Villarini, G.F., et al., 2009.On the stationarity of annual flood peaks in thecontinental United States during the 20th century.Water ResourcesResearch, 45, W08417. doi:10.1029/2008WR007645
Vörösmarty, C.J., 2002. Global change, the water cycle, and oursearch for Mauna Loa. Hydrological Processes, 16 (1), 135–139. doi:10.1002/hyp.527
Wang, J. and Zhang, X., 2008. Downscaling and projection of winterextreme daily precipitation over North America. Journal ofClimate, 21 (5), 923–937.
Wells, L.E., 1990. Holocene history of the El Niño phenomenon asrecorded in flood sediments of northern coastal Peru. Geology,18 (11), 1134–1137. doi:10.1130/0091-7613
Wenger, C., Hussey, K., and Pittock, J., 2013. Living with floods: keylessons from Australia and abroad [online]. Australian NationalUniversity and NCCARF. Available from: http://www.nccarf.edu.au/publications/living-floods-key-lessons-australia-and-abroad[Accessed 22 November 2013].
Wilby, R.L., et al., 2008. Climate change and fluvial flood risk in the UK:more of the same? Hydrological Processes, 22 (14), 2511–2523.
Wilby, R.L. and Keenan, R., 2012. Adapting to flood risk underclimate change. Progress in Physical Geography, 36, 349–379.
World Bank, 2010. Economics of adaptation to climate change [online].Washington, DC: World Bank. Available from: http://www-wds.worldbank.org/external/default/WDSContentServer/WDSP/IB/2012/06/27/000425970_20120627163039/Rendered/PDF/702670ESW0P10800EACCSynthesisReport.pdf [Accessed 22November 2013].
Wu, X., et al., 2012. An evaluation of land surface modification,storm sewer development, and rainfall variation on waterlog-ging risk in Shanghai. Natural Hazards, 63, 305–323.
Zhang, X., et al., 2007. Detection of human influence on twen-tieth-century precipitation trends. Nature, 448 (7152),461–465.
Zolina, O.C., et al., 2010. Changing structure of European precipita-tion: longer wet periods leading to more abundant rainfalls.Geophysical Research Letters, 37, L06704.
28 Zbigniew W. Kundzewicz et al.
Dow
nloa
ded
by [
71.2
18.1
66.9
] at
06:
31 0
7 Ja
nuar
y 20
14