flood risk assessment and risk reduction plan · flood risk assessment and risk reduction plan...
TRANSCRIPT
Prepared for: Charlotte-Mecklenburg Storm Water Services
Prepared by:
AECOM
January 2012
FFlloooodd RRiisskk AAsssseessssmmeenntt aanndd
RRiisskk RReedduuccttiioonn PPllaann
Flood Risk Assessment and Risk Reduction Plan January 2012
i
Table of Contents
Executive Summary ........................................................................................................................ 1 Section 1 Introduction ............................................................................................................... 6
1.1 Background ...................................................................................................................... 6 1.2 Purpose ............................................................................................................................. 7 1.3 Goals and Objectives ........................................................................................................ 7 1.4 Concept............................................................................................................................. 8
Section 2 Flood Risk Assessment ........................................................................................... 10 2.1 Flood Risk ...................................................................................................................... 10 2.2 Flood Risk Property Score ............................................................................................. 10 2.3 Flood Risk Scoring System ............................................................................................ 10 2.4 Flood Risk Property Score Example Calculation ........................................................... 23
Section 3 Risk Reduction Recommendations ......................................................................... 25 3.1 Purpose ........................................................................................................................... 25 3.2 Flood Mitigation Techniques ......................................................................................... 25
3.2.1 Property Acquisition and Structure Demolition (Buyout) ...................................... 26 3.2.2 Structure Demolition and Rebuild (Demo Rebuild) ............................................... 27 3.2.3 Property Acquisition and Structure Relocation (Relocation) ................................. 28 3.2.4 Property Acquisition, Demolition or Relocation, and Re-sale (Buyout Resale) .... 29 3.2.5 Structure Elevation (Elevation) ............................................................................... 30 3.2.6 Abandon Basement and Fill (Fill Basement) .......................................................... 31 3.2.7 Dry Floodproofing of Structures (Dry Floodproofing) ........................................... 32 3.2.8 Wet Floodproofing of Structures (Wet Floodproofing) .......................................... 34 3.2.9 Audible Flood Warning System for Individual Property (Audible Warning) ........ 35 3.2.10 Storm Water Detention Facilities (Detention) ........................................................ 36 3.2.11 Storm Water System Control (Flood Control) ........................................................ 37 3.2.12 Automated Flood Notifications (FINS Notification) .............................................. 39 3.2.13 Public Education (Public Education) ...................................................................... 39 3.2.14 Flood Insurance (Flood Insurance) ......................................................................... 40 3.2.15 Levee/Floodwall Protection for Multiple Structures (Levee) ................................. 41 3.2.16 Protecting Service Equipment (HVAC, electrical, utilities, fuel) (Protecting Equipment) ............................................................................................................................ 43 3.2.17 Partial Dry Floodproofing (Partial Dry Floodproofing) ......................................... 43 3.2.18 Partial Wet Floodproofing (Partial Wet Floodproofing) ........................................ 44 3.2.19 Levee/Wall/Berm for a Single Structure (Ring Levee) .......................................... 45
3.3 Recommendation Categories.......................................................................................... 46 3.4 Evaluating the Risk Reduction Recommendations ........................................................ 47
Section 4 Flood Mitigation Priority Scores ............................................................................ 49 4.1 Purpose ........................................................................................................................... 49 4.2 Flood Mitigation Scoring System .................................................................................. 49 4.3 Flood Mitigation Scores ................................................................................................. 53 4.4 Applying the Flood Mitigation Scoring System ............................................................ 57
Section 5 Planning Process ..................................................................................................... 58 5.1 Background .................................................................................................................... 58 5.2 Phase I: Develop Framework ......................................................................................... 58 5.3 Phase II: Refine, Finalize, and Apply Methods ............................................................. 58
Flood Risk Assessment and Risk Reduction Plan January 2012
ii
5.4 Citizen Review Committee (CRC) ................................................................................. 59 5.4.1 CRC Meetings ......................................................................................................... 60 5.4.2 CRC Input ............................................................................................................... 61
5.5 Pilot Study ...................................................................................................................... 61 5.5.1 Pilot Study Procedures ............................................................................................ 62 5.5.2 Flood Risk Property Score ...................................................................................... 62 5.5.3 Risk Reduction Recommendations ......................................................................... 64
Section 6 Plan Maintenance .................................................................................................... 68 6.1 Plan Monitoring and Maintenance ................................................................................. 68 6.2 Losses Avoided .............................................................................................................. 68
List of Tables
Table 1: Flood Impacts Criteria and Base Points.......................................................................... 17 Table 2: Storm Event Recurrence Intervals/Annualized Probability ............................................ 18 Table 3: Location-based Multipliers ............................................................................................. 22 Table 4: Mitigation Techniques Matrix ........................................................................................ 47 Table 5: Flood Mitigation Score Factors Summary ...................................................................... 53 Table 6: CRC Meeting Schedule and Covered Topics ................................................................. 60
List of Figures
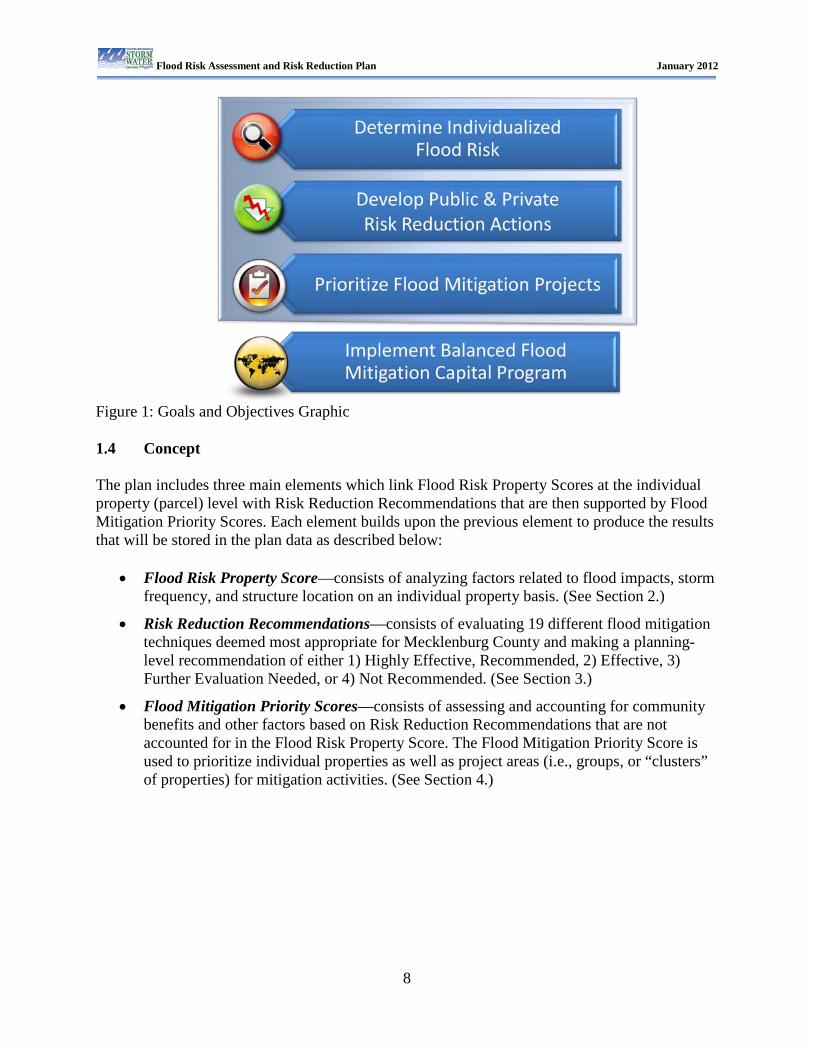
Figure 1: Goals and Objectives Graphic ......................................................................................... 8 Figure 2: Concept Process Graphic................................................................................................. 9 Figure 3: Flood Risk Property Score Illustration .......................................................................... 11 Figure 4: Examples of Flooding Above the Lowest Floor (Source: FEMA P-312) ..................... 11 Figure 5: Example of Mechanical Equipment Flooding – DFE is Design Flood Elevation (Source: FEMA P-312) ................................................................................................................. 12 Figure 6: Example of Crawlspace Flooding (left) and Basement Flooding (right) – DFE is Design Flood Elevation (Source: FEMA P-312) ......................................................................... 12 Figure 7: Example of Parcel Completely Surrounded by Flood Water from FIRM .................... 13 Figure 8: Example of a Structure Completely Surrounded by Flood Water From FIRM ............ 13 Figure 9: Example of “Moderate” Exterior Property Improvement (left) and “Significant” Exterior Property Improvement (right) ......................................................................................... 15 Figure 10: Example of Potential Vehicle Flooding ...................................................................... 16 Figure 11: Example of Yard Flooding .......................................................................................... 16 Figure 12: Illustration of Storm Water Velocities in a Stream Cross-Section .............................. 20 Figure 13: Flow Hazard Regimes for Infants, Children, and Adults ............................................ 21 Figure 14: Example of Building Located in the Community Encroachment Area from Flood Insurance Rate Map ...................................................................................................................... 22 Figure 15: Flood Risk Scoring System Example .......................................................................... 23 Figure 16: Example of Demolition in Progress – Cavalier Apartments ....................................... 26 Figure 17: Example of a Demo Rebuild Project ........................................................................... 27 Figure 18: Example of House Relocation ..................................................................................... 28 Figure 19: House During Elevation Process ................................................................................. 30 Figure 20: Completed Elevation of House.................................................................................... 30 Figure 21: Example of Dry Floodproofing (Source: FEMA P-312)............................................. 33
Flood Risk Assessment and Risk Reduction Plan January 2012
iii
Figure 22: Example of Wet Floodproofing (Source: FEMA P-312) ............................................ 34 Figure 23: Example of a water alert system.................................................................................. 35 Figure 24: Example of Dry Detention Basin ................................................................................ 36 Figure 25: Example of Backwater at Culvert Shown in Profile ................................................... 38 Figure 26: FINS Logo ................................................................................................................... 39 Figure 27: Example of Flood Safety Brochure ............................................................................. 39 Figure 28: Example of Flood Insurance Promotion Poster ........................................................... 40 Figure 29: Levee Built around Multiple Structures ...................................................................... 41 Figure 30: Plan View and Section View of Traditional Level/Floodwall System ....................... 41 Figure 31: Example of Elevated Utilities...................................................................................... 43 Figure 32: Levee/Flood for a Single Structure ............................................................................. 45 Figure 33: Sand Sifter Graphic ..................................................................................................... 48 Figure 34: Example Project Area Map ......................................................................................... 55 Figure 35: Neighborhoods and Watersheds Represented by CRC Members ............................... 59 Figure 36: CRC Meeting ............................................................................................................... 61 Figure 37: Map of Pilot Study Areas ............................................................................................ 62 Figure 38: Map of Pilot Study Areas ............................................................................................ 63 Figure 39: Example Dashboard .................................................................................................... 64 Figure 40: Example Dashboard Map ............................................................................................ 65
Appendices
Appendix A: Acronyms and Definitions ...................................................................................... 69 Appendix B: Data Requirements .................................................................................................. 73 Appendix C: Documentation (of Decisions and Assumptions Made) .......................................... 75 Appendix D: Flood Risk Property Score – Impact-based Scoring Matrix ................................... 76 Appendix E: Mitigation Techniques Criteria Summary ............................................................... 77 Appendix F: Benefit-Cost Assumptions ....................................................................................... 83 Appendix G: Pilot Study Flood Risk Property Score Sample Spreadsheet .................................. 86 Appendix H: Pilot Study Mitigation Recommendations Sample Spreadsheet ............................. 87 Appendix I: Pilot Study Flood Mitigation Property Score Sample Spreadsheet .......................... 88
Flood Risk Assessment and Risk Reduction Plan January 2012
1
Executive Summary
Charlotte-Mecklenburg Storm Water Services (CMSWS) manages and maintains the regulated floodplains within the City of Charlotte, the towns of Cornelius, Davidson, Huntersville, Matthews, Mint Hill, and Pineville, and the unincorporated areas of Mecklenburg County. CMSWS aims to serve the citizens of Mecklenburg County by reducing the potential for loss of life and property due to flooding, while enhancing the natural and beneficial functions of the floodplain along streams regulated by the Federal Emergency Management Agency (FEMA). There are over 4,000 structures in approximately 350 miles of regulated streams within the County. The CMSWS Flood Mitigation Program is responsible for assessing flood risk, developing mitigation plans, and identifying flood hazard mitigation projects within the floodplain. As a national leader in local floodplain management, CMSWS has historically integrated risk identification, assessment, and planning. These efforts have resulted in the successful implementation of structural and non-structural risk reduction measures, including the acquisition and demolition of more than 250 flood-prone structures within the County as well as the adoption of local floodplain development regulations that exceed Federal standards. This Flood Risk Assessment and Risk Reduction Plan (Flood RA/RR Plan) is designed to assist the County’s Flood Mitigation Program in building and expanding upon these previous efforts to minimize the consequences to people and property when a flood occurs. The approaches, methods, and products described in this plan are necessary to further integrate the County’s risk identification, assessment, and planning efforts. CMSWS expects to leverage detailed local data and new mapping products with technology in order to perform property-specific risk assessments, identify planning-level mitigation projects, and set project priorities. It will allow CMSWS to engage in risk-based mitigation planning and decision making, resulting in strategic, sustainable actions that reduce or eliminate risks to life and property from flooding. This project also represents a significant step forward in increasing the public’s awareness and understanding of risk management. The Flood RA/RR Plan is designed to be a dynamic, continuously updated plan that will aid in identifying, prioritizing, and planning future flood mitigation projects. It will be a “digital plan” and as such will be routinely updated as new data becomes available. Examples of data that can change over time include property specific data such as Elevation Certificates, parcel information, and building footprints, as well as hazard-
Flood Risk Assessment and Risk Reduction Plan January 2012
2
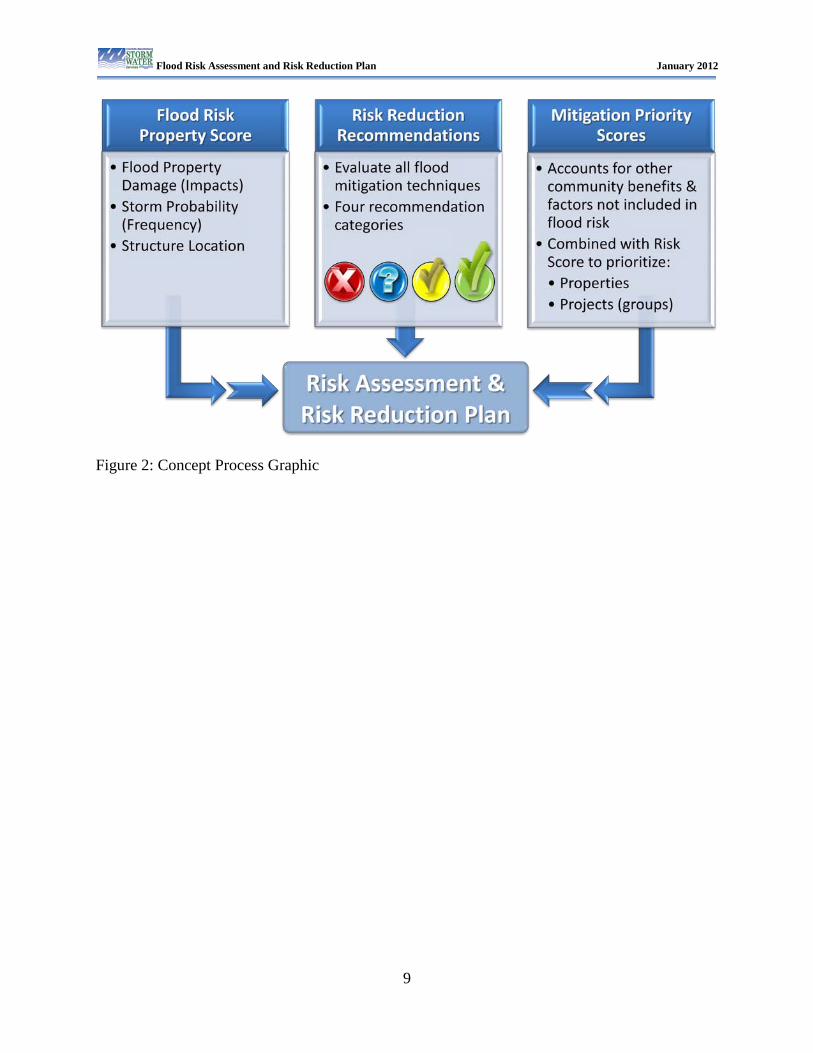
specific data such as flood hazard maps and velocity areas, and also environmental data, such as water quality buffers, environmental focus areas, etc. The plan includes three main elements which link Flood Risk Property Scores at the individual property (parcel) level with Risk Reduction Recommendations that are then supported by Flood Mitigation Priority Scores. Each element builds upon the previous element to produce the results that will be stored in the plan data as described below:
Flood Risk Property Score—consists of analyzing factors related to flood impacts, storm frequency, and structure location on an individual property basis.
Risk Reduction Recommendations—consists of evaluating 19 different flood mitigation techniques deemed most appropriate for Mecklenburg County and making a planning-level recommendation of either 1) Highly Effective, Recommended, 2) Effective, 3) Further Evaluation Needed, 4) Not Recommended.
Flood Mitigation Priority Scores—consists of assessing and accounting for community benefits and other factors based on Risk Reduction Recommendations that are not accounted for in the Flood Risk Property Score. The Flood Mitigation Priority Score is used to prioritize individual properties as well as project areas (i.e., groups, or “clusters” of properties) for mitigation activities.
The Flood Risk Property Score is intended to be a relative indicator of a property’s flood risk. Flood risk is defined as the likelihood of an event occurring (probability) multiplied by the impacts/consequences (financial, personal, and property damage) that occur. The Flood Risk Scoring System generates a specific Flood Risk Property Score for individual properties. The Flood Risk Property Score is derived through the identification of the potential flood impacts (consequences, or damages) to the property, quantifying the likelihood that the flood impact will occur, and accounting for additional risks to the structure due to location. The flood impact factors deemed important to citizens within the Mecklenburg County floodplain and incorporated into the Flood Risk Property Score are: Finished floor/living space Frequency of flooding Location within the floodplain (including velocity) Crawl space Mechanical/systems Vehicles Ingress/egress from the building and property during a flood Exterior improvements (detached garages, sheds, pools, etc.) Number of dwelling units impacted
The end result of applying the Flood Risk Scoring System is a numerical score that provides information about the relative flood risk for the property. CMSWS can use this score to aid in prioritizing the flood-prone properties according to their flood risk for flood mitigation planning purposes. The intent of this step is to identify the properties at risk, and to quantify their actual level of risk based on available flood hazard data and building information for each property.
Flood Risk Assessment and Risk Reduction Plan January 2012
3
The Risk Reduction Recommendations contained within the plan data are intended to be used to guide both public and private flood mitigation activities. The plan will identify flood mitigation techniques that would be most effective in reducing flood risk for each property. The key to any flood hazard mitigation plan is implementing actions that will eliminate or reduce flood risk. Therefore, mitigation recommendations will be made for each flood-prone property based on the evaluation of different mitigation techniques according to a variety of selection criteria. As part of the plan, the following 19 mitigation techniques have been identified and determined to be appropriate for application in Mecklenburg County:
1. Property Acquisition and Structure Demolition 2. Structure Demolition and Rebuild 3. Property Acquisition and Structure Relocation 4. Property Acquisition, Demolition or Relocation, and Re-sale 5. Structure Elevation 6. Abandon Basement and Fill 7. Dry Floodproofing of Structures 8. Wet Floodproofing of Structures 9. Audible Flood Warning System for Individual Property 10. Storm Water Detention Facilities 11. Storm Water System Control 12. Automated Flood Notifications 13. Public Education 14. Flood Insurance 15. Levee/Floodwall Protection for Multiple Structures 16. Protecting Service Equipment 17. Partial Dry Floodproofing 18. Partial Wet Floodproofing 19. Levee/Wall/Berm for a Single Structure
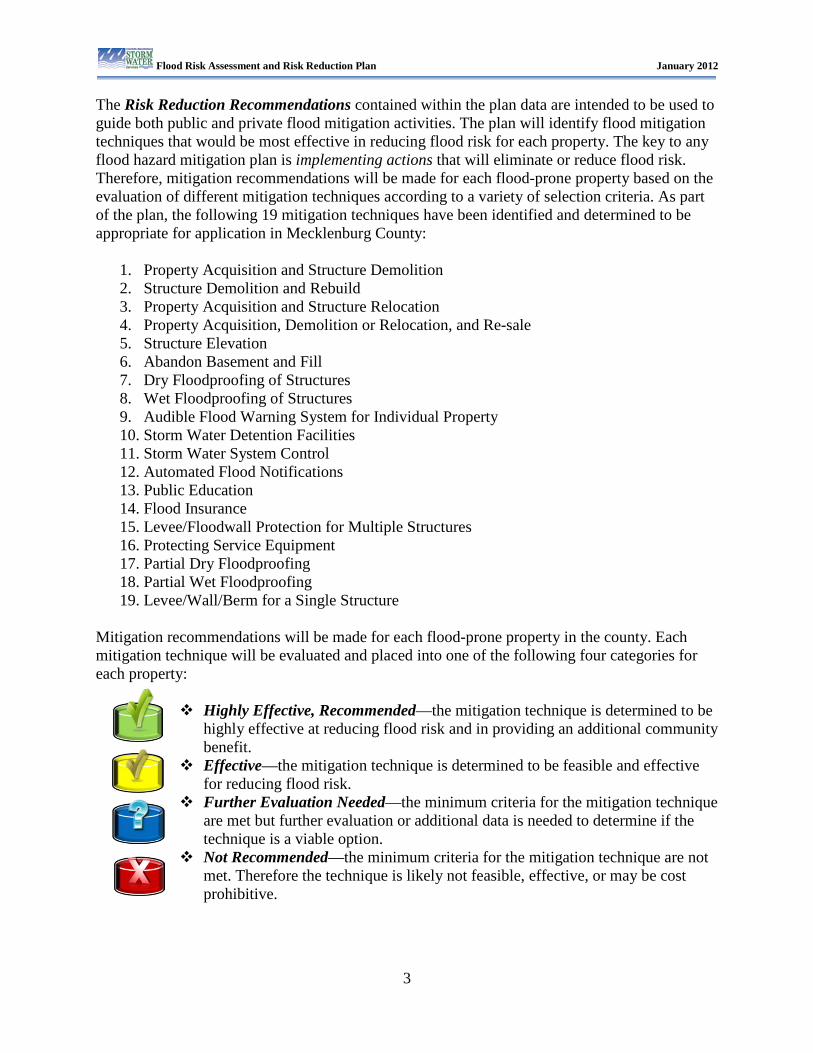
Mitigation recommendations will be made for each flood-prone property in the county. Each mitigation technique will be evaluated and placed into one of the following four categories for each property:
Highly Effective, Recommended—the mitigation technique is determined to be highly effective at reducing flood risk and in providing an additional community benefit.
Effective—the mitigation technique is determined to be feasible and effective for reducing flood risk.
Further Evaluation Needed—the minimum criteria for the mitigation technique are met but further evaluation or additional data is needed to determine if the technique is a viable option.
Not Recommended—the minimum criteria for the mitigation technique are not met. Therefore the technique is likely not feasible, effective, or may be cost prohibitive.
Flood Risk Assessment and Risk Reduction Plan January 2012
4
Flood Mitigation Priority Scores will be used to prioritize flood mitigation efforts across the county. The purpose of developing Flood Mitigation Priority Scores is to account for: (1) other community-based benefits and, (2) other factors not included in the Flood Risk Property Score. The factors incorporated into the Flood Mitigation Priority Scores are: Life and human safety Cost effectiveness Proximity to other mitigation projects Property added to flood zone Repetitive Loss (RL) structure Property adjacent to publicly owned land Property located on five-year planned greenway trail Property located on five-year planned sanitary sewer route Property intersects with water quality buffer Property located in an Environmental Focus Area Property covered by NFIP policy Historic preservation and cultural asset protection Other
CMSWS wants to prioritize future projects that could include individual properties as well as multiple properties grouped into one mitigation project. The same priority factors are used to generate both a Property Score and a Project Score. These scores will be used to prioritize properties and project areas for the County’s mitigation planning purposes. The planning process was a multi-year effort developed in two phases. Phase I focused on developing a framework for the approach and Phase II focused on refining, finalizing, and applying the approach. Prior to finalizing this plan, two floodplain areas were identified as part of a pilot study and used to test, demonstrate, and refine the scoring methodologies developed for the three steps. The pilot study included a mix of residential and commercial structures, and a variety of individual building types within each category. The results of the pilot study were used to identify potential issues, such as data accuracy with regard to the flood models and building inventories, and to test and refine the processes and methodologies used for the elements of the plan. Phase II also relied heavily on input from a 12-member Citizen Review Committee (CRC) which met approximately every month throughout a nine-month period. The committee consisted of residents living in the floodplain who have been impacted by flooding. The CRC also fulfilled a vital role as a “sounding board” for the discussion of ideas and cross-checks to make sure that proposed thoughts, details, and approaches made good sense. Significant changes were made as a result of the pilot study and CRC input. Plan maintenance is critical to the longevity and useful life of the Flood RA/RR Plan. The plan results will be maintained and updated in a digital environment. The fundamental concepts contained within this plan document will continue to serve as the foundation of the plan, while the property specific plan results will change over time. These results, such as Flood Risk
Flood Risk Assessment and Risk Reduction Plan January 2012
5
Property Scores, Risk Reduction Recommendations, and Flood Mitigation Priority Scores will be periodically updated under two main circumstances:
1. Data changes or corrections to the supporting information occur that could result in changes to the property specific plan results.
2. Adjustments to computations are deemed necessary by staff to provide more accurate results.
At a minimum, once per year, all the datasets will be reviewed for changes and if necessary, the plan results will be updated. If CMSWS obtains more accurate property data for individual properties, the plan results can be updated immediately. In addition, changes to the computations, multipliers, weighting, etc. may be necessary to provide more accurate results. If adjustments are made, they will be documented and the subsequent Flood Risk Property Scores, Risk Reduction Recommendations, and Flood Mitigation Priority Scores will be updated. The data contained within this plan will be populated as new floodplain maps become available. The initial results for approximately 40 percent of the County will be available around May 2012. By early 2013, results for an additional 40 percent of the County should be available. The remaining 20 percent of the County is at the least flood risk and should be completed within 2-3 years. The Flood RA/RR Plan coupled with a balanced and adequately funded Flood Mitigation Capital Improvement Program (CIP) will continue to successfully reduce flood risk in Mecklenburg County. CMSWS will use the plan to: Guide the CIP Identify properties at greatest flood risk Identify mitigation strategies Prioritize projects Highlight potential eligibility for FEMA grants
In addition, the plan results will help increase the public’s awareness of flood risk make more informed decisions that could reduce their individual flood risk. This plan will support CMSWS continued efforts to engage in risk-based mitigation planning that results in sustainable actions aimed at reducing or eliminating risk to life and property from flooding. As this plan is put into action, there will be a measurable reduction in our vulnerability to flooding and Mecklenburg County will continue to become a more sustainable and flood resilient community.
Flood Risk Assessment and Risk Reduction Plan January 2012
6
Section 1 Introduction
1.1 Background Charlotte-Mecklenburg Storm Water Services (CMSWS) manages and maintains the regulated floodplains within the City of Charlotte, the towns of Cornelius, Davidson, Huntersville, Matthews, Mint Hill, and Pineville, and the unincorporated areas of Mecklenburg County. CMSWS aims to serve the citizens of Mecklenburg County by reducing the potential for loss of life and property due to flooding, while enhancing the natural and beneficial functions of the floodplain along streams regulated by the Federal Emergency Management Agency (FEMA). There are over 4,000 structures in approximately 350 miles of regulated streams within the County. The CMSWS Flood Mitigation Program reduces flood risk to people and property through a variety of programmatic strategies, including: enforcing floodplain regulations, maintaining floodplain maps, providing advanced flood notification to emergency responders, assessing flood risk, developing mitigation plans, and implementing flood hazard mitigation projects. The Flood Mitigation Program also disseminates information on flood risk and potential mitigation options to floodplain property owners and the general public as new data becomes available. Charlotte-Mecklenburg began evaluating potential flood hazard mitigation sites in the early 2000’s. At that time there were many properties subject to frequent flooding and property owners were seeking solutions. Mecklenburg County’s last flood hazard mitigation plan was completed in 2003, making it nine years old as of 2012. In May 2004, Charlotte-Mecklenburg completed engineering studies that evaluated flood hazard mitigation strategies in 10 of the County’s most urbanized watersheds. This study primarily used two sets of criteria to evaluate the different improvement alternatives—location in relation to the Community Encroachment Area Boundary (0.1’ Floodway) and cost effectiveness (Benefit-Cost Ratio). As a secondary consideration, the study also evaluated flood mitigation techniques for flood reduction capability, constructability, social/environmental impacts, and hydraulic impacts in a broad sense. The Flood Hazard Mitigation Plan in place at the time considered six flood hazard mitigation strategies: acquisition/demolition (buyouts), structure elevation, floodproofing, infrastructure improvements, flood barriers such as a levee or floodwall, and no action. Property acquisition and structure demolition was the most frequent flood mitigation technique recommended in that plan. The successful implementation of the buyout strategy in the previous Flood Hazard Mitigation Plan, coupled with FEMA’s narrow view of the financial “benefits” of mitigation, has created an opportunity to reprioritize remaining flood-prone buildings and re-evaluate strategies to reduce the flood risk. The updated strategy established in this plan is not predominantly focused on properties that meet FEMA’s cost-benefit criteria. The Flood Risk Assessment and Risk Reduction Plan (Flood RA/RR Plan) includes a new approach to evaluating flood risk for each flood-prone property and prioritizing future mitigation projects and project areas. To summarize, it includes a more comprehensive, holistic, and multi-disciplinary risk-based approach to risk assessment and risk reduction.
Flood Risk Assessment and Risk Reduction Plan January 2012
7
In addition, the County’s updated all-hazard mitigation plan, adopted by the Mecklenburg County Board of Commissioners on June 15, 2011, identified this Flood RA/RR Plan as a mitigation action:
“Mecklenburg County Mitigation Action 3 – Complete and begin implementation of detailed Flood Hazard Mitigation Plan which will identify specific mitigation options based on risk factor scoring utilizing public and private funding.”
The all-hazard mitigation plan meets the requirements of the Disaster Mitigation Act of 2000, FEMA, and the State of North Carolina, but does not reflect the detailed, comprehensive evaluation of the flood hazard included in this Flood RA/RR Plan. 1.2 Purpose The purpose of the Flood RA/RR Plan is to recommend a more comprehensive range of specific flood mitigation techniques at the building/parcel level and to assist private property owners and local government officials in making informed decisions about flood mitigation strategies. In short, the purpose of the Flood RA/RR Plan is to assist in identifying, prioritizing, and planning future flood mitigation projects. It is the vision of CMSWS that this plan will be a “digital plan” and as such will be updated when new data becomes available. Examples of data that can change over time include property specific data such as Elevation Certificates, parcel information, and building footprints, as well as hazard-specific data such as flood hazard maps and velocity areas, and also environmental data, such as water quality buffers, environmental focus areas, etc. 1.3 Goals and Objectives The Flood RA/RR Plan is designed to be a dynamic, continuously updated planning tool that will aid in identifying, prioritizing, and planning future flood mitigation projects. The goals of the plan are shown in Figure 1.
Flood Risk Assessment and Risk Reduction Plan January 2012
8
Figure 1: Goals and Objectives Graphic 1.4 Concept The plan includes three main elements which link Flood Risk Property Scores at the individual property (parcel) level with Risk Reduction Recommendations that are then supported by Flood Mitigation Priority Scores. Each element builds upon the previous element to produce the results that will be stored in the plan data as described below:
• Flood Risk Property Score—consists of analyzing factors related to flood impacts, storm frequency, and structure location on an individual property basis. (See Section 2.)
• Risk Reduction Recommendations—consists of evaluating 19 different flood mitigation techniques deemed most appropriate for Mecklenburg County and making a planning-level recommendation of either 1) Highly Effective, Recommended, 2) Effective, 3) Further Evaluation Needed, or 4) Not Recommended. (See Section 3.)
• Flood Mitigation Priority Scores—consists of assessing and accounting for community benefits and other factors based on Risk Reduction Recommendations that are not accounted for in the Flood Risk Property Score. The Flood Mitigation Priority Score is used to prioritize individual properties as well as project areas (i.e., groups, or “clusters” of properties) for mitigation activities. (See Section 4.)
Flood Risk Assessment and Risk Reduction Plan January 2012
9
Figure 2: Concept Process Graphic
Flood Risk Assessment and Risk Reduction Plan January 2012
10
Section 2 Flood Risk Assessment
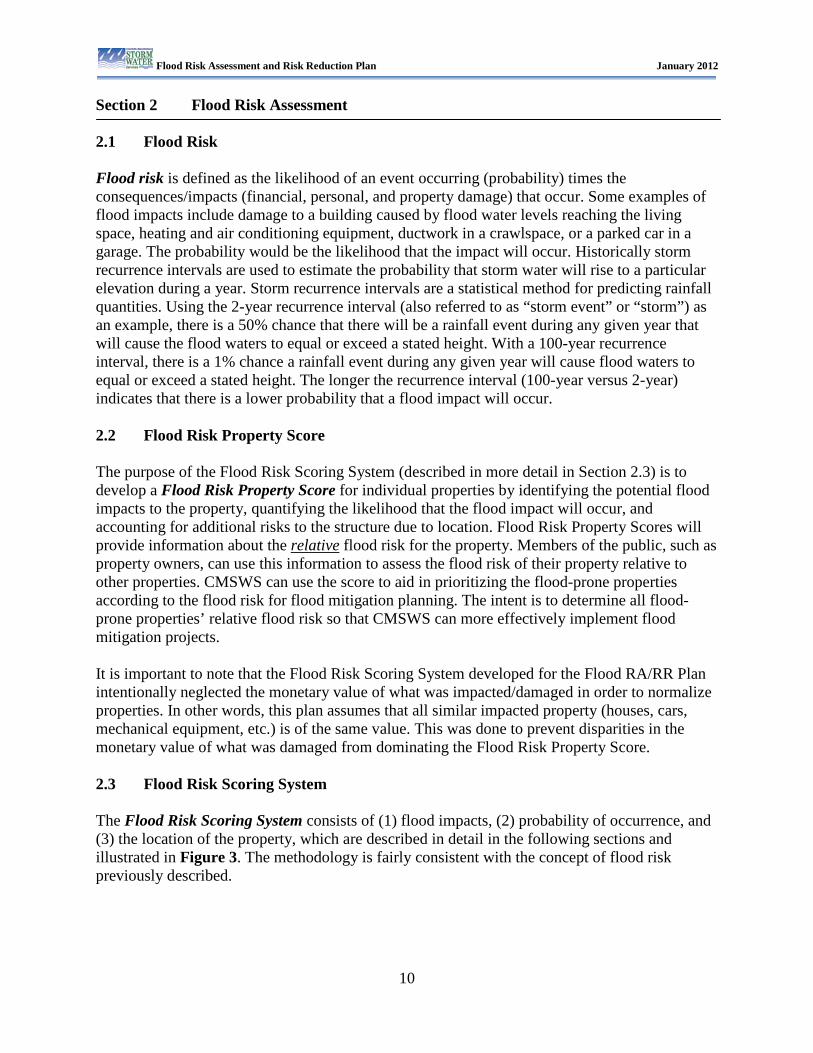
2.1 Flood Risk Flood risk is defined as the likelihood of an event occurring (probability) times the consequences/impacts (financial, personal, and property damage) that occur. Some examples of flood impacts include damage to a building caused by flood water levels reaching the living space, heating and air conditioning equipment, ductwork in a crawlspace, or a parked car in a garage. The probability would be the likelihood that the impact will occur. Historically storm recurrence intervals are used to estimate the probability that storm water will rise to a particular elevation during a year. Storm recurrence intervals are a statistical method for predicting rainfall quantities. Using the 2-year recurrence interval (also referred to as “storm event” or “storm”) as an example, there is a 50% chance that there will be a rainfall event during any given year that will cause the flood waters to equal or exceed a stated height. With a 100-year recurrence interval, there is a 1% chance a rainfall event during any given year will cause flood waters to equal or exceed a stated height. The longer the recurrence interval (100-year versus 2-year) indicates that there is a lower probability that a flood impact will occur. 2.2 Flood Risk Property Score The purpose of the Flood Risk Scoring System (described in more detail in Section 2.3) is to develop a Flood Risk Property Score for individual properties by identifying the potential flood impacts to the property, quantifying the likelihood that the flood impact will occur, and accounting for additional risks to the structure due to location. Flood Risk Property Scores will provide information about the relative flood risk for the property. Members of the public, such as property owners, can use this information to assess the flood risk of their property relative to other properties. CMSWS can use the score to aid in prioritizing the flood-prone properties according to the flood risk for flood mitigation planning. The intent is to determine all flood-prone properties’ relative flood risk so that CMSWS can more effectively implement flood mitigation projects. It is important to note that the Flood Risk Scoring System developed for the Flood RA/RR Plan intentionally neglected the monetary value of what was impacted/damaged in order to normalize properties. In other words, this plan assumes that all similar impacted property (houses, cars, mechanical equipment, etc.) is of the same value. This was done to prevent disparities in the monetary value of what was damaged from dominating the Flood Risk Property Score. 2.3 Flood Risk Scoring System The Flood Risk Scoring System consists of (1) flood impacts, (2) probability of occurrence, and (3) the location of the property, which are described in detail in the following sections and illustrated in Figure 3. The methodology is fairly consistent with the concept of flood risk previously described.
Flood Risk Assessment and Risk Reduction Plan January 2012
11
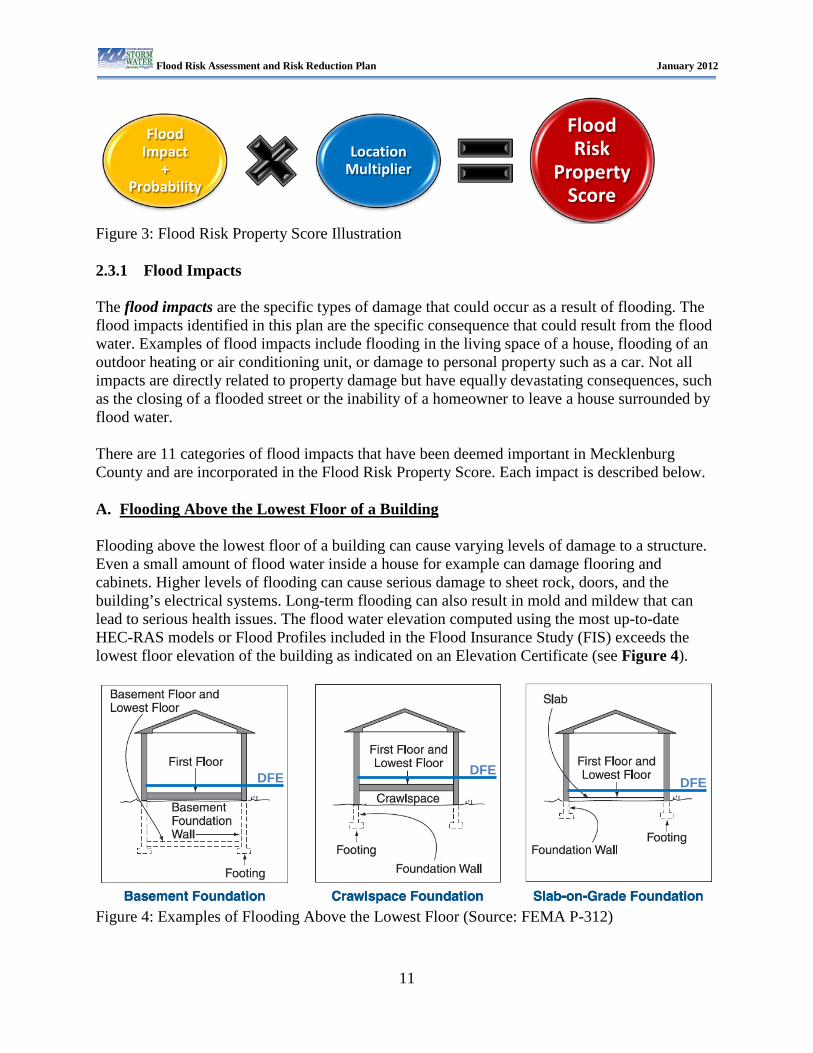
Figure 3: Flood Risk Property Score Illustration 2.3.1 Flood Impacts The flood impacts are the specific types of damage that could occur as a result of flooding. The flood impacts identified in this plan are the specific consequence that could result from the flood water. Examples of flood impacts include flooding in the living space of a house, flooding of an outdoor heating or air conditioning unit, or damage to personal property such as a car. Not all impacts are directly related to property damage but have equally devastating consequences, such as the closing of a flooded street or the inability of a homeowner to leave a house surrounded by flood water. There are 11 categories of flood impacts that have been deemed important in Mecklenburg County and are incorporated in the Flood Risk Property Score. Each impact is described below. A. Flooding Above the Lowest Floor of a Building Flooding above the lowest floor of a building can cause varying levels of damage to a structure. Even a small amount of flood water inside a house for example can damage flooring and cabinets. Higher levels of flooding can cause serious damage to sheet rock, doors, and the building’s electrical systems. Long-term flooding can also result in mold and mildew that can lead to serious health issues. The flood water elevation computed using the most up-to-date HEC-RAS models or Flood Profiles included in the Flood Insurance Study (FIS) exceeds the lowest floor elevation of the building as indicated on an Elevation Certificate (see Figure 4).
Figure 4: Examples of Flooding Above the Lowest Floor (Source: FEMA P-312)
Flood Impact
+Probability
Location Multiplier
Flood Risk
Property Score
DFE DFE DFE
Flood Risk Assessment and Risk Reduction Plan January 2012
12
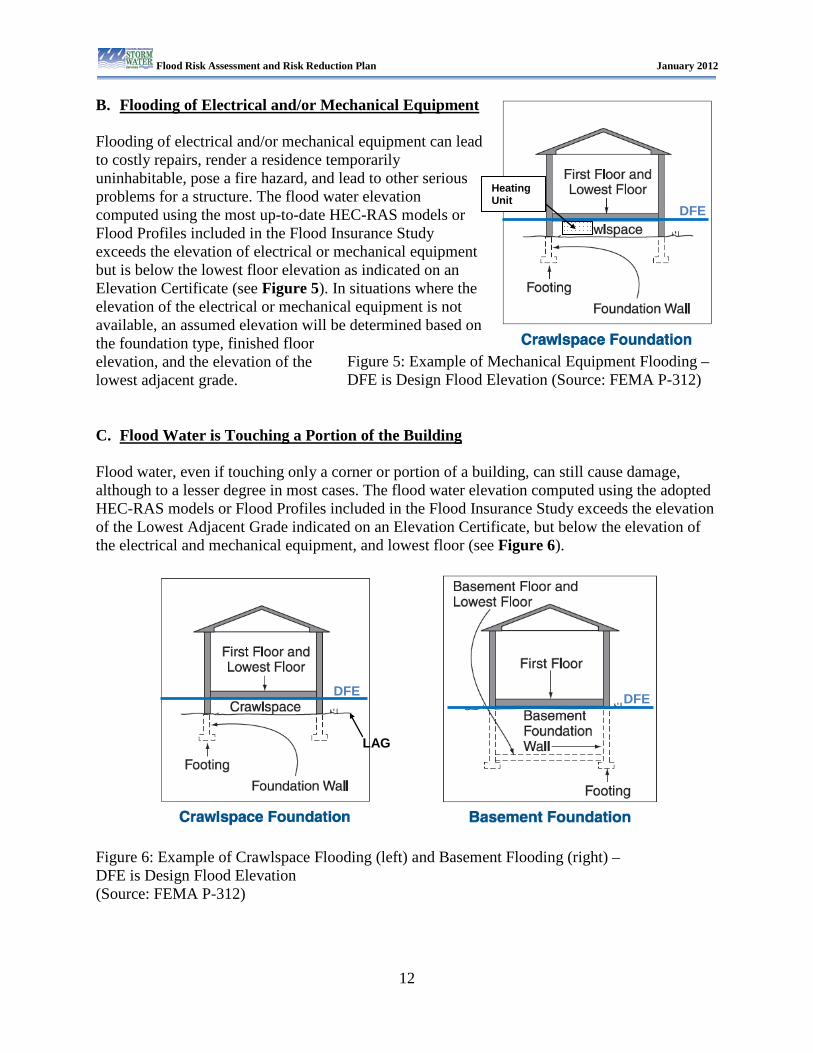
B. Flooding of Electrical and/or Mechanical Equipment Flooding of electrical and/or mechanical equipment can lead to costly repairs, render a residence temporarily uninhabitable, pose a fire hazard, and lead to other serious problems for a structure. The flood water elevation computed using the most up-to-date HEC-RAS models or Flood Profiles included in the Flood Insurance Study exceeds the elevation of electrical or mechanical equipment but is below the lowest floor elevation as indicated on an Elevation Certificate (see Figure 5). In situations where the elevation of the electrical or mechanical equipment is not available, an assumed elevation will be determined based on the foundation type, finished floor elevation, and the elevation of the lowest adjacent grade.
C. Flood Water is Touching a Portion of the Building Flood water, even if touching only a corner or portion of a building, can still cause damage, although to a lesser degree in most cases. The flood water elevation computed using the adopted HEC-RAS models or Flood Profiles included in the Flood Insurance Study exceeds the elevation of the Lowest Adjacent Grade indicated on an Elevation Certificate, but below the elevation of the electrical and mechanical equipment, and lowest floor (see Figure 6).
Figure 6: Example of Crawlspace Flooding (left) and Basement Flooding (right) – DFE is Design Flood Elevation (Source: FEMA P-312)
DFE
DFE
Heating Unit
LAG
Figure 5: Example of Mechanical Equipment Flooding – DFE is Design Flood Elevation (Source: FEMA P-312)
DFE
Flood Risk Assessment and Risk Reduction Plan January 2012
13
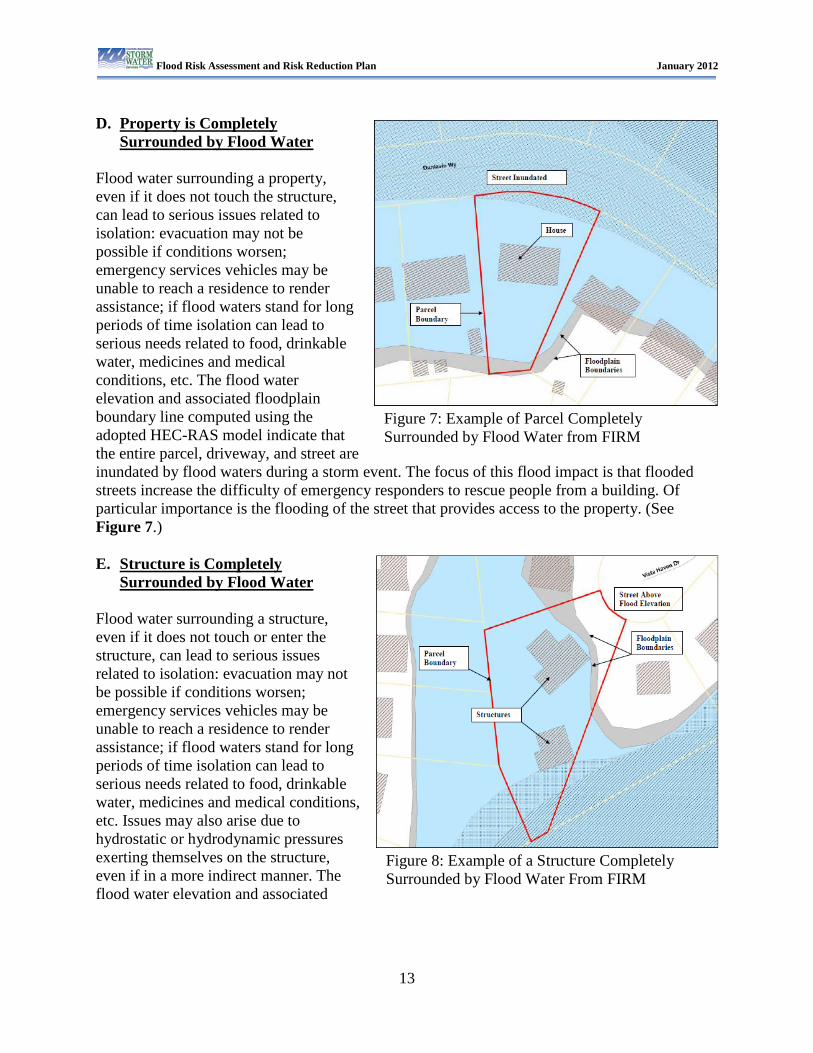
D. Property is Completely
Surrounded by Flood Water Flood water surrounding a property, even if it does not touch the structure, can lead to serious issues related to isolation: evacuation may not be possible if conditions worsen; emergency services vehicles may be unable to reach a residence to render assistance; if flood waters stand for long periods of time isolation can lead to serious needs related to food, drinkable water, medicines and medical conditions, etc. The flood water elevation and associated floodplain boundary line computed using the adopted HEC-RAS model indicate that the entire parcel, driveway, and street are inundated by flood waters during a storm event. The focus of this flood impact is that flooded streets increase the difficulty of emergency responders to rescue people from a building. Of particular importance is the flooding of the street that provides access to the property. (See Figure 7.) E. Structure is Completely
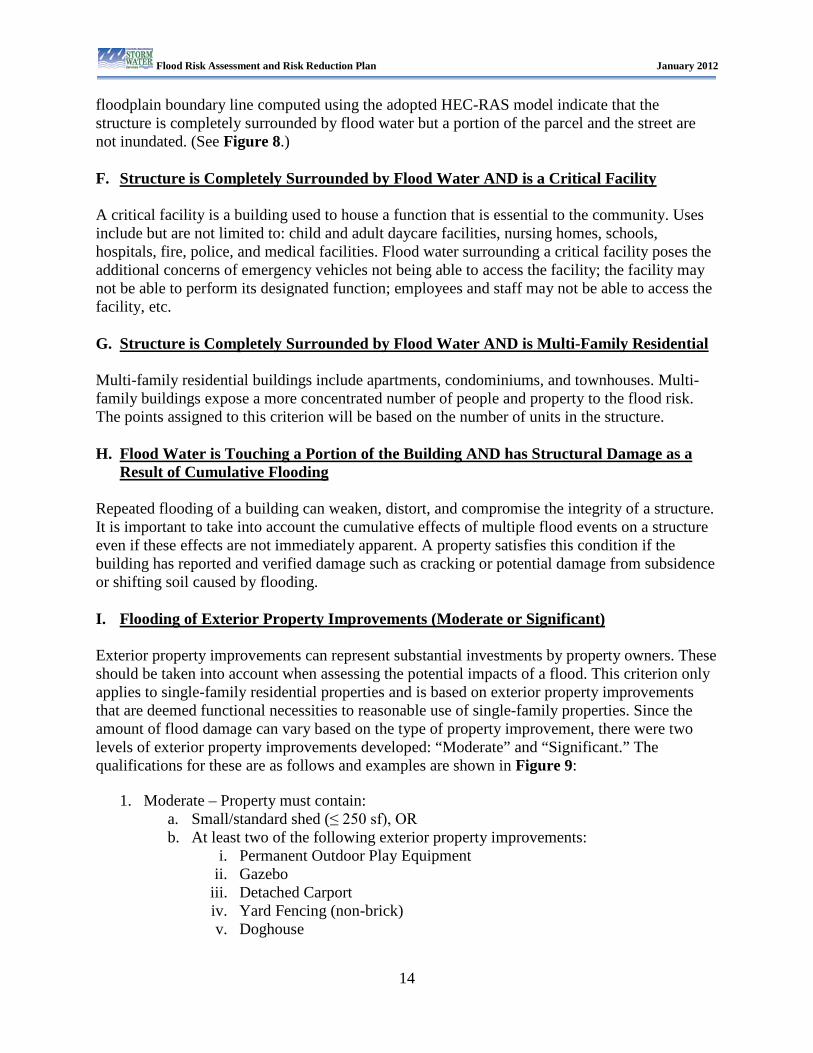
Surrounded by Flood Water Flood water surrounding a structure, even if it does not touch or enter the structure, can lead to serious issues related to isolation: evacuation may not be possible if conditions worsen; emergency services vehicles may be unable to reach a residence to render assistance; if flood waters stand for long periods of time isolation can lead to serious needs related to food, drinkable water, medicines and medical conditions, etc. Issues may also arise due to hydrostatic or hydrodynamic pressures exerting themselves on the structure, even if in a more indirect manner. The flood water elevation and associated
Figure 7: Example of Parcel Completely Surrounded by Flood Water from FIRM
Figure 8: Example of a Structure Completely Surrounded by Flood Water From FIRM
Flood Risk Assessment and Risk Reduction Plan January 2012
14
floodplain boundary line computed using the adopted HEC-RAS model indicate that the structure is completely surrounded by flood water but a portion of the parcel and the street are not inundated. (See Figure 8.) F. Structure is Completely Surrounded by Flood Water AND is a Critical Facility A critical facility is a building used to house a function that is essential to the community. Uses include but are not limited to: child and adult daycare facilities, nursing homes, schools, hospitals, fire, police, and medical facilities. Flood water surrounding a critical facility poses the additional concerns of emergency vehicles not being able to access the facility; the facility may not be able to perform its designated function; employees and staff may not be able to access the facility, etc. G. Structure is Completely Surrounded by Flood Water AND is Multi-Family Residential Multi-family residential buildings include apartments, condominiums, and townhouses. Multi-family buildings expose a more concentrated number of people and property to the flood risk. The points assigned to this criterion will be based on the number of units in the structure. H. Flood Water is Touching a Portion of the Building AND has Structural Damage as a
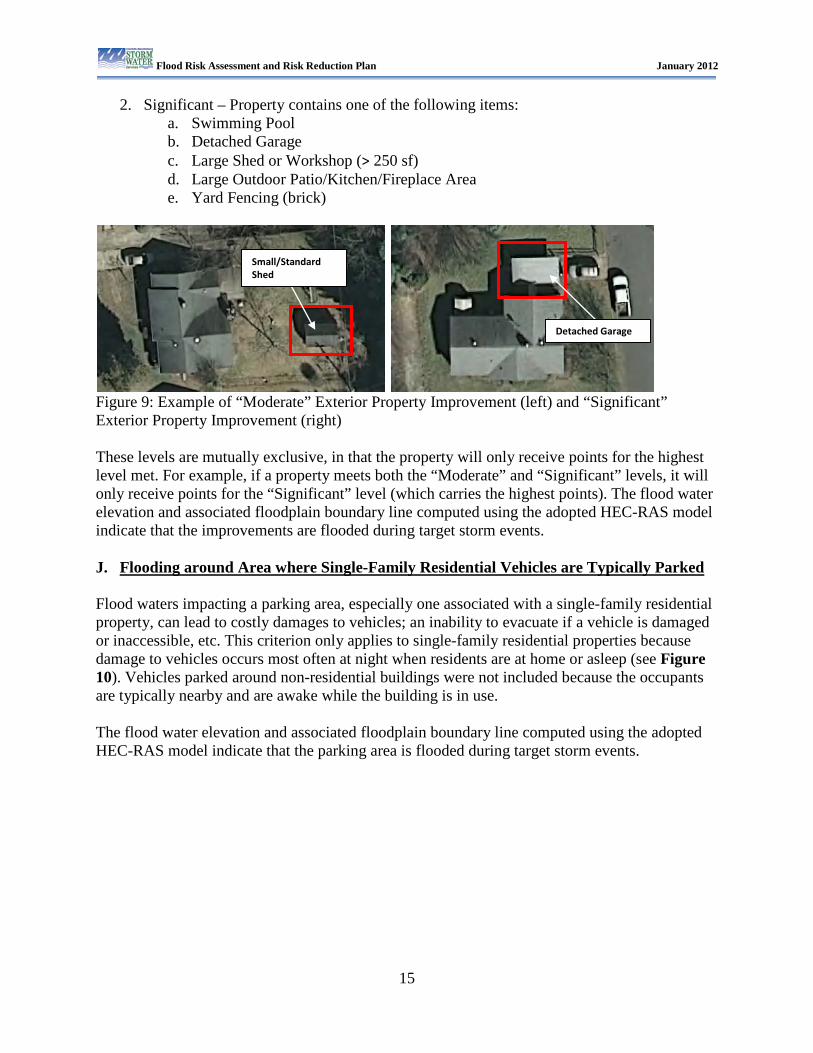
Result of Cumulative Flooding Repeated flooding of a building can weaken, distort, and compromise the integrity of a structure. It is important to take into account the cumulative effects of multiple flood events on a structure even if these effects are not immediately apparent. A property satisfies this condition if the building has reported and verified damage such as cracking or potential damage from subsidence or shifting soil caused by flooding. I. Flooding of Exterior Property Improvements (Moderate or Significant) Exterior property improvements can represent substantial investments by property owners. These should be taken into account when assessing the potential impacts of a flood. This criterion only applies to single-family residential properties and is based on exterior property improvements that are deemed functional necessities to reasonable use of single-family properties. Since the amount of flood damage can vary based on the type of property improvement, there were two levels of exterior property improvements developed: “Moderate” and “Significant.” The qualifications for these are as follows and examples are shown in Figure 9:
1. Moderate – Property must contain: a. Small/standard shed (≤ 250 sf), OR b. At least two of the following exterior property improvements:
i. Permanent Outdoor Play Equipment ii. Gazebo
iii. Detached Carport iv. Yard Fencing (non-brick) v. Doghouse
Flood Risk Assessment and Risk Reduction Plan January 2012
15
2. Significant – Property contains one of the following items: a. Swimming Pool b. Detached Garage c. Large Shed or Workshop (> 250 sf) d. Large Outdoor Patio/Kitchen/Fireplace Area e. Yard Fencing (brick)
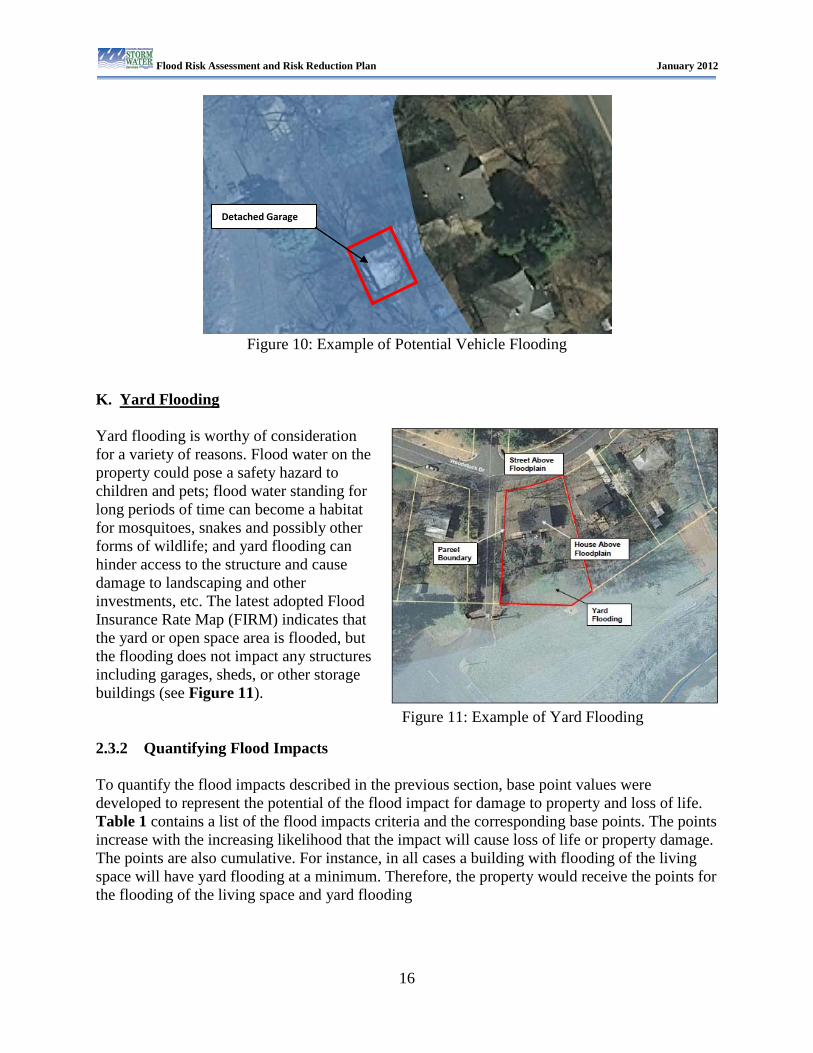
Figure 9: Example of “Moderate” Exterior Property Improvement (left) and “Significant” Exterior Property Improvement (right) These levels are mutually exclusive, in that the property will only receive points for the highest level met. For example, if a property meets both the “Moderate” and “Significant” levels, it will only receive points for the “Significant” level (which carries the highest points). The flood water elevation and associated floodplain boundary line computed using the adopted HEC-RAS model indicate that the improvements are flooded during target storm events. J. Flooding around Area where Single-Family Residential Vehicles are Typically Parked Flood waters impacting a parking area, especially one associated with a single-family residential property, can lead to costly damages to vehicles; an inability to evacuate if a vehicle is damaged or inaccessible, etc. This criterion only applies to single-family residential properties because damage to vehicles occurs most often at night when residents are at home or asleep (see Figure 10). Vehicles parked around non-residential buildings were not included because the occupants are typically nearby and are awake while the building is in use. The flood water elevation and associated floodplain boundary line computed using the adopted HEC-RAS model indicate that the parking area is flooded during target storm events.
Small/Standard Shed
Detached Garage
Flood Risk Assessment and Risk Reduction Plan January 2012
16
Figure 10: Example of Potential Vehicle Flooding
K. Yard Flooding Yard flooding is worthy of consideration for a variety of reasons. Flood water on the property could pose a safety hazard to children and pets; flood water standing for long periods of time can become a habitat for mosquitoes, snakes and possibly other forms of wildlife; and yard flooding can hinder access to the structure and cause damage to landscaping and other investments, etc. The latest adopted Flood Insurance Rate Map (FIRM) indicates that the yard or open space area is flooded, but the flooding does not impact any structures including garages, sheds, or other storage buildings (see Figure 11). 2.3.2 Quantifying Flood Impacts To quantify the flood impacts described in the previous section, base point values were developed to represent the potential of the flood impact for damage to property and loss of life. Table 1 contains a list of the flood impacts criteria and the corresponding base points. The points increase with the increasing likelihood that the impact will cause loss of life or property damage. The points are also cumulative. For instance, in all cases a building with flooding of the living space will have yard flooding at a minimum. Therefore, the property would receive the points for the flooding of the living space and yard flooding
Figure 11: Example of Yard Flooding
Detached Garage
Flood Risk Assessment and Risk Reduction Plan January 2012
17
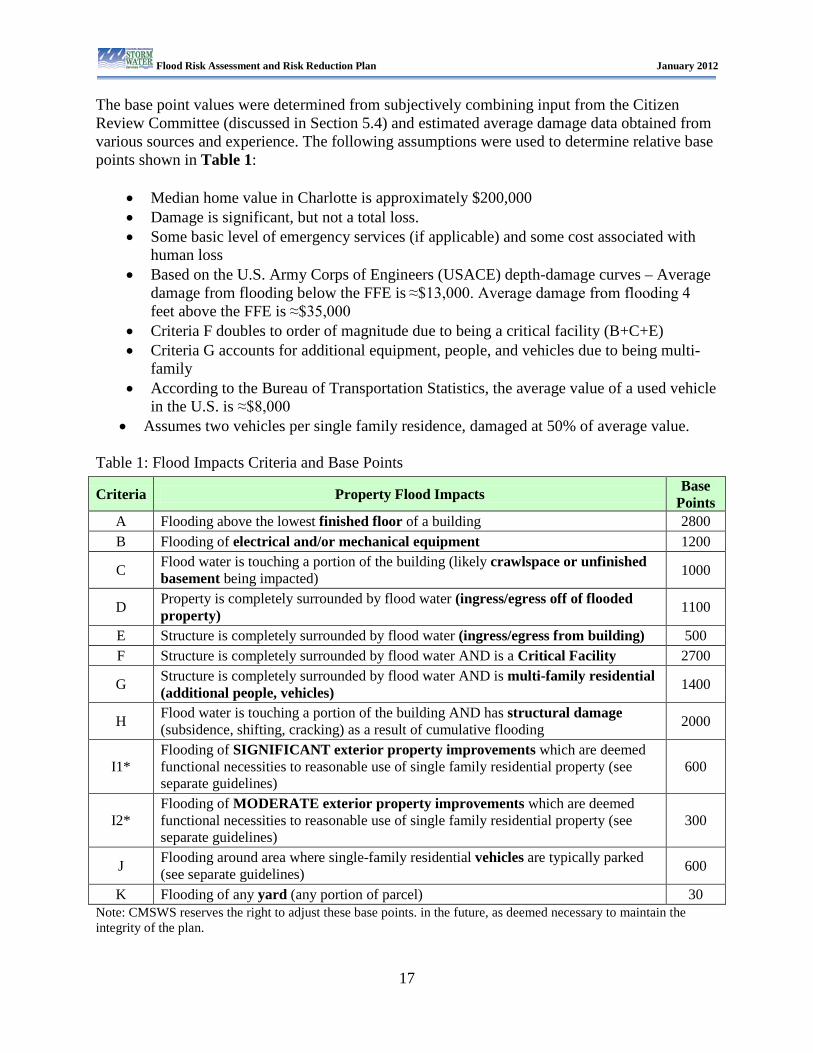
The base point values were determined from subjectively combining input from the Citizen Review Committee (discussed in Section 5.4) and estimated average damage data obtained from various sources and experience. The following assumptions were used to determine relative base points shown in Table 1:
• Median home value in Charlotte is approximately $200,000 • Damage is significant, but not a total loss. • Some basic level of emergency services (if applicable) and some cost associated with
human loss • Based on the U.S. Army Corps of Engineers (USACE) depth-damage curves – Average
damage from flooding below the FFE is ≈$13,000. Average damage from flooding 4 feet above the FFE is ≈$35,000
• Criteria F doubles to order of magnitude due to being a critical facility (B+C+E) • Criteria G accounts for additional equipment, people, and vehicles due to being multi-
family • According to the Bureau of Transportation Statistics, the average value of a used vehicle
in the U.S. is ≈$8,000 • Assumes two vehicles per single family residence, damaged at 50% of average value.
Table 1: Flood Impacts Criteria and Base Points
Note: CMSWS reserves the right to adjust these base points. in the future, as deemed necessary to maintain the integrity of the plan.
Criteria Property Flood Impacts Base Points
A Flooding above the lowest finished floor of a building 2800 B Flooding of electrical and/or mechanical equipment 1200
C Flood water is touching a portion of the building (likely crawlspace or unfinished basement being impacted) 1000
D Property is completely surrounded by flood water (ingress/egress off of flooded property) 1100
E Structure is completely surrounded by flood water (ingress/egress from building) 500 F Structure is completely surrounded by flood water AND is a Critical Facility 2700
G Structure is completely surrounded by flood water AND is multi-family residential (additional people, vehicles) 1400
H Flood water is touching a portion of the building AND has structural damage (subsidence, shifting, cracking) as a result of cumulative flooding 2000
I1* Flooding of SIGNIFICANT exterior property improvements which are deemed functional necessities to reasonable use of single family residential property (see separate guidelines)
600
I2* Flooding of MODERATE exterior property improvements which are deemed functional necessities to reasonable use of single family residential property (see separate guidelines)
300
J Flooding around area where single-family residential vehicles are typically parked (see separate guidelines) 600
K Flooding of any yard (any portion of parcel) 30
Flood Risk Assessment and Risk Reduction Plan January 2012
18
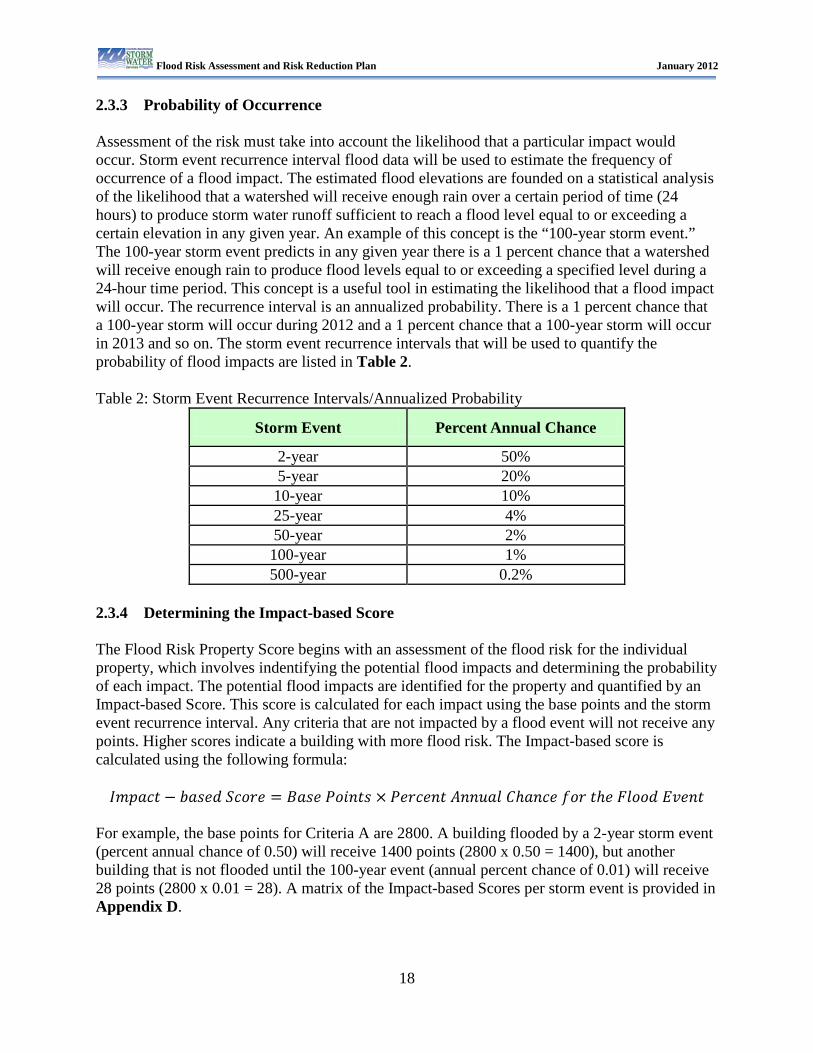
2.3.3 Probability of Occurrence Assessment of the risk must take into account the likelihood that a particular impact would occur. Storm event recurrence interval flood data will be used to estimate the frequency of occurrence of a flood impact. The estimated flood elevations are founded on a statistical analysis of the likelihood that a watershed will receive enough rain over a certain period of time (24 hours) to produce storm water runoff sufficient to reach a flood level equal to or exceeding a certain elevation in any given year. An example of this concept is the “100-year storm event.” The 100-year storm event predicts in any given year there is a 1 percent chance that a watershed will receive enough rain to produce flood levels equal to or exceeding a specified level during a 24-hour time period. This concept is a useful tool in estimating the likelihood that a flood impact will occur. The recurrence interval is an annualized probability. There is a 1 percent chance that a 100-year storm will occur during 2012 and a 1 percent chance that a 100-year storm will occur in 2013 and so on. The storm event recurrence intervals that will be used to quantify the probability of flood impacts are listed in Table 2. Table 2: Storm Event Recurrence Intervals/Annualized Probability
Storm Event Percent Annual Chance
2-year 50% 5-year 20% 10-year 10% 25-year 4% 50-year 2% 100-year 1% 500-year 0.2%
2.3.4 Determining the Impact-based Score The Flood Risk Property Score begins with an assessment of the flood risk for the individual property, which involves indentifying the potential flood impacts and determining the probability of each impact. The potential flood impacts are identified for the property and quantified by an Impact-based Score. This score is calculated for each impact using the base points and the storm event recurrence interval. Any criteria that are not impacted by a flood event will not receive any points. Higher scores indicate a building with more flood risk. The Impact-based score is calculated using the following formula:
For example, the base points for Criteria A are 2800. A building flooded by a 2-year storm event (percent annual chance of 0.50) will receive 1400 points (2800 x 0.50 = 1400), but another building that is not flooded until the 100-year event (annual percent chance of 0.01) will receive 28 points (2800 x 0.01 = 28). A matrix of the Impact-based Scores per storm event is provided in Appendix D.
Flood Risk Assessment and Risk Reduction Plan January 2012
19
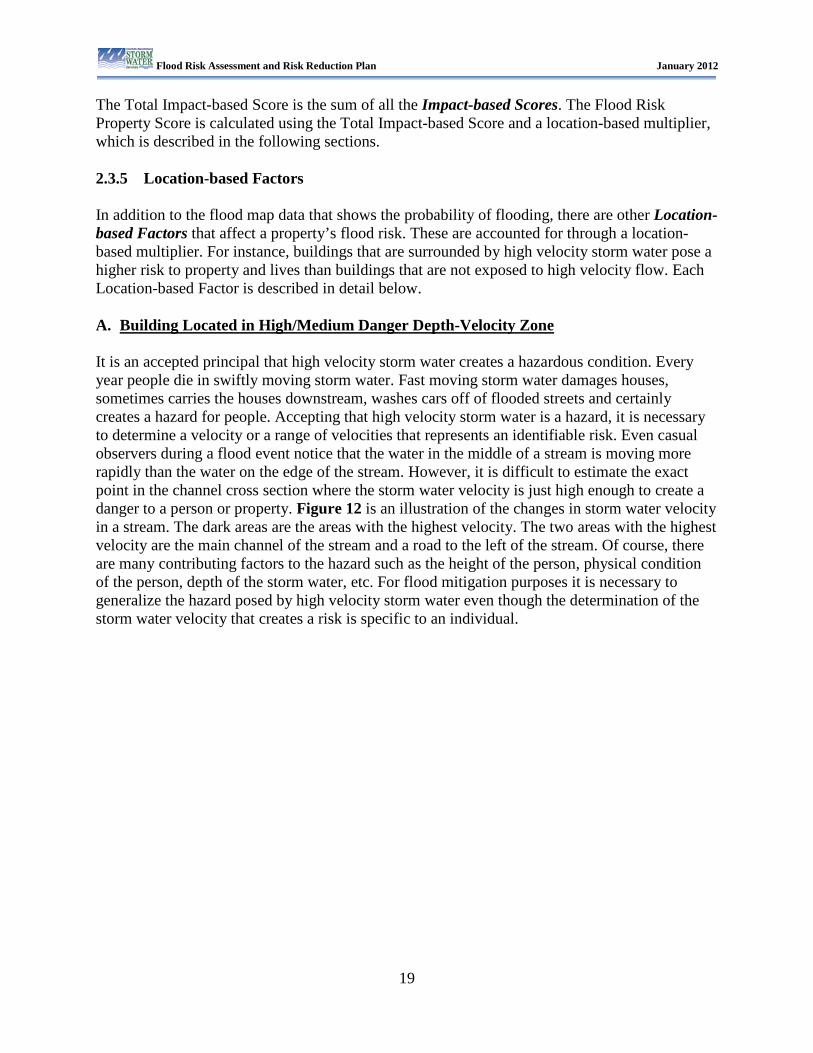
The Total Impact-based Score is the sum of all the Impact-based Scores. The Flood Risk Property Score is calculated using the Total Impact-based Score and a location-based multiplier, which is described in the following sections. 2.3.5 Location-based Factors In addition to the flood map data that shows the probability of flooding, there are other Location-based Factors that affect a property’s flood risk. These are accounted for through a location-based multiplier. For instance, buildings that are surrounded by high velocity storm water pose a higher risk to property and lives than buildings that are not exposed to high velocity flow. Each Location-based Factor is described in detail below. A. Building Located in High/Medium Danger Depth-Velocity Zone It is an accepted principal that high velocity storm water creates a hazardous condition. Every year people die in swiftly moving storm water. Fast moving storm water damages houses, sometimes carries the houses downstream, washes cars off of flooded streets and certainly creates a hazard for people. Accepting that high velocity storm water is a hazard, it is necessary to determine a velocity or a range of velocities that represents an identifiable risk. Even casual observers during a flood event notice that the water in the middle of a stream is moving more rapidly than the water on the edge of the stream. However, it is difficult to estimate the exact point in the channel cross section where the storm water velocity is just high enough to create a danger to a person or property. Figure 12 is an illustration of the changes in storm water velocity in a stream. The dark areas are the areas with the highest velocity. The two areas with the highest velocity are the main channel of the stream and a road to the left of the stream. Of course, there are many contributing factors to the hazard such as the height of the person, physical condition of the person, depth of the storm water, etc. For flood mitigation purposes it is necessary to generalize the hazard posed by high velocity storm water even though the determination of the storm water velocity that creates a risk is specific to an individual.
Flood Risk Assessment and Risk Reduction Plan January 2012
20
Figure 12: Illustration of Storm Water Velocities in a Stream Cross-Section The approach being used to delineate the high and medium danger depth-velocity zones are found in a report issued in April 2010 for the Australian Rainfall and Runoff (ARR) guidelines project (“Project 10: Appropriate Safety Criteria for People, Stage 1 Report”). Figure 13 was presented in the ARR report and shows the relationship between the depth/velocity product and hazards to pedestrians. Pedestrians are subdivided into three height/mass product categories that correspond to infants/small children, children, and adults.
100 150 200 250 300
608
610
612
614
616
618
620
622
Briar Creek Tributary 1 Plan: Floodplain 12/7/2009 RS = 4649
Station (ft)
Ele
vatio
n (ft
)
Legend
WS 100-yr EX
0 ft/s
2 ft/s
4 ft/s
6 ft/s
8 ft/s
Ground
Bank Sta
.07 .025 .07 .055 .065
Flood Risk Assessment and Risk Reduction Plan January 2012
21
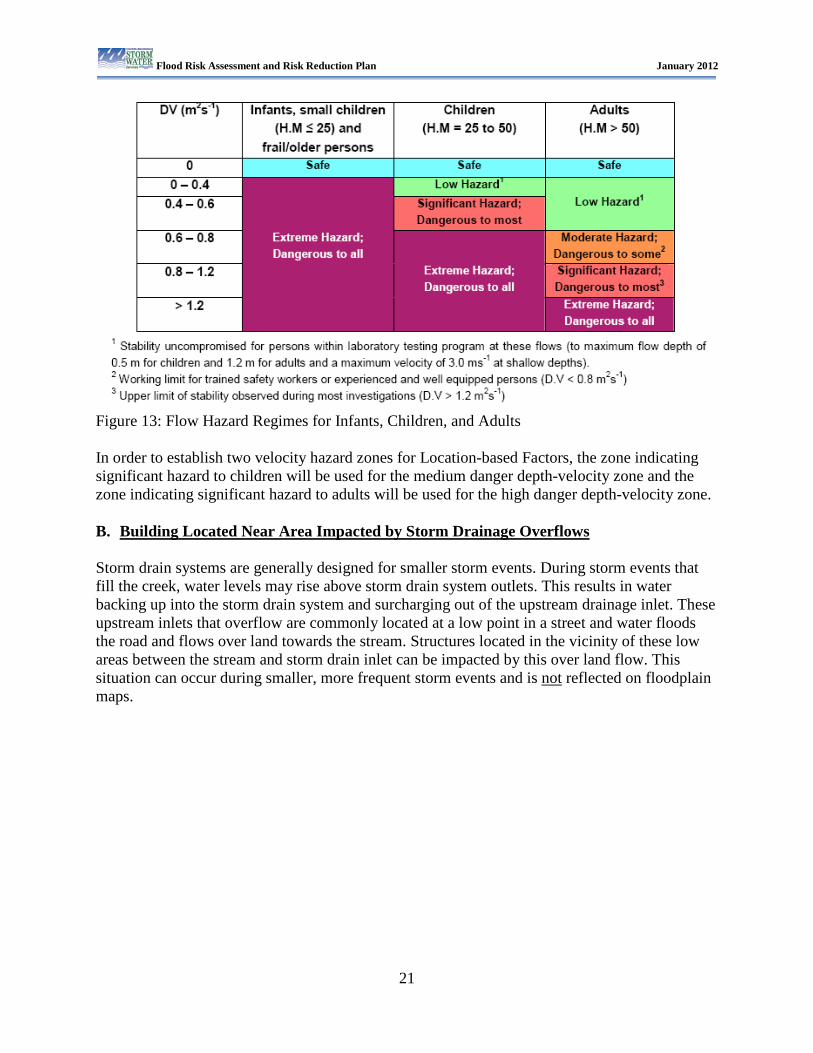
Figure 13: Flow Hazard Regimes for Infants, Children, and Adults In order to establish two velocity hazard zones for Location-based Factors, the zone indicating significant hazard to children will be used for the medium danger depth-velocity zone and the zone indicating significant hazard to adults will be used for the high danger depth-velocity zone. B. Building Located Near Area Impacted by Storm Drainage Overflows Storm drain systems are generally designed for smaller storm events. During storm events that fill the creek, water levels may rise above storm drain system outlets. This results in water backing up into the storm drain system and surcharging out of the upstream drainage inlet. These upstream inlets that overflow are commonly located at a low point in a street and water floods the road and flows over land towards the stream. Structures located in the vicinity of these low areas between the stream and storm drain inlet can be impacted by this over land flow. This situation can occur during smaller, more frequent storm events and is not reflected on floodplain maps.
Flood Risk Assessment and Risk Reduction Plan January 2012
22
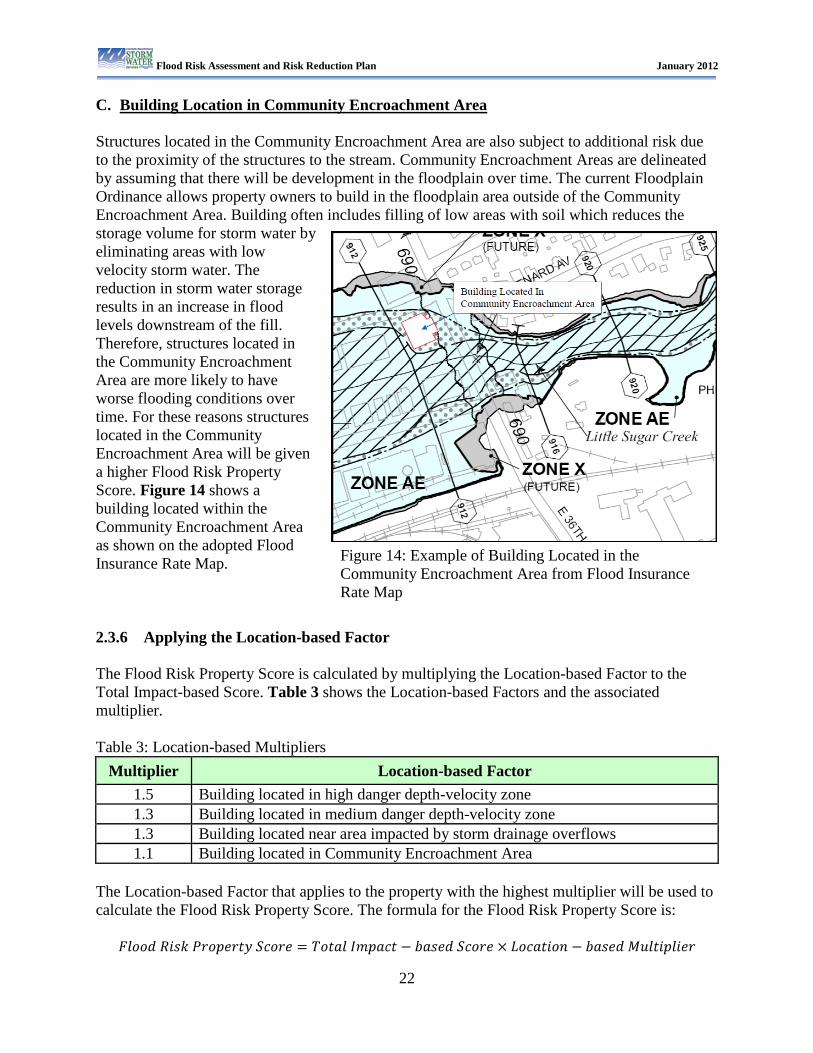
C. Building Location in Community Encroachment Area Structures located in the Community Encroachment Area are also subject to additional risk due to the proximity of the structures to the stream. Community Encroachment Areas are delineated by assuming that there will be development in the floodplain over time. The current Floodplain Ordinance allows property owners to build in the floodplain area outside of the Community Encroachment Area. Building often includes filling of low areas with soil which reduces the storage volume for storm water by eliminating areas with low velocity storm water. The reduction in storm water storage results in an increase in flood levels downstream of the fill. Therefore, structures located in the Community Encroachment Area are more likely to have worse flooding conditions over time. For these reasons structures located in the Community Encroachment Area will be given a higher Flood Risk Property Score. Figure 14 shows a building located within the Community Encroachment Area as shown on the adopted Flood Insurance Rate Map. 2.3.6 Applying the Location-based Factor The Flood Risk Property Score is calculated by multiplying the Location-based Factor to the Total Impact-based Score. Table 3 shows the Location-based Factors and the associated multiplier. Table 3: Location-based Multipliers
Multiplier Location-based Factor 1.5 Building located in high danger depth-velocity zone 1.3 Building located in medium danger depth-velocity zone 1.3 Building located near area impacted by storm drainage overflows 1.1 Building located in Community Encroachment Area
The Location-based Factor that applies to the property with the highest multiplier will be used to calculate the Flood Risk Property Score. The formula for the Flood Risk Property Score is:
Figure 14: Example of Building Located in the Community Encroachment Area from Flood Insurance Rate Map
Flood Risk Assessment and Risk Reduction Plan January 2012
23
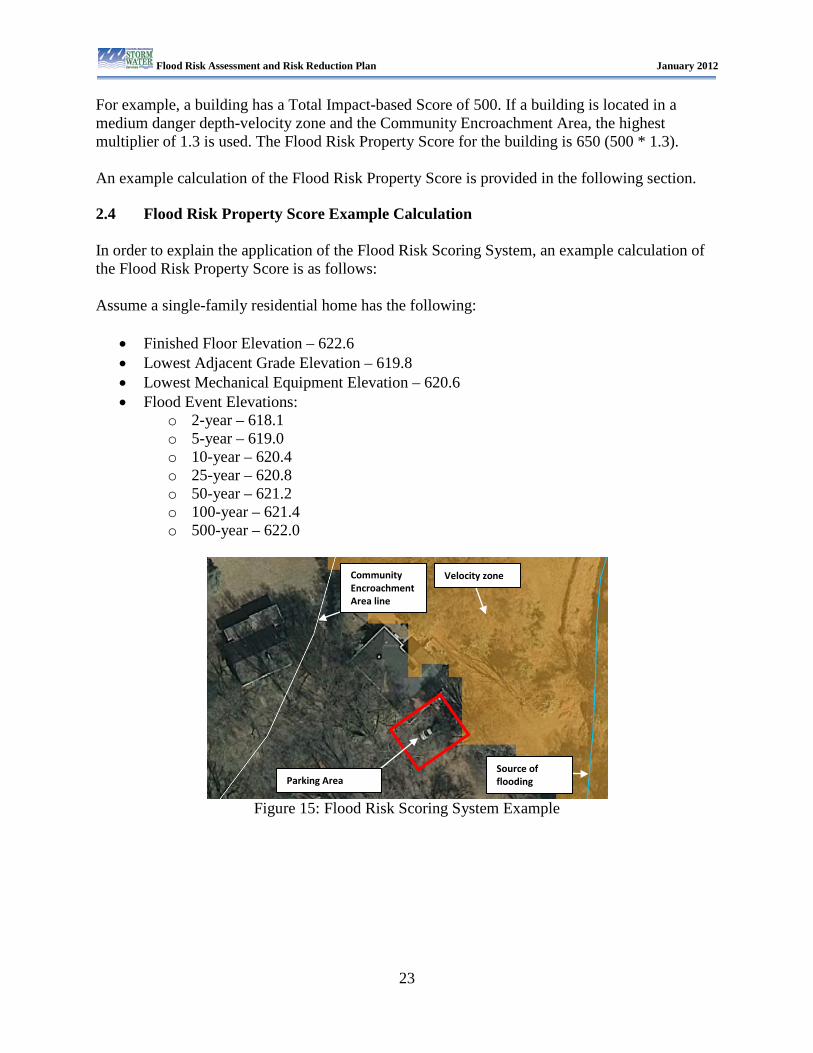
For example, a building has a Total Impact-based Score of 500. If a building is located in a medium danger depth-velocity zone and the Community Encroachment Area, the highest multiplier of 1.3 is used. The Flood Risk Property Score for the building is 650 (500 * 1.3). An example calculation of the Flood Risk Property Score is provided in the following section. 2.4 Flood Risk Property Score Example Calculation In order to explain the application of the Flood Risk Scoring System, an example calculation of the Flood Risk Property Score is as follows: Assume a single-family residential home has the following:
• Finished Floor Elevation – 622.6 • Lowest Adjacent Grade Elevation – 619.8 • Lowest Mechanical Equipment Elevation – 620.6 • Flood Event Elevations:
o 2-year – 618.1 o 5-year – 619.0 o 10-year – 620.4 o 25-year – 620.8 o 50-year – 621.2 o 100-year – 621.4 o 500-year – 622.0
Figure 15: Flood Risk Scoring System Example
Velocity zone Community Encroachment Area line
Parking Area Source of flooding
Flood Risk Assessment and Risk Reduction Plan January 2012
24
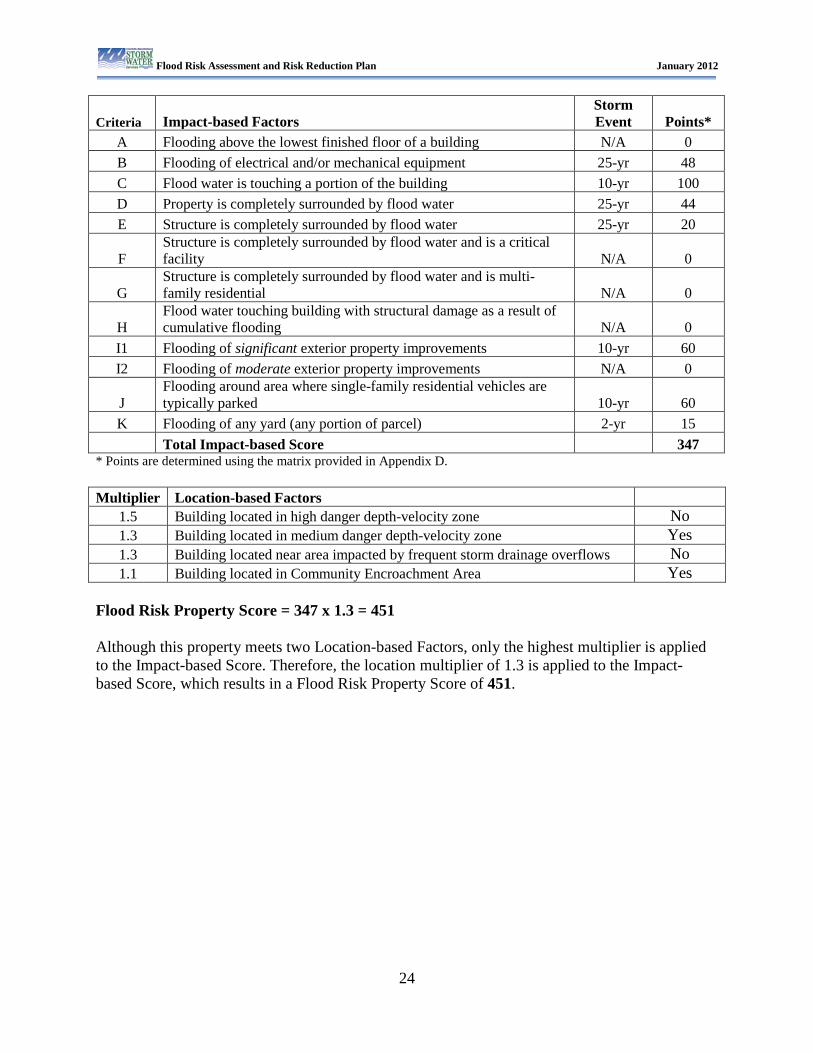
Criteria Impact-based Factors Storm Event Points*
A Flooding above the lowest finished floor of a building N/A 0 B Flooding of electrical and/or mechanical equipment 25-yr 48 C Flood water is touching a portion of the building 10-yr 100 D Property is completely surrounded by flood water 25-yr 44 E Structure is completely surrounded by flood water 25-yr 20
F Structure is completely surrounded by flood water and is a critical facility N/A 0
G Structure is completely surrounded by flood water and is multi-family residential N/A 0
H Flood water touching building with structural damage as a result of cumulative flooding N/A 0
I1 Flooding of significant exterior property improvements 10-yr 60 I2 Flooding of moderate exterior property improvements N/A 0
J Flooding around area where single-family residential vehicles are typically parked 10-yr 60
K Flooding of any yard (any portion of parcel) 2-yr 15 Total Impact-based Score 347
* Points are determined using the matrix provided in Appendix D. Multiplier Location-based Factors
1.5 Building located in high danger depth-velocity zone No 1.3 Building located in medium danger depth-velocity zone Yes 1.3 Building located near area impacted by frequent storm drainage overflows No 1.1 Building located in Community Encroachment Area Yes
Flood Risk Property Score = 347 x 1.3 = 451 Although this property meets two Location-based Factors, only the highest multiplier is applied to the Impact-based Score. Therefore, the location multiplier of 1.3 is applied to the Impact-based Score, which results in a Flood Risk Property Score of 451.
Flood Risk Assessment and Risk Reduction Plan January 2012
25
Section 3 Risk Reduction Recommendations
3.1 Purpose Reducing flood risk is one of CMSWS’ primary goals. This can be accomplished by reducing the probability of flooding (typically through “structural” man-made alterations) or by reducing the consequences/impacts that will result when a flood does occur. Generally speaking, it is rare to find one mitigation technique that is appropriate for all flood-prone structures within a community. Some techniques, such as acquisition/demolition (buyout), can eliminate large numbers of worst-case properties. However, as local programs evolve, it becomes necessary to evaluate a broader range of techniques in order to arrive at Risk Reduction Recommendations that target the full range of flood-prone properties throughout the planning area. For the purposes of this plan, 19 mitigation techniques have been identified and determined to be appropriate for Mecklenburg County. These mitigation techniques may provide a complete solution by eliminating flood risk, while others may be partial solutions by reducing flood risk. Acquisition/demolition, for example, removes the structure and its inhabitants from that particular hazard area, thus eliminating the flood risk. Elevation, however, simply reduces the flood risk because the structure and its inhabitants are still located in the same hazard area. Recognizing that the implementation of a single flood mitigation technique in all situations is not possible, a reduction in flood risk may be accomplished by implementing several flood mitigation techniques. Not all mitigation activities have to be identified, driven, and/or funded by government entities, whether Federal, state, or local. Property owners place large investments in their property and are essentially the primary stakeholder. The Risk Reduction Recommendations contained within the plan data are intended to be used by both CMSWS and individual property owners as a guide to take action(s) aimed at reducing or eliminating flood risk. Some actions will also lead to lower flood insurance premiums and can make properties more valuable. 3.2 Flood Mitigation Techniques The term flood mitigation technique is used to describe a specific project type that could be used in a given situation to reduce flood risk. The key to any flood hazard mitigation plan is implementing actions that will eliminate or reduce flood risk. Therefore, mitigation recommendations will be made for each flood-prone property. Many properties will have more than one flood hazard mitigation technique that can be employed to reduce or eliminate the flood risk. It is also important to note that these are planning level recommendations and subject to the availability and quality of data. CMSWS will evaluate the recommended techniques before implementing any mitigation project. The 19 mitigation techniques contained within this Flood RA/RR Plan were deemed most appropriate for Mecklenburg County and are described in detail in the following sections.
Flood Risk Assessment and Risk Reduction Plan January 2012
26
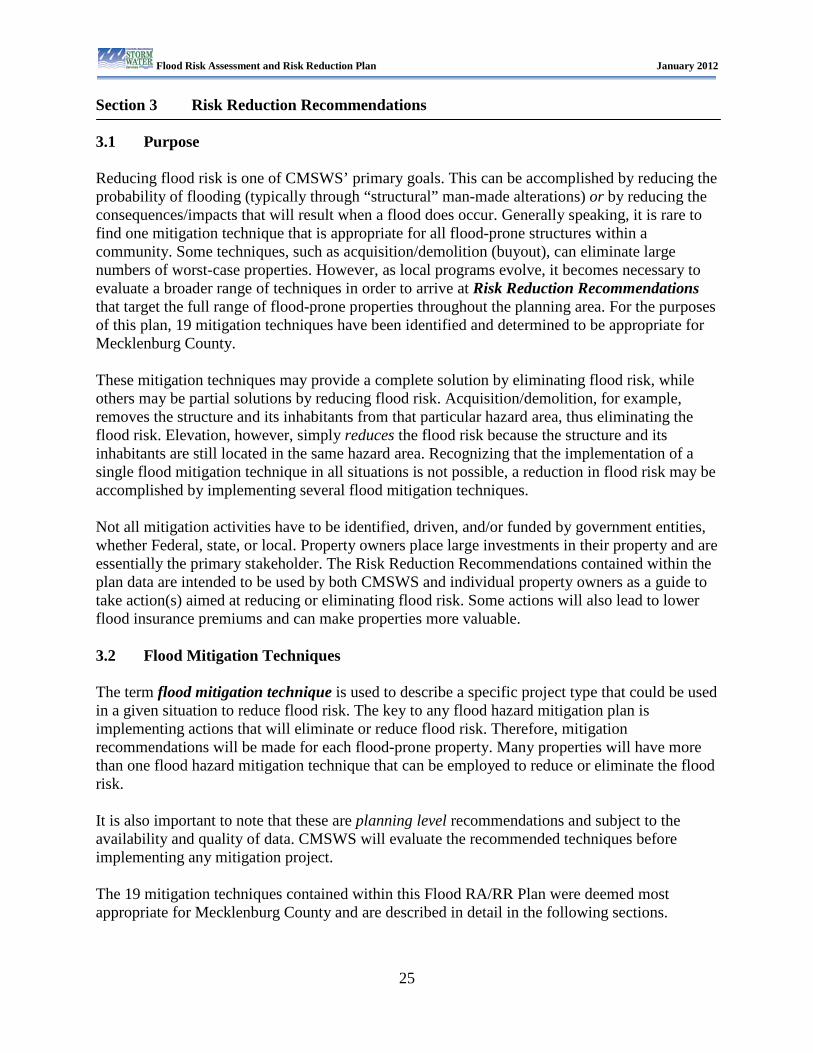
3.2.1 Property Acquisition and Structure Demolition (Buyout) Property acquisition and structure demolition involves the purchase of a flood-prone structure and underlying land and demolition of the structure by a demolition contractor. The flood-prone structure is demolished and the debris is removed from the site. The site is graded to accommodate local runoff and grass is planted to promote long-term stability of the soil. When FEMA funds are used to purchase the property, the property is deed-restricted in perpetuity as open space to preserve the natural function of the floodplain. Possible funding sources include:
• FEMA Eligible Activity • Local Government • NFIP ICC Fund if eligible
Advantages of this technique include:
• Completely removes people and property from the flood risk • Property is available for use as open space, greenway, park, sanitary sewer project, water
quality project or other similar uses • Removal of structure and impervious surfaces improves water quality in the watershed
Disadvantages of this technique include:
• Purchase of the land and building and paying for demolition is costly • Government owned land is removed from the tax base • A large portion of the demolition debris is taken to a landfill • If purchased with FEMA funds, land must be used as open space—cannot resale.
Criteria include:
• Structure is pre-FIRM or post-FIRM with a finished floor elevation lower than the Flood Protection Elevation1
• Property has a Flood Risk Property Score ≥ 300
• Property is located adjacent to publicly owned land • Any part of the structure is located in a water quality buffer • Property has a Flood Risk Property Score ≥ 500 • Property is located at potential water quality capital improvement site • Property is located in critical needs area of planned greenway, park, sanitary sewer line,
or water line • Property has a Flood Risk Property Score ≥ 700
1 The Flood Protection Elevation, or FPE, is defined for the purposes of this plan as the future 100-year flood elevation plus 1 foot of freeboard.
Figure 16: Example of Demolition in Progress – Cavalier Apartments
Flood Risk Assessment and Risk Reduction Plan January 2012
27
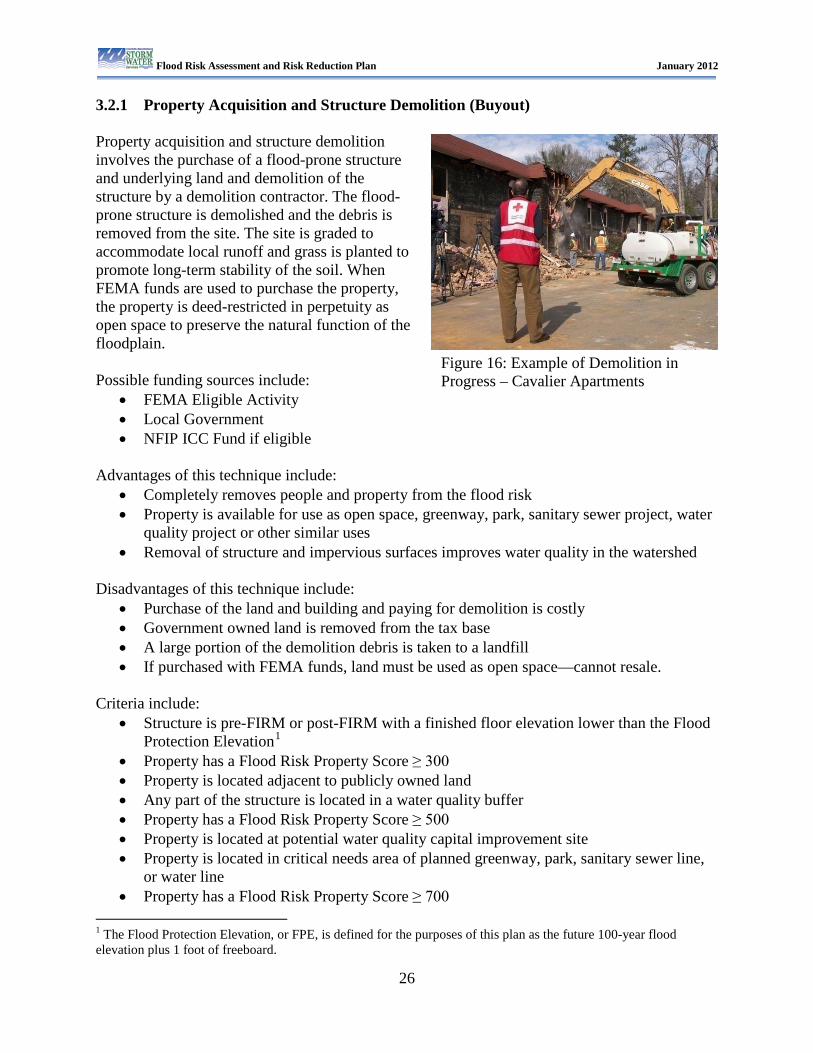
3.2.2 Structure Demolition and Rebuild (Demo Rebuild) Structure demolition and rebuild involves the demolition of a flood-prone structure and the construction of a floodplain regulatory compliant structure on the same property. The rebuilt structure is either located outside the floodplain on the same parcel or built above the Flood Protection Elevation (FPE) inside the floodplain and is compliant with the Floodplain Ordinance. Possible funding sources include:
• FEMA Eligible Activity • Local Government may be available in the future • Private/Owner • Community Development Block Grant
Advantages of this technique include:
• Decreases the flood threat to people and property • Less expensive than demolition or relocation because the
government does not purchase the land and building • Property remains in the tax base
Disadvantages of this technique include:
• Does not completely eliminate flood risk for people and property • The property is not available for public uses such as open space, greenway, park, sanitary
sewer project, water quality project or other similar uses • Does not improve water quality by removing impervious surface from the watershed • Personal property such as a car may not be protected • A storm event with a flood elevation greater than the FPE would cause damage
Criteria include:
• Land area outside the FEMA Floodway is large enough to accommodate 1.5x the footprint of the structure (to account for setbacks)
• Land area outside the high velocity zone is 1.5x the footprint of the structure • Land area outside the water quality buffer is large enough to accommodate 1.5x the
footprint of the structure • Building tax value is ≤ $30,000 • Building grade is Below Average • Land tax value is ≥ 3x the building tax value • Property is not surrounded by water during the FEMA Base Flood • Property is not located in critical needs area of planned greenway, park, sanitary sewer
line, or water line • Property is not located at a potential water quality capital improvement site
Notes:
• Must be a Severe Repetitive Loss property to be eligible for FEMA funds
Figure 17: Example of a Demo Rebuild Project
Flood Risk Assessment and Risk Reduction Plan January 2012
28
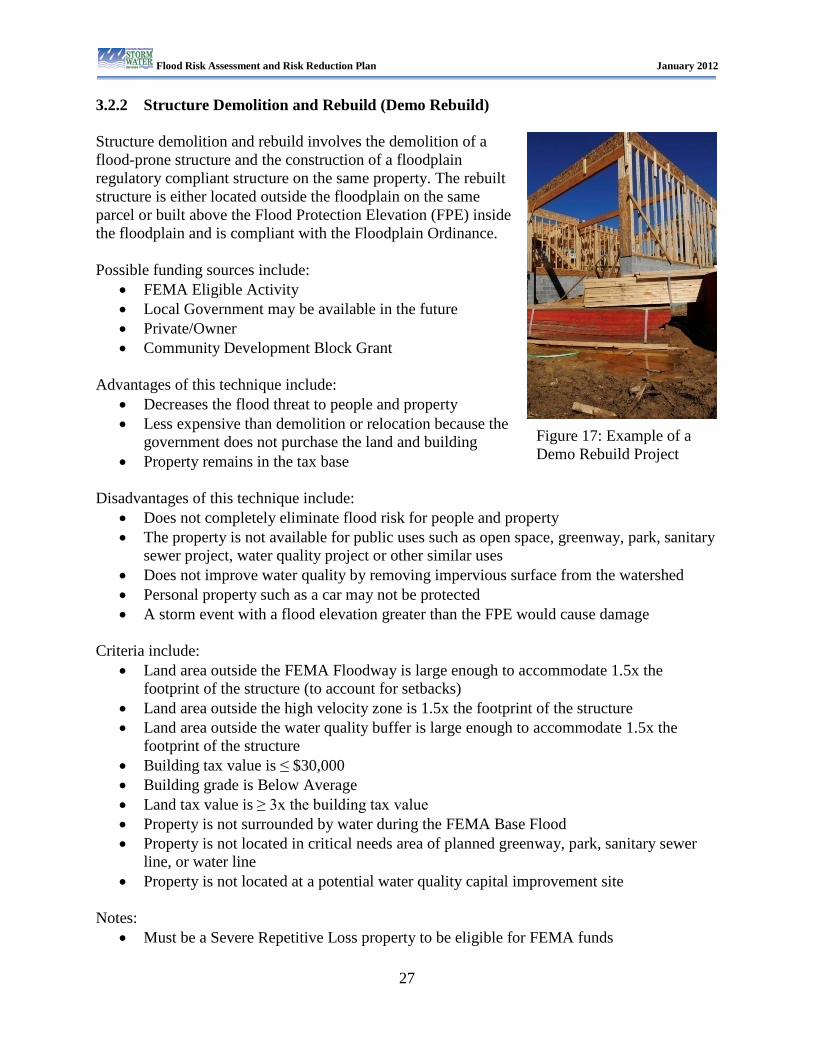
3.2.3 Property Acquisition and Structure Relocation (Relocation) Property acquisition and structure relocation involves the purchase of the land underlying a flood-prone structure and relocating the structure to a location outside the floodplain. When public funds are available, a local government entity may acquire the land. The structure would be moved to a location outside the floodplain and remains the property of a private owner. The private owner bears the cost of acquiring a new parcel for the structure and the local government entity may bear the structure relocation costs. When FEMA funds are used to purchase the land, the flood-prone land must be deed-restricted in perpetuity as open space to preserve the natural function of the floodplain. Possible funding sources include:
• FEMA Eligible Activity • Local Government • Private/Owner • NFIP ICC fund if eligible
Advantages of this technique include:
• Completely removes people and property from the flood risk • Property is available for use as open space, greenway, park, sanitary sewer project, water
quality project or other similar uses • Relocation is a reuse of the building—no demolition debris for the landfill • Less costly than acquisition and demolition
Disadvantages of this technique include:
• Government owned land is removed from the tax base • If purchased with FEMA funds, land must be used as open space—cannot resale land • Difficulty in transporting building from existing lot to a new lot
Criteria include:
• Structure is pre-FIRM or structure is post-FIRM and has finished floor elevation lower than the Flood Protection Elevation
• Structure foundation is not slab-on-grade • Structure does not have masonry walls (Cement Block/Split-Face Block, Concrete block,
Jumbo/Common Brick, Precast Panel, Reinforced Concrete, or Stone) • Building tax value is > $30,000 • Property has Risk Score ≥ 300 • Structure is a single story (no split levels or multi-story)
Figure 18: Example of House Relocation
Flood Risk Assessment and Risk Reduction Plan January 2012
29
• Structure footprint is ≤ 2000 sf • Property is located adjacent to publicly owned land • Any part of the structure is located inside a water quality buffer • Property has Risk Score ≥ 500 • Structure footprint is ≤ 1500 sf • Property is located in critical needs area of planned greenway, park, sanitary sewer line,
or water line • Property is located at a potential water quality capital improvement site • Property has Risk Score ≥ 700
Notes:
• New building site must be outside the Special Flood Hazard Area 3.2.4 Property Acquisition, Demolition or Relocation, and Re-sale (Buyout Resale) Property acquisition, demolition or relocation, and re-sale involves the purchase of a flood-prone structure and underlying land and the demolition or relocation of the structure to a location outside the floodplain. When public funds are available, a local government entity may acquire the land for resale later. There would be no deed restriction on the deed that passes from the private property owner to the government entity. Therefore, the government entity could sell the portion of the property that is outside the floodplain, and retain the portion inside the floodplain. Possible funding sources include:
• Local Government • Private/Owner • Community Development Block Grant
Advantages of this technique include:
• Completely removes people and property from the flood risk • When government is involved, portion of property retained by the government is
available for use as open space, greenway, park, sanitary sewer project, water quality project or other similar uses
• When government is involved, portion of property sold to private owner remains in the tax base
• When government is involved, government recoups some of the expense for purchase and demolition or relocation by the sale of a portion of the property
Disadvantages of this technique include:
• Initial cost is high to purchase the property and demolish or relocate the building • Demolition produces debris for the landfill • Relocation requires a willing buyer for the structure • Cannot obtain a FEMA grant for this type of project • Government owned portion of the property is removed from the tax base
Flood Risk Assessment and Risk Reduction Plan January 2012
30
Criteria include: • Structure is pre-FIRM or structure is post-FIRM and has finished floor elevation lower
than the Flood Protection Elevation • Resale portion of property outside the Community Encroachment Area is ≥ 1 acre for
commercial, industrial, or retail zoned property or ≥ ½ acre for residential zoned property
• Property has Risk Score ≥ 300 • Property is located adjacent to publicly owned land • Any part of the structure is located inside a water quality buffer • Property has Risk Score ≥ 500 • Property is located in critical needs area of planned greenway, park, sanitary sewer line,
or water line • Property is located at a potential water quality capital improvement site • Property has Risk Score ≥ 700
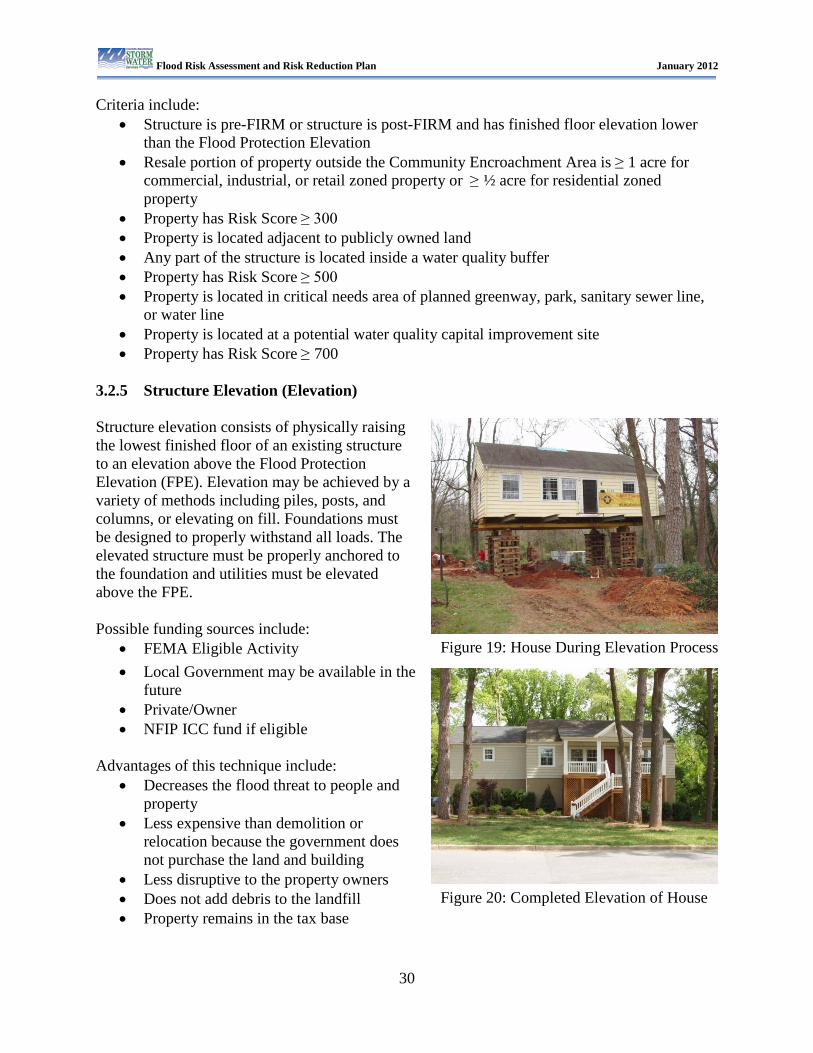
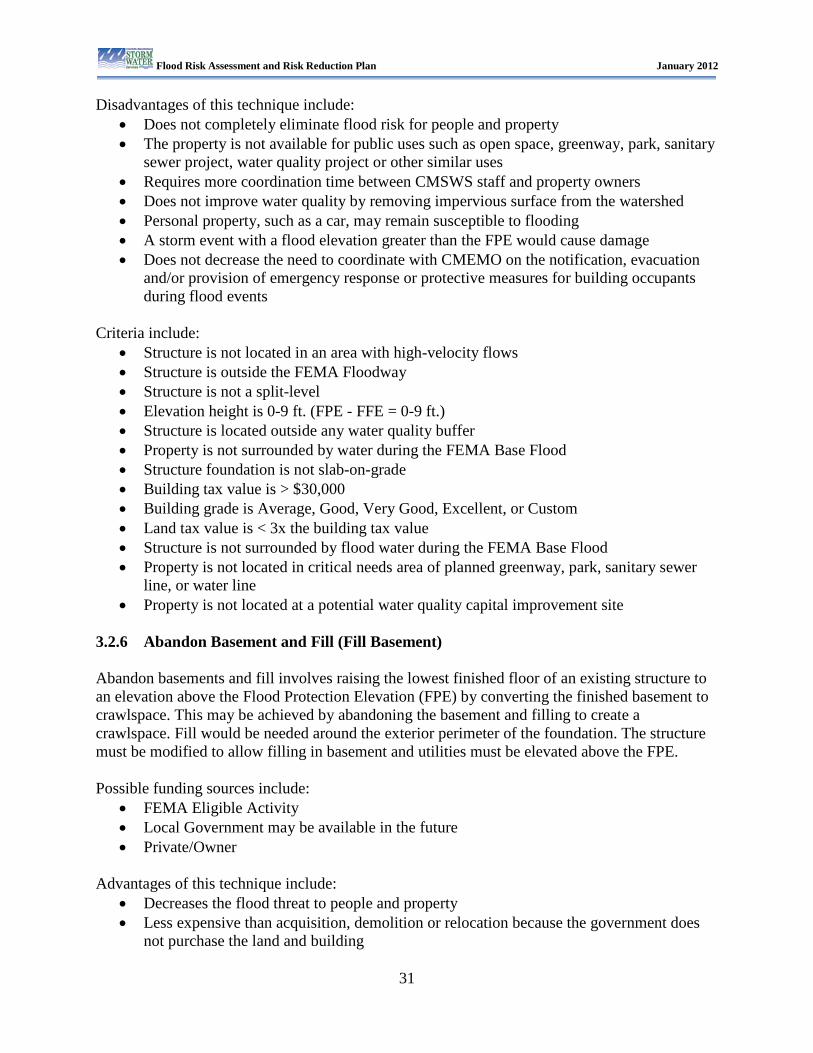
3.2.5 Structure Elevation (Elevation) Structure elevation consists of physically raising the lowest finished floor of an existing structure to an elevation above the Flood Protection Elevation (FPE). Elevation may be achieved by a variety of methods including piles, posts, and columns, or elevating on fill. Foundations must be designed to properly withstand all loads. The elevated structure must be properly anchored to the foundation and utilities must be elevated above the FPE. Possible funding sources include:
• FEMA Eligible Activity • Local Government may be available in the
future • Private/Owner • NFIP ICC fund if eligible
Advantages of this technique include:
• Decreases the flood threat to people and property
• Less expensive than demolition or relocation because the government does not purchase the land and building
• Less disruptive to the property owners • Does not add debris to the landfill • Property remains in the tax base
Figure 19: House During Elevation Process
Figure 20: Completed Elevation of House
Flood Risk Assessment and Risk Reduction Plan January 2012
31
Disadvantages of this technique include: • Does not completely eliminate flood risk for people and property • The property is not available for public uses such as open space, greenway, park, sanitary
sewer project, water quality project or other similar uses • Requires more coordination time between CMSWS staff and property owners • Does not improve water quality by removing impervious surface from the watershed • Personal property, such as a car, may remain susceptible to flooding • A storm event with a flood elevation greater than the FPE would cause damage • Does not decrease the need to coordinate with CMEMO on the notification, evacuation
and/or provision of emergency response or protective measures for building occupants during flood events
Criteria include:
• Structure is not located in an area with high-velocity flows • Structure is outside the FEMA Floodway • Structure is not a split-level • Elevation height is 0-9 ft. (FPE - FFE = 0-9 ft.) • Structure is located outside any water quality buffer • Property is not surrounded by water during the FEMA Base Flood • Structure foundation is not slab-on-grade • Building tax value is > $30,000 • Building grade is Average, Good, Very Good, Excellent, or Custom • Land tax value is < 3x the building tax value • Structure is not surrounded by flood water during the FEMA Base Flood • Property is not located in critical needs area of planned greenway, park, sanitary sewer
line, or water line • Property is not located at a potential water quality capital improvement site
3.2.6 Abandon Basement and Fill (Fill Basement) Abandon basements and fill involves raising the lowest finished floor of an existing structure to an elevation above the Flood Protection Elevation (FPE) by converting the finished basement to crawlspace. This may be achieved by abandoning the basement and filling to create a crawlspace. Fill would be needed around the exterior perimeter of the foundation. The structure must be modified to allow filling in basement and utilities must be elevated above the FPE. Possible funding sources include:
• FEMA Eligible Activity • Local Government may be available in the future • Private/Owner
Advantages of this technique include:
• Decreases the flood threat to people and property • Less expensive than acquisition, demolition or relocation because the government does
not purchase the land and building
Flood Risk Assessment and Risk Reduction Plan January 2012
32
• Less disruptive to the property owners • Does not add debris to the landfill • Property remains in the tax base • Results in a fully compliant building
Disadvantages of this technique include:
• Does not completely eliminate flood risk for people and property • The property is not available for public uses such as open space, greenway, park, sanitary
sewer project, water quality project or other similar uses • Requires more coordination time between CMSWS staff and property owners • Does not improve water quality by removing impervious surface from the watershed • A storm event with a flood elevation greater than the FPE would cause damage
Criteria include:
• Structure is not located in an area with high-velocity flows • Structure is outside the FEMA Floodway • Structure has a basement • Next Higher Floor is ≥ FPE • Structure is located outside any water quality buffer • Property is not surrounded by water during the FEMA Base Flood • Structure is not surrounded by flood water during the FEMA Base Flood • Property is not located in critical needs area of planned greenway, park, sanitary sewer
line, or water line • Property is not located at a potential water quality capital improvement site
Notes:
• Not a typical technique but could be FEMA eligible as an elevation project
3.2.7 Dry Floodproofing of Structures (Dry Floodproofing) Dry floodproofing of a structure involves making any area below the Flood Protection Elevation (FPE) watertight to prevent floodwater from entering the structure. The walls must be made watertight with waterproof coatings, impermeable membranes, and/or supplemental layers of concrete or masonry. Any windows, doors, or other openings must be equipped with permanent or removable shields. Water and sewer lines must be equipped with backflow preventer valves. All mechanical and electrical equipment must be flood protected either by a floodproofing enclosure or by elevating above the FPE.
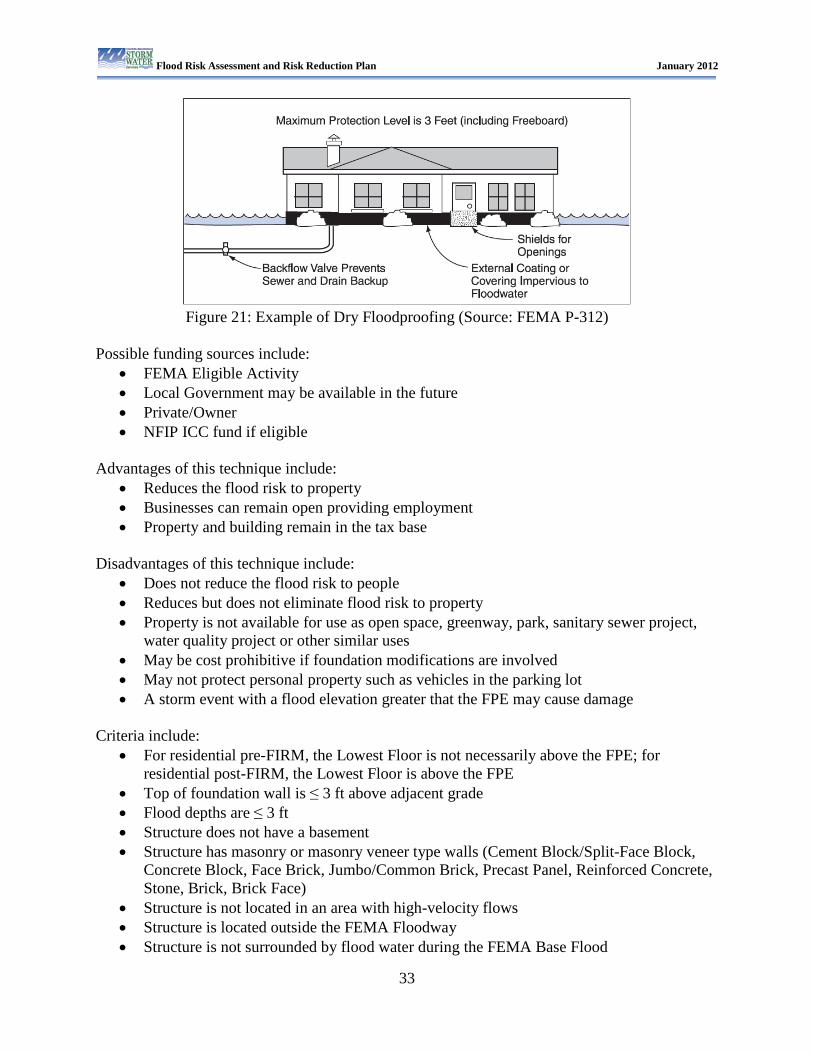
Flood Risk Assessment and Risk Reduction Plan January 2012
33
Figure 21: Example of Dry Floodproofing (Source: FEMA P-312)
Possible funding sources include:
• FEMA Eligible Activity • Local Government may be available in the future • Private/Owner • NFIP ICC fund if eligible
Advantages of this technique include:
• Reduces the flood risk to property • Businesses can remain open providing employment • Property and building remain in the tax base
Disadvantages of this technique include:
• Does not reduce the flood risk to people • Reduces but does not eliminate flood risk to property • Property is not available for use as open space, greenway, park, sanitary sewer project,
water quality project or other similar uses • May be cost prohibitive if foundation modifications are involved • May not protect personal property such as vehicles in the parking lot • A storm event with a flood elevation greater that the FPE may cause damage
Criteria include:
• For residential pre-FIRM, the Lowest Floor is not necessarily above the FPE; for residential post-FIRM, the Lowest Floor is above the FPE
• Top of foundation wall is ≤ 3 ft above adjacent grade • Flood depths are ≤ 3 ft • Structure does not have a basement • Structure has masonry or masonry veneer type walls (Cement Block/Split-Face Block,
Concrete Block, Face Brick, Jumbo/Common Brick, Precast Panel, Reinforced Concrete, Stone, Brick, Brick Face)
• Structure is not located in an area with high-velocity flows • Structure is located outside the FEMA Floodway • Structure is not surrounded by flood water during the FEMA Base Flood
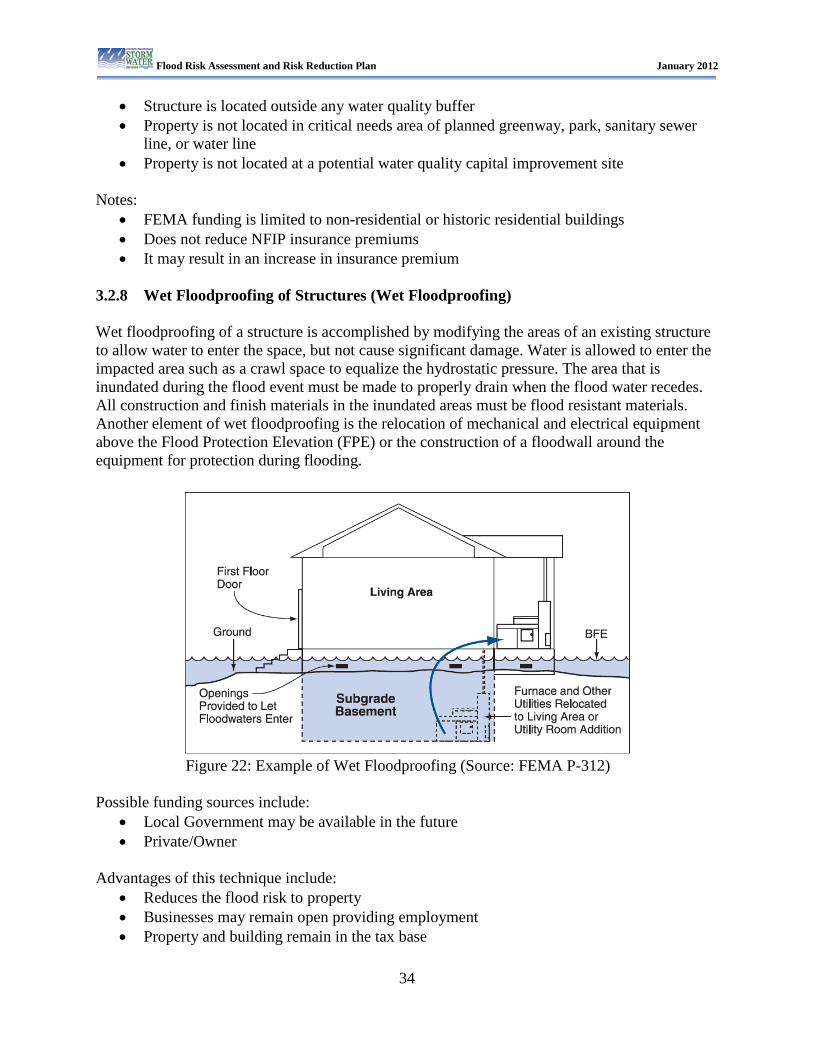
Flood Risk Assessment and Risk Reduction Plan January 2012
34
• Structure is located outside any water quality buffer • Property is not located in critical needs area of planned greenway, park, sanitary sewer
line, or water line • Property is not located at a potential water quality capital improvement site
Notes:
• FEMA funding is limited to non-residential or historic residential buildings • Does not reduce NFIP insurance premiums • It may result in an increase in insurance premium
3.2.8 Wet Floodproofing of Structures (Wet Floodproofing) Wet floodproofing of a structure is accomplished by modifying the areas of an existing structure to allow water to enter the space, but not cause significant damage. Water is allowed to enter the impacted area such as a crawl space to equalize the hydrostatic pressure. The area that is inundated during the flood event must be made to properly drain when the flood water recedes. All construction and finish materials in the inundated areas must be flood resistant materials. Another element of wet floodproofing is the relocation of mechanical and electrical equipment above the Flood Protection Elevation (FPE) or the construction of a floodwall around the equipment for protection during flooding.
Figure 22: Example of Wet Floodproofing (Source: FEMA P-312)
Possible funding sources include:
• Local Government may be available in the future • Private/Owner
Advantages of this technique include:
• Reduces the flood risk to property • Businesses may remain open providing employment • Property and building remain in the tax base
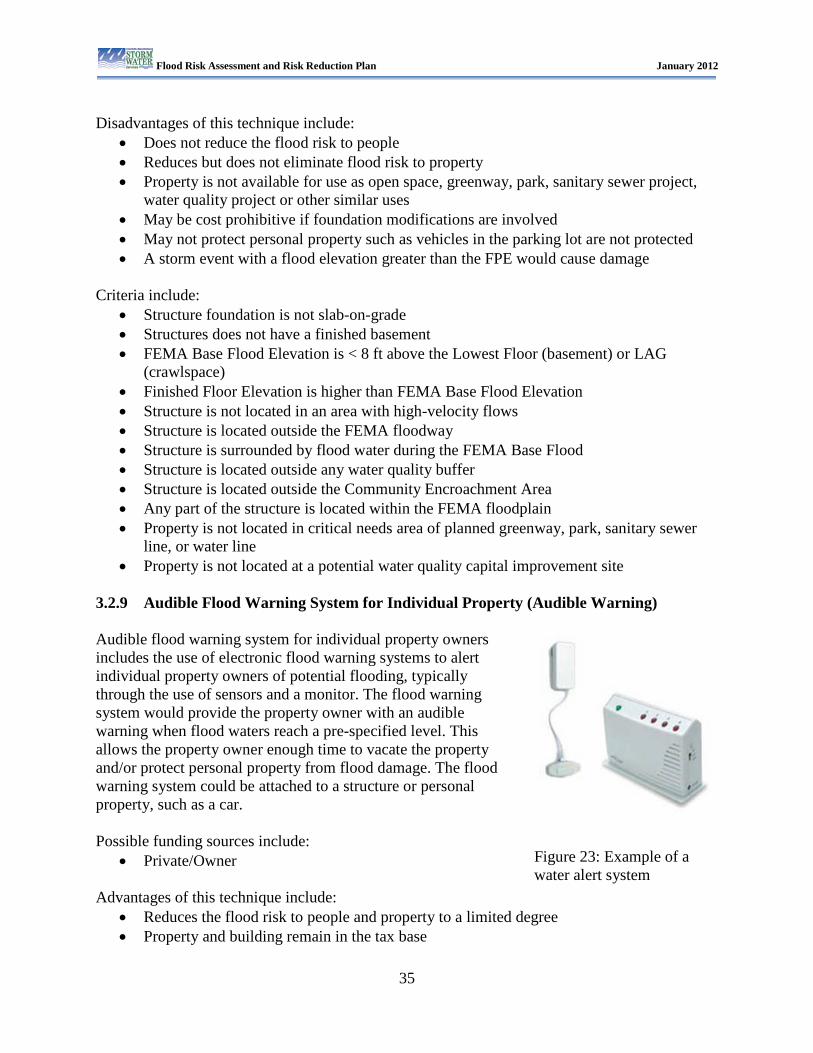
Flood Risk Assessment and Risk Reduction Plan January 2012
35
Disadvantages of this technique include:
• Does not reduce the flood risk to people • Reduces but does not eliminate flood risk to property • Property is not available for use as open space, greenway, park, sanitary sewer project,
water quality project or other similar uses • May be cost prohibitive if foundation modifications are involved • May not protect personal property such as vehicles in the parking lot are not protected • A storm event with a flood elevation greater than the FPE would cause damage
Criteria include:
• Structure foundation is not slab-on-grade • Structures does not have a finished basement • FEMA Base Flood Elevation is < 8 ft above the Lowest Floor (basement) or LAG
(crawlspace) • Finished Floor Elevation is higher than FEMA Base Flood Elevation • Structure is not located in an area with high-velocity flows • Structure is located outside the FEMA floodway • Structure is surrounded by flood water during the FEMA Base Flood • Structure is located outside any water quality buffer • Structure is located outside the Community Encroachment Area • Any part of the structure is located within the FEMA floodplain • Property is not located in critical needs area of planned greenway, park, sanitary sewer
line, or water line • Property is not located at a potential water quality capital improvement site
3.2.9 Audible Flood Warning System for Individual Property (Audible Warning) Audible flood warning system for individual property owners includes the use of electronic flood warning systems to alert individual property owners of potential flooding, typically through the use of sensors and a monitor. The flood warning system would provide the property owner with an audible warning when flood waters reach a pre-specified level. This allows the property owner enough time to vacate the property and/or protect personal property from flood damage. The flood warning system could be attached to a structure or personal property, such as a car. Possible funding sources include:
• Private/Owner Advantages of this technique include:
• Reduces the flood risk to people and property to a limited degree • Property and building remain in the tax base
Figure 23: Example of a water alert system
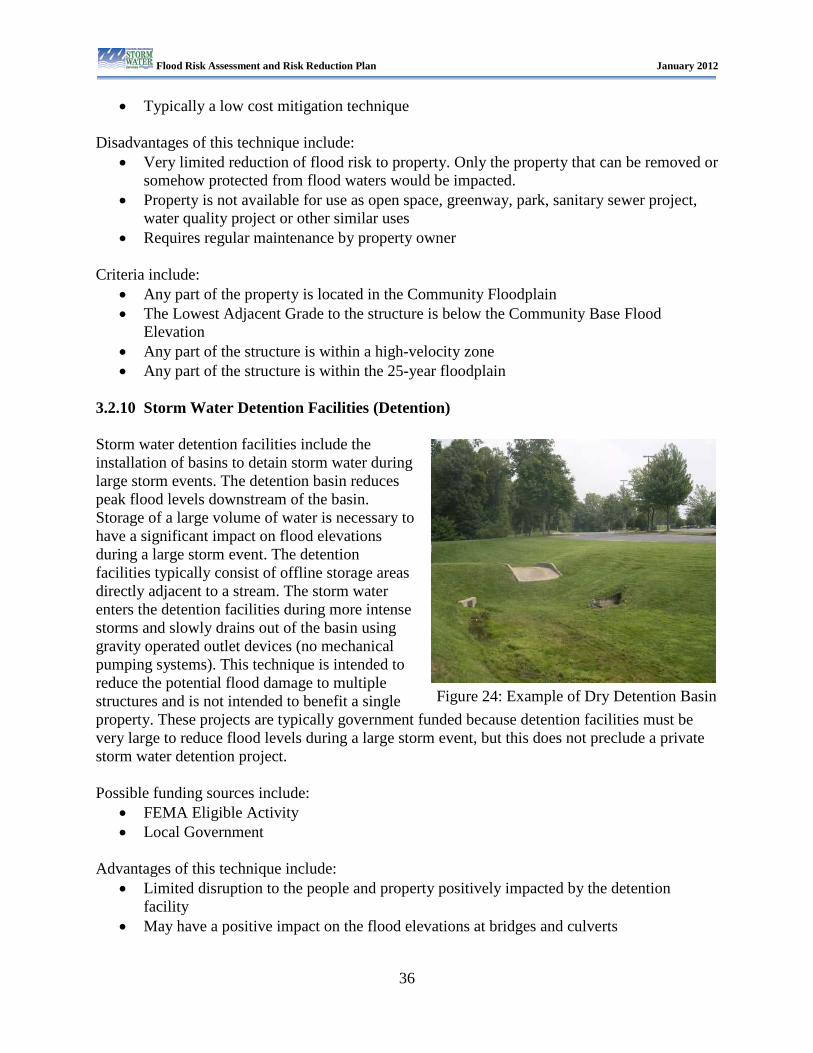
Flood Risk Assessment and Risk Reduction Plan January 2012
36
• Typically a low cost mitigation technique Disadvantages of this technique include:
• Very limited reduction of flood risk to property. Only the property that can be removed or somehow protected from flood waters would be impacted.
• Property is not available for use as open space, greenway, park, sanitary sewer project, water quality project or other similar uses
• Requires regular maintenance by property owner Criteria include:
• Any part of the property is located in the Community Floodplain • The Lowest Adjacent Grade to the structure is below the Community Base Flood
Elevation • Any part of the structure is within a high-velocity zone • Any part of the structure is within the 25-year floodplain
3.2.10 Storm Water Detention Facilities (Detention) Storm water detention facilities include the installation of basins to detain storm water during large storm events. The detention basin reduces peak flood levels downstream of the basin. Storage of a large volume of water is necessary to have a significant impact on flood elevations during a large storm event. The detention facilities typically consist of offline storage areas directly adjacent to a stream. The storm water enters the detention facilities during more intense storms and slowly drains out of the basin using gravity operated outlet devices (no mechanical pumping systems). This technique is intended to reduce the potential flood damage to multiple structures and is not intended to benefit a single property. These projects are typically government funded because detention facilities must be very large to reduce flood levels during a large storm event, but this does not preclude a private storm water detention project. Possible funding sources include:
• FEMA Eligible Activity • Local Government
Advantages of this technique include:
• Limited disruption to the people and property positively impacted by the detention facility
• May have a positive impact on the flood elevations at bridges and culverts
Figure 24: Example of Dry Detention Basin
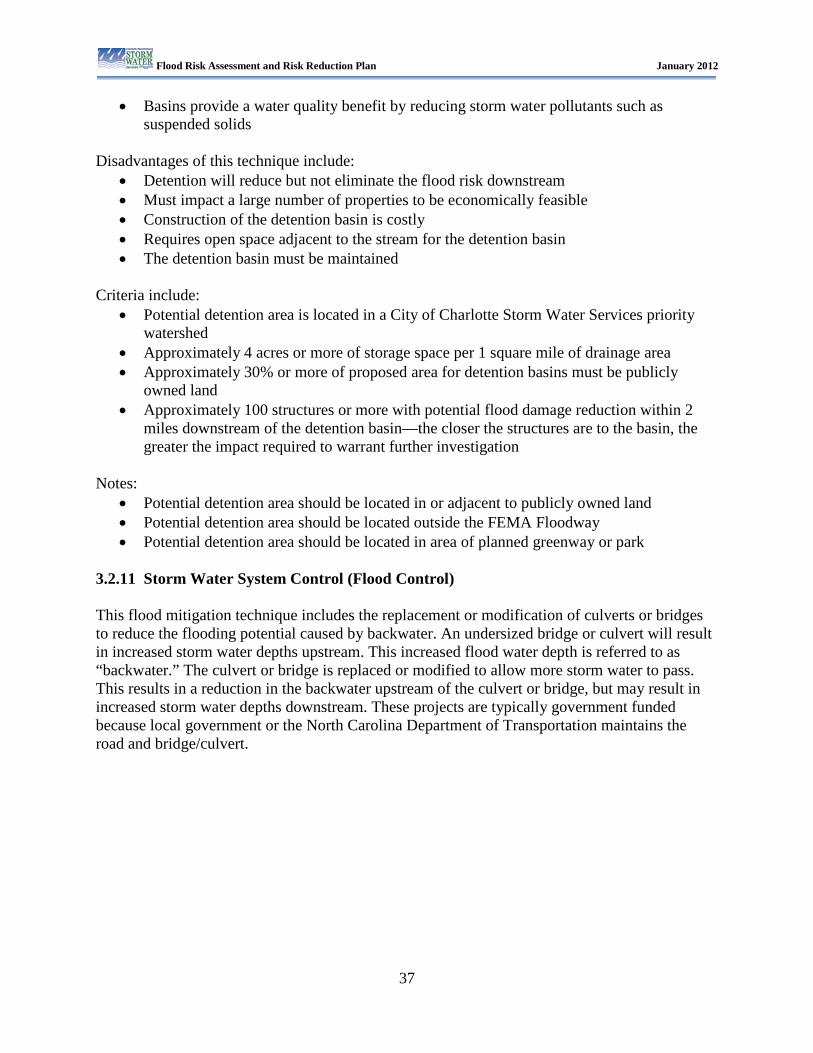
Flood Risk Assessment and Risk Reduction Plan January 2012
37
• Basins provide a water quality benefit by reducing storm water pollutants such as suspended solids
Disadvantages of this technique include:
• Detention will reduce but not eliminate the flood risk downstream • Must impact a large number of properties to be economically feasible • Construction of the detention basin is costly • Requires open space adjacent to the stream for the detention basin • The detention basin must be maintained
Criteria include:
• Potential detention area is located in a City of Charlotte Storm Water Services priority watershed
• Approximately 4 acres or more of storage space per 1 square mile of drainage area • Approximately 30% or more of proposed area for detention basins must be publicly
owned land • Approximately 100 structures or more with potential flood damage reduction within 2
miles downstream of the detention basin—the closer the structures are to the basin, the greater the impact required to warrant further investigation
Notes:
• Potential detention area should be located in or adjacent to publicly owned land • Potential detention area should be located outside the FEMA Floodway • Potential detention area should be located in area of planned greenway or park
3.2.11 Storm Water System Control (Flood Control) This flood mitigation technique includes the replacement or modification of culverts or bridges to reduce the flooding potential caused by backwater. An undersized bridge or culvert will result in increased storm water depths upstream. This increased flood water depth is referred to as “backwater.” The culvert or bridge is replaced or modified to allow more storm water to pass. This results in a reduction in the backwater upstream of the culvert or bridge, but may result in increased storm water depths downstream. These projects are typically government funded because local government or the North Carolina Department of Transportation maintains the road and bridge/culvert.
Flood Risk Assessment and Risk Reduction Plan January 2012
38
Figure 25: Example of Backwater at Culvert Shown in Profile
Possible funding sources include:
• FEMA Eligible Activity • State Government • Local Government
Advantages of this technique include:
• Increases in the conveyance of bridges and culverts in a backwater situation can have a significant effect on flood elevations upstream of the culvert or bridge
• Typically the bridge or culvert is owned by a governmental entity and the cost of the replacement or modification does not include land acquisition
Disadvantages of this technique include:
• The expansion of a culvert or bridge in a backwater situation may increase the flood elevations downstream of the modified structure
• Modifying or replacing culverts and bridges is costly • Modifying or replacing culverts and bridges typically requires permitting from local,
state, and Federal government Criteria include:
• Backwater upstream of bridge or culvert impacts approximately 25 structures • The road overtopping height to culvert opening height ratio is > 2 • Internal staff review process identifies this culvert as a concern
Notes:
• Limited number of structures immediately downstream of bridge or culvert
86000 86500 87000 87500 88000 88500
610
620
630
640
Storm Water Control Plan: McAlpine Creek 12/18/2007
Main Channel Di stance (ft)
Ele
vatio
n (ft
)
Legend
WS 100-YEAR
Ground
9803
7.0
9854
0.0
9903
4.0
9908
6.0
9938
1.0
9980
9.0
1002
80.0
1007
01.0
Main Stem Reach - 1
Flood Risk Assessment and Risk Reduction Plan January 2012
39
• Bridge or Culvert is located in 100-year floodplain • Affected properties are not located in critical needs area of planned greenway, park, or
sanitary sewer line 3.2.12 Automated Flood Notifications (FINS Notification) CMSWS in conjunction with the USGS operates the Flood Information & Notification System (FINS) in Mecklenburg County. FINS has a network of automated rain and stream gages that constantly measure precipitation and stream depth in target streams where flooding has resulted in risk to people and damage to structures in the past. FINS automatically notifies emergency services personnel when either the rain depth or stream depth exceeds a predetermined threshold. CMSWS may build user-driven notification into FINS. CMSWS staff may provide user assistance with determining thresholds for individual properties. Possible funding sources include:
• Local Government Advantages of this technique include:
• Reduces the flood risk to people and property to a limited degree • Property and building remain in the tax base
Disadvantages of this technique include:
• Does not completely eliminate flood risk to people • Very limited reduction of flood risk to property. Only the property that can be removed or
somehow protected from flood waters would be impacted. • Property is not available for use as open space, greenway, park, sanitary sewer project,
water quality project or other similar use Criteria include:
• Any part of the property is located in the Community Floodplain 3.2.13 Public Education (Public Education) This mitigation technique consists of a multi-media public education campaign to inform owners of flood-prone properties of the flood risks and methods for protecting their lives and property. The focus of this effort is to teach the public strategies to protect themselves before, during, and after a flood event. Examples of the educational effort would include encouraging flood-prone property owners to purchase flood insurance, keeping storm drains clear of debris,
Figure 27: Example of Flood Safety Brochure
Figure 26: FINS Logo
Flood Risk Assessment and Risk Reduction Plan January 2012
40
avoiding flooded roads, etc. The education would be accomplished through broadcast media, the storm water website, flyers, and public meetings. Possible funding sources include:
• Local Government Advantages of this technique include:
• Engages a large number of people in the flood mitigation process • Empowers individual property owners to make good decisions about flood risk and flood
mitigation • Builds support necessary to further identify and fund more active type mitigation projects • Relatively inexpensive
Disadvantages of this technique include:
• This is not an active method of flood mitigation • Cannot be assured that contact is made with every impacted property owner
Criteria include:
• Any part of the property is located in the Community Floodplain 3.2.14 Flood Insurance (Flood Insurance) The goal is the purchase of flood insurance through the National Flood Insurance Program for all flood-prone properties. CMSWS encourages property owners to purchase flood insurance because it is one of the best methods for limiting the individual economic damage due to flooding. FEMA requires property owners to maintain flood insurance as a requirement of receiving flood mitigation grant funding. Possible funding sources include:
• Private/Owner Advantages of this technique include:
• This compensates individuals for economic losses due to flooding
• This is not an expense for CMSWS Disadvantages of this technique include:
• This technique does not reduce flood risk to property by structural physical means and does not do anything to reduce risk to life
• Flood insurance may provide a false sense of security Criteria include:
• Any part of the property is located in the Community Floodplain
Figure 28: Example of Flood Insurance Promotion Poster
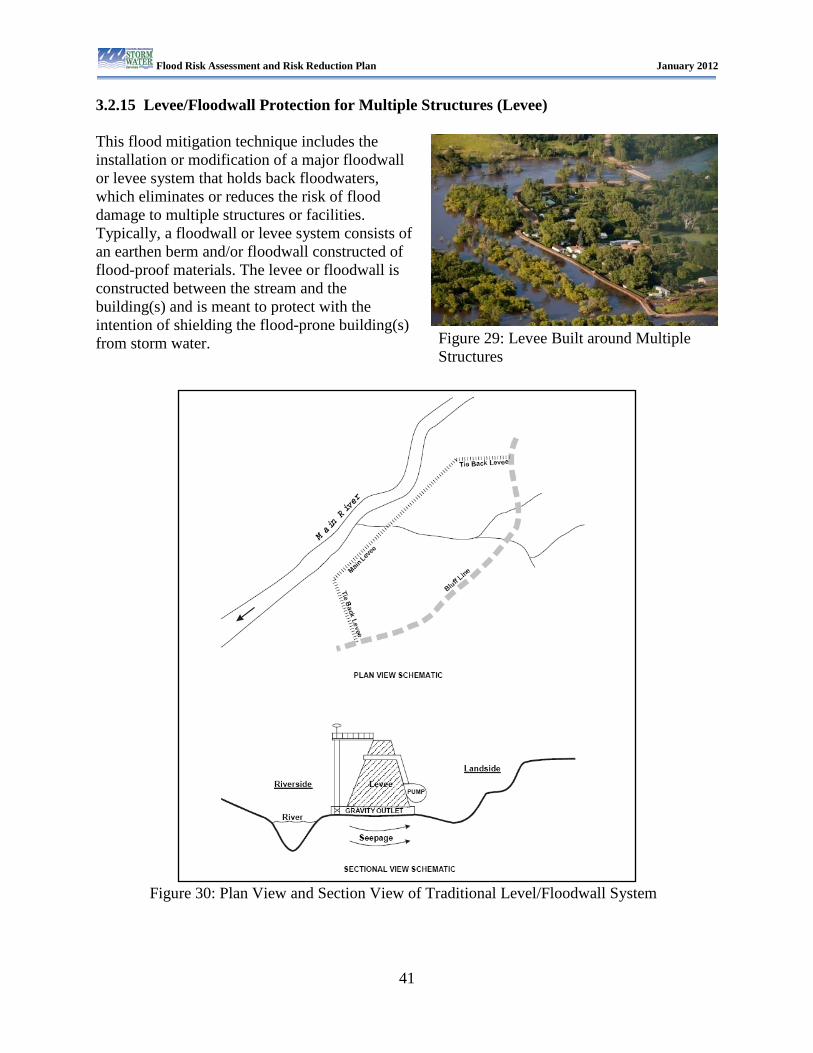
Flood Risk Assessment and Risk Reduction Plan January 2012
41
3.2.15 Levee/Floodwall Protection for Multiple Structures (Levee) This flood mitigation technique includes the installation or modification of a major floodwall or levee system that holds back floodwaters, which eliminates or reduces the risk of flood damage to multiple structures or facilities. Typically, a floodwall or levee system consists of an earthen berm and/or floodwall constructed of flood-proof materials. The levee or floodwall is constructed between the stream and the building(s) and is meant to protect with the intention of shielding the flood-prone building(s) from storm water.
Figure 30: Plan View and Section View of Traditional Level/Floodwall System
Figure 29: Levee Built around Multiple Structures
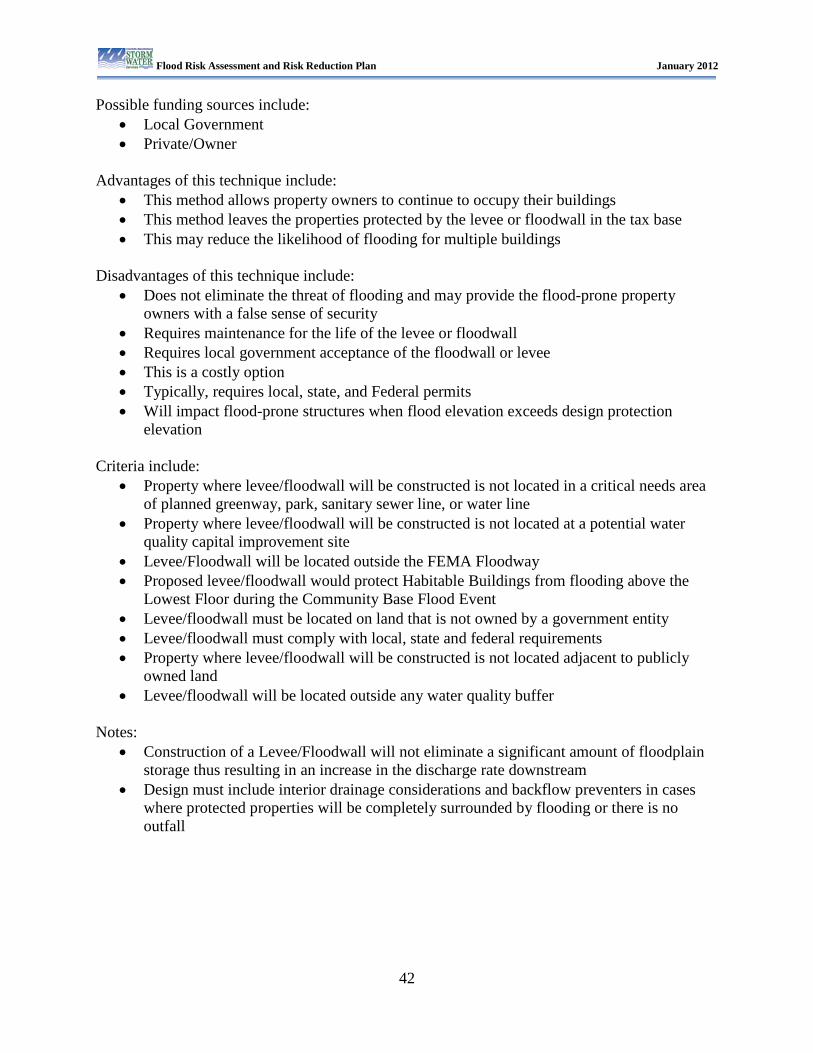
Flood Risk Assessment and Risk Reduction Plan January 2012
42
Possible funding sources include: • Local Government • Private/Owner
Advantages of this technique include:
• This method allows property owners to continue to occupy their buildings • This method leaves the properties protected by the levee or floodwall in the tax base • This may reduce the likelihood of flooding for multiple buildings
Disadvantages of this technique include:
• Does not eliminate the threat of flooding and may provide the flood-prone property owners with a false sense of security
• Requires maintenance for the life of the levee or floodwall • Requires local government acceptance of the floodwall or levee • This is a costly option • Typically, requires local, state, and Federal permits • Will impact flood-prone structures when flood elevation exceeds design protection
elevation Criteria include:
• Property where levee/floodwall will be constructed is not located in a critical needs area of planned greenway, park, sanitary sewer line, or water line
• Property where levee/floodwall will be constructed is not located at a potential water quality capital improvement site
• Levee/Floodwall will be located outside the FEMA Floodway • Proposed levee/floodwall would protect Habitable Buildings from flooding above the
Lowest Floor during the Community Base Flood Event • Levee/floodwall must be located on land that is not owned by a government entity • Levee/floodwall must comply with local, state and federal requirements • Property where levee/floodwall will be constructed is not located adjacent to publicly
owned land • Levee/floodwall will be located outside any water quality buffer
Notes:
• Construction of a Levee/Floodwall will not eliminate a significant amount of floodplain storage thus resulting in an increase in the discharge rate downstream
• Design must include interior drainage considerations and backflow preventers in cases where protected properties will be completely surrounded by flooding or there is no outfall
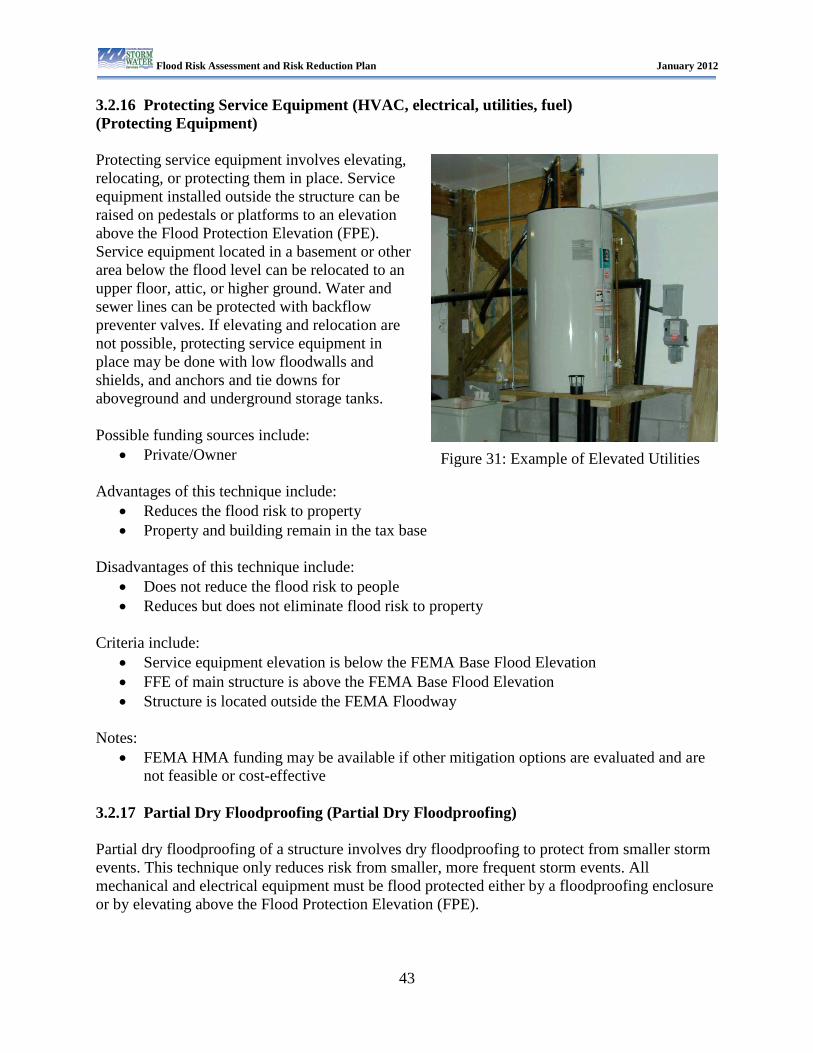
Flood Risk Assessment and Risk Reduction Plan January 2012
43
3.2.16 Protecting Service Equipment (HVAC, electrical, utilities, fuel) (Protecting Equipment) Protecting service equipment involves elevating, relocating, or protecting them in place. Service equipment installed outside the structure can be raised on pedestals or platforms to an elevation above the Flood Protection Elevation (FPE). Service equipment located in a basement or other area below the flood level can be relocated to an upper floor, attic, or higher ground. Water and sewer lines can be protected with backflow preventer valves. If elevating and relocation are not possible, protecting service equipment in place may be done with low floodwalls and shields, and anchors and tie downs for aboveground and underground storage tanks. Possible funding sources include:
• Private/Owner Advantages of this technique include:
• Reduces the flood risk to property • Property and building remain in the tax base
Disadvantages of this technique include:
• Does not reduce the flood risk to people • Reduces but does not eliminate flood risk to property
Criteria include:
• Service equipment elevation is below the FEMA Base Flood Elevation • FFE of main structure is above the FEMA Base Flood Elevation • Structure is located outside the FEMA Floodway
Notes:
• FEMA HMA funding may be available if other mitigation options are evaluated and are not feasible or cost-effective
3.2.17 Partial Dry Floodproofing (Partial Dry Floodproofing) Partial dry floodproofing of a structure involves dry floodproofing to protect from smaller storm events. This technique only reduces risk from smaller, more frequent storm events. All mechanical and electrical equipment must be flood protected either by a floodproofing enclosure or by elevating above the Flood Protection Elevation (FPE).
Figure 31: Example of Elevated Utilities
Flood Risk Assessment and Risk Reduction Plan January 2012
44
Possible funding sources include: • Private/Owner
Advantages of this technique include:
• Reduces the flood risk to property • Property and building remain in the tax base
Disadvantages of this technique include:
• Only protects from smaller storm events • Does not reduce the flood risk to people • Reduces but does not eliminate flood risk to property
Criteria include:
• Structure does not have a basement • Structure has masonry or masonry veneer type walls (Cement Block/Split-Face Block,
Concrete Block, Face Brick, Jumbo/Common Brick, Precast Panel, Reinforced Concrete, Stone, Brick, Brick Face, Stone)
• Structure is not located in an area with high-velocity flows • Structure is located outside the FEMA floodway
Notes:
• This technique only reduces risk from smaller, more frequent storm events • Dry floodproofing should not exceed 3 feet
3.2.18 Partial Wet Floodproofing (Partial Wet Floodproofing) Partial wet floodproofing involves wet floodproofing to protect from smaller storm events. All mechanical and electrical equipment must be relocated above the Flood Protection Elevation (FPE) or protected by constructing a floodwall around the equipment. Possible funding sources include:
• Private/Owner Advantages of this technique include:
• This method allows the property owner to continue to occupy their building • This method leaves the property protected by the levee or floodwall in the tax base • This may reduce the likelihood of flooding the building
Disadvantages of this technique include:
• Only protects from smaller storm events • Does not reduce the flood risk to people • Reduces but does not eliminate flood risk to property
Criteria include:
• Structure foundation is not slab-on-grade
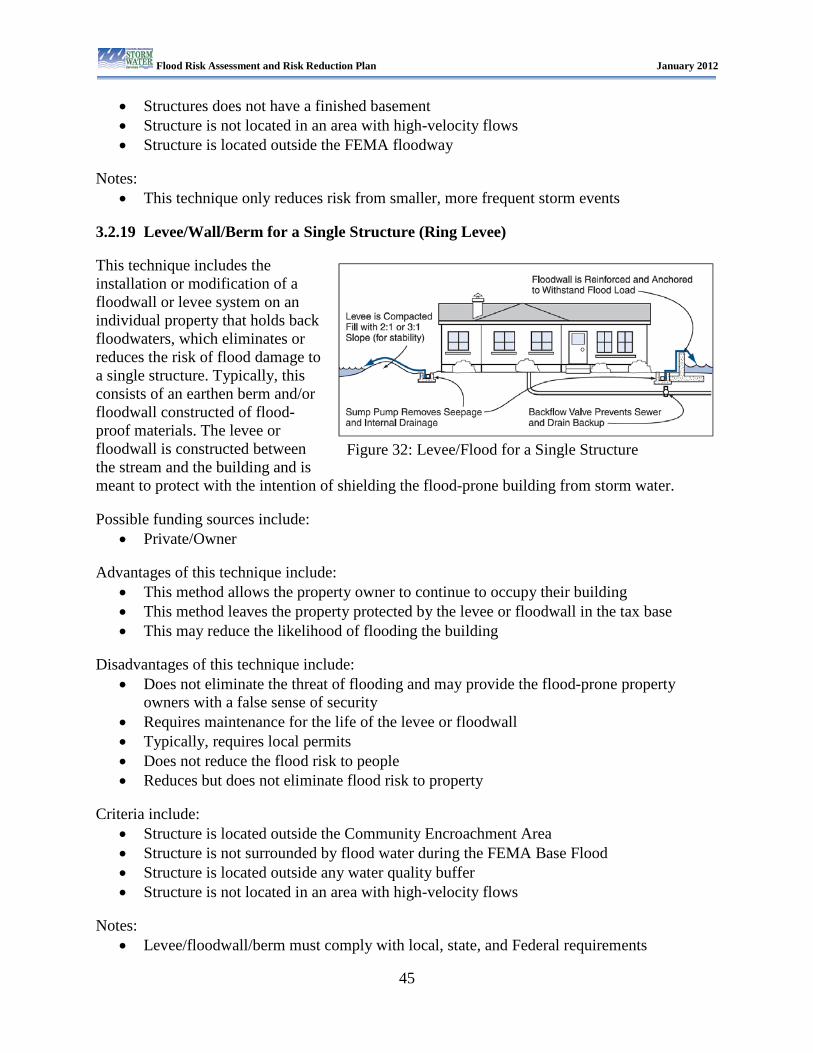
Flood Risk Assessment and Risk Reduction Plan January 2012
45
• Structures does not have a finished basement • Structure is not located in an area with high-velocity flows • Structure is located outside the FEMA floodway
Notes:
• This technique only reduces risk from smaller, more frequent storm events 3.2.19 Levee/Wall/Berm for a Single Structure (Ring Levee) This technique includes the installation or modification of a floodwall or levee system on an individual property that holds back floodwaters, which eliminates or reduces the risk of flood damage to a single structure. Typically, this consists of an earthen berm and/or floodwall constructed of flood-proof materials. The levee or floodwall is constructed between the stream and the building and is meant to protect with the intention of shielding the flood-prone building from storm water. Possible funding sources include:
• Private/Owner Advantages of this technique include:
• This method allows the property owner to continue to occupy their building • This method leaves the property protected by the levee or floodwall in the tax base • This may reduce the likelihood of flooding the building
Disadvantages of this technique include:
• Does not eliminate the threat of flooding and may provide the flood-prone property owners with a false sense of security
• Requires maintenance for the life of the levee or floodwall • Typically, requires local permits • Does not reduce the flood risk to people • Reduces but does not eliminate flood risk to property
Criteria include:
• Structure is located outside the Community Encroachment Area • Structure is not surrounded by flood water during the FEMA Base Flood • Structure is located outside any water quality buffer • Structure is not located in an area with high-velocity flows
Notes:
• Levee/floodwall/berm must comply with local, state, and Federal requirements
Figure 32: Levee/Flood for a Single Structure
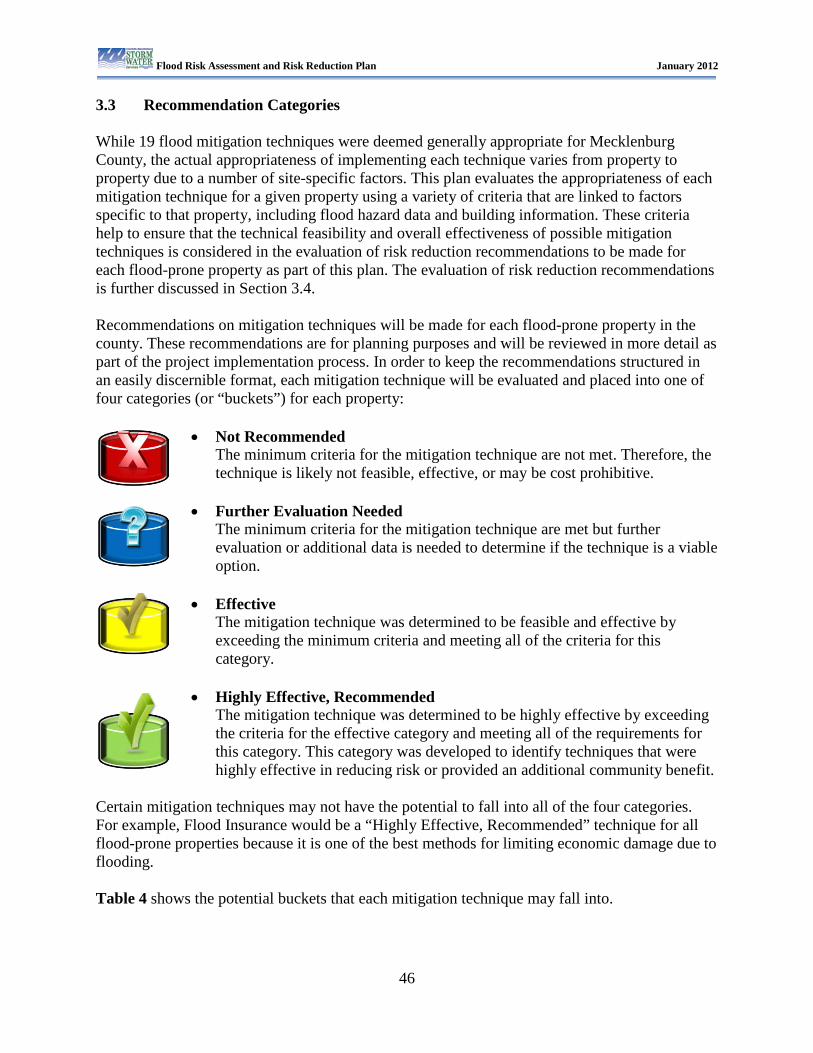
Flood Risk Assessment and Risk Reduction Plan January 2012
46
3.3 Recommendation Categories While 19 flood mitigation techniques were deemed generally appropriate for Mecklenburg County, the actual appropriateness of implementing each technique varies from property to property due to a number of site-specific factors. This plan evaluates the appropriateness of each mitigation technique for a given property using a variety of criteria that are linked to factors specific to that property, including flood hazard data and building information. These criteria help to ensure that the technical feasibility and overall effectiveness of possible mitigation techniques is considered in the evaluation of risk reduction recommendations to be made for each flood-prone property as part of this plan. The evaluation of risk reduction recommendations is further discussed in Section 3.4. Recommendations on mitigation techniques will be made for each flood-prone property in the county. These recommendations are for planning purposes and will be reviewed in more detail as part of the project implementation process. In order to keep the recommendations structured in an easily discernible format, each mitigation technique will be evaluated and placed into one of four categories (or “buckets”) for each property:
• Not Recommended The minimum criteria for the mitigation technique are not met. Therefore, the technique is likely not feasible, effective, or may be cost prohibitive.
• Further Evaluation Needed The minimum criteria for the mitigation technique are met but further evaluation or additional data is needed to determine if the technique is a viable option.
• Effective The mitigation technique was determined to be feasible and effective by exceeding the minimum criteria and meeting all of the criteria for this category.
• Highly Effective, Recommended The mitigation technique was determined to be highly effective by exceeding the criteria for the effective category and meeting all of the requirements for this category. This category was developed to identify techniques that were highly effective in reducing risk or provided an additional community benefit.
Certain mitigation techniques may not have the potential to fall into all of the four categories. For example, Flood Insurance would be a “Highly Effective, Recommended” technique for all flood-prone properties because it is one of the best methods for limiting economic damage due to flooding. Table 4 shows the potential buckets that each mitigation technique may fall into.
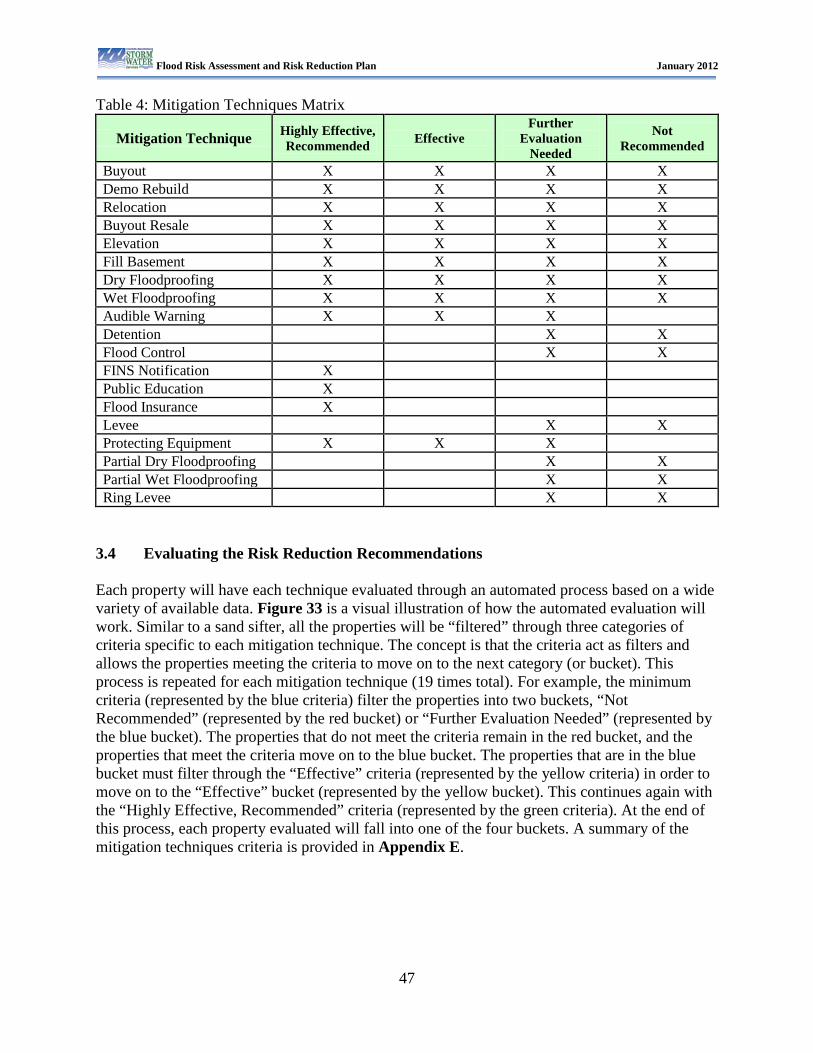
Flood Risk Assessment and Risk Reduction Plan January 2012
47
Table 4: Mitigation Techniques Matrix
Mitigation Technique Highly Effective, Recommended Effective
Further Evaluation
Needed
Not Recommended
Buyout X X X X Demo Rebuild X X X X Relocation X X X X Buyout Resale X X X X Elevation X X X X Fill Basement X X X X Dry Floodproofing X X X X Wet Floodproofing X X X X Audible Warning X X X Detention X X Flood Control X X FINS Notification X Public Education X Flood Insurance X Levee X X Protecting Equipment X X X Partial Dry Floodproofing X X Partial Wet Floodproofing X X Ring Levee X X
3.4 Evaluating the Risk Reduction Recommendations Each property will have each technique evaluated through an automated process based on a wide variety of available data. Figure 33 is a visual illustration of how the automated evaluation will work. Similar to a sand sifter, all the properties will be “filtered” through three categories of criteria specific to each mitigation technique. The concept is that the criteria act as filters and allows the properties meeting the criteria to move on to the next category (or bucket). This process is repeated for each mitigation technique (19 times total). For example, the minimum criteria (represented by the blue criteria) filter the properties into two buckets, “Not Recommended” (represented by the red bucket) or “Further Evaluation Needed” (represented by the blue bucket). The properties that do not meet the criteria remain in the red bucket, and the properties that meet the criteria move on to the blue bucket. The properties that are in the blue bucket must filter through the “Effective” criteria (represented by the yellow criteria) in order to move on to the “Effective” bucket (represented by the yellow bucket). This continues again with the “Highly Effective, Recommended” criteria (represented by the green criteria). At the end of this process, each property evaluated will fall into one of the four buckets. A summary of the mitigation techniques criteria is provided in Appendix E.
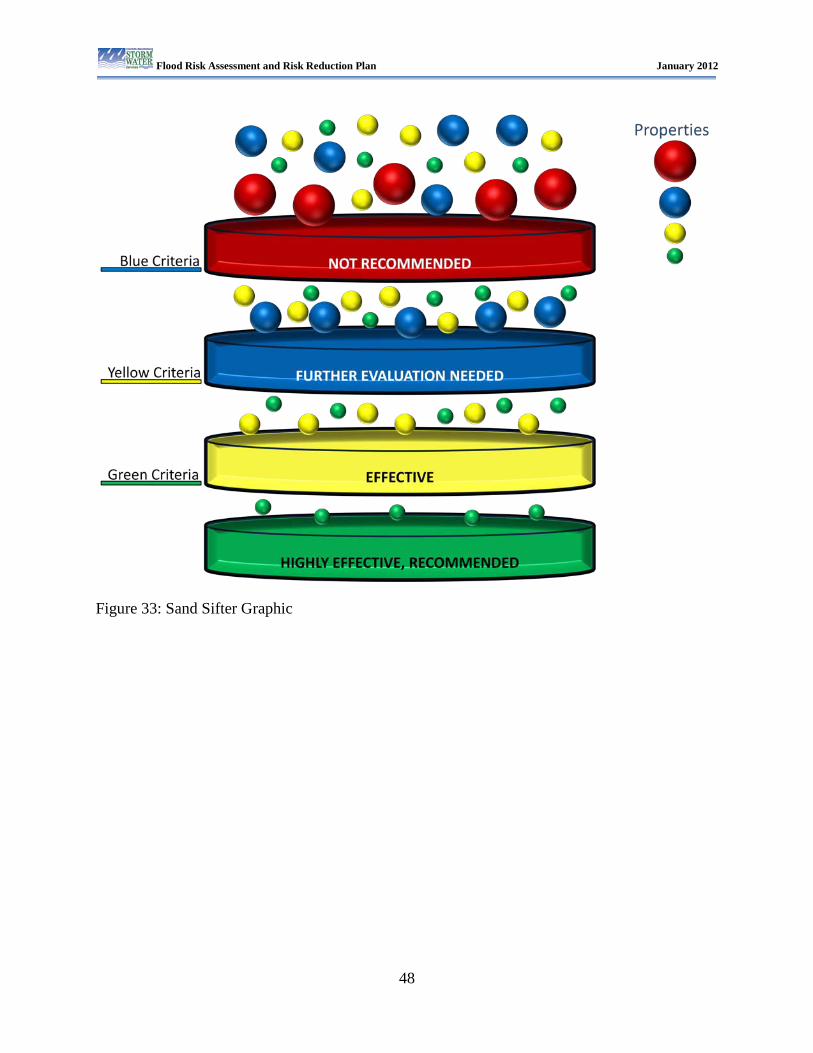
Flood Risk Assessment and Risk Reduction Plan January 2012
48
Figure 33: Sand Sifter Graphic
Flood Risk Assessment and Risk Reduction Plan January 2012
49
Section 4 Flood Mitigation Priority Scores
4.1 Purpose The purpose of developing Flood Mitigation Priority Scores is to account for: (1) other community-based benefits and (2) other factors not included in the Flood Risk Property Score. The Flood Mitigation Scoring System will be used to generate Flood Mitigation Property Scores and Flood Mitigation Project Scores. These scores will be used to prioritize individual properties and project areas. Prioritizing properties and projects will allow CMSWS various options when implementing capital improvement expenditures. 4.2 Flood Mitigation Scoring System The Flood Mitigation Scoring System consists of 13 priority factors. Some of these factors are scored based on certain techniques being deemed “Effective” or “Highly Effective,” while others are scored based on any technique. These factors and how they are scored are described in detail in the following sections. 4.2.1 Life and Human Safety The life and human safety factor is applicable if the mitigation technique eliminates or significantly reduces the potential for “residual risk" and potential emergency response services. The criterion for this factor consists of whether or not the recommended technique(s) involve(s) the permanent removal of a habitable structure from the flood hazard area. This factor is scored based on the following techniques being deemed “Effective” or “Highly Effective.”
• Property Acquisition and Structure Demolition • Property Acquisition and Structure Relocation • Property Acquisition, Demolition/Relocation, and Re-sale
4.2.2 Cost Effectiveness (Benefit-Cost Ratio) This factor addresses the cost effectiveness of a mitigation project, which is based on a Benefit-Cost Ratio (BCR). BCRs are commonly used to determine cost effectiveness by comparing estimated benefits and costs. A project is considered cost effective when the estimated benefits equal or exceed the estimated costs. This results in a BCR ≥ 1. FEMA’s Benefit-Cost Analysis (BCA) Tool will be used to generate BCRs for this factor. The BCA Tool was developed by FEMA to serve as the standard method to evaluate and quantify the cost effectiveness of mitigation projects submitted for funding assistance under its hazard mitigation grant programs. In addition to confirming the required cost effectiveness criteria of proposed projects are met, the BCA Tool affords FEMA the ability to compare the value of mitigation projects competing against each other and to determine which the best alternatives are from a fiscal standpoint.
Flood Risk Assessment and Risk Reduction Plan January 2012
50
The methodologies, standard values and calculations included in the BCA Tool are continuously improved through routine software re-engineering and are commonly recognized as the industry standard for evaluating cost-effectiveness for mitigation project across the United States. However, it is also commonly noted that the BCA Tool’s definition of benefits, which is limited to future losses prevented or reduced, is too narrow in scope and doesn’t take into account additional benefits to society that are often realized at the local community level. These additional benefits include but are not limited to the additional community-based benefits considered in this plan’s Flood Mitigation Scoring System (i.e., expanding or connecting publicly owned lands, greenway trails, sanitary sewer routes and water quality buffers). For this reason, CMSWS is limiting the emphasis and influence of the BCA Tool in its risk reduction recommendations and in the generation of Flood Mitigation Priority Scores. Under this factor, the BCA Tool will be used to estimate benefits (i.e., flood losses avoided) of a mitigation project. The benefits estimated by FEMA’s BCA software are based on FEMA’s standard values for project useful life and are expressed as the present value of the expected avoided damages after the mitigation technique is implemented. The total project cost will be estimated outside of the BCA Tool using the County’s tax data and building attribute information, in combination with cost assumptions. FEMA’s standard values for project useful life and a summary of the cost assumptions are provided in Appendix F. Points will be assigned based on the BCR generated using the estimated benefits and project costs as described above. A BCR ≥ 1.0 receives the highest number of points. A BCR ranging from 0.5 to 1.0 receives a mid-range point. A BCR < 0.5 receives no points. BCRs will be generated and scored for each property which has the following mitigation techniques deemed “Effective” or “Highly Effective.”
• Property Acquisition and Structure Demolition • Property Acquisition and Structure Relocation • Property Acquisition, Demolition/Relocation, and Re-sale • Structure Elevation • Dry Floodproofing of Structures • Wet Floodproofing of Structures
4.2.3 Proximity to Other Mitigation Projects This factor recognizes enhancements to coordination and the possibility of reduced costs for holistic neighborhood solutions. This factor also accounts for efforts to minimize “checkerboard” approaches to flood mitigation and efforts to maximize potential for grouped property projects. Essentially, points are awarded if the project is located within 1,000 feet of other previously implemented or planned mitigation projects and has the following techniques being deemed “Effective” or “Highly Effective.”
• Property Acquisition and Structure Demolition • Structure Demolition and Rebuild • Property Acquisition and Structure Relocation • Property Acquisition, Demolition/Relocation, and Re-sale
Flood Risk Assessment and Risk Reduction Plan January 2012
51
• Structure Elevation 4.2.4 Property Added To Flood Zone This factor addresses hardships caused by map changes to property owners who purchased a structure that was outside the mapped floodplain at the time of purchase. Points are awarded if the property is currently inside a mapped floodplain, but was not located in a mapped floodplain at the time of purchase by the current owner. This factor is scored based on any technique being deemed “Effective” or “Highly Effective.” 4.2.5 Repetitive Loss Structure This factor addresses recurring flood damages to insured structures. Properties are deemed Repetitive Loss (RL) or Severe Repetitive Loss (SRL) properties by FEMA based on the number and dollar amount of claims filed with the National Flood Insurance Program (NFIP). There is also a possibility that these structures may be eligible for multiple FEMA grant programs. Points are awarded if the structure is an SRL property, or an RL property. No points are awarded if the structure fails to meet one of these two criteria. This factor is scored based on any technique deemed “Effective” or “Highly Effective.” 4.2.6 Property Adjacent To Publicly Owned Land The purpose of this factor is to identify possible contiguous neighborhood project areas. Points are awarded if the property has at least one boundary in common with the property boundary of a parcel owned by a local, state, or Federal government entity. Since this factor involves creating contiguous neighborhood project areas, it is scored based on the following techniques being deemed “Effective” or “Highly Effective.”
• Property Acquisition and Structure Demolition • Property Acquisition and Structure Relocation • Property Acquisition, Demolition/Relocation, and Re-sale
4.2.7 Property Located On Five-Year Planned Greenway Trail This factor recognizes projects that achieve multiple community planning objectives and can maximize the use of funds by leveraging the project with another local government goal, in this case related to planned greenway trails. Points are awarded if the property is along stream sections which have been identified for a future greenway trail based on Park and Recreation’s five-year plan. This factor is scored based on the following techniques being deemed “Effective” or “Highly Effective.”
• Property Acquisition and Structure Demolition • Property Acquisition and Structure Relocation • Property Acquisition, Demolition/Relocation, and Re-sale
Flood Risk Assessment and Risk Reduction Plan January 2012
52
4.2.8 Property Located On Five-Year Planned Sanitary Sewer Route This factor recognizes projects that achieve multiple community planning objectives and can maximize the use of funds by leveraging the project with another local government goal, in this case related to planned sanitary sewer routes. Points are awarded if the property is along a planned sanitary sewer alignment. This factor is scored based on the following techniques being deemed “Effective” or “Highly Effective.”
• Property Acquisition and Structure Demolition • Property Acquisition and Structure Relocation • Property Acquisition, Demolition/Relocation, and Re-sale
4.2.9 Property Intersects With Water Quality Buffer This factor recognizes projects that would positively impact water quality. Points are awarded if the property intersects a water quality buffer as defined by local Water Quality Ordinances. This factor is scored based on the following techniques being deemed “Effective” or “Highly Effective.”
• Property Acquisition and Structure Demolition • Property Acquisition and Structure Relocation
4.2.10 Property Located in an Environmental Focus Area This factor recognizes projects that would positively impact water quality in one of the top ten (10) impacted watersheds, which are identified in the Water Quality Capital Improvement Project Watershed Ranking Protocol. Points are awarded if the property is located in one of these watersheds. This factor is scored based on the following techniques being deemed “Effective” or “Highly Effective.”
• Property Acquisition and Structure Demolition • Property Acquisition and Structure Relocation
4.2.11 Property Covered By NFIP Policy This factor credits property owners who have taken action to reduce financial risk by having an active flood insurance policy under the NFIP. There is also a possibility that these structures may be eligible for multiple FEMA grant programs. Points are awarded if the property address is included in FEMA's NFIP policy database. This factor is scored based on any technique deemed “Effective” or “Highly Effective.” 4.2.12 Historic Preservation and Cultural Asset Protection Points are awarded if the project achieves multiple community objectives by protecting or enhancing historic or cultural assets. This is determined by whether the property includes historic
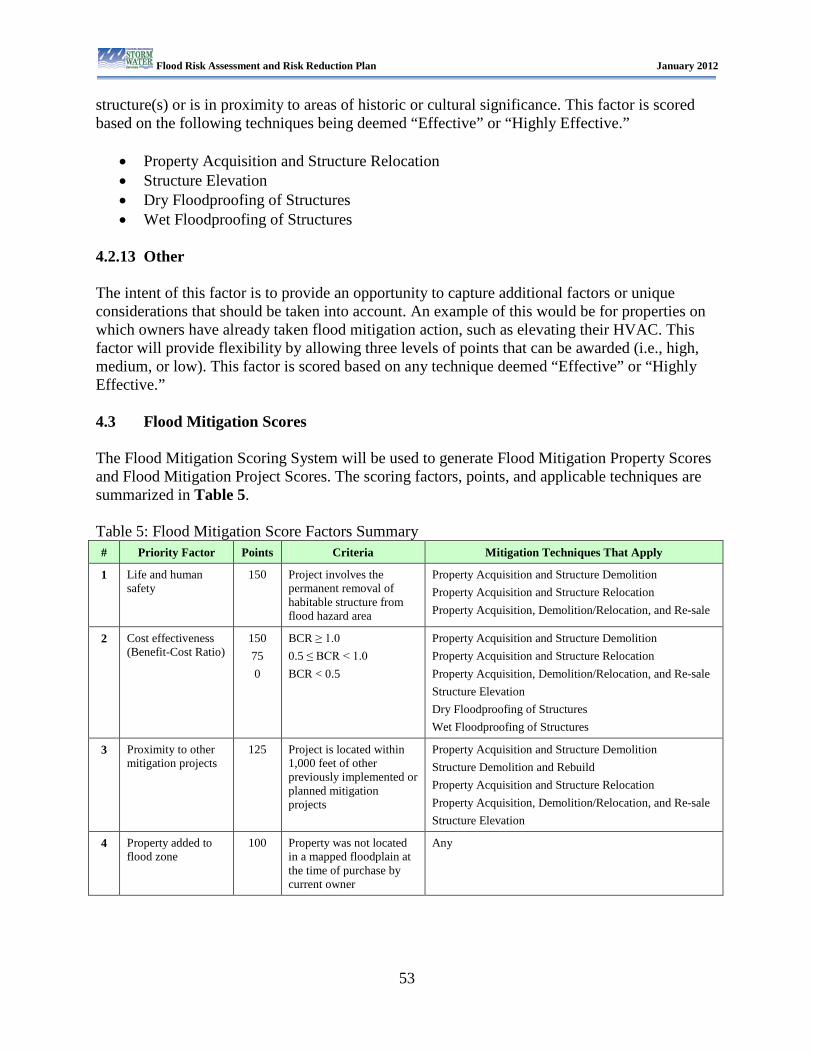
Flood Risk Assessment and Risk Reduction Plan January 2012
53
structure(s) or is in proximity to areas of historic or cultural significance. This factor is scored based on the following techniques being deemed “Effective” or “Highly Effective.”
• Property Acquisition and Structure Relocation • Structure Elevation • Dry Floodproofing of Structures • Wet Floodproofing of Structures
4.2.13 Other The intent of this factor is to provide an opportunity to capture additional factors or unique considerations that should be taken into account. An example of this would be for properties on which owners have already taken flood mitigation action, such as elevating their HVAC. This factor will provide flexibility by allowing three levels of points that can be awarded (i.e., high, medium, or low). This factor is scored based on any technique deemed “Effective” or “Highly Effective.” 4.3 Flood Mitigation Scores The Flood Mitigation Scoring System will be used to generate Flood Mitigation Property Scores and Flood Mitigation Project Scores. The scoring factors, points, and applicable techniques are summarized in Table 5. Table 5: Flood Mitigation Score Factors Summary # Priority Factor Points Criteria Mitigation Techniques That Apply
1 Life and human safety
150 Project involves the permanent removal of habitable structure from flood hazard area
Property Acquisition and Structure Demolition Property Acquisition and Structure Relocation Property Acquisition, Demolition/Relocation, and Re-sale
2 Cost effectiveness (Benefit-Cost Ratio)
150 75 0
BCR ≥ 1.0 0.5 ≤ BCR < 1.0 BCR < 0.5
Property Acquisition and Structure Demolition Property Acquisition and Structure Relocation Property Acquisition, Demolition/Relocation, and Re-sale Structure Elevation Dry Floodproofing of Structures Wet Floodproofing of Structures
3 Proximity to other mitigation projects
125 Project is located within 1,000 feet of other previously implemented or planned mitigation projects
Property Acquisition and Structure Demolition Structure Demolition and Rebuild Property Acquisition and Structure Relocation Property Acquisition, Demolition/Relocation, and Re-sale Structure Elevation
4 Property added to flood zone
100 Property was not located in a mapped floodplain at the time of purchase by current owner
Any
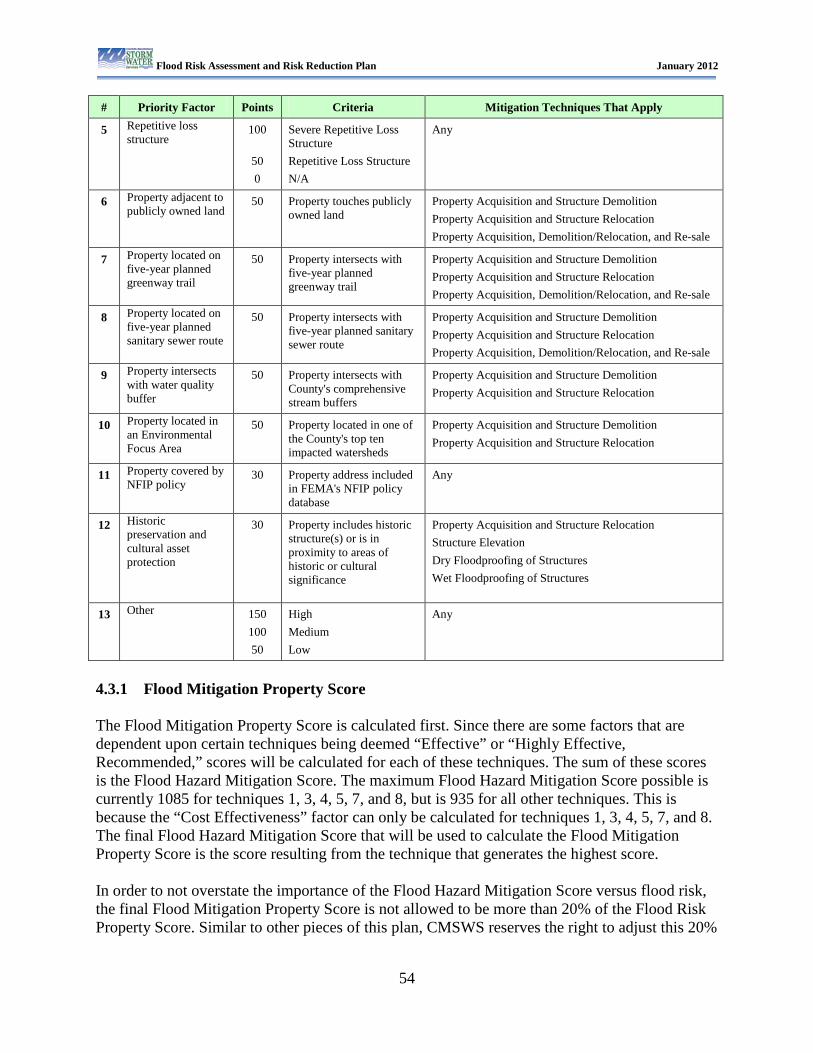
Flood Risk Assessment and Risk Reduction Plan January 2012
54
# Priority Factor Points Criteria Mitigation Techniques That Apply
5 Repetitive loss structure
100
50 0
Severe Repetitive Loss Structure Repetitive Loss Structure N/A
Any
6 Property adjacent to publicly owned land
50 Property touches publicly owned land
Property Acquisition and Structure Demolition Property Acquisition and Structure Relocation Property Acquisition, Demolition/Relocation, and Re-sale
7 Property located on five-year planned greenway trail
50 Property intersects with five-year planned greenway trail
Property Acquisition and Structure Demolition Property Acquisition and Structure Relocation Property Acquisition, Demolition/Relocation, and Re-sale
8 Property located on five-year planned sanitary sewer route
50 Property intersects with five-year planned sanitary sewer route
Property Acquisition and Structure Demolition Property Acquisition and Structure Relocation Property Acquisition, Demolition/Relocation, and Re-sale
9 Property intersects with water quality buffer
50 Property intersects with County's comprehensive stream buffers
Property Acquisition and Structure Demolition Property Acquisition and Structure Relocation
10 Property located in an Environmental Focus Area
50 Property located in one of the County's top ten impacted watersheds
Property Acquisition and Structure Demolition Property Acquisition and Structure Relocation
11 Property covered by NFIP policy
30 Property address included in FEMA's NFIP policy database
Any
12 Historic preservation and cultural asset protection
30 Property includes historic structure(s) or is in proximity to areas of historic or cultural significance
Property Acquisition and Structure Relocation Structure Elevation Dry Floodproofing of Structures Wet Floodproofing of Structures
13 Other 150 100 50
High Medium Low
Any
4.3.1 Flood Mitigation Property Score The Flood Mitigation Property Score is calculated first. Since there are some factors that are dependent upon certain techniques being deemed “Effective” or “Highly Effective, Recommended,” scores will be calculated for each of these techniques. The sum of these scores is the Flood Hazard Mitigation Score. The maximum Flood Hazard Mitigation Score possible is currently 1085 for techniques 1, 3, 4, 5, 7, and 8, but is 935 for all other techniques. This is because the “Cost Effectiveness” factor can only be calculated for techniques 1, 3, 4, 5, 7, and 8. The final Flood Hazard Mitigation Score that will be used to calculate the Flood Mitigation Property Score is the score resulting from the technique that generates the highest score. In order to not overstate the importance of the Flood Hazard Mitigation Score versus flood risk, the final Flood Mitigation Property Score is not allowed to be more than 20% of the Flood Risk Property Score. Similar to other pieces of this plan, CMSWS reserves the right to adjust this 20%
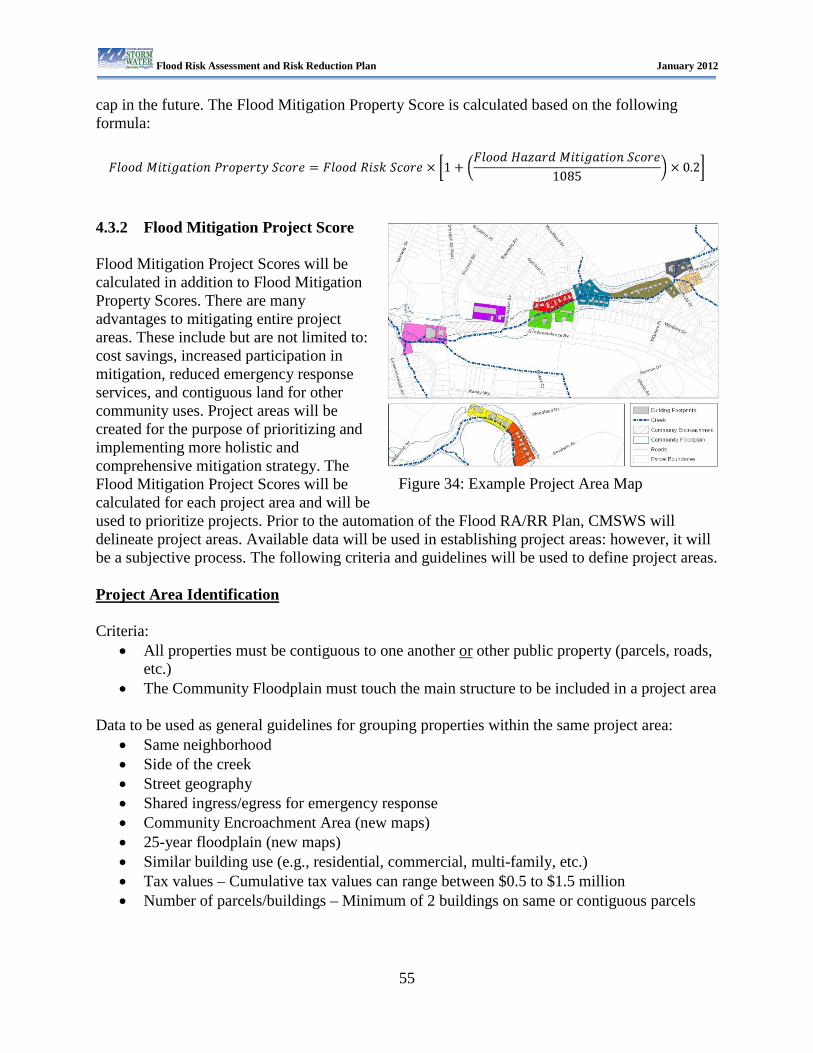
Flood Risk Assessment and Risk Reduction Plan January 2012
55
cap in the future. The Flood Mitigation Property Score is calculated based on the following formula:
4.3.2 Flood Mitigation Project Score Flood Mitigation Project Scores will be calculated in addition to Flood Mitigation Property Scores. There are many advantages to mitigating entire project areas. These include but are not limited to: cost savings, increased participation in mitigation, reduced emergency response services, and contiguous land for other community uses. Project areas will be created for the purpose of prioritizing and implementing more holistic and comprehensive mitigation strategy. The Flood Mitigation Project Scores will be calculated for each project area and will be used to prioritize projects. Prior to the automation of the Flood RA/RR Plan, CMSWS will delineate project areas. Available data will be used in establishing project areas: however, it will be a subjective process. The following criteria and guidelines will be used to define project areas. Project Area Identification Criteria:
• All properties must be contiguous to one another or other public property (parcels, roads, etc.)
• The Community Floodplain must touch the main structure to be included in a project area Data to be used as general guidelines for grouping properties within the same project area:
• Same neighborhood • Side of the creek • Street geography • Shared ingress/egress for emergency response • Community Encroachment Area (new maps) • 25-year floodplain (new maps) • Similar building use (e.g., residential, commercial, multi-family, etc.) • Tax values – Cumulative tax values can range between $0.5 to $1.5 million • Number of parcels/buildings – Minimum of 2 buildings on same or contiguous parcels
Figure 34: Example Project Area Map

Flood Risk Assessment and Risk Reduction Plan January 2012
56
Upon implementation, multiple project areas could be combined based on budget and potential to benefit additional properties. Project areas will be refined and adjusted if necessary to account for the following:
• Similar recommended mitigation techniques that would be relevant to defining project areas. These include:
o Property Acquisition and Structure Demolition o Structure Demolition and Rebuild o Property Acquisition and Structure Relocation o Property Acquisition, Demolition/Relocation, and Resale o Structure Elevation o Storm Water Detention Facilities o Storm Water System Control o Levee/Floodwall Protection for Multiple Structures
• Flood Risk Property Scores • Benefit-Cost Data • High velocity Zones
Flood Mitigation Project Scores will be determined by averaging the Flood Mitigation Property Scores in the project area.
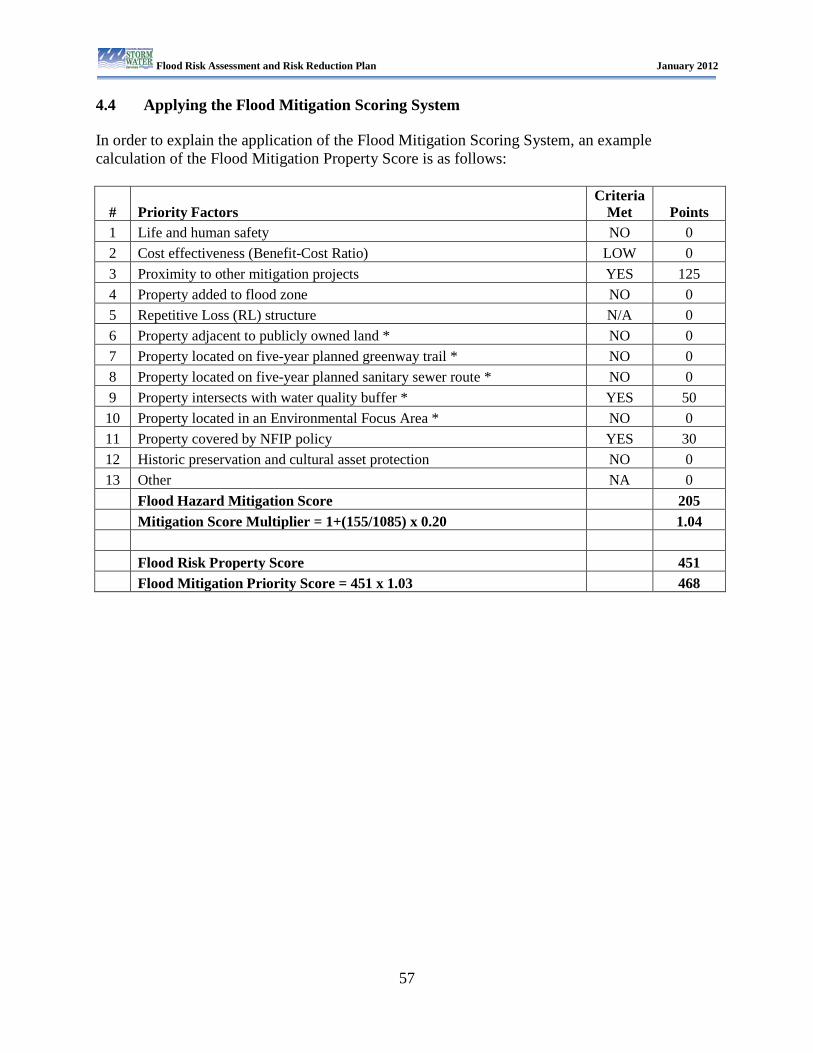
Flood Risk Assessment and Risk Reduction Plan January 2012
57
4.4 Applying the Flood Mitigation Scoring System In order to explain the application of the Flood Mitigation Scoring System, an example calculation of the Flood Mitigation Property Score is as follows:
# Priority Factors Criteria
Met Points 1 Life and human safety NO 0 2 Cost effectiveness (Benefit-Cost Ratio) LOW 0 3 Proximity to other mitigation projects YES 125 4 Property added to flood zone NO 0 5 Repetitive Loss (RL) structure N/A 0 6 Property adjacent to publicly owned land * NO 0 7 Property located on five-year planned greenway trail * NO 0 8 Property located on five-year planned sanitary sewer route * NO 0 9 Property intersects with water quality buffer * YES 50
10 Property located in an Environmental Focus Area * NO 0 11 Property covered by NFIP policy YES 30 12 Historic preservation and cultural asset protection NO 0 13 Other NA 0
Flood Hazard Mitigation Score 205 Mitigation Score Multiplier = 1+(155/1085) x 0.20 1.04
Flood Risk Property Score 451 Flood Mitigation Priority Score = 451 x 1.03 468
Flood Risk Assessment and Risk Reduction Plan January 2012
58
Section 5 Planning Process
5.1 Background The process for developing the Flood RA/RR Plan began in 2009. It involved layers of review, assessment, and recommendations from a variety of sources. This multi-disciplinary approach was intended to broaden the perspective for the development of flood hazard mitigation strategies in Mecklenburg County. This approach included contributions by people with extensive flood mitigation experience and people with limited flood mitigation experience but extensive experience in other areas such as water quality and engineering. The staff involvement included CMSWS employees at various levels: project managers, supervisors, and a division manager. The final source of information included people from other areas that impact the floodplains such as park and recreation, utilities, and schools. The process followed to develop this plan consisted of two phases. Phase I focused on developing a framework for the approach and Phase II focused on refining, finalizing, and applying the approach. 5.2 Phase I: Develop Framework The first phase of this effort was to develop the framework for the approach and methodologies to be applied. Phase I tasks included assessing the flood risk by identifying the flooding circumstances that warrant increased mitigation effort, determining the flood mitigation techniques and strategies (both public and private mitigation actions) that are most effective in Mecklenburg County at reducing the flood risk, and developing criteria for applying the mitigation actions on a parcel or building level. Using a handyman analogy, Phase I of the update loaded the toolbox with the tools to complete the work, and provided the instruction books for which tools to use under which circumstances. The effectiveness of potential mitigation strategies were evaluated for use in Mecklenburg County. Selection criteria were developed to determine the flood mitigation techniques that provide the best results for a particular flood-prone property. 5.3 Phase II: Refine, Finalize, and Apply Methods The second phase consisted of refining, finalizing, and applying the methods in Phase I. CMSWS worked with an experienced consultant (AECOM) to run a pilot study to refine and finalize the methodologies developed in Phase I. In addition to the pilot study, a Citizen Review Committee was established to assist in the review and improvement of the plan (see Section 5.4). Upon validating the results from the pilot study, the next step is to develop an automated tool that will apply the methodologies and criteria to recommend risk reduction actions and prioritize and guide CMSWS Capital Improvement expenditures into the future. This automated tool will allow CMSWS to update the Flood RA/RR Plan on a continual basis when new data becomes available.
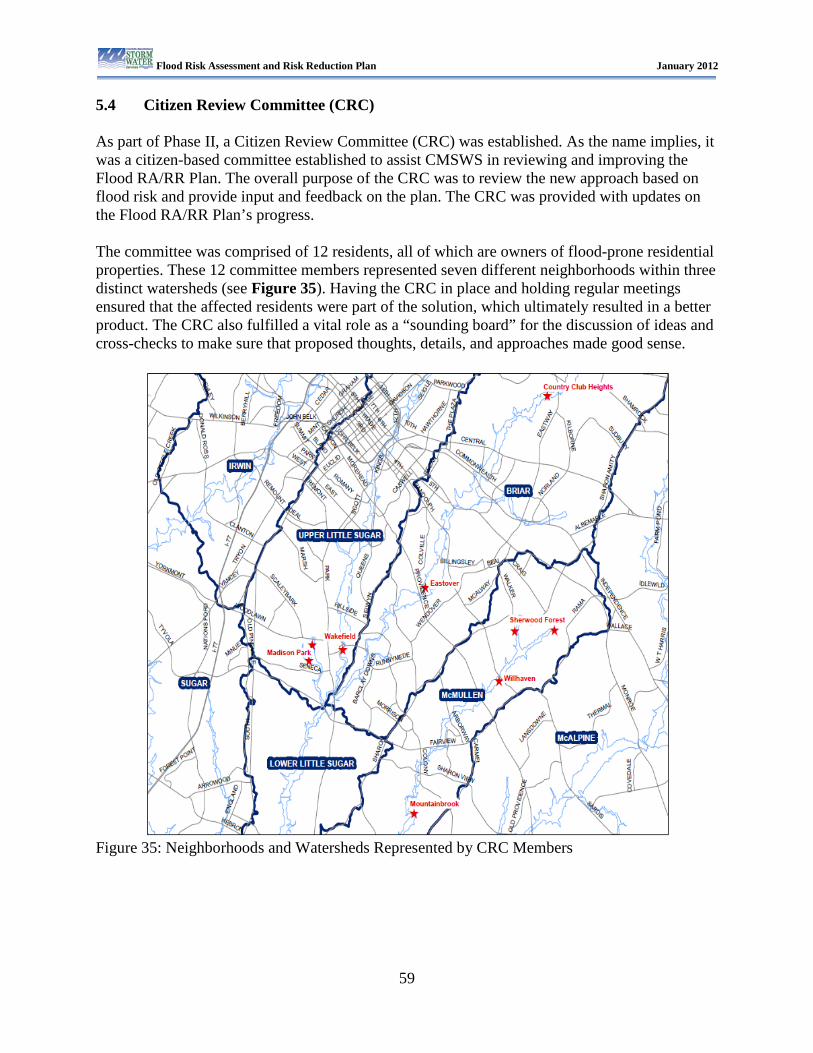
Flood Risk Assessment and Risk Reduction Plan January 2012
59
5.4 Citizen Review Committee (CRC) As part of Phase II, a Citizen Review Committee (CRC) was established. As the name implies, it was a citizen-based committee established to assist CMSWS in reviewing and improving the Flood RA/RR Plan. The overall purpose of the CRC was to review the new approach based on flood risk and provide input and feedback on the plan. The CRC was provided with updates on the Flood RA/RR Plan’s progress. The committee was comprised of 12 residents, all of which are owners of flood-prone residential properties. These 12 committee members represented seven different neighborhoods within three distinct watersheds (see Figure 35). Having the CRC in place and holding regular meetings ensured that the affected residents were part of the solution, which ultimately resulted in a better product. The CRC also fulfilled a vital role as a “sounding board” for the discussion of ideas and cross-checks to make sure that proposed thoughts, details, and approaches made good sense.
Figure 35: Neighborhoods and Watersheds Represented by CRC Members
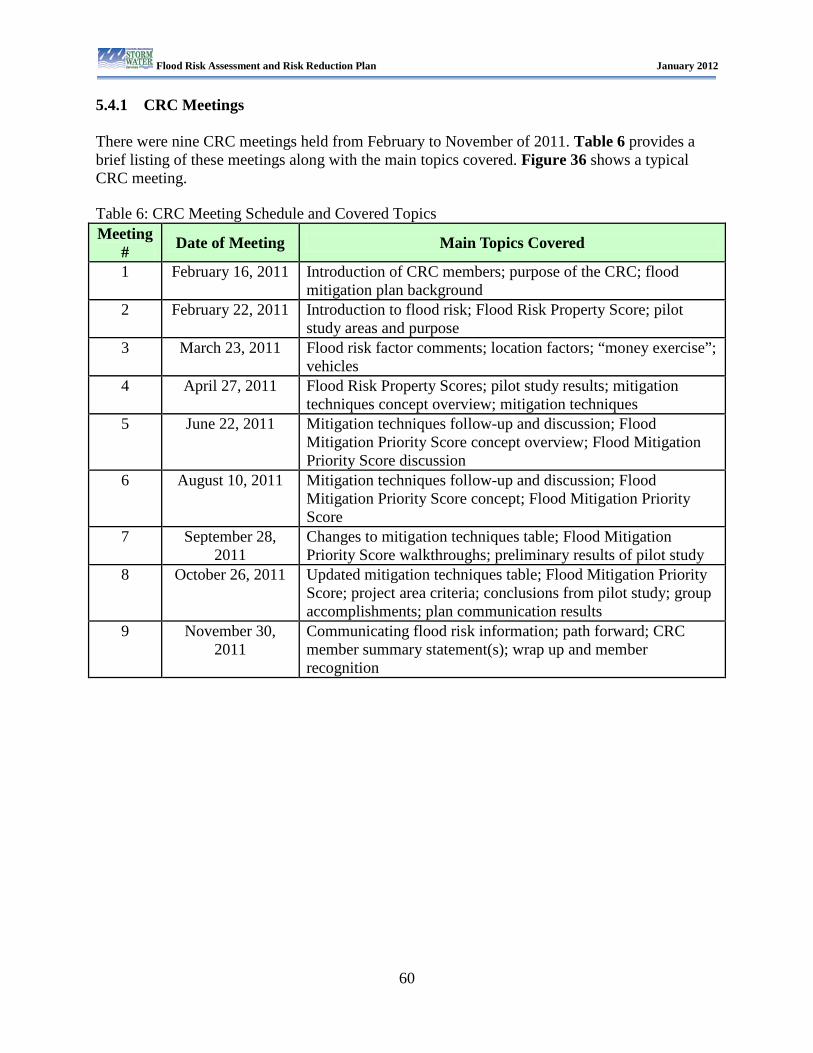
Flood Risk Assessment and Risk Reduction Plan January 2012
60
5.4.1 CRC Meetings There were nine CRC meetings held from February to November of 2011. Table 6 provides a brief listing of these meetings along with the main topics covered. Figure 36 shows a typical CRC meeting. Table 6: CRC Meeting Schedule and Covered Topics Meeting
# Date of Meeting Main Topics Covered
1 February 16, 2011 Introduction of CRC members; purpose of the CRC; flood mitigation plan background
2 February 22, 2011 Introduction to flood risk; Flood Risk Property Score; pilot study areas and purpose
3 March 23, 2011 Flood risk factor comments; location factors; “money exercise”; vehicles
4 April 27, 2011 Flood Risk Property Scores; pilot study results; mitigation techniques concept overview; mitigation techniques
5 June 22, 2011 Mitigation techniques follow-up and discussion; Flood Mitigation Priority Score concept overview; Flood Mitigation Priority Score discussion
6 August 10, 2011 Mitigation techniques follow-up and discussion; Flood Mitigation Priority Score concept; Flood Mitigation Priority Score
7 September 28, 2011
Changes to mitigation techniques table; Flood Mitigation Priority Score walkthroughs; preliminary results of pilot study
8 October 26, 2011 Updated mitigation techniques table; Flood Mitigation Priority Score; project area criteria; conclusions from pilot study; group accomplishments; plan communication results
9 November 30, 2011
Communicating flood risk information; path forward; CRC member summary statement(s); wrap up and member recognition
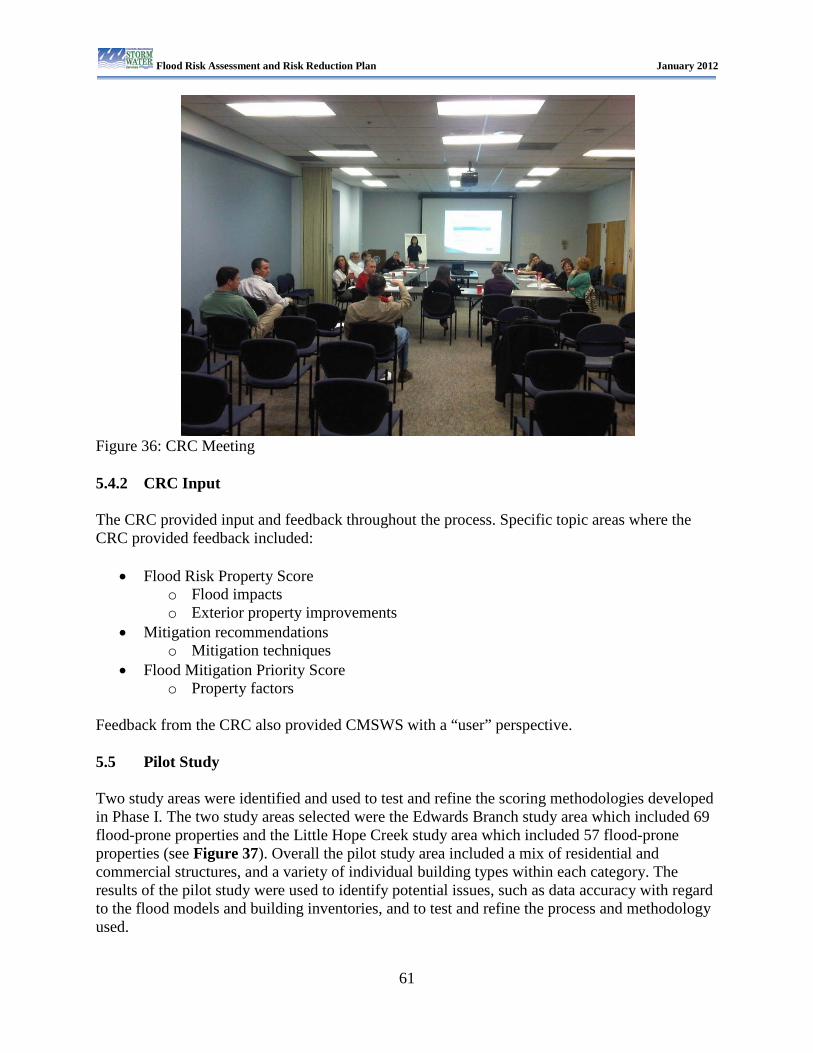
Flood Risk Assessment and Risk Reduction Plan January 2012
61
Figure 36: CRC Meeting 5.4.2 CRC Input The CRC provided input and feedback throughout the process. Specific topic areas where the CRC provided feedback included:
• Flood Risk Property Score o Flood impacts o Exterior property improvements
• Mitigation recommendations o Mitigation techniques
• Flood Mitigation Priority Score o Property factors
Feedback from the CRC also provided CMSWS with a “user” perspective. 5.5 Pilot Study Two study areas were identified and used to test and refine the scoring methodologies developed in Phase I. The two study areas selected were the Edwards Branch study area which included 69 flood-prone properties and the Little Hope Creek study area which included 57 flood-prone properties (see Figure 37). Overall the pilot study area included a mix of residential and commercial structures, and a variety of individual building types within each category. The results of the pilot study were used to identify potential issues, such as data accuracy with regard to the flood models and building inventories, and to test and refine the process and methodology used.
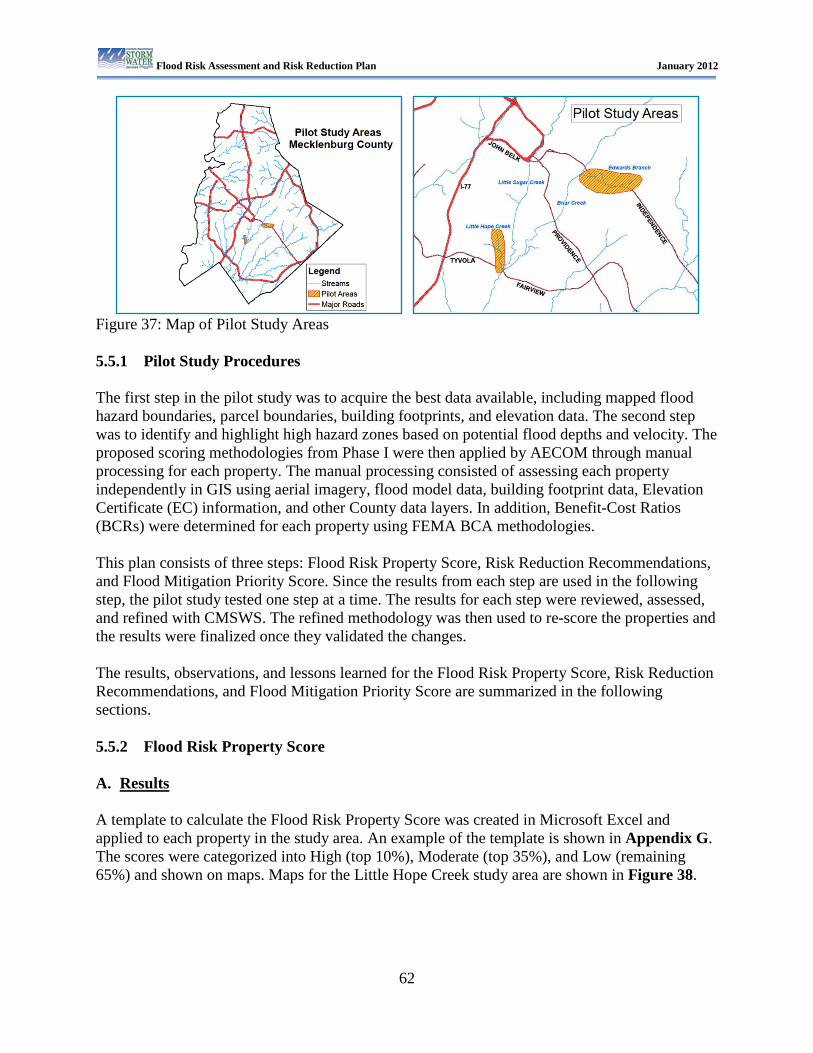
Flood Risk Assessment and Risk Reduction Plan January 2012
62
Figure 37: Map of Pilot Study Areas 5.5.1 Pilot Study Procedures The first step in the pilot study was to acquire the best data available, including mapped flood hazard boundaries, parcel boundaries, building footprints, and elevation data. The second step was to identify and highlight high hazard zones based on potential flood depths and velocity. The proposed scoring methodologies from Phase I were then applied by AECOM through manual processing for each property. The manual processing consisted of assessing each property independently in GIS using aerial imagery, flood model data, building footprint data, Elevation Certificate (EC) information, and other County data layers. In addition, Benefit-Cost Ratios (BCRs) were determined for each property using FEMA BCA methodologies. This plan consists of three steps: Flood Risk Property Score, Risk Reduction Recommendations, and Flood Mitigation Priority Score. Since the results from each step are used in the following step, the pilot study tested one step at a time. The results for each step were reviewed, assessed, and refined with CMSWS. The refined methodology was then used to re-score the properties and the results were finalized once they validated the changes. The results, observations, and lessons learned for the Flood Risk Property Score, Risk Reduction Recommendations, and Flood Mitigation Priority Score are summarized in the following sections. 5.5.2 Flood Risk Property Score A. Results A template to calculate the Flood Risk Property Score was created in Microsoft Excel and applied to each property in the study area. An example of the template is shown in Appendix G. The scores were categorized into High (top 10%), Moderate (top 35%), and Low (remaining 65%) and shown on maps. Maps for the Little Hope Creek study area are shown in Figure 38.
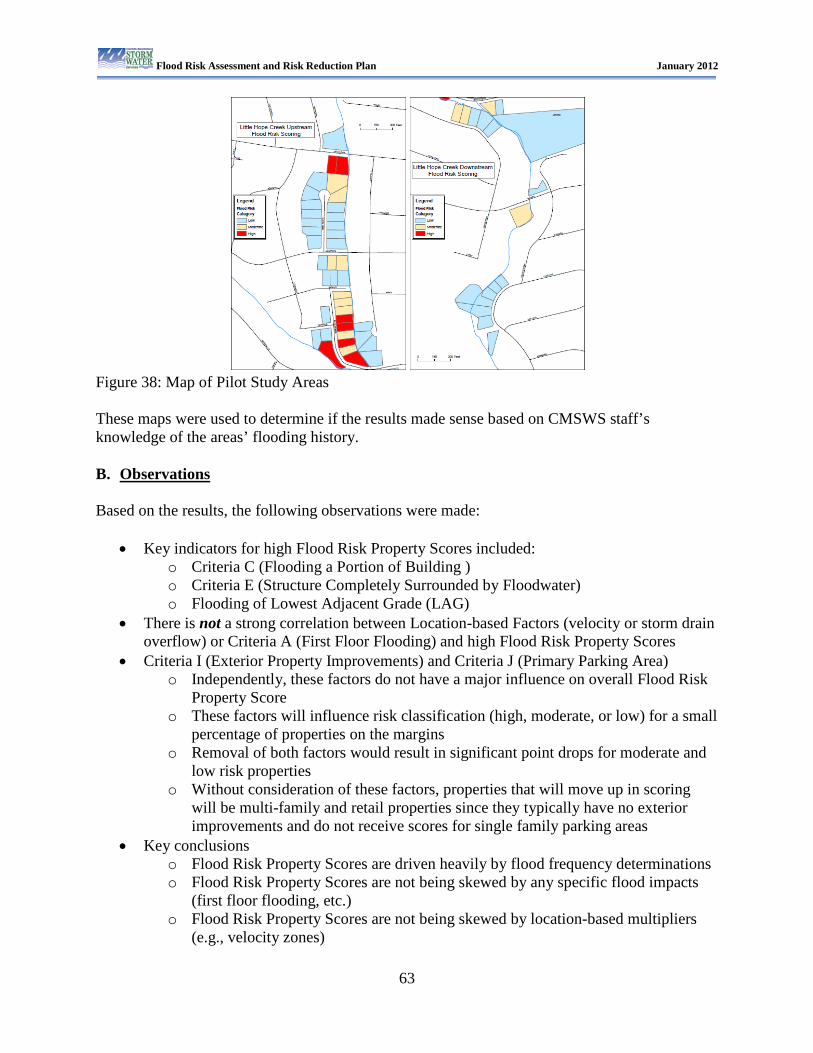
Flood Risk Assessment and Risk Reduction Plan January 2012
63
Figure 38: Map of Pilot Study Areas These maps were used to determine if the results made sense based on CMSWS staff’s knowledge of the areas’ flooding history. B. Observations Based on the results, the following observations were made:
• Key indicators for high Flood Risk Property Scores included: o Criteria C (Flooding a Portion of Building ) o Criteria E (Structure Completely Surrounded by Floodwater) o Flooding of Lowest Adjacent Grade (LAG)
• There is not a strong correlation between Location-based Factors (velocity or storm drain overflow) or Criteria A (First Floor Flooding) and high Flood Risk Property Scores
• Criteria I (Exterior Property Improvements) and Criteria J (Primary Parking Area) o Independently, these factors do not have a major influence on overall Flood Risk
Property Score o These factors will influence risk classification (high, moderate, or low) for a small
percentage of properties on the margins o Removal of both factors would result in significant point drops for moderate and
low risk properties o Without consideration of these factors, properties that will move up in scoring
will be multi-family and retail properties since they typically have no exterior improvements and do not receive scores for single family parking areas
• Key conclusions o Flood Risk Property Scores are driven heavily by flood frequency determinations o Flood Risk Property Scores are not being skewed by any specific flood impacts
(first floor flooding, etc.) o Flood Risk Property Scores are not being skewed by location-based multipliers
(e.g., velocity zones)
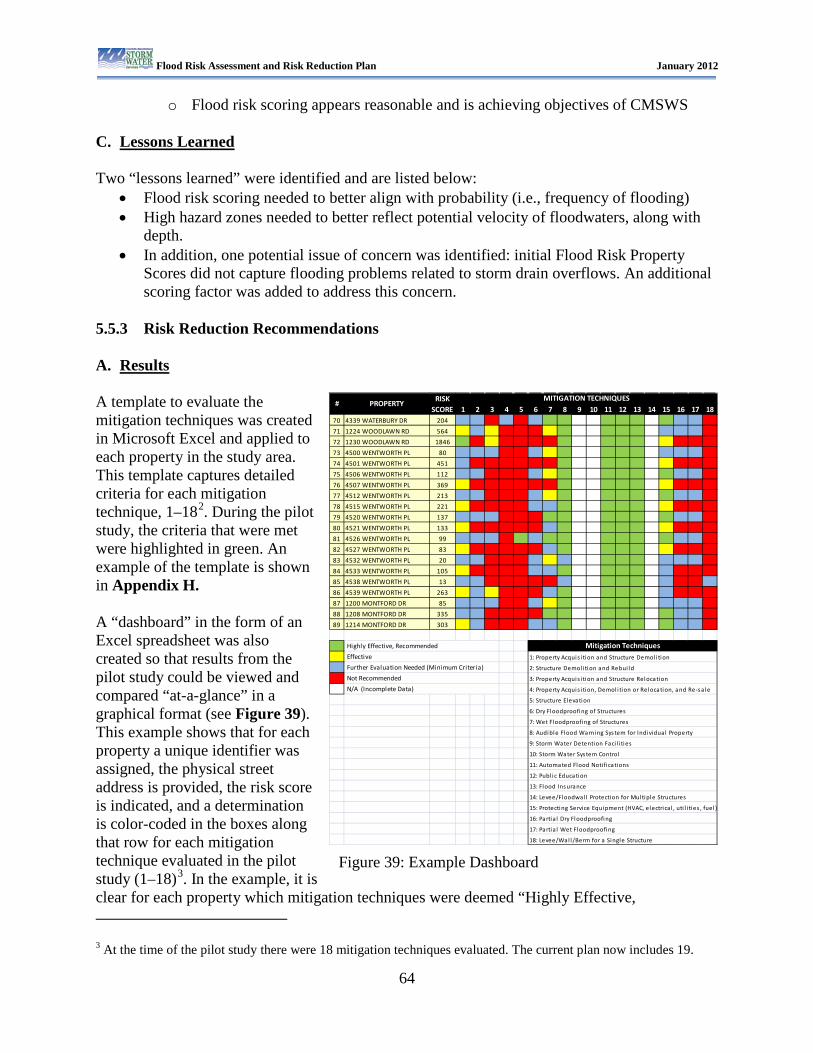
Flood Risk Assessment and Risk Reduction Plan January 2012
64
o Flood risk scoring appears reasonable and is achieving objectives of CMSWS C. Lessons Learned Two “lessons learned” were identified and are listed below:
• Flood risk scoring needed to better align with probability (i.e., frequency of flooding) • High hazard zones needed to better reflect potential velocity of floodwaters, along with
depth. • In addition, one potential issue of concern was identified: initial Flood Risk Property
Scores did not capture flooding problems related to storm drain overflows. An additional scoring factor was added to address this concern.
5.5.3 Risk Reduction Recommendations A. Results A template to evaluate the mitigation techniques was created in Microsoft Excel and applied to each property in the study area. This template captures detailed criteria for each mitigation technique, 1–182
. During the pilot study, the criteria that were met were highlighted in green. An example of the template is shown in Appendix H.
A “dashboard” in the form of an Excel spreadsheet was also created so that results from the pilot study could be viewed and compared “at-a-glance” in a graphical format (see Figure 39). This example shows that for each property a unique identifier was assigned, the physical street address is provided, the risk score is indicated, and a determination is color-coded in the boxes along that row for each mitigation technique evaluated in the pilot study (1–18)3
3 At the time of the pilot study there were 18 mitigation techniques evaluated. The current plan now includes 19.
. In the example, it is clear for each property which mitigation techniques were deemed “Highly Effective,
1 2 3 4 5 6 7 8 9 10 11 12 13 14 15 16 17 1870 4339 WATERBURY DR 204
71 1224 WOODLAWN RD 564
72 1230 WOODLAWN RD 1846
73 4500 WENTWORTH PL 80
74 4501 WENTWORTH PL 451
75 4506 WENTWORTH PL 112
76 4507 WENTWORTH PL 369
77 4512 WENTWORTH PL 213
78 4515 WENTWORTH PL 221
79 4520 WENTWORTH PL 137
80 4521 WENTWORTH PL 133
81 4526 WENTWORTH PL 99
82 4527 WENTWORTH PL 83
83 4532 WENTWORTH PL 20
84 4533 WENTWORTH PL 105
85 4538 WENTWORTH PL 13
86 4539 WENTWORTH PL 263
87 1200 MONTFORD DR 85
88 1208 MONTFORD DR 335
89 1214 MONTFORD DR 303
14: Levee/Floodwal l Protection for Multiple Structures
15: Protecting Service Equipment (HVAC, electrica l , uti l i ties , fuel )
16: Partia l Dry Floodproofing
17: Partia l Wet Floodproofing
18: Levee/Wal l/Berm for a Single Structure
12: Publ ic Education
13: Flood Insurance
Effective
Further Evaluation Needed (Minimum Criteria)
Not Recommended
8: Audible Flood Warning System for Individual Property
2: Structure Demol i tion and Rebui ld
3: Property Acquis i tion and Structure Relocation
4: Property Acquis i tion, Demol i tion or Relocation, and Re-sa le
5: Structure Elevation
6: Dry Floodproofing of Structures
7: Wet Floodproofing of Structures
1: Property Acquis i tion and Structure Demol i tion
N/A (Incomplete Data)
Mitigation Techniques Highly Effective, Recommended
9: Storm Water Detention Faci l i ties
10: Storm Water System Control
11: Automated Flood Noti fications
MITIGATION TECHNIQUESPROPERTY#
RISK SCORE
Figure 39: Example Dashboard
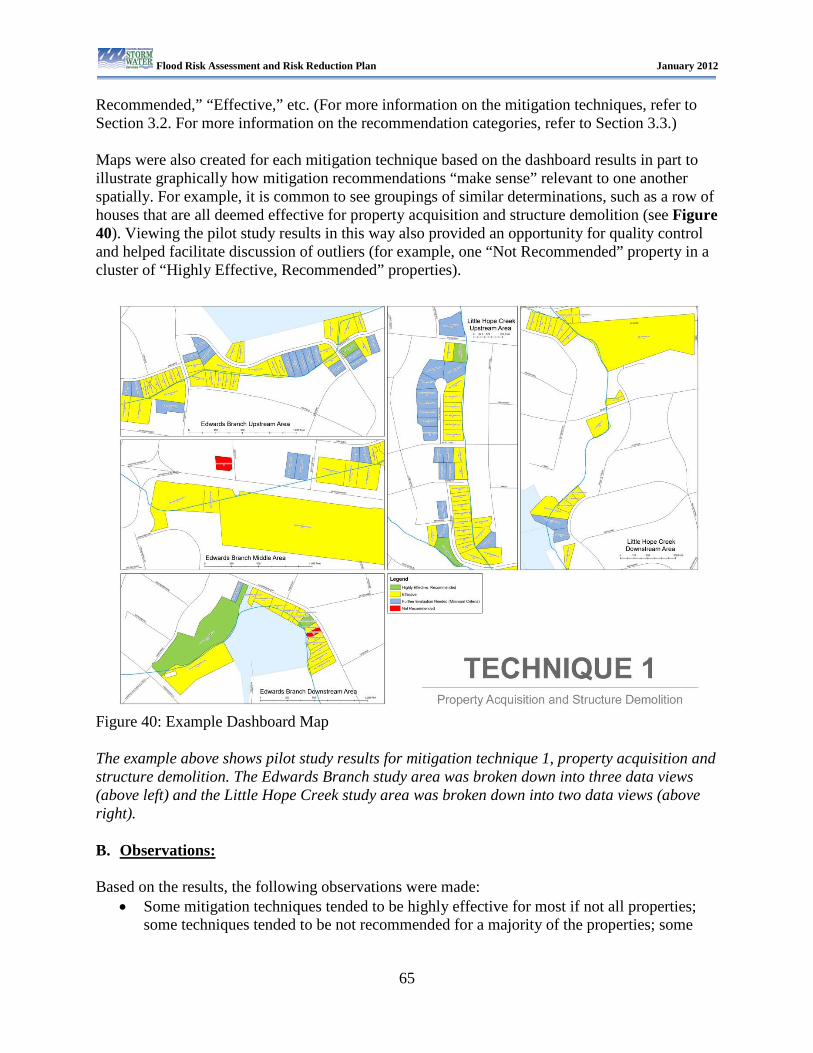
Flood Risk Assessment and Risk Reduction Plan January 2012
65
Recommended,” “Effective,” etc. (For more information on the mitigation techniques, refer to Section 3.2. For more information on the recommendation categories, refer to Section 3.3.) Maps were also created for each mitigation technique based on the dashboard results in part to illustrate graphically how mitigation recommendations “make sense” relevant to one another spatially. For example, it is common to see groupings of similar determinations, such as a row of houses that are all deemed effective for property acquisition and structure demolition (see Figure 40). Viewing the pilot study results in this way also provided an opportunity for quality control and helped facilitate discussion of outliers (for example, one “Not Recommended” property in a cluster of “Highly Effective, Recommended” properties).
Figure 40: Example Dashboard Map The example above shows pilot study results for mitigation technique 1, property acquisition and structure demolition. The Edwards Branch study area was broken down into three data views (above left) and the Little Hope Creek study area was broken down into two data views (above right). B. Observations: Based on the results, the following observations were made:
• Some mitigation techniques tended to be highly effective for most if not all properties; some techniques tended to be not recommended for a majority of the properties; some
Flood Risk Assessment and Risk Reduction Plan January 2012
66
techniques varied widely based on the physical and programmatic characteristics of the property in question
• The location of the structure (and sometimes the exact location of the structure on the parcel) can have a unique bearing on different mitigation techniques
o For example, the structure’s relationship to the floodplain, floodway, high velocity flood zones, water quality buffers, other publicly owned land, etc.
• Physical characteristics of the structure’s construction can have a unique bearing on different mitigation techniques
o For example, foundation type, wall type, building square footage, current elevation (and elevation of individual building components), etc.
• For many mitigation techniques, the presence of a basement (or details regarding the basement) is a key factor
o Does the structure have a basement o Does the structure have a finished basement
C. Lessons Learned The mitigation techniques criteria were revised numerous times to ensure the recommended techniques were appropriate for the properties in the pilot study. Five techniques were added during the pilot study, which are as follows:
• Protecting Service Equipment—Reduces flood risk to service equipment such as HVAC, electrical, mechanical, etc.
• Partial Dry Floodproofing—Reduces flood risk by protecting structures from smaller, more frequent flood events.
• Partial Wet Floodproofing—Reduces flood risk by protecting structures from smaller, more frequent flood events.
• Levee/Wall/Berm for a Single Structure—Reduces flood risk by protecting structures from smaller, more frequent flood events.
• Abandon Basement and Fill—This is an effective technique that is used in other parts of the country. It is not described in any of the other techniques.
5.4.5 Flood Mitigation Priority Score A. Results A template to calculate the Flood Risk Property Score was created in Excel and applied to each property in the study area. An example of the template is shown in Appendix I. The scores were categorized into High (top 10%), Moderate (top 35%), and Low (remaining 65%) and were compared to the Flood Risk Property Score. This was done to determine how much movement occurred in the results. The goal was to cap the mitigation multiplier such that it did not move a low risk property into the high risk category. Flood Mitigation Priority Scores were calculated using a 20%, 30%, 40%, and 50% cap. The properties were prioritized from highest to lowest based on the Flood Risk Property Score and the Flood Mitigation Priority Scores for each of the caps.
Flood Risk Assessment and Risk Reduction Plan January 2012
67
B. Observations One observation on the scoring factors was on the criteria for the factor, “Proximity to other mitigation projects.” This criterion was originally set at 2,000 feet. This was plotted on a map and was determined to be too large because it did not meet the purpose of the factor. Based on the map, this criterion was reduced to 1,000 feet. Another observation was on the mitigation multiplier. This was set at 20% based on how much properties moved up or down the list. Due to the size of the pilot study, this percentage will be re-evaluated when the plan is automated and scores are generated for all flood-prone properties in the county. CMSWS will have the ability to evaluate and adjust this cap in the future to ensure that the intent of the Flood Mitigation Priority Score is met. C. Lessons Learned Lessons learned included the following:
• Flood Mitigation Priority Scores should not be allowed to overinflate the property’s overall score. For the pilot study, setting the cap at 20% of the Flood Risk Property Score met this purpose. It should be noted that this cap need to be monitored and adjusted in the future.
• Care needed to be taken to ensure that the criteria for the Flood Mitigation Priority Score was fair, but did not create a situation where a low risk property became a high priority property. Several iterations of the pilot study mitigation scoring were completed using variations of the criteria to determine the appropriate combination of criteria and thresholds to achieve an appropriate Flood Mitigation Priority Score.
• In general, the flood mitigation scoring evolved throughout the pilot study process as factors and concepts were refined based on input from the CRC, AECOM, and CMSWS.
Flood Risk Assessment and Risk Reduction Plan January 2012
68
Section 6 Plan Maintenance
6.1 Plan Monitoring and Maintenance One of the key features of this plan is that the results will reside in a digital environment. This will significantly extend the longevity and useful life of the Flood RA/RR Plan. The fundamental concepts contained within this plan document will continue to serve as the foundation of the plan, while the property specific plan results will change over time. These results, such as Flood Risk Property Scores, Risk Reduction Recommendations, and Flood Mitigation Priority Scores will be updated under two main circumstances:
1. Data changes or corrections to the supporting information occur that could result in changes to the property specific plan results.
2. Adjustments to computations are deemed necessary by staff to provide more accurate results.
A. Data Changes or Corrections Each time data that feeds into the plan is changed or corrected, the property specific plan results could change. Appendix B contains data maintenance information for the major datasets utilized by this plan. The overall intent is for the plan to be a living, digital process and as such data and results will be updated on a continual basis. At a minimum, once per year, all the datasets will be reviewed for changes and if necessary, the plan results will be updated. For example, new data on a planned greenway could prompt an update to determine if the new information changes the extent to which properties meet, or fail to meet, criteria associated with planned greenways in the Flood Mitigation Priority Scoring step. In addition, staff may obtain more accurate property information (typically an Elevation Certificate) and elect to update the plan results for individual properties immediately. B. Adjustments to computations The Flood RA/RR Plan, has gone through extensive development, review, and vetting. However, it is a unique approach that has not been used in other communities. The Flood Risk Property Scores, Risk Reduction Recommendations, and Flood Mitigation Priority Scores need to be sound and reasonable. In the event staff determine changes to the computations, multipliers, weighting, etc. are necessary to provide more accurate results, adjustments will be made and documented. 6.2 Losses Avoided The intent of the update process is for CMSWS to have the authority to make changes to the Flood RA/RR Plan without the need to return to the Mecklenburg County Board of County Commissioners to approve the changes. Examples of the types of changes CMSWS may wish to make to this plan over time include, but are not limited to, the following: point systems, multipliers, mitigation scoring caps, etc.
Flood Risk Assessment and Risk Reduction Plan January 2012
69
Appendix A: Acronyms and Definitions This plan uses a number of terms, phrases, and acronyms that may have different meanings to different readers. The following is a list of terms and definitions that may be useful in understanding key concepts of this document. Base Flood: A flood having a 1% chance of being equaled or exceeded in any given year. Base Flood Elevation: The elevation of surface water resulting from a flood that has a 1% chance of equaling or exceeding that level in any given year. The BFE is shown on the Flood Insurance Rate Map (FIRM) for zones AE, AH, A1–A30, AR, AR/A, AR/AE, AR/A1– A30, AR/AH, AR/AO, V1–V30, and VE. Basement: Any area of the building, having its floor subgrade (below ground level on all sides). BCA: Benefit-Cost Analysis BCR: Benefit-Cost Ratio Building: Any structure built for support, shelter, or enclosure for any occupancy or storage. CIP: Capital Improvement Program CMEMO: Charlotte-Mecklenburg Emergency Management Office CMSWS: Charlotte-Mecklenburg Storm Water Services Community Base Flood: The flood determined using future land use conditions having a 1% chance of being equaled or exceeded in any given year. Community Base Flood Elevation: The elevation shown on the Flood Insurance Rate Map Flood Hazard Data Table, having a 1% chance of being equaled or exceeded, determined using future land use conditions. Community Development Block Grant: The Community Development Block Grant (CDBG) program is a flexible program that provides communities with resources to address a wide range of unique community development needs. Beginning in 1974, the CDBG program is one of the longest continuously run programs at HUD. The CDBG program provides annual grants on a formula basis to 1209 general units of local government and States. Community Encroachment Area: The channel of a stream or other watercourse and the adjacent land areas that must be reserved in order to discharge the FEMA Base Flood without cumulatively increasing the water surface elevation more than 0.1 foot. Community Floodplain: This shows where flooding is likely to occur in the future, based on expected development upstream.
Flood Risk Assessment and Risk Reduction Plan January 2012
70
CRC: Citizen Review Committee FEMA: Federal Emergency Management Agency FEMA Base Flood: The flood determined using land use conditions at the time of the study having a 1% chance of being equaled or exceeded in any given year. FEMA Base Flood Elevation (BFE): The elevation shown on the Flood Insurance Rate Map and Flood Insurance Study Profile that indicates the water surface elevation resulting from a FEMA Base Flood that has a 1% chance of equaling or exceeding that level in any given year. FEMA Floodway: The channel of a river or other watercourse and the adjacent land areas that must be reserved in order to discharge the FEMA Base Flood, without cumulatively increasing the water surface elevation more than 0.5 foot. On the Catawba River, and the portions of Six Mile Creek and Rocky River which run along the county boundary line, the FEMA Floodway means the channel of a stream or other watercourse and the adjacent land areas that must be reserved in order to discharge the FEMA Base Flood, without cumulatively increasing the water surface elevation more than 1.0 feet. First Floor Elevation (FFE): This is the elevation of the top of the lowest finished floor of the structure being studied. Also referred to as Finished Floor Elevation. Flood or Flooding: A general and temporary condition of partial or complete inundation of normally dry land areas from:
1. The overflow of inland or tidal waters; and/or 2. The unusual and rapid accumulation of run-off of surface waters from any source.
Flood Information & Notification System (FINS): A network of automated rain and stream gages that constantly measure precipitation and stream depth in target streams where flooding has resulted in risk to people and damage to structures in the past. Flood Insurance Rate Map (FIRM): An official map of a community, in both digital and printed format, on which the Federal Emergency Management Agency has delineated the Special Flood Hazard Area and the risk premium zones applicable to the community. The date of Charlotte’s original FIRM is August 15, 1978 and this date should be used to determine whether a structure is pre-FIRM or post-FIRM. Flood Insurance Study (FIS): A compilation and presentation of flood risk data for specific watercourses, lakes, and coastal flood hazard areas within a community. When a flood study is completed for the NFIP, the information and maps are assembled into an FIS. The FIS report contains detailed flood elevation data in flood profiles and data tables. Flood Mitigation: Action(s) taken to reduce or eliminate long-term risk to life and property from a flood event.
Flood Risk Assessment and Risk Reduction Plan January 2012
71
Flood Mitigation Plan: A plan that identifies flood risks and mitigation actions to reduce or eliminate long-term risk to life and property from flooding. Flood Protection Elevation (FPE): The elevation to which all structures located within the Community Special Flood Hazard Area must be elevated (or floodproofed if non-residential). Within areas where Base Flood Elevations (BFEs) have been determined, this elevation shall be the Community Base Flood Elevation plus one (1) foot of freeboard (except along the Catawba River where it is the FEMA Base Flood Elevation plus two (2) feet of freeboard). In areas where no BFE has been established, all structures and other development must be elevated (or floodproofed if non-residential), to two (2) feet above the highest adjacent grade. For the purposes of this plan, this will be based on the Community Base Flood Elevation plus one (1) foot of freeboard. Flood Risk: The likelihood of impacts/consequences (financial, personal, and property damage) resulting from a flood. Floodplain: Any land area susceptible to being inundated by flood waters from any source. Floodproofing: Any combination of structural and nonstructural additions, changes, or adjustments to structures, which reduce or eliminate risk of flood damage to real estate or improved real property, water and sanitation facilities, or structures with their contents. Floodway: Is either the FEMA Floodway or the Community Encroachment Area. Freeboard: The height added to the Community Base Flood Elevation (BFE) to account for the many unknown factors that could contribute to flood heights greater than the height calculated for a selected size flood and floodway conditions, such as wave action, blockage of bridge openings, and the hydrological effect of urbanization of the watershed. The Community Base Flood Elevation (BFE) plus the freeboard establishes the “Flood Protection Elevation.” Historic Structure: Any structure that is:
1. listed individually in the National Register of Historic Places (a listing maintained by the U.S. Department of Interior) or preliminarily determined by the Secretary of Interior as meeting the requirements for individual listing on the National Register;
2. certified or preliminarily determined by the Secretary of Interior as contributing to the historical significance of a registered historic district or a district preliminarily determined by the Secretary to qualify as a registered historic district
3. individually listed on a local inventory of historic landmarks in communities with a Certified Local Government (CLG) Program”; or
4. certified as contributing to the historical significance of a historic district designated by a community with a “Certified Local Government (CLG) Program”
Increased Cost of Compliance (ICC): The National Flood Insurance Program (NFIP) includes this coverage for all new and renewed Standard Flood Insurance Policies. Policyholders can get
Flood Risk Assessment and Risk Reduction Plan January 2012
72
up to $30,000 to help pay the costs to bring their home or business into compliance with their community’s floodplain ordinance. Lowest Floor: The lowest floor of the lowest enclosed area (including the basement). An unfinished or flood-resistant enclosure, usable solely for parking of vehicles, building access or storage in an area other than a basement area, is not considered a building's Lowest Floor provided that such enclosure is not built so as to render the structure in violation of the applicable non-elevation design requirements of this ordinance. Lowest Mechanical Equipment (LME): The lowest elevation height of mechanical and/or electrical equipment, such as air conditioners, furnaces, hot water heater, etc. Lowest Adjacent Grade: The elevation of the ground, sidewalk, or patio slab immediately next to a building. NFIP: National Flood Insurance Program Post-FIRM: A building that was constructed after August 15, 1978. Pre-FIRM: A building that was constructed before August 15, 1978. Repetitive Loss: Flood-related damages sustained by a structure on two (2) separate occasions during any 10-year period for which the cost of repairs at the time of each such flood event, on the average, equals or exceeds 25% of the Market Value of the structure before the damage occurred. Severe Repetitive Loss (SRL): A residential property that is covered under an NFIP flood insurance policy and: (a) that has at least four NFIP claim payments (including building and contents) over $5,000 each, and the cumulative amount of such claims payments exceeds $20,000; or (b) for which at least two separate claims payments (building payments only) have been made with the cumulative amount of the building portion of such claims exceeding the market value of the building. For both (a) and (b), at least two of the referenced claims must have occurred within any 10-year period, and must be greater than 10 days apart. Special Flood Hazard Area (SFHA): The 100-year, or 1-percent-annual-chance, flood zone.
Flood Risk Assessment and Risk Reduction Plan January 2012
73
Appendix B: Data Requirements This Plan requires an abundance of data that is found in various sources. The data sources are listed below with information on the maintenance schedule and the data provided.
• Elevation Certificate Database: This data is updated regularly as new Elevation Certificates are received.
o Street address o Lowest Finished Floor Elevation (FFE) o Lowest Mechanical Elevation (LME) o Lowest Adjacent Grade (LAG) o Highest Adjacent Grade (HAG) o Water surface elevations (WSELs) for 2-, 5-, 10-, 25-, 50-, 100-, and 500-year
modeled storms o WSEL for 100-year future event (community floodplain) o Basement information o Foundation information
• Parcel Database: This data is updated regularly as data changes.
o Parcel ID o Address o Occupancy type o Foundation o Number of Units o Date of Last Sale o Year Built o Total Value o Land Value o Building Grade o Number of Stories o Exterior Wall o Heated Square Feet o Foundation Type
• Building Footprints: Updated as needed.
• Bed Elevations: Updated when FIRM is updated.
• Floodplain Maps: Updated when FIRM is updated. • Community Encroachment Area: Updated when FIRM is updated.
• Critical Facilities: Updated as needed.
• Water Quality Buffer: Updated as needed.
Flood Risk Assessment and Risk Reduction Plan January 2012
74
• Local and National Historic Sites: Updated as needed.
• 5-year Water CIP: Updated as needed.
• 5-year Sewer CIP: Updated as needed.
• 5-year Greenway: Updated as needed.
• Parks: Updated as needed.
• Parking Locations: Updated as needed.
• High Danger Depth-Velocity Areas: Updated each time new models are developed.
• Moderate Danger Depth-Velocity Areas: Updated each time new models are developed.
• Water Quality CIP Sites: Updated as needed.
• Significant Property Improvements: Updated as needed; could be updated upon
request of property owner.
• Moderate Property Improvements: Updated as needed; could be updated upon request of property owner.
• Public Lands: Updated as needed.
• Mitigation Projects: Updated monthly.
• Repetitive Losses: Updated yearly.
• NFIP Policies: Updated yearly.
• Environmental Focus Areas: Updated as needed.
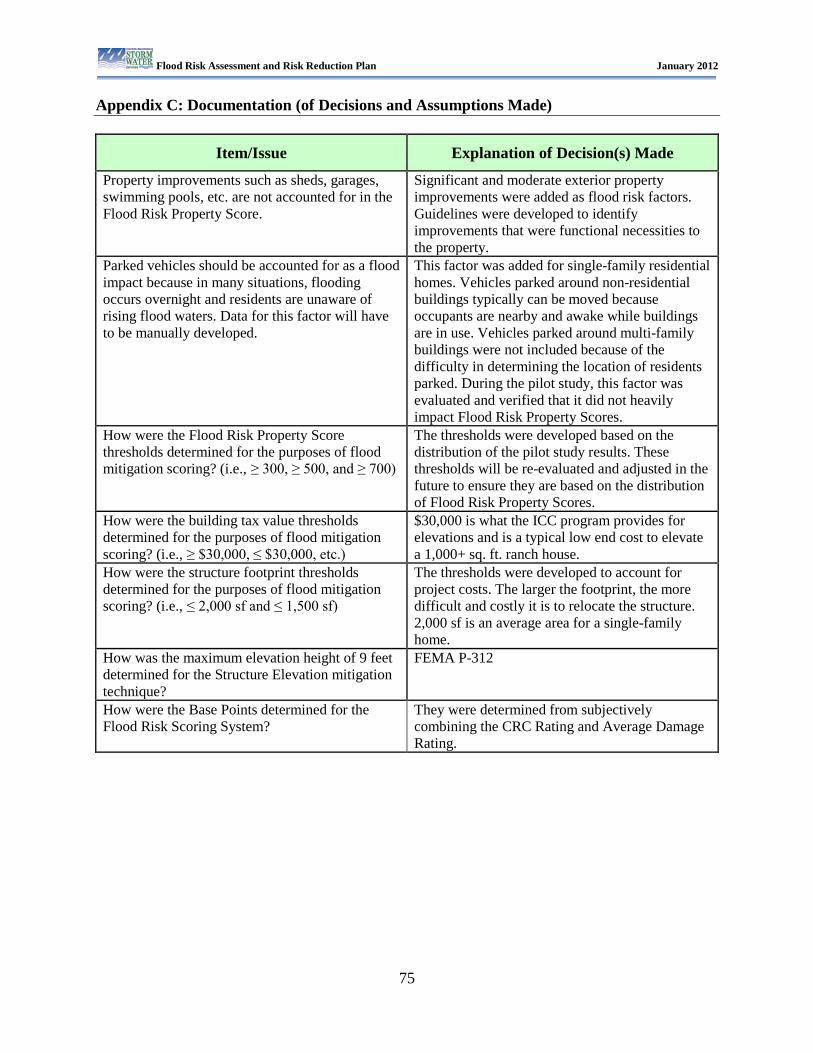
Flood Risk Assessment and Risk Reduction Plan January 2012
75
Appendix C: Documentation (of Decisions and Assumptions Made)
Item/Issue Explanation of Decision(s) Made
Property improvements such as sheds, garages, swimming pools, etc. are not accounted for in the Flood Risk Property Score.
Significant and moderate exterior property improvements were added as flood risk factors. Guidelines were developed to identify improvements that were functional necessities to the property.
Parked vehicles should be accounted for as a flood impact because in many situations, flooding occurs overnight and residents are unaware of rising flood waters. Data for this factor will have to be manually developed.
This factor was added for single-family residential homes. Vehicles parked around non-residential buildings typically can be moved because occupants are nearby and awake while buildings are in use. Vehicles parked around multi-family buildings were not included because of the difficulty in determining the location of residents parked. During the pilot study, this factor was evaluated and verified that it did not heavily impact Flood Risk Property Scores.
How were the Flood Risk Property Score thresholds determined for the purposes of flood mitigation scoring? (i.e., ≥ 300, ≥ 500, and ≥ 700)
The thresholds were developed based on the distribution of the pilot study results. These thresholds will be re-evaluated and adjusted in the future to ensure they are based on the distribution of Flood Risk Property Scores.
How were the building tax value thresholds determined for the purposes of flood mitigation scoring? (i.e., ≥ $30,000, ≤ $30,000, etc.)
$30,000 is what the ICC program provides for elevations and is a typical low end cost to elevate a 1,000+ sq. ft. ranch house.
How were the structure footprint thresholds determined for the purposes of flood mitigation scoring? (i.e., ≤ 2,000 sf and ≤ 1,500 sf)
The thresholds were developed to account for project costs. The larger the footprint, the more difficult and costly it is to relocate the structure. 2,000 sf is an average area for a single-family home.
How was the maximum elevation height of 9 feet determined for the Structure Elevation mitigation technique?
FEMA P-312
How were the Base Points determined for the Flood Risk Scoring System?
They were determined from subjectively combining the CRC Rating and Average Damage Rating.
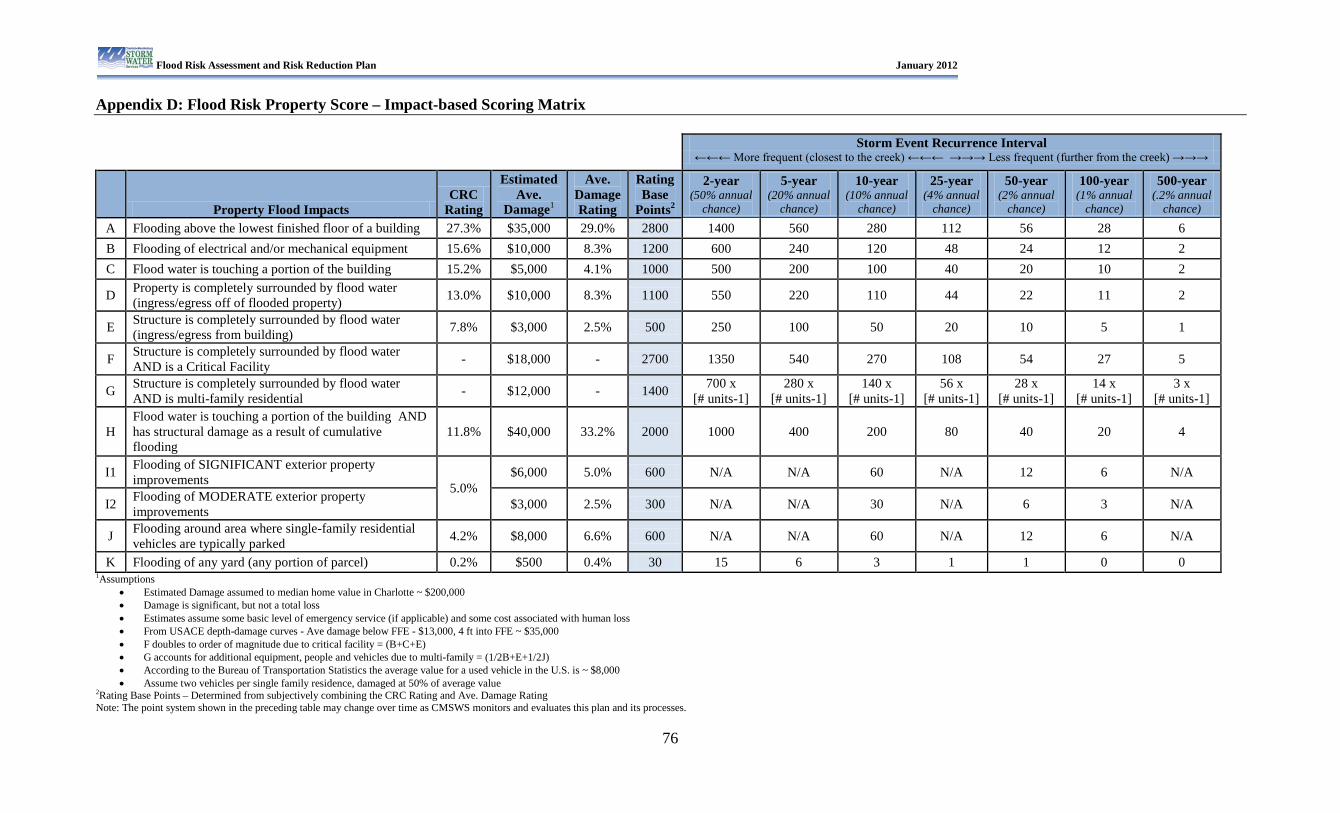
Flood Risk Assessment and Risk Reduction Plan January 2012
76
Appendix D: Flood Risk Property Score – Impact-based Scoring Matrix
Storm Event Recurrence Interval
←←← More frequent (closest to the creek) ←←← →→→ Less frequent (further from the creek) →→→
Property Flood Impacts
CRC Rating
Estimated Ave.
Damage1
Ave. Damage Rating
Rating Base
Points2
2-year (50% annual
chance)
5-year (20% annual
chance)
10-year (10% annual
chance)
25-year (4% annual
chance)
50-year (2% annual
chance)
100-year (1% annual
chance)
500-year (.2% annual
chance) A Flooding above the lowest finished floor of a building 27.3% $35,000 29.0% 2800 1400 560 280 112 56 28 6 B Flooding of electrical and/or mechanical equipment 15.6% $10,000 8.3% 1200 600 240 120 48 24 12 2 C Flood water is touching a portion of the building 15.2% $5,000 4.1% 1000 500 200 100 40 20 10 2
D Property is completely surrounded by flood water (ingress/egress off of flooded property) 13.0% $10,000 8.3% 1100 550 220 110 44 22 11 2
E Structure is completely surrounded by flood water (ingress/egress from building) 7.8% $3,000 2.5% 500 250 100 50 20 10 5 1
F Structure is completely surrounded by flood water AND is a Critical Facility - $18,000 - 2700 1350 540 270 108 54 27 5
G Structure is completely surrounded by flood water AND is multi-family residential - $12,000 - 1400 700 x
[# units-1] 280 x
[# units-1] 140 x
[# units-1] 56 x
[# units-1] 28 x
[# units-1] 14 x
[# units-1] 3 x
[# units-1]
H Flood water is touching a portion of the building AND has structural damage as a result of cumulative flooding
11.8% $40,000 33.2% 2000 1000 400 200 80 40 20 4
I1 Flooding of SIGNIFICANT exterior property improvements 5.0%
$6,000 5.0% 600 N/A N/A 60 N/A 12 6 N/A
I2 Flooding of MODERATE exterior property improvements $3,000 2.5% 300 N/A N/A 30 N/A 6 3 N/A
J Flooding around area where single-family residential vehicles are typically parked 4.2% $8,000 6.6% 600 N/A N/A 60 N/A 12 6 N/A
K Flooding of any yard (any portion of parcel) 0.2% $500 0.4% 30 15 6 3 1 1 0 0 1Assumptions
• Estimated Damage assumed to median home value in Charlotte ~ $200,000 • Damage is significant, but not a total loss • Estimates assume some basic level of emergency service (if applicable) and some cost associated with human loss • From USACE depth-damage curves - Ave damage below FFE - $13,000, 4 ft into FFE ~ $35,000 • F doubles to order of magnitude due to critical facility = (B+C+E) • G accounts for additional equipment, people and vehicles due to multi-family = (1/2B+E+1/2J) • According to the Bureau of Transportation Statistics the average value for a used vehicle in the U.S. is ~ $8,000 • Assume two vehicles per single family residence, damaged at 50% of average value
2Rating Base Points – Determined from subjectively combining the CRC Rating and Ave. Damage Rating Note: The point system shown in the preceding table may change over time as CMSWS monitors and evaluates this plan and its processes.
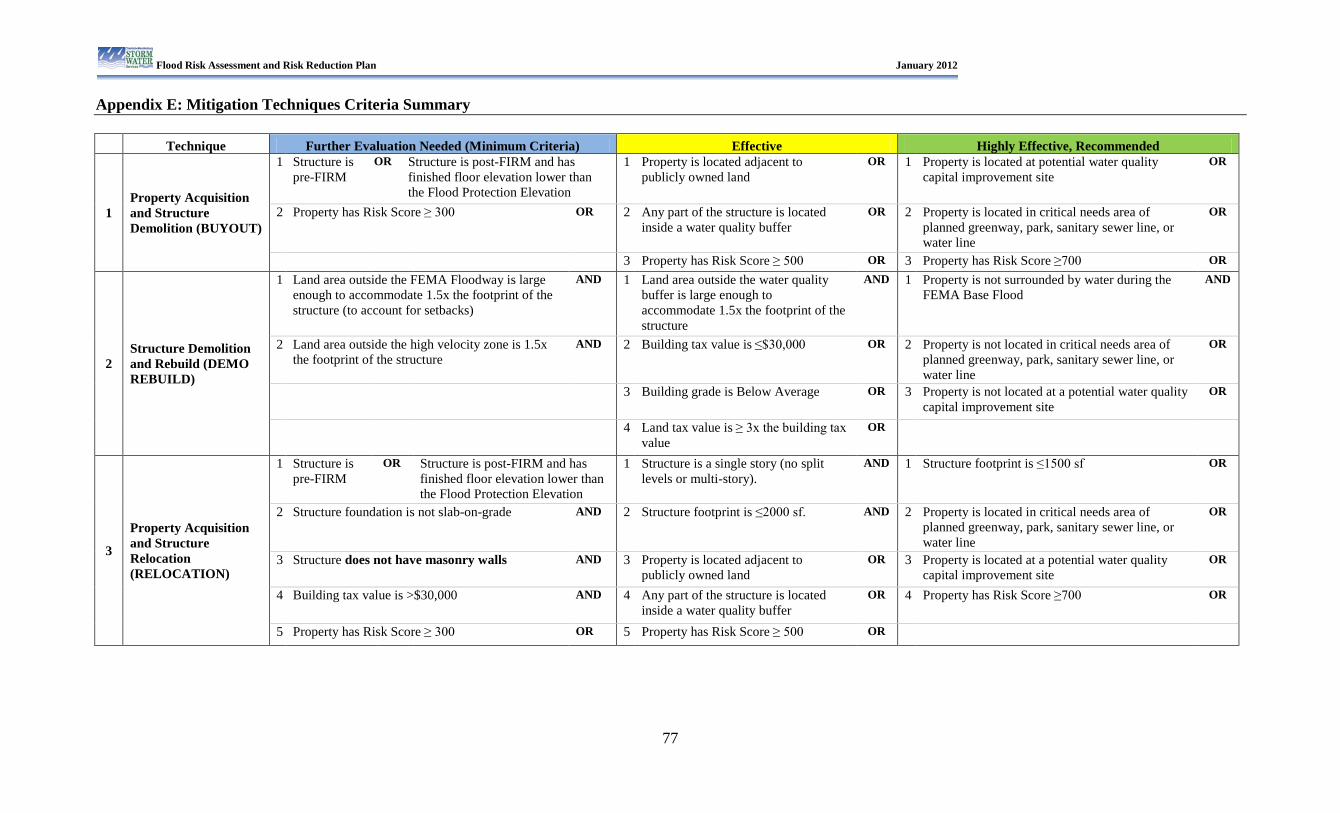
Flood Risk Assessment and Risk Reduction Plan January 2012
77
Appendix E: Mitigation Techniques Criteria Summary Technique Further Evaluation Needed (Minimum Criteria) Effective Highly Effective, Recommended
1 Property Acquisition and Structure Demolition (BUYOUT)
1 Structure is pre-FIRM
OR Structure is post-FIRM and has finished floor elevation lower than the Flood Protection Elevation
1 Property is located adjacent to publicly owned land
OR 1 Property is located at potential water quality capital improvement site
OR
2 Property has Risk Score ≥ 300 OR 2 Any part of the structure is located inside a water quality buffer
OR 2 Property is located in critical needs area of planned greenway, park, sanitary sewer line, or water line
OR
3 Property has Risk Score ≥ 500 OR 3 Property has Risk Score ≥700 OR
2 Structure Demolition and Rebuild (DEMO REBUILD)
1 Land area outside the FEMA Floodway is large enough to accommodate 1.5x the footprint of the structure (to account for setbacks)
AND 1 Land area outside the water quality buffer is large enough to accommodate 1.5x the footprint of the structure
AND 1 Property is not surrounded by water during the FEMA Base Flood
AND
2 Land area outside the high velocity zone is 1.5x the footprint of the structure
AND 2 Building tax value is ≤$30,000 OR 2 Property is not located in critical needs area of planned greenway, park, sanitary sewer line, or water line
OR
3 Building grade is Below Average OR 3 Property is not located at a potential water quality capital improvement site
OR
4 Land tax value is ≥ 3x the building tax value
OR
3
Property Acquisition and Structure Relocation (RELOCATION)
1 Structure is pre-FIRM
OR Structure is post-FIRM and has finished floor elevation lower than the Flood Protection Elevation
1 Structure is a single story (no split levels or multi-story).
AND 1 Structure footprint is ≤1500 sf OR
2 Structure foundation is not slab-on-grade AND 2 Structure footprint is ≤2000 sf. AND 2 Property is located in critical needs area of planned greenway, park, sanitary sewer line, or water line
OR
3 Structure does not have masonry walls AND 3 Property is located adjacent to publicly owned land
OR 3 Property is located at a potential water quality capital improvement site
OR
4 Building tax value is >$30,000 AND 4 Any part of the structure is located inside a water quality buffer
OR 4 Property has Risk Score ≥700 OR
5 Property has Risk Score ≥ 300 OR 5 Property has Risk Score ≥ 500 OR
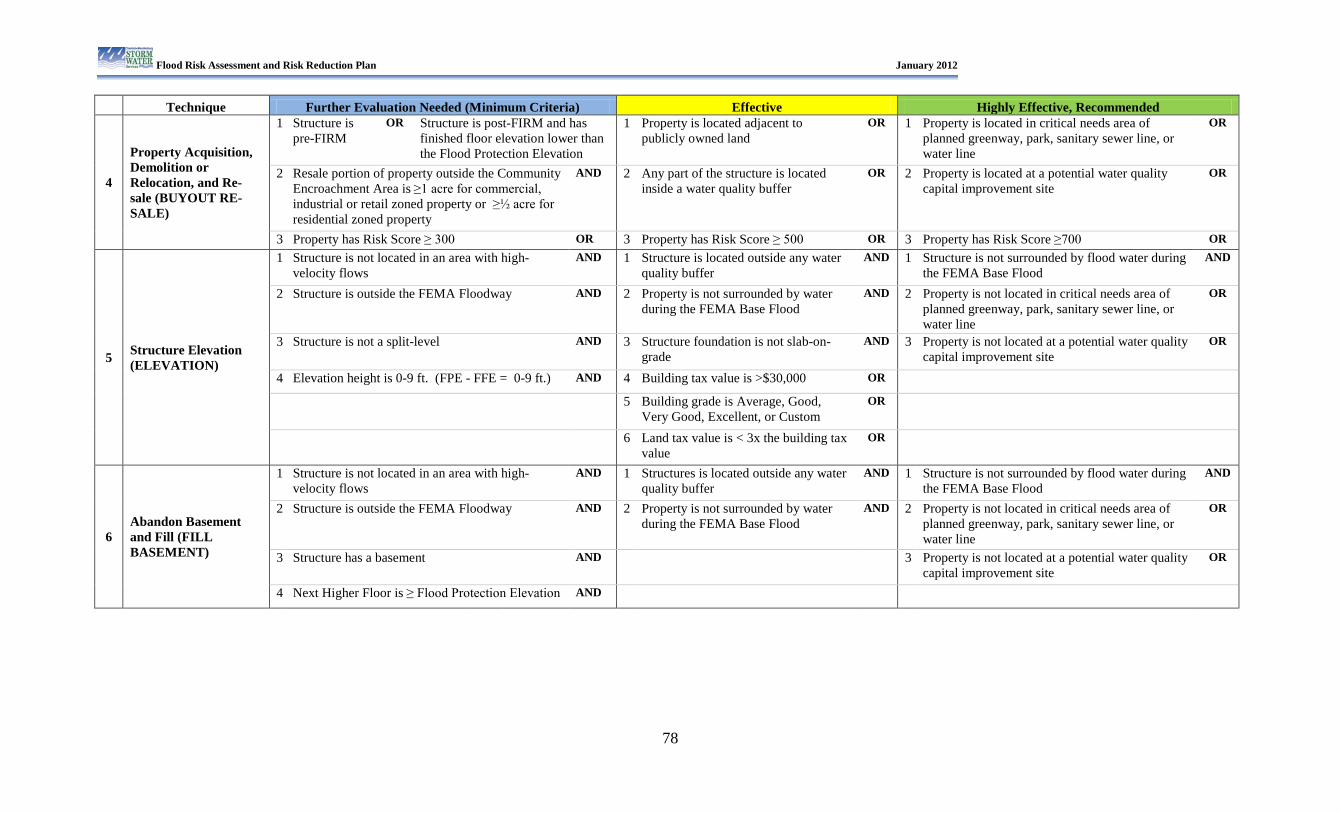
Flood Risk Assessment and Risk Reduction Plan January 2012
78
Technique Further Evaluation Needed (Minimum Criteria) Effective Highly Effective, Recommended
4
Property Acquisition, Demolition or Relocation, and Re-sale (BUYOUT RE-SALE)
1 Structure is pre-FIRM
OR Structure is post-FIRM and has finished floor elevation lower than the Flood Protection Elevation
1 Property is located adjacent to publicly owned land
OR 1 Property is located in critical needs area of planned greenway, park, sanitary sewer line, or water line
OR
2 Resale portion of property outside the Community Encroachment Area is ≥1 acre for commercial, industrial or retail zoned property or ≥½ acre for residential zoned property
AND 2 Any part of the structure is located inside a water quality buffer
OR 2 Property is located at a potential water quality capital improvement site
OR
3 Property has Risk Score ≥ 300 OR 3 Property has Risk Score ≥ 500 OR 3 Property has Risk Score ≥700 OR
5 Structure Elevation (ELEVATION)
1 Structure is not located in an area with high-velocity flows
AND 1 Structure is located outside any water quality buffer
AND 1 Structure is not surrounded by flood water during the FEMA Base Flood
AND
2 Structure is outside the FEMA Floodway AND 2 Property is not surrounded by water during the FEMA Base Flood
AND 2 Property is not located in critical needs area of planned greenway, park, sanitary sewer line, or water line
OR
3 Structure is not a split-level AND 3 Structure foundation is not slab-on-grade
AND 3 Property is not located at a potential water quality capital improvement site
OR
4 Elevation height is 0-9 ft. (FPE - FFE = 0-9 ft.) AND 4 Building tax value is >$30,000 OR
5 Building grade is Average, Good, Very Good, Excellent, or Custom
OR
6 Land tax value is < 3x the building tax value
OR
6 Abandon Basement and Fill (FILL BASEMENT)
1 Structure is not located in an area with high-velocity flows
AND 1 Structures is located outside any water quality buffer
AND 1 Structure is not surrounded by flood water during the FEMA Base Flood
AND
2 Structure is outside the FEMA Floodway AND 2 Property is not surrounded by water during the FEMA Base Flood
AND 2 Property is not located in critical needs area of planned greenway, park, sanitary sewer line, or water line
OR
3 Structure has a basement AND 3 Property is not located at a potential water quality capital improvement site
OR
4 Next Higher Floor is ≥ Flood Protection Elevation AND
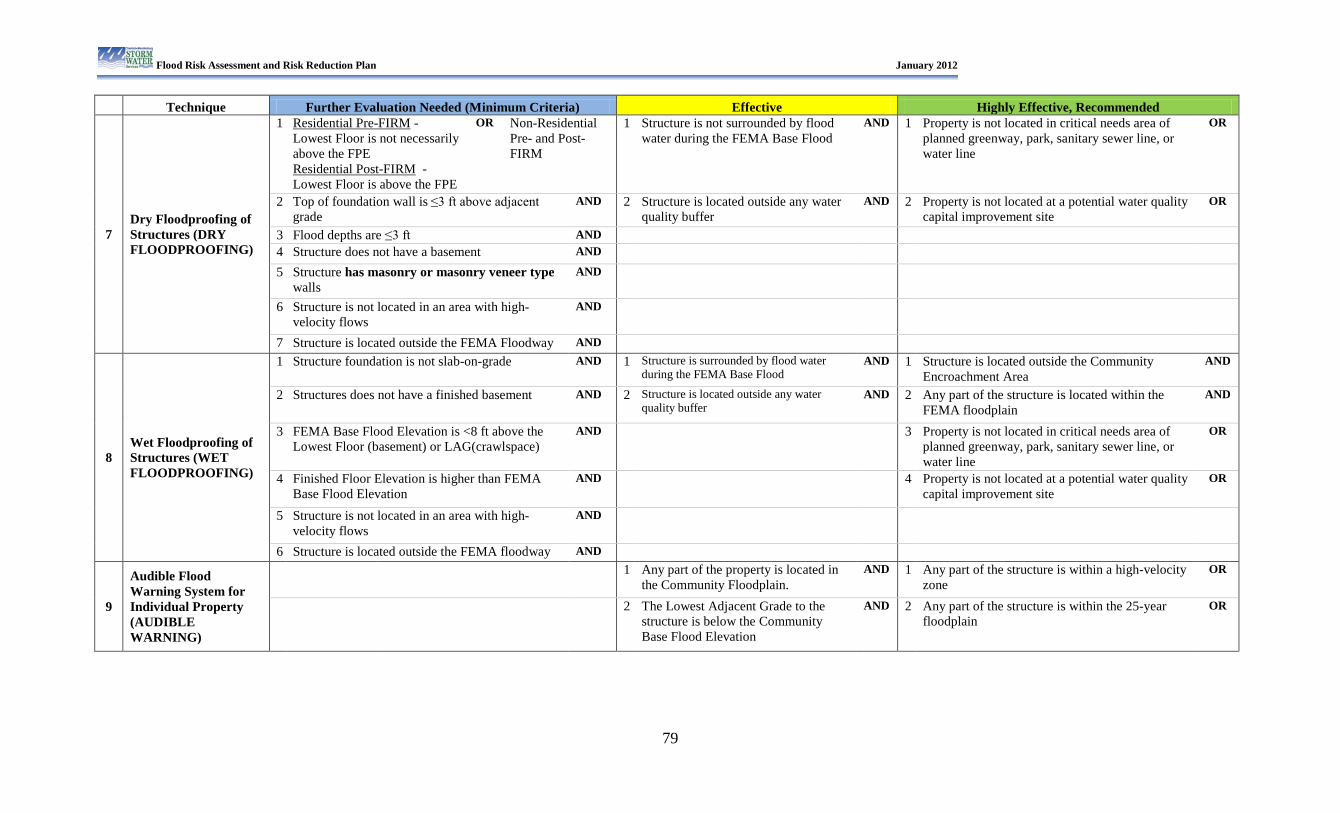
Flood Risk Assessment and Risk Reduction Plan January 2012
79
Technique Further Evaluation Needed (Minimum Criteria) Effective Highly Effective, Recommended
7 Dry Floodproofing of Structures (DRY FLOODPROOFING)
1 Residential Pre-FIRM - Lowest Floor is not necessarily above the FPE Residential Post-FIRM - Lowest Floor is above the FPE
OR Non-Residential Pre- and Post-FIRM
1 Structure is not surrounded by flood water during the FEMA Base Flood
AND 1 Property is not located in critical needs area of planned greenway, park, sanitary sewer line, or water line
OR
2 Top of foundation wall is ≤3 ft above adjacent grade
AND 2 Structure is located outside any water quality buffer
AND 2 Property is not located at a potential water quality capital improvement site
OR
3 Flood depths are ≤3 ft AND 4 Structure does not have a basement AND 5 Structure has masonry or masonry veneer type
walls AND
6 Structure is not located in an area with high-velocity flows
AND
7 Structure is located outside the FEMA Floodway AND
8 Wet Floodproofing of Structures (WET FLOODPROOFING)
1 Structure foundation is not slab-on-grade AND 1 Structure is surrounded by flood water during the FEMA Base Flood
AND 1 Structure is located outside the Community Encroachment Area
AND
2 Structures does not have a finished basement AND 2 Structure is located outside any water quality buffer
AND 2 Any part of the structure is located within the FEMA floodplain
AND
3 FEMA Base Flood Elevation is <8 ft above the Lowest Floor (basement) or LAG(crawlspace)
AND 3 Property is not located in critical needs area of planned greenway, park, sanitary sewer line, or water line
OR
4 Finished Floor Elevation is higher than FEMA Base Flood Elevation
AND 4 Property is not located at a potential water quality capital improvement site
OR
5 Structure is not located in an area with high-velocity flows
AND
6 Structure is located outside the FEMA floodway AND
9
Audible Flood Warning System for Individual Property (AUDIBLE WARNING)
1 Any part of the property is located in the Community Floodplain.
AND 1 Any part of the structure is within a high-velocity zone
OR
2 The Lowest Adjacent Grade to the structure is below the Community Base Flood Elevation
AND 2 Any part of the structure is within the 25-year floodplain
OR
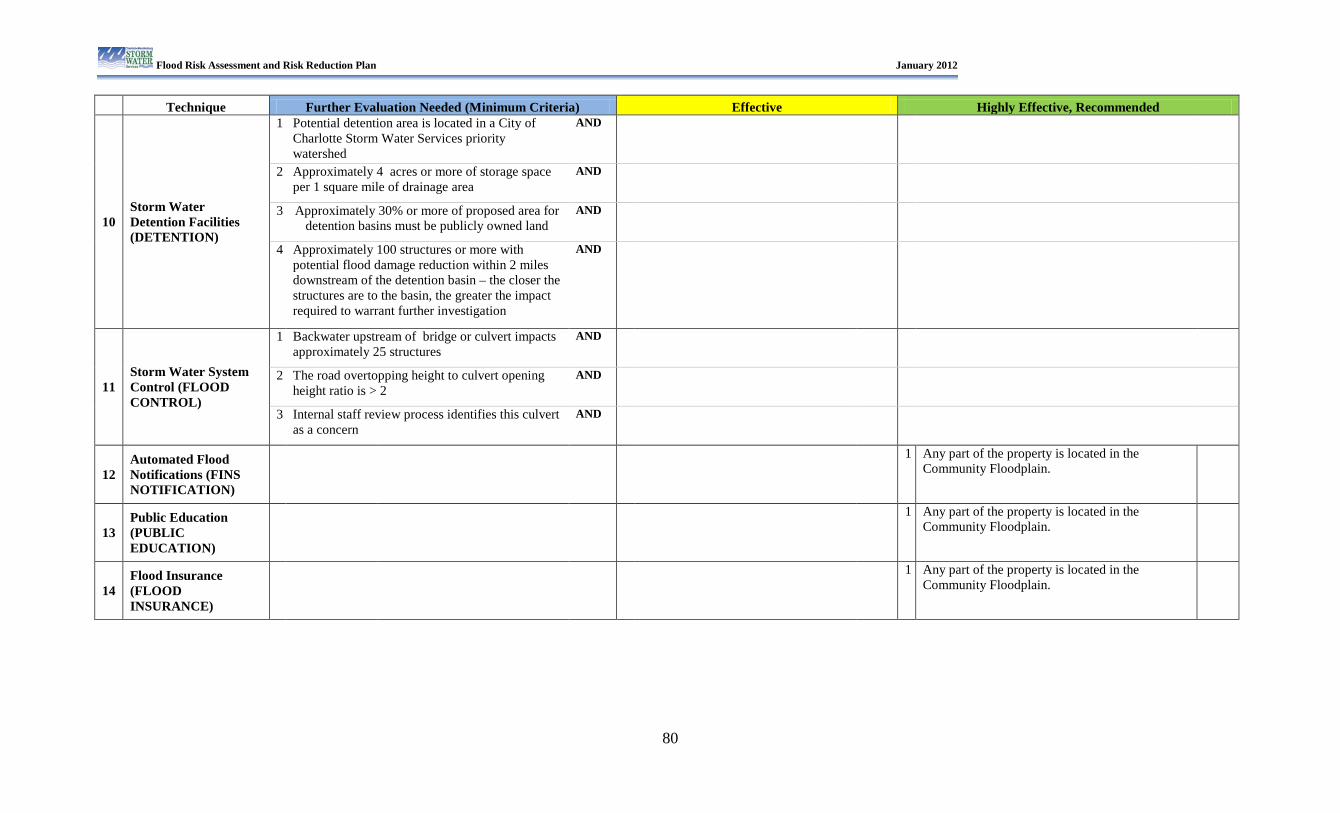
Flood Risk Assessment and Risk Reduction Plan January 2012
80
Technique Further Evaluation Needed (Minimum Criteria) Effective Highly Effective, Recommended
10 Storm Water Detention Facilities (DETENTION)
1 Potential detention area is located in a City of Charlotte Storm Water Services priority watershed
AND
2 Approximately 4 acres or more of storage space per 1 square mile of drainage area
AND
3 Approximately 30% or more of proposed area for detention basins must be publicly owned land
AND
4 Approximately 100 structures or more with potential flood damage reduction within 2 miles downstream of the detention basin – the closer the structures are to the basin, the greater the impact required to warrant further investigation
AND
11 Storm Water System Control (FLOOD CONTROL)
1 Backwater upstream of bridge or culvert impacts approximately 25 structures
AND
2 The road overtopping height to culvert opening height ratio is > 2
AND
3 Internal staff review process identifies this culvert as a concern
AND
12 Automated Flood Notifications (FINS NOTIFICATION)
1 Any part of the property is located in the Community Floodplain.
13 Public Education (PUBLIC EDUCATION)
1 Any part of the property is located in the Community Floodplain.
14 Flood Insurance (FLOOD INSURANCE)
1 Any part of the property is located in the Community Floodplain.
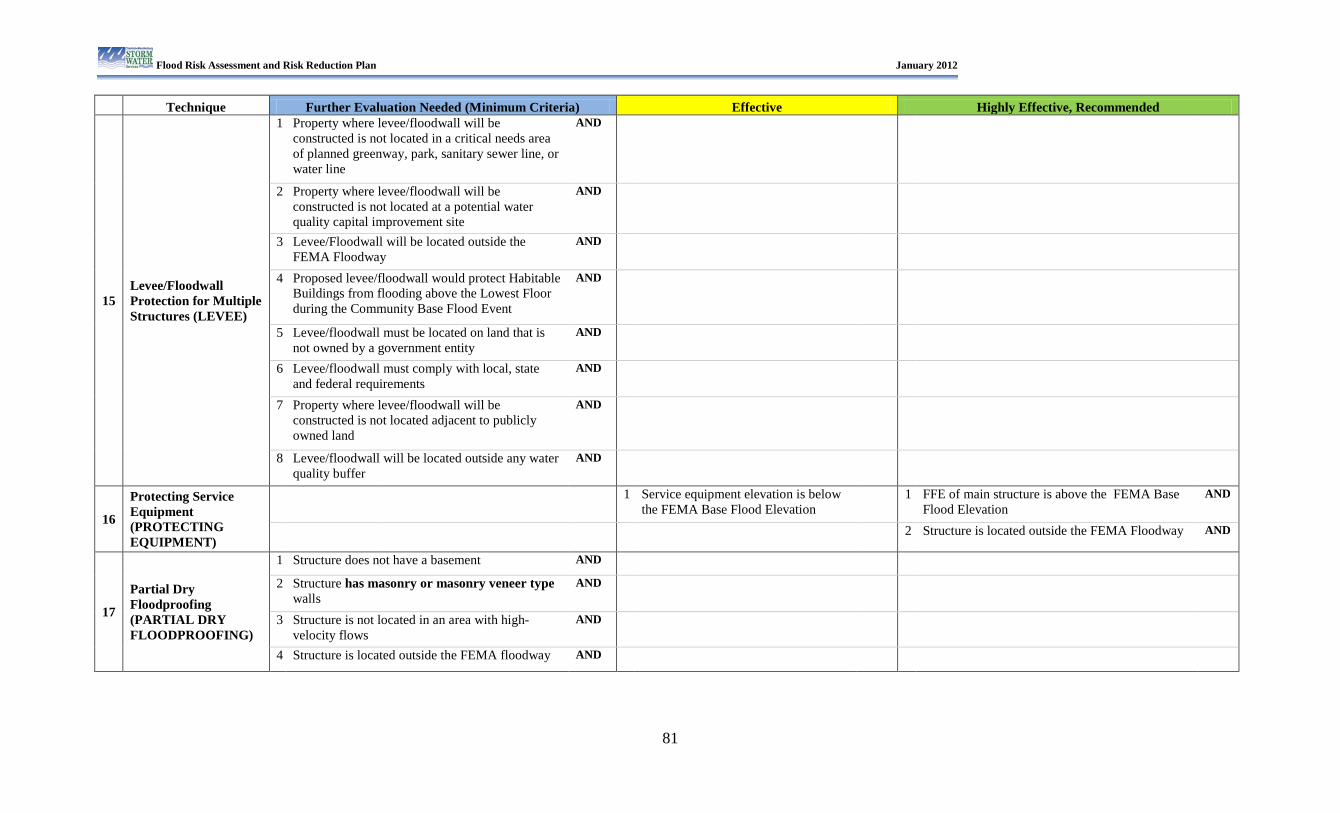
Flood Risk Assessment and Risk Reduction Plan January 2012
81
Technique Further Evaluation Needed (Minimum Criteria) Effective Highly Effective, Recommended
15 Levee/Floodwall Protection for Multiple Structures (LEVEE)
1 Property where levee/floodwall will be constructed is not located in a critical needs area of planned greenway, park, sanitary sewer line, or water line
AND
2 Property where levee/floodwall will be constructed is not located at a potential water quality capital improvement site
AND
3 Levee/Floodwall will be located outside the FEMA Floodway
AND
4 Proposed levee/floodwall would protect Habitable Buildings from flooding above the Lowest Floor during the Community Base Flood Event
AND
5 Levee/floodwall must be located on land that is not owned by a government entity
AND
6 Levee/floodwall must comply with local, state and federal requirements
AND
7 Property where levee/floodwall will be constructed is not located adjacent to publicly owned land
AND
8 Levee/floodwall will be located outside any water quality buffer
AND
16
Protecting Service Equipment (PROTECTING EQUIPMENT)
1 Service equipment elevation is below the FEMA Base Flood Elevation
1 FFE of main structure is above the FEMA Base Flood Elevation
AND
2 Structure is located outside the FEMA Floodway AND
17
Partial Dry Floodproofing (PARTIAL DRY FLOODPROOFING)
1 Structure does not have a basement AND
2 Structure has masonry or masonry veneer type walls
AND
3 Structure is not located in an area with high-velocity flows
AND
4 Structure is located outside the FEMA floodway AND
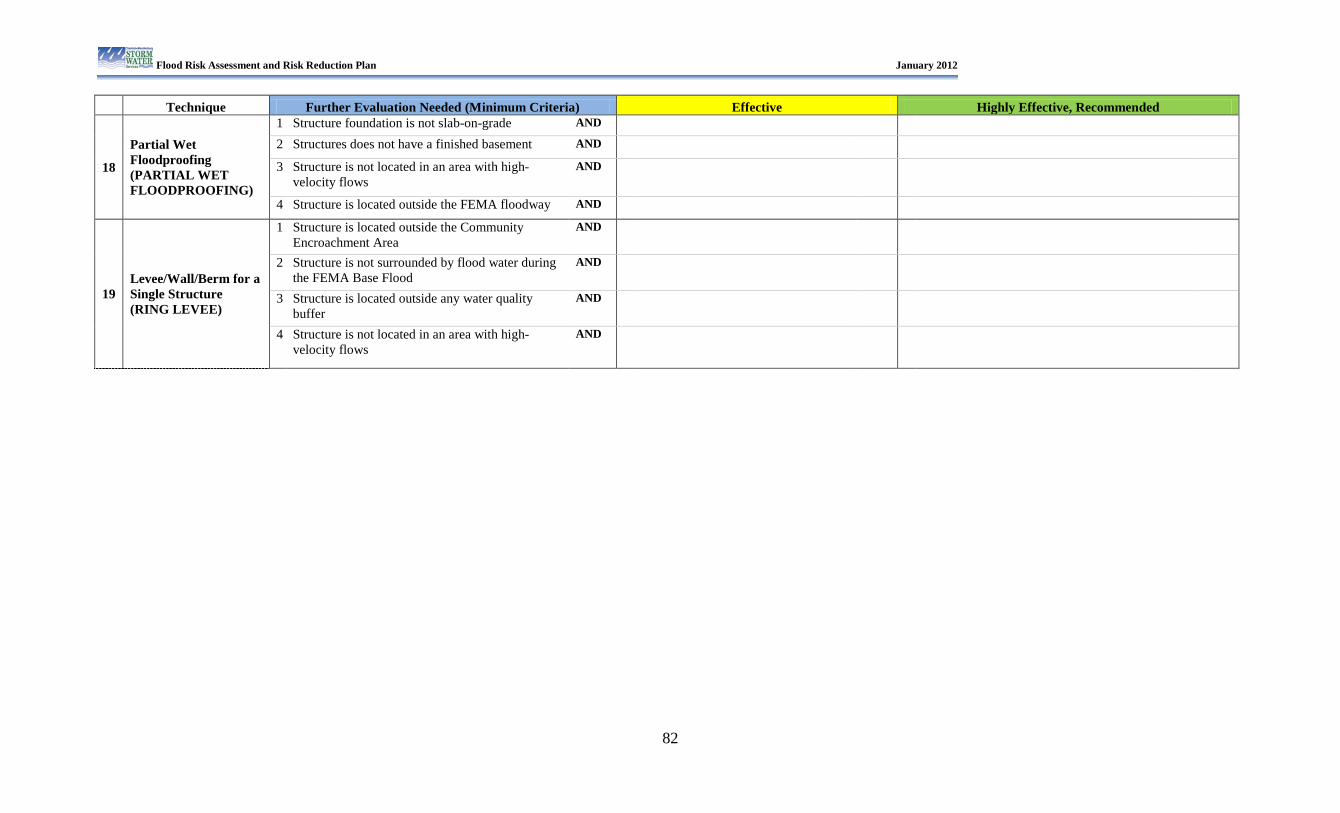
Flood Risk Assessment and Risk Reduction Plan January 2012
82
Technique Further Evaluation Needed (Minimum Criteria) Effective Highly Effective, Recommended
18
Partial Wet Floodproofing (PARTIAL WET FLOODPROOFING)
1 Structure foundation is not slab-on-grade AND 2 Structures does not have a finished basement AND
3 Structure is not located in an area with high-velocity flows
AND
4 Structure is located outside the FEMA floodway AND
19 Levee/Wall/Berm for a Single Structure (RING LEVEE)
1 Structure is located outside the Community Encroachment Area
AND
2 Structure is not surrounded by flood water during the FEMA Base Flood
AND
3 Structure is located outside any water quality buffer
AND
4 Structure is not located in an area with high-velocity flows
AND
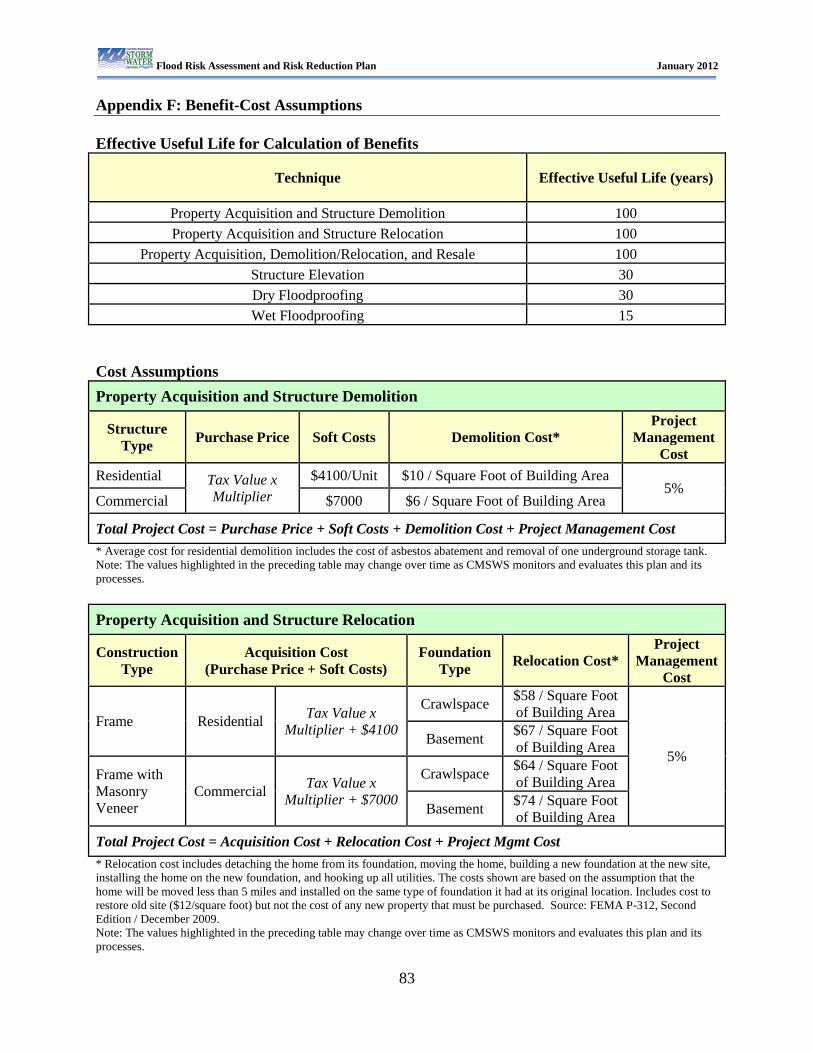
Flood Risk Assessment and Risk Reduction Plan January 2012
83
Appendix F: Benefit-Cost Assumptions Effective Useful Life for Calculation of Benefits
Technique Effective Useful Life (years)
Property Acquisition and Structure Demolition 100 Property Acquisition and Structure Relocation 100
Property Acquisition, Demolition/Relocation, and Resale 100 Structure Elevation 30 Dry Floodproofing 30 Wet Floodproofing 15
Cost Assumptions Property Acquisition and Structure Demolition
Structure Type Purchase Price Soft Costs Demolition Cost*
Project Management
Cost Residential Tax Value x
Multiplier $4100/Unit $10 / Square Foot of Building Area
5% Commercial $7000 $6 / Square Foot of Building Area
Total Project Cost = Purchase Price + Soft Costs + Demolition Cost + Project Management Cost * Average cost for residential demolition includes the cost of asbestos abatement and removal of one underground storage tank. Note: The values highlighted in the preceding table may change over time as CMSWS monitors and evaluates this plan and its processes. Property Acquisition and Structure Relocation
Construction Type
Acquisition Cost (Purchase Price + Soft Costs)
Foundation Type Relocation Cost*
Project Management
Cost
Frame Residential Tax Value x Multiplier + $4100
Crawlspace $58 / Square Foot of Building Area
5% Basement $67 / Square Foot
of Building Area
Frame with Masonry Veneer
Commercial Tax Value x Multiplier + $7000
Crawlspace $64 / Square Foot of Building Area
Basement $74 / Square Foot of Building Area
Total Project Cost = Acquisition Cost + Relocation Cost + Project Mgmt Cost * Relocation cost includes detaching the home from its foundation, moving the home, building a new foundation at the new site, installing the home on the new foundation, and hooking up all utilities. The costs shown are based on the assumption that the home will be moved less than 5 miles and installed on the same type of foundation it had at its original location. Includes cost to restore old site ($12/square foot) but not the cost of any new property that must be purchased. Source: FEMA P-312, Second Edition / December 2009. Note: The values highlighted in the preceding table may change over time as CMSWS monitors and evaluates this plan and its processes.
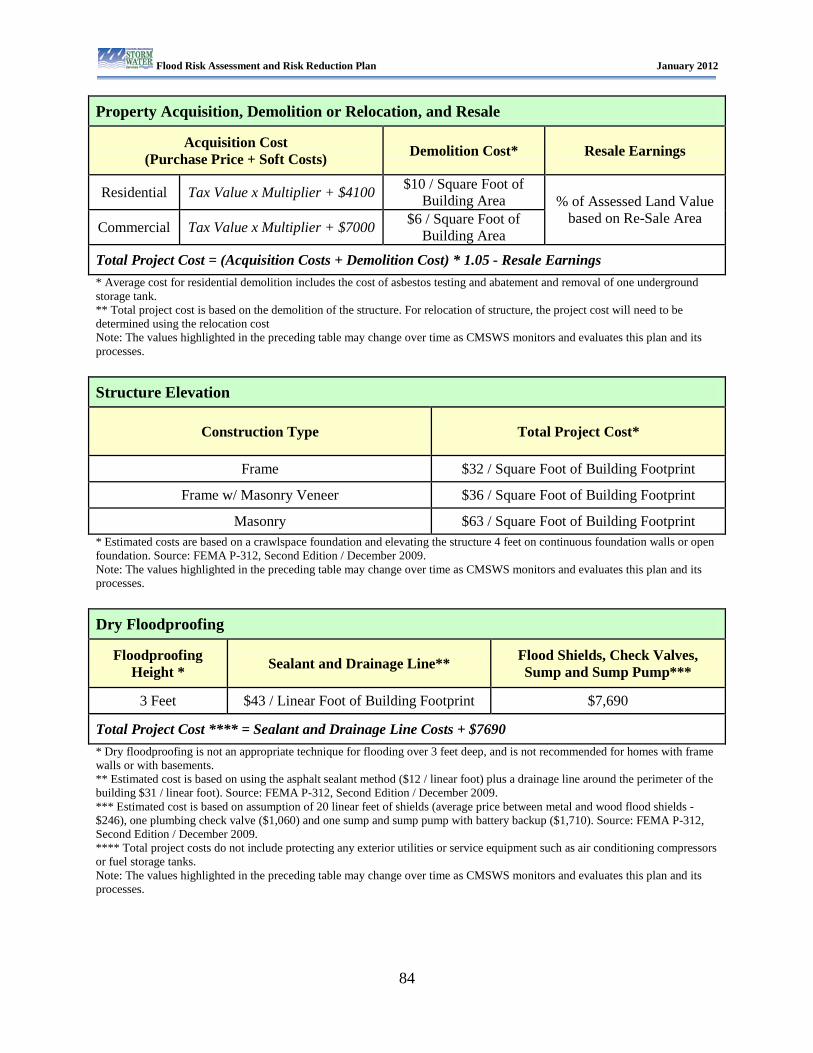
Flood Risk Assessment and Risk Reduction Plan January 2012
84
Property Acquisition, Demolition or Relocation, and Resale
Acquisition Cost (Purchase Price + Soft Costs) Demolition Cost* Resale Earnings
Residential Tax Value x Multiplier + $4100 $10 / Square Foot of Building Area % of Assessed Land Value
based on Re-Sale Area Commercial Tax Value x Multiplier + $7000 $6 / Square Foot of Building Area
Total Project Cost = (Acquisition Costs + Demolition Cost) * 1.05 - Resale Earnings * Average cost for residential demolition includes the cost of asbestos testing and abatement and removal of one underground storage tank. ** Total project cost is based on the demolition of the structure. For relocation of structure, the project cost will need to be determined using the relocation cost Note: The values highlighted in the preceding table may change over time as CMSWS monitors and evaluates this plan and its processes. Structure Elevation
Construction Type Total Project Cost*
Frame $32 / Square Foot of Building Footprint
Frame w/ Masonry Veneer $36 / Square Foot of Building Footprint
Masonry $63 / Square Foot of Building Footprint * Estimated costs are based on a crawlspace foundation and elevating the structure 4 feet on continuous foundation walls or open foundation. Source: FEMA P-312, Second Edition / December 2009. Note: The values highlighted in the preceding table may change over time as CMSWS monitors and evaluates this plan and its processes. Dry Floodproofing
Floodproofing Height * Sealant and Drainage Line** Flood Shields, Check Valves,
Sump and Sump Pump***
3 Feet $43 / Linear Foot of Building Footprint $7,690
Total Project Cost **** = Sealant and Drainage Line Costs + $7690 * Dry floodproofing is not an appropriate technique for flooding over 3 feet deep, and is not recommended for homes with frame walls or with basements. ** Estimated cost is based on using the asphalt sealant method ($12 / linear foot) plus a drainage line around the perimeter of the building $31 / linear foot). Source: FEMA P-312, Second Edition / December 2009. *** Estimated cost is based on assumption of 20 linear feet of shields (average price between metal and wood flood shields - $246), one plumbing check valve ($1,060) and one sump and sump pump with battery backup ($1,710). Source: FEMA P-312, Second Edition / December 2009. **** Total project costs do not include protecting any exterior utilities or service equipment such as air conditioning compressors or fuel storage tanks. Note: The values highlighted in the preceding table may change over time as CMSWS monitors and evaluates this plan and its processes.
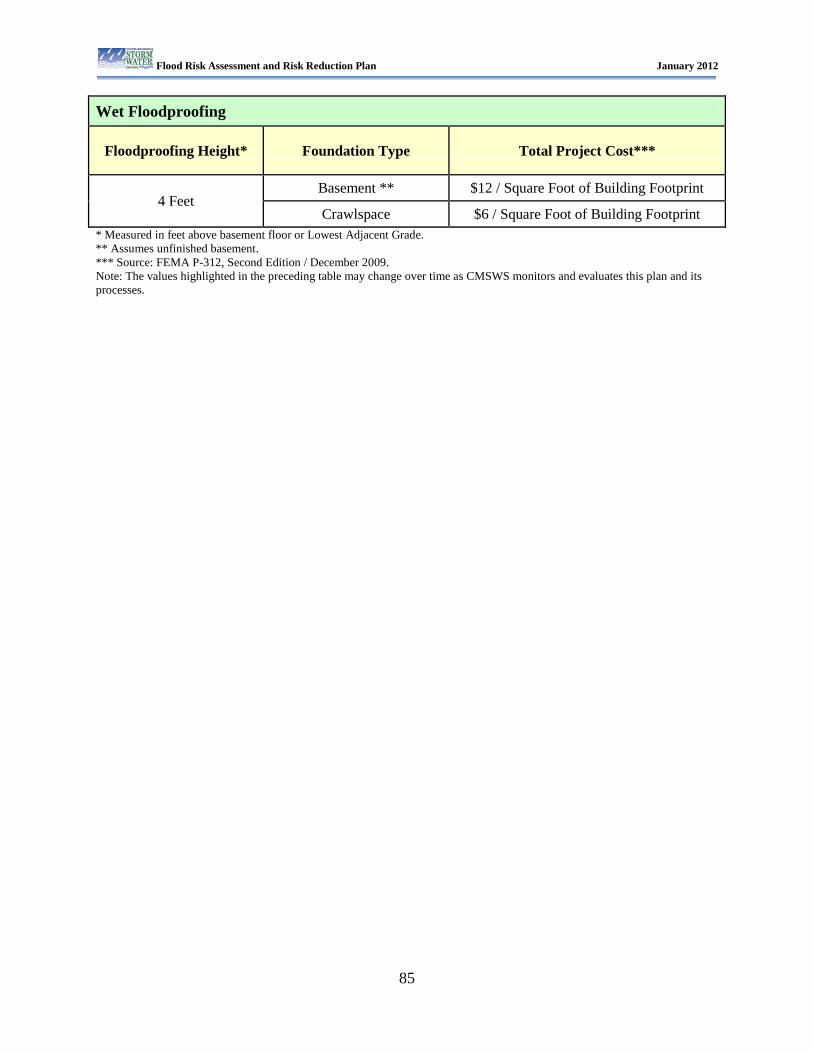
Flood Risk Assessment and Risk Reduction Plan January 2012
85
Wet Floodproofing
Floodproofing Height* Foundation Type Total Project Cost***
4 Feet Basement ** $12 / Square Foot of Building Footprint
Crawlspace $6 / Square Foot of Building Footprint * Measured in feet above basement floor or Lowest Adjacent Grade. ** Assumes unfinished basement. *** Source: FEMA P-312, Second Edition / December 2009. Note: The values highlighted in the preceding table may change over time as CMSWS monitors and evaluates this plan and its processes.
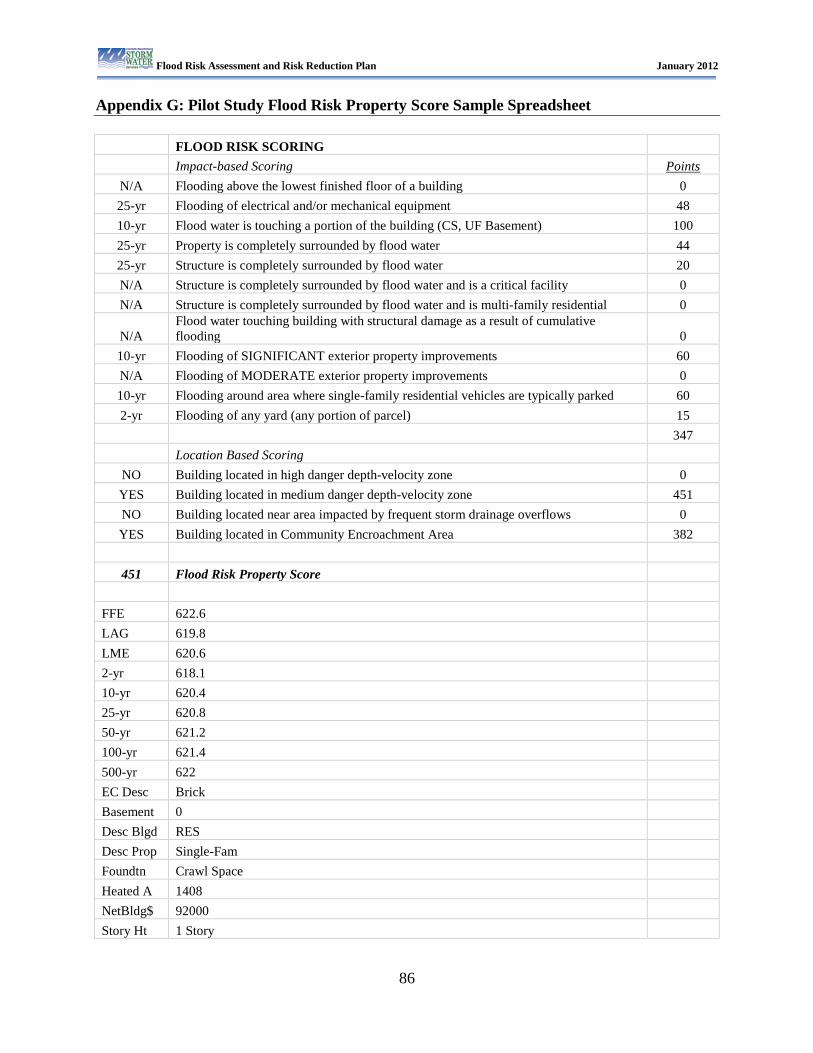
Flood Risk Assessment and Risk Reduction Plan January 2012
86
Appendix G: Pilot Study Flood Risk Property Score Sample Spreadsheet
FLOOD RISK SCORING
Impact-based Scoring Points N/A Flooding above the lowest finished floor of a building 0 25-yr Flooding of electrical and/or mechanical equipment 48 10-yr Flood water is touching a portion of the building (CS, UF Basement) 100 25-yr Property is completely surrounded by flood water 44 25-yr Structure is completely surrounded by flood water 20 N/A Structure is completely surrounded by flood water and is a critical facility 0 N/A Structure is completely surrounded by flood water and is multi-family residential 0
N/A Flood water touching building with structural damage as a result of cumulative flooding 0
10-yr Flooding of SIGNIFICANT exterior property improvements 60 N/A Flooding of MODERATE exterior property improvements 0 10-yr Flooding around area where single-family residential vehicles are typically parked 60 2-yr Flooding of any yard (any portion of parcel) 15
347
Location Based Scoring
NO Building located in high danger depth-velocity zone 0 YES Building located in medium danger depth-velocity zone 451 NO Building located near area impacted by frequent storm drainage overflows 0 YES Building located in Community Encroachment Area 382
451 Flood Risk Property Score
FFE 622.6 LAG 619.8 LME 620.6 2-yr 618.1 10-yr 620.4 25-yr 620.8 50-yr 621.2 100-yr 621.4 500-yr 622 EC Desc Brick Basement 0 Desc Blgd RES Desc Prop Single-Fam Foundtn Crawl Space Heated A 1408 NetBldg$ 92000 Story Ht 1 Story
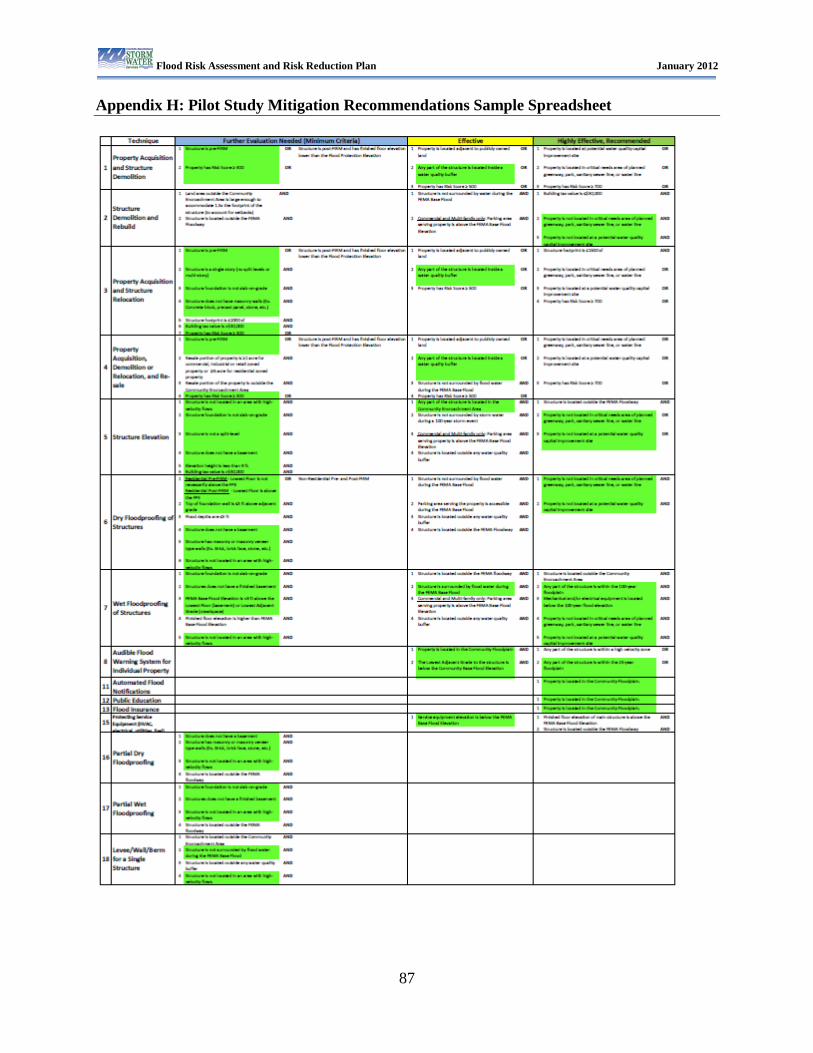
Flood Risk Assessment and Risk Reduction Plan January 2012
87
Appendix H: Pilot Study Mitigation Recommendations Sample Spreadsheet
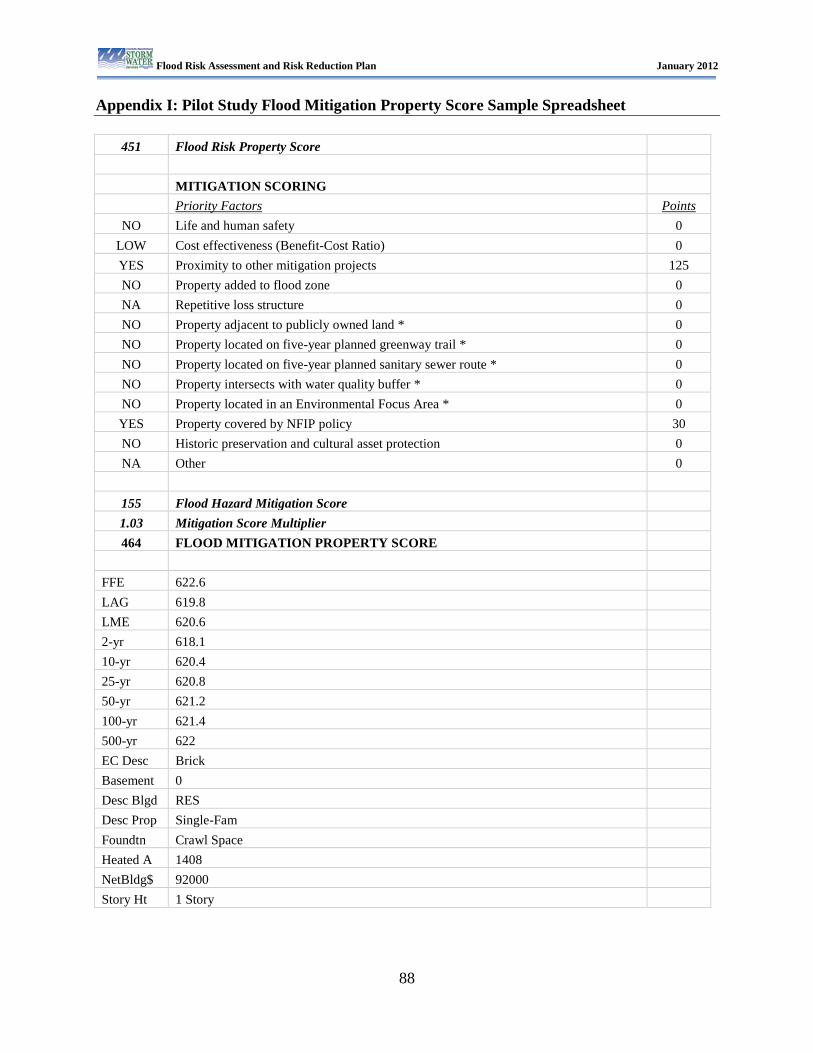
Flood Risk Assessment and Risk Reduction Plan January 2012
88
Appendix I: Pilot Study Flood Mitigation Property Score Sample Spreadsheet
451 Flood Risk Property Score
MITIGATION SCORING
Priority Factors Points
NO Life and human safety 0 LOW Cost effectiveness (Benefit-Cost Ratio) 0 YES Proximity to other mitigation projects 125 NO Property added to flood zone 0 NA Repetitive loss structure 0 NO Property adjacent to publicly owned land * 0 NO Property located on five-year planned greenway trail * 0 NO Property located on five-year planned sanitary sewer route * 0 NO Property intersects with water quality buffer * 0 NO Property located in an Environmental Focus Area * 0 YES Property covered by NFIP policy 30 NO Historic preservation and cultural asset protection 0 NA Other 0
155 Flood Hazard Mitigation Score 1.03 Mitigation Score Multiplier 464 FLOOD MITIGATION PROPERTY SCORE
FFE 622.6 LAG 619.8 LME 620.6 2-yr 618.1 10-yr 620.4 25-yr 620.8 50-yr 621.2 100-yr 621.4 500-yr 622 EC Desc Brick Basement 0 Desc Blgd RES Desc Prop Single-Fam Foundtn Crawl Space Heated A 1408 NetBldg$ 92000 Story Ht 1 Story