florian nichitiu, james r. drumond, jiansheng zou, robert deschamault(*) department of physics,...
TRANSCRIPT

Florian Nichitiu, James R. Drumond, Jiansheng Zou,Robert Deschamault(*)
Department of Physics, University of Toronto, Canada(*) COM DEV, Cambridge, Ontario, Canada.
Florian NichitiuJune 2003, CAP
South Atlantic Anomaly seen by MOPITT

Radiation effect on spacecraft systems and instruments
Spacecraft anomalies: from -------- easily recovered to -------- total mission failure origin: -- engineering (operation fault, mechanism failure and ageing) -- space weather which simulate engineering faults— BUT not only
Based upon the effect upon the s/c :
Surface charging | Photonics noise Deep dielectric charging | Total dose effects Single Event Upset (SEU) | Material degradation Solar radio frequency interference | Spacecraft drag
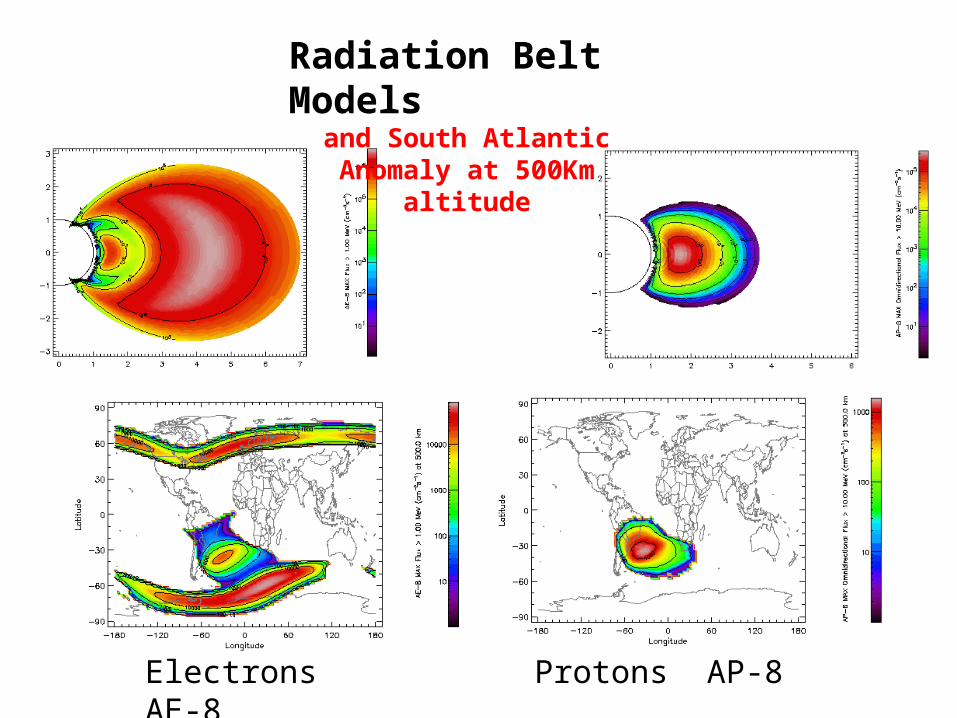
Electrons AE-8 Protons AP-8
Radiation Belt Modelsand South Atlantic Anomaly at
500Km altitude

Mopitt instrument
Two piezoelectric accelerometers
Cooler Compressor(vibrations for x,y,z)
Cooler Displacer(vibrations for x,y,z)
Multi-component force measurementsKistler: K-Shear accelerometer.Sensing element: quartz crystal

0.1 0.2 0.3 0.4 0.5 0.616229.58
16229.60
16229.62
16229.64
16229.66
16229.68
16229.70
16229.72
16229.74
Tim
e (d
ays)
Vibration (N)
-250
-200
-150
-100
-50
0
50
100
150
200
250
Selection limit
Width=0.03 NAverage=018 N
-0.6 -0.5 -0.4 -0.3 -0.2 -0.1
0.0
0.5
1.0
1.5
2.0
2.5
LOG
(N)
LOG(Vibration intensity)
Intensity (Vibration) distribution all events
A -0.48533 0.14097B -5.03397 0.44251
Mopitt Accelerometer anomalies
109.112 109.114 109.116 109.118 109.120 109.122 109.124 109.126
0.1
0.2
0.3
0.4
0.5
0.6
0.7
0.8
0.9
Co
mp
resso
r Z
vib
rati
on
DOY 110 (2003)
DOY 109 (2003) Comp Z Vib
110.072 110.074 110.076 110.078 110.080 110.082 110.084
Comp Z Vib

Mopitt Accelerometer Anomalies
Daily rate = 1.06 ev/daySAA events = 54 %Poles ( +/- 70 ) = 19.4 %; North/South asymmetry=0.43

8.0
16
24
32
40
48
56
64
72
-80 -60 -40 -20 0
-50
-40
-30
-20
-10
Mopitt DSE over SAA
Latit
ude
Longitude
Mopitt Accelerometer Anomalies in South Atlantic Anomaly region
Total time: 993 days; Total Nr ev over SAA=567 ( 54%) SAA rate= 0.57 ev/dayMopitt spend 6.25% of time over SAA SAA rate=9.14 ev/day

-80-60
-40
-20
0-50
-40
-30
-20
-10
0
10
20
30
40
50
60
70
80
Nr
of E
vent
s
Latitu
de
Longitude
-100 -80 -60 -40 -20 0
0
5
10
15
20
25
30
-47.295
29.200
Longitude
-60 -50 -40 -30 -20 -10 0
0
5
10
15
20
25
30
-25.993
16.870
Latitude
SAA seen by Mopitt
-150-100
-500
50100
150 -80
-60-40
-200
2040
6080
0
10
20
30
40
50
Nr
of E
vent
s
Latitu
deLongitude
------------

0 200 400 600 800 10000.00E+000
5.00E+008
1.00E+009
1.50E+009
2.00E+009
2.50E+009
3.00E+009
Proton Flux p E>1 MeV p E>10 MeV
DOY (from 2000)
0
2
4
6
8
10
12
14
16
18
N1
Y3
N1Y2
Y1
DOY (from 2000)
DS
E d
aily
rat
e
0 200 400 600 800 10000
2000000
4000000
6000000
8000000
10000000
12000000
14000000
DOY (from 2000)
Y2Y1
Proton Flux
DS
E d
aily
rat
e
p E>100 MeV
0
2
4
6
8
10
12
14
16
18
Y3
Solar Protons EventsDetected by Mopitt accelerometer
0 200 400 600 800 1000 1200-2
0
2
4
6
8
10
12
14
16
18
Average daily rate=
Daily Rate for Mopitt Accelerometer Anomalies
+/- 0.041861.05734
Dai
ly R
ate
DOY(from 2000)

Solar Proton Events
Max p Flux pfu @ >
10 MeV 100 MeV
Y1 Jul 14/15: 2000 24000 410
Y2 Nov 09: 2000 14800 347
N1 Sept 25: 2001 12900 31
Y3 Nov 06: 2001 31700 253
N2 Nov 24: 2001 18900 4
-Solar Proton Events ( from ftp://ftp.ngdc.noaa.gov/ ,
http://www.sel.noaa.gov/weekly/)
Mopitt Accelerometer detect SPE at 6 Nov(during the second peak of proton flux)

1.00E+011 2.00E+011 3.00E+011 4.00E+011
2
4
6
8
10
12
14
16
18
20
(Y1)
(Y3)
(Y2)
(N1 & N2)
SPE Proton Fluence (E=1 MeV to 150 MeV) [#/cm^2]
25 Sept. & 23 Nov. 2001
14/15 July 2000
9 Nov. 2000
6 Nov. 2001
Mop
itt #
DS
E d
urin
g S
PE
0 20 40 60 80 100 120
0.0
0.5
1.0
1.5
2.0
2.5
p+
(#1
0^10
/cm
^2)
Energy (MeV)
GOES-10 DataEvent Accumulated Fluence
Y1 Y2 Y3 N1 N2
30 35 40 45 500.00
0.05
0.10
0.15
0.20
0.25
0.30
0.35
0.40
0.45
0.50
0.55
SPE not dedected by Mopitt
SPE dedected by Mopitt
GOES-10 DataEvent Accumulated Fluence Y1
Y2 Y3 N1 N2
p+
(#1
0^10
/cm
^2)
Energy (MeV)
0.10 0.15 0.20 0.25 0.30 0.35 0.40 0.45 0.50 0.55
2
4
6
8
10
12
14
16
18
20
(N1 & N2)
(Y2)
(Y3)
(Y1)
Mo
pitt
# D
SE
du
ring
SP
E
25 Sept. & 23 Nov. 2001
9 Nov. 2000
6 Nov. 2001
14/15 July 2000
p+ (#10^10/cm^2) at 30 MeV
SPE detected by Mopitt. Energy dependence

-200 -150 -100 -50 0 50 100 150 200-100
-80
-60
-40
-20
0
20
40
60
80
100
Night Day
La
titu
de
Longitude
Mopitt DSE location during intense SPE
Mopitt Accelerometer Anomalies during intense SPE
- are caused by high energy charged particles precipitating via ‘pole horns’. - more events during the Day

1965 1970 1975 1980 1985 1990 1995 2000 2005
0
50
100
150
200
SC #21 SC #22 SC #23
SS
N
Year1995 1996 1997 1998 1999 2000 2001 2002 2003 2004
-20
0
20
40
60
80
100
120
140
160
180
SS
N
Year
Double Solar Maximum
2000.0 2000.5 2001.0 2001.5 2002.0 2002.5 2003.0100
110
120
130
140
Year R
I SS
N
F1
0.7
160
170
180
190
200
0 20 40 60 80 100 12060
80
100
120
140
160
180
200
From 1997 (Solar Activity min)
Sol
ar R
adio
Flu
x F
10.7
cm
SI SSN
1997 1998 1999 2000 2001 2002 20030
20
40
60
80
100
120
140
The sun radio emission at a wavelength of 10.7 cm and sun spot number
Max of SC #23
F1
0.7
RI S
SN
Year
60
80
100
120
140
160
180
200

0 5 10 15 20 25 30 35
0.0
0.2
0.4
0.6
0.8
1.0
1.2
1.4
1.6
1.8
2.0
2.2
Month (from 2000)
High Solar Activity
Monthly average of Mopitt DSE Daily Rate
Global for SAA region for polar regions
Mo
pit
t D
SE
Dai
ly R
ate
During High Solar Activity period( II sub-max) the relative contribution oftrapped particles in SAA decrease from 54%to 42% as a consequence of direct injectionof more high energy particles

0 200 400 600 800 1000 12000.0
0.5
1.0
1.5
2.0
2.5
DOY(2000)
DSE (total) DSE (over SSA)
DS
E d
aily
rat
e
0 200 400 600 800 1000 1200
0.4
0.6
0.8
1.0
1.2
1.4
1.6
1.8
2.0
2.2Daily DSE rate smmothing
DOY(2000)
Mop
itt D
SE
dai
ly r
ate
DSE all events 0.3
0.4
0.5
0.6
0.7
0.8
0.9
Mop
itt D
SE
dai
ly r
ate
DSE over SAA
0 200 400 600 800 1000 1200
130
140
150
160
170
180
190
200
210
220
Mopitt DSE
SSN
F10.7 cm
I sub-max II sub-max
F10
.7 c
m (
sfu)
& S
SN
(+
55)
Mop
itt D
SE
dai
ly r
ate
DOY(2000)
0.0
0.4
0.8
1.2
1.6
2.0
0 200 400 600 800 1000 1200
Correlation with Solar activity
Mopitt Accelerometer anomalies are
correlated with Solar Activity as shown by Solar Radio Flux :
index F10.7
27 days average
and smooth 27-average

Summary and conclusions
Analysis of Mopitt accelerometer anomalies anomalies are located in the SAA and polar regions anomalies are caused by the radiation environment (energetic particles). detection of SPE the energetic particles are mainly high energy protons (30-50 MeV). Piezoelectric (SiO2) accelerometer a possible new effect: piezoelectricity induced by corpuscular radiation. decrease of relative SAA contribution during High Solar Activity (second max) injection of more high energy particles (via poles) during Solar Activity second sub-max ( Solar Cycle 23). direct correlation with Solar Activity as expressed by Solar Radio Flux (F107) the Solar Radio Flux at 10.7 cm is a more complex proxy for Solar Activity.