florida department of revenue - mtc.gov€¦ · appendix 5, acceptance sampling table ......
TRANSCRIPT

© 2004 by Florida Department of Revenue
Florida Department of Revenue

Florida Department of Revenue April 2004 Page i
Non-Statistical Sampling
PurposeThe purpose of this booklet is to inform taxpayers, practitioners, and other interested parties of the sampling methods that can be used by the Department and to provide a general understanding of what to expect if the auditor uses non-statistical sampling. Although the emphasis is upon sales and use tax, the same procedures may be used for audits of other taxes administered by the Florida Department of Revenue.
Credits
Designed and developed by the Florida Department of Revenue, General Tax Administration Statistics Team.
Sponsored by:
State of FloridaDepartment of RevenueGeneral Tax Administration ProgramCompliance Review ProcessTallahassee, Florida

Florida Department of Revenue April 2004 Page iii
Non-Statistical Sampling

Florida Department of Revenue April 2004 Page iii
Non-Statistical Sampling
Florida Department of RevenueNon-Statistical Sampling
Table of ContentsSubject Page No.
Non-Statistical Sampling...............................................................................................1
Selecting the Sample.........................................................................3
Completing the Sample.....................................................................6
Projecting and Allocating Sample Results........................................7
Appendix 1, Sampling Survey.......................................................................................9Appendix 2, Non-Statistical Sampling Steps..............................................................11Appendix 3, Sampling Agreement..............................................................................13Appendix 4, Sampling Plan.........................................................................................15Appendix 5, Acceptance Sampling Table....................................................................17Appendix 6, Acceptance Sampling............................................................................19Appendix 7, WinSample Data Directory.....................................................................27Appendix 8, Table of Z Values.....................................................................................31Appendix 9, Table of T Values.....................................................................................33
Glossary........................................................................................................................35
Bibliography.................................................................................................................39

Florida Department of Revenue April 2004 Page 1
Non-Statistical Sampling
Florida Department of Revenue April 2004 Page 1
Non-Statistical Sampling
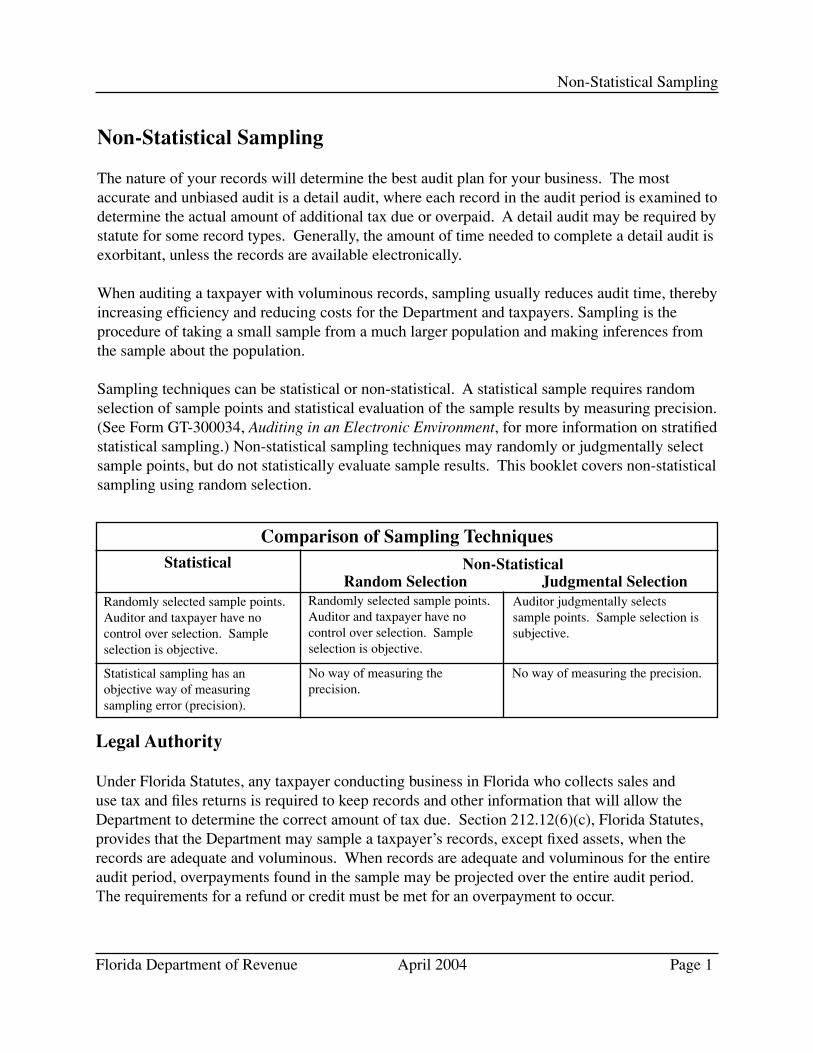
Non-Statistical Sampling
The nature of your records will determine the best audit plan for your business. The most accurate and unbiased audit is a detail audit, where each record in the audit period is examined to determine the actual amount of additional tax due or overpaid. A detail audit may be required by statute for some record types. Generally, the amount of time needed to complete a detail audit is exorbitant, unless the records are available electronically.
When auditing a taxpayer with voluminous records, sampling usually reduces audit time, thereby increasing efficiency and reducing costs for the Department and taxpayers. Sampling is the procedure of taking a small sample from a much larger population and making inferences from the sample about the population.
Sampling techniques can be statistical or non-statistical. A statistical sample requires random selection of sample points and statistical evaluation of the sample results by measuring precision. (See Form GT-300034, Auditing in an Electronic Environment, for more information on stratified statistical sampling.) Non-statistical sampling techniques may randomly or judgmentally select sample points, but do not statistically evaluate sample results. This booklet covers non-statistical sampling using random selection.
Legal Authority
Under Florida Statutes, any taxpayer conducting business in Florida who collects sales and use tax and files returns is required to keep records and other information that will allow the Department to determine the correct amount of tax due. Section 212.12(6)(c), Florida Statutes, provides that the Department may sample a taxpayer’s records, except fixed assets, when the records are adequate and voluminous. When records are adequate and voluminous for the entire audit period, overpayments found in the sample may be projected over the entire audit period. The requirements for a refund or credit must be met for an overpayment to occur.
Comparison of Sampling TechniquesStatistical Non-Statistical
No way of measuring the precision.
Randomly selected sample points. Auditor and taxpayer have no control over selection. Sample selection is objective.
Statistical sampling has an objective way of measuring sampling error (precision).
Randomly selected sample points. Auditor and taxpayer have no control over selection. Sample selection is objective.
Auditor judgmentally selects sample points. Sample selection is subjective.
Judgmental SelectionRandom Selection
No way of measuring the precision.

Page 2 April 2004 Florida Department of Revenue
Non-Statistical Sampling
Florida Department of Revenue April 2004 Page 3
Non-Statistical Sampling
According to s. 212.12(6)(b), F.S., if a taxpayer does not have adequate records of retail sales or purchases, the Department may project a deficiency from a sample of the taxpayer’s available records. There is no provision in (6)(b) to project an overpayment for taxpayers who do not have adequate records. When a taxpayer’s records are inadequate, any refund or credit must be verified by a detail examination of the records available concerning the refund. The auditor must document in the case file the nature of the taxpayers’ records and the basis for his or her determination.

Page 2 April 2004 Florida Department of Revenue
Non-Statistical Sampling
Florida Department of Revenue April 2004 Page 3
Non-Statistical Sampling
Selecting the Sample
The first step in selecting the sample is to identify the sampling frame. The sampling frame is a group of items from which the sample is drawn or a listing of sampling units. In a homogeneous sampling frame, any item in the frame is representative of any other item; therefore, a random selection of all items in the frame will be representative.
The auditor determines how the accounting records are physically stored and available in order to identify the sampling frame. Typically, accounting records have numbered sampling frames or non-numbered sampling frames, or they may have a combination of both.
Both numbered and non-numbered sampling frames can be randomly sampled using WinSample. WinSample is a software program developed by the General Tax Administration’s Statistics Team and Applied Technology. WinSample randomly selects sample points from many possible sampling frames using a seed number. WinSample may be used when taxpayer records are not available in an electronic format suitable for stratified statistical sampling or e-Auditing.
Numbered sampling frames include source documents that are consecutively numbered. Some examples are:
• Invoice numbers• Voucher numbers• Check numbers
Non-numbered sampling frames include source documents that have no natural numbering system. Although not consecutively numbered, a random sample of the transactions may still be identified. Some examples of non-numbered sampling frames supported in WinSample are:
• Time periods (days, weeks, months, quarters)• Journals (with page numbers and multiple lines on each page)• Imaged documents• Microfiche
After the sampling frame is identified, data integrity tests for each sampling frame should be performed. Data integrity tests should be performed on both numbered and non-numbered populations. Acceptance sampling can be used in tax auditing to assist in determining data integrity and whether a taxpayer’s records are adequate or inadequate.
Page 4 April 2004 Florida Department of Revenue
Non-Statistical Sampling
Florida Department of Revenue April 2004 Page 5
Non-Statistical Sampling
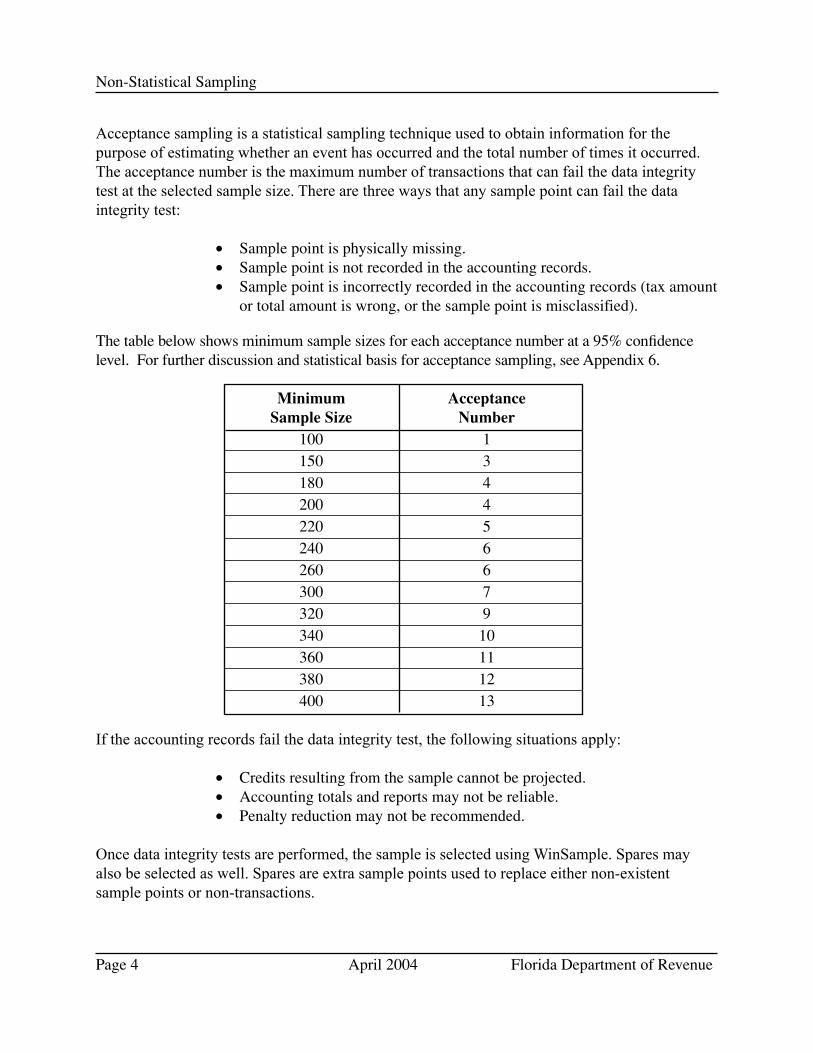
Acceptance sampling is a statistical sampling technique used to obtain information for the purpose of estimating whether an event has occurred and the total number of times it occurred. The acceptance number is the maximum number of transactions that can fail the data integrity test at the selected sample size. There are three ways that any sample point can fail the data integrity test:
• Sample point is physically missing.• Sample point is not recorded in the accounting records.• Sample point is incorrectly recorded in the accounting records (tax amount
or total amount is wrong, or the sample point is misclassified).
The table below shows minimum sample sizes for each acceptance number at a 95% confidence level. For further discussion and statistical basis for acceptance sampling, see Appendix 6.
Minimum Acceptance Sample Size Number 100 1 150 3 180 4 200 4 220 5 240 6 260 6 300 7 320 9 340 10 360 11 380 12 400 13
If the accounting records fail the data integrity test, the following situations apply:
• Credits resulting from the sample cannot be projected.• Accounting totals and reports may not be reliable.• Penalty reduction may not be recommended.
Once data integrity tests are performed, the sample is selected using WinSample. Spares may also be selected as well. Spares are extra sample points used to replace either non-existent sample points or non-transactions.

Page 4 April 2004 Florida Department of Revenue
Non-Statistical Sampling
Florida Department of Revenue April 2004 Page 5
Non-Statistical Sampling
Suggested sample sizes can be based on the following guidelines:
• Acceptance sampling • Central limit theorem• Student’s t• Taxpayer request
The sample points selected for acceptance sampling can also be used as the sample points to determine compliance. Whether the records are adequate or inadequate, the randomly selected sample points can be used for the sample.
The central limit theorem applies when a sample size of at least 30 sample points is used. In accordance with the central limit theorem, the sample means will be normally distributed for random samples taken from the population, regardless of the population’s distribution or size. Therefore, a sample of 30 sample points can be used if this method is selected. See the Appendices for the normal distribution table.
The student’s t distribution can be used for sample sizes less than 30 sample points. Based on statistical methodologies, a minimum sample size of 5 is recommended. Further discussion of the student’s t distribution is found in the Appendices.
A sample size may be requested by the taxpayer. The auditor’s experience and judgment as well as the suggested sample size guidelines will be used to determine if the taxpayer’s requested sample size is large enough.
Suggested sample sizes listed below are based on acceptance sampling, the central limit theorem, or student’s t distribution for each sampling frame.
Sampling Frame Suggested Sample sizeNumbered Acceptance sampling # or 30 sample pointsNon-Numbered:
• Time Periods (Days) 5 or 30 days• Time Periods (Weeks) 5 weeks• Time Periods (Months) 5 months• Time Periods (Quarters) 2 quarters• Journal Pages and Lines Acceptance sampling # or 30 sample points• Image Documents Acceptance sampling # or 30 sample points• Microfiche Documents Acceptance sampling # or 30 sample points

Page 6 April 2004 Florida Department of Revenue
Non-Statistical Sampling
Florida Department of Revenue April 2004 Page 7
Non-Statistical Sampling
Completing the Sample
The Department requests source documents to verify the tax treatment of the sample points. If tax was due on a transaction and not paid or accrued, an underpayment is scheduled in the audit workpapers. If tax was not due on a transaction, but paid or accrued in error, an overpayment will be scheduled in the audit workpapers if the taxpayer has met the requirements for a refund of taxes paid to the Department in error. All sample points will be examined and documented in the audit workpapers. Correctly taxed transactions will not be deleted, but will hold 0.00 additional tax due value.
Negative invoices are entered as credit amounts. This does reduce the sample base; however, negative sample points (i.e. credit memos) normally occur in any population. Gross sales and other population totals include negative amounts, and they are not adjusted.
Outliers are items that are larger or smaller than the majority of items in the population. They are also called extraordinary, exceptional, or non-recurring items. Any random sample may contain what others may consider outliers. With simple random sampling, all items in the population have an equal chance of being selected. You should not remove any sample points from your sample. All sample points are projected.
The results of the sample are provided to the taxpayer during the audit, so that any available supporting documentation can be located. Any sample points without supporting source documents are considered taxable and will be scheduled as an underpayment.
Non-existent or non-transaction sample points will be replaced by spare sample points in the order selected by the WinSample program. Examples of non-existent or non-transactions for each type of sampling frame include:
Numbered Sampling Frames
• Voided invoices.• Voided checks.• Voided vouchers.• Fixed asset invoices are examined in detail
by statute.• Real property rental or other transactions
are easily examined in detail.• Transactions outside the audit period.
Non-Numbered Sampling Frames
• Time periods – days, months, weeks or quarters where the business was closed (holidays, etc.).
• Journal pages or lines that do not exist.• Image frame that does not exist.• Image frame that does not contain an
invoice (envelopes, correspondence, etc.).• Microfiche row or column that does not
exist on the selected sheet.• Transactions outside the audit period.
Non-statistical sampling does not calculate precision and there is no statistical evaluation of the sample results, so expanding the sample is a judgmental decision made by the auditor, the auditor’s manager, and/or the taxpayer.

Page 6 April 2004 Florida Department of Revenue
Non-Statistical Sampling
Florida Department of Revenue April 2004 Page 7
Non-Statistical Sampling
If the sample is expanded, any remaining spares will be examined in the order selected. If necessary, additional sample points will be randomly selected from the original sampling frame using WinSample and the same seed number used to select the original sample points. The additional sample points are then added to the original sample transactions in the exhibit and audited for tax compliance.
Projecting and Allocating Sample Results
The ratio estimator is the preferred estimator for non-statistical sampling because it weighs any errors of the sample proportionately by dollar value. The difference estimator is an average error per sample point. With non-statistical sampling, the difference estimator may skew the average because of the increased variability of the sample without stratification.
The ratio estimator calculates a percentage based on the ratio of the sample results to the sample base. In the case of overpayments, the sample results would be a negative amount divided by the sample base. The ratio is multiplied by the sampling frame dollars per month to obtain total additional tax due or overpaid for the exhibit.
The sample results may be represented by additional tax due or additional taxable amount. If additional tax due is used the ratio is called the percentage of error. If additional taxable amount is used the ratio is called the error ratio.
The percent of error exhibit calculates a percentage of the total additional tax due of the sample points divided by the sample base:
Additional tax of the sample pointsSample base
The percent of error is multiplied by the total value of the sampling frame to obtain additional tax due or overpaid for the population. The percent of error can be used when sales are made to multiple counties with varying tax rates or purchases are acquired in multiple counties. Separate exhibits for each county may also be used in audits with multiple counties.
The error ratio exhibit type calculates a percentage of the total additional taxable amount of the sample points divided by the sample base:
Additional taxable amount of the sample pointsSample base

Page 8 April 2004 Florida Department of Revenue
Non-Statistical Sampling
Florida Department of Revenue April 2004 Page 9
Non-Statistical Sampling
The error ratio is multiplied by the total value of the sampling frame to obtain additional taxable amounts for both the state and county for the exhibit. The error ratio should only be used when sampling just one county since the additional taxable amount is multiplied by the state and county rate for each month in the period.

Page 8 April 2004 Florida Department of Revenue
Non-Statistical Sampling
Florida Department of Revenue April 2004 Page 9
Non-Statistical Sampling
Appendix 1 Sampling Survey
The answers to the following questions will help determine appropriate sampling frames for each audit:
1. How many sales invoices are generated per month?
2. How many purchase invoices are paid each month?
3. Are any of the source documents numbered sequentially? Are they filed that way?
4. How and where are the source documents physically filed?
5. Are source documents available on journals, microfiche, or imaging systems?
6. If there is an imaging system, which documents are imaged? (Invoices, purchase orders, correspondence, envelopes, interoffice memos, etc.)
7. Are there any source documents not available for review?
8. Have the operations of the company significantly changed during the audit period? (Changes in accounting staff, computer system, operations, etc.)
9. Does the company separate sales and/or purchases transactions by location, product line, or in some other manner (by department, store location, division, etc.)?
10. Are fixed asset transactions filed separately from general purchases?
11. Are sales invoices for Florida sales and out-of-state sales filed together?
12. Are sales invoices for both exempt and taxable sales filed together?
13. Are inventory purchases (for resale) filed separately from general expenses?
14. When are the DR-15s filed, i.e., monthly, quarterly, semi-annually, or annually?
15. How are the DR-15s filled out – are all sales combined or are they separated?
16. If the DR-15s contain combined sales figures, are monthly totals for each area to be sampled available?

Page 10 April 2004 Florida Department of Revenue
Non-Statistical Sampling
Florida Department of Revenue April 2004 Page 11
Non-Statistical Sampling
17. What is the fiscal year of the company?
18. Are there any days when the company is closed?
19. If records are filed weekly, what constitutes a week? (Mon. – Fri., Tue. – Sat., etc.)
20. If records are filed quarterly, what constitutes a quarter? (Jan. – Mar., Feb. – Apr., etc.)

Page 10 April 2004 Florida Department of Revenue
Non-Statistical Sampling
Florida Department of Revenue April 2004 Page 11
Non-Statistical Sampling
Appendix 2 Non-Statistical Sampling Steps
Selecting the Sample
Step Action Considerations Result1 Identify the sampling
frame.• Numbered records: Single range, multiple
ranges, either overlapping or non-overlapping.
• Non-numbered records: Time periods (days,
weeks, months, quarters), journals, imaged documents, or microfiche.
The most homogeneous sampling frame is determined, based on how the taxpayer records and stores its records.
2 Select a sample size. • Acceptance sampling• Central limit theorem• Student’s t• Taxpayer request
A sample size is selected.
3 Randomly select sample points.
• Select the appropriate option in WinSample.
• Set sampling frame parameters.
A randomly selected sample is generated using WinSample.

Page 12 April 2004 Florida Department of Revenue
Non-Statistical Sampling
Florida Department of Revenue April 2004 Page 13
Non-Statistical Sampling
Completing the Sample
Step Action Considerations Result1 Audit the sample points. • Create exhibits in
Department software.• Examine documentation.• Record results in
Department software.• Replace sample points, if
needed, with spares.
The sample will be examined and the results recorded in Department software.
2 Expand the sample. • Review sample results with taxpayer.
• Determine whether to expand the sample.
• Examine remaining spares.
• Select additional sample points using WinSample.
The sample will be expanded to include additional sample points.
3 Review additional sample points.
• Import additional points into Department software.
• Review additional documentation.
• Record results.
The expanded sample is audited.
Projecting and Allocating Sample Results
Step Action Considerations Result1. Project sample results. • Import or enter the
monthly amounts to use for projecting sample results.
• Prepare % of error or error ratio schedule.
• Prepare additional tax due schedule.
Sample results are projected to the sampling frame.

Page 12 April 2004 Florida Department of Revenue
Non-Statistical Sampling
Florida Department of Revenue April 2004 Page 13
Non-Statistical Sampling
Appendix 3 Sampling Agreement
This agreement made and entered into by and between the Florida Department of
Revenue, hereafter referred to as “The Department,” and Company Name, FEI# ___________,
Audit #_________________, hereafter referred to as “Taxpayer.” The Department and Taxpayer
will be collectively referred to herein as “Parties.”
WITNESSETH
WHEREAS, the Parties wish to facilitate the completion of a sales and use tax
compliance audit, Audit Number __________________;
WHEREAS, the Parties agree that the records of Taxpayer are so voluminous in nature
and substance that a sampling is an effective, expedient, and adequate method to facilitate the
audit;
NOW, THEREFORE, in consideration of the mutual premises contained herein, it is
hereby agreed to by the Parties as follows:
1. Pursuant to section 212.12(6) (c), Florida Statutes, the audit of
Taxpayer for the period __________ shall be controlled by the sampling method set
forth in the sampling plan(s) included in the audit workpapers.
2. This sample shall be deemed to be representative of all of the
transactions pertaining to Taxpayer’s business and the findings of this sampling shall
be projected over the period set forth in the sampling plan(s).

Page 14 April 2004 Florida Department of Revenue
Non-Statistical Sampling
Florida Department of Revenue April 2004 Page 15
Non-Statistical Sampling
In Witness whereof, we as representatives of the respective parties have hereunto set our
hand and in so doing we hereby bind the parties who we represent.
FLORIDA DEPARTMENT OF REVENUE
By:____________________________________
Jim Zingale, Executive Director or his designee(s)
_______________________________________ Title Date
By:_____________________________________
Officer or owner of business
________________________________________Title Date

Page 14 April 2004 Florida Department of Revenue
Non-Statistical Sampling
Florida Department of Revenue April 2004 Page 15
Non-Statistical Sampling
Appendix 4 Sampling Plan
This sampling plan explains and defines the sampling method to be used in conducting the sample of sales invoices.
TAXPAYER NAME
Sample Company AUDIT NO.__0201234577____________
FEI# ______________________________
1. Define the Sampling Frame
Florida Department of Revenue auditors will sample sales invoices from the period 01/01/2000 – 12/31/2002. Sales invoices are consecutively numbered beginning with invoice #10000 and ending with invoice #18000 for the audit period, which will be the sampling frame.
2. Method of Sampling
The method used for sample selection will be simple random sampling. Spare sample points will be identified in the event that an invoice selected is non-existent or a non-transaction (voided invoice, an invoice never issued, etc.).
3. Sample
A sample of 100 sample points will be examined and the results used to determine tax compliance. A total of 25 spares will be identified and used for non-existent or non-transactions. If needed, spares will be used in the order selected.
4. Random Selection of Sample Points
The sample has been randomly selected from the population using Department software (WinSample) and the randomly generated seed number (see below). Taxpayer will provide the Department with the source documents for the sample points selected. The auditor will determine additional tax due or overpaid for each sample point. The auditor will review and discuss the results of the sample with the taxpayer. If requested, the sample may be expanded to include additional sample points. Additional sample points, if needed, will be selected using the same seed number below.
Random Selection Seed Number: 23242012

Page 16 April 2004 Florida Department of Revenue
Non-Statistical Sampling
Florida Department of Revenue April 2004 Page 17
Non-Statistical Sampling
5. Calculation of Additional Tax Due or Overpaid
Additional tax due or overpaid will be calculated using the ratio estimator. The ratio estimator calculates a percentage of error based on ratio of additional tax due or overpaid from the sample divided by the dollars examined in the sample.
The auditor will schedule all sample points into the exhibit to determine the sample base for the sampling frame. Exceptions will be totaled and a percentage of error will be calculated. This percentage will then be multiplied by sampling frame totals, which are the monthly amounts of the sales invoices as reported on taxpayer’s financial statements. The Sales and Use Tax Returns (DR15s will not be used for projecting the error, since the sampling frame includes only sales invoices, and the gross sales reported on the DR-15s include other sales that were not sampled.
There is no minimum number of errors. If no errors are found, additional tax due or overpaid is 0.00 for the exhibit. Even if only a single error is found, it is projected, whether the error is a tax deficiency or overpayment.
6. Sampling Plan Applicable Only to the Taxpayer
This sampling plan is only applicable to the Taxpayer identified above and is not intended to be a rule or a statement of general applicability.

Page 16 April 2004 Florida Department of Revenue
Non-Statistical Sampling
Florida Department of Revenue April 2004 Page 17
Non-Statistical Sampling
Appendix 5 Acceptance Sampling Table
ACCEPTANCE SAMPLING (HYPERGEOMETRIC PROBABILITIES)SAMPLE SIZES AND ACCEPTANCE NUMBERS
PROBABILITY THAT ERROR IN A UNIVERSE > 1000 IS < :

Florida Department of Revenue April 2004 Page 19
Non-Statistical Sampling

Florida Department of Revenue April 2004 Page 19
Non-Statistical Sampling
Appendix 6 Acceptance Sampling
Attributes Sampling Plans AKA Acceptance SamplingAttribute Sampling Plans
©Dr. C. G. ChentnikDecember 2, 2002
These plans are used to estimate the rate (percentage) of occurrence of a specific quality (attribute) in a population. They answer the question: “How Many?” We might use this type of sampling plan to estimate the number of taxable invoices. A possible conclusion using attributes sampling could be that “There is only a 5% risk that the true rate of taxable entries in our population exceeds 6%.”
Any statistical sampling plan will by its very nature have inherent estimation errors. The suggestion is to detail or look at every data point rather than sample. The decision to sample the taxpayer’s records is a managerial one based on the cost of detailing each and every record. Any detail sample will be more accurate than one involving a prediction based on statistics. We use statistics to estimate the parameters of interest. It is my recommendation to detail as large a population as is cost effective before resorting to a sampling methodology.
Notation -- Acceptance Sampling
R = number of successes or complete record matches n = number of trials
π = trial success probability
r = 0, 1, 2, 3, ..., n n = sample size for our problem
P= the Population proportion of correct records
Q= (1-P) or the Population proportion of incorrect records
p= the sample proportion of correct records
q= (1-p) or the sample proportion of incorrect records

Page 20 April 2004 Florida Department of Revenue
Non-Statistical Sampling
Florida Department of Revenue April 2004 Page 21
Non-Statistical Sampling
______
σp ≅ √ PQ/n = it is assumed that p is normally distributed about P and
therefore this is an approximate statement for the standard deviation of the probability distribution of interest.
Since p is assumed normally distributed about P, upon repeated sampling, it will lie within the range ( P ± 2σ
p ) with a 95% chance. Hence, this expression is applicable:
______
2 √ PQ/n = 5 % = .05 or n = 4PQ and, .0025 ∀ p ≤ .5,
n ≤ 400.
Notice the difficulty that appears and is common to every problem of estimating the correct sample size. Namely an expression for n has been developed where n depends on the very property of the population we want to estimate — P. We therefore need some idea of the likely value of P.
Pr = a probability statement
d = actual error of estimation; some tolerable margin of error d in the estimated proportion
α = the risk that we are willing to incur that the actual error is larger than d

Page 20 April 2004 Florida Department of Revenue
Non-Statistical Sampling
Florida Department of Revenue April 2004 Page 21
Non-Statistical Sampling
Discussion
The extant situation is likened to a Bernoulli process, which is described as a random experiment consisting of a sequence of trials (randomly drawn sample points) which is characterized by:
1) Each sample point can have only one of two possible outcomes — success or failure.(Success in our situation is defined as a correct record match and failure is an incorrect match.)
2) Every outcome of each preceding trial’s results is independent of all other trials.
3) The probability for success is a stationary constant for all trials.
4) The probability for success is p and the probability for failure is q = (1-p) and their
definitions are interchangeable.
If, as in our case, the outcomes are the results of a Bernoulli process, then the number of successes – R — is said to have a binomial distribution.
The below expression, referred to as the binomial formula, is appropriate for any Bernoulli process:
Pr[R=r] = [ n!/[r!(n-r)!] ] π r(1-π )n-r
where, R = number of successes or complete record matches n = number of trials π = trial success probability r = 0, 1, 2, 3, ..., n ! = Factorial
If we are interested in the proportion of successes r/n we have this probability formula:
Pr[ P=r/n ] = [ n!/[r!(n-r)!] ] π r(1-π )n-r
Where, P = r/n is the proportion of successes.
An interesting and fundamental property of the binomial distribution is that we may approximate its probability density function with that of the normal probability function. This fundamental property holds for all values of π (excepting the obvious cases of 0 and 1) , as n becomes large.

Page 22 April 2004 Florida Department of Revenue
Non-Statistical Sampling
Florida Department of Revenue April 2004 Page 23
Non-Statistical Sampling
Cumulative probability distribution for the proportion of correct records in the taxpayer’s records:
r r/n = r/10 P{ P = r/n } P{ P≤ r/n )
0 0 .0060 .0060 1 .1 .0404 .0464 2 .2 .1209 .1673 3 .3 .2150 .3823 4 .4 .2508 .6331 5 .5 .2007 .8338 6 .6 .1114 .9452 7 .7 .0425 .9877 8 .8 .0106 .9983 9 .9 .0016 .9999 10 1.0 .0001 1.000
The unit normal approximation to the binomial uses these established statistical constructs:
E(P) = π or the mean or expected value E is what is used in the unit normal’s case
_____________ | π ( 1- π )
σ
p = √ n
Assuming that P has a sampling distribution that is shaped like a unit normal, we can convert P into a unit normal variable by the following transformation:
Z = P - π σ
p
From these relationships we can proceed to use all the tools provided by the unit normal probability distribution.

Page 22 April 2004 Florida Department of Revenue
Non-Statistical Sampling
Florida Department of Revenue April 2004 Page 23
Non-Statistical Sampling
Acceptance Sampling
In our problem we would be using a variant of attributes statistical sampling called acceptance sampling.
We want to accept/certify the auditee’s record keeping system as adequate or it has “data integrity” with some set minimum quality. Consider a small sample problem: the size of the records’ base submitted for approval is N=5000. The desired success rate is 95%; the sample size is n=100. The decision rule is if 7 or fewer failures (non-matches) are detected in the sample, the taxpayer’s records are accepted as meeting the minimum 5% defective criterion.
The number 7 is called the acceptance number. Thus the taxpayer’s records will be accepted if the sample proportion defective P is less than or equal to .07 = 7/100. Suppose that π = .10. If we knew that π = .10, the taxpayer’s records would not be accepted. We need: _____________ | .1( 1- .1) = .03 σ
p = √ 100
The probability of acceptance therefore is computed in this fashion:
P [ P ≤ .07 ] = P [ P - π ] ≤ [.07 - .10] = 1.00 = Z value σ
p .03
P [ Z ≤ 1.00] = .5000 - .3413* = .1587*Read from a table of unit normal probabilities
Thus there would be a 15.87% (called the consumer’s risk) probability of accepting a record’s base which truly has a fraction defective greater than 5%. For this sampling plan to work, it is clear that either a smaller acceptance number is appropriate or a larger sample size is necessary.
If we were to lower our acceptance number to 6, we would have:
P [ P ≤ .06 ] = P [ P - π ] ≤ [.06 - .10] = 1.333333 σ
p .03
P [ Z ≤ 1.3333333] = .5000 - .4085* = .0915 or 9.15%

Page 24 April 2004 Florida Department of Revenue
Non-Statistical Sampling
Florida Department of Revenue April 2004 Page 25
Non-Statistical Sampling
If we were to lower our acceptance number to 5, we would have:
P [ P ≤ .05 ] = P [ P - π ] ≤ [.05 - .10] = 1.666666 σ
p .03
P [ Z ≤ 1.666666] = .5000 - .4525* = .0475 or 4.75%
This last result meets these strictest requirements, but only if we know that π is really = .10 .
Another kind of erroneous decision may be made. Let us suppose that the true value π is really .05 in the above instance. Since 8 or more defective records would give cause for rejection, a different type of mistake is committed: rejecting a good record’s base because we had a larger number of defectives show up in our sample than we can abide. We might want to know this probability — called the producer’s risk.
_____________ | .05( 1- .05) = .0217944 σ
P = √ 100
P [ .07 > P ] = P [ .07 - .05] = .9176669 .0217944
P [ .9176669 < Z] = .5000 - .3485 = .1515
Thus there is a 15.15% chance that a good record’s base will be erroneously rejected; this is called the producer’s risk. These errors are also known as Type I and Type II errors.
Both of these latter computations revolve around the fact that we know π . In actuality we do not know this value. We therefore would tend toward increasing the sample size until we felt at ease with these errors.
Sample Size Determination for Acceptance Sampling
We must determine the parameter to be estimated and the standard deviation of its point estimator. Then:
1. Solve this equation for the sample size:
2. Choose B, the bound on the acceptable margin of error, and a confidence coefficient (1- α), Z
α/2 x (standard deviation of the estimator) = B where Zα /2
is the value of Z having area α /2 to its right.
The bound B on the margin of error is .05 = 5%.
Page 24 April 2004 Florida Department of Revenue
Non-Statistical Sampling
Florida Department of Revenue April 2004 Page 25
Non-Statistical Sampling
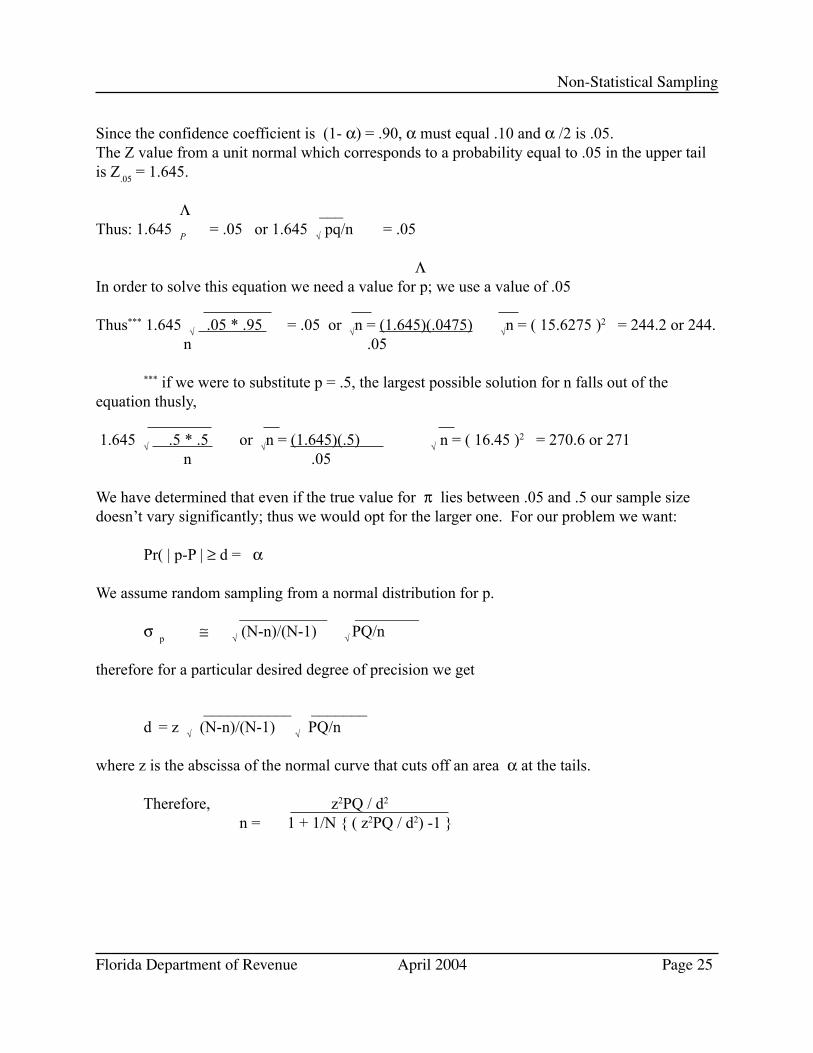
Since the confidence coefficient is (1- α) = .90, α must equal .10 and α /2 is .05. The Z value from a unit normal which corresponds to a probability equal to .05 in the upper tail is Z
.05 = 1.645.
Λ ___Thus: 1.645
P = .05 or 1.645 √ pq/n = .05
ΛIn order to solve this equation we need a value for p; we use a value of .05 Thus*** 1.645 √ .05 * .95 = .05 or √n = (1.645)(.0475) √n = ( 15.6275 )2 = 244.2 or 244. n .05
*** if we were to substitute p = .5, the largest possible solution for n falls out of the equation thusly, 1.645 √ .5 * .5 or √n = (1.645)(.5) √ n = ( 16.45 )2 = 270.6 or 271 n .05
We have determined that even if the true value for π lies between .05 and .5 our sample size doesn’t vary significantly; thus we would opt for the larger one. For our problem we want:
Pr( | p-P | ≥ d = α
We assume random sampling from a normal distribution for p. ___________ ________
σ
p ≅ √ (N-n)/(N-1) √
PQ/n
therefore for a particular desired degree of precision we get
___________ _______ d
= z √ (N-n)/(N-1) √ PQ/n
where z is the abscissa of the normal curve that cuts off an area α at the tails.
Therefore, z2PQ / d2
n = 1 + 1/N { ( z2PQ / d2) -1 }

Page 26 April 2004 Florida Department of Revenue
Non-Statistical Sampling
Florida Department of Revenue April 2004 Page 27
Non-Statistical Sampling
An advance estimate p for P is usually substituted here. Also if N is large the finite population correction factor (fpcf) (N-n)/(N-1) reduces this expression to
no = z2 pq / d2 = pq / V
where,
V = pq / no is the desired variance of the sample population
So, if: d = 0.05 , p = 0.5 , α = 0.05 , and z = 2 we have
no = ( 4 ) ( 0.5 ) ( 0.5) = 400 This is a result where there will only be
.0025 minimal increases in precision beyond this sample size. This sample size will be adjusted downward only if the fpcf is greater than 5% of the population size.
This computation of the sample size for a population size of 3,000 would be:
n = no = 400/ (1+ 399/3000) = 400 / (1 + .1330) = 353
1+ (no -1) / N
In other words, a sample size greater than 400 returns only a trivial increase in sample precision and is a pseudo-maximum size for the normal approximation to the binomial distribution.
All of this development has assumed sampling without replacement. Because of this we can use the binomial distribution instead of the hyper-geometric probability density function. Whenever we have a population size of 8,000 or more, we would use 400 as a sample size. (When 400 ≥ 5% of the population size we then would have to use the fpcf to compensate, as above.)

Page 26 April 2004 Florida Department of Revenue
Non-Statistical Sampling
Florida Department of Revenue April 2004 Page 27
Non-Statistical Sampling
Appendix 7 WinSample Data Directoryand Technical Information
Maximum Sampling Frame Size = 1,000,000Maximum Sample Size = 10,000Maximum Spares = 10,000
WinSample uses the Borland Random Number Generator
Taxpayer Profile Table
File Name: Profile.DBF COMPANY: String, 50 Positions Company NameUSERTYPE: String, 20 Positions Type of UserAUDITNO: String, 10 Positions Audit NumberSAMPLES: Floating Point, 8 Positions Total # of Samples in the ProfileCOUNTER: Floating Point, 8 Positions System Field for indexing sample files
Sample Master File (Contains the file names of all sample files in a SAM file)
File Name: SamMaster.DBF FILENAME: String, 15 Positions Name of Sample FileSAMPLEDESC: String, 25 Positions Description of Sample FileSAMPLEOPT: String, 25 Positions System Field for Sample OptionSAMPLESIZE: Floating Point, 8 Positions Sample SizeSPARES: Floating Point, 8 Positions # of SparesSEED: String, 15 Positions Seed #POPULATION: Floating Point, 8 Positions PopulationRUNDATE: String, 20 Positions Date the Sample was generated

Page 28 April 2004 Florida Department of Revenue
Non-Statistical Sampling
Florida Department of Revenue April 2004 Page 29
Non-Statistical Sampling
Numbered Population Sample File
File Name: Numsam.dbf DATAROW: String, 1 Positions System Field: Y = Sample = Sample row, N = Range rowBEGRANGE: Floating Point, 8 Positions Beginning of RangeENDRANGE: Floating Point, 8 Positions Ending of RangeORDER: Floating Point, 8 Positions Order of Sample selectionsSAMPLE: Floating Point, 8 Positions Sample #SPARES: Floating Point, 8 Positions Spare #
Time Sample File
File Name: Timsam.dbf DATAROW: String, 1 Positions System Field: Y = Sample = Sample row,
N = Range rowORDER: Floating Point, 8 Positions Order of Sample selectionsPERIOD: String, 10 Positions Period being sampled,
Day, Week, Month, QuarterBEGPERIOD: Date Beginning of RangeENDPERIOD: Date Ending of RangeSAMPLE: Date Sample #SPARE: Date Spare #
Journal Sample File
File Name: Jrnsam.dbf DATAROW: String, 1 Positions System Field: Y = Sample = Sample row,
N = Range rowJOURNALNO: Floating Point, 8 Positions Journal # RangeNOOFPAGES: Floating Point, 8 Positions # of Pages for Journal #NOOFLINES: Floating Point, 8 Positions # of Lines for Journal #ORDER: Floating Point, 8 Positions Order of Sample selectionsJRNLSAMPLE: Floating Point, 8 Positions Sample Journal #PAGESAMPLE: Floating Point, 8 Positions Sample Page #LINESAMPLE: Floating Point, 8 Positions Sample Line #JRNLSPARES: Floating Point, 8 Positions Spare Journal #PAGESPARES: Floating Point, 8 Positions Spare Page #LINESPARES: Floating Point, 8 Positions Spare Line #

Page 28 April 2004 Florida Department of Revenue
Non-Statistical Sampling
Florida Department of Revenue April 2004 Page 29
Non-Statistical Sampling
Imaged Documents Sample File
File Name: Imgsam.dbf DATAROW: String, 1 Positions System Field: Y = Sample = Sample row,
N = Range rowORDER: Floating Point, 8 Positions Order of Sample selectionsNOOFTAPES: Floating Point, 8 Positions Range of TapesNOOFFRAMES: Floating Point, 8 Positions Range of FramesTAPESAMPLE: Floating Point, 8 Positions Sample Frame #FRAMESAMPL: Floating Point, 8 Positions Sample Tape #TAPESPARE: Floating Point, 8 Positions Spare Tape #FRAMESPARE: Floating Point, 8 Positions Spare Frame #
Microfiche Sample File
File Name: Micsam16.dbf DATAROW: String, 1 Positions System Field: Y = Sample = Sample row,
N = Range rowORDER: Floating Point, 8 Positions Order of Sample selectionsMICSHEETNO: Floating Point, 8 Positions Range of Microfiche Sheet #sROWNORANGE: Floating Point, 8 Positions Range of RowsCOLNORANGE: Floating Point, 8 Positions Range of ColumnsMICSAMPLE: Floating Point, 8 Positions Sample Microfiche Sheet #ROWSAMPLE: Floating Point, 8 Positions Sample Row #COLSAMPLE: Floating Point, 8 Positions Sample Column #MICSPARE: Floating Point, 8 Positions Spare Microfiche Sheet #ROWSPARE: Floating Point, 8 Positions Spare Row #COLSPARE: Floating Point, 8 Positions Spare Column #

Florida Department of Revenue April 2004 Page 31
Non-Statistical Sampling

Florida Department of Revenue April 2004 Page 31
Non-Statistical Sampling
Appendix 8 Table Of Z Values
Reprinted from Schaum’s Outlines, Business Statistics, Third Edition.

Florida Department of Revenue April 2004 Page 33
Non-Statistical Sampling

Florida Department of Revenue April 2004 Page 33
Non-Statistical Sampling
Appendix 9 Table Of T Values
Student’s T Distribution
W. S. Gosset at the turn of the century first studied the problem of non-normally distributed sample means for small sample sizes. The brewery at which he worked forbade his publishing anything, so he used a nom de plume “student” and used the name “t” for his random variable.
This study determined that the “student t” distribution is bell-shaped and symmetrical, much like the normal distribution. A commonly used guideline is that the “student t” distribution need only be used when the sample size is 30 or less; for larger samples, the normal distribution is ordinarily used.
The table on the next page shows the proportions of area for the t distribution. Degrees of freedom are calculated as 1 less than the sample size (n-1). The t value replaces the z value in any formulas where sample size is less than 30. For sample sizes less than 30, the sample size formula is:
n = ( t * s/e )2
Where n = sample size t = value of t s = standard deviation e = acceptable magnitude for error
The formula to calculate precision (UCL = Upper Confidence Level; LCL = Lower Confidence Level) also becomes:
UCL = x + ( t * s )
LCL = x - ( t * s )
Where x = Sample mean t = value of t at the given confidence level s = Standard deviation of the sample

Page 34 April 2004 Florida Department of Revenue
Non-Statistical Sampling
Florida Department of Revenue April 2004 Page 35
Non-Statistical Sampling
Table of T Values

Page 34 April 2004 Florida Department of Revenue
Non-Statistical Sampling
Florida Department of Revenue April 2004 Page 35
Non-Statistical Sampling
Glossary
Acceptance sampling A variant of attribute sampling.
Attribute samplingEstimates the rate (percentage) of occurrence of a specific quality (attribute) in a population (see Appendix 5).
Average See mean.
Central limit theorem States that the sampling distribution of sample means approaches the normal distribution as the number of samples increases, regardless of the distribution of the population. If the central limit theorem is used, the samples drawn from the parent population must be of size 30 or more.
Confidence intervalThe range of values in which the value of the population parameter of interest may be contained with the specified probability.
Confidence levelThe specified probability of the confidence interval.
Mean A measure of central tendency calculating the sum of the values in the data group divided by the number of values.
Normal deviate The normal deviate is represented by z. A table of Z values (Appendix 8) presents the probability that the value of interest lies within a specified interval under the unit normal distribution as measured by the standard deviation.
OutliersItems that are larger or smaller than the majority of items in the population.
PopulationThe entire set of values that are being audited.
PrecisionThe level of acceptable risk associated with using the sample mean to estimate the population mean. Also known as precision, maximum tolerable error, sampling error, and E.

Page 36 April 2004 Florida Department of Revenue
Non-Statistical Sampling
Florida Department of Revenue April 2004 Page 37
Non-Statistical Sampling
Random number samplingA table of numbers used to specifically select population elements for sample purposes.
RangeThe difference between the highest and lowest values in a group of values.
SampleA group of values selected from a population.
Sample baseThe total dollar amount of all the selected sample points.
Sample pointA single record in the population selected to be audited. The sample point can be a numbered transaction, a time period (day, week, month, or quarter), a journal page and line item, an image tape and frame number, or a microfiche sheet, row, and column. Sample point can also be referred to as sample unit.
Sample unitSee sample point.
Sampling frameA group of items from which the sample is drawn or a listing of sampling units that represents the population. It may or may not be identical to the population.
Seed NumberA randomly generated number used as a starting point for sample selection.
Simple random sampleA type of sampling in which every value in the population has an equal chance of selection for inclusion in the sample.
SparesExtra sample points used to replace non-existent sample points or non-transactions.
Statistical samplingEvaluating the precision of inferences about a population on the basis of information obtained from a random sample.

Page 36 April 2004 Florida Department of Revenue
Non-Statistical Sampling
Florida Department of Revenue April 2004 Page 37
Non-Statistical Sampling
Student’s tStates that the sampling distribution of sample means approaches the normal distribution as the number of samples increases, regardless of the distribution of the population. If the student t is used, the samples drawn from the parent population must be of size 5 or more. A table of t values is in Appendix 9.
Unit normal distributionA continuous probability distribution that is symmetrical. The mean, median and mode are all equal.
ZSee normal deviate (see Appendix 8).

Florida Department of Revenue April 2004 Page 39
Non-Statistical Sampling
Florida Department of Revenue April 2004 Page 39
Non-Statistical Sampling
Bibliography
Cochran, William G., Sampling Techniques, New York: John Wiley & Sons, 1977
Duncan, Acheson J., Quality Control and Industrial Statistics, Homewood, Illinois: 1986
Lapin, Lawrence L., Statistics for Modern Business Decisions, New York: Harcourt, Brace, and Jovanovich, Inc. 1973
Mandell, B. J., Statistics for Management, Baltimore: Dangary Publishing Company, Inc., 1977
Mendenhall, William, Beaver, Robert J., and Beaver, Barbara M., A Course in Business Statistics,Boston: Duxbury Press, 1996
Multistate Tax Commission, Joint Audit Program, Non-Statistical Sampling Training Course, March 2000
Professional Development Institute, University of North Texas, Statistical Sampling for State Revenue Auditors, 2000.
Schaefer, Richard L., Mendenhall, William, and Ott, Lyman, Elementary Survey Sampling,Boston: Duxbury Press, 1986
Wilburn, Arthur J., Practical Statistical Sampling for Auditors, New York: Marcel Dekker, Inc.,1984
Zikmund, William G., Business Research Methods, Fort Worth: The Dryden Press, 1991


GT-340001N. 04/04