florida performance measures david lee workshop … performance measures workshop david lee office...
TRANSCRIPT
Florida Department of
TRANSPORTATION
Florida Performance
Measures Workshop
David LeeOffice of Policy Planning
September 28, 2016
22
Florida Department of Transportation
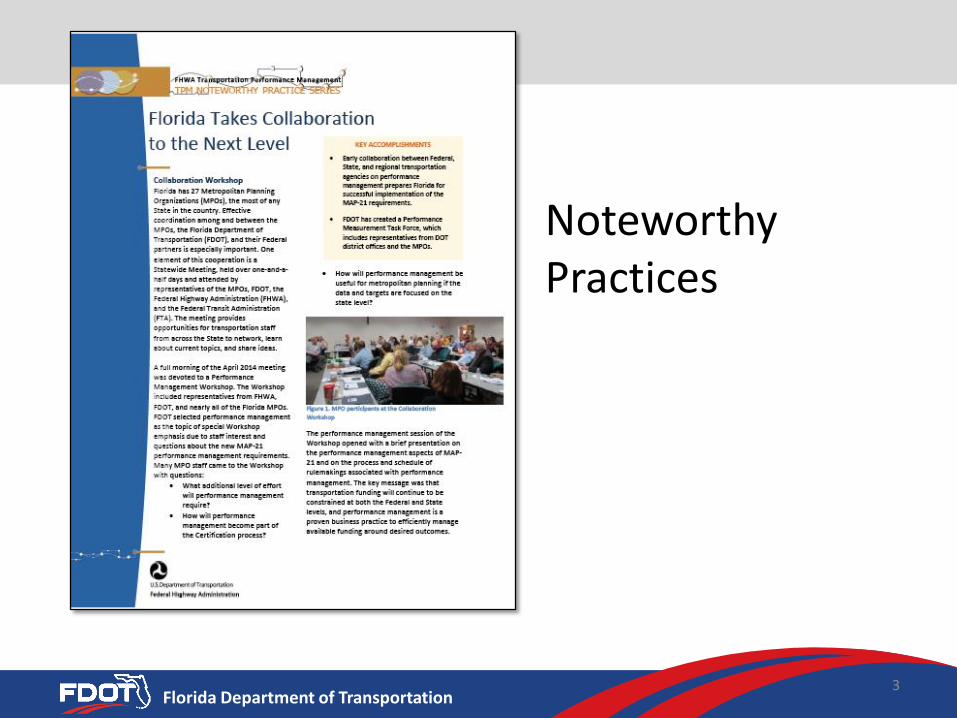
NoteworthyPractices
3

Florida Department of Transportation
Florida Performance Measures Workshops
4
Collaboration WorkshopPerformance Measures
2016
Florida Department of Transportation
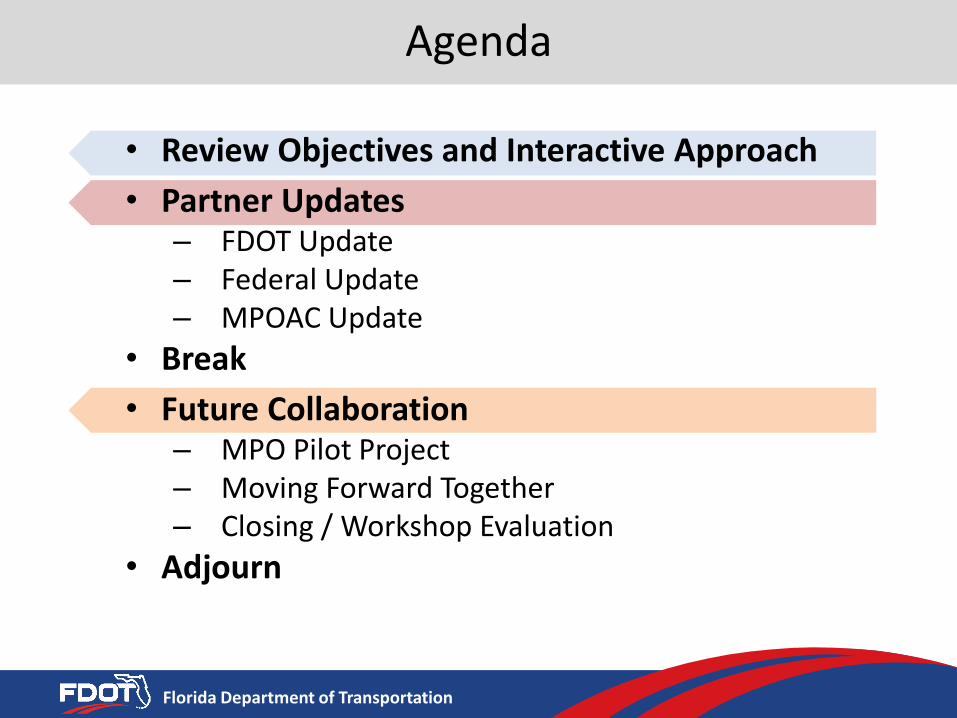
Agenda
• Review Objectives and Interactive Approach
• Partner Updates– FDOT Update– Federal Update– MPOAC Update
• Break
• Future Collaboration– MPO Pilot Project – Moving Forward Together – Closing / Workshop Evaluation
• Adjourn
Florida Department of Transportation
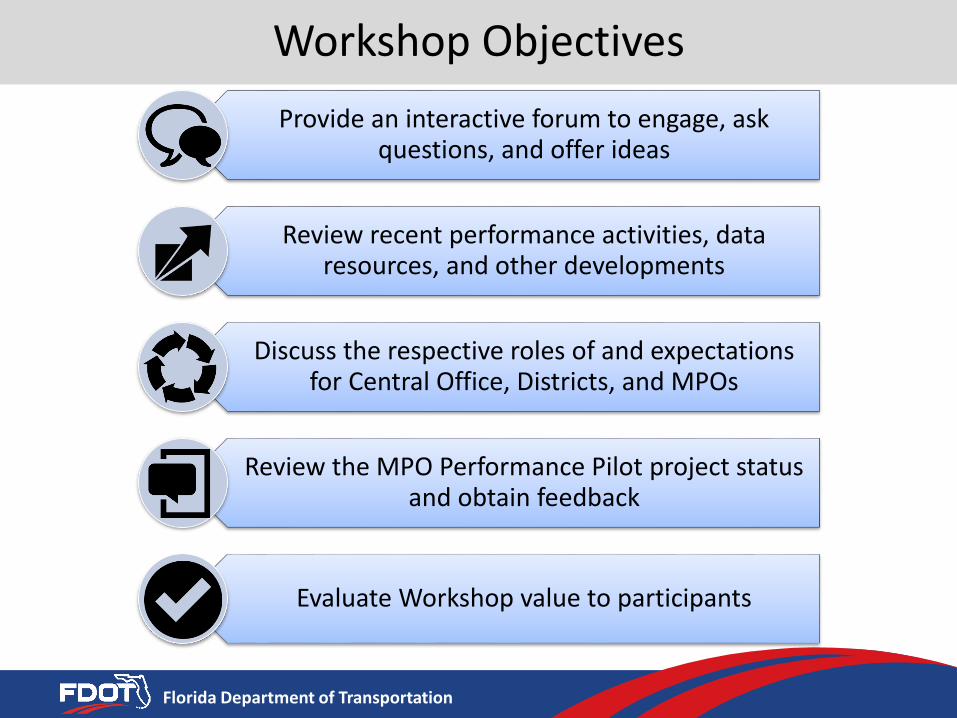
Workshop Objectives
Provide an interactive forum to engage, ask questions, and offer ideas
Review recent performance activities, data resources, and other developments
Discuss the respective roles of and expectations for Central Office, Districts, and MPOs
Review the MPO Performance Pilot project status and obtain feedback
Evaluate Workshop value to participants
Florida Department of Transportation
Asset ManagementPlan Adopted October 2015
Florida Department of Transportation
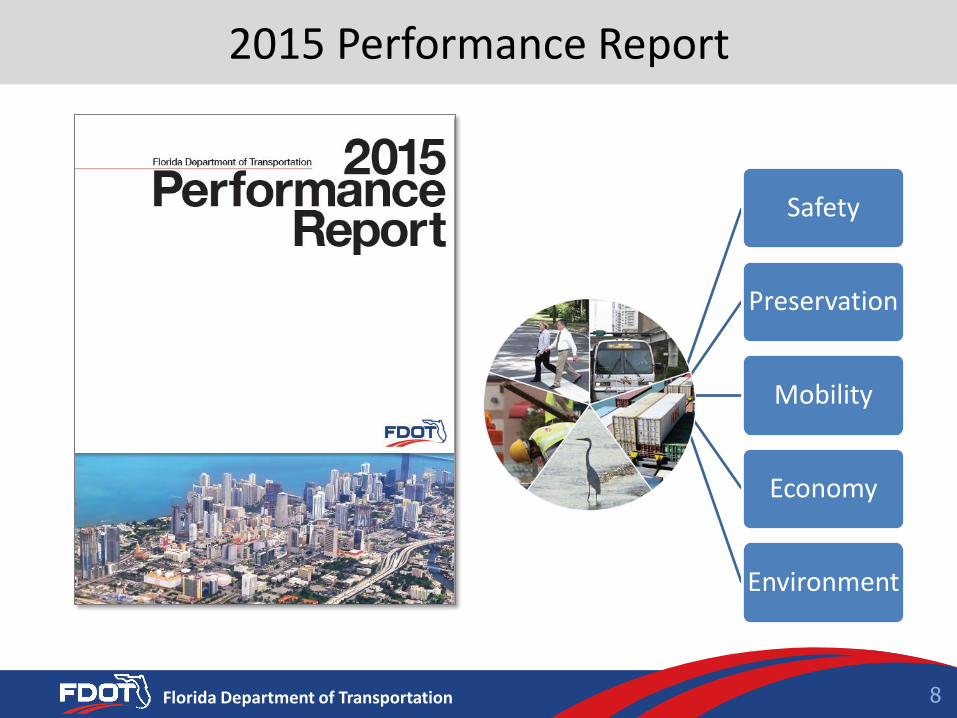
Safety
Preservation
Mobility
Economy
Environment
8
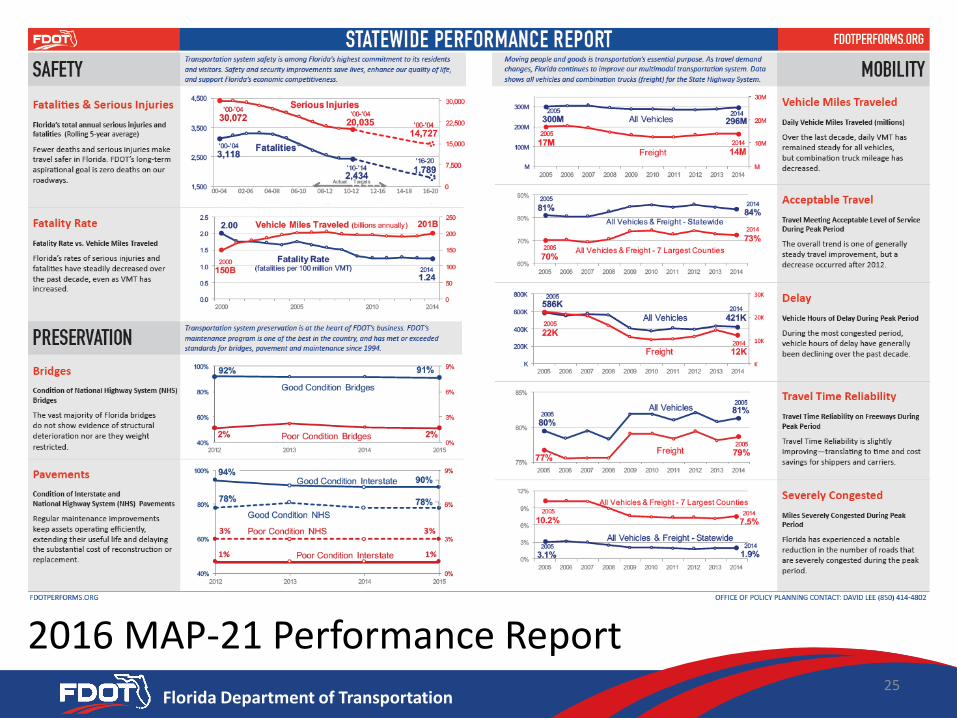
2015 Performance Report
Florida Department of Transportation
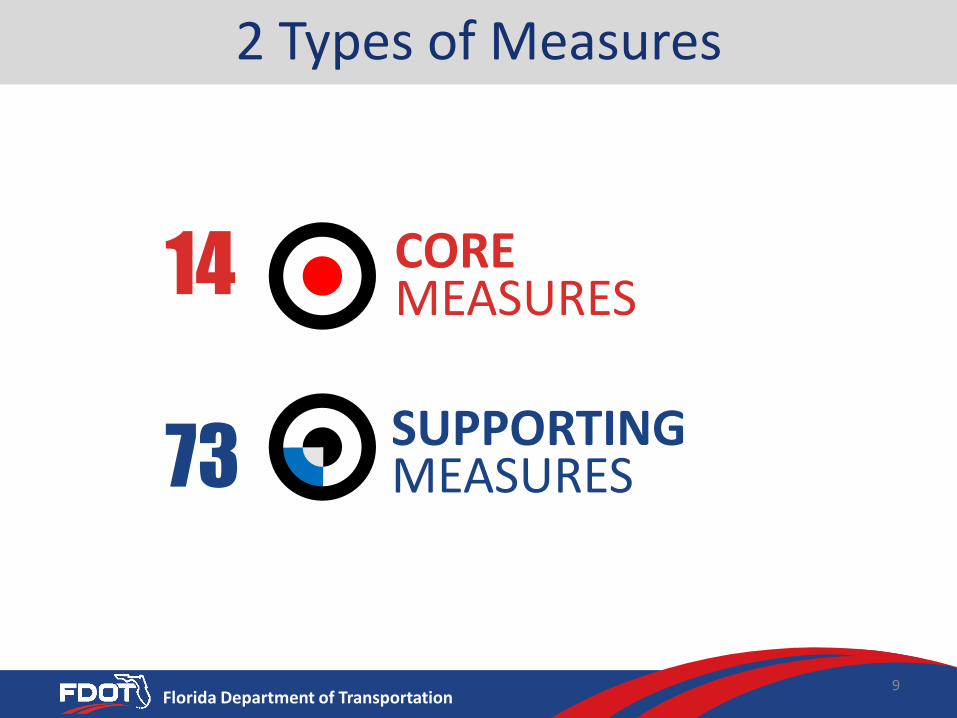
2 Types of Measures
SUPPORTINGMEASURES
COREMEASURES14
73
9
Florida Department of Transportation
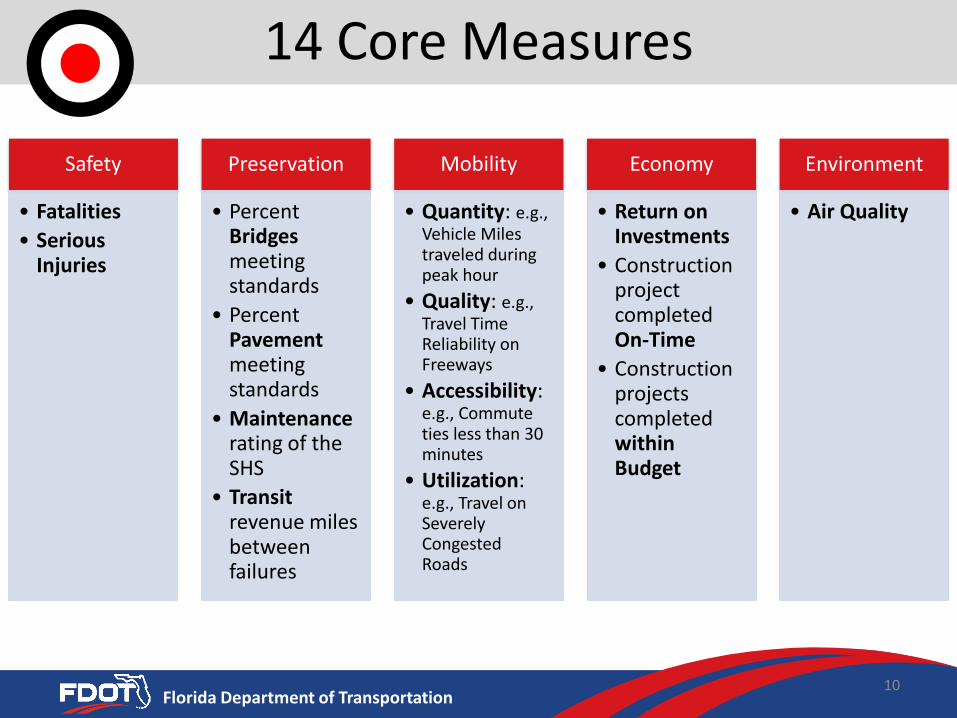
14 Core Measures
10
Safety
• Fatalities
• Serious Injuries
Preservation
• Percent Bridgesmeeting standards
• Percent Pavementmeeting standards
• Maintenancerating of the SHS
• Transitrevenue miles between failures
Mobility
• Quantity: e.g., Vehicle Miles traveled during peak hour
• Quality: e.g., Travel Time Reliability on Freeways
• Accessibility: e.g., Commute ties less than 30 minutes
• Utilization: e.g., Travel on Severely Congested Roads
Economy
• Return on Investments
• Construction project completed On-Time
• Construction projects completed within Budget
Environment
• Air Quality
Florida Department of Transportation
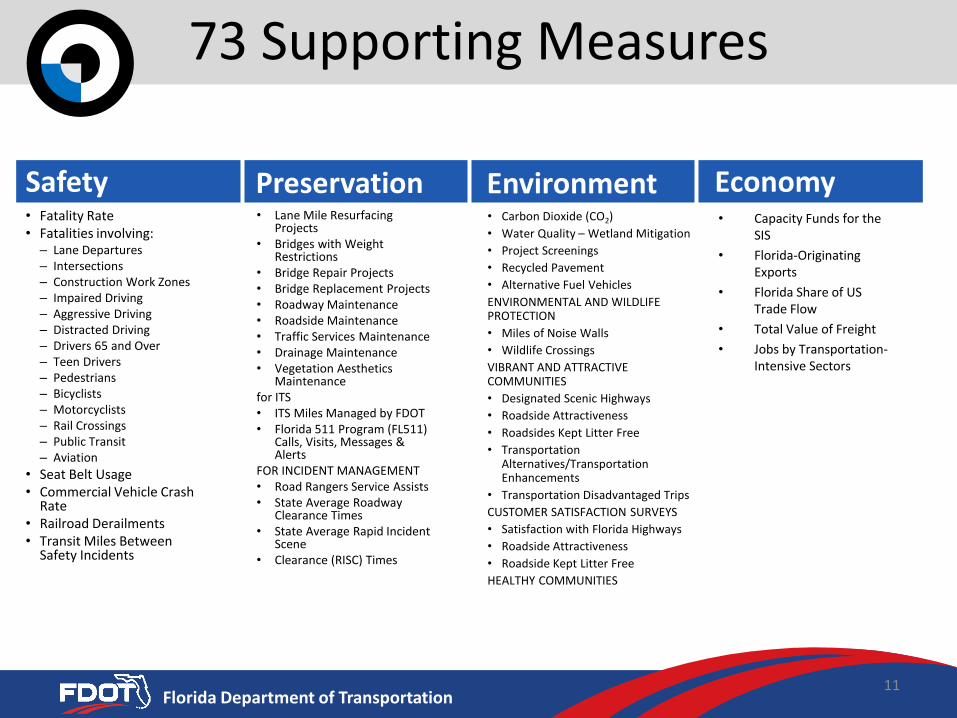
73 Supporting Measures
Safety• Fatality Rate• Fatalities involving:
– Lane Departures– Intersections– Construction Work Zones– Impaired Driving– Aggressive Driving– Distracted Driving– Drivers 65 and Over– Teen Drivers– Pedestrians– Bicyclists– Motorcyclists– Rail Crossings– Public Transit– Aviation
• Seat Belt Usage• Commercial Vehicle Crash
Rate• Railroad Derailments• Transit Miles Between
Safety Incidents
Preservation• Lane Mile Resurfacing
Projects• Bridges with Weight
Restrictions• Bridge Repair Projects• Bridge Replacement Projects• Roadway Maintenance• Roadside Maintenance• Traffic Services Maintenance• Drainage Maintenance• Vegetation Aesthetics
Maintenancefor ITS• ITS Miles Managed by FDOT• Florida 511 Program (FL511)
Calls, Visits, Messages & Alerts
FOR INCIDENT MANAGEMENT• Road Rangers Service Assists• State Average Roadway
Clearance Times• State Average Rapid Incident
Scene• Clearance (RISC) Times
Environment• Carbon Dioxide (CO2)
• Water Quality – Wetland Mitigation
• Project Screenings
• Recycled Pavement
• Alternative Fuel Vehicles
ENVIRONMENTAL AND WILDLIFE PROTECTION
• Miles of Noise Walls
• Wildlife Crossings
VIBRANT AND ATTRACTIVE COMMUNITIES
• Designated Scenic Highways
• Roadside Attractiveness
• Roadsides Kept Litter Free
• Transportation Alternatives/Transportation Enhancements
• Transportation Disadvantaged Trips
CUSTOMER SATISFACTION SURVEYS
• Satisfaction with Florida Highways
• Roadside Attractiveness
• Roadside Kept Litter Free
HEALTHY COMMUNITIES
Economy• Capacity Funds for the
SIS
• Florida-Originating Exports
• Florida Share of US Trade Flow
• Total Value of Freight
• Jobs by Transportation-Intensive Sectors
11

Florida Department of Transportation
73 Supporting Measures
Travel Quantity• Vehicle Miles of Travel
• Vehicle Miles Traveled per Capita
• Combination Truck Miles Traveled
• Transit Passenger Trips
• Aviation Passenger Boardings
• Seaport Passenger Trips
• Rail Passenger Trips
• TEU (20-foot equivalent unit) Containers
• Freight Tonnage
Travel Quality• Level of Service (LOS)
• Pedestrian and Bicycle LOS
• Vehicle Hours of Delay
• Combination Truck Hours of Delay
• Travel Time Reliability
• Aviation and Rail Departure Reliability
• Transit Headways
Accessibility• Commute Times Less Than 30
Minutes
• Bicycle and Pedestrian Facilities
• Aviation, Rail, and Seaport Highway Adequacy
Utilization• Miles Severely Congested
• Travel Severely Congested
Mobility
12
Florida Department of Transportation
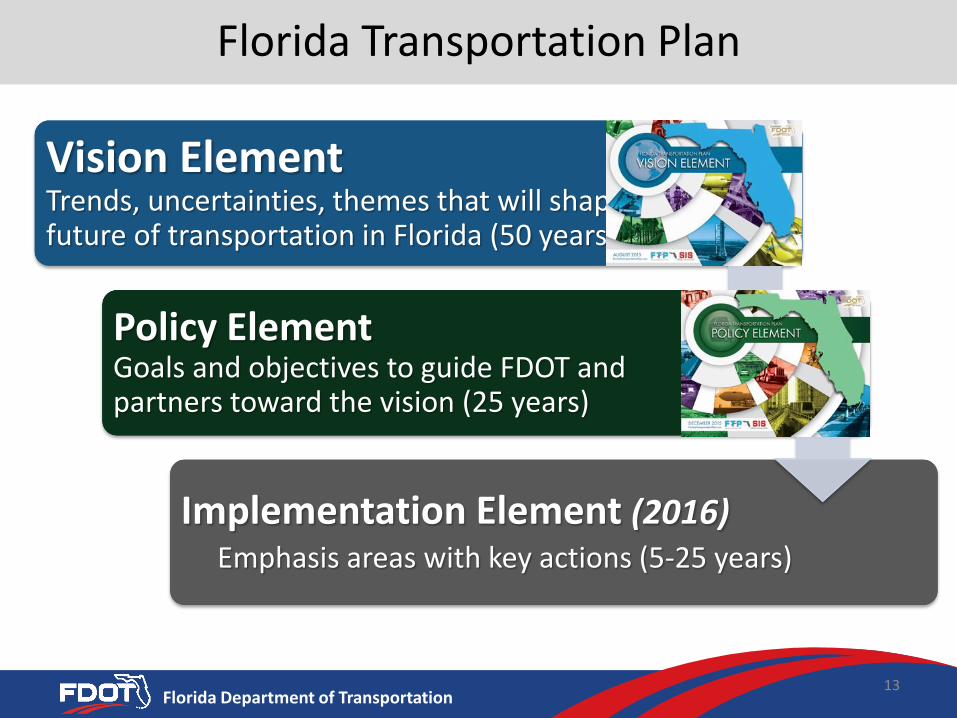
Florida Transportation Plan
13
Vision Element Trends, uncertainties, themes that will shape future of transportation in Florida (50 years)
Policy Element Goals and objectives to guide FDOT and partners toward the vision (25 years)
Implementation Element (2016)Emphasis areas with key actions (5-25 years)
Florida Department of Transportation
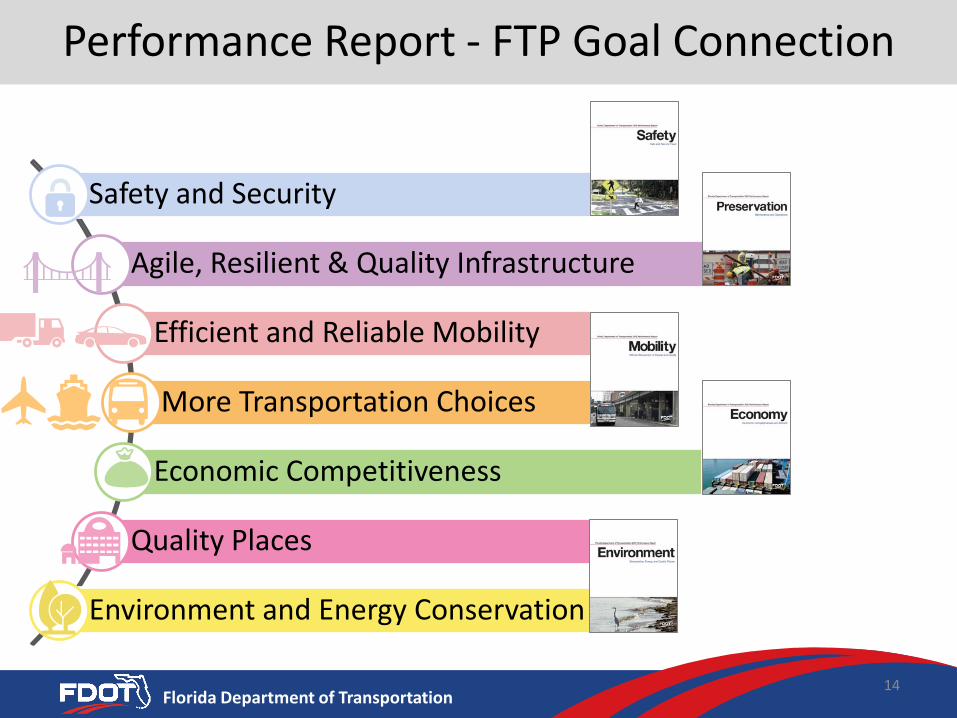
Performance Report - FTP Goal Connection
14
Safety and Security
Agile, Resilient & Quality Infrastructure
Efficient and Reliable Mobility
More Transportation Choices
Economic Competitiveness
Quality Places
Environment and Energy Conservation
Florida Department of Transportation
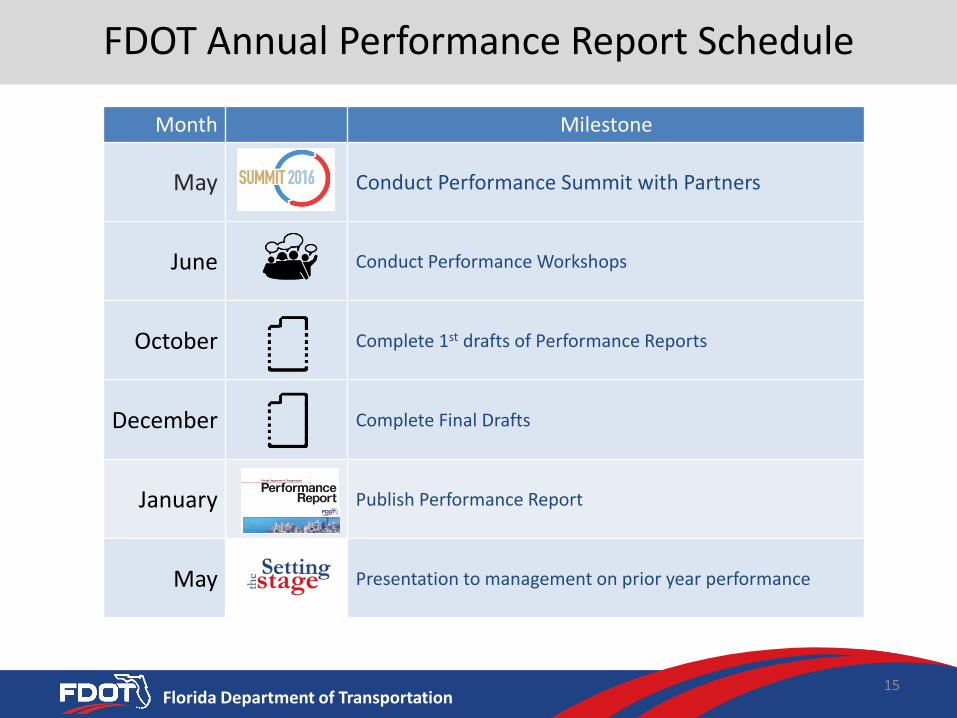
FDOT Annual Performance Report Schedule
15
Month Milestone
May Conduct Performance Summit with Partners
June Conduct Performance Workshops
October Complete 1st drafts of Performance Reports
December Complete Final Drafts
January Publish Performance Report
May Presentation to management on prior year performance
Florida Department of
TRANSPORTATION
Sponsored by the Florida Department of Transportation Office of Policy Planning

Florida Department of Transportation17
Performance Summit Panelists
Florida Department of Transportation
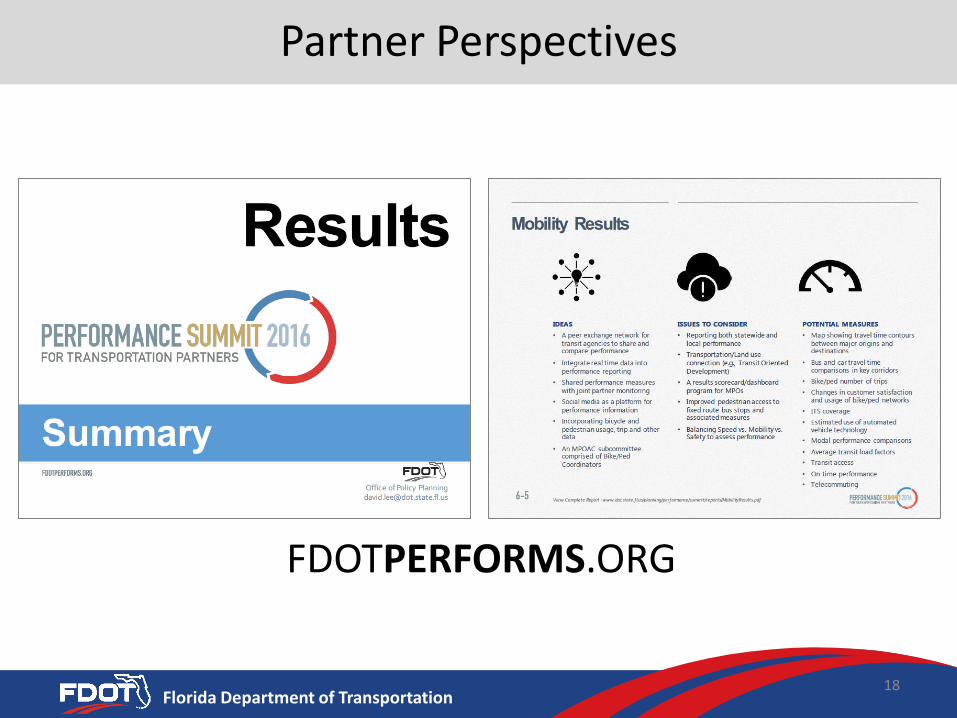
Partner Perspectives
18
FDOTPERFORMS.ORG
Florida Department of Transportation
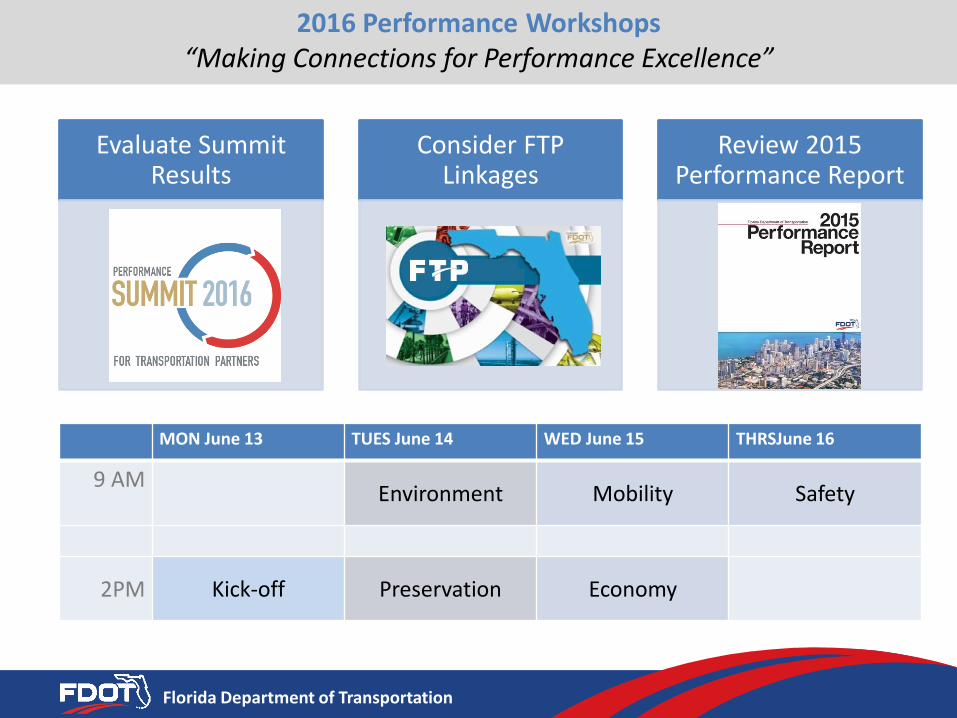
2016 Performance Workshops“Making Connections for Performance Excellence”
MON June 13 TUES June 14 WED June 15 THRSJune 16
9 AMEnvironment Mobility Safety
2PM Kick-off Preservation Economy
Evaluate Summit Results
Consider FTP Linkages
Review 2015 Performance Report
Florida Department of Transportation
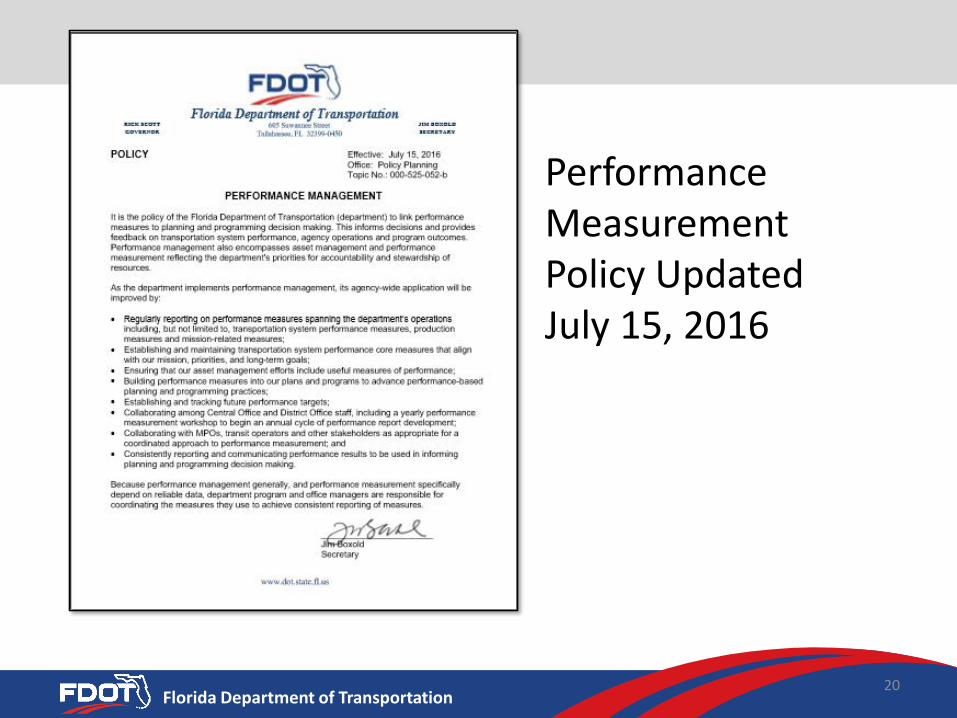
PerformanceMeasurement Policy Updated July 15, 2016
20
Florida Department of Transportation
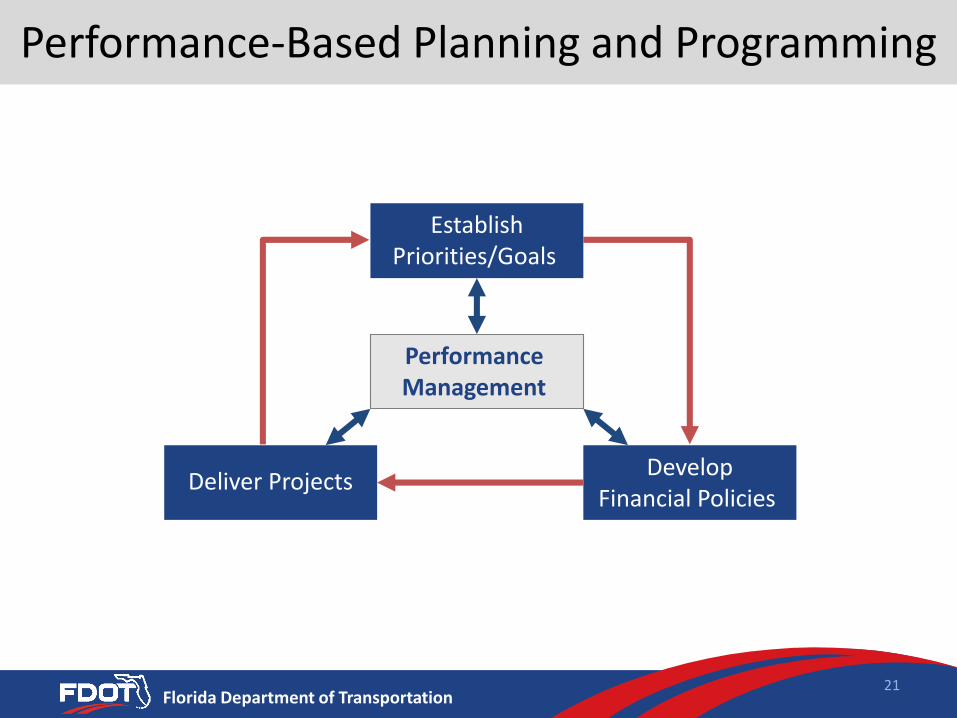
Performance-Based Planning and Programming
21
DevelopFinancial Policies
Deliver Projects
Performance Management
EstablishPriorities/Goals
Florida Department of Transportation
Florida Department of Transportation
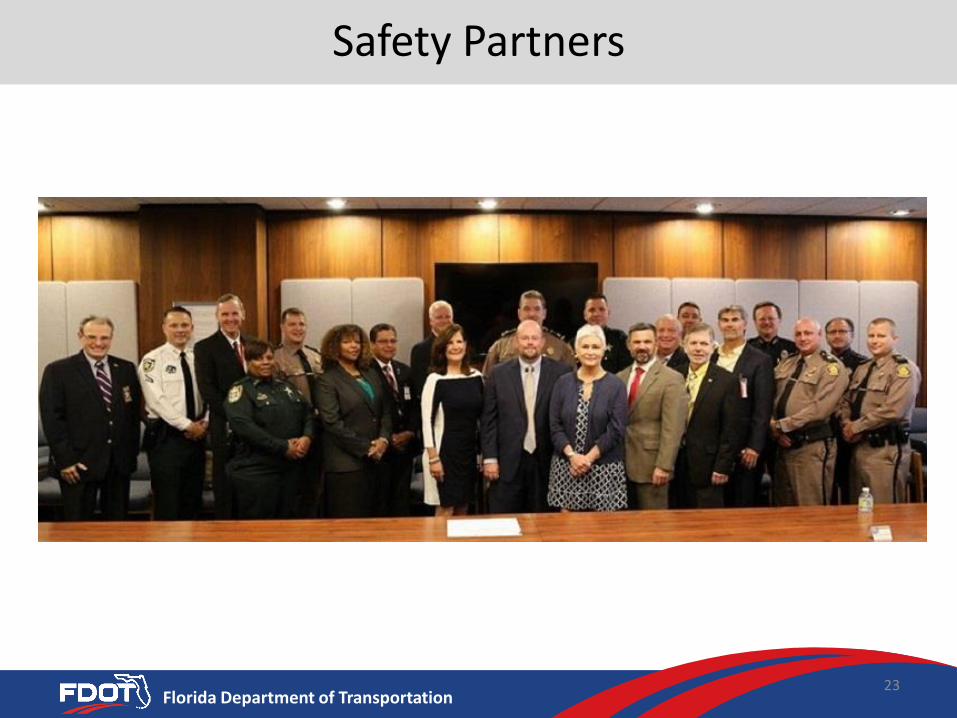
Safety Partners
23
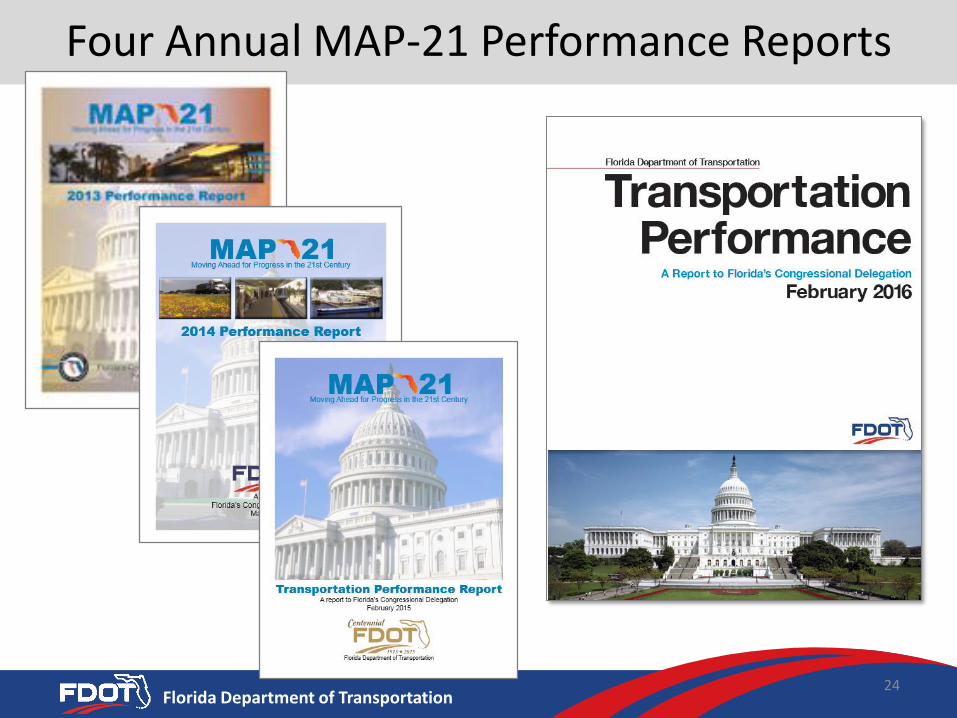
Florida Department of Transportation24
Four Annual MAP-21 Performance Reports
Florida Department of Transportation25
2016 MAP-21 Performance Report

Florida Department of Transportation
– Initial State Performance
Report
– BaselinePerformancePeriod Report
– Mid Performance
Period Progress Report
– Full Performance
Progress Report
Federal Reporting Timeline
October 1, 2016 October 1, 2018 October 1, 2020 October 1, 2022
26
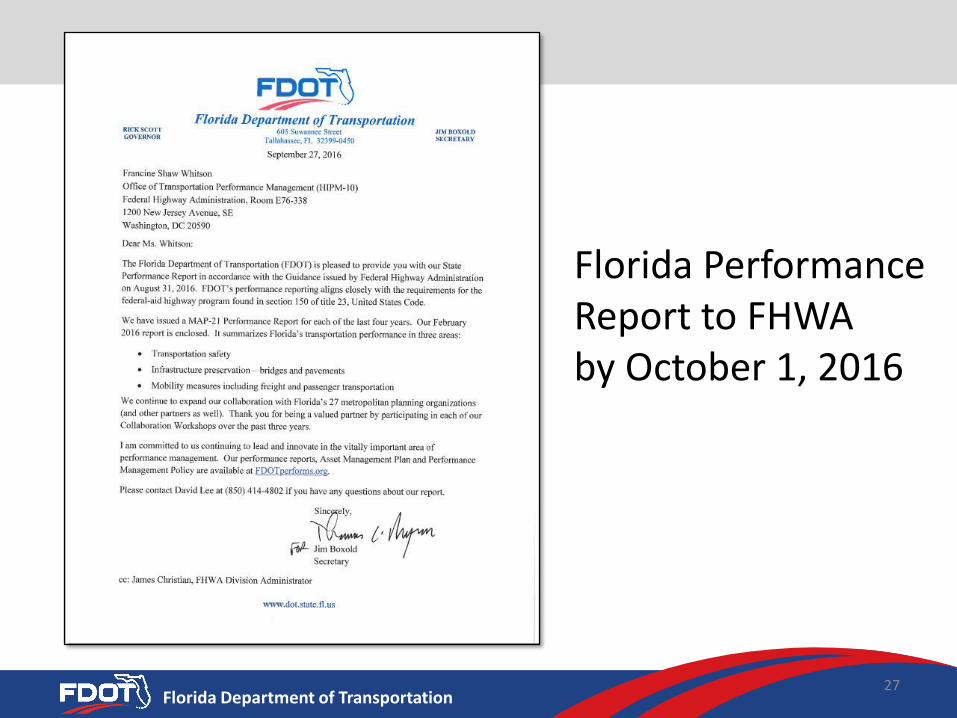
Florida Department of Transportation27
Florida Performance Report to FHWAby October 1, 2016
Florida Department of Transportation
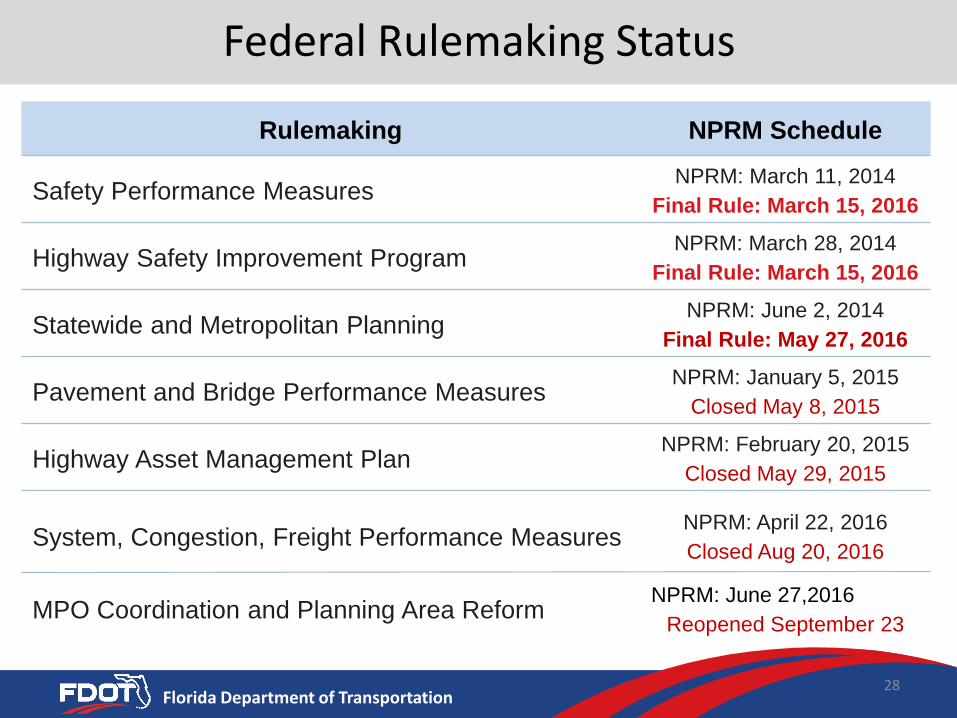
Federal Rulemaking Status
Rulemaking NPRM Schedule
Safety Performance MeasuresNPRM: March 11, 2014
Final Rule: March 15, 2016
Highway Safety Improvement ProgramNPRM: March 28, 2014
Final Rule: March 15, 2016
Statewide and Metropolitan PlanningNPRM: June 2, 2014
Final Rule: May 27, 2016
Pavement and Bridge Performance MeasuresNPRM: January 5, 2015
Closed May 8, 2015
Highway Asset Management PlanNPRM: February 20, 2015
Closed May 29, 2015
System, Congestion, Freight Performance MeasuresNPRM: April 22, 2016
Closed Aug 20, 2016
MPO Coordination and Planning Area ReformNPRM: June 27,2016
Reopened September 23
28
Florida Department of Transportation
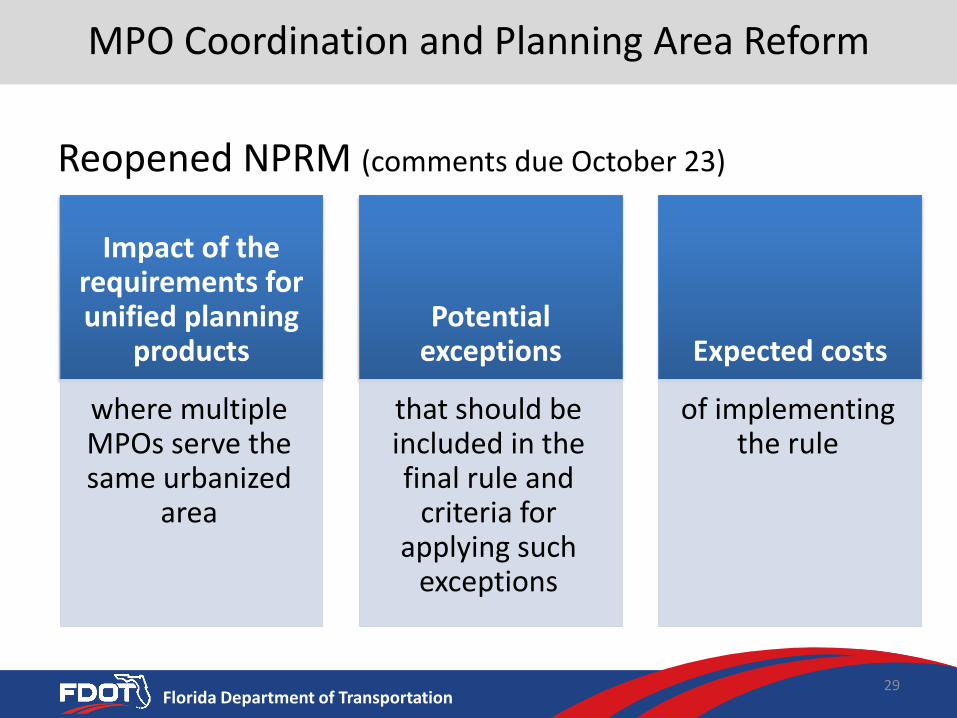
MPO Coordination and Planning Area Reform
Reopened NPRM (comments due October 23)
Impact of the requirements for unified planning
products
where multiple MPOs serve the same urbanized
area
Potential exceptions
that should be included in the final rule and
criteria for applying such
exceptions
Expected costs
of implementing the rule
29
Florida Department of Transportation
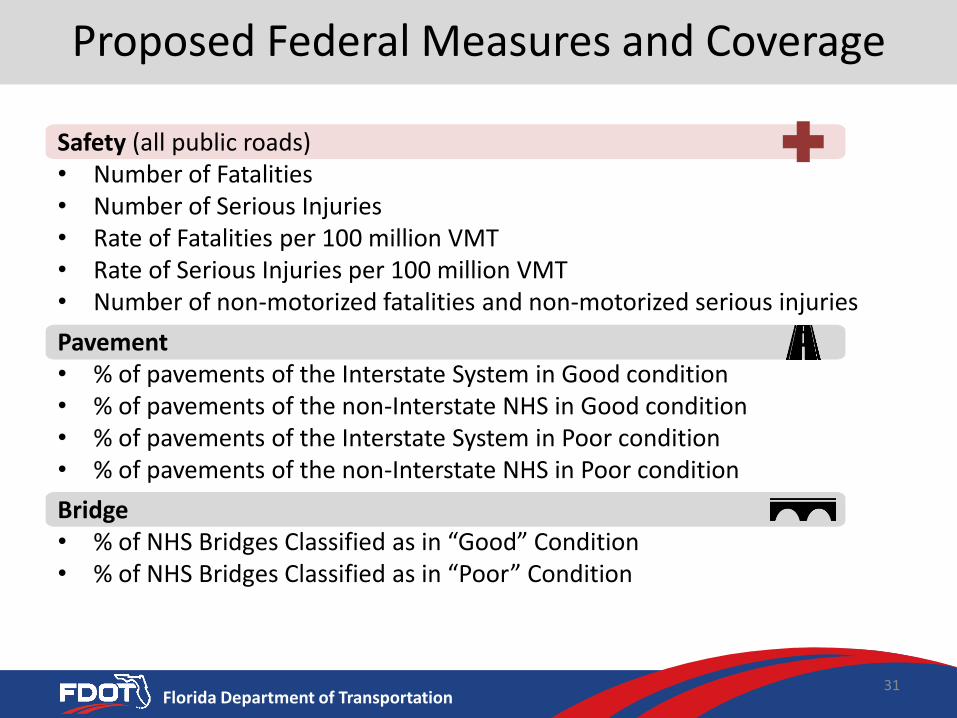
Proposed Federal Measures and Coverage
Safety (all public roads)• Number of Fatalities• Number of Serious Injuries• Rate of Fatalities per 100 million VMT• Rate of Serious Injuries per 100 million VMT• Number of non-motorized fatalities and non-motorized serious injuries
Pavement• % of pavements of the Interstate System in Good condition• % of pavements of the non-Interstate NHS in Good condition• % of pavements of the Interstate System in Poor condition• % of pavements of the non-Interstate NHS in Poor condition
Bridge• % of NHS Bridges Classified as in “Good” Condition• % of NHS Bridges Classified as in “Poor” Condition
31
Florida Department of Transportation
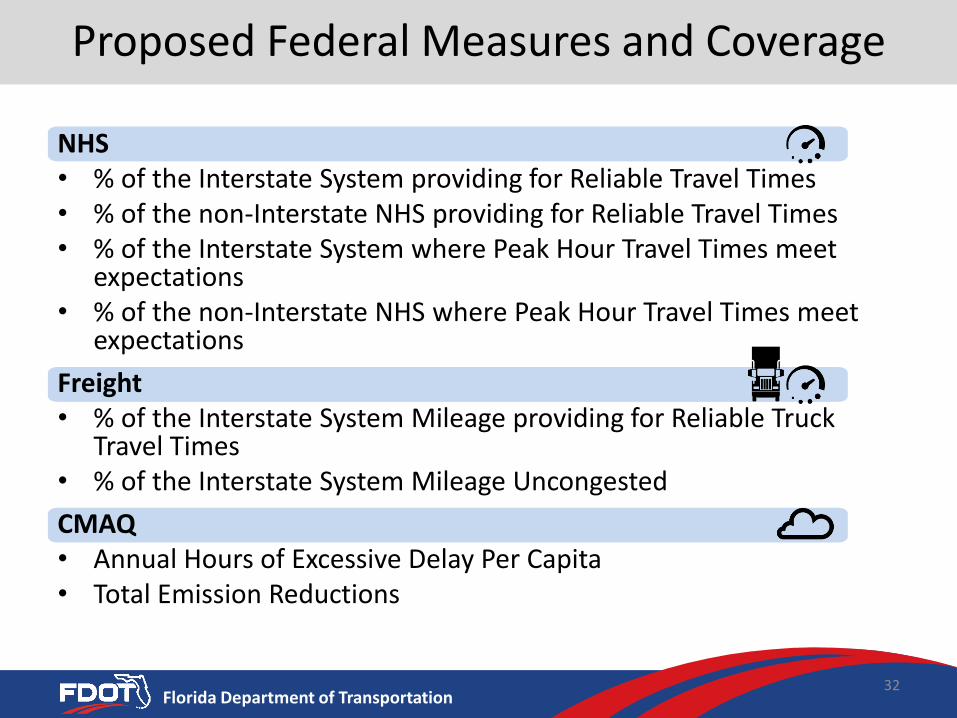
Proposed Federal Measures and Coverage
NHS• % of the Interstate System providing for Reliable Travel Times• % of the non-Interstate NHS providing for Reliable Travel Times• % of the Interstate System where Peak Hour Travel Times meet
expectations• % of the non-Interstate NHS where Peak Hour Travel Times meet
expectations
Freight• % of the Interstate System Mileage providing for Reliable Truck
Travel Times• % of the Interstate System Mileage Uncongested
CMAQ• Annual Hours of Excessive Delay Per Capita• Total Emission Reductions
32
Florida Department of Transportation
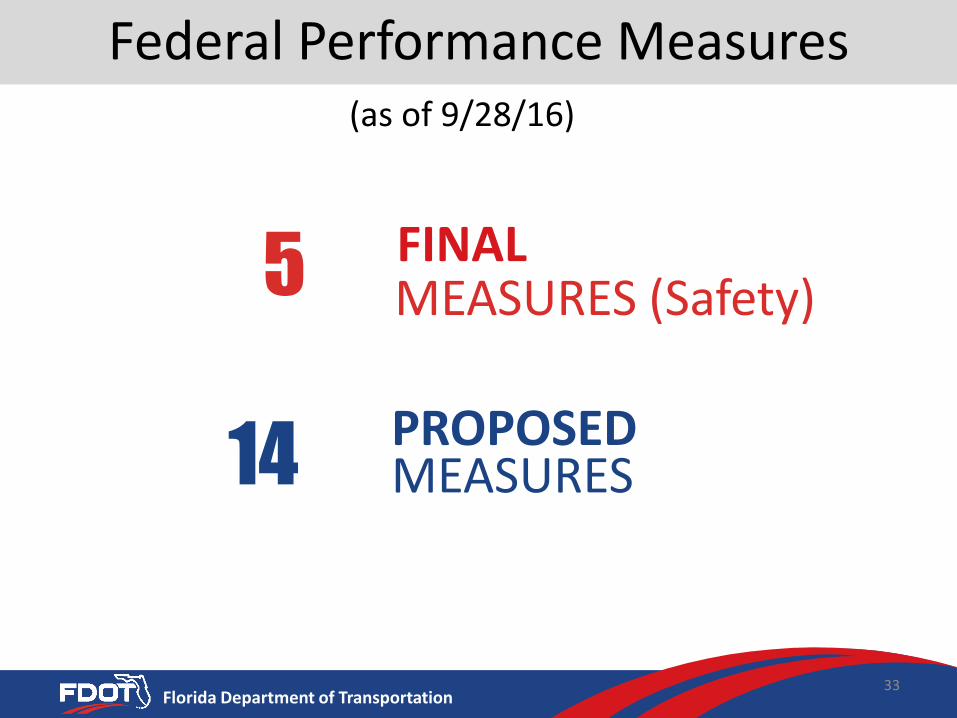
Federal Performance Measures
PROPOSEDMEASURES
MEASURES (Safety)5
14
33
FINAL
(as of 9/28/16)
3434
Florida Department of Transportation35
35
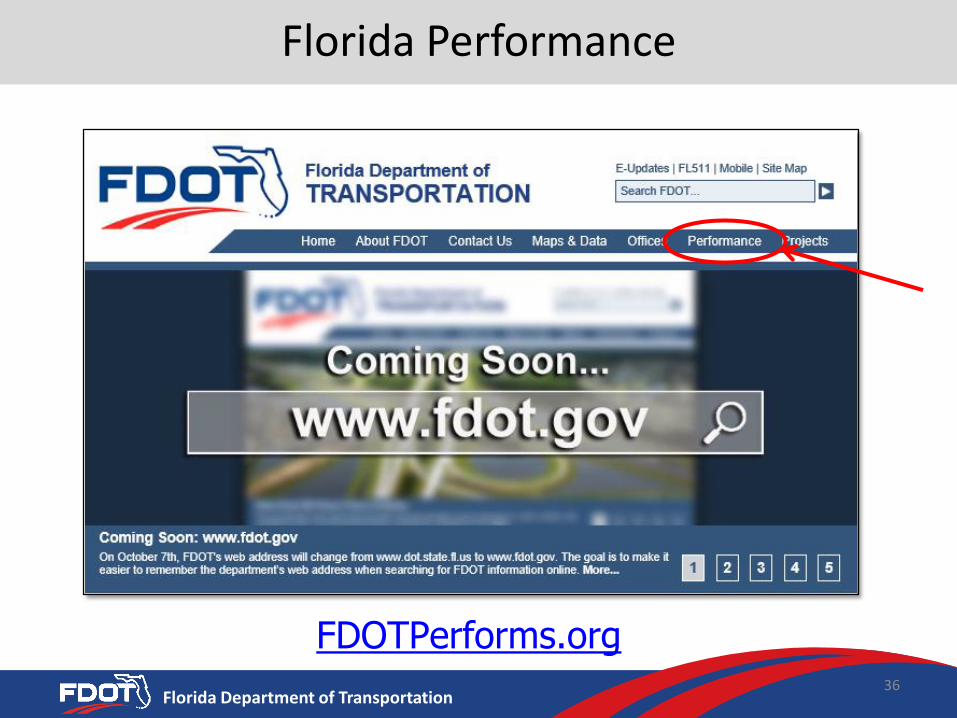
Florida Department of Transportation36
Florida Performance
FDOTPerforms.org
Florida Department of Transportation
Thank you
David Lee
Administrator, Statewide Planning & Policy Analysis
(850) 414-4802
TitleSubtitle
MeetingDate
Office of Transportation Performance Management
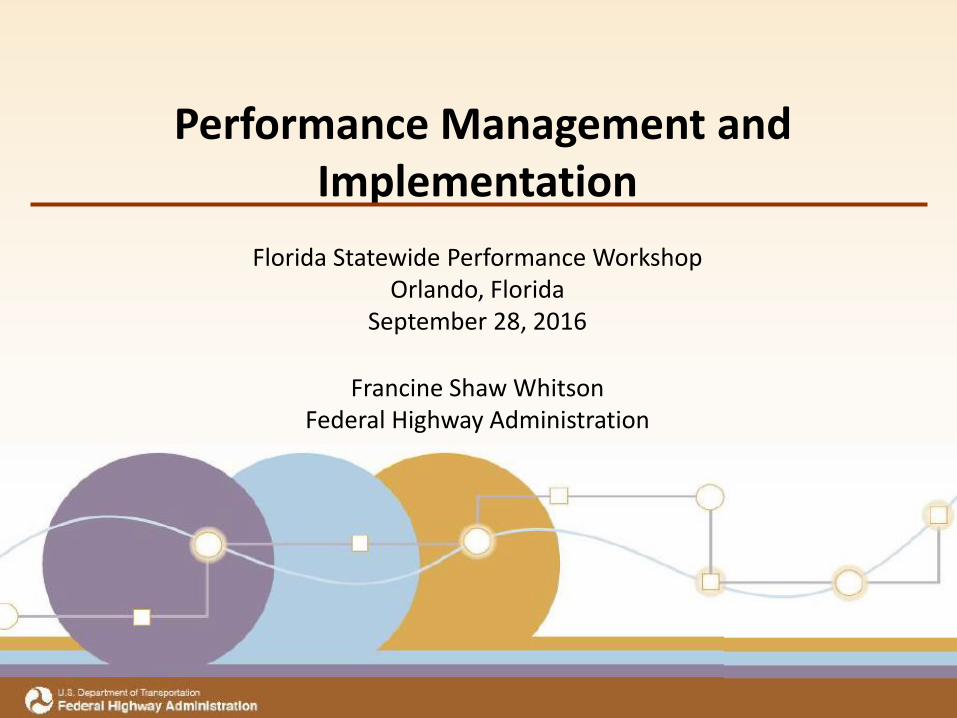
Performance Management and Implementation
Florida Statewide Performance WorkshopOrlando, Florida
September 28, 2016
Francine Shaw Whitson Federal Highway Administration
Transportation Performance Management
Presentation Outline
Why Transportation Performance Management (TPM)?
National Performance Management Measures
What’s Next for FHWA
TPM Professional Capacity Building
39
Transportation Performance Management
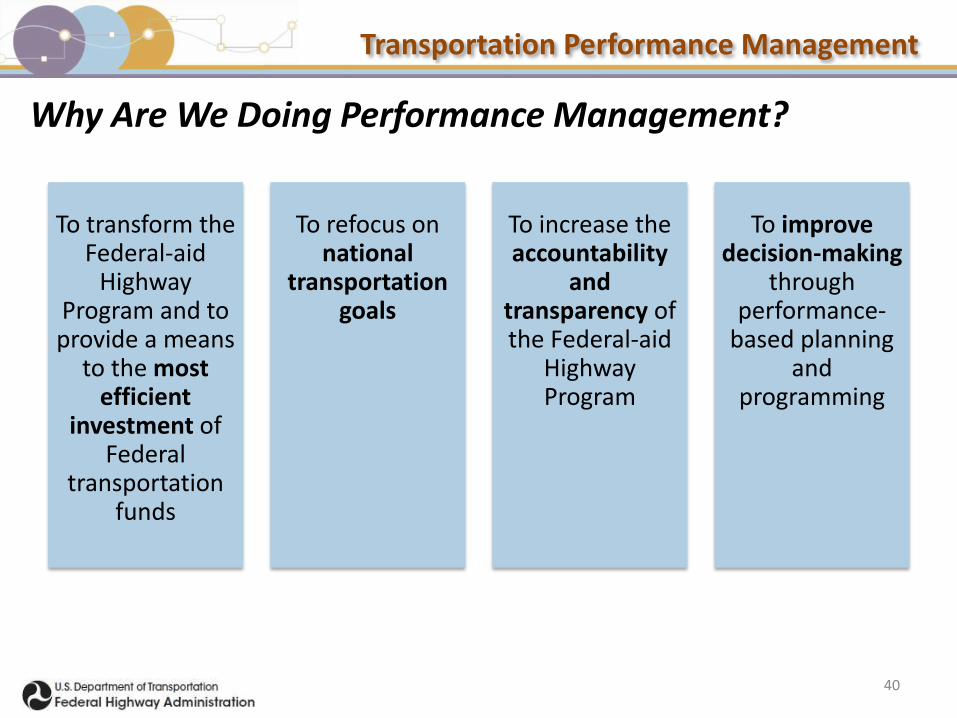
Why Are We Doing Performance Management?
To transform the Federal-aid
Highway Program and to provide a means
to the mostefficient
investment of Federal
transportation funds
To refocus on national
transportation goals
To increase the accountability
and transparency of the Federal-aid
Highway Program
To improve decision-making
through performance-
based planning and
programming
40
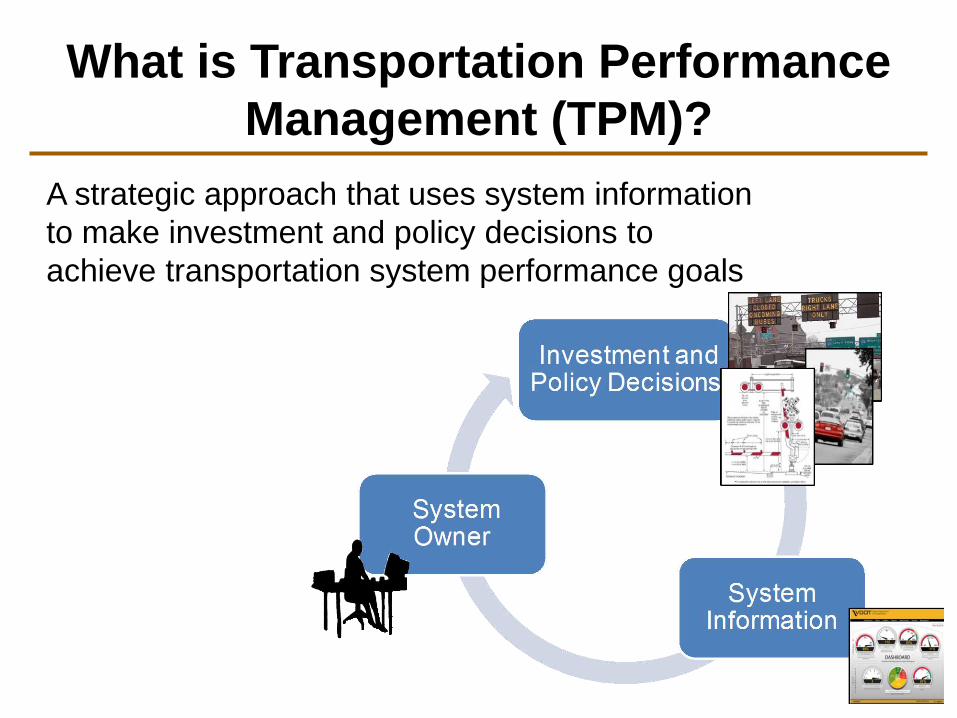
A strategic approach that uses system information
to make investment and policy decisions to
achieve transportation system performance goals
What is Transportation Performance
Management (TPM)?
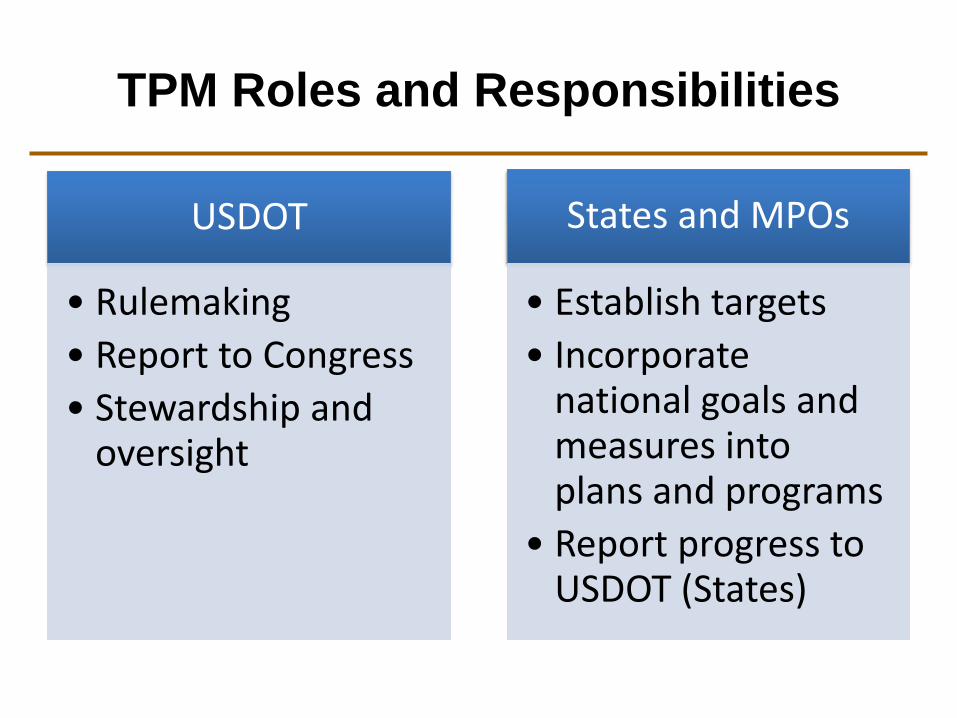
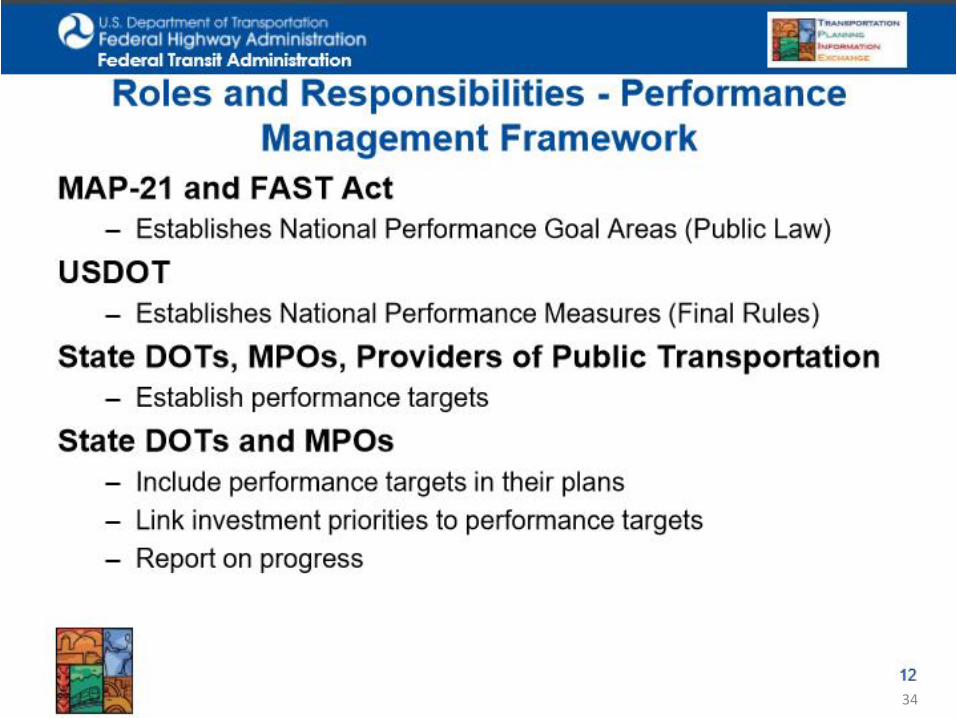
USDOT
• Rulemaking
• Report to Congress
• Stewardship and oversight
States and MPOs
• Establish targets
• Incorporate national goals and measures into plans and programs
• Report progress to USDOT (States)
TPM Roles and Responsibilities

Transportation Performance Management
43
Florida DOT and Performance Management

Transportation Performance Management
National Performance Management Measures
44
Transportation Performance Management
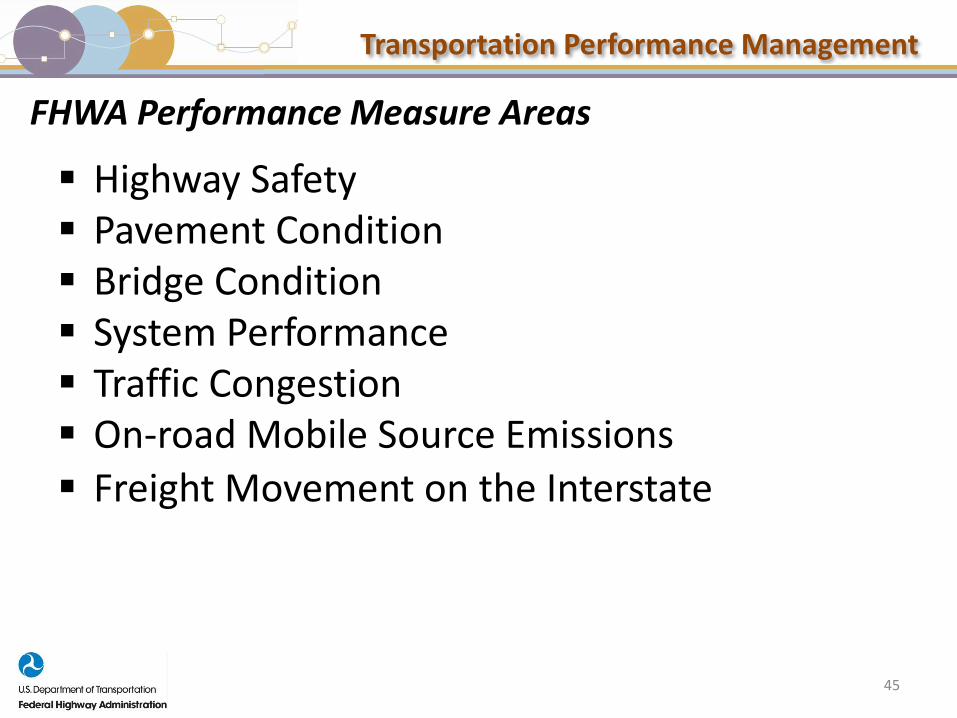
Highway Safety Pavement Condition Bridge Condition System Performance Traffic Congestion On-road Mobile Source Emissions
Freight Movement on the Interstate
FHWA Performance Measure Areas
45
Transportation Performance Management
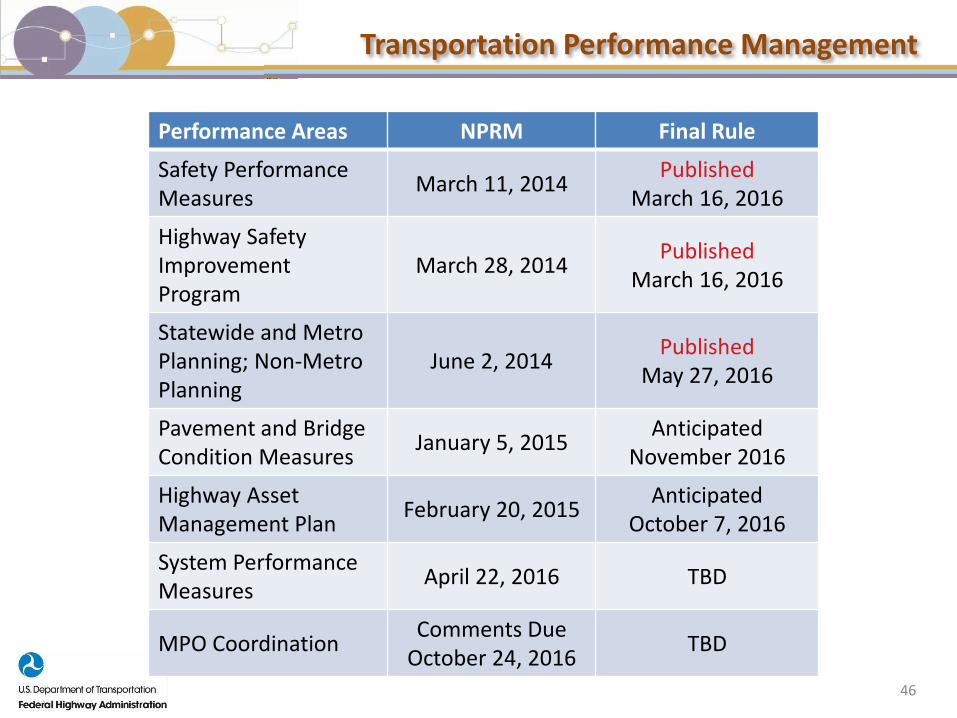
Performance Areas NPRM Final Rule
Safety Performance Measures
March 11, 2014Published
March 16, 2016
Highway Safety Improvement Program
March 28, 2014Published
March 16, 2016
Statewide and Metro Planning; Non-Metro Planning
June 2, 2014Published
May 27, 2016
Pavement and Bridge Condition Measures
January 5, 2015Anticipated
November 2016
Highway Asset Management Plan
February 20, 2015Anticipated
October 7, 2016
System Performance Measures
April 22, 2016 TBD
MPO CoordinationComments Due
October 24, 2016TBD
46
Transportation Performance Management
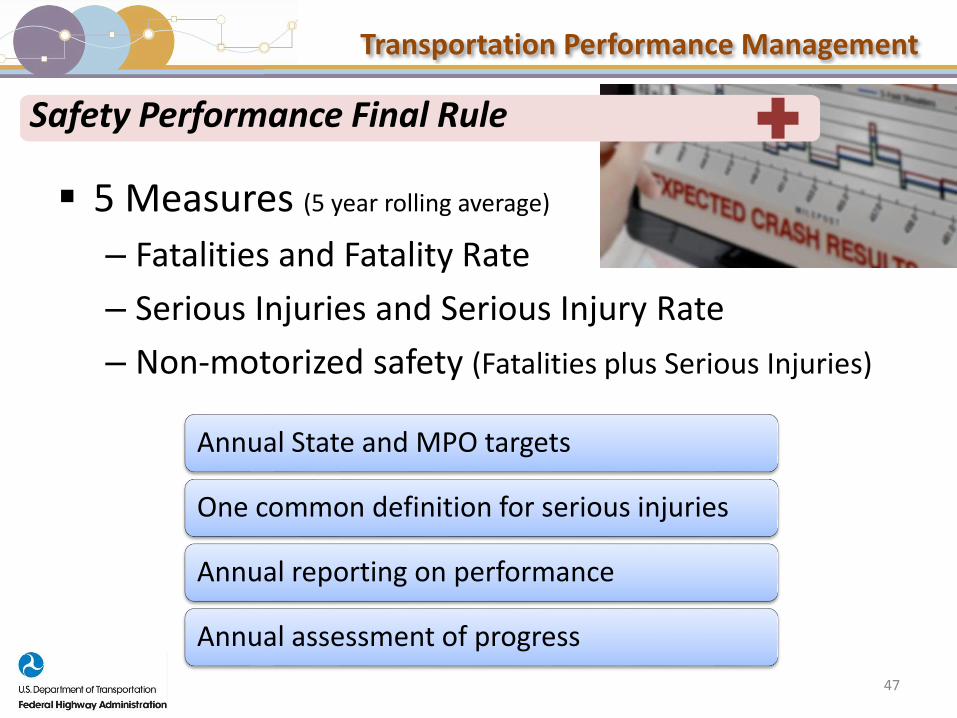
Safety Performance Final Rule
5 Measures (5 year rolling average)
– Fatalities and Fatality Rate
– Serious Injuries and Serious Injury Rate
– Non-motorized safety (Fatalities plus Serious Injuries)
47
Annual State and MPO targets
One common definition for serious injuries
Annual reporting on performance
Annual assessment of progress
Transportation Performance Management
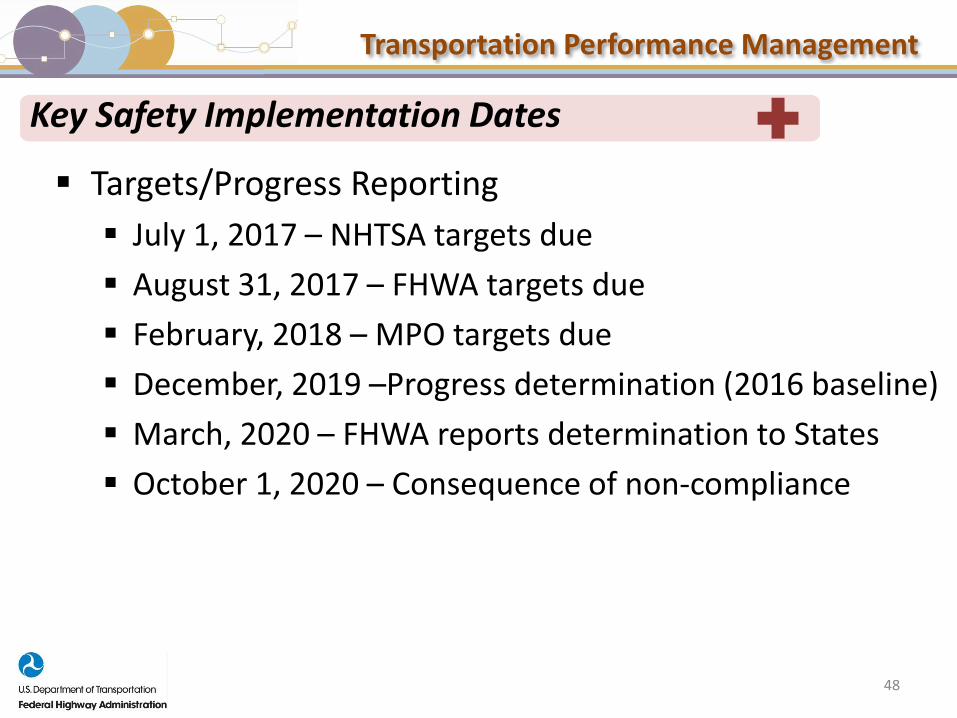
Key Safety Implementation Dates
Targets/Progress Reporting
July 1, 2017 – NHTSA targets due
August 31, 2017 – FHWA targets due
February, 2018 – MPO targets due
December, 2019 –Progress determination (2016 baseline)
March, 2020 – FHWA reports determination to States
October 1, 2020 – Consequence of non-compliance
48
Transportation Performance Management
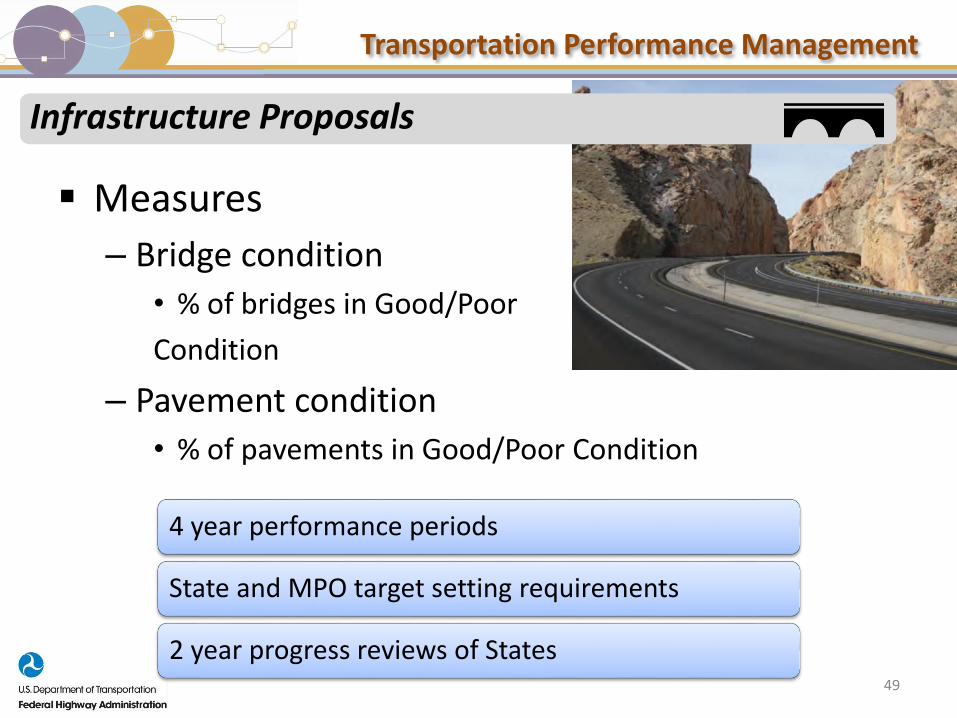
Infrastructure Proposals
49
Measures
– Bridge condition
• % of bridges in Good/Poor
Condition
– Pavement condition
• % of pavements in Good/Poor Condition
4 year performance periods
State and MPO target setting requirements
2 year progress reviews of States
Transportation Performance Management
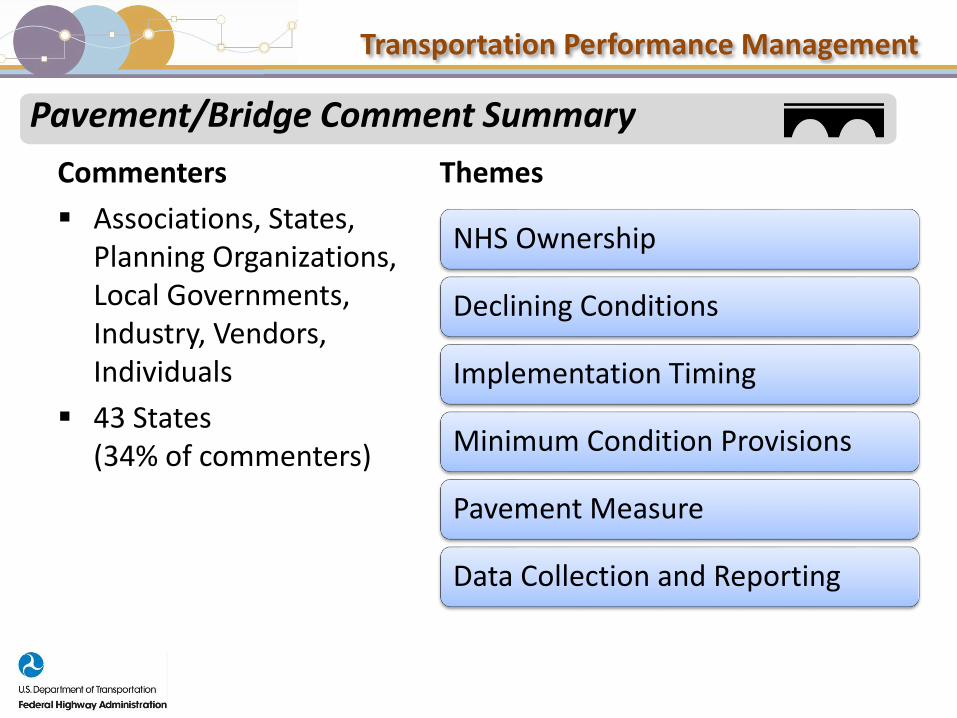
Pavement/Bridge Comment Summary
Commenters
Associations, States, Planning Organizations, Local Governments, Industry, Vendors, Individuals
43 States (34% of commenters)
NHS Ownership
Declining Conditions
Implementation Timing
Minimum Condition Provisions
Pavement Measure
Data Collection and Reporting
Themes
Transportation Performance Management
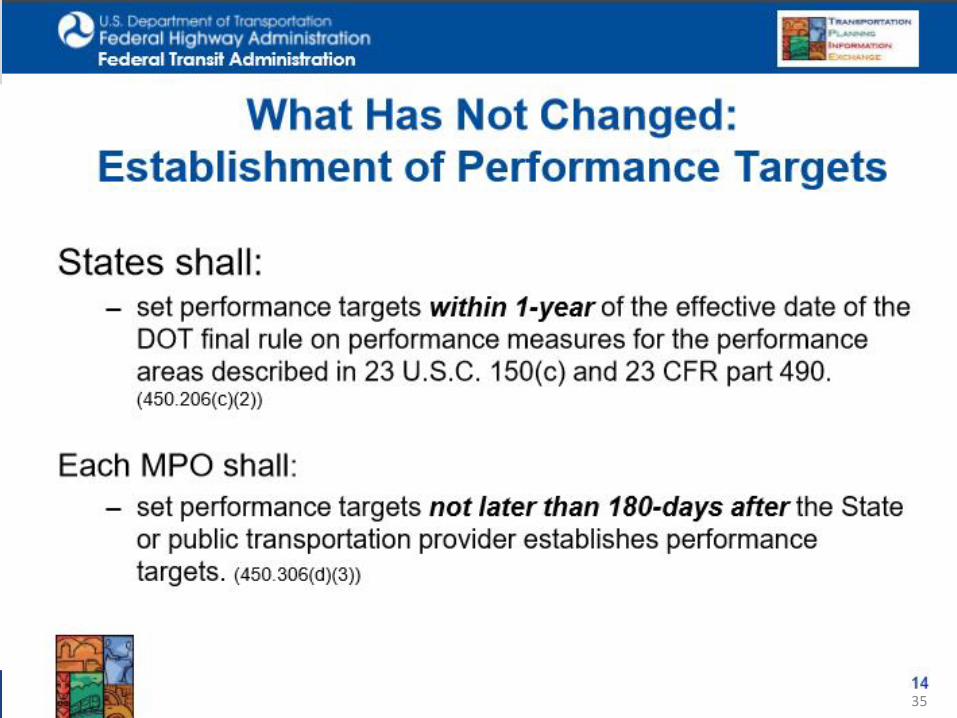
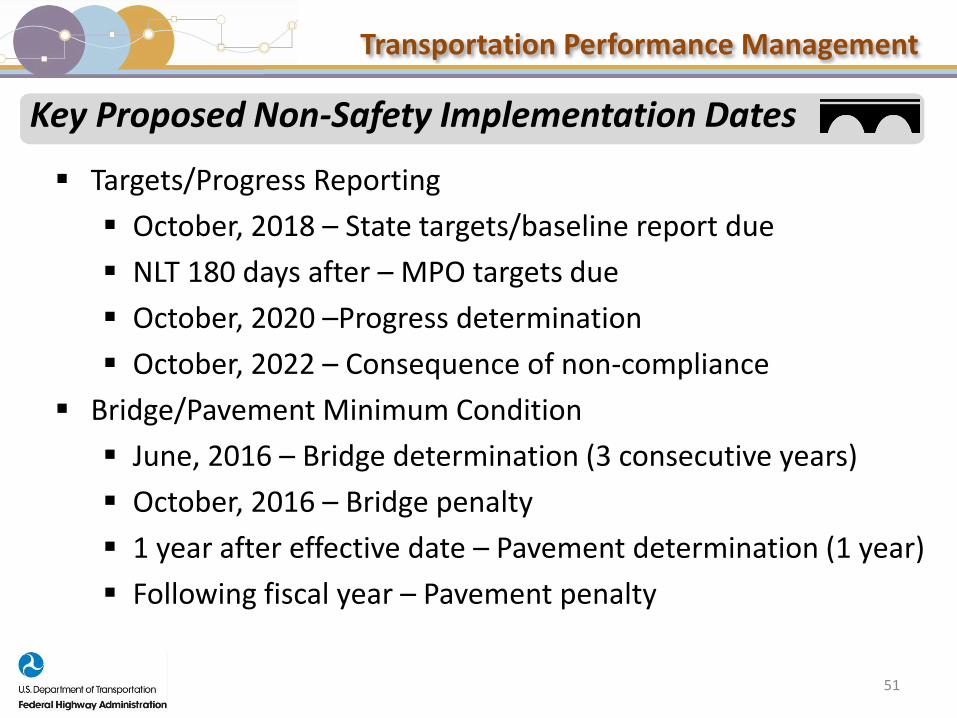
Key Proposed Non-Safety Implementation Dates
51
Targets/Progress Reporting
October, 2018 – State targets/baseline report due
NLT 180 days after – MPO targets due
October, 2020 –Progress determination
October, 2022 – Consequence of non-compliance
Bridge/Pavement Minimum Condition
June, 2016 – Bridge determination (3 consecutive years)
October, 2016 – Bridge penalty
1 year after effective date – Pavement determination (1 year)
Following fiscal year – Pavement penalty
Transportation Performance Management
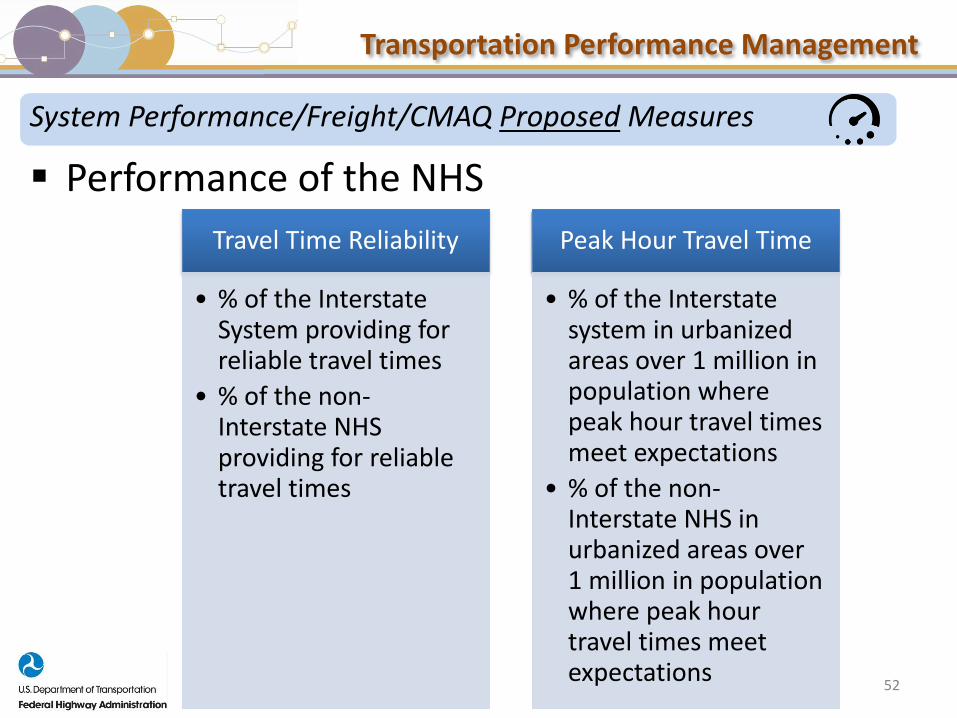
System Performance/Freight/CMAQ Proposed Measures
52
Performance of the NHS
Travel Time Reliability
• % of the Interstate System providing for reliable travel times
• % of the non-Interstate NHS providing for reliable travel times
Peak Hour Travel Time
• % of the Interstate system in urbanized areas over 1 million in population where peak hour travel times meet expectations
• % of the non-Interstate NHS in urbanized areas over 1 million in population where peak hour travel times meet expectations
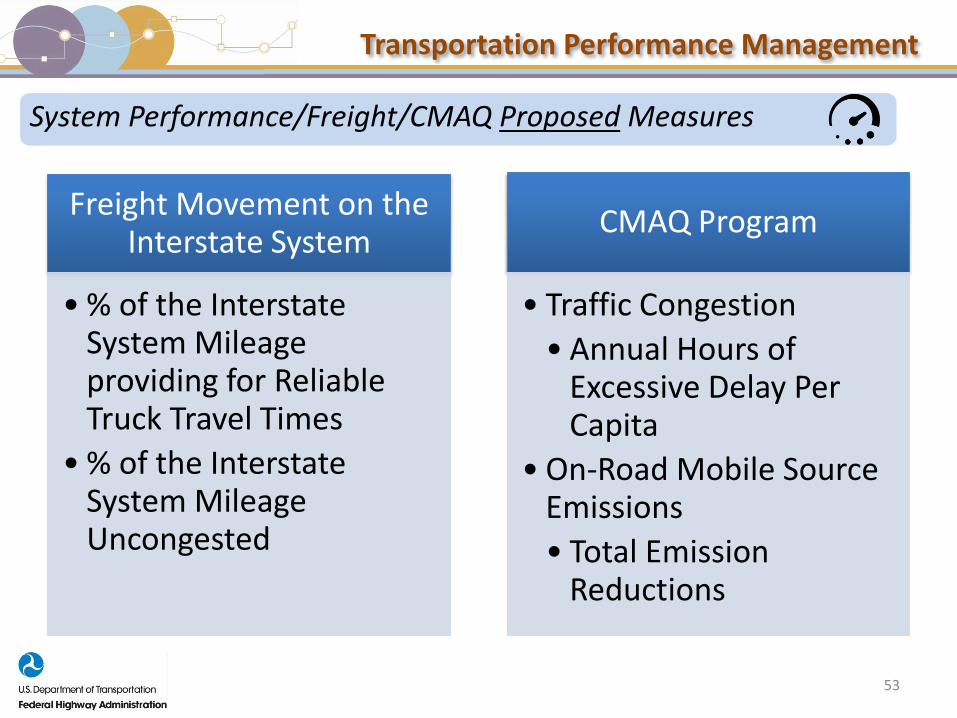
Transportation Performance Management
Freight Movement on the Interstate System
• % of the Interstate System Mileage providing for Reliable Truck Travel Times
• % of the Interstate System Mileage Uncongested
CMAQ Program
• Traffic Congestion
• Annual Hours of Excessive Delay Per Capita
• On-Road Mobile Source Emissions
• Total Emission Reductions
53
System Performance/Freight/CMAQ Proposed Measures

Transportation Performance Management
System Performance/Freight/CMAQ Proposed Target Establishment
For Travel Time Reliability and
Freight Movement on the Interstate
Measures
• State DOTs establish 2- and 4-year targets. MPOs either agree to support statewide target or establish their own.
For Peak Hour Travel Time and Traffic
Congestion Measures
• State DOTs and MPOs collectively establish single, unified targets for each applicable urbanized area.
For On-Road Mobile Source Emissions
Measure
• MPOs that have applicable projects establish targets
54

Transportation Performance Management
System Performance/Freight/CMAQ Proposed Primary Data Sources
For Travel Time Reliability, Peak Hour Travel Time, Freight Movement, and
Traffic Congestion Measures
• National Performance Management Research Data Set (NPMRDS) or equivalent
For On-Road Mobile Source Emissions Measure
• CMAQ Public Access System
55
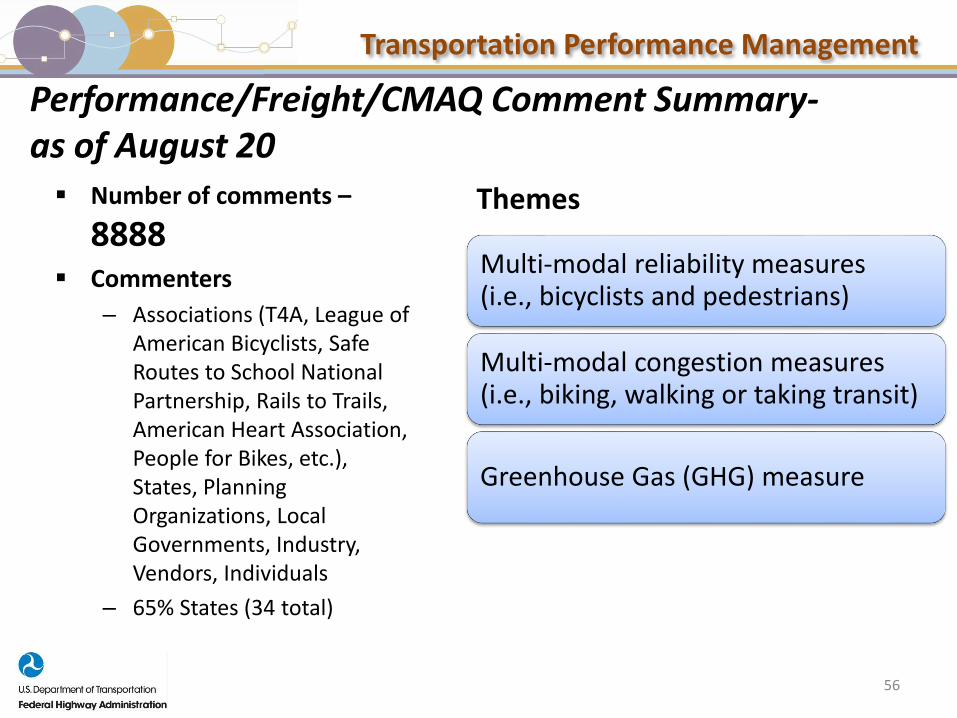
Transportation Performance Management
Performance/Freight/CMAQ Comment Summary-as of August 20 Number of comments –
8888 Commenters
– Associations (T4A, League of American Bicyclists, Safe Routes to School National Partnership, Rails to Trails, American Heart Association, People for Bikes, etc.), States, Planning Organizations, Local Governments, Industry, Vendors, Individuals
– 65% States (34 total)
56
Multi-modal reliability measures(i.e., bicyclists and pedestrians)
Multi-modal congestion measures (i.e., biking, walking or taking transit)
Greenhouse Gas (GHG) measure
Themes
Transportation Performance Management
What’s next for FHWA?
57

Transportation Performance Management
What’s Next from FHWA?
Final Rules- Pavement/Bridge Condition Measures, System Performance/ Freight/ CMAQ Measures, Asset Management Plan
Guidance
Training
Workshops and Peer Exchanges
Technical assistance and support
58
Transportation Performance Management
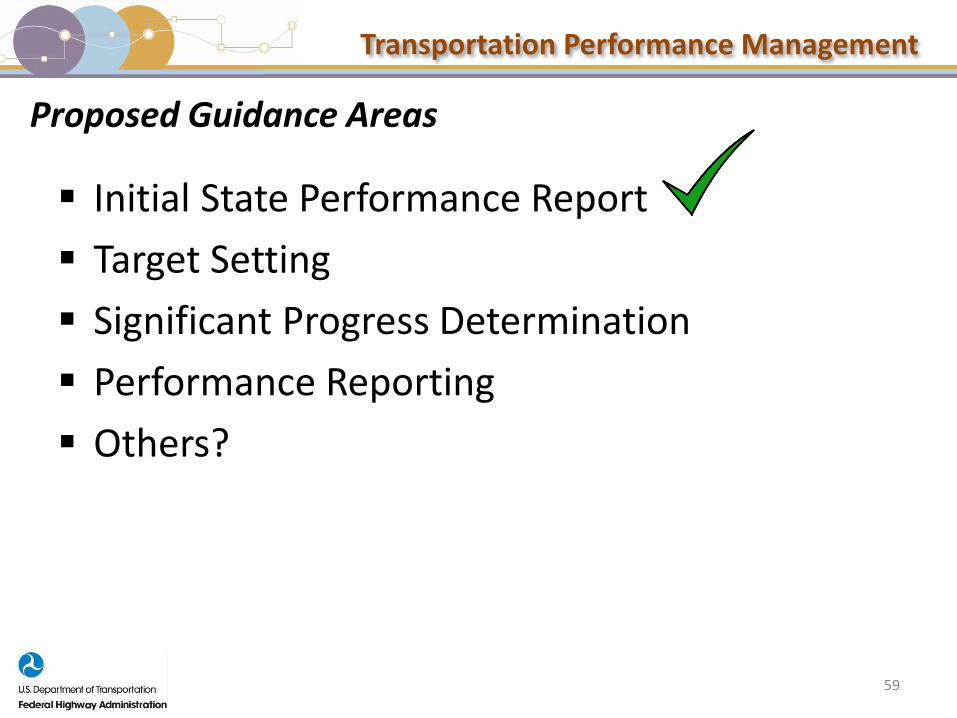
Proposed Guidance Areas
Initial State Performance Report
Target Setting
Significant Progress Determination
Performance Reporting
Others?
59
Transportation Performance Management
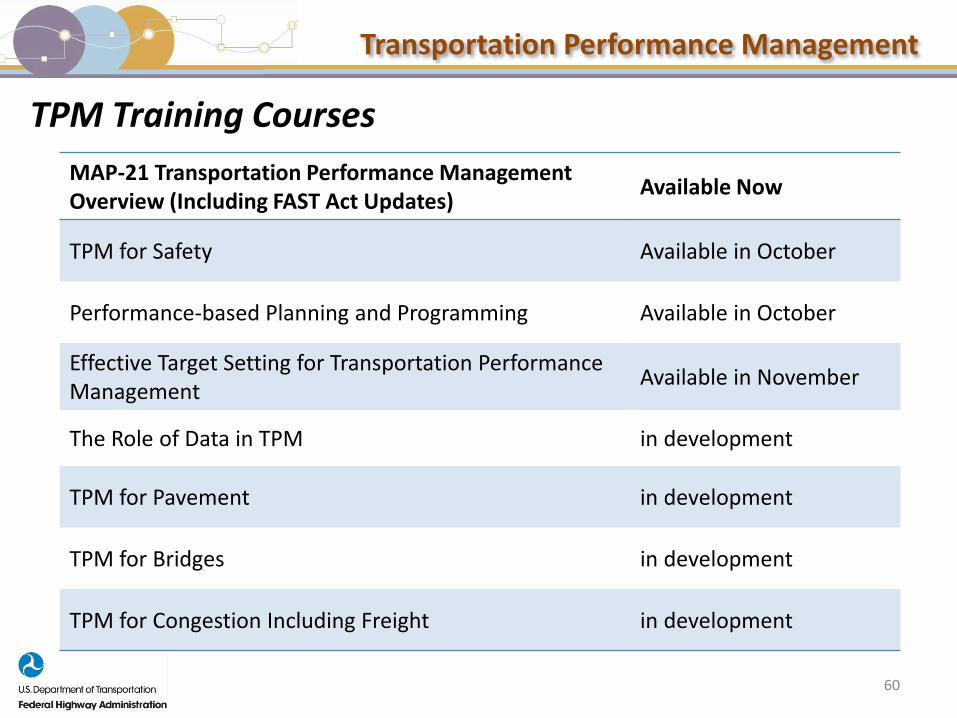
TPM Training Courses
60
MAP-21 Transportation Performance Management Overview (Including FAST Act Updates)
Available Now
TPM for Safety Available in October
Performance-based Planning and Programming Available in October
Effective Target Setting for Transportation Performance Management
Available in November
The Role of Data in TPM in development
TPM for Pavement in development
TPM for Bridges in development
TPM for Congestion Including Freight in development
Transportation Performance Management
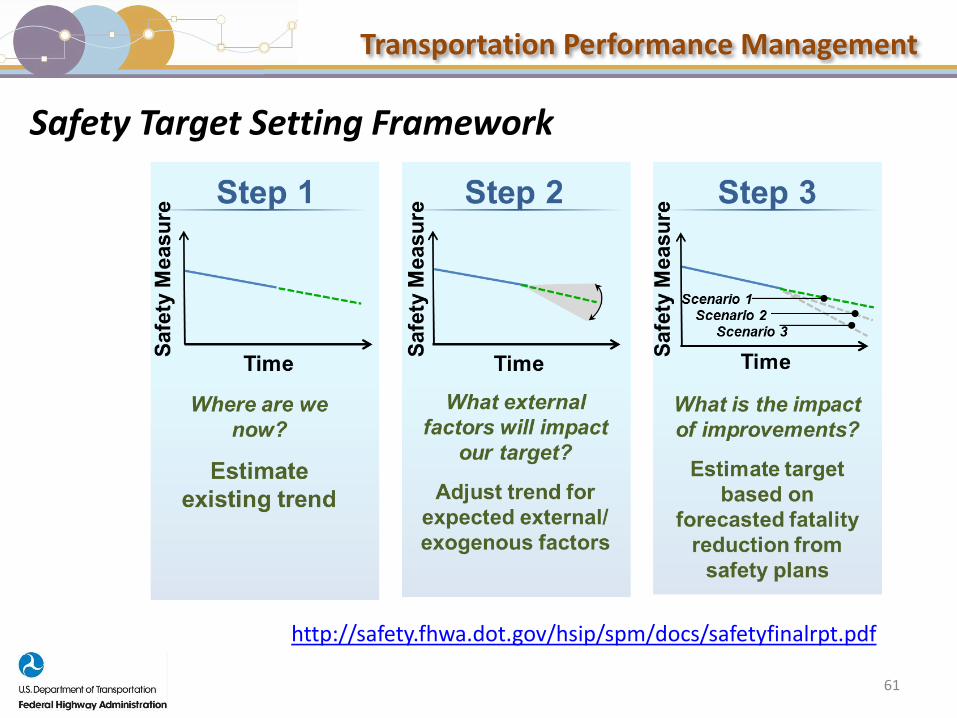
Safety Target Setting Framework
61
http://safety.fhwa.dot.gov/hsip/spm/docs/safetyfinalrpt.pdf
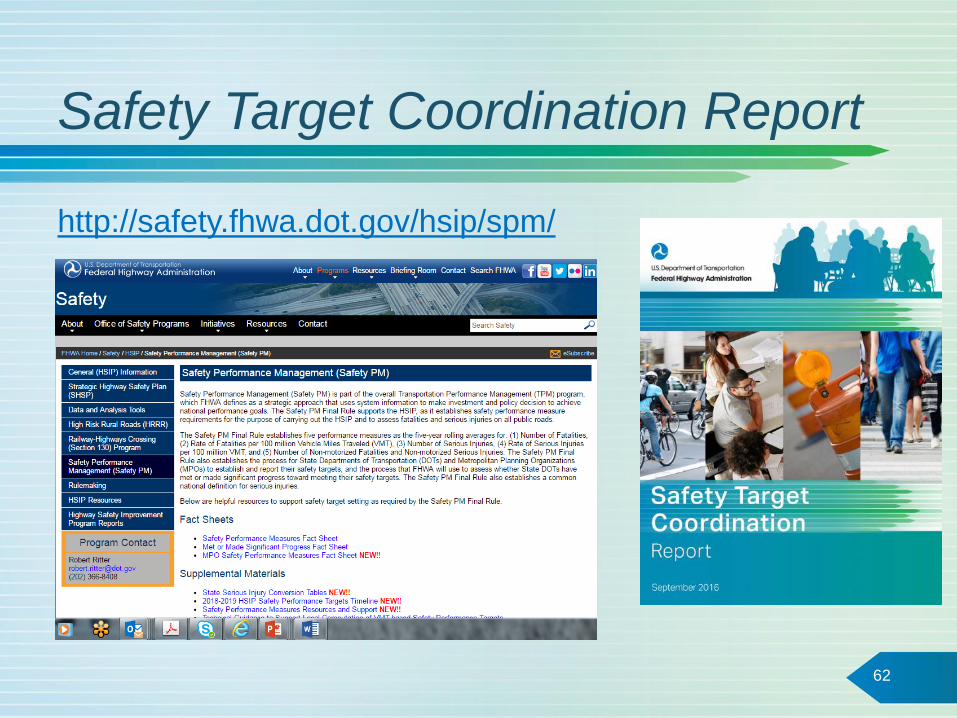
Safety Target Coordination Report
62
http://safety.fhwa.dot.gov/hsip/spm/
Transportation Performance Management
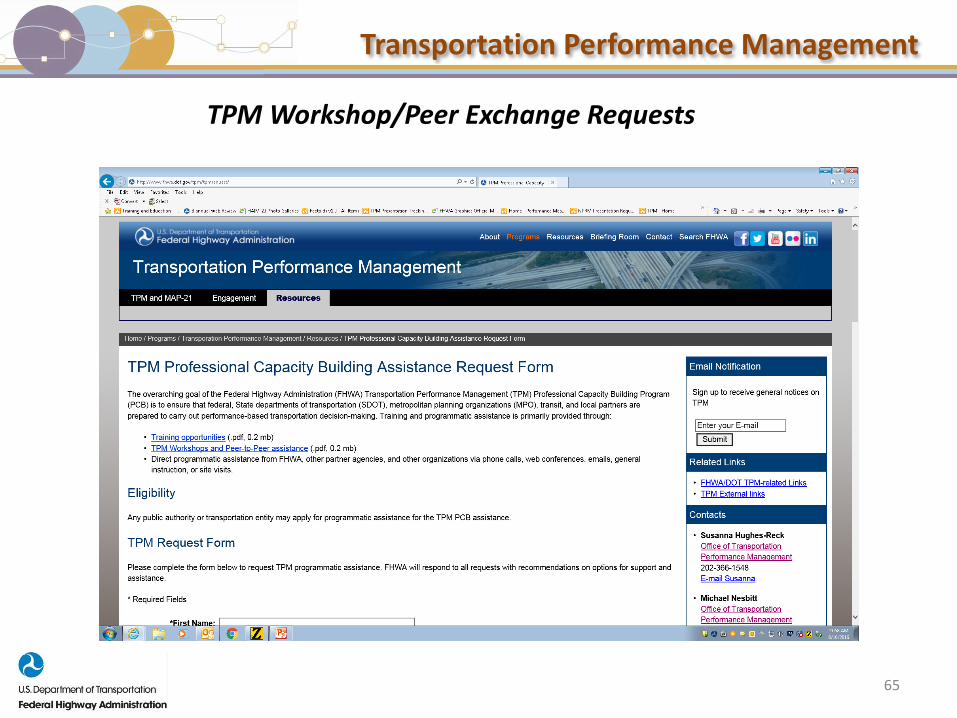
TPM Workshop/Peer Exchange Requests
65
Transportation Performance Management
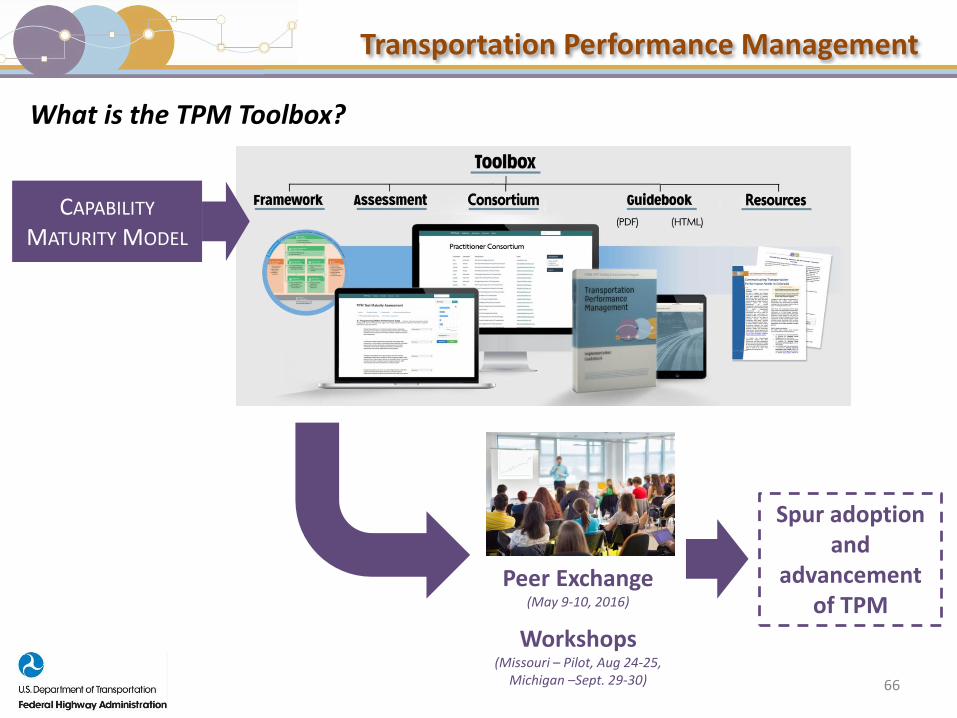
What is the TPM Toolbox?
66
Peer Exchange(May 9-10, 2016)
Workshops(Missouri – Pilot, Aug 24-25,
Michigan –Sept. 29-30)
Spur adoption and
advancement of TPM
CAPABILITY
MATURITY MODEL
Transportation Performance Management
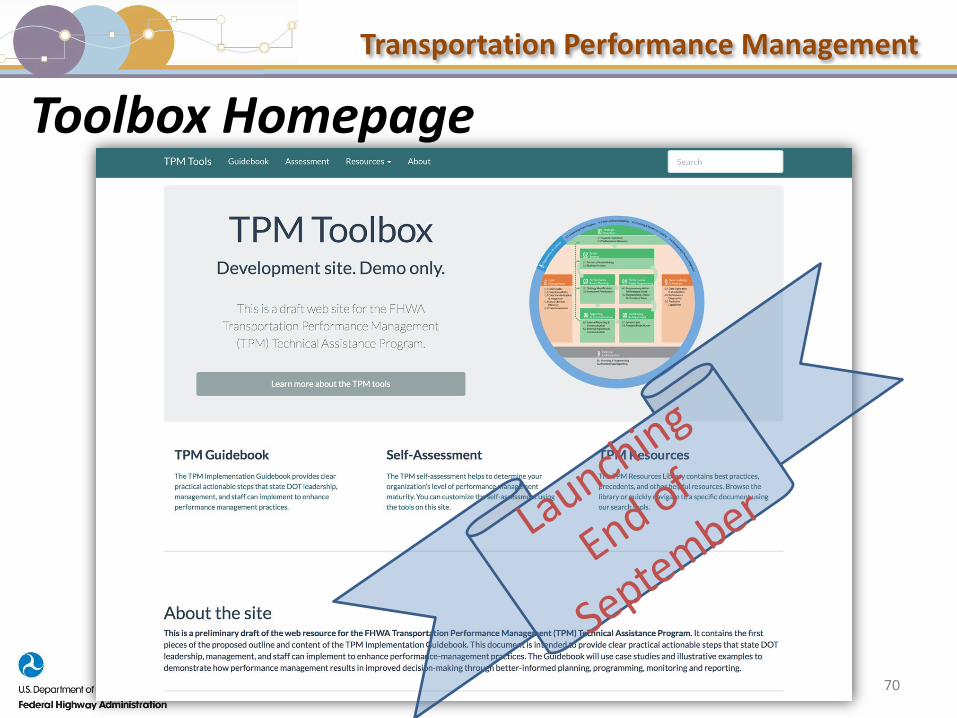
Toolbox Homepage
70
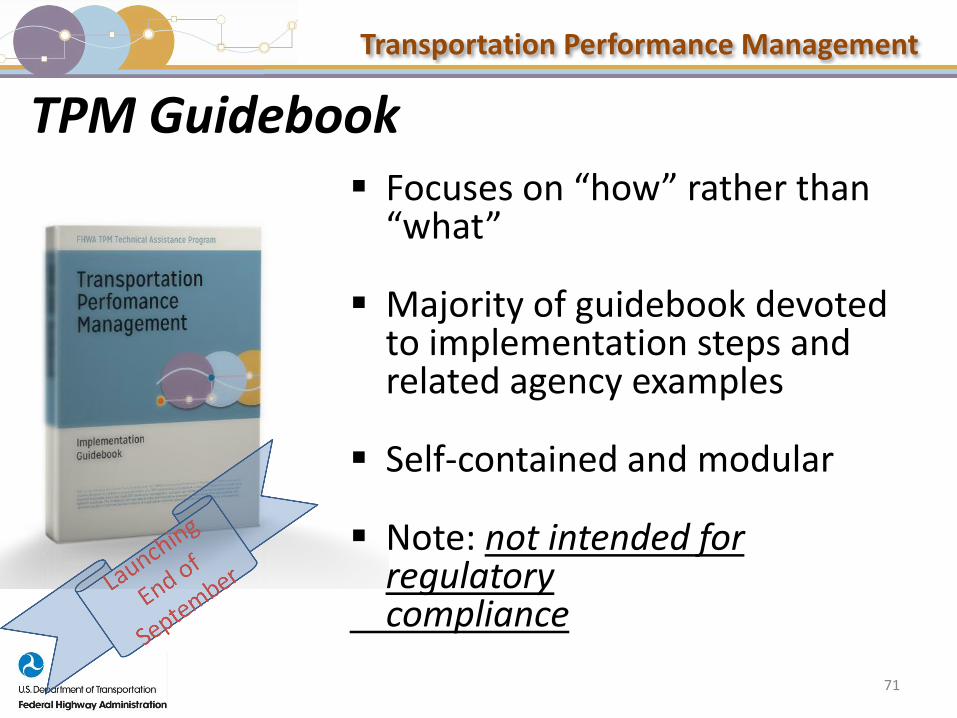
Transportation Performance Management
TPM Guidebook Focuses on “how” rather than
“what”
Majority of guidebook devoted to implementation steps and related agency examples
Self-contained and modular
Note: not intended for regulatory compliance
71
Transportation Performance Management
The Future of Transportation Performance Management
72
Transportation Performance Management
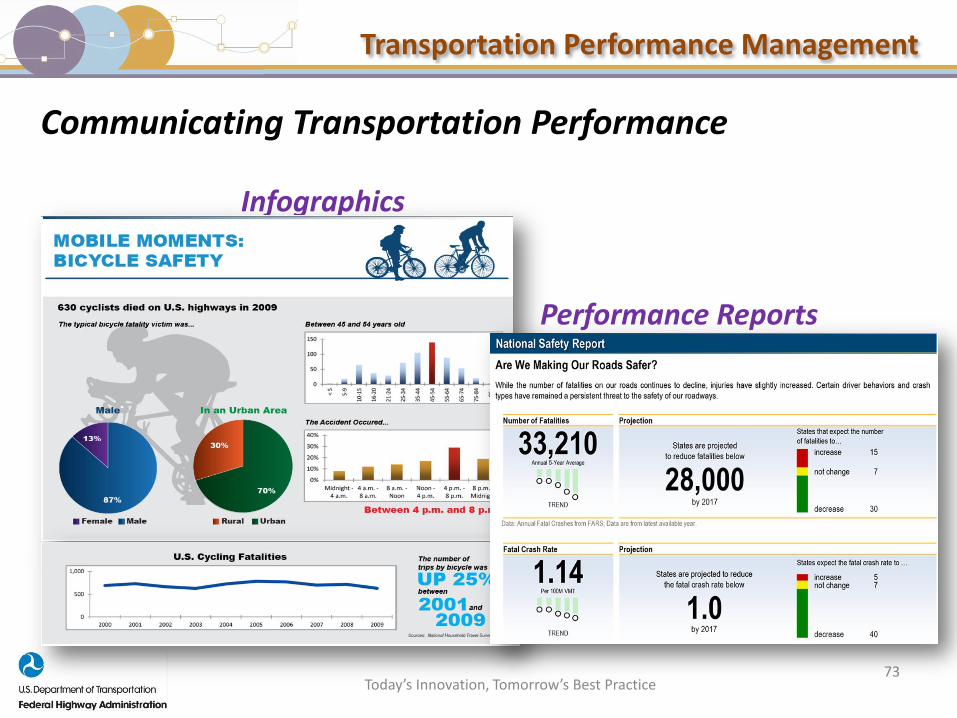
Infographics
73
Performance Reports
Communicating Transportation Performance
Today’s Innovation, Tomorrow’s Best Practice
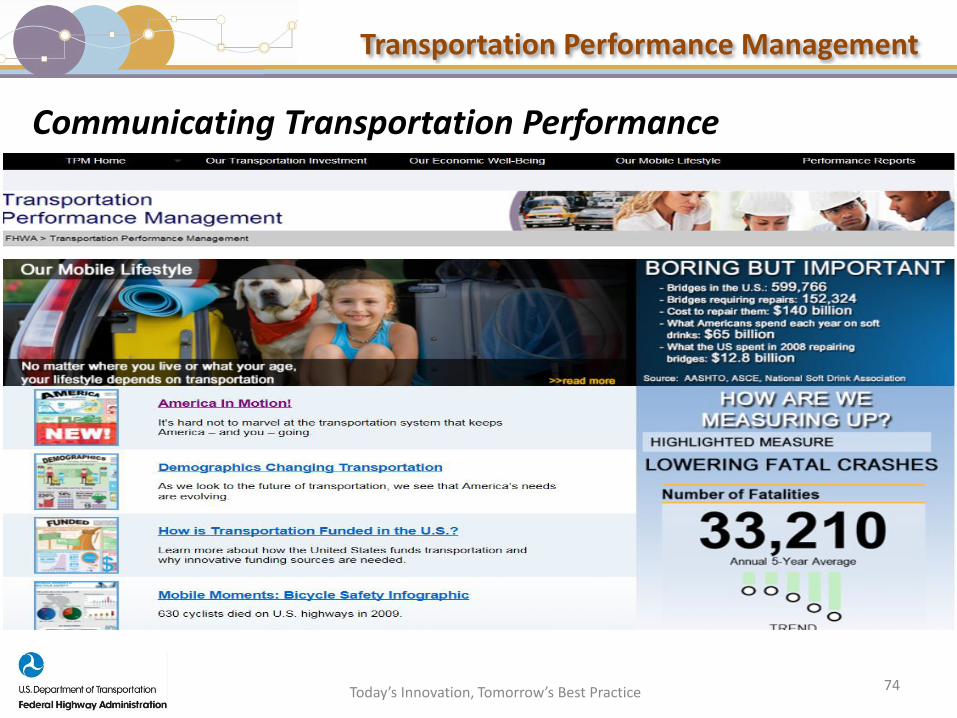
Transportation Performance Management
Today’s Innovation, Tomorrow’s Best Practice 74
Communicating Transportation Performance

Transportation Performance Management
Thank You
http://www.fhwa.dot.gov/tpm/
Today’s Innovation, Tomorrow’s Best Practice 75
Florida Department of
TRANSPORTATION
Update
76
Carl Mikyska, Executive Director(850) 414-4062 [email protected]
Florida Department of Transportation
For further information please contact:
Carl Mykyska, Executive Director
Florida MPO Advisory Council
605 Suwannee Street, MS 28B
Tallahassee, FL 32399
(850) 414-4062 Office
(850) 545-1890 Cell
www.mpoac.org
77
MPOAC

Florida Department of
TRANSPORTATION
FDOT/MPO Pilot Update National Performance Measures
78
Florida Department of Transportation
Joe Crossett – High Street Consulting GroupBeth Alden – Hillsborough County MPOJames Cromar – Broward MPOPhil Matson – Indian River County MPOMike Escalante – Gainesville MTPO
Panel
79
Florida Department of Transportation
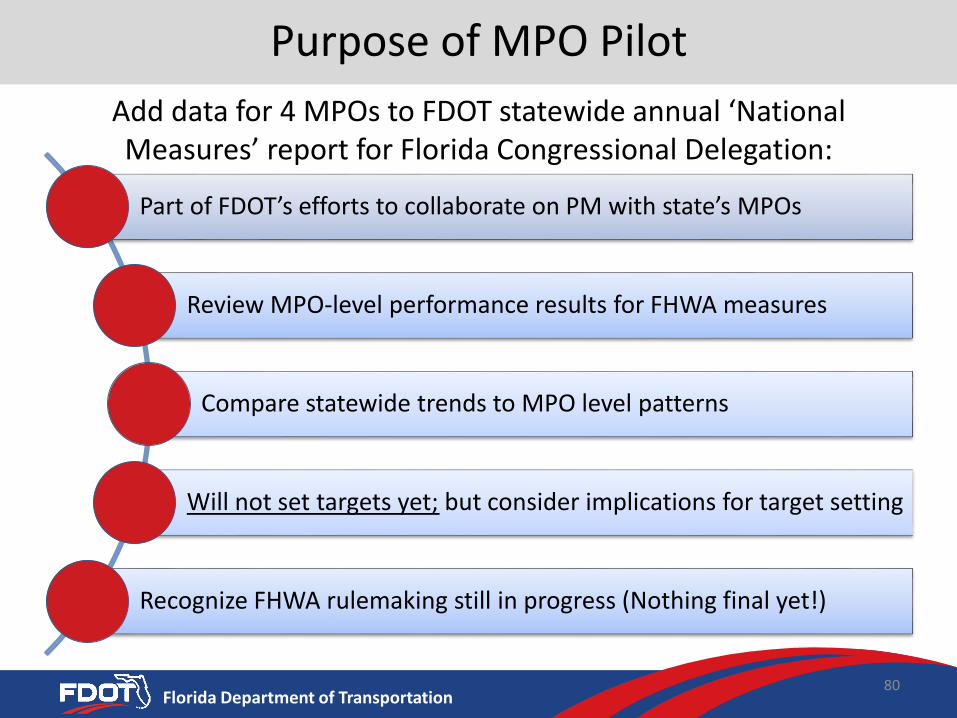
Part of FDOT’s efforts to collaborate on PM with state’s MPOs
Review MPO-level performance results for FHWA measures
Compare statewide trends to MPO level patterns
Will not set targets yet; but consider implications for target setting
Recognize FHWA rulemaking still in progress (Nothing final yet!)
Purpose of MPO Pilot
Add data for 4 MPOs to FDOT statewide annual ‘National Measures’ report for Florida Congressional Delegation:
80
Florida Department of Transportation81
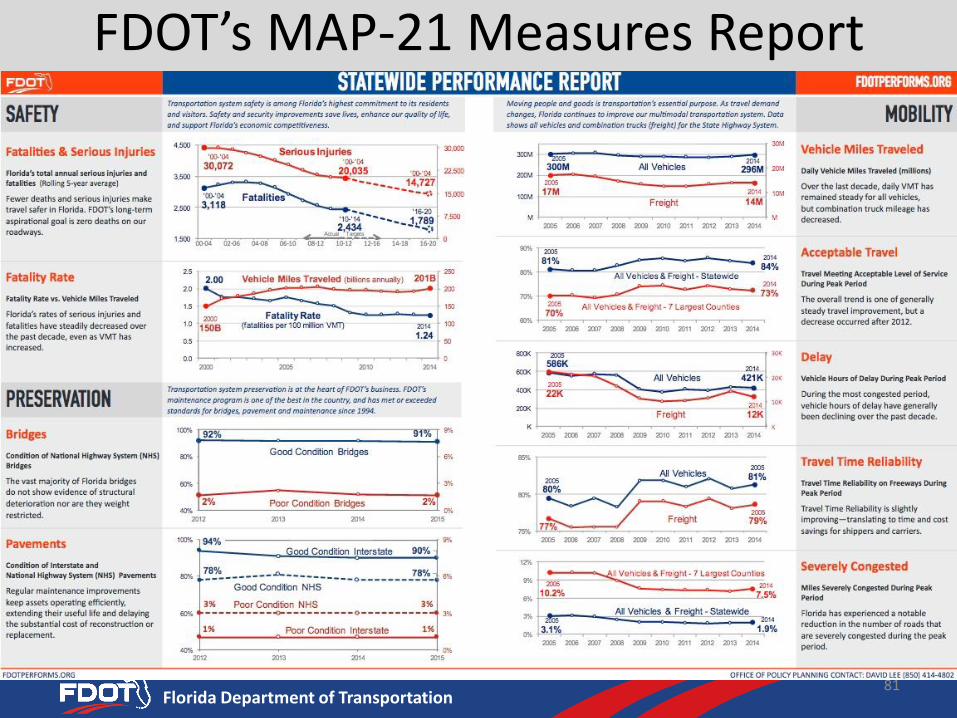
FDOT’s MAP-21 Measures Report

Florida Department of Transportation
Daily Vehicle Miles Traveled in Pilot MPOs
(2015 State Highway System Vehicle Miles Traveled by MPO/TPO Boundary)
Hillsborough
82
Gainesville Indian River
21 Million VMT4% large trucks
27 Million VMT4% large trucks
2.7 Million VMT5% large trucks
1.6 Million VMT4% large trucks
Broward
Florida Department of Transportation
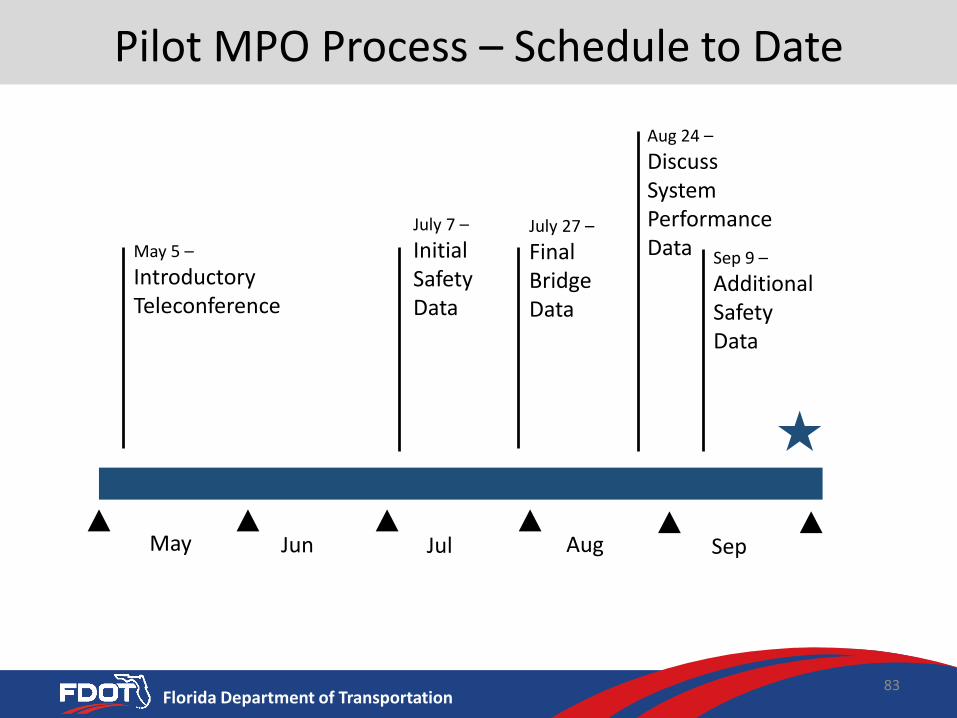
Pilot MPO Process – Schedule to Date
83
May Jun Jul Aug Sep
May 5 –
IntroductoryTeleconference
Sep 9 –
Additional Safety Data
Aug 24 –
Discuss System Performance Data
July 27 –
Final Bridge Data
July 7 –
Initial Safety Data
Florida Department of Transportation
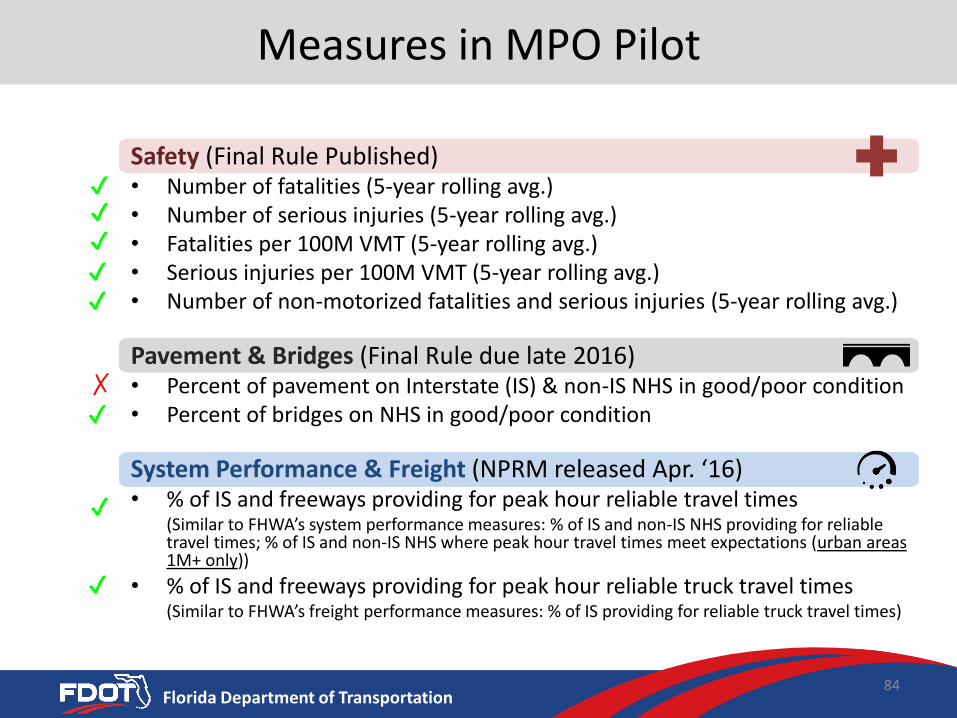
Measures in MPO Pilot
Safety (Final Rule Published)• Number of fatalities (5-year rolling avg.)• Number of serious injuries (5-year rolling avg.)• Fatalities per 100M VMT (5-year rolling avg.)• Serious injuries per 100M VMT (5-year rolling avg.)• Number of non-motorized fatalities and serious injuries (5-year rolling avg.)
Pavement & Bridges (Final Rule due late 2016)• Percent of pavement on Interstate (IS) & non-IS NHS in good/poor condition• Percent of bridges on NHS in good/poor condition
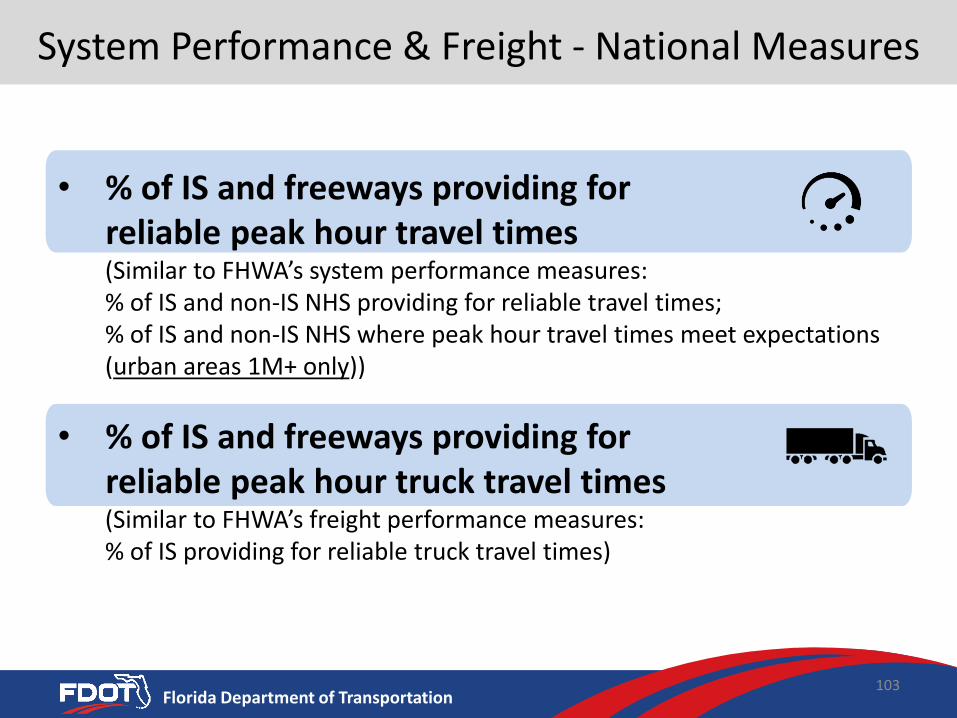
System Performance & Freight (NPRM released Apr. ‘16)• % of IS and freeways providing for peak hour reliable travel times
(Similar to FHWA’s system performance measures: % of IS and non-IS NHS providing for reliable travel times; % of IS and non-IS NHS where peak hour travel times meet expectations (urban areas 1M+ only))
• % of IS and freeways providing for peak hour reliable truck travel times (Similar to FHWA’s freight performance measures: % of IS providing for reliable truck travel times)
84
✔✔
✔
✔
✔
✔
✗
✔
✔
Florida Department of Transportation
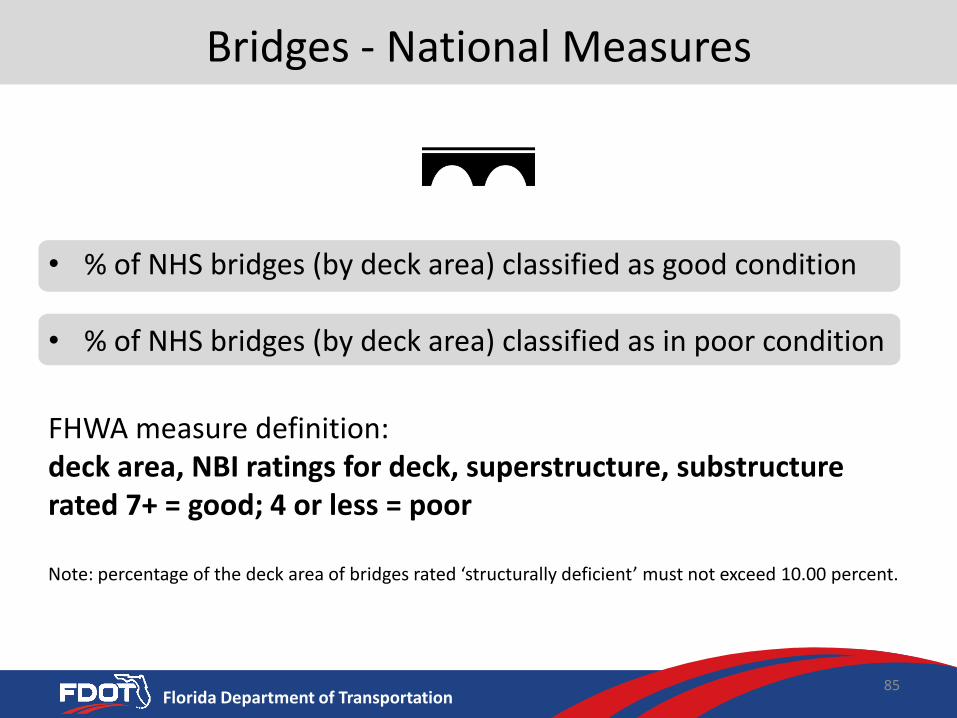
• % of NHS bridges (by deck area) classified as good condition
• % of NHS bridges (by deck area) classified as in poor condition
FHWA measure definition: deck area, NBI ratings for deck, superstructure, substructure rated 7+ = good; 4 or less = poor
Note: percentage of the deck area of bridges rated ‘structurally deficient’ must not exceed 10.00 percent.
Bridges - National Measures
85
9/28/2016 86Florida Department of Transportation 86
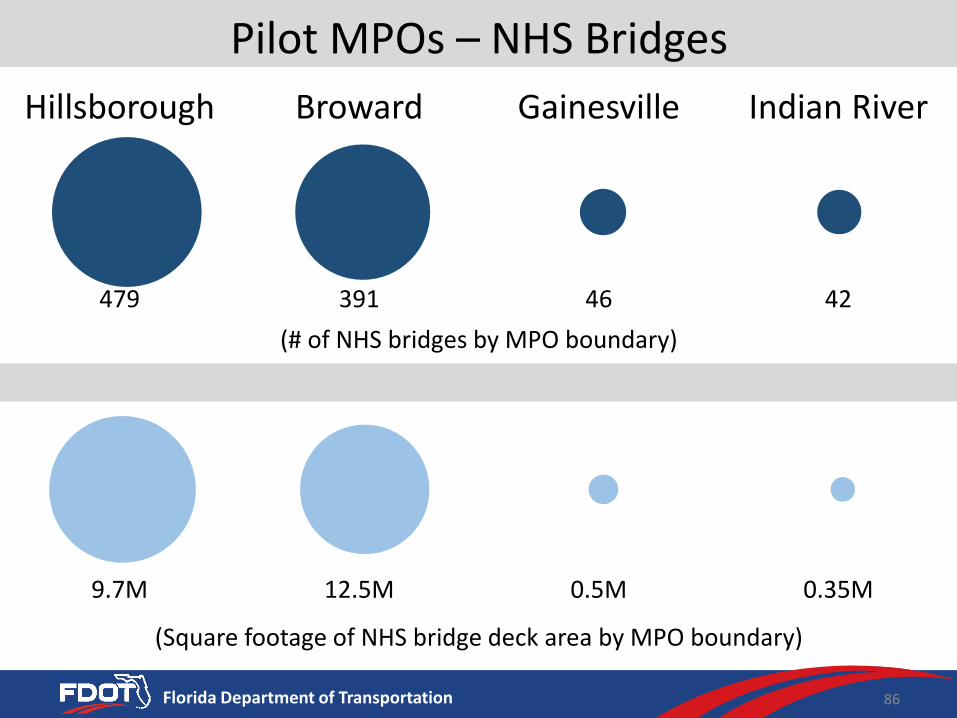
Pilot MPOs – NHS Bridges
Hillsborough Gainesville Indian River
479 391 46 42
(# of NHS bridges by MPO boundary)
9.7M 12.5M 0.35M0.5M
(Square footage of NHS bridge deck area by MPO boundary)
Broward
Florida Department of Transportation
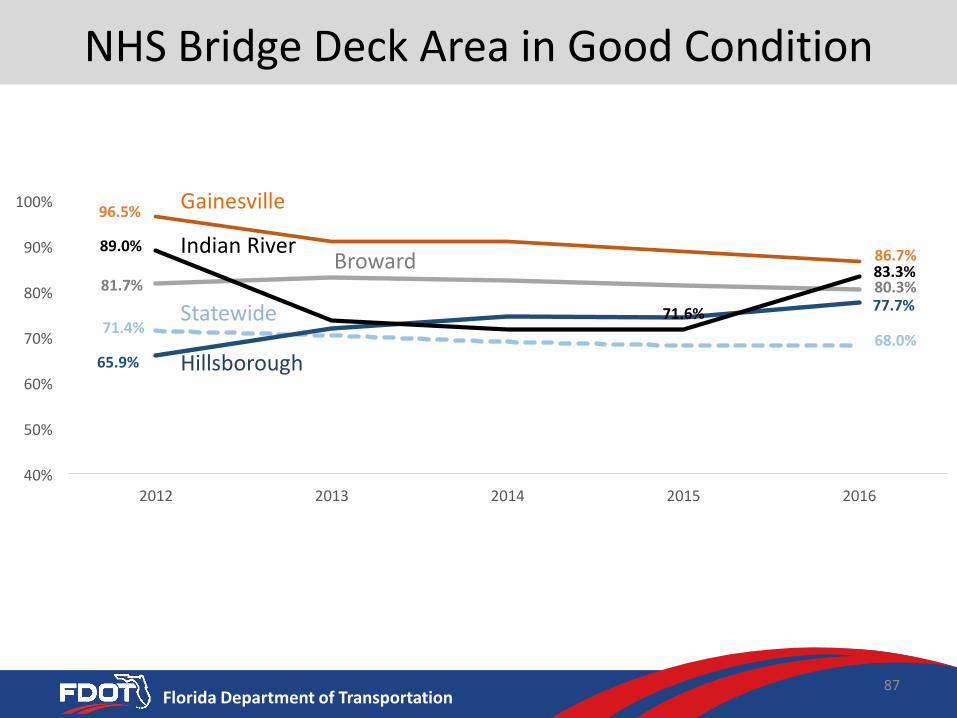
NHS Bridge Deck Area in Good Condition
87
71.4%68.0%
81.7% 80.3%
96.5%
86.7%
65.9%
77.7%
89.0%
71.6%
83.3%
40%
50%
60%
70%
80%
90%
100%
2012 2013 2014 2015 2016
Gainesville
Indian RiverBroward
Hillsborough
Statewide

Florida Department of Transportation
NHS Bridge Deck Area in Poor Condition
88
3.14%
1.77%
0.82%
0.00%0.00%
1.00%
2.00%
3.00%
4.00%
2012 2013 2014 2015 2016
Statewide
Hillsborough
Florida Department of
TRANSPORTATION
MPO Pilot PerspectivesBroward
HillsboroughGainesville
Indian River
89
9/28/2016 90Florida Department of Transportation 90
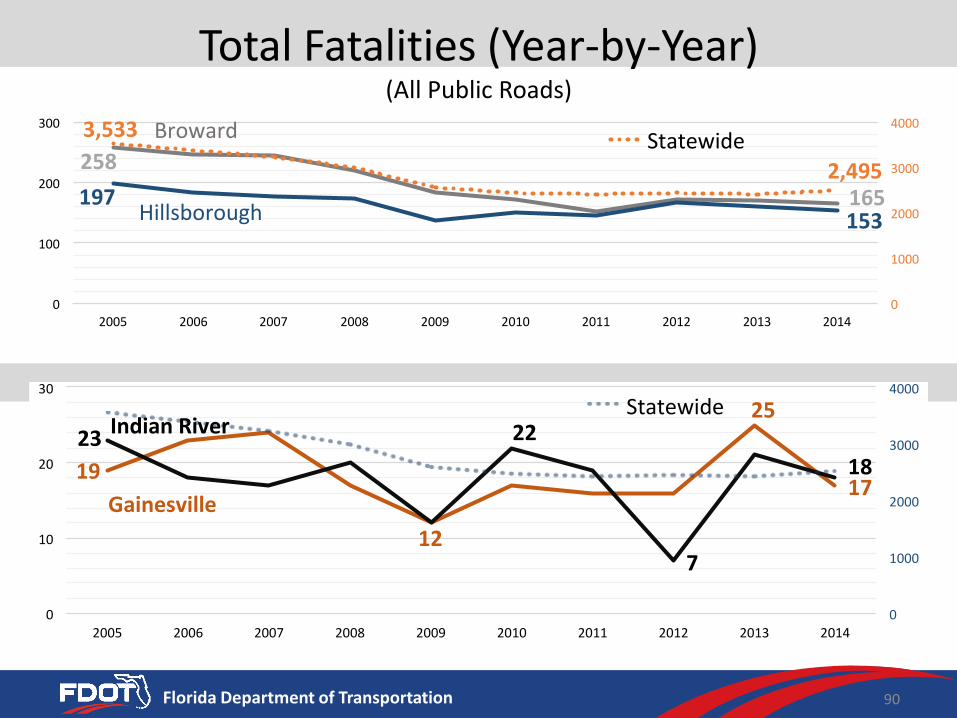
Total Fatalities (Year-by-Year)(All Public Roads)
258
165197153
3,533
2,495
0
1000
2000
3000
4000
0
100
200
300
2005 2006 2007 2008 2009 2010 2011 2012 2013 2014
StatewideBroward
Hillsborough
19
12
25
17
23 22
7
18
0
1000
2000
3000
4000
0
10
20
30
2005 2006 2007 2008 2009 2010 2011 2012 2013 2014
Statewide
Gainesville
IndianRiver

9/28/2016 91Florida Department of Transportation 91
Total Fatalities (5 Year Rolling Avg.)(All Public Roads)
230
165173
151 155
0
1000
2000
3000
4000
0
100
200
300
2005 2006 2007 2008 2009 2010 2011 2012 2013 2014
Statewide
Broward
Hillsborough
19
16
1818 17
3,133
2,434
0
1000
2000
3000
4000
0
5
10
15
20
2005 2006 2007 2008 2009 2010 2011 2012 2013 2014
Statewide
Gainesville
IndianRiver
9/28/2016 92Florida Department of Transportation 92
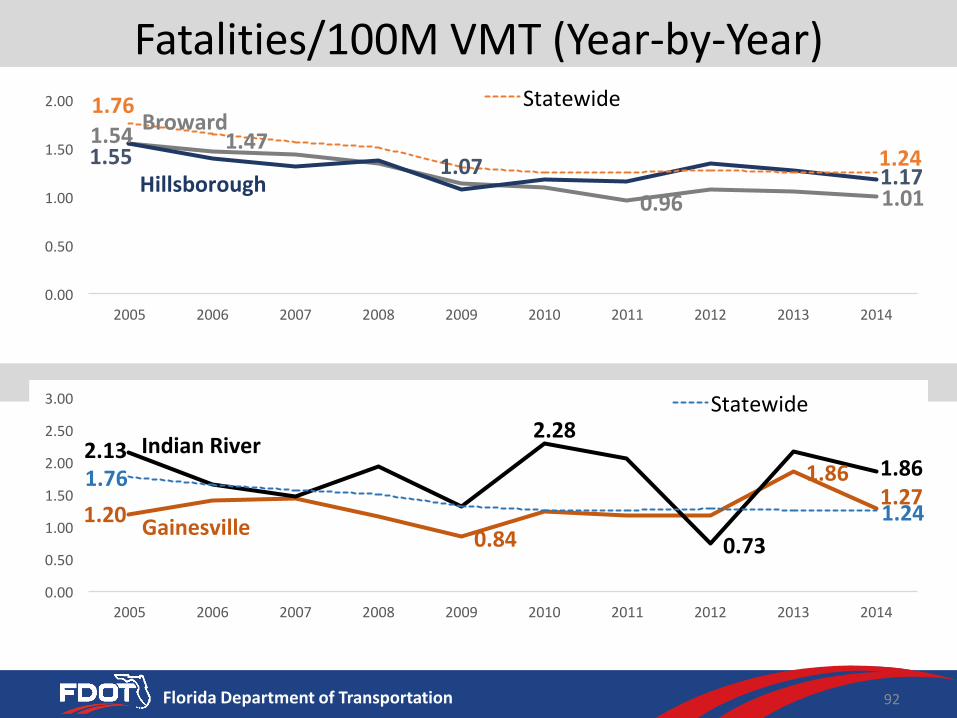
Fatalities/100M VMT (Year-by-Year)
1.54 1.47
0.96 1.01
1.55 1.07 1.17
1.76
1.24
0.00
0.50
1.00
1.50
2.00
2005 2006 2007 2008 2009 2010 2011 2012 2013 2014
StatewideBroward
Hillsborough
1.200.84
1.861.27
2.132.28
0.73
1.861.76
1.24
0.00
0.50
1.00
1.50
2.00
2.50
3.00
2005 2006 2007 2008 2009 2010 2011 2012 2013 2014
Statewide
Gainesville
IndianRiver
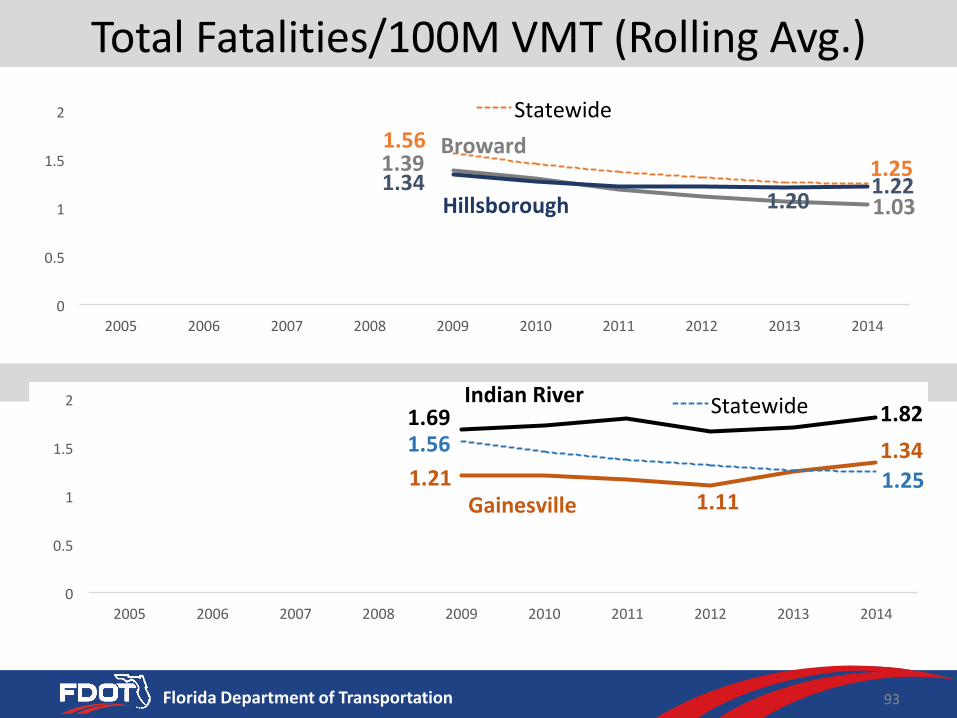
9/28/2016 93Florida Department of Transportation 93
Total Fatalities/100M VMT (Rolling Avg.)
1.39
1.031.34
1.201.22
1.561.25
0
0.5
1
1.5
2
2005 2006 2007 2008 2009 2010 2011 2012 2013 2014
Statewide
Broward
Hillsborough
1.211.11
1.34
1.69 1.82
1.56
1.25
0
0.5
1
1.5
2
2005 2006 2007 2008 2009 2010 2011 2012 2013 2014
Statewide
Gainesville
IndianRiver

Florida Department of
TRANSPORTATION
MPO Pilot PerspectivesBroward
HillsboroughGainesville
Indian River
94
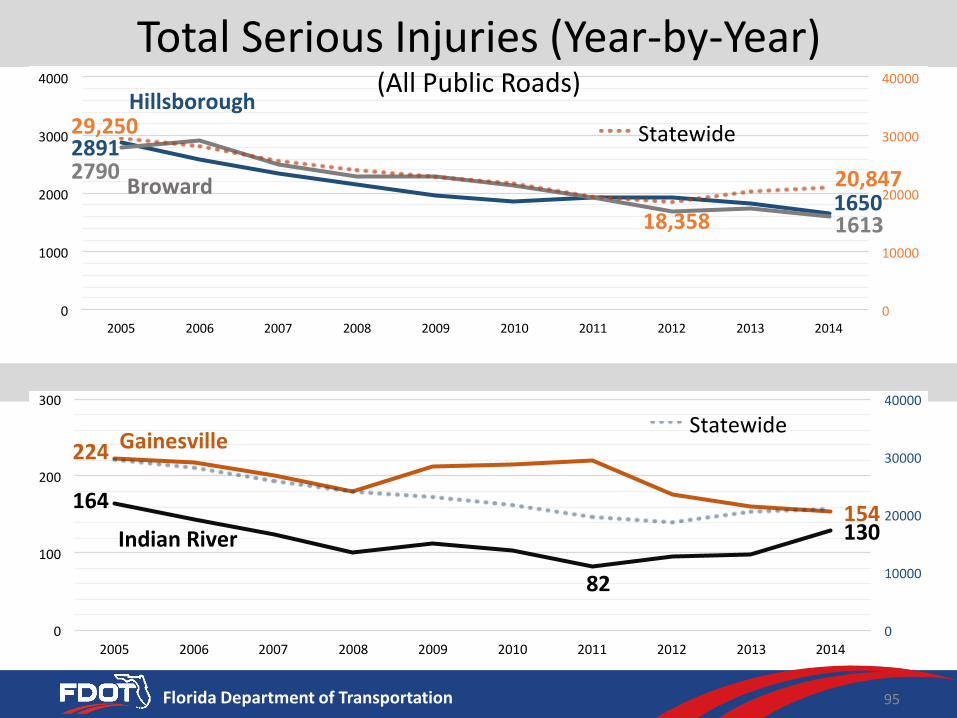
9/28/2016 95Florida Department of Transportation 95
2891
1650
2790
1613
29,250
18,358
20,847
0
10000
20000
30000
40000
0
1000
2000
3000
4000
2005 2006 2007 2008 2009 2010 2011 2012 2013 2014
Statewide
Broward
Hillsborough
Total Serious Injuries (Year-by-Year)(All Public Roads)
224
154164
82
130
0
10000
20000
30000
40000
0
100
200
300
2005 2006 2007 2008 2009 2010 2011 2012 2013 2014
StatewideGainesville
IndianRiver
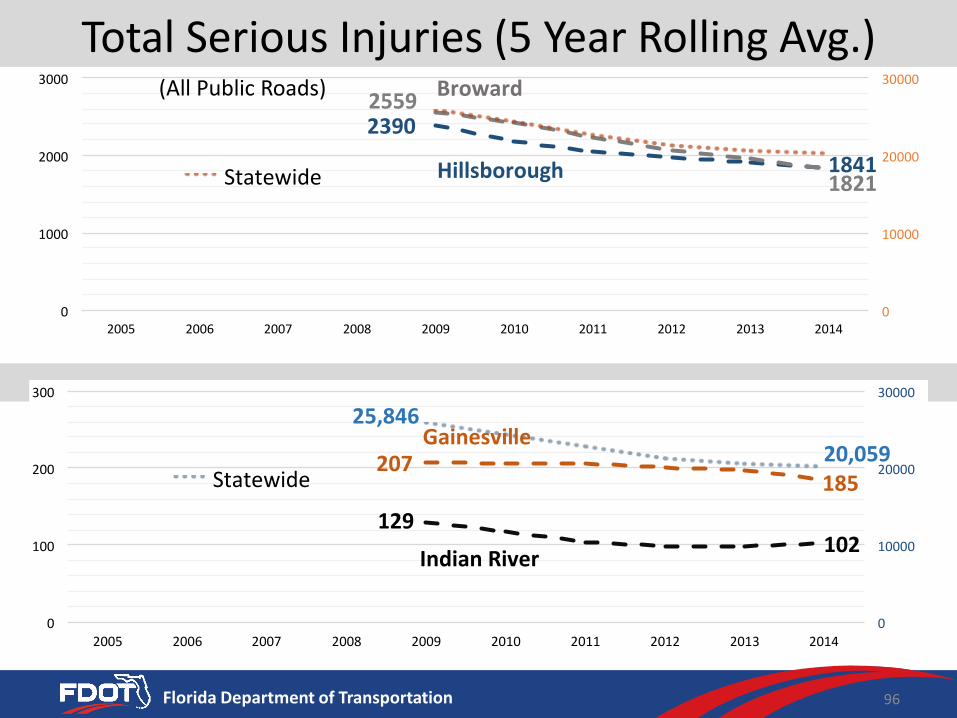
9/28/2016 96Florida Department of Transportation 96
2390
1841
2559
1821
0
10000
20000
30000
0
1000
2000
3000
2005 2006 2007 2008 2009 2010 2011 2012 2013 2014
Statewide
Broward
Hillsborough
Total Serious Injuries (5 Year Rolling Avg.)
207185
129102
25,846
20,059
0
10000
20000
30000
0
100
200
300
2005 2006 2007 2008 2009 2010 2011 2012 2013 2014
Statewide
Gainesville
IndianRiver
(All Public Roads)

9/28/2016 97Florida Department of Transportation 97
Serious Injuries/100M VMT (Yr-by-Yr)
17.3
10.1
21.9
12.414.5
10.4
-
5.00
10.00
15.00
20.00
25.00
2005 2006 2007 2008 2009 2010 2011 2012 2013 2014
StatewideBroward
Hillsborough
14.1 11.5
15.213.414.5
10.4
-
5.00
10.00
15.00
20.00
2005 2006 2007 2008 2009 2010 2011 2012 2013 2014
Statewide
Gainesville
IndianRiver
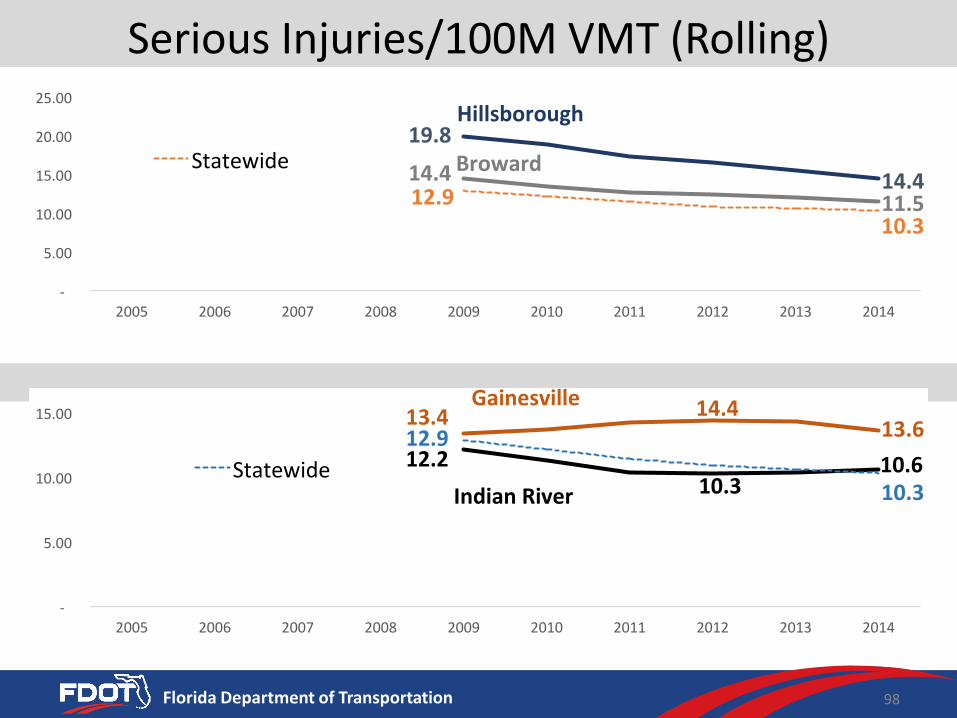
9/28/2016 98Florida Department of Transportation 98
Serious Injuries/100M VMT (Rolling)
13.4 14.413.6
12.210.3
10.612.9
10.3
-
5.00
10.00
15.00
2005 2006 2007 2008 2009 2010 2011 2012 2013 2014
Statewide
Gainesville
IndianRiver
14.4
11.5
19.8
14.412.9
10.3
-
5.00
10.00
15.00
20.00
25.00
2005 2006 2007 2008 2009 2010 2011 2012 2013 2014
Statewide Broward
Hillsborough

Florida Department of
TRANSPORTATION
MPO Pilot PerspectivesBroward
HillsboroughGainesville
Indian River
99

9/28/2016 100Florida Department of Transportation 100
298
216
351
301
260
274
207221
3423 3302
0
1000
2000
3000
4000
0
100
200
300
400
2005 2006 2007 2008 2009 2010 2011 2012 2013 2014
Statewide
Broward
Hillsborough
Number of Non-Motorized Fatalities & Serious Injuries (Combined)
311 299243 224
3158 3087
0
1000
2000
3000
4000
0
100
200
300
400
2005 2006 2007 2008 2009 2010 2011 2012 2013 2014
StatewideBroward
Hillsborough
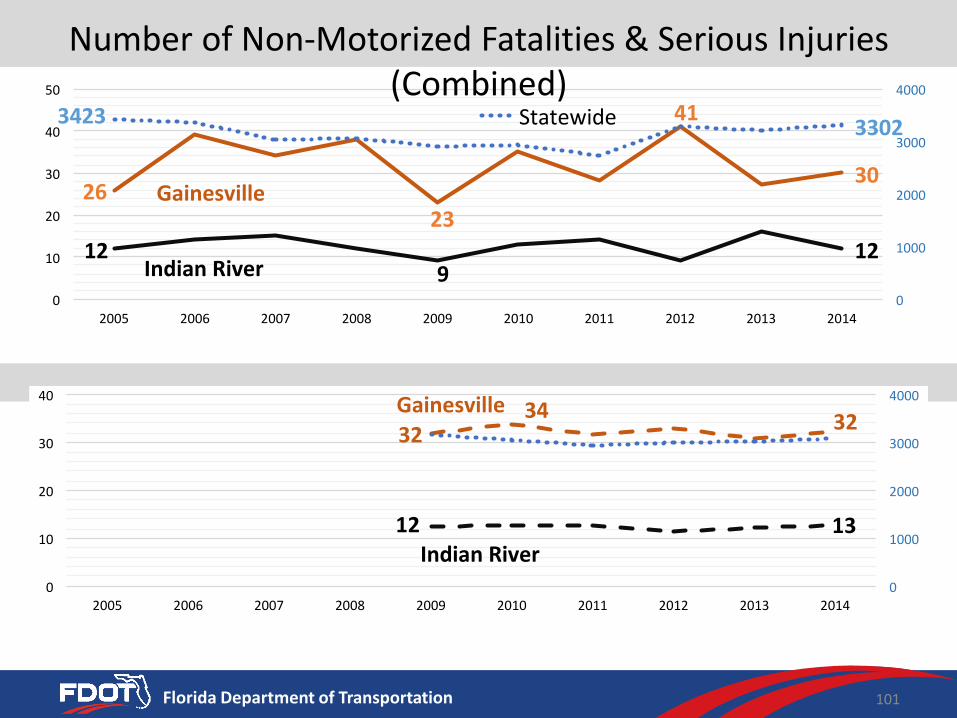
9/28/2016 101Florida Department of Transportation 101
2623
41
30
129
12
3423 3302
0
1000
2000
3000
4000
0
10
20
30
40
50
2005 2006 2007 2008 2009 2010 2011 2012 2013 2014
Statewide
Gainesville
IndianRiver
Number of Non-Motorized Fatalities & Serious Injuries (Combined)
3234 32
12 13
0
1000
2000
3000
4000
0
10
20
30
40
2005 2006 2007 2008 2009 2010 2011 2012 2013 2014
Gainesville
IndianRiver

Florida Department of
TRANSPORTATION
MPO Pilot PerspectivesBroward
HillsboroughGainesville
Indian River
102
Florida Department of Transportation
• % of IS and freeways providing for reliable peak hour travel times (Similar to FHWA’s system performance measures: % of IS and non-IS NHS providing for reliable travel times; % of IS and non-IS NHS where peak hour travel times meet expectations (urban areas 1M+ only))
• % of IS and freeways providing for reliable peak hour truck travel times (Similar to FHWA’s freight performance measures: % of IS providing for reliable truck travel times)
System Performance & Freight - National Measures
103

Florida Department of Transportation
Peak Hour Travel Reliability
(Freeways Inside MPO Boundary)
104
For seven largest counties travel time reliability is defined as the percentage of freeway trips traveling at least 45 mph.
For all others travel time reliability is defined as the percentage of freeway trips travelling at greater than or equal to 5mph below the posted speed limit.
Unreliable travel during peak hour
Broward GainesvilleHillsborough Indian River
78%
22%
83%
17%
96%
4%
97%
3%
Florida Department of Transportation
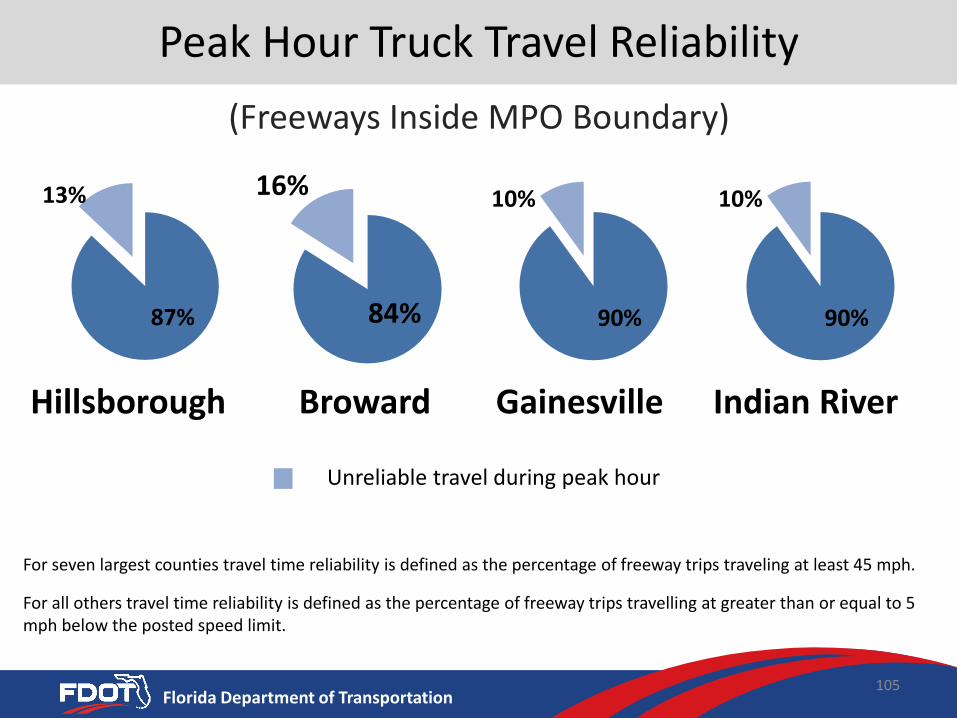
Peak Hour Truck Travel Reliability
(Freeways Inside MPO Boundary)
105
Unreliable travel during peak hour
For seven largest counties travel time reliability is defined as the percentage of freeway trips traveling at least 45 mph.
For all others travel time reliability is defined as the percentage of freeway trips travelling at greater than or equal to 5mph below the posted speed limit.
Broward GainesvilleHillsborough Indian River
84%
16%
87%
13%
90%
10%
90%
10%

Florida Department of Transportation
Other FDOT Mobility Measures
% of Heavily Congested Freeway Miles at Peak Hour
Heavily congested (LOS F) freeway miles during peak hour (By MPO boundary region)
Broward GainesvilleHillsborough Indian River
23%
77%
16%
84%
<1%
>99%
<1%
>99%
106
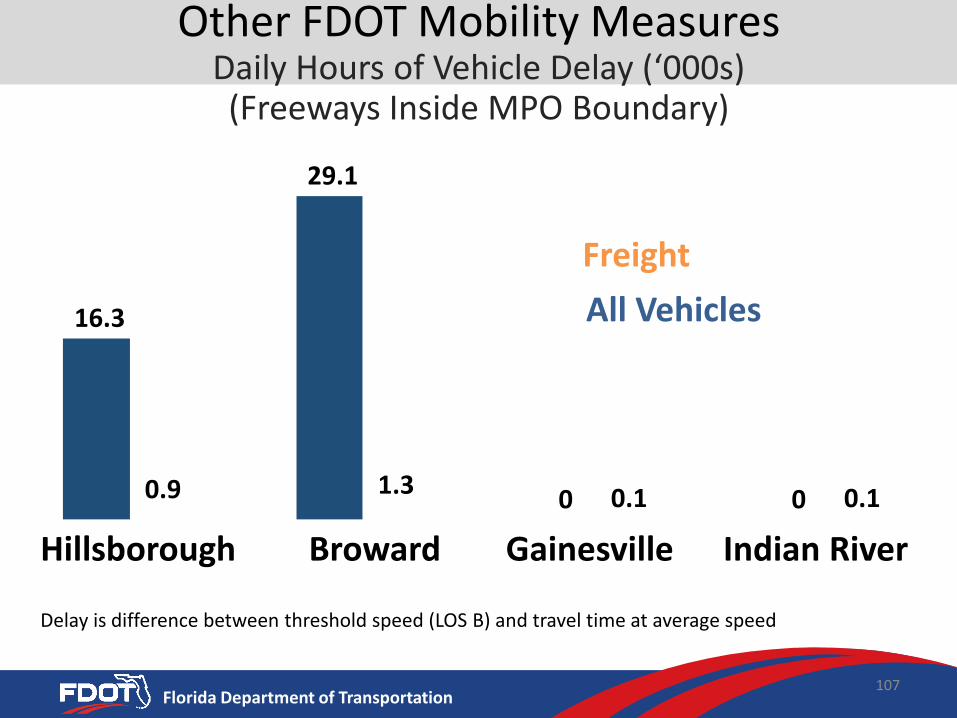
Florida Department of Transportation
Other FDOT Mobility MeasuresDaily Hours of Vehicle Delay (‘000s)(Freeways Inside MPO Boundary)
Delay is difference between threshold speed (LOS B) and travel time at average speed
Broward GainesvilleHillsborough Indian River
16.3
29.1
0 00.9 1.3 0.1 0.1
Freight
All Vehicles
107

Florida Department of
TRANSPORTATION
MPO Pilot PerspectivesBroward
HillsboroughGainesville
Indian River
108