florida’s iv-e waiver mary i. armstrong, ph.d. cathy sowell, l.c.s.w. svetlana yampolskaya, ph.d...
TRANSCRIPT
EVALUATION FINDINGS:FIVE YEARS POST-IMPLEMENTATION
Florida’s IV-E Waiver
Mary I. Armstrong, Ph.D.Cathy Sowell, L.C.S.W.
Svetlana Yampolskaya, Ph.D
September 6, 2012
TITLE IV-E WAIVER - OVERVIEW
Authorized by the Administration for Children and Families (ACF)
and implemented statewide in October, 2006
Allowed the use of federal foster care funds for a wide variety of
child welfare purposes rather than being restricted to out-of-home
care, as is normally the case under Title IV-E of the Social Security
Act
Permitted funds to be used for a broader array of child welfare
services and supports to improve permanency and safety outcomes
for all children who enter the child welfare system with an allegation
of maltreatment

EVALUATION DESIGN Hypothesis 1: Over the life of the demonstration project, fewer children will need to
enter out-of-home care
Hypothesis 2: Over the life of the demonstration project, there will be improvements
in child outcomes, including child permanency, safety, and well-being
Hypothesis 3: Waiver implementation will lead to changes in or expansion of the
existing child welfare service array for many, if not all, of the lead agencies.
Consistent with the Community-Based Care (CBC) model, the new flexibility of funds
will be used differently by each lead agency, based on the unique needs of the
communities they serve
Hypothesis 4: Expenditures associated with out-of-home care will decrease
following Waiver implementation, while expenditures associated with prevention and
in-home services will increase, although no new dollars will be spent as a result of
Waiver implementation
EVALUATION DESIGN
Analysis Components
Programmatic Outcomes Analysis: Examined the effect of IV-E Waiver
implementation on lead agency performance and outcomes for children, based
on administrative data analysis. Florida Safe Families Network (FSFN) was used
as the primary source of data, in addition to data reports produced by DCF.
Family Assessment and Services Analysis: Examined the process used by
CBC organizations to assess family needs in order to plan for/provide appropriate
services and understand the extent to which families are involved and satisfied
with the services received. Data were collected via focus groups, interviews, DCF
Regional Quality Assurance reviews, and the National Data Archive on Child
Abuse and Neglect.
EVALUATION DESIGNAnalysis Components
Child Welfare Practice Analysis: Assessed changes in CBC lead agency
practices since Waiver implementation. Specifically, strategies were identified that
were intended to: prevent child abuse, neglect, and out-of-home placement, engage
families in service planning/provision, increase permanency, and reduce lengths of
stay in out-of-home care. Primary data sources included a lead agency survey,
interviews, focus groups, and supplementary materials.
Cost Analysis: Examined the relationship between Waiver implementation and
changes in the use of child welfare funding sources. Expenditure data were
provided by the DCF Office of Revenue Management and lead agencies, and
qualitative data regarding changes in the use of child welfare funding sources were
collected via interviews with relevant stakeholders.
EVALUATION DESIGN
Analysis Components
Implementation Analysis: Examined and tracked the
implementation process and assessed the system-level impact of
the Waiver on the state’s child welfare system, including CBC lead
agencies, provider networks, child protection units, local
communities, judges, and DCF. Data were collected via interviews,
document reviews, and focus groups.

FINDINGS
Contextual and Organizational Factors Affecting Waiver Implementation
Facilitators
Philosophy of Care
Organizational Efficiencies
Communication and Collaboration
Community Perception and Involvement

Contextual and Organizational Factors Affecting Waiver Implementation
Challenges
Pace of Implementation
Education Needs
Recruitment and Retention of Case Managers
Fiscal Challenges
Contextual Challenges

Hypothesis 1
Number of Children Living in and Entering Out-of-Home Care Nationally by Federal Fiscal Year
Data sources: USDHHS, 2006, 2008, 2009a, 2009b, 2010, 2011.
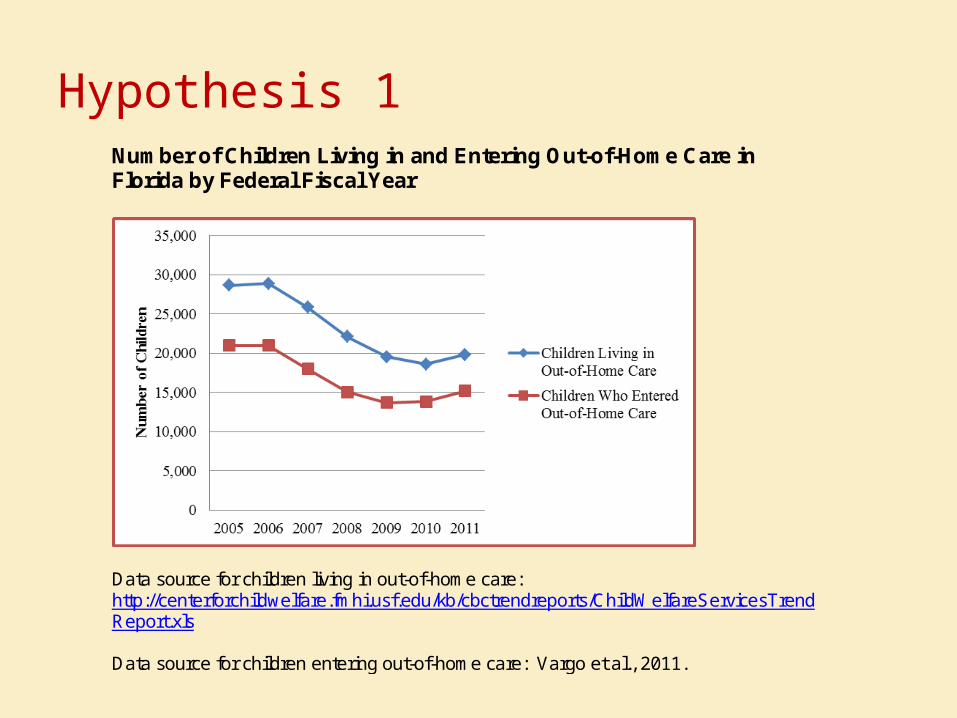
Hypothesis 1Number of Children Living in and Entering Out-of-Home Care in Florida by Federal Fiscal Year
Data source for children living in out-of-home care: http://centerforchildwelfare.fmhi.usf.edu/kb/cbctrendreports/ChildWelfareServicesTrendReport.xls Data source for children entering out-of-home care: Vargo et al., 2011.
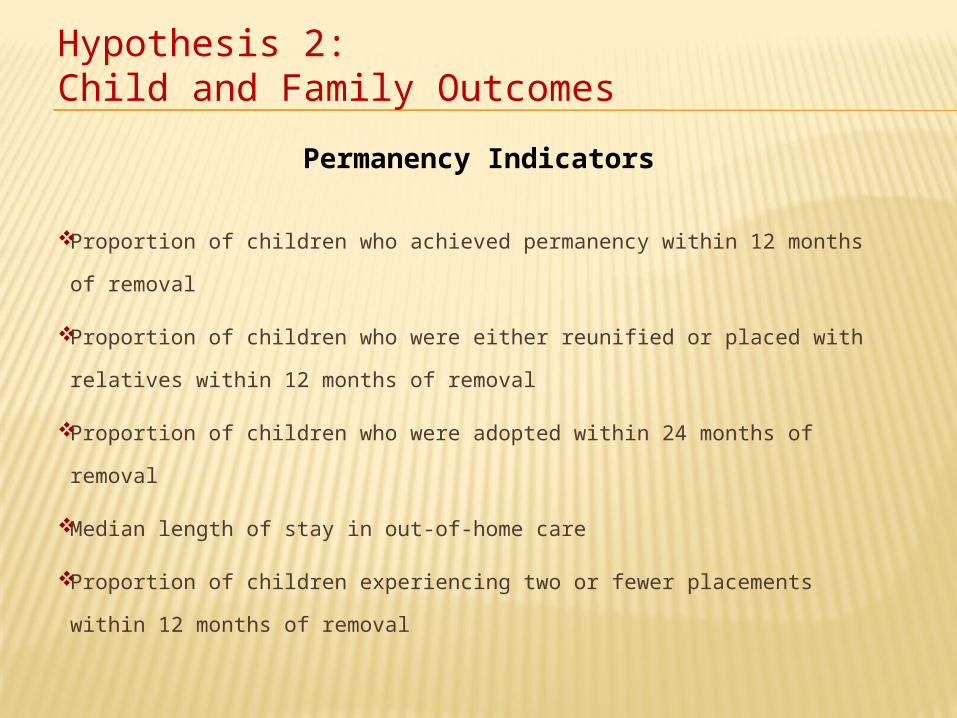
Hypothesis 2: Child and Family Outcomes
Permanency Indicators
Proportion of children who achieved permanency within 12 months of
removal
Proportion of children who were either reunified or placed with relatives
within 12 months of removal
Proportion of children who were adopted within 24 months of removal
Median length of stay in out-of-home care
Proportion of children experiencing two or fewer placements within 12
months of removal

FFY 04-05 FFY 05-06 FFY 06-07 FFY 07-08 FFY 08-09 FFY 09-1010
20
30
40
50
60
70
50.6 51.953.9 53.3 53.9
51.8
Pro
po
rtio
n o
f ch
ildre
n a
chie
vin
g p
erm
anen
cy
Waiver Implementation
Hypothesis 2 Proportion of children exiting OOH care who achievedpermanency within 12 months of removal
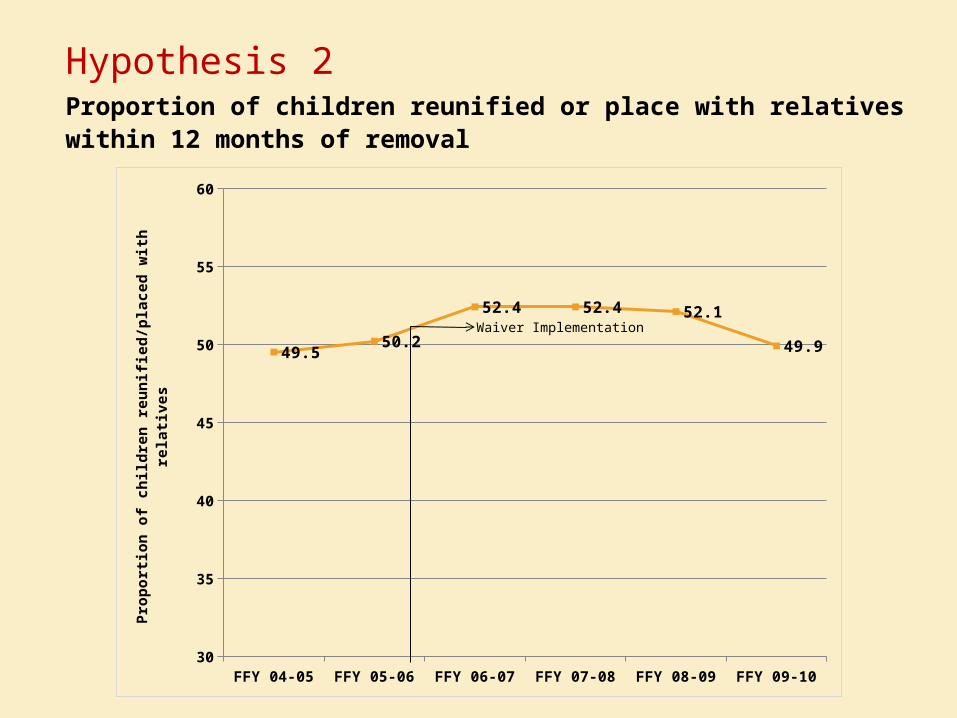
Hypothesis 2 Proportion of children reunified or place with relativeswithin 12 months of removal
FFY 04-05 FFY 05-06 FFY 06-07 FFY 07-08 FFY 08-09 FFY 09-1030
35
40
45
50
55
60
49.550.2
52.4 52.4 52.1
49.9
Pro
po
rtio
n o
f ch
ildre
n r
eun
ifie
d/p
lace
d w
ith
rel
ativ
es
Waiver Implementation

Hypothesis 2 Proportion of children with adoption finalized within 24months of removal
FFY 04-05 FFY 05-06 FFY 06-07 FFY 07-08 FFY 08-090
2
4
6
8
10
12
14
5.1
6.7
8.3
10.2
11.7
Pro
po
rtio
n o
f ch
ildre
n a
do
pte
d
Waiver Implementation

Hypothesis 2 Median length of stay for children who entered OOHcare and exited for any reason
FFY 04-05 FFY 05-06 FFY 06-07 FFY 07-08 FFY 08-09 FFY 09-100
2
4
6
8
10
12
14
16
18
11.4 11.211.1
10.911
11.4
Med
ian
len
gth
of
stay
(in
mo
nth
s)
Waiver Implementation
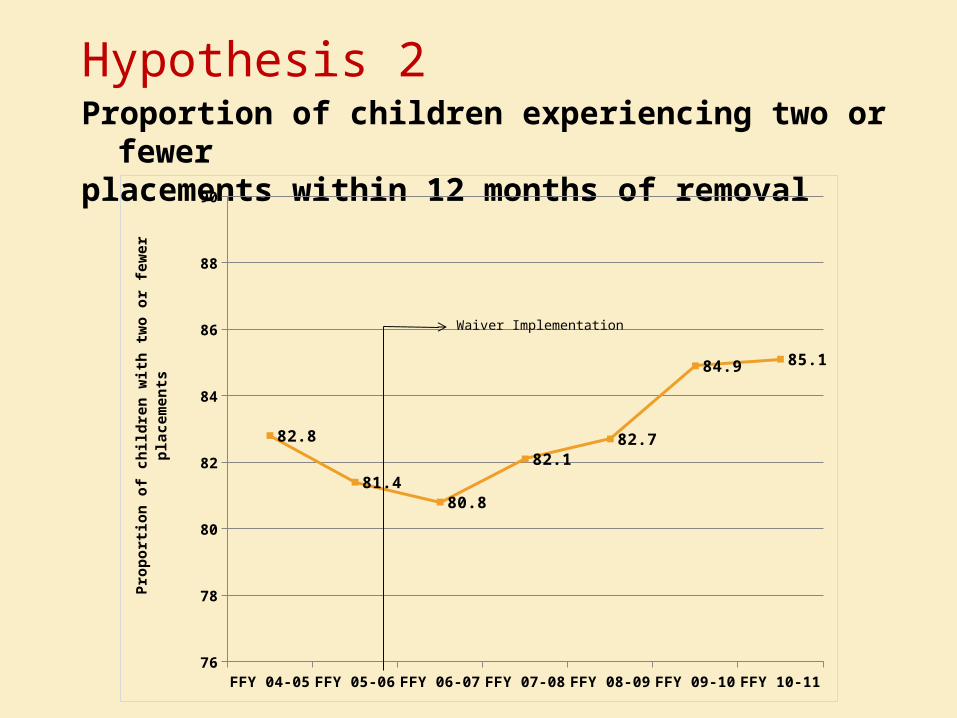
Hypothesis 2 Proportion of children experiencing two or fewerplacements within 12 months of removal
FFY 04-05 FFY 05-06 FFY 06-07 FFY 07-08 FFY 08-09 FFY 09-10 FFY 10-1176
78
80
82
84
86
88
90
82.8
81.480.8
82.182.7
84.9 85.1
Pro
po
rtio
n o
f ch
ildre
n w
ith
tw
o o
r fe
wer
pla
cem
ents
Waiver Implementation

Hypothesis 2
Strategies used to promote permanency
Supports for relative caregivers
Efforts to increase timely adoptions
Changes in practice when children are placed in shelter
Concurrent changes in the judicial system
Hypothesis 2
Stakeholder perspectives on strategies for placement stability
Timely and appropriate assessment of children and matching to services
Foster home recruitment
Retention and capacity
Identifying and supporting relative placements
Providing behavioral support training to all placement types
Targeted review committees

Hypothesis 2
Safety Indicators
Proportion of children who exited out-of-home care and re-entered within
12 months
Proportion of children with recurrence of maltreatment within six months
of service termination
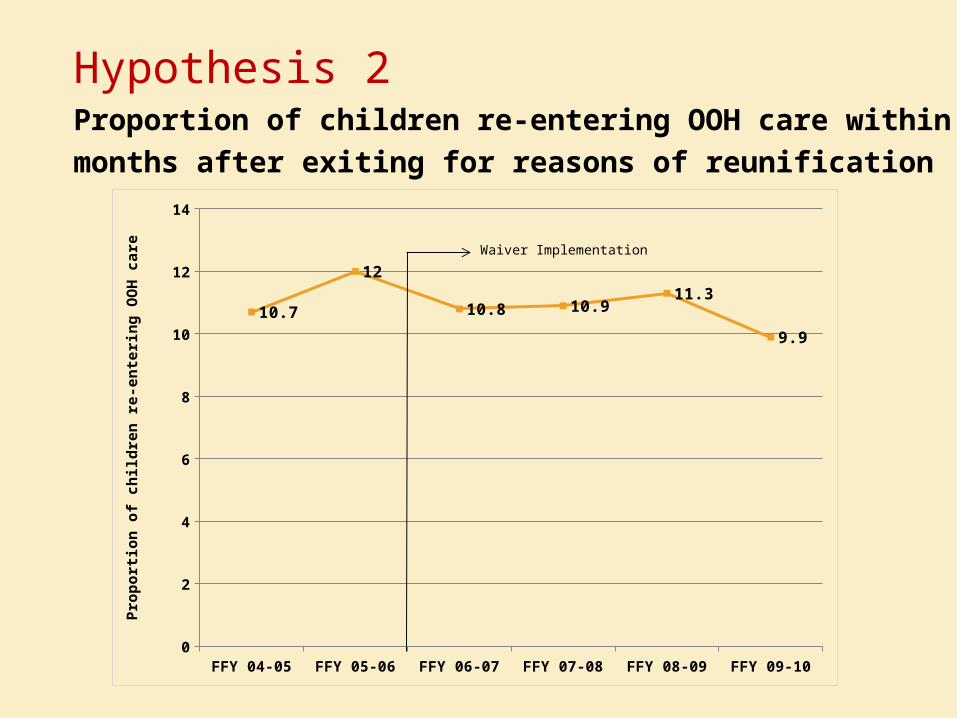
Hypothesis 2 Proportion of children re-entering OOH care within 12
months after exiting for reasons of reunification
FFY 04-05 FFY 05-06 FFY 06-07 FFY 07-08 FFY 08-09 FFY 09-100
2
4
6
8
10
12
14
10.7
12
10.8 10.911.3
9.9
Pro
po
rtio
n o
f ch
ildre
n r
e-en
teri
ng
OO
H c
are
Waiver Implementation

Hypothesis 2 Proportion of children who were maltreated with sixmonths after service termination
FFY 04-05 FFY 05-06 FFY 06-07 FFY 07-08 FFY 08-09 FFY 09-100
1
2
3
4
5
6
7
8
9
10
4.44
3.7
3.13.5 3.6
Ave
rag
e p
rop
ort
ion
of
child
ren
mal
trea
ted
Waiver Implementation

Hypothesis 2
Stakeholder perspectives on re-entry into OOH care
Lack of agreement about reunification decisions between legal
services, the judiciary, Guardians ad Litem, parents, and the lead
agency
Need for supportive services for guardians – continuum of care
Need plan for alternative placements at time of reunification
Treatment services and community supports need to be in place before
and after reunification
Hypothesis 2
Family Assessment and Services Analysis
Data Source
Florida DCF case management quality of practice reviews
(QP)
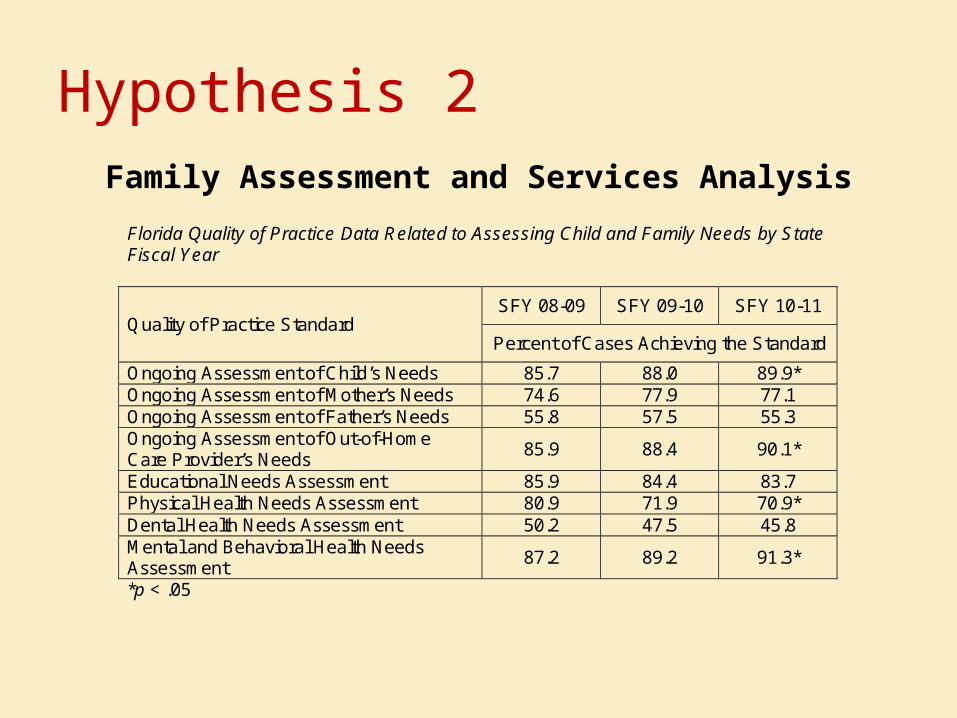
Hypothesis 2Family Assessment and Services Analysis
Florida Quality of Practice Data Related to Assessing Child and Family Needs by State Fiscal Year
Quality of Practice Standard SFY 08-09 SFY 09-10 SFY 10-11
Percent of Cases Achieving the Standard
Ongoing Assessment of Child’s Needs 85.7 88.0 89.9* Ongoing Assessment of Mother’s Needs 74.6 77.9 77.1 Ongoing Assessment of Father’s Needs 55.8 57.5 55.3 Ongoing Assessment of Out-of-Home Care Provider’s Needs
85.9 88.4 90.1*
Educational Needs Assessment 85.9 84.4 83.7 Physical Health Needs Assessment 80.9 71.9 70.9* Dental Health Needs Assessment 50.2 47.5 45.8 Mental and Behavioral Health Needs Assessment
87.2 89.2 91.3*
*p < .05

Hypothesis 2Family Assessment and Services Analysis
Florida Quality of Practice Data Related to Family Engagement by State Fiscal Year
Quality of Practice Standard Number SFY 08-09 SFY 09-10 SFY 10-11
Percent of Cases Achieving the Standard
Case Manager Visits – Frequency – Child 49.7 70.2 66.9* Case Manager Visits – Quality – Child 59.7 70.4 73.5* Case Manager Visits – Frequency – Mother
31.2 47.3 44.8*
Case Manager Visits – Frequency – Father
20.7 32.6 31.0*
Case Manager Visits – Quality – Mother 56.6 72.3 73.2* Case Manager Visits – Quality – Father 44.6 58.6 62.7* Mother’s Participation in Decision Making 49.3 53.8 58.9* Father’s Participation in Decision Making 38.6 39.5 40.0 Family Involvement in Case Planning Process
63.4 69.1 74.9*
Engaging Child’s Mother in Services 68.2 72.7 76.6* Engaging Child’s Father in Services 52.9 58.2 59.8* * p < .05
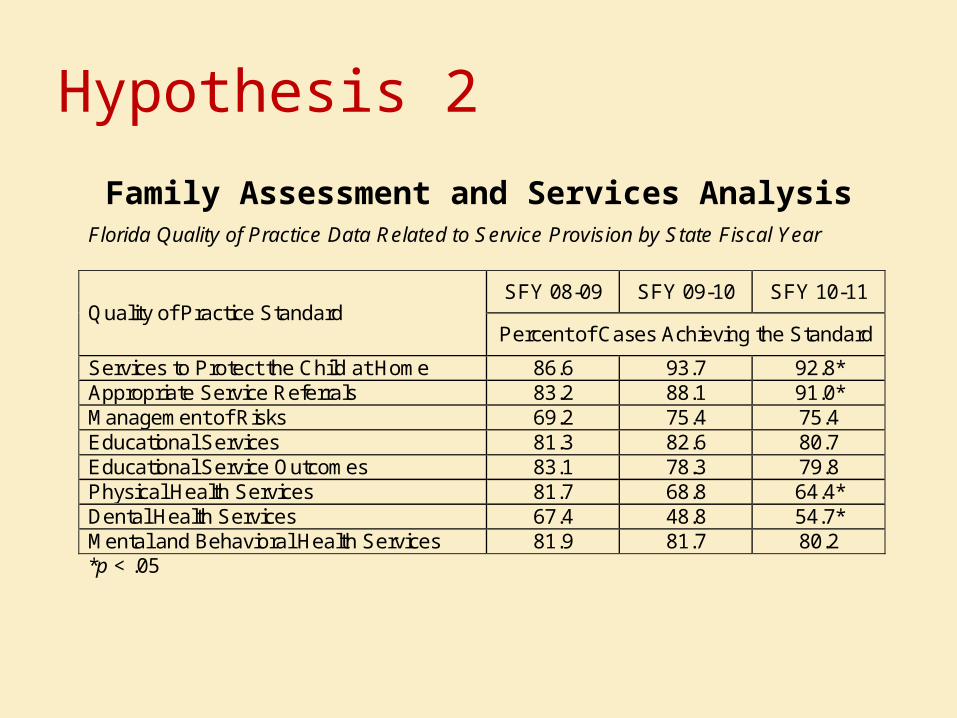
Hypothesis 2
Family Assessment and Services AnalysisFlorida Quality of Practice Data Related to Service Provision by State Fiscal Year
Quality of Practice Standard SFY 08-09 SFY 09-10 SFY 10-11
Percent of Cases Achieving the Standard
Services to Protect the Child at Home 86.6 93.7 92.8* Appropriate Service Referrals 83.2 88.1 91.0* Management of Risks 69.2 75.4 75.4 Educational Services 81.3 82.6 80.7 Educational Service Outcomes 83.1 78.3 79.8 Physical Health Services 81.7 68.8 64.4* Dental Health Services 67.4 48.8 54.7* Mental and Behavioral Health Services 81.9 81.7 80.2 *p < .05
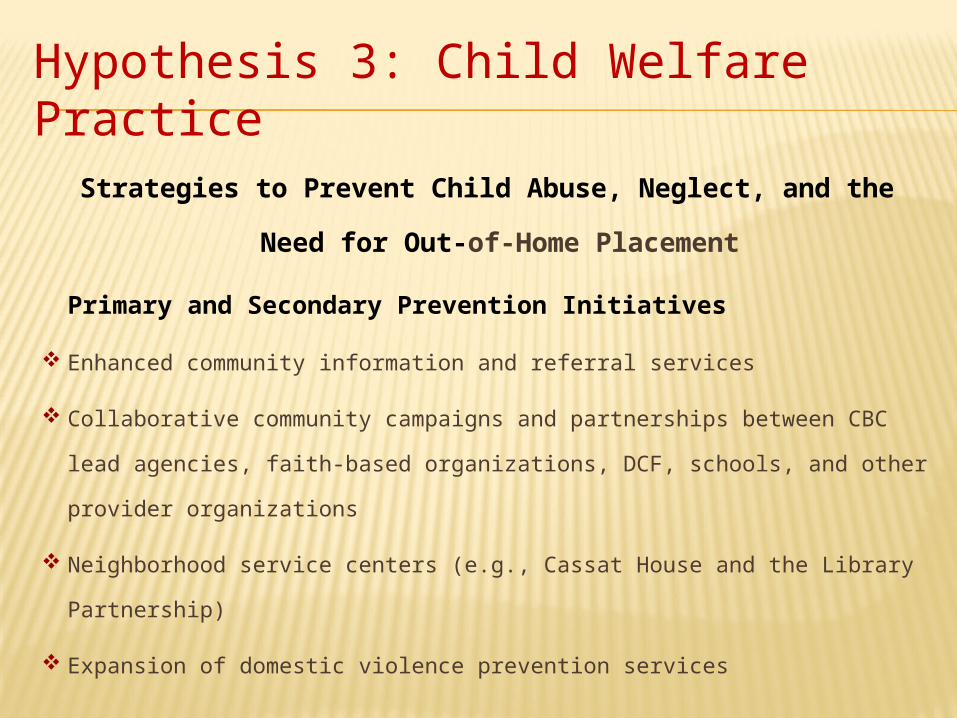
Hypothesis 3: Child Welfare Practice
Strategies to Prevent Child Abuse, Neglect, and the Need for
Out-of-Home Placement
Primary and Secondary Prevention Initiatives
Enhanced community information and referral services
Collaborative community campaigns and partnerships between CBC lead
agencies, faith-based organizations, DCF, schools, and other provider
organizations
Neighborhood service centers (e.g., Cassat House and the Library Partnership)
Expansion of domestic violence prevention services

Hypothesis 3
Strategies to Prevent Child Abuse, Neglect, and the Need
for Out-of-Home Placement
Tertiary Prevention Strategies
Increased use of strategies to connect families with resources and supports at
the initial stage of contact with the child protection/welfare system
Intensive in-home family preservation services
Increased capacity of in-home parent education and intervention programs (e.g.,
Nurturing Parent Program, Parenting with Love and Limits)
Increased use of flex funds to purchase items or services such as beds, utility
payments or rent assistance

Hypothesis 3
Strategies to Engage Families in Service Planning
Increased availability of family team conferencing or family group
decision making
Increased availability of services and practices to engage and support
relative and non-relative caregivers
Implementation of family-centered practice model
Reduction in caseload size
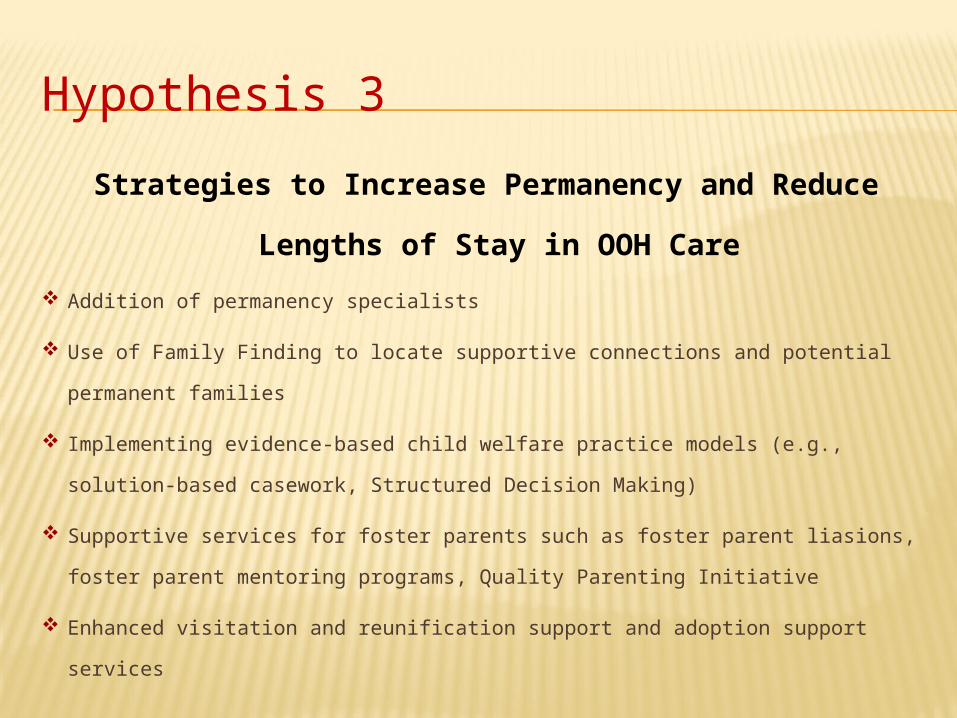
Hypothesis 3
Strategies to Increase Permanency and Reduce
Lengths of Stay in OOH Care
Addition of permanency specialists
Use of Family Finding to locate supportive connections and potential permanent
families
Implementing evidence-based child welfare practice models (e.g., solution-based
casework, Structured Decision Making)
Supportive services for foster parents such as foster parent liasions, foster parent
mentoring programs, Quality Parenting Initiative
Enhanced visitation and reunification support and adoption support services

Hypothesis 3
Strategies to Improve Child and Family Well-Being
Educational liaisons/specialists
Nurse liaisons/specialists
Increased capacity of medical foster care
Increased availability of behavior analysts and behavior management
services

Hypothesis 4: Cost Analysis
Assessment of Fiscal Effectiveness
Extent to which CBC lead agencies invested a larger proportion of child
welfare services funds on front-end services
How key funding sources were used
Reduction in IV-E administrative costs
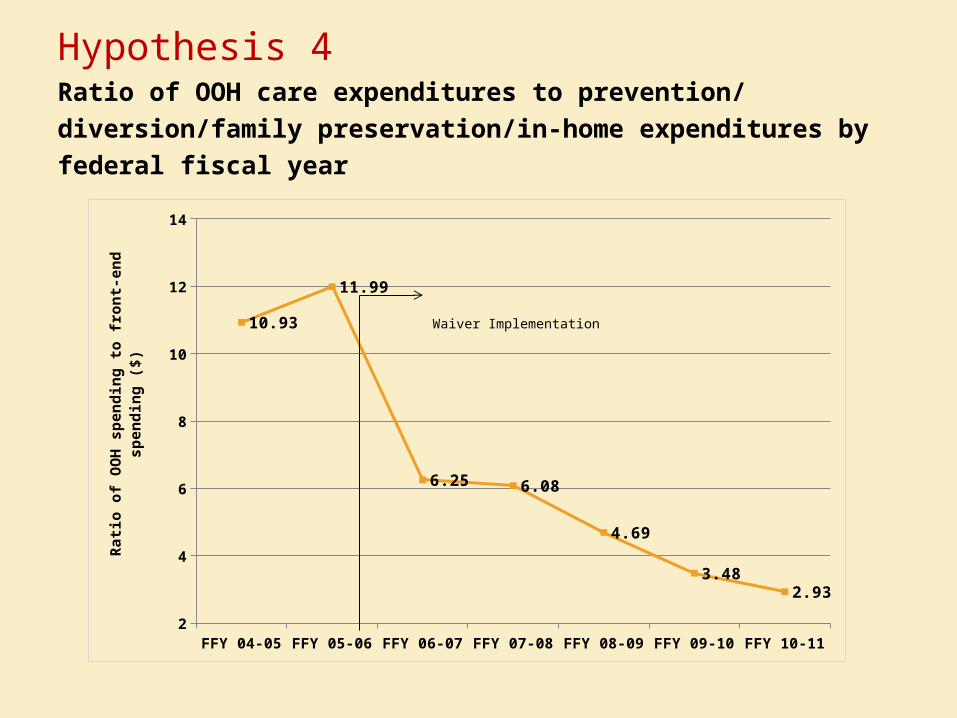
Hypothesis 4 Ratio of OOH care expenditures to prevention/ diversion/family
preservation/in-home expenditures by federal fiscal year
FFY 04-05 FFY 05-06 FFY 06-07 FFY 07-08 FFY 08-09 FFY 09-10 FFY 10-112
4
6
8
10
12
14
10.93
11.99
6.25 6.08
4.69
3.482.93R
atio
of
OO
H s
pen
din
g t
o f
ron
t-en
d s
pen
din
g (
$)
Waiver Implementation

Hypothesis 4 Child welfare expenditures by federal fiscal year by type of service (in
million $)
Type of Service
FFY04-05
FFY05-06
FFY06-07
FFY07-08
FFY08-09
FFY09-10
FFY10-11
FFY 10-11 minus
FFY 04-05
% Change
Licensed out-of-home care
163.4 194.4 184.0 167.5 144.9 134.1 133.7 -29.7 -18.2
Dependency case management
312.4 384.7 315.1 325.6 311.5 310.8 310.5 -1.9 -0.6
Front-end services
15.0 16.2 29.4 27.6 30.9 38.6 45.7 30.7 205.4
Other124.7 122.5
78.8 88.5 102.0 121.1 121.0 -3.7 -3.0
Total615.5 717.8
607.3 609.1 589.4 604.7 610.9 -4.6 -0.7
NOTE: Some totals and differences may be off by one decimal place due to rounding.

Hypothesis 4
Changes in Spending by Fund Source
Allowed Florida’s child welfare system to access 100% of the federally-
appropriated IV-E funds each year since Waiver implementation
The more flexible use of IV-E funds enabled a much greater use of State funds
for front-end services.
The largest increase in categorical spending of State funds during the Waiver
period occurred with non-Temporary Assistance to Needy Families (TANF) funds
for prevention, intervention, and in-home supports.
Spending increased from $27.6 million in FFY 04-05 to $68.9 million in SFY 11-12.

Hypothesis 4
Fiscal Issues Pertinent to Waiver Implementation
Funding flexibility
Funding challenges
Shifting resources from OOH care
Directing resources toward creative prevention strategies
Recommendations
Pursue renewal of the IV-E Waiver. The financial flexibility afforded by the Waiver
has enabled CBC lead agencies to increase spending for prevention, diversion,
family preservation, and other in-home services that are viable substitutes for
out-of-home care for many children and families
With renewal of the IV-E Waiver, flexible funds should be used to improve
permanency and safety outcomes for children with physical and emotional
problems
CBC lead agencies should continue their efforts to address safety issues and to
prevent re-entry into out-of-home care

Recommendations Improvement is needed in the areas of the ongoing assessment of fathers’
needs, the frequency of case manager visits, assessing children’s dental
health needs, supporting parents’ participation in case planning, and
providing physical and dental health services to children
Provide guidance to CBC lead agencies to ensure administrative costs are
reported in a consistent manner
The legislature, DCF, CBC lead agencies, and community providers should
devise a strategy to facilitate more even distribution of services and
supports available to children and families involved in the child welfare
system to ensure adequate access across all individuals, especially in rural
areas
Contact Information
Mary Armstrong: [email protected] Cathy Sowell: [email protected] Svetlana Yampolskaya: [email protected]
Evaluation reports, briefs, and topical papers:
Florida's Center for Child Welfare
http://centerforchildwelfare.fmhi.usf.edu/DataReports/IVEReport.shtml