florida's ocean and coastal economies report phase 2
TRANSCRIPT

8/9/2019 Florida's Ocean and Coastal Economies Report Phase 2
http://slidepdf.com/reader/full/floridas-ocean-and-coastal-economies-report-phase-2 1/219
Phase IIFlorida’s Ocean and Coastal
Economies ReportJudith Kildow, Principal InvestigatorMonterey Bay Aquarium Research Institute
June 2008

8/9/2019 Florida's Ocean and Coastal Economies Report Phase 2
http://slidepdf.com/reader/full/floridas-ocean-and-coastal-economies-report-phase-2 2/219
Acknowledgments The National Ocean Economics Program research team prepared this report incollaboration with the following people named below along with their contributions tothis work. Judith Kildow was Principal Investigator and led the team. Charles Colgan,
University of Maine, provided oversight for the Ocean Economy sectors: Real Estate,Cruise Industry, Fishing Industry and Transportation. Linwood Pendleton, Fellow at theOcean Foundation, provided oversight for the Coastal Recreation chapters. Othermembers of the NOEP research team who contributed to many of the chapters andpreparation of the report included Bonnie Lockwood, Pat Johnston, Scott Norris, KirstinCsik, Nick Rome, Elizabeth Rogers, Bethany Taylor, and Nat Miller.
Research teams at Florida Atlantic University were led by Principal Investigator LenoreAlpert from the Center for Urban and Environmental Solutions at Florida AtlanticUniversity; William B. Stronge, Professor Emeritus and Senior Fellow; M.J. Matthews,Senior Research Associate; and Angela Grooms, Research Associate; who were
responsible for the following chapters: 1) The Cruise Industry, 2) Real Estate, 3) TouristReal Estate, and 4) Coastal Recreation. Other research assistants who contributed to thesechapters were Lauren Schild, Marc Miller, Ian Singer, and Jose Mena.
The research team at the University of Florida, Gainesville, responsible for information inthe Fisheries Industry chapter included Charles Adams, Principal Investigator andChristopher de Bodisco, post-doctoral assistant.

8/9/2019 Florida's Ocean and Coastal Economies Report Phase 2
http://slidepdf.com/reader/full/floridas-ocean-and-coastal-economies-report-phase-2 3/219

8/9/2019 Florida's Ocean and Coastal Economies Report Phase 2
http://slidepdf.com/reader/full/floridas-ocean-and-coastal-economies-report-phase-2 4/219

8/9/2019 Florida's Ocean and Coastal Economies Report Phase 2
http://slidepdf.com/reader/full/floridas-ocean-and-coastal-economies-report-phase-2 5/219
Florida’s Ocean and Coastal Economies
Phase II
Table of Contents
Part I — Introduction and Background...........................................................................................................1
Chapter 1 Context for the Study..........................................................................................................1
Chapter 2 Glossary of Terms and Definitions....................................................................................3
Part II — Executive Summary and Update.....................................................................................................7
Chapter 3 Executive Summary ............................................................................................................7
Chapter 4 Updates from Phase I Report .............................................................................................9 4.1 Florida Coastal Economy 2006.......... ........... ........... .......... ........... ........... .......... ........... ........ 10 4.2 Coastal Economy Growth 2003-2006.......... ........... .......... ........... ........... .......... ........... ......... 11 4.3 Economic Growth at the County Level 2003-2006...............................................................11 4.4 Population and Housing ........................................................................................................16 4.5 Conclusion ............................................................................................................................23
Part III — Ocean Economy: Sector Supplements.........................................................................................25
Chapter 5 Fishing Industry ...............................................................................................................26 5.1 Fishing Industry Overview....................................................................................................26 Commercial Fisheries..........................................................................................................................27 5.3 Recreational Fisheries ...........................................................................................................35 5.4 Imports and Exports ..............................................................................................................39 5.5 Seafood Processors and Wholesalers ........... .......... ........... .......... ........... .......... ........... .......... 42 5.6 Commercial and Pleasure Water Vessel Registrations .......... ........... ........... ........... ........... ...44 5.7 Conclusion ............................................................................................................................45
Chapter 6 Marine Transportation including Ports ...........................................................................46 6.1 Introduction..........................................................................................................................46 6.2 National and State Comparisons..........................................................................................47 6.3 Conclusion ...........................................................................................................................56
Chapter 7 Marine Construction – Beach Nourishment.....................................................................58 7.1 Dredging Operations.............................................................................................................58 7.2 Beach Nourishment...............................................................................................................60 7.3 Conclusion ............................................................................................................................70
Chapter 8 Coastal Tourism and Recreation – The Cruise Industry ..................................................72 8.1 Introduction to Florida’s Cruise Industry..............................................................................72 8.2 Overview of Florida’s Cruise Economy.......... .......... ........... ........... .......... ........... .......... .......72
8.3 National Comparisons of the Cruise Tourism Industry................... ........... .......... ........... ......74 8.4 State Economic Impacts of the Cruise Industry ......... ........... .......... ........... .......... ........... ......75 8.5 Analysis of Individual Florida Cruise Ports ........... ........... .......... ........... ........... .......... .......... 78 8.6 Conclusion ............................................................................................................................81
Chapter 9 Coastal Real Estate ..........................................................................................................82 9.1 Coastal Real Estate Values....................................................................................................82 9.2 Tourist-Oriented Coastal Property in Florida......................................................................116 9.3 Seasonal Housing................................................................................................................127
i

8/9/2019 Florida's Ocean and Coastal Economies Report Phase 2
http://slidepdf.com/reader/full/floridas-ocean-and-coastal-economies-report-phase-2 6/219
9.4 Conclusion ..........................................................................................................................136
Chapter 10 Marine Research and Education....................................................................................137 10.1 Introduction.........................................................................................................................137 10.2 Marine Institutions Survey Results ........... .......... ........... ........... ........... ........... .......... .......... 137 Conclusion.........................................................................................................................................143
Part IV Coastal Recreation Activities and Assets ........... .......... ........... ........... ........... ........... ......144 Chapter 11 Introduction and Overview............................................................................................144
11.1 Non-Market Values.............................................................................................................144 11.2 Organization of this Report............ .......... ........... ........... ........... ........... .......... ........... .......... 145 11.3 Impacts of the 2004 and 2005 Hurricane Seasons in Florida.......... ........... ........... ........... ...148 11.4 Coastal Recreation in Florida............... ........... .......... ........... ........... ........... .......... ........... ....149
Chapter 12 Park Visitation and Attendance.....................................................................................156 12.1 Introduction.........................................................................................................................156 12.2 Florida’s State Parks ...........................................................................................................158 12.3 State and National Park Attendance................ ........... ........... .......... ........... ........... .......... ....161 12.4 Recreational Reef Use.........................................................................................................164 12.5 Data Gaps in Coastal Park Visitation............. .......... ........... ........... .......... ........... ........... .....166
Chapter 13 Recreational Boating in Florida................................................................................168 13.1 Introduction.........................................................................................................................168 13.2 Boating within Florida’s Park System .......... ........... ........... .......... ........... ........... .......... ......169 13.3 Boating Activity..................................................................................................................170 13.4 Boating and Recreational Reef Use ....................................................................................172 13.5 Data Gaps............................................................................................................................173
Chapter 14 Recreational Fishing in Florida.....................................................................................174 14.1 Introduction.........................................................................................................................174 14.2 Fishing and Recreational Reef Use by Anglers.......... ........... ........... .......... ........... ........... ...177 14.3 Data Gaps............................................................................................................................178
Chapter 15 Scuba Diving and Snorkeling in Florida........................................................................179 15.1 Introduction.........................................................................................................................179
15.2 Recreational Reef Use............... .......... ........... .......... ........... .......... ........... .......... ........... ......179 15.3 Data Gaps............................................................................................................................181
Chapter 16 Beach Activities in Florida.............................................................................................182 16.1 Introduction.........................................................................................................................182 16.2 Beach Regions.....................................................................................................................182 16.3 Beach Attendance ...............................................................................................................184 16.4 State Beach Parks................................................................................................................186 16.5 Selected Studies of Florida Beaches ...................................................................................187 16.6 Surfing in Florida ................................................................................................................189 16.7 Data Gaps............................................................................................................................191
Chapter 17 Conclusion......................................................................................................................192
Part V References......................................................................................................................193
ii
8/9/2019 Florida's Ocean and Coastal Economies Report Phase 2
http://slidepdf.com/reader/full/floridas-ocean-and-coastal-economies-report-phase-2 7/219
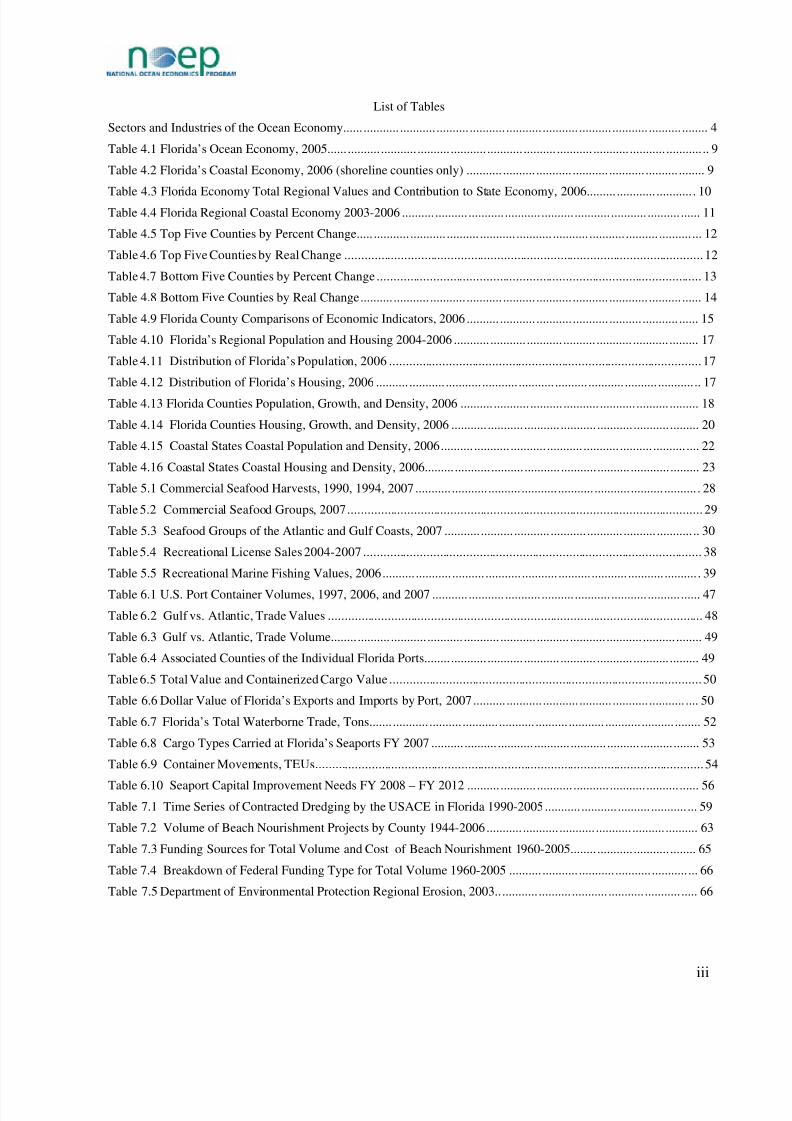
List of Tables
Sectors and Industries of the Ocean Economy................. ........... .......... ........... ........... ........... .......... ........... .......... ........ 4
Table 4.1 Florida’s Ocean Economy, 2005................ ........... .......... ........... ........... .......... ........... ........... ........... ........... .. 9
Table 4.2 Florida’s Coastal Economy, 2006 (shoreline counties only) ........... .......... ........... ........... ........... .......... ........ 9
Table 4.3 Florida Economy Total Regional Values and Contribution to State Economy, 2006......... ............ ........... . 10 Table 4.4 Florida Regional Coastal Economy 2003-2006 .......... .......... ........... ........... .......... ........... ........... .......... ...... 11
Table 4.5 Top Five Counties by Percent Change................ ........... .......... ........... ........... ........... ........... .......... .......... ... 12
Table 4.6 Top Five Counties by Real Change ............................................................................................................ 12
Table 4.7 Bottom Five Counties by Percent Change .................................................................................................. 13
Table 4.8 Bottom Five Counties by Real Change.......... ........... ........... ........... .......... ........... ........... ............ .......... ...... 14
Table 4.9 Florida County Comparisons of Economic Indicators, 2006 .......... ........... ........... ........... .......... ........... ...... 15
Table 4.10 Florida’s Regional Population and Housing 2004-2006 ........... ........... ........... .......... ........... ........... ......... 17
Table 4.11 Distribution of Florida’s Population, 2006 ..............................................................................................17
Table 4.12 Distribution of Florida’s Housing, 2006 .......... ........... ........... ........... ........... .......... ........... .......... ........... .. 17
Table 4.13 Florida Counties Population, Growth, and Density, 2006 .......... ........... .......... ........... ........... .......... ......... 18
Table 4.14 Florida Counties Housing, Growth, and Density, 2006 ........... ........... ........... ........... ........... ........... ......... 20
Table 4.15 Coastal States Coastal Population and Density, 2006.......... ........... ........... ........... ........... .......... .......... .... 22
Table 4.16 Coastal States Coastal Housing and Density, 2006......... ........... .......... ........... ........... .......... ............ ......... 23
Table 5.1 Commercial Seafood Harvests, 1990, 1994, 2007 ........... ........... .......... ........... ........... ........... .......... .......... . 28
Table 5.2 Commercial Seafood Groups, 2007........................................................................................................... 29
Table 5.3 Seafood Groups of the Atlantic and Gulf Coasts, 2007 ........... .......... ........... ........... ........... .......... ........... .. 30
Table 5.4 Recreational License Sales 2004-2007 ...................................................................................................... 38
Table 5.5 Recreational Marine Fishing Values, 2006.......... ........... .......... ........... ........... .......... ........... ........... .......... . 39
Table 6.1 U.S. Port Container Volumes, 1997, 2006, and 2007 ........... ........... ........... .......... ........... ........... .......... ...... 47
Table 6.2 Gulf vs. Atlantic, Trade Values ................................................................................................................. 48
Table 6.3 Gulf vs. Atlantic, Trade Volume.................. ........... ........... ........... ........... .......... ........... ........... .......... ........ 49
Table 6.4 Associated Counties of the Individual Florida Ports........ ........... ........... ........... ........... ........... ........... ......... 49
Table 6.5 Total Value and Containerized Cargo Value .............................................................................................. 50
Table 6.6 Dollar Value of Florida’s Exports and Imports by Port, 2007.......... ........... ........... .......... ........... ........... .... 50
Table 6.7 Florida’s Total Waterborne Trade, Tons.................. .......... ........... ........... .......... ........... ........... .......... ........ 52
Table 6.8 Cargo Types Carried at Florida’s Seaports FY 2007 .......... .......... ........... ........... ........... .......... .......... ........ 53
Table 6.9 Container Movements, TEUs..................................................................................................................... 54
Table 6.10 Seaport Capital Improvement Needs FY 2008 – FY 2012 .......... ........... ........... ........... ........... .......... ...... 56 Table 7.1 Time Series of Contracted Dredging by the USACE in Florida 1990-2005........... ........... .......... ........... ... 59
Table 7.2 Volume of Beach Nourishment Projects by County 1944-2006........... ........... ........... ........... .......... .......... 63
Table 7.3 Funding Sources for Total Volume and Cost of Beach Nourishment 1960-2005................... ........... ........ 65
Table 7.4 Breakdown of Federal Funding Type for Total Volume 1960-2005 .......... ........... ........... ........... ........... ... 66
Table 7.5 Department of Environmental Protection Regional Erosion, 2003............. .......... ........... ........... ........... ..... 66
iii

8/9/2019 Florida's Ocean and Coastal Economies Report Phase 2
http://slidepdf.com/reader/full/floridas-ocean-and-coastal-economies-report-phase-2 8/219
Table 7.6 Counties in Department of Environmental Protection Regions for Reference ........... .......... ........... .......... 67
Table 8.1 Florida Ocean Tourism & Recreation Industries - Excluding Cruise Line, 2004........... .......... ........... ...... 72
Table 8.2 Embarkations by Port 2004-2006 ..............................................................................................................74
Table 8.3 Florida's Share of U.S. Cruise Industry, 2006................. ........... ........... ........... .......... ........... .......... .......... . 75
Table 8.4 Total Economic Impacts of Cruise Purchasing on Business Sectors in Florida, 2006................. ........... .... 76
Table 8.5 Economic Impact of Cruise Industry on Direct Spending in Florida 2000-2006............... ........... ............ 77
Table 8.6 Economic Impact of Cruise Industry on Florida Spending 2000-2006................ ........... ........... .......... ..... 77
Table 8.7 Cruise Operations, Embarkations and Disembarkations FY 2005 – FY 2007............. ........... ........... ......... 80
Table 9.1 Seasonal Homes by State, 1990 and 2006 ............................................................................................... 128
Table 9.2 Percentage of Seasonal Homes, 1990 and 2006.................. .......... ........... .......... ........... ........... ........... ..... 129
Table 10.1 Florida Marine Economic Indicators ..................................................................................................... 138
Table 10.2 Major Marine and Coastal Research and Education Institutions in Florida, 2007................... ........... ... 140
Table 12.1 National Estuarine Research Reserves Attendance 2002 - 2007................ ........... .......... ........... ........... .. 163
Table 15.1 Expenditures for Scuba Diving and Snorkeling in Florida ......... ........... ........... .......... ........... ............ ..... 180
iv

8/9/2019 Florida's Ocean and Coastal Economies Report Phase 2
http://slidepdf.com/reader/full/floridas-ocean-and-coastal-economies-report-phase-2 9/219
List of Figures
Figure 5.1 Commercial Seafood Harvests 1990-2007 ................................................................................................28
Figure 5.2 Commercial Seafood Landings by Coast 1990-2007 .......... .......... ........... ........... ........... ........... ......... ...... 29
Figure 5.3 Commercial Seafood Groups 1990-2007 ................................................................................................. 29
Figure 5.4 Commercial Marine Ornamental Landed Values 1994-2007 .......... ........... ........... ........... ........... ........... .. 30 Figure 5.5 Ornamental Finfish and Invertebrate Harvests 1994-2007........... ........... ........... ........... ........... .......... ...... 31
Figure 5.6 Marine Ornamental Live Rock and Sand 1994-2007 ........... ........... ........... .......... ........... ........... .......... .... 32
Figure 5.7 Commercial Marine Fishing Licenses FY 1994-95 to FY2006-07 ........... ........... ........... .......... ........... .... 33
Figure 5.8 Commercial Fishing License Types FY 1994-95 to 2006-07............ ........... ........... ........... ........... .......... . 33
Figure 5.9 Aquaculture Operations, Workers, and Sales 1987-2005.......... ........... ........... ........... .......... ........... ......... 34
Figure 5.10 Aquaculture Product Sales 1987-2005 ................................................................................................... 35
Figure 5.11 Recreational Fish Landings 1990-2006 .................................................................................................. 36
Figure 5.12 Top Ten Recreation Fish 1990-2006 ....................................................................................................... 37
Figure 5.13 Saltwater Fishing Licenses Sold 2004-2007................ ........... .......... ........... ........... .......... ........... .......... . 37 Figure 5.14 Individual Recreational Fishing Licenses, Resident and Non-Resident 2004-2007 ............ ........... ........ 38
Figure 5.15 Annual Imports of Seafood 1990-2007 .................................................................................................. 39
Figure 5.16 Imports of Finfish and Shellfish 1990-2007 .......... ........... .......... ........... ........... ........... ........... .......... ...... 40
Figure 5.17 Seafood Exports 1990-2007 ................................................................................................................... 40
Figure 5.18 Exports of Finfish and Invertebrates 1990-2007 .......... ........... ........... .......... ........... ........... .......... .......... 41
Figure 5.19 Seafood Re-Exports 1990-2007.................. ........... .......... ........... ........... ........... ........... ......... .......... ........ 42
Figure 5.20 Re-Exports of Finfish and Invertebrates 1990-2007................ ........... ........... ........... ........... .......... ......... 42
Figure 5.21 Seafood Processing and Wholesale Plants 1990-2005 ........... ........... ........... ........... ........... ........... ......... 43
Figure 5.22 Seafood Processing and Wholesale Plants 1990-2007 ........... ........... ........... ........... ........... ........... ......... 43
Figure 5.23 Processed Seafood Weight and Value 1990-2005 ........... .......... ........... ........... .......... ........... ........... ....... 44
Figure 5.24 Total Commercial and Pleasure Registrations FY 1995-96 to FY 2006-07........... .......... ........... .......... . 44
Figure 5.25 Commercial Fish Landings vs. Seafood Imports.............. .......... ........... ........... ........... .......... ........... ...... 45
Figure 6.1 Map of Florida’s Seaports ....................................................................................................................... 46
Figure 6.2 Percentage Changes of Cargo Values and Volume 2005-2007 .......... ........... ........... ........... ........... ......... . 49
Figure 6.3 Distribution of Florida Seaports based on Total Value, FY 2006........... ........... .......... ........... .......... ........ 51
Figure 6.4 Distribution of Florida’s Seaports by Tons, FY 2007......... ........... ........... ........... .......... ........... .......... ...... 52
Figure 6.5 Florida Ports Import vs. Export Tonnage, FY 2007 .......... ........... .......... ........... ........... .......... .......... ........ 53
Figure 6.6 Percentages of Cargo Types at Florida Seaports, FY 2007 ........... .......... ........... ........... ........... .......... ...... 54
Figure 6.7 Container Movements FY 1996-FY 2006 ................................................................................................54
Figure 6.8 Distribution of Florida Seaports based on Container Movements, 2007 ........... .......... ........... ........... ....... 55
Figure 6.9 Distribution of Estimated Funding, FY 2008 ........................................................................................... 56
Figure 7.1 Time Series of Contracted Dredging by the USACE in Florida 1990-2005............... ........... ........... ........ 60
Figure 7.2 Top Ten Beach Nourishment States in the U.S. by Cost 1960-2007........... ........... ........... ........... .......... .. 61
v

8/9/2019 Florida's Ocean and Coastal Economies Report Phase 2
http://slidepdf.com/reader/full/floridas-ocean-and-coastal-economies-report-phase-2 10/219
Figure 7.3 Top Ten Beach Nourishment States in the U.S. by Volume 1960-2007 .......... ........... ........... ........... ....... 62
Figure 7.4 Cost and Volume of Beach Nourishment Projects in Florida 1960-2005................ ........... ........... ........... . 63
Figure 7.5 Funding Sources for Total Volume and Cost of Beach Nourishment 1960-2005 ........... ........... ........... .. 65
Figure 7.6 Main Sources of Funding for Beach Nourishment 1992-2002.......... ........... ........... ........... .......... ........... . 67
Figure 7.7 Regional Funding for Beach Nourishment Projects 1992-2002 .......... ........... ........... ........... .......... .......... 68
Figure 7.8 Map of Critical Erosion Areas in Florida .................................................................................................. 69
Figure 7.9 Map of the Florida State Coastal Construction Control Line .......... ........... .......... ........... ........... .......... .... 70
Figure 8.1 Map of Florida’s Cruise Ports........... ........... ........... .......... ........... ........... .......... ............ .......... .......... ........ 73
Figure 8.2 Embarkations by Port 2004-2006..............................................................................................................74
Figure 8.3 Florida's Percentage Share of U.S. Cruise Industry, 2006.......... ........... ........... ........... ........... .......... ......... 75
Figure 8.4 Employment, Income, and Direct Spending: Florida Cruise Industry 2000-2006.......... ........... ........... ..... 77
Figure 8.5 Total Global Embarkations 1990-2006.......... ........... ........... ........... ........... .......... ........... ........... .......... ...... 78
Figure 8.6 Percent of Global Cruise Embarkations, 2006.................. ........... ........... .......... ........... ........... .......... ........ 78
Figure 8.7 Total Embarkations from Florida Ports 1990-2006 ........... ........... .......... ........... ........... ........... .......... ....... 79
Figure 8.8 Percentage Share of Florida Cruise Embarkations by Port 1990-2006........... ........... .......... ........... .......... 79
Figure 8.9 Percentage Growth in Cruising at Florida Ports 2001-2006.......... .......... ........... ........... ........... .......... ...... 80
Figure 8.10 Embarkations and Disembarkations from Florida Ports by Length of Cruise.......... ........... ........... ......... 81
Figure 9.1 Number of Florida Coastal Properties by Land Use.......... .......... ........... ........... .......... ........... .......... ........ 84
Figure 9.2 Value of Florida Coastal Properties by Land Use .................................................................................... 84
Figure 9.3 Value of Florida Coastal Residential Properties, 2007 ........... ........... ........... ........... .......... .......... ........... .. 85
Figure 9.4 Average Value of Florida Coastal Residential Properties, 2007........... .......... ........... ........... ........... ......... 85
Figure 9.5 Value of Florida Coastal Commercial Properties, 2007 ........... ........... ........... .......... ........... .......... .......... . 86
Figure 9.6 Growth in the Number of Florida Coastal Properties 2002-2007.......... ........... ........... ........... ........... ....... 86
Figure 9.7 Growth in the Value of Florida Coastal Properties 2002-2007............ ........... ........... ........... .......... .......... 87 Figure 9.8 Growth in the Average Value of Florida Coastal Properties 2002-2007 ........... ........... ........... ........... ...... 87
Figure 9.9 Florida Comprehensive Recreation Planning Regions ........... .......... ........... .......... ........... ........... ........... .. 89
Figure 9.10 Distribution of the Number of Coastal Properties by Coastal Region, 2007........... ........... ........... ......... 90
Figure 9.11 Distribution of Coastal Property Values by Coastal Region, 2007............. .......... ........... ........... .......... .. 90
Figure 9.12 Distribution of Average Coastal Property Values by Coastal Region, 2007 ........... ........... ........... ......... 91
Figure 9.13 Distribution of Property Values by Land Use in Coastal Regions, 2007............. ........... ........... ........... .. 91
Figure 9.14 Average Coastal Property Values by Land Use in Coastal Regions, 2007........... .......... ........... ........... .. 92
Figure 9.15 Coastal Value as a Percent of Total Value in Coastal Regions, 2006.............. ........... ........... ........... ...... 92
Figure 9.16 Percent Growth in Coastal Values in Coastal Regions 2002-2007............. ........... ........... .......... ............ 93 Figure 9.17 Property Tax Revenues from Coastal Parcels by Region .......... ........... ........... ........... ........... ........... ...... 93
Figure 9.18 Distribution of the Number of Coastal Properties by County Northeast Region, 2007.............. ............ 94
Figure 9.19 Distribution of Coastal Property Values by County Northeast Region, 2007 .......... ........... ........... ........ 95
Figure 9.20 Distribution of Average Coastal Property Values in Northeast Coastal Region, 2007.................. .......... 95
Figure 9.21 Coastal Value as a Percent of Total Value in Northeast Coastal Region, 2006.......... ........... ........... ...... 96
vi

8/9/2019 Florida's Ocean and Coastal Economies Report Phase 2
http://slidepdf.com/reader/full/floridas-ocean-and-coastal-economies-report-phase-2 11/219
Figure 9.22 Percent Growth in Coastal Value in Northeast Coastal Region 2002-2007 ........... ........... ........... .......... 96
Figure 9.23 Distribution of Coastal Property Values by Land Use in Northeast Coastal Region, 2007.................... 97
Figure 9.24 Average Value of Coastal Properties by Land Use in Northeast Coastal Region, 2007................ .......... 97
Figure 9.25 Property Tax Revenues from Coastal Parcels by County in Northeast Coastal Region, 2007 ............ .... 98
Figure 9.26 Distribution of the Number of Coastal Properties by County Southeast Region, 2007.............. ........... . 99
Figure 9.27 Distribution of Coastal Property Values by County in Southeast Region, 2007 ........... ........... ........... ... 99
Figure 9.28 Distribution of Average Coastal Property Values in Southeast Coastal Region, 2007......... ........... ..... 100
Figure 9.29 Coastal Value as Percent of Total Value in Southeast Coastal Region, 2006 ........... ........... .......... ...... 100
Figure 9.30 Percent Growth in Coastal Value in Southeast Coastal Region 2002-2007 .......... ........... ........... ......... 101
Figure 9.31 Distribution of Coastal Property Values by Land Use in Southeast Coastal Region, 2007........... ....... 101
Figure 9.32 Average Coastal Property Values by Land Use in Southeast Coastal Region, 2007............ .......... ...... 102
Figure 9.33 Property Tax Revenue from Coastal Parcels by County in Southeast Coastal Region, 2007............... 102
Figure 9.34 Distribution of Number of Coastal Properties by County Southwest Region, 2007................ ........... .. 103
Figure 9.35 Distribution of Coastal Property Values by County in Southwest Region, 2007 .......... ............ ........... 104
Figure 9.36 Distribution of Average Coastal Property Values in Southwest Coastal Region, 2007............. ........... 104
Figure 9.37 Coastal Values as Percent of Total Value in Southwest Coastal Region, 2006........... ........... ........... ... 105
Figure 9.38 Percent Growth in Coastal Value in Southwest Coastal Region 2002-2007 ........... ........... ........... ....... 105
Figure 9.39 Distribution of Coastal Property Values by Land Use in Southwest Coastal Region, 2007.................. 106
Figure 9.40 Average Coastal Property Values by Land Use in Southwest Coastal Region, 2007.......... ........... ....... 106
Figure 9.41 Property Tax Revenues from Coastal Parcels by County in Southwest Coastal Region, 2007............ 107
Figure 9.42 Distribution of the Number of Coastal Properties by County Big Bend Region, 2007 ........... ........... .. 107
Figure 9.43 Distribution of Coastal Property Values by County in Big Bend Region, 2007.......... ........... ........... ... 108
Figure 9.44 Distribution of Coastal Property Values by Land Use in Big Bend Coastal Region, 2007........... ....... 108
Figure 9.45 Coastal Value as Percent of Total Value in Big Bend Coastal Region, 2006................ ........... ........... . 109 Figure 9.46 Percent Growth in Coastal Value in Big Bend Coastal Region 2002-2007........... ........... ........... ......... 109
Figure 9.47 Distribution of Coastal Property Values by Land Use in Big Bend Coastal Region, 2007........... ....... 110
Figure 9.48 Average Coastal Property Values by Land Use in Big Bend Coastal Region, 2007 .......... ........... ....... 110
Figure 9.49 Property Tax Revenues from Coastal Parcels by County in Big Bend Coastal Region, 2007.............. 111
Figure 9.50 Distribution of the Number of Coastal Properties by County Northwest Region, 2007................ ....... 112
Figure 9.51 Distribution of Coastal Property Values by County in Northwest Region, 2007 .......... ........... .......... .. 112
Figure 9.52 Distribution of Average Coastal Property Values in Northwest Coastal Region, 2007............. ........... 113
Figure 9.53 Coastal Value as Percent of Total Value in Northwest Coastal Region, 2006 .......... ........... ........... ..... 113
Figure 9.54 Percent Growth in Coastal Value in Northwest Coastal Region 2002-2007 ........... ........... ........... ....... 114 Figure 9.55 Distribution of Coastal Property Values by Land Use in Northwest Coastal Region, 2007............ ..... 114
Figure 9.56 Average Coastal Property Values by Land Use in Northwest Coastal Region, 2007............ ........... .... 115
Figure 9.57 Property Tax Revenues from Coastal Parcels by County Northwest Coastal Region, 2007 ............ .... 115
Figure 9.58 Type of Accommodations Used by Domestic Visitors to Florida............ ........... ........... .......... ........... .. 116
Figure 9.59 Licenses for Tourist and Transient Housing in Florida, 2008 ........... ........... ........... ........... ........... ........ 117
vii
8/9/2019 Florida's Ocean and Coastal Economies Report Phase 2
http://slidepdf.com/reader/full/floridas-ocean-and-coastal-economies-report-phase-2 12/219
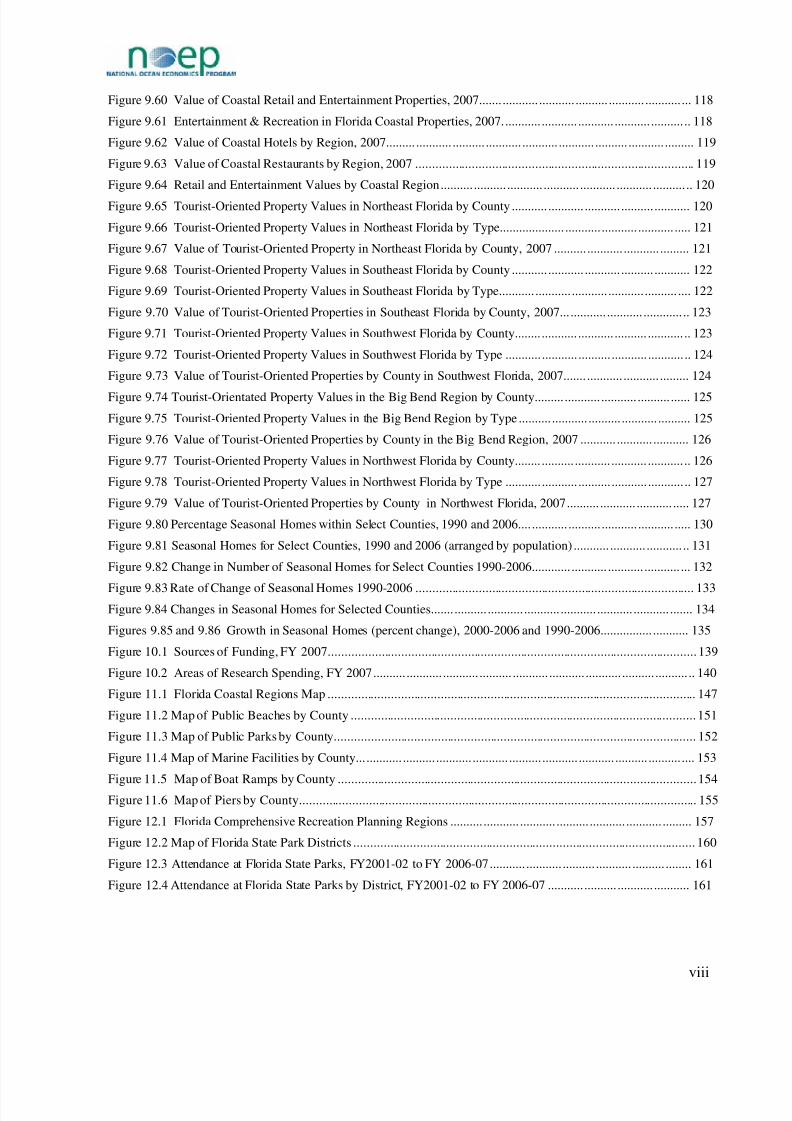
Figure 9.60 Value of Coastal Retail and Entertainment Properties, 2007.................. ........... .......... ........... ........... ... 118
Figure 9.61 Entertainment & Recreation in Florida Coastal Properties, 2007............ ........... ........... ........... .......... .. 118
Figure 9.62 Value of Coastal Hotels by Region, 2007......... ........... .......... ........... ........... ........... .......... ........... ......... 119
Figure 9.63 Value of Coastal Restaurants by Region, 2007 .................................................................................... 119
Figure 9.64 Retail and Entertainment Values by Coastal Region.......... .......... ........... ........... ........... ........... .......... .. 120
Figure 9.65 Tourist-Oriented Property Values in Northeast Florida by County ........... ........... ........... .......... ........... 120
Figure 9.66 Tourist-Oriented Property Values in Northeast Florida by Type.................... ........... ........... ........... ..... 121
Figure 9.67 Value of Tourist-Oriented Property in Northeast Florida by County, 2007 .......... ........... ........... ......... 121
Figure 9.68 Tourist-Oriented Property Values in Southeast Florida by County ........... ........... ........... .......... ........... 122
Figure 9.69 Tourist-Oriented Property Values in Southeast Florida by Type........... ........... ........... ........... .......... .... 122
Figure 9.70 Value of Tourist-Oriented Properties in Southeast Florida by County, 2007.............. ........... ............ .. 123
Figure 9.71 Tourist-Oriented Property Values in Southwest Florida by County................... ........... .......... ........... .. 123
Figure 9.72 Tourist-Oriented Property Values in Southwest Florida by Type ........... ........... .......... ........... ........... .. 124
Figure 9.73 Value of Tourist-Oriented Properties by County in Southwest Florida, 2007.................. ........... ......... 124
Figure 9.74 Tourist-Orientated Property Values in the Big Bend Region by County......... ........... ........... .......... ...... 125
Figure 9.75 Tourist-Oriented Property Values in the Big Bend Region by Type .......... ........... .......... ........... .......... 125
Figure 9.76 Value of Tourist-Oriented Properties by County in the Big Bend Region, 2007 ........... ........... ........... 126
Figure 9.77 Tourist-Oriented Property Values in Northwest Florida by County.................. ........... ........... ........... .. 126
Figure 9.78 Tourist-Oriented Property Values in Northwest Florida by Type ........... ........... .......... ........... ........... .. 127
Figure 9.79 Value of Tourist-Oriented Properties by County in Northwest Florida, 2007.......... ........... ........... ..... 127
Figure 9.80 Percentage Seasonal Homes within Select Counties, 1990 and 2006............... .......... ........... ........... ..... 130
Figure 9.81 Seasonal Homes for Select Counties, 1990 and 2006 (arranged by population) ........... ........... ........... .. 131
Figure 9.82 Change in Number of Seasonal Homes for Select Counties 1990-2006............ ........... ........... ........... ... 132
Figure 9.83 Rate of Change of Seasonal Homes 1990-2006 .................................................................................... 133 Figure 9.84 Changes in Seasonal Homes for Selected Counties................. ........... ........... ........... ........... ........... ....... 134
Figures 9.85 and 9.86 Growth in Seasonal Homes (percent change), 2000-2006 and 1990-2006................ ........... 135
Figure 10.1 Sources of Funding, FY 2007............................................................................................................... 139
Figure 10.2 Areas of Research Spending, FY 2007.......... ........... ........... .......... ........... ........... ........... .......... .......... .. 140
Figure 11.1 Florida Coastal Regions Map ............................................................................................................... 147
Figure 11.2 Map of Public Beaches by County ........................................................................................................ 151
Figure 11.3 Map of Public Parks by County............................................................................................................. 152
Figure 11.4 Map of Marine Facilities by County.............. .......... ........... ........... .......... ........... ........... .......... .......... .... 153
Figure 11.5 Map of Boat Ramps by County ............................................................................................................154 Figure 11.6 Map of Piers by County........................................................................................................................ 155
Figure 12.1 Florida Comprehensive Recreation Planning Regions .......... ........... ........... .......... ........... ........... ......... 157
Figure 12.2 Map of Florida State Park Districts ....................................................................................................... 160
Figure 12.3 Attendance at Florida State Parks, FY2001-02 to FY 2006-07........... ........... .......... ........... .......... ........ 161
Figure 12.4 Attendance at Florida State Parks by District, FY2001-02 to FY 2006-07 ........... .......... ........... ........... 161
viii
8/9/2019 Florida's Ocean and Coastal Economies Report Phase 2
http://slidepdf.com/reader/full/floridas-ocean-and-coastal-economies-report-phase-2 13/219
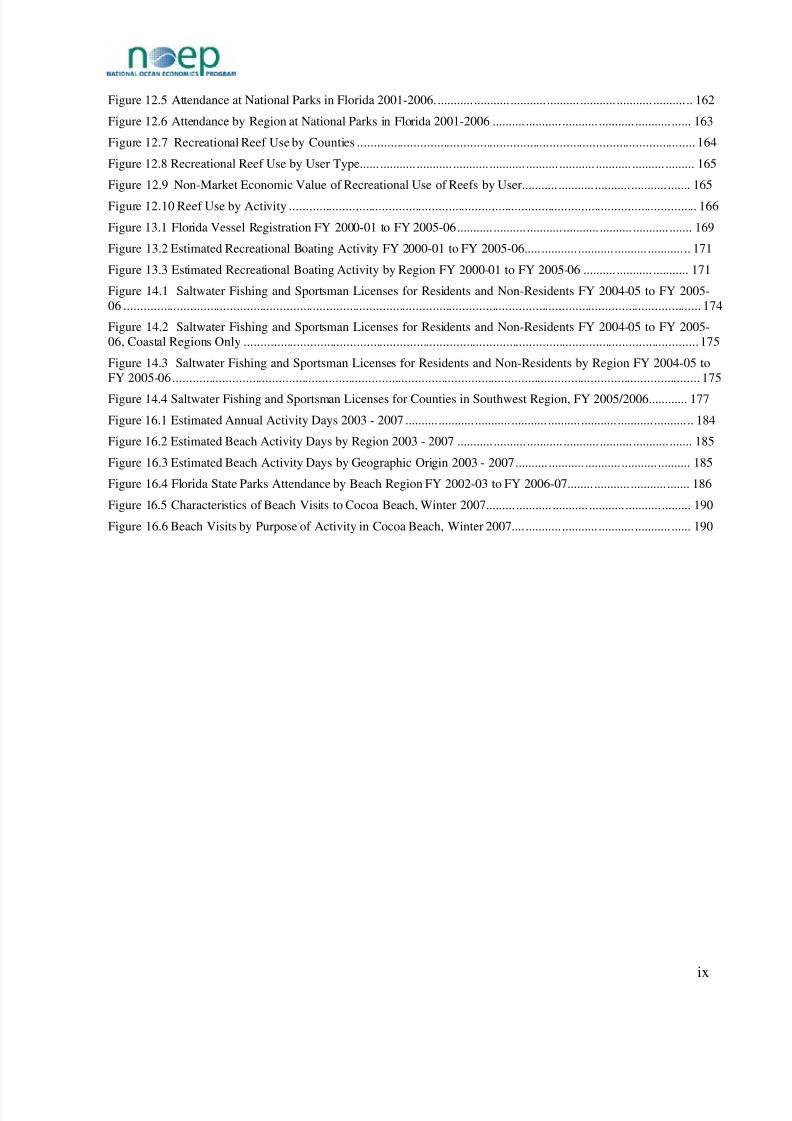
Figure 12.5 Attendance at National Parks in Florida 2001-2006............ ........... ........... .......... ........... ........... .......... .. 162
Figure 12.6 Attendance by Region at National Parks in Florida 2001-2006 .......... ........... ........... ........... ........... ...... 163
Figure 12.7 Recreational Reef Use by Counties ...................................................................................................... 164
Figure 12.8 Recreational Reef Use by User Type................. ........... ........... ........... .......... ........... ........... .......... ......... 165
Figure 12.9 Non-Market Economic Value of Recreational Use of Reefs by User........... ........... ........... ........... ....... 165
Figure 12.10 Reef Use by Activity ........................................................................................................................... 166
Figure 13.1 Florida Vessel Registration FY 2000-01 to FY 2005-06........... .......... ........... ........... .......... ........... ....... 169
Figure 13.2 Estimated Recreational Boating Activity FY 2000-01 to FY 2005-06................ ........... .......... ........... .. 171
Figure 13.3 Estimated Recreational Boating Activity by Region FY 2000-01 to FY 2005-06 .......... ........... ........... 171
Figure 14.1 Saltwater Fishing and Sportsman Licenses for Residents and Non-Residents FY 2004-05 to FY 2005-06 .............................................................................................................................................................................. 174
Figure 14.2 Saltwater Fishing and Sportsman Licenses for Residents and Non-Residents FY 2004-05 to FY 2005-06, Coastal Regions Only .........................................................................................................................................175
Figure 14.3 Saltwater Fishing and Sportsman Licenses for Residents and Non-Residents by Region FY 2004-05 toFY 2005-06............................................................................................................................................................... 175
Figure 14.4 Saltwater Fishing and Sportsman Licenses for Counties in Southwest Region, FY 2005/2006............ 177
Figure 16.1 Estimated Annual Activity Days 2003 - 2007 .......... ........... ........... ........... .......... ........... ........... .......... .. 184
Figure 16.2 Estimated Beach Activity Days by Region 2003 - 2007 ........... .......... ........... ........... .......... ........... ....... 185
Figure 16.3 Estimated Beach Activity Days by Geographic Origin 2003 - 2007.......... ........... ........... ........... .......... 185
Figure 16.4 Florida State Parks Attendance by Beach Region FY 2002-03 to FY 2006-07................... ........... ....... 186
Figure 16.5 Characteristics of Beach Visits to Cocoa Beach, Winter 2007......... ........... ........... ........... ........... ......... 190
Figure 16.6 Beach Visits by Purpose of Activity in Cocoa Beach, Winter 2007............... ........... ........... ........... ...... 190
ix

8/9/2019 Florida's Ocean and Coastal Economies Report Phase 2
http://slidepdf.com/reader/full/floridas-ocean-and-coastal-economies-report-phase-2 14/219
x

8/9/2019 Florida's Ocean and Coastal Economies Report Phase 2
http://slidepdf.com/reader/full/floridas-ocean-and-coastal-economies-report-phase-2 15/219
Part I — Introduction and Background
Chapter 1 Context for the Study
Phase II of Florida’s Ocean and Coastal Economics Report was prepared for the FloridaOceans and Coastal Council and funded under contract #RM077 by the FloridaDepartment of Environmental Protection. The Phase I report of Florida’s Ocean andCoastal Economies provided basic information that the NOEP compiles for all coastalstates about employment, wages and output of those activities located geographicallyalong Florida’s shoreline (Coastal Economy) as well as those activities directlydependent upon the oceans (Ocean Economy). That information not only described thestatus and trends of Florida’s Coastal and Ocean Economy but allowed comparison toeconomies in other states as well as comparisons among counties in Florida. It alsoprovides basic data about fisheries productivity and estimates of the non-market value of coastal recreation.
The Phase II report is in three volumes: this report, Phase II, Florida’s Ocean and
Coastal Economies, a smaller summary version, Phase II Facts and Figures, and Phase
II Appendices. Phase II expands and provides more detailed information about additionaleconomic activities that particularly define Florida’s Ocean Economy that were notincluded in Phase I. These include: the passenger cruise industry, the commercial andrecreational fishing, coastal real estate – the value of coastal real estate, value of touristreal estate and data on seasonal housing; marine research and education institutions,coastal construction activities including beach nourishment and dredging, and finallymarine transportation and port activities. In addition, an expanded marine recreationsection provides detail about the location of Florida’s coastal recreational assets, the
number provides information on the number of people using them, and estimates of thevalue of numerous recreational activities such as boating, surfing, etc. A major study onboating and marinas is currently underway for the state of Florida by other contractors
1.
To provide context for the expanded descriptions of economic activities, the NOEP hasalso prepared an update of the Phase I report using a summary of the most recentnumbers available for Florida’s Coastal and Ocean economic contributions, e.g. asummary update of the estimates from the Phase I report.
Background
Florida’s economy has been strongly tied to the oceans through tourism and recreationfor decades. Yet, there are many facets of its economy that are also dependent on its longand lovely coastline, but don’t get reported in any single document or coherent report.
1 Urban Harbors Institute, et al. (forthcoming in 2008).
Boating Access Facilities Inventory and Economic Study. University of Massachusetts-Boston, Mass.Prepared for Florida Fish and Wildlife Conservation Commission.
1

8/9/2019 Florida's Ocean and Coastal Economies Report Phase 2
http://slidepdf.com/reader/full/floridas-ocean-and-coastal-economies-report-phase-2 16/219
That is the purpose of this effort. The combination of these activities adds up to a diverseeconomy that sustains Florida. Marine industries, for example, are a major economicengine for the state of Florida. In 2005 it was reported that the marine-related industrystatewide generated $18.4 billion in annual economic impact and 220,000 jobs in theareas of seaports, boating and marinas, fishing, and marine science research. Almost
100,000 of these jobs were in manufacturing.
2
This report attempts to provide important details, some of which can be found in separatereports and separate websites which were our sources and reported throughout thefollowing pages, and some of which were generated specifically for this report, such asthe real estate values and those for the marine research and education sector, two newsectors that NOEP added to its data series with the anticipation that these sectors willsoon be measured in other states as well. These newly added sectors are also importantto report because they add an important dimension to Florida’s economy. Coastal realestate carries a high price tag with various tax revenues that flow to the state. At thesame time, that market has gone through volatile times recently, leaving the state with farlower revenues as a result of lower values. It is instructive to be able to track thesevalues so that contingencies can be created with more accurate forecasting. The researchand education sector chapter provides a window into the potential effectiveness of Florida’s efforts to attract research institutions as a way of diversifying its economy to aless volatile service sector. The Marine Research and Education sector provides aninteresting microcosm, and only three-fifths of the institutions actually responded, so thischapter is still underestimating values.
Dollar values in this report are reported in current dollars when only one year is availableand in real dollars (2000 base year) for multiple years.
For those who have not read Phase I, we include a description of the two types of
economies we have measured in both reports: Ocean and Coastal Economies. SeeGlossary.
The Coastal and Ocean Economies Are Not the Same
Economic ActivityLocated Along the Coast
Economic Activity Using theOcean as an Input
Coastal Economy Ocean Economy
2 Murray, Thomas & Associates, Inc. (2005). Florida’s Recreational Marine Industry – Economic Impactand Growth: 1980-2005. p. iii. Cited in Marine Industries Association of Florida. Boating is Big Businessin Florida. Retrieved 11/15/2007 http://www.boatflorida.org/custom_pages/site_page_2708/index.html.
2
8/9/2019 Florida's Ocean and Coastal Economies Report Phase 2
http://slidepdf.com/reader/full/floridas-ocean-and-coastal-economies-report-phase-2 17/219
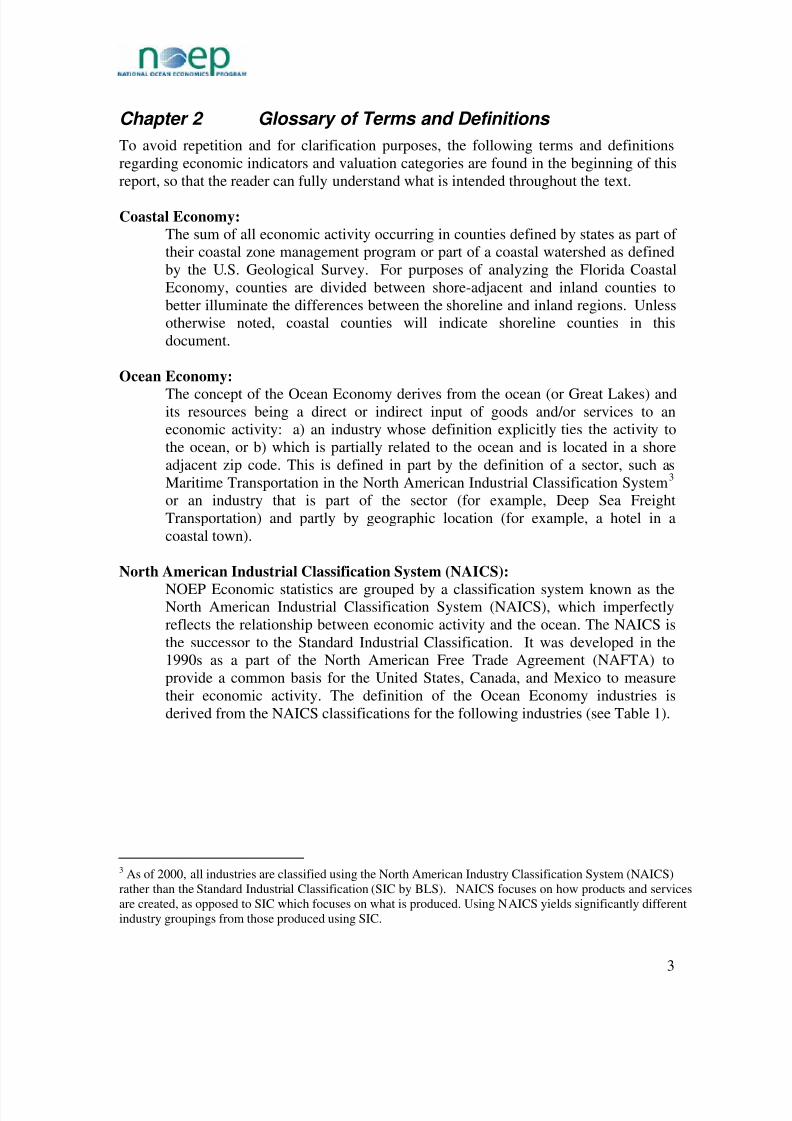
Chapter 2 Glossary of Terms and Definitions
To avoid repetition and for clarification purposes, the following terms and definitionsregarding economic indicators and valuation categories are found in the beginning of thisreport, so that the reader can fully understand what is intended throughout the text.
Coastal Economy: The sum of all economic activity occurring in counties defined by states as part of their coastal zone management program or part of a coastal watershed as definedby the U.S. Geological Survey. For purposes of analyzing the Florida CoastalEconomy, counties are divided between shore-adjacent and inland counties tobetter illuminate the differences between the shoreline and inland regions. Unlessotherwise noted, coastal counties will indicate shoreline counties in thisdocument.
Ocean Economy:
The concept of the Ocean Economy derives from the ocean (or Great Lakes) andits resources being a direct or indirect input of goods and/or services to aneconomic activity: a) an industry whose definition explicitly ties the activity tothe ocean, or b) which is partially related to the ocean and is located in a shoreadjacent zip code. This is defined in part by the definition of a sector, such as Maritime Transportation in the North American Industrial Classification System
3
or an industry that is part of the sector (for example, Deep Sea FreightTransportation) and partly by geographic location (for example, a hotel in acoastal town).
North American Industrial Classification System (NAICS):
NOEP Economic statistics are grouped by a classification system known as theNorth American Industrial Classification System (NAICS), which imperfectlyreflects the relationship between economic activity and the ocean. The NAICS isthe successor to the Standard Industrial Classification. It was developed in the1990s as a part of the North American Free Trade Agreement (NAFTA) toprovide a common basis for the United States, Canada, and Mexico to measuretheir economic activity. The definition of the Ocean Economy industries isderived from the NAICS classifications for the following industries (see Table 1).
3 As of 2000, all industries are classified using the North American Industry Classification System (NAICS)rather than the Standard Industrial Classification (SIC by BLS). NAICS focuses on how products and servicesare created, as opposed to SIC which focuses on what is produced. Using NAICS yields significantly differentindustry groupings from those produced using SIC.
3
8/9/2019 Florida's Ocean and Coastal Economies Report Phase 2
http://slidepdf.com/reader/full/floridas-ocean-and-coastal-economies-report-phase-2 18/219
Sectors and Industries of the Ocean Economy
Construction – Marine Tourism & Recreation – Coastal
Amusement and Recreation Services, NEC*
Living Resources – Marine Boat Dealers
Fishing Eating & Drinking Places
Fish Hatcheries and Aquaculture Hotels & Lodging PlacesSeafood Processing Marinas
Seafood Markets Recreational Vehicle Parks & Campgrounds
Minerals – Offshore Scenic Water Tours
Limestone, Sand, & Gravel Sporting Goods Retailers
Oil and Gas Exploration Zoos, Aquaria
Oil and Gas Production Transportation – Marine
Deep Sea Freight Transportation
Marine Passenger Transportation
Ship & Boat Building Marine Transportation Services
Boat Building and Repair Search and Navigation Equipment
Ship Building and Repair Warehousing*Not elsewhere classified
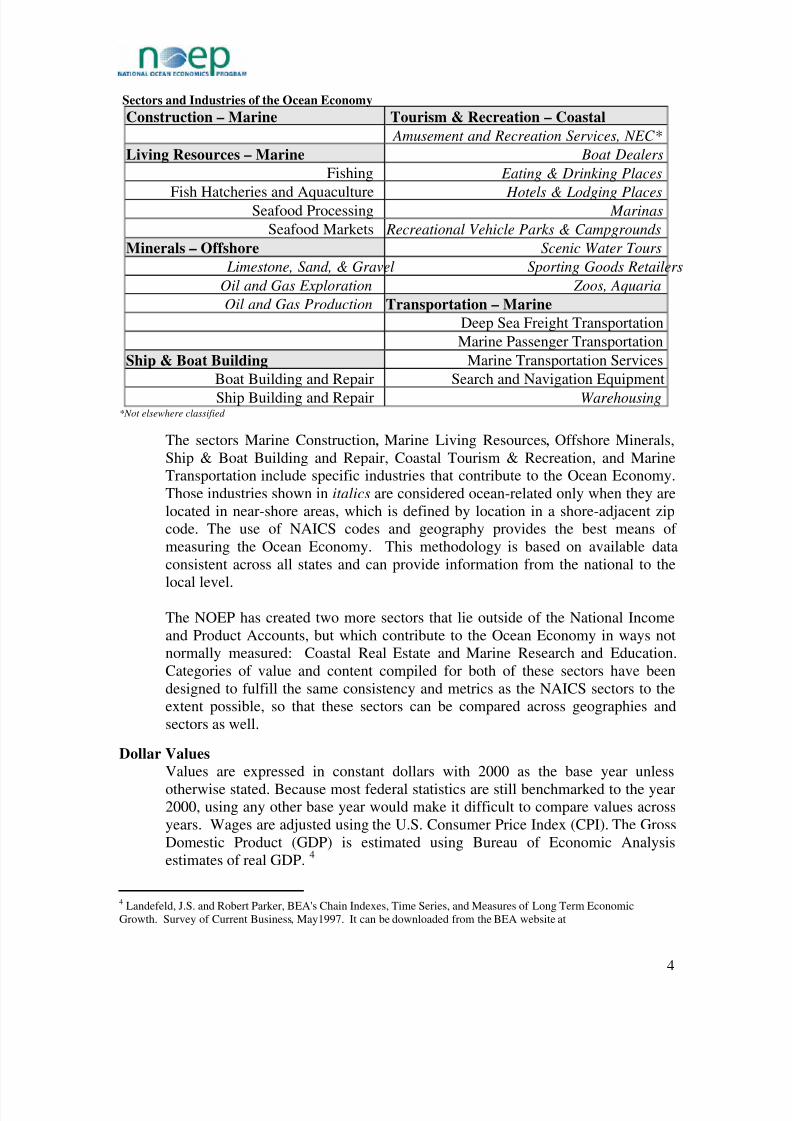
The sectors Marine Construction, Marine Living Resources, Offshore Minerals,Ship & Boat Building and Repair, Coastal Tourism & Recreation, and MarineTransportation include specific industries that contribute to the Ocean Economy.Those industries shown in italics are considered ocean-related only when they arelocated in near-shore areas, which is defined by location in a shore-adjacent zipcode. The use of NAICS codes and geography provides the best means of measuring the Ocean Economy. This methodology is based on available dataconsistent across all states and can provide information from the national to the
local level.
The NOEP has created two more sectors that lie outside of the National Incomeand Product Accounts, but which contribute to the Ocean Economy in ways notnormally measured: Coastal Real Estate and Marine Research and Education.Categories of value and content compiled for both of these sectors have beendesigned to fulfill the same consistency and metrics as the NAICS sectors to theextent possible, so that these sectors can be compared across geographies andsectors as well.
Dollar Values Values are expressed in constant dollars with 2000 as the base year unless
otherwise stated. Because most federal statistics are still benchmarked to the year2000, using any other base year would make it difficult to compare values acrossyears. Wages are adjusted using the U.S. Consumer Price Index (CPI). The GrossDomestic Product (GDP) is estimated using Bureau of Economic Analysisestimates of real GDP.
4
4 Landefeld, J.S. and Robert Parker, BEA's Chain Indexes, Time Series, and Measures of Long Term EconomicGrowth. Survey of Current Business, May1997. It can be downloaded from the BEA website at
4

8/9/2019 Florida's Ocean and Coastal Economies Report Phase 2
http://slidepdf.com/reader/full/floridas-ocean-and-coastal-economies-report-phase-2 19/219
• Dollar values are estimated as direct and indirect values. Indirect values includeinduced values.
• Direct values are those activities associated only with the designated oceansectors such as Recreation & Tourism and Living Resources (examples include
labor and capital costs associated with fish processing or ship building.• Multipliers are indirect and induced values. Multipliers affect the estimates of
employment, wages, and output within the region. Indirect effects include boththe change in economic activity in industries within the region that buy or sellfrom ocean industries (examples include sales of food to restaurants and hotelsand the activities of travel agents booking trips) and the change in economicactivity resulting from the spending of the wages earned by those employed of theocean industries within the region (induced). All indirect values or multipliereffects are based on IMPLAN, a standard and widely used economic impactmodel.
• Unless otherwise indicated, all measures are stated as direct values.
Employment Employment is the annual average wage and salary employment (excluding self-employment) as reported in the Quarterly Census of Employment and Wages(formerly known as the ES-202 employment series). This definition covers about90% of employment in the U.S. It excludes farm employment, the military,railroads, and self-employment. Wage and salary employment measuresemployment by place of work, not by place of residence. It also measures jobs,not people. It does not distinguish between full and part time work, and year-round and part-year jobs. The data in the NOEP database is annual averageemployment. Employment in the fisheries harvesting sector is generally excludedfrom the unemployment insurance laws and thus is not included in the NOEPdata.
Gross Domestic Product (GDP)
GDP is a measure of the contribution of the sector to the value of goods andservices in the economy. GDP is a measure of value-added, or sales, minus the cost of inputs. Using this measure eliminates “double counting,” among sectors.5
GDP data is published only at the state level and for industry aggregations greaterthan used in the Ocean Economy definition. In order to estimate a share of GDPin an Ocean or Coastal Economy industry, the proportion of the GDP for a givensector is calculated based on the proportion of total wages paid in that sector by a
given establishment. Since wages often account for as much as 60% of GSP, this
http://www.bea.gov/bea/regional/gsp/help/OnlineHelp.htm5 Bureau of Economic Analysis defines GDP as “the value added in production by the labor and property located in astate. GDP for a State is derived as the sum of the gross state product originating in all industries in a State. In concept,an industry's GDP, referred to as its "value added", is equivalent to its gross output (sales or receipts and otheroperating income, commodity taxes, and inventory change) minus its intermediate inputs (consumption of goods andservices purchased from other U.S. industries or imported). Thus, GDP is often considered the state counterpart of thenation's gross domestic product (GDP), BEA's featured measure of U.S. output. In practice, GDP estimates aremeasured as the sum of the costs incurred and incomes earned in the production of GDP.”
5

8/9/2019 Florida's Ocean and Coastal Economies Report Phase 2
http://slidepdf.com/reader/full/floridas-ocean-and-coastal-economies-report-phase-2 20/219
method is a reasonable approximation of individual establishments’ contributionto GDP.
Housing Patterns and Trends
These include both single and multi-family housing units including seasonal andyear round, owner occupied and rental. The U.S. Bureau of Census is the sourcefor these data.
National Ocean Economics Program (NOEP):
Externally funded program to understand and estimate changes in the nature andvalue of the coastal and ocean-based economy of the United States.
Wages and Salaries: Total wages and salaries paid; all wages are shown in year 2000 dollars
6

8/9/2019 Florida's Ocean and Coastal Economies Report Phase 2
http://slidepdf.com/reader/full/floridas-ocean-and-coastal-economies-report-phase-2 21/219
Part II — Executive Summary and Update
Chapter 3 Executive Summary
• Florida’s Coastal Economy generated almost $562B in 2006.
• Florida’s Ocean Economy contributed $25B in 2005.
Fishing Industry
• Commercial saltwater landings generated $143M in inflation-adjusted docksidesales in 2007, compared to $247.5M in 1990.
• Annual commercial saltwater landings declined 66% by weight and 56% inconstant value between 1990 and 2007.
• Commercial vessel registrations declined 13.3% from 1990 to 2007, whilepleasure craft registrations increased by 11%.
• Seafood Imports totaled $2.1B in 2007, an annual growth of 5.7% since 1990.
• Seafood Exports were $89.1B in 2007.
• In 2006, over 2M saltwater anglers contributed $3B in retail sales with over 180Mfish landed, making Florida the number one recreational fishing state in theUnited States.
Marine Transportation
• Florida's international trade value, including both waterborne and airbornecommodities moving through coastal access points and over land, totaled $115B,a $5B increase in 2007 (4.7%) over the previous record of $110B in 2006.
• Florida’s 14 deepwater seaports managed 121 million tons of cargo, generating an
overall $73B economic contribution.Coastal Construction
• Dredging costs increased during the period 1990-2000, but declined sharply since,with a peak in 2000 at $41.2M, and value in 2005 being $3.3M.
• 59% of Florida’s beaches (485 miles) are experiencing erosion; of these, 192miles are nourished beaches managed by federal entities.
• $1.1B was spent from 1960 through 2007 on beach nourishment activities inFlorida.
Tourism and Recreation – The Cruise Industry
• More than 9M cruise passengers embarked on cruises from U.S. ports in 2006.
• The top three Florida ports accounted for over 4M of the 9M passengers thatembarked on cruises from U.S. ports in 2006 or an estimated 50% of all U.S.cruise embarkations.
• Florida businesses received almost $6B in 2006, or one-third of the directexpenditures generated by the cruise industry in the United States.
7

8/9/2019 Florida's Ocean and Coastal Economies Report Phase 2
http://slidepdf.com/reader/full/floridas-ocean-and-coastal-economies-report-phase-2 22/219
Real Estate
• Florida’s 367,000 coastal properties were valued for tax purposes in 2006 at$181B, yielding $2B in property tax revenues.
• Coastal parcels made up 7.5% of the value of all real estate in Florida.
•
From 2002-2006, the number of coastal parcels grew by about 10%, but the valueof coastal parcels more than doubled reflecting the strong demand for coastal realestate in the early part of this decade.
Seasonal Housing
• Florida ranks first in the nation for number of seasonal housing units.
• In 1990 Florida accounted for 14% of all seasonal housing units in the UnitedStates with 417,670. In 2006 Florida accounted for 16% of U.S. seasonal housingunits with 655,647.
• From 1990-2006 Florida added 237,977 seasonal housing units, a 57% growthrate, compared to an overall U.S growth in seasonal housing units of 37%.
Marine Research and Education, 39 of 55 institutions reporting
• Annual Budgets totaled $272.5M.
• Annual Wages totaled $154M.
• Annual Employment totaled 2,925.
• Number of degree students totaled 2,234.
Coastal Recreation
• In Fiscal Year 2007, the Florida system of State Parks provided a direct economicimpact of over $936M to local economies throughout the state.
• For every 1,000 persons attending a State Park, total direct economic impactexceeded $43,200. On average, if a State Park were closed for one year, a loss of nearly $5.9M would impact the state economy. Similarly, if the State Park systemincreased annual attendance by 10% during the next fiscal year, the state’seconomy would rise by an additional $65M.
• In 2005, the recreational marine-related industry statewide generated $18.4B inannual economic impact, 220,000 jobs in the areas of boating and marinas,fishing, and marine science research. Almost 100,000 of these jobs were inmanufacturing. 6
6 Murray, Thomas & Associates, Inc. (2005). Florida’s Recreational Marine Industry – Economic Impact
and Growth: 1980-2005. p. iii. Cited in Marine Industries Association of Florida. Boating is Big Business
in Florida. Retrieved 11/15/2007 http://www.boatflorida.org/custom_pages/site_page_2708/index.html.
8

8/9/2019 Florida's Ocean and Coastal Economies Report Phase 2
http://slidepdf.com/reader/full/floridas-ocean-and-coastal-economies-report-phase-2 23/219
Chapter 4 Updates from Phase I Report
To set the stage for the economic studies included in this report, the most recent estimatesavailable for both the Ocean and Coastal economies for Florida are present below.
• Florida’s Ocean Economy contributed $25B to state GDP during 2005. Thiscomprised 4% of the total GDP.
• Without the multiplier effects, the Ocean Economy produced direct output of more than $14B.
Table 4.1 Florida’s Ocean Economy, 2005
Ocean Economy Employment, 2005
Sector Direct Indirect & Induced Total
Construction 3,580 3,077 6,657
Living Resources 4,135 4,419 8,554
Minerals 475 390 865
Ship & Boat Building 13,556 11,960 25,516
Tourism & Recreation 261,204 100,669 361,873
Transportation 32,049 75,659 107,708
Ocean Economy 314,999 196,174 511,173
Ocean Economy Wages, 2005
Sector Direct Indirect & Induced Total
Construction $163,800,810 137,166,798 $300,967,608
Living Resources $122,450,157 161,230,122 $283,680,279
Minerals $20,717,729 66,319,522 $87,037,251
Ship & Boat Building $497,270,170 347,392,941 $844,663,111
Tourism & Recreation $4,786,359,214 2,935,474,106 $7,721,833,320
Transportation $1,615,599,892 2,610,163,186 $4,225,763,078
Ocean Economy $7,206,197,972 6,257,746,675 $13,463,944,647
Ocean Economy GDP, 2005Sector Direct Indirect & Induced Total
Construction $365,690,000 333,436,142 $699,126,142
Living Resources $354,640,000 292,507,072 $647,147,072
Minerals $68,900,000 49,311,730 $118,211,730
Ship & Boat Building $396,090,000 262,053,144 $658,143,144
Tourism & Recreation $10,512,590,000 7,697,318,398 $18,209,908,398
Transportation $2,322,960,000 2,200,307,712 $4,523,267,712
Ocean Economy $14,020,870,000 10,834,934,198 $24,855,804,198
Florida’s coastal (shoreline counties) contributed almost $562B to state GDP for 2006.This was 82% of state GDP.
Table 4.2 Florida’s Coastal Economy, 2006 (shoreline counties only)
Supersector Establishments Employment Wages GDP
Construction 55,448 473,960 $19,370,199,234 $43,098,844,063
Financial Activities 55,503 428,621 $23,727,596,107 $141,238,751,050
Education and Health Services 41,650 891,115 $36,270,400,396 $44,543,391,374
Information 7,062 122,939 $6,915,884,613 $22,581,285,553
9

8/9/2019 Florida's Ocean and Coastal Economies Report Phase 2
http://slidepdf.com/reader/full/floridas-ocean-and-coastal-economies-report-phase-2 24/219
Supersector Establishments Employment Wages GDP
Leisure and Hospitality 33,988 641,340 $12,812,829,992 $26,402,075,726
Manufacturing 13,132 302,599 $13,852,457,530 $27,480,902,806
Natural Resources and Mining 2,908 58,923 $1,384,373,389 $4,351,546,699
Other Services 38,141 191,734 $5,157,590,478 $14,166,289,754
Professional and Business
Services 91,849 898,109 $39,061,614,696 $72,180,894,146
Public Administration 2,822 323,459 $15,733,744,365 $60,070,901,103
Trade, Transportation, andUtilities 97,711 1,226,712 $43,642,006,508 $105,637,428,623
Total, all industries 445,634 5,782,478 $226,403,461,926 $561,752,310,896
4.1 Florida Coastal Economy 2006
This section provides an update of Florida’s Coastal Economy for 2006. It includes themost recent values of industries within the shoreline region, for the Atlantic and Gulf coasts, and their contribution to Florida’s economy overall. Comparisons are made to the
2003 values, which were the most recent data available in NOEP’s Florida Ocean and Coastal Economies, 2006 report. Percent changes from 2003 are shown on a state,regional, and county level.
Overall, economic growth from 2003-2006 was strong, with the smallest growth rates foremployment at 10% increase, and the highest growth for GDP at 17.5%. While the finalnumbers for 2007 and 2008 are not yet available, initial evaluations show a reversal of the growth seen leading up to 2006, with declines in 2007 and 2008. Florida’s shorelineand coastal regions’ contribution to the state economy in 2006 are provided in table 4.3.Florida’s shoreline makes up over 75% of economic activity whether measured by GDP,wages, employment, or establishments, yet the shoreline counties make up only 56% of
land area. Both coastal regions showed economic contributions that were inverselyproportional to their land area. While the Gulf Coast makes up 34% of land area, itcontributed approximately 30% of economic activity in Florida; however, the AtlanticCoast takes up 21% of land area and showed a range of economic activity from 45% of Florida’s employment to almost 50% contribution to Florida’s GDP. Thisdisproportionate division of economic distribution is due to the urban counties such asMiami-Dade, Broward, Palm Beach, and Duval along the Atlantic Coast. These fourcounties alone make up 42% of Florida’s overall GDP.
Table 4.3 Florida Economy Total Regional Values and Contribution to State Economy, 2006
Establishments % of FL Total Employment % of FL Total
Florida Total 560,589 100.0% 7,632,992 100.0%
Shoreline Total 445,634 79.5% 5,782,478 75.8%
Atlantic Shoreline 273,503 48.8% 3,425,730 44.9%
Gulf Shoreline 172,131 30.7% 2,356,748 30.9%
Wages % of FL Total GDP % of FL Total
Florida Total $291,926,053,544 100.0% $713,504,000,000 100.0%
Shoreline Total $226,403,461,926 77.6% $561,752,310,896 78.7%
Atlantic Shoreline $139,954,527,968 47.9% $352,075,624,974 49.3%
Gulf Shoreline $86,448,933,958 29.6% $209,676,685,922 29.4%
10

8/9/2019 Florida's Ocean and Coastal Economies Report Phase 2
http://slidepdf.com/reader/full/floridas-ocean-and-coastal-economies-report-phase-2 25/219
4.2 Coastal Economy Growth 2003-2006
Florida experienced large economic growth rates from 2003-2006 despite this short timeperiod. The smallest changes were seen in employment, with the Atlantic Coast at 8.8%and the Gulf Coast at 9.8%, compared to the Florida state overall growth of 10% (shownin table 4.4). Combined, shoreline counties lagged the overall state growth trends
somewhat, reflecting both the mature economies of the urban coastal areas and continuedstrong growth in central Florida around the Orlando area. However, the Gulf of Mexicoshoreline counties did show somewhat faster growth than the state rates.
Table 4.4 Florida Regional Coastal Economy 2003-2006
% Change 2003-2006
Establishments Employment Wages GDP
Florida Total 17.36% 10.07% 14.51% 17.47%
Shoreline Total 16.16% 9.22% 13.91% 16.91%
Atlantic Shoreline 13.76% 8.83% 13.43% 16.26%
Gulf Shoreline 20.20% 9.81% 14.71% 18.01%
4.3 Economic Growth at the County Level 2003-2006
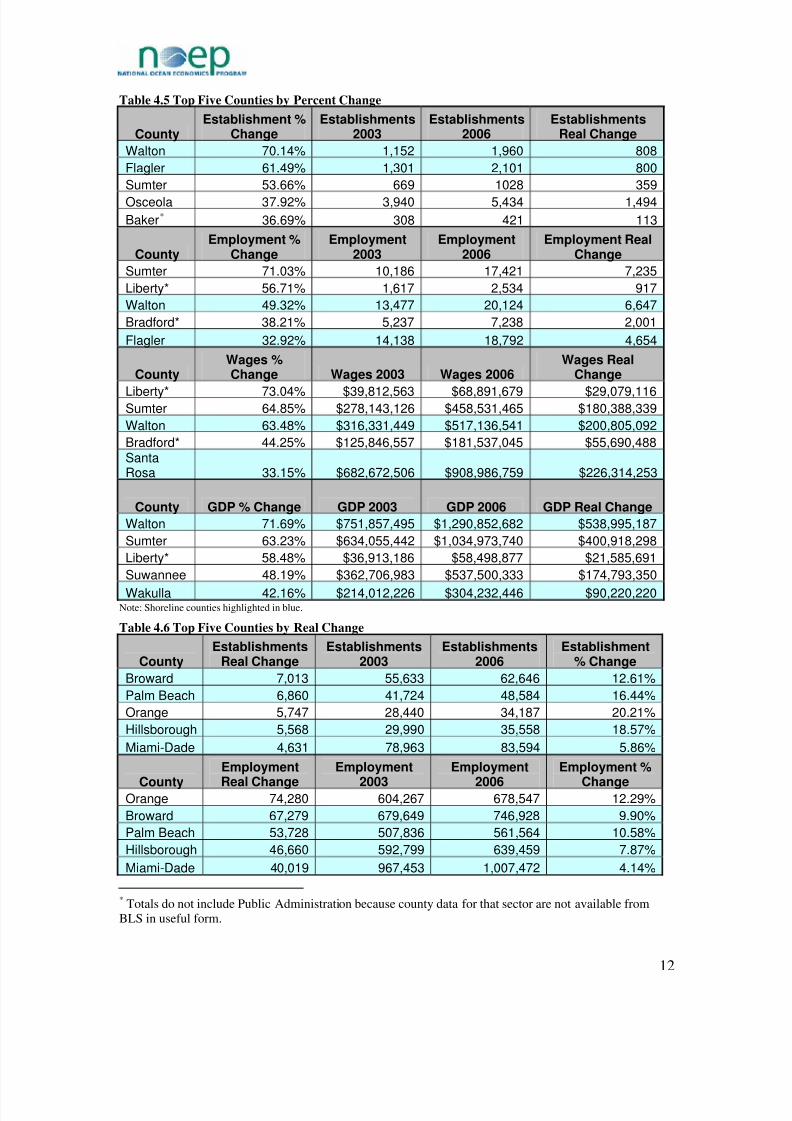
At the county level, growth over 2003-2006 was uneven. Although state numbers showgreater growth inland, more individual shoreline counties ranked among the top counties,in particular by real change, while more inland counties ranked among the bottomcounties (tables 4.5 through 4.8). While this is the case, the actual change and percentchange helps to identify the overall impact throughout the state for growth in bothshoreline and inland counties. Without an indication of what the actual change or baselinefor change is, percent change can not tell a complete story. For instance, differentshoreline counties rank highest in growth when measured by percent change or by realchange (tables 4.5 and 4.6). This demonstrates that while more significant changes areoccurring in shoreline counties such as Flagler, Santa Rosa, Wakulla, and Walton(reflected in percent change), strong growth is still occurring in major shoreline countiessuch as Broward, Hillsborough, Miami-Dade, and Palm Beach (reflected in real change).While these latter counties do not rank high in percentage change, their real growth ishigh because they are some of the largest economic producers in the state, and anysignificant growth will produce the largest real change in value. On the other hand, inlandcounties such as Sumter, Liberty, and Baker counties have relatively small contributionsto the overall state economy. However, growth in these inland counties has beenconsistently strong when measured by percent change, and these are some of the fastestgrowing counties in the state. This county comparison helps to explain why inlandcounties are showing a stronger percent change in state data than the shoreline; thecoastal region consists of matured economies which, while contributing more to theoverall state economy, show less growth than inland counties. Even though the inlandcounties contribute less to the state economy, they exhibit larger percent change.
11
8/9/2019 Florida's Ocean and Coastal Economies Report Phase 2
http://slidepdf.com/reader/full/floridas-ocean-and-coastal-economies-report-phase-2 26/219
Table 4.5 Top Five Counties by Percent Change
CountyEstablishment %
ChangeEstablishments
2003Establishments
2006Establishments
Real Change
Walton 70.14% 1,152 1,960 808
Flagler 61.49% 1,301 2,101 800
Sumter 53.66% 669 1028 359
Osceola 37.92% 3,940 5,434 1,494
Baker* 36.69% 308 421 113
CountyEmployment %
ChangeEmployment
2003Employment
2006Employment Real
Change
Sumter 71.03% 10,186 17,421 7,235
Liberty* 56.71% 1,617 2,534 917
Walton 49.32% 13,477 20,124 6,647
Bradford* 38.21% 5,237 7,238 2,001
Flagler 32.92% 14,138 18,792 4,654
CountyWages %Change Wages 2003 Wages 2006
Wages RealChange
Liberty* 73.04% $39,812,563 $68,891,679 $29,079,116Sumter 64.85% $278,143,126 $458,531,465 $180,388,339
Walton 63.48% $316,331,449 $517,136,541 $200,805,092
Bradford* 44.25% $125,846,557 $181,537,045 $55,690,488SantaRosa 33.15% $682,672,506 $908,986,759 $226,314,253
County GDP % Change GDP 2003 GDP 2006 GDP Real Change
Walton 71.69% $751,857,495 $1,290,852,682 $538,995,187
Sumter 63.23% $634,055,442 $1,034,973,740 $400,918,298
Liberty* 58.48% $36,913,186 $58,498,877 $21,585,691
Suwannee 48.19% $362,706,983 $537,500,333 $174,793,350
Wakulla 42.16% $214,012,226 $304,232,446 $90,220,220Note: Shoreline counties highlighted in blue.
Table 4.6 Top Five Counties by Real Change
CountyEstablishments
Real ChangeEstablishments
2003Establishments
2006Establishment
% Change
Broward 7,013 55,633 62,646 12.61%
Palm Beach 6,860 41,724 48,584 16.44%
Orange 5,747 28,440 34,187 20.21%
Hillsborough 5,568 29,990 35,558 18.57%
Miami-Dade 4,631 78,963 83,594 5.86%
County
Employment
Real Change
Employment
2003
Employment
2006
Employment %
ChangeOrange 74,280 604,267 678,547 12.29%
Broward 67,279 679,649 746,928 9.90%
Palm Beach 53,728 507,836 561,564 10.58%
Hillsborough 46,660 592,799 639,459 7.87%
Miami-Dade 40,019 967,453 1,007,472 4.14%
* Totals do not include Public Administration because county data for that sector are not available fromBLS in useful form.
12

8/9/2019 Florida's Ocean and Coastal Economies Report Phase 2
http://slidepdf.com/reader/full/floridas-ocean-and-coastal-economies-report-phase-2 27/219
Establishments Establishments Establishments EstablishmentCounty Real Change 2003 2006 % Change
CountyWages Real
Change Wages 2003 Wages 2006Wages %Change
Miami-Dade $3,593,694,647 $33,385,154,936 $36,978,849,583 10.76%
Broward $3,496,434,270 $22,831,332,503 $26,327,766,773 15.31%
Orange $3,143,547,280 $19,575,051,161 $22,718,598,441 16.06%
Palm Beach $2,241,439,624 $17,877,340,999 $20,118,780,623 12.54%
Hillsborough $2,218,903,449 $19,839,780,747 $22,058,684,196 11.18%
CountyGDP RealChange GDP 2003 GDP 2006 GDP % Change
Miami-Dade $12,044,132,282 $83,005,023,786 $95,049,156,068 14.51%
Broward $11,084,886,265 $57,498,727,832 $68,583,614,097 19.28%
Orange $9,301,099,182 $46,317,027,183 $55,618,126,365 20.08%
Hillsborough $8,072,891,960 $49,623,045,643 $57,695,937,603 16.27%
Palm Beach $6,012,352,388 $43,476,759,483 $49,489,111,871 13.83%Note: Shoreline counties highlighted in blue.
The bottom five counties showing the smallest growth, and sometimes declines, areconsolidated in tables 4.7-4.8. Unlike the top five counties, which showed a significantdifference in counties that had strongest growth by percent change compared to realchange, these bottom counties are consistently low regardless of whether measured bypercent change or real change. This is due in part to most of the bottom five countiesexperiencing declines, which are negative regardless of how they are measured.However, some counties experienced drastic falls in particular aspects of their economy,leading to a strong decline in both real values and percent change. For instance, Putnamcounty saw a sharp fall in the Construction sector from 2003-2006, which led to theoverall losses seen in employment, wages, and GDP. Both shoreline counties, Franklinand Monroe, saw growth in all sectors but Education, which fell in both counties duringthis period. For additional information on counties not included in tables 4.5-4.8, seeAppendix A.
Table 4.7 Bottom Five Counties by Percent Change
CountyEstablishment
% ChangeEstablishments
2003Establishments
2006Establishments
Real Change
Monroe 3.01% 3,981 4,101 120
Hamilton 1.84% 217 221 4
Madison 1.42% 351 356 5
Franklin -1.44% 416 410 -6
Liberty* -2.04% 98 96 -2
CountyEmployment %
ChangeEmployment
2003Employment
2006EmploymentReal Change
Glades -1.33% 1,357 1,339 -18
Putnam -1.66% 19,219 18,900 -319
Madison -2.77% 5,093 4,952 -141
Monroe -4.34% 36,958 35,353 -1,605
Charlotte -11.84% 49,500 43,639 -5,861
13

8/9/2019 Florida's Ocean and Coastal Economies Report Phase 2
http://slidepdf.com/reader/full/floridas-ocean-and-coastal-economies-report-phase-2 28/219
CountyWages %Change Wages 2003 Wages 2006
Wages RealChange
Jackson 4.65% $338,535,945 $354,268,886 $15,732,941
Gadsden 4.37% $350,457,321 $365,759,813 $15,302,492
Madison 3.30% $106,572,640 $110,092,848 $3,520,208
Charlotte 1.60% $1,186,653,971 $1,205,614,757 $18,960,786
Putnam -1.20% $510,402,796 $504,260,494 ($6,142,302)
County GDP % Change GDP 2003 GDP 2006GDP RealChange
Charlotte 6.83% $2,245,478,258 $2,398,900,143 $153,421,885
Leon 6.57% $10,020,353,645 $10,678,433,147 $658,079,502
Calhoun* 3.87% $89,298,128 $92,754,913 $3,456,785
Putnam 2.51% $1,061,916,994 $1,088,610,228 $26,693,234
Hamilton 1.09% $119,396,808 $120,693,491 $1,296,683Note: Shoreline counties highlighted in blue.
Table 4.8 Bottom Five Counties by Real Change
CountyEstablishments
Real ChangeEstablishments
2003Establishments
2006Establishment
% Change
Lafayette 6 133 139 4.51%
Madison 5 351 356 1.42%
Hamilton 4 217 221 1.84%
Liberty* -2 98 96 -2.04%
Franklin -6 416 410 -1.44%
CountyEmployment Real
ChangeEmployment
2003Employment
2006Employment %
Change
Glades -18 1,357 1,339 -1.33%
Madison -141 5,093 4,952 -2.77%
Putnam -319 19,219 18,900 -1.66%
Monroe -1,605 36,958 35,353 -4.34%
Charlotte -5,861 49,500 43,639 -11.84%
CountyWages Real
Change Wages 2003 Wages 2006Wages %Change
Franklin $8,438,278 $69,523,674 $77,961,952 12.14%
Glades $6,231,603 $29,464,529 $35,696,132 21.15%
Madison $3,520,208 $106,572,640 $110,092,848 3.30%
Lafayette $2,145,640 $34,969,492 $37,115,132 6.14%
Putnam ($6,142,302) $510,402,796 $504,260,494 -1.20%
CountyGDP RealChange GDP 2003 GDP 2006 GDP % Change
Glades $16,519,303 $48,944,399 $65,463,702 33.75%Madison $15,065,484 $197,911,128 $212,976,612 7.61%
Lafayette $9,840,419 $80,196,239 $90,036,658 12.27%
Calhoun* $3,456,785 $89,298,128 $92,754,913 3.87%
Hamilton $1,296,683 $119,396,808 $120,693,491 1.09%Note: Shoreline counties highlighted in blue.
14

8/9/2019 Florida's Ocean and Coastal Economies Report Phase 2
http://slidepdf.com/reader/full/floridas-ocean-and-coastal-economies-report-phase-2 29/219
Table 4.9 displays the most recent 2006 values for employment, wages, and GDP, as wellas both average wage and average contribution to GDP per employee for each county.
Table 4.9 Florida County Comparisons of Economic Indicators, 2006
County Employment Wages
Avg. Wageper
Employee GDP
Avg.Contribution to
GDP perEmployee
Alachua 124,818 $3,703,063,276 $29,668 $6,401,714,619 $51,288
Baker*
6,540 $153,832,698 $23,522 $232,217,183 $35,507
Bay 73,069 $2,079,693,284 $28,462 $4,897,986,202 $67,032
Bradford* 7,238 $181,537,045 $25,081 $262,641,142 $36,286
Brevard 207,781 $7,058,910,011 $33,973 $16,081,775,779 $77,398
Broward 746,928 $26,327,766,773 $35,248 $68,583,614,097 $91,821
Calhoun* 2,891 $65,892,453 $22,792 $92,754,913 $32,084
Charlotte 43,639 $1,205,614,757 $27,627 $2,398,900,143 $54,971
Citrus 33,923 $909,883,233 $26,822 $1,887,026,545 $55,627
Clay 44,792 $1,165,825,399 $26,028 $2,248,684,564 $50,203
Collier 134,891 $4,529,338,578 $33,578 $10,777,234,315 $79,896Columbia 21,674 $580,744,104 $26,795 $1,193,696,373 $55,075
DeSoto 9,062 $216,482,545 $23,889 $543,967,041 $60,027
Dixie 2,794 $65,060,027 $23,286 $136,396,134 $48,818
Duval 461,726 $16,649,684,731 $36,060 $44,625,799,157 $96,650
Escambia 129,644 $3,735,416,044 $28,813 $8,579,697,747 $66,179
Flagler 18,792 $487,003,195 $25,915 $1,179,088,850 $62,744
Franklin 3,373 $77,961,952 $23,114 $210,200,513 $62,319
Gadsden 14,947 $365,759,813 $24,470 $639,100,359 $42,758
Gilchrist* 2,603 $57,816,528 $22,211 $102,113,555 $39,229
Glades 1,339 $35,696,132 $26,659 $65,463,702 $48,890
Gulf 4,181 $106,936,502 $25,577 $261,469,177 $62,537
Hamilton 3,636 $113,030,013 $31,086 $120,693,491 $33,194
Hardee 8,218 $186,300,446 $22,670 $404,281,617 $49,195
Hendry 12,309 $301,012,228 $24,455 $680,276,374 $55,267
Hernando 40,029 $990,885,229 $24,754 $2,117,575,206 $52,901
Highlands 28,666 $673,680,685 $23,501 $1,483,787,259 $51,761
Hillsborough 639,459 $22,058,684,196 $34,496 $57,695,937,603 $90,226
Holmes 3,544 $77,592,059 $21,894 $168,759,837 $47,618
Indian River 50,027 $1,445,071,659 $28,886 $3,379,419,634 $67,552
Jackson 14,755 $354,268,886 $24,010 $832,975,456 $56,454
Jefferson 3,212 $77,194,135 $24,033 $184,050,515 $57,301
Lafayette 1,689 $37,115,132 $21,975 $90,036,658 $53,308
Lake 83,915 $2,311,951,430 $27,551 $5,235,571,465 $62,391Lee 224,141 $7,092,817,944 $31,644 $16,619,715,374 $74,148
Leon 146,206 $4,497,701,522 $30,763 $10,678,433,147 $73,037
Levy 9,033 $201,570,521 $22,315 $453,207,016 $50,172
Liberty* 2,534 $68,891,679 $27,187 $58,498,877 $23,086
Madison 4,952 $110,092,848 $22,232 $212,976,612 $43,008
* Totals do not include Public Administration because county data for that sector are not available fromBLS in useful form.
15
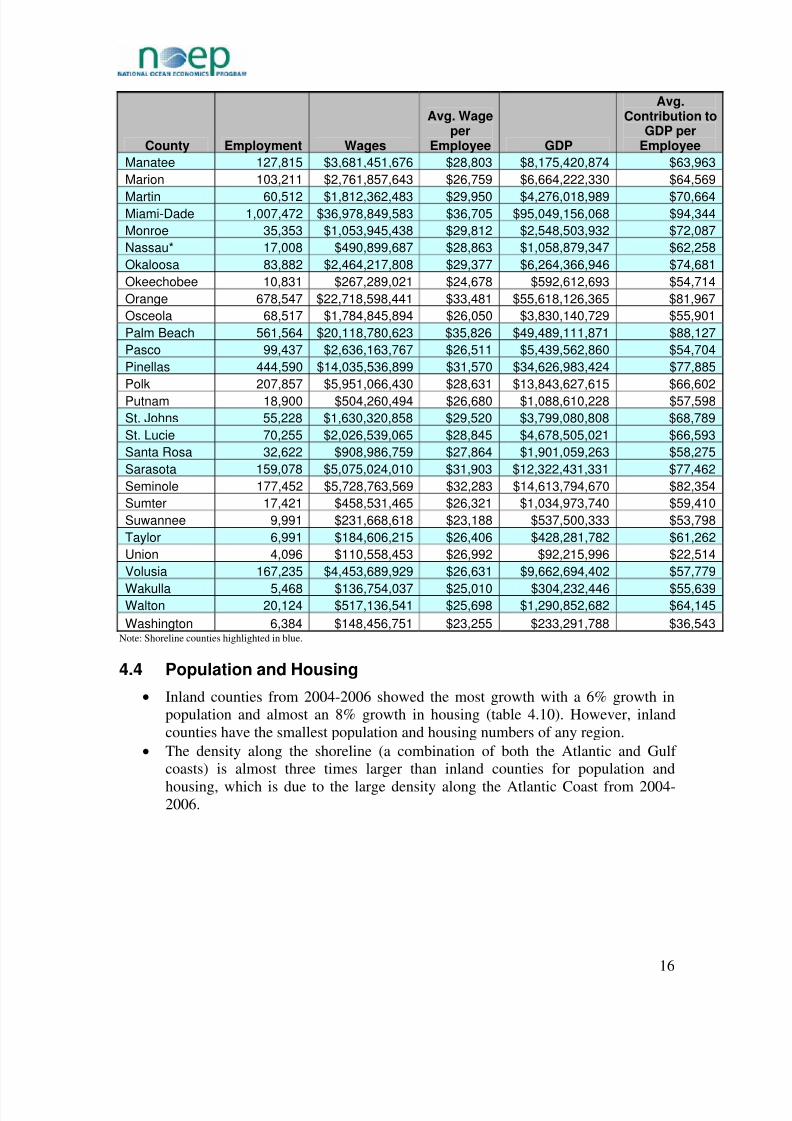
8/9/2019 Florida's Ocean and Coastal Economies Report Phase 2
http://slidepdf.com/reader/full/floridas-ocean-and-coastal-economies-report-phase-2 30/219
County Employment Wages
Avg. Wageper
Employee
Avg.Contribution to
GDP perGDP Employee
Manatee 127,815 $3,681,451,676 $28,803 $8,175,420,874 $63,963
Marion 103,211 $2,761,857,643 $26,759 $6,664,222,330 $64,569
Martin 60,512 $1,812,362,483 $29,950 $4,276,018,989 $70,664Miami-Dade 1,007,472 $36,978,849,583 $36,705 $95,049,156,068 $94,344
Monroe 35,353 $1,053,945,438 $29,812 $2,548,503,932 $72,087
Nassau* 17,008 $490,899,687 $28,863 $1,058,879,347 $62,258
Okaloosa 83,882 $2,464,217,808 $29,377 $6,264,366,946 $74,681
Okeechobee 10,831 $267,289,021 $24,678 $592,612,693 $54,714
Orange 678,547 $22,718,598,441 $33,481 $55,618,126,365 $81,967
Osceola 68,517 $1,784,845,894 $26,050 $3,830,140,729 $55,901
Palm Beach 561,564 $20,118,780,623 $35,826 $49,489,111,871 $88,127
Pasco 99,437 $2,636,163,767 $26,511 $5,439,562,860 $54,704
Pinellas 444,590 $14,035,536,899 $31,570 $34,626,983,424 $77,885
Polk 207,857 $5,951,066,430 $28,631 $13,843,627,615 $66,602
Putnam 18,900 $504,260,494 $26,680 $1,088,610,228 $57,598
St. Johns 55,228 $1,630,320,858 $29,520 $3,799,080,808 $68,789
St. Lucie 70,255 $2,026,539,065 $28,845 $4,678,505,021 $66,593
Santa Rosa 32,622 $908,986,759 $27,864 $1,901,059,263 $58,275
Sarasota 159,078 $5,075,024,010 $31,903 $12,322,431,331 $77,462
Seminole 177,452 $5,728,763,569 $32,283 $14,613,794,670 $82,354
Sumter 17,421 $458,531,465 $26,321 $1,034,973,740 $59,410
Suwannee 9,991 $231,668,618 $23,188 $537,500,333 $53,798
Taylor 6,991 $184,606,215 $26,406 $428,281,782 $61,262
Union 4,096 $110,558,453 $26,992 $92,215,996 $22,514
Volusia 167,235 $4,453,689,929 $26,631 $9,662,694,402 $57,779
Wakulla 5,468 $136,754,037 $25,010 $304,232,446 $55,639Walton 20,124 $517,136,541 $25,698 $1,290,852,682 $64,145
Washington 6,384 $148,456,751 $23,255 $233,291,788 $36,543Note: Shoreline counties highlighted in blue.
4.4 Population and Housing
• Inland counties from 2004-2006 showed the most growth with a 6% growth inpopulation and almost an 8% growth in housing (table 4.10). However, inlandcounties have the smallest population and housing numbers of any region.
• The density along the shoreline (a combination of both the Atlantic and Gulf coasts) is almost three times larger than inland counties for population and
housing, which is due to the large density along the Atlantic Coast from 2004-2006.
16

8/9/2019 Florida's Ocean and Coastal Economies Report Phase 2
http://slidepdf.com/reader/full/floridas-ocean-and-coastal-economies-report-phase-2 31/219
Table 4.10 Florida’s Regional Population and Housing 2004-2006
2004
Population
2004
Density
2006
Population
2006
Density
Population
Growth
2004
Housing
2004
Density
2006
Housing
2006
Density
Housin
Growth
Shoreline 13,307,295 444 13,786,323 460 3.6% 6,232,373 208 6,619,117 221 6.2
Inland 4,059,298 169 4,303,565 180 6.0% 1,777,632 74 1,914,302 80 7.7
Atlantic 7,938,989 697 8,173,987 717 3.0% 3,506,681 308 3,697,572 324 5.4Gulf 5,368,306 289 5,612,336 302 4.6% 2,725,692 146.8 2,921,545 157 7.2
Florida 17,366,593 322 18,089,888 336 4.2% 8,010,005 149 8,533,419 158 6.5
Region
Population Housing
• The shoreline showed the least growth in comparison to the overall state andinland counties, but accounts for the majority of Florida’s population at 76% from2004 to 2006 (table 4.11).
• The Atlantic Coast has about 45% of the population, while the Gulf Coast has31%, and the inland counties region has almost 24% from 2004 to 2006.
Table 4.11 Distribution of Florida’s Population, 2006
Region Population Percent
Shoreline 13,786,323 76.2%Inland 4,303,565 23.8%
Atlantic 8,173,987 45.2%
Gulf 5,612,336 31.0%
• The majority, almost 78%, of Florida’s housing is also along the shorelinecounties, while only 22% are in inland counties from 2004 to 2006 (table 4.12).
• About 43% of the housing exists along the Atlantic Coast from 2004 to 2006,whereas about 34% is along the Gulf Coast.
Table 4.12 Distribution of Florida’s Housing, 2006
Region Housing Percent
Shoreline 6,619,117 77.6%
Inland 1,914,302 22.4%
Atlantic 3,697,572 43.3%
Gulf 2,921,545 34.2%
Population and Housing by County
• Most counties experienced a growth in population from 2004-2006, but fivecounties experienced a negative growth (Pinellas at -0.2%, Escambia at -0.2%,Okaloosa at -0.2%, Charlotte at -1.7%, and Monroe at -4.1%), as shown in Table4.13.
• Nine counties experienced a population growth of at least 10% (Lee, Pasco, Lake,St. Lucie, Osceola, St. Johns, Hernando, Flagler, and Sumter).
• Flagler experienced the highest population growth at almost 21% and Sumter, thenext highest, at about 14%.
17
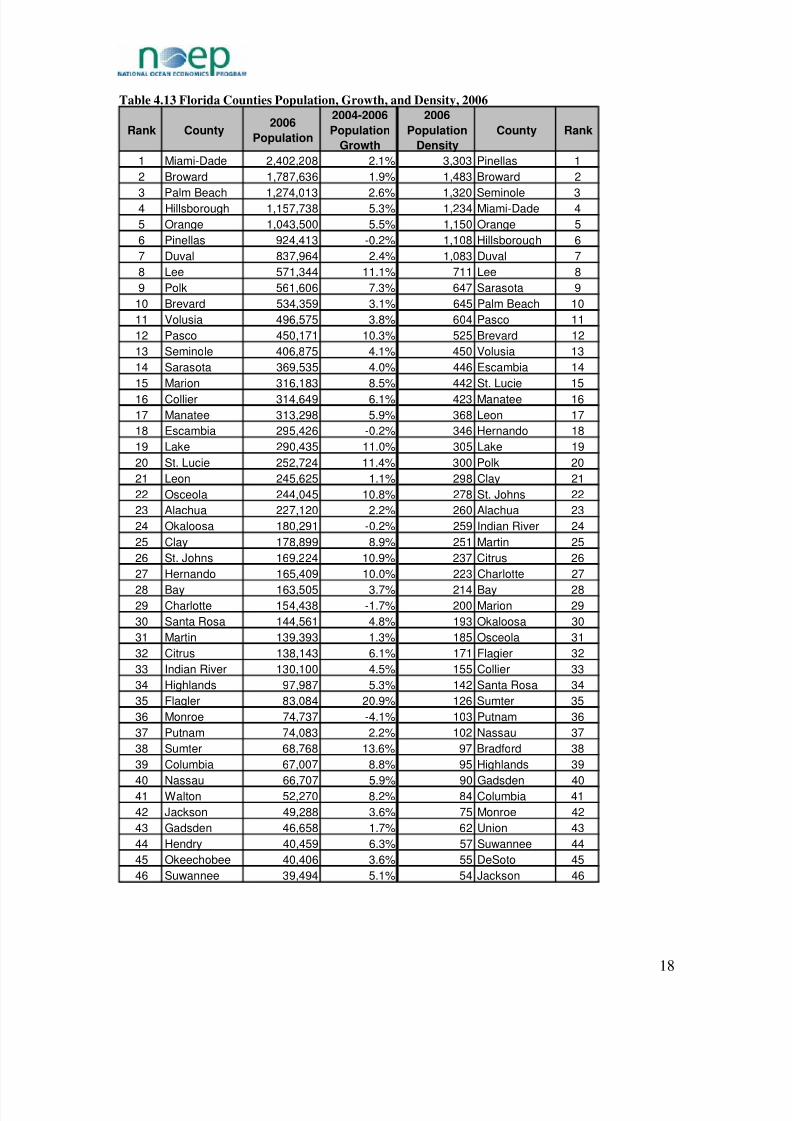
8/9/2019 Florida's Ocean and Coastal Economies Report Phase 2
http://slidepdf.com/reader/full/floridas-ocean-and-coastal-economies-report-phase-2 32/219
Table 4.13 Florida Counties Population, Growth, and Density, 2006
Rank County2006
Population
2004-2006
Population
Growth
2006
Population
Density
County Rank
1 Miami-Dade 2,402,208 2.1% 3,303 Pinellas 1
2 Broward 1,787,636 1.9% 1,483 Broward 2
3 Palm Beach 1,274,013 2.6% 1,320 Seminole 34 Hillsborough 1,157,738 5.3% 1,234 Miami-Dade 4
5 Orange 1,043,500 5.5% 1,150 Orange 5
6 Pinellas 924,413 -0.2% 1,108 Hillsborough 6
7 Duval 837,964 2.4% 1,083 Duval 7
8 Lee 571,344 11.1% 711 Lee 8
9 Polk 561,606 7.3% 647 Sarasota 9
10 Brevard 534,359 3.1% 645 Palm Beach 10
11 Volusia 496,575 3.8% 604 Pasco 11
12 Pasco 450,171 10.3% 525 Brevard 12
13 Seminole 406,875 4.1% 450 Volusia 13
14 Sarasota 369,535 4.0% 446 Escambia 14
15 Marion 316,183 8.5% 442 St. Lucie 15
16 Collier 314,649 6.1% 423 Manatee 16
17 Manatee 313,298 5.9% 368 Leon 17
18 Escambia 295,426 -0.2% 346 Hernando 18
19 Lake 290,435 11.0% 305 Lake 19
20 St. Lucie 252,724 11.4% 300 Polk 20
21 Leon 245,625 1.1% 298 Clay 21
22 Osceola 244,045 10.8% 278 St. Johns 22
23 Alachua 227,120 2.2% 260 Alachua 23
24 Okaloosa 180,291 -0.2% 259 Indian River 24
25 Clay 178,899 8.9% 251 Martin 25
26 St. Johns 169,224 10.9% 237 Citrus 26
27 Hernando 165,409 10.0% 223 Charlotte 27
28 Bay 163,505 3.7% 214 Bay 2829 Charlotte 154,438 -1.7% 200 Marion 29
30 Santa Rosa 144,561 4.8% 193 Okaloosa 30
31 Martin 139,393 1.3% 185 Osceola 31
32 Citrus 138,143 6.1% 171 Flagier 32
33 Indian River 130,100 4.5% 155 Collier 33
34 Highlands 97,987 5.3% 142 Santa Rosa 34
35 Flagler 83,084 20.9% 126 Sumter 35
36 Monroe 74,737 -4.1% 103 Putnam 36
37 Putnam 74,083 2.2% 102 Nassau 37
38 Sumter 68,768 13.6% 97 Bradford 38
39 Columbia 67,007 8.8% 95 Highlands 39
40 Nassau 66,707 5.9% 90 Gadsden 4041 Walton 52,270 8.2% 84 Columbia 41
42 Jackson 49,288 3.6% 75 Monroe 42
43 Gadsden 46,658 1.7% 62 Union 43
44 Hendry 40,459 6.3% 57 Suwannee 44
45 Okeechobee 40,406 3.6% 55 DeSoto 45
46 Suwannee 39,494 5.1% 54 Jackson 46
18
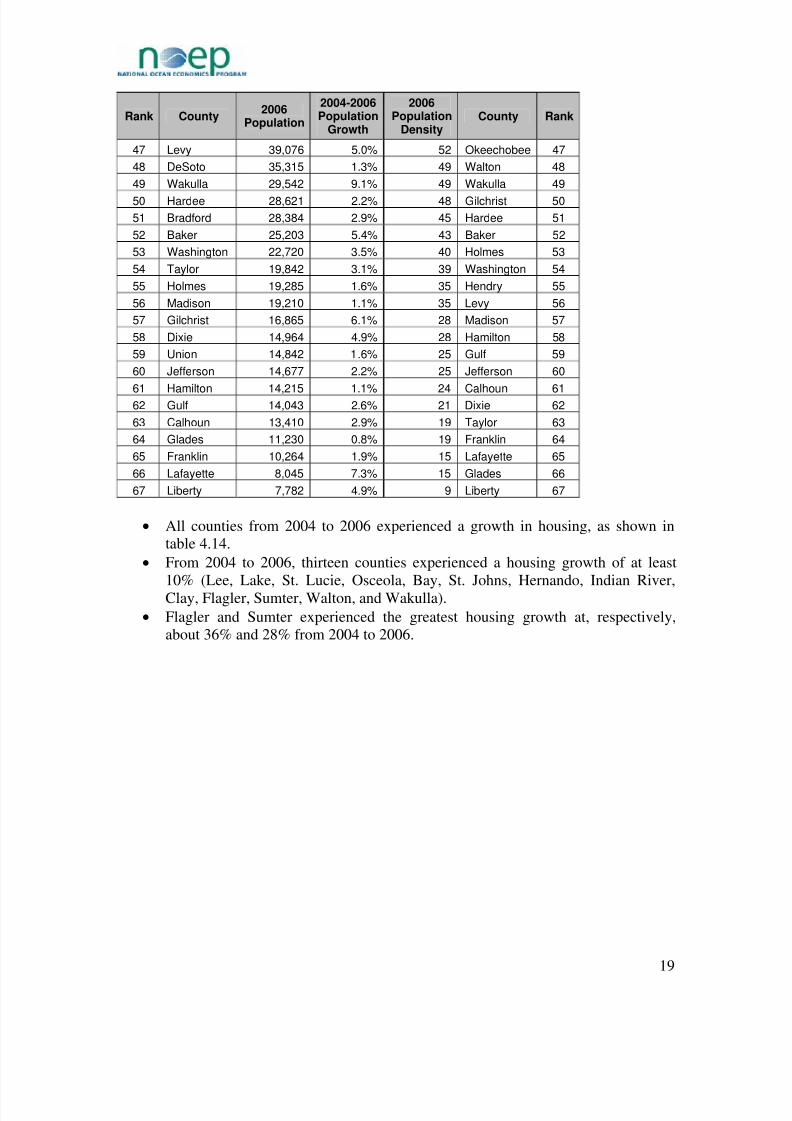
8/9/2019 Florida's Ocean and Coastal Economies Report Phase 2
http://slidepdf.com/reader/full/floridas-ocean-and-coastal-economies-report-phase-2 33/219
Rank County2006
Population
2004-2006Population
Growth
2006Population
DensityCounty Rank
47 Levy 39,076 5.0% 52 Okeechobee 47
48 DeSoto 35,315 1.3% 49 Walton 48
49 Wakulla 29,542 9.1% 49 Wakulla 49
50 Hardee 28,621 2.2% 48 Gilchrist 50
51 Bradford 28,384 2.9% 45 Hardee 51
52 Baker 25,203 5.4% 43 Baker 52
53 Washington 22,720 3.5% 40 Holmes 53
54 Taylor 19,842 3.1% 39 Washington 54
55 Holmes 19,285 1.6% 35 Hendry 55
56 Madison 19,210 1.1% 35 Levy 56
57 Gilchrist 16,865 6.1% 28 Madison 57
58 Dixie 14,964 4.9% 28 Hamilton 58
59 Union 14,842 1.6% 25 Gulf 59
60 Jefferson 14,677 2.2% 25 Jefferson 60
61 Hamilton 14,215 1.1% 24 Calhoun 6162 Gulf 14,043 2.6% 21 Dixie 62
63 Calhoun 13,410 2.9% 19 Taylor 63
64 Glades 11,230 0.8% 19 Franklin 64
65 Franklin 10,264 1.9% 15 Lafayette 65
66 Lafayette 8,045 7.3% 15 Glades 66
67 Liberty 7,782 4.9% 9 Liberty 67
• All counties from 2004 to 2006 experienced a growth in housing, as shown intable 4.14.
• From 2004 to 2006, thirteen counties experienced a housing growth of at least10% (Lee, Lake, St. Lucie, Osceola, Bay, St. Johns, Hernando, Indian River,Clay, Flagler, Sumter, Walton, and Wakulla).
• Flagler and Sumter experienced the greatest housing growth at, respectively,about 36% and 28% from 2004 to 2006.
19

8/9/2019 Florida's Ocean and Coastal Economies Report Phase 2
http://slidepdf.com/reader/full/floridas-ocean-and-coastal-economies-report-phase-2 34/219
Table 4.14 Florida Counties Housing, Growth, and Density, 2006
Rank County2006
Housing
2004-2006
Housing
Growth
2006
Housing
Density
County Rank
1 Miami-Dade 953,025 5.0% 1,781 Pinellas 1
2 Broward 796,539 1.8% 661 Broward 2
3 Palm Beach 631,100 4.2% 552 Seminole 34 Hillsborough 505,654 5.9% 491 Duval 4
5 Pinellas 498,415 1.3% 490 Miami-Dade 5
6 Orange 440,120 7.4% 485 Orange 6
7 Duval 379,564 6.1% 481 Hillsborough 7
8 Lee 341,150 16.5% 425 Lee 8
9 Polk 269,410 9.2% 380 Sarasota 9
10 Brevard 260,634 7.0% 320 Palm Beach 10
11 Volusia 243,403 5.5% 286 Pasco 11
12 Sarasota 216,932 7.7% 256 Brevard 12
13 Pasco 212,939 9.6% 225 Manatee 13
14 Collier 187,606 7.5% 221 Volusia 14
15 Seminole 169,989 4.8% 219 St. Lucie 15
16 Manatee 166,330 7.7% 207 Escambia 16
17 Marion 152,854 8.9% 179 Leon 17
18 Escambia 136,861 3.7% 162 Hernando 18
19 Lake 134,120 10.3% 147 Indian River 19
20 St. Lucie 125,530 16.1% 144 Polk 20
21 Leon 119,420 5.2% 141 Lake 21
22 Osceola 109,892 17.7% 139 Charlotte 22
23 Alachua 106,752 4.0% 135 Martin 23
24 Charlotte 96,051 9.2% 132 St. Johns 24
25 Bay 95,105 10.6% 126 Citrus 25
26 Okaloosa 91,239 7.3% 125 Bay 26
27 St. Johns 80,369 14.9% 122 Alachua 27
28 Hernando 77,411 10.6% 116 Clay 2829 Martin 74,894 4.6% 98 Okaloosa 29
30 Indian River 74,158 11.9% 97 Marion 30
31 Citrus 73,613 8.9% 96 Flagier 31
32 Clay 69,535 11.3% 93 Collier 32
33 Santa Rosa 58,038 5.9% 83 Osceola 33
34 Monroe 53,395 1.6% 75 Sumter 34
35 Highlands 53,116 4.3% 57 Santa Rosa 35
36 Flagler 46,652 36.3% 54 Monroe 36
37 Sumter 40,667 28.2% 52 Highlands 37
38 Walton 40,042 14.8% 49 Putnam 38
39 Putnam 35,264 1.6% 49 Nassau 39
40 Nassau 31,704 9.2% 38 Walton 4041 Columbia 25,530 3.9% 36 Gadsden 41
42 Jackson 20,474 1.7% 34 Bradford 42
43 Gadsden 18,488 2.5% 32 Columbia 43
44 Levy 17,763 3.7% 24 Suwannee 44
45 Suwannee 16,557 2.6% 23 DeSoto 45
46 Okeechobee 16,385 2.4% 22 Jackson 46
20

8/9/2019 Florida's Ocean and Coastal Economies Report Phase 2
http://slidepdf.com/reader/full/floridas-ocean-and-coastal-economies-report-phase-2 35/219
Rank County2006
Housing
2004-2006
Housing
Growth
2006
Housing
Density
County Rank
47 DeSoto 14,349 2.3% 21 Okeechobee 47
48 Hendry 13,081 4.4% 21 Wakulla 48
49 Wakulla 12,652 10.2% 18 Gilchrist 49
50 Hardee 10,307 1.9% 17 Washington 5051 Bradford 10,038 1.9% 17 Holmes 51
52 Taylor 10,015 1.9% 16 Union 52
53 Washington 9,963 1.5% 16 Hardee 53
54 Baker 8,557 6.0% 16 Levy 54
55 Gulf 8,525 2.5% 15 Gulf 55
56 Franklin 8,294 6.1% 15 Franklin 56
57 Holmes 8,267 1.3% 15 Baker 57
58 Madison 8,167 1.8% 12 Madison 58
59 Dixie 7,810 3.4% 11 Hendry 59
60 Gilchrist 6,404 3.5% 11 Dixie 60
61 Glades 6,024 2.5% 10 Hamilton 61
62 Jefferson 5,705 3.7% 10 Calhoun 62
63 Calhoun 5,430 1.8% 10 Taylor 63
64 Hamilton 5,171 1.6% 10 Jefferson 64
65 Union 3,926 2.1% 8 Glades 65
66 Liberty 3,242 1.2% 5 Lafayette 66
67 Lafayette 2,803 2.1% 4 Liberty 67
Florida Versus Other Coastal States
• Compared to other coastal states, from 2004 to 2006, Florida ranks third in coastalpopulation and thirteenth in coastal density (table 4.15).
21

8/9/2019 Florida's Ocean and Coastal Economies Report Phase 2
http://slidepdf.com/reader/full/floridas-ocean-and-coastal-economies-report-phase-2 36/219
Table 4.15 Coastal States Coastal Population and Density, 2006
Rank State PopulationCoastal %
of State
Coastal
LandDensity State Rank
1 California 27,413,266 75.2% 1,393 4,308 Illinois 1
2 New York 16,395,253 84.9% 1,729 1,682 Pennsylvania 2
3 Florida 13,786,323 76.2% 5,639 1,390 New Jersey 3
4 New Jersey 7,836,314 89.8% 3,546 1,363 Massachusetts 45 Illinois 6,001,731 46.8% 1,045 1,022 Rhode Island 5
6 Texas 5,836,084 24.8% 2,267 959 Connecticut 6
7 Michigan 5,061,154 50.1% 19,066 860 New York 7
8 Massachusetts 4,834,910 75.1% 3,758 719 Ohio 8
9 Virginia 4,826,364 63.1% 39,094 701 California 9
10 Washington 4,390,189 68.6% 6,383 591 Maryland 10
11 Maryland 3,771,508 67.2% 8,826 547 Virginia 11
12 Pennsylvania 2,907,406 23.4% 1,513 505 Indiana 12
13 Ohio 2,702,365 23.5% 29,971 460 Florida 13
14 Connecticut 2,172,751 62.0% 1,954 437 Delaware 14
15 Wisconsin 2,008,814 36.2% 1,064 391 New Hampshire 15
16 Louisiana 1,927,769 45.0% 15,091 387 Texas 16
17 Oregon 1,449,526 39.2% 18,884 232 Washington 17
18 Hawaii 1,285,498 100.0% 2,829 203 Alabama 18
19 South Carolina 1,105,852 25.6% 6,423 200 Hawaii 19
20 Rhode Island 1,067,610 100.0% 1,785 192 Mississippi 20
21 Maine 984,045 74.5% 10,525 191 Wisconsin 21
22 North Carolina 904,994 10.2% 6,839 162 South Carolina 22
23 Delaware 853,476 100.0% 31,422 161 Michigan 23
24 Indiana 764,786 12.1% 13,002 148 Louisiana 24
25 Georgia 579,544 6.2% 5,635 103 Georgia 25
26 Alabama 573,319 12.5% 9,361 97 North Carolina 26
27 Alaska 568,836 84.9% 12,051 82 Maine 27
28 New Hampshire 416,257 31.7% 19,241 75 Oregon 28
29 Mississippi 342,873 11.8% 10,635 23 Minnesota 2930 Minnesota 246,478 4.8% 381,120 1 Alaska 30
United States 123,015,295 41.1% 696,046.2 177 United States
• Florida ranks second in coastal housing compared to other coastal states from2004 to 2006, but twelfth in housing density (table 4.16).
22

8/9/2019 Florida's Ocean and Coastal Economies Report Phase 2
http://slidepdf.com/reader/full/floridas-ocean-and-coastal-economies-report-phase-2 37/219
Table 4.16 Coastal States Coastal Housing and Density, 2006
Rank State HousingCoastal %
of State
Coastal
LandDensity State Rank
1 .California 9,913,634 75.2% 1,393 1,728 .Illinois 1
2 .Florida 6,619,117 77.6% 1,729 716 .Pennsylvania 2
3 .New York 6,564,182 83.0% 3,546 577 .Massachusetts 3
4 .New Jersey 3,135,491 90.3% 5,639 556 .New Jersey 45 .Illinois 2,408,051 46.3% 1,045 430 .Rhode Island 5
6 .Texas 2,294,597 24.9% 2,267 391 .Connecticut 6
7 .Michigan 2,281,218 50.5% 19,066 344 .New York 7
8 .Massachusetts 2,045,098 75.5% 3,758 328 .Ohio 8
9 .Virginia 1,982,024 61.3% 39,094 254 .California 9
10 .Washington 1,888,349 70.0% 6,383 248 .Maryland 10
11 .Maryland 1,580,664 68.7% 8,826 225 .Virginia 11
12 .Pennsylvania 1,237,610 22.7% 29,971 221 .Florida 12
13 .Ohio 1,231,103 24.4% 1,513 212 .Indiana 13
14 .Wisconsin 909,086 35.9% 1,954 196 .Delaware 14
15 .Connecticut 885,192 61.8% 1,064 162 .New Hampshire 15
16 .Louisiana 808,512 44.2% 15,091 152 .Texas 16
17 .Oregon 619,471 39.0% 18,884 100 .Washington 17
18 .South Carolina 570,681 28.9% 2,829 97 .Alabama 18
19 .Maine 506,549 73.3% 1,785 88 .Mississippi 19
20 .Hawaii 500,036 100.0% 10,525 86 .Wisconsin 20
21 .North Carolina 486,320 12.1% 6,839 83 .South Carolina 21
22 .Rhode Island 449,582 100.0% 6,423 78 .Hawaii 22
23 .Delaware 382,828 100.0% 31,422 73 .Michigan 23
24 .Indiana 320,338 11.6% 13,002 62 .Louisiana 24
25 .Alabama 273,054 12.9% 9,361 52 .North Carolina 25
26 .Georgia 253,611 6.5% 5,635 45 .Georgia 26
27 .Alaska 233,615 84.5% 12,051 42 .Maine 27
28 .New Hampshire 172,552 29.3% 19,241 32 .Oregon 28
29 .Mississippi 156,506 12.6% 10,635 12 .Minnesota 2930 .Minnesota 127,552 5.6% 381,120 1 .Alaska 30
United States 50,836,623 40.2% 672,090 76 United States
4.5 Conclusion
While this update provides the current values, and changes from the 2003 values in thePhase I report, the overall change during the time period of available data was notnoteworthy. However, some counties showed significant growth; most notably the inlandcounties, which had less established economies and base populations from which togrow. Other counties, typically urban shoreline counties, showed small percentage
growth in their economies, population, and housing. This was due to the mature nature of these communities; they have established bases of population and housing and theireconomies are already some of the largest in the state.
In 2006, the Florida Coastal Economy GDP was $562B, 82% of the state total. Density of both population and housing in 2006 along the shoreline of Florida was almost threetimes greater than inland counties. The shoreline counties made up 76% of the statepopulation (13.8M people) and 78% of state housing (6.6M housing units).
23

8/9/2019 Florida's Ocean and Coastal Economies Report Phase 2
http://slidepdf.com/reader/full/floridas-ocean-and-coastal-economies-report-phase-2 38/219

8/9/2019 Florida's Ocean and Coastal Economies Report Phase 2
http://slidepdf.com/reader/full/floridas-ocean-and-coastal-economies-report-phase-2 39/219
Part III — Ocean Economy: Sector Supplements
The Ocean Economy includes those economic sectors that are directly dependent uponthe ocean. In Phase I, the NOEP reported the status of four economic indicators for
Florida – establishments, employment, wages and GDP for six sectors: Coastal Tourism,Marine Transportation, Fishing, Coastal Construction, Offshore Minerals, and Ship andBoat Building and Repair. These also included basic production data for fisheries as partof the Fishing sector. Chapter 4 of this report provided a summary update for those Oceansectors, using the same indicators in Phase I as context for the remaining part of thePhase II Report. Phase II goes beyond what was presented in Phase I without repeating,but rather expands those sectors and adds two new ones – Real Estate values, and MarineResearch and Education. The last two fall outside the statistical framework of theNational Income and Product Accounts used for the other NOEP industrial sectors, so theNOEP has created a template that allows comparisons among other states for these newsectors, but not among sectors; Research and Education sector. The Real Estate sector
measures property values and uses, comparing shoreline with inland values to reflect thevalue added by proximity to the oceans; only employment and wages are comparable tothe other sectors in the Marine . .Expanded sectors for Phase II include A) Chapter 5:detailed fishing industry indicators that reflect changes over time and trends andopportunities; B) Marine Transportation data reflecting trade patterns and valuesaccording to geographies and cargo, providing counties increased indicators that reflecttheir economic engines; C) Coastal Tourism and Recreation: Passenger and revenuedata from the Cruise Industry which has a dominant role in Florida’s economy, but is nota direct addition to the estimates from Phase I, just a different way of measuring impactswith additional data; D) Marine Construction: detailed beach nourishment data anddredging information to enhance the estimates from Phase I.
25

8/9/2019 Florida's Ocean and Coastal Economies Report Phase 2
http://slidepdf.com/reader/full/floridas-ocean-and-coastal-economies-report-phase-2 40/219
Chapter 5 Fishing Industry
5.1 Fishing Industry Overview
Florida’s fishing industry has two primary industries: commercial fisheries (seafood and
wild ornamental collection) and recreational fishing. There are also important freshwaterand saltwater aquaculture sectors. Also included in this chapter are detailed data forseafood processing, and seafood imports and exports. Imports and exports were added todemonstrate the difference in the scale of volume between domestically harvested andimported commercial species and to explain the changes in the seafood processingindustry, which processes both domestically harvested and imported fish.
Data on employment in the commercial fishing industry is not available for Florida, as isthe case for most other states. As a proxy for employment, this section presents data oncommercial fishing licenses for salt water use.
In contrast to commercial fishing, where the initial “value” of production (dockside valueand value of output from the processing industry) is determined through on-going datacollection programs, the economic activity associated with recreational fishing ismeasured through periodic surveys of marine sports fishing participants. The recreational“value” (or expenditures) is generated through data collected by these surveys whichdescribe the number of days spent fishing and the expenditures by recreational anglers forfood, bait, boats, etc. These recreational-oriented expenditure measures are notconsistent with the dockside and processed value measures for the commercial industry,so it is not possible to add the two together to obtain a "total economic value" for allfishing activities.
Historically, Florida has been a top marine recreational fishing and seafood producingstate. Resident and out-of-state anglers are enjoying the abundance of Florida waters inrecord numbers, and marine seafood landing values consistently place Florida among thetop ten states. Highlights from the collected data follow.
• Commercial Fisheries – Though historically an important source of domestic seafoodproducts for the U.S. market, the volume and value of landings by the commercialfishing industry has declined during the past decade, partly due to reduced fish stocks,as well as management decisions concerning gear and catch limitations.o Commercial saltwater landings generated $143M in inflation-adjusted dockside
sales in 2007, compared to $247.5M in 1990
o Annual commercial saltwater landings dropped 66% by weight (181.6M poundsto 80.1M pounds) and 56% ($247.5M to $143M)7 in constant value8 between1990 and 2007.
7 Florida Fish and Wildlife Conservation Commission. Commercial F isheries Landings in Florida.
http://floridamarine.org/features/view_article.asp?id=19224
8 Values expressed in constant 2000 dollars are deflated by consumer price index.
26

8/9/2019 Florida's Ocean and Coastal Economies Report Phase 2
http://slidepdf.com/reader/full/floridas-ocean-and-coastal-economies-report-phase-2 41/219
o Commercial ornamental harvests (ornamental fish, invertebrates, rock and sand,and marine plants), while small in value compared to seafood landings, continueto represent an important component of the overall commercial fisheries harvestindustry.
o Commercial fishing licenses dropped by 38% between FY 1995 and FY 2006,
probably tracking the decline in catch.o Aquaculture contributed $100M (nominal) in 2003 sales, but only a small portion
was devoted to edible products, with the major component represented bycultured, freshwater, ornamental fish.
o Hard clams reported considerable growth between 1995 and 2005:$10.7M in sales by 153 growers in 2005 versus 1995 sales of $5.41M by142 growers.
o Cultured oysters reported sales of $0.9M during 2005 with little if anygrowth. Though most oysters are harvested from public beds, some oysterculture is currently being conducted on several shellfish leases located inApalachicola Bay (Floridaaquaculture.com).
o
Aside from hard clam culture, the edible seafood component of the Floridaaquaculture industry has not shown much growth and has recently beenshown to be very susceptible to hurricane-related damage.
• Recreational Fisheries – With a stable record of economic contribution, saltwaterrecreational fishing has been valuable to Florida’s Ocean Economy.o ~2M saltwater anglers contributed $3B in retail sales in 2006 making Florida first
in the nation in both categories.o >180M fish landed in 2006, making Florida the number one recreational fishing
state in the United States in terms of numbers of fish caught.o Number of fishing licenses and permits grew at an annual rate of 3.1%, from 1M
in 2004 to 1.1M in 2007, and annual revenue from sales grew 4.3% from $14.8M
to $17M.• Seafood Processing, Imports and Exports – Though Florida’s commercial landings
and processed seafood value declined between 1990 and 2007, seafood imports andexports increased.o Seafood Imports totaled $2.1B in 2007, an annual growth of 5.7% since 1990.o Seafood Exports were $89.1B in 2007, an annual rate of 6.4% since 1990.o Seafood Re-Exports (imports that are exported without processing) grew 10.9%
annually since 1990, worth $15.7B in 2007.o Number of seafood processors and wholesale plants declined by 30% since 1990.
Employment in these plants declined by 22%.
• Commercial vessel registrations – Commercial vessel registrations dropped 13.3%
from 1990 to 2007, while pleasure craft registrations increased by 11%.
Commercial Fisheries
Landings
The commercial fishing industry represents an important component of the naturalresource-based businesses in Florida. However, commercial marine seafood landingshave declined steadily since 1990 (figure 5.1.1). From a high of 181M pounds in 1990 to
27

8/9/2019 Florida's Ocean and Coastal Economies Report Phase 2
http://slidepdf.com/reader/full/floridas-ocean-and-coastal-economies-report-phase-2 42/219
a low of 80M pounds in 2007, the weight of total landings has declined by 56%. Thedecline in the volume of landings is somewhat offset by an increase in value as theresource becomes more scarce. The result is that the nominal value of landings hasdeclined only slightly. However, in constant dollars, the value of Florida’s marineseafood landings declined 42% between 1990 and 2007, and 44% between the 1994 peak
and 2007. Much of the annual variation is based on environmental conditions affectingyear-to-year spawning, recruitment, and effort. However the consistent downward trendbeginning in the mid-1990’s can be largely traced to increasingly stressed stocks andmore stringent management. Specifically, the use of entangling nets was banned fromstate waters beginning in 1995. In addition, permit moratoria, more stringent harvestquotas, and other constraints have contributed to the declining commercial catch.
0
20
40
60
80
100
120
140
160
180
200
1990 1991 1992 1993 1994 1995 19961997 1998 1999 20002001 2002 20032004 2005 2006 2007
M i l l i o n P o u n d s
0
50
100
150
200
250
300
$ M i l l i o n ( 2 0
0 0 $ )
Landed Weight Landed Value
Figure 5.1 Commercial Seafood Harvests 1990-2007
Table 5.1 Commercial Seafood Harvests, 1990, 1994, 2007
Year Million Pounds $Million (nominal)
1990 181.6 $187.8
1994 161.6 $220.9
2007 80.1 $170.9
Of the coastal regions, the Gulf Coast has, on average, landed 70-75% of Florida’sdomestic seafood catch by weight and 70-80% by value (figure 5.2). Both coasts haveshown similar decline in production with each dropping 49% in weight from the 1994
peak. The Atlantic Coast declined 55% in constant value while the Gulf Coast fell 40%between 1994 and 2007. Florida marine seafood is also landed at inland and out of stateports, which accounted for 1.2M pounds, valued at $1.4M in 2007.
28

8/9/2019 Florida's Ocean and Coastal Economies Report Phase 2
http://slidepdf.com/reader/full/floridas-ocean-and-coastal-economies-report-phase-2 43/219
0
20
40
60
80
100
120
140
1990 1991 1992 1993 1994 1995 1996 1997 1998 1999 2000 2001 2002 2003 2004 2005 2006 2007
M i l l i o n P o u n d s
$0
$20
$40
$60
$80
$100
$120
$140
$160
$180
$200
$ M i l l i o n
( 2 0 0 0 $ )
Atlantic Weight Gulf Weight Atlantic Value Gulf Value
Figure 5.2 Commercial Seafood Landings by Coast 1990-2007
Marine seafood products are divided into four main groups; finfish, food shrimp, bait
shrimp, and invertebrates, which include clams, oysters, crabs, lobsters, squids andsponges (figure 5.3). Finfish and invertebrates make up over two thirds of the catch eachyear. In 2007, 43.3M pounds of finfish were landed, valued at $65M and 22.4M poundsof invertebrates were caught worth $72M (table 5.2).
0
20
40
60
80
100
120
140
1990 1991 1992 1993 1994 1995 1996 1997 1998 1999 2000 2001 2002 2003 2004 2005 2006 2007
M i l l i
o n P o u n d s
$0
$2 0
$4 0
$6 0
$8 0
$100
$120
$ M i l l i o n ( 2 0 0 0 $ )
Finfish Invertebrates Bait Shrimp Food Shrimp
Finfis h Value In verteb ra tes Va lu e Bait Shrim p Va lue Fo od Sh rim p Value
Figure 5.3 Commercial Seafood Groups 1990-2007
Table 5.2 Commercial Seafood Groups, 2007
Seafood Group Million Pounds $Million (nominal)
Finfish 43.3 $64.8
Invertebrates 22.4 $72.0
Food Shrimp 12.7 $26.5
Bait Shrimp 1.8 $7.5
29
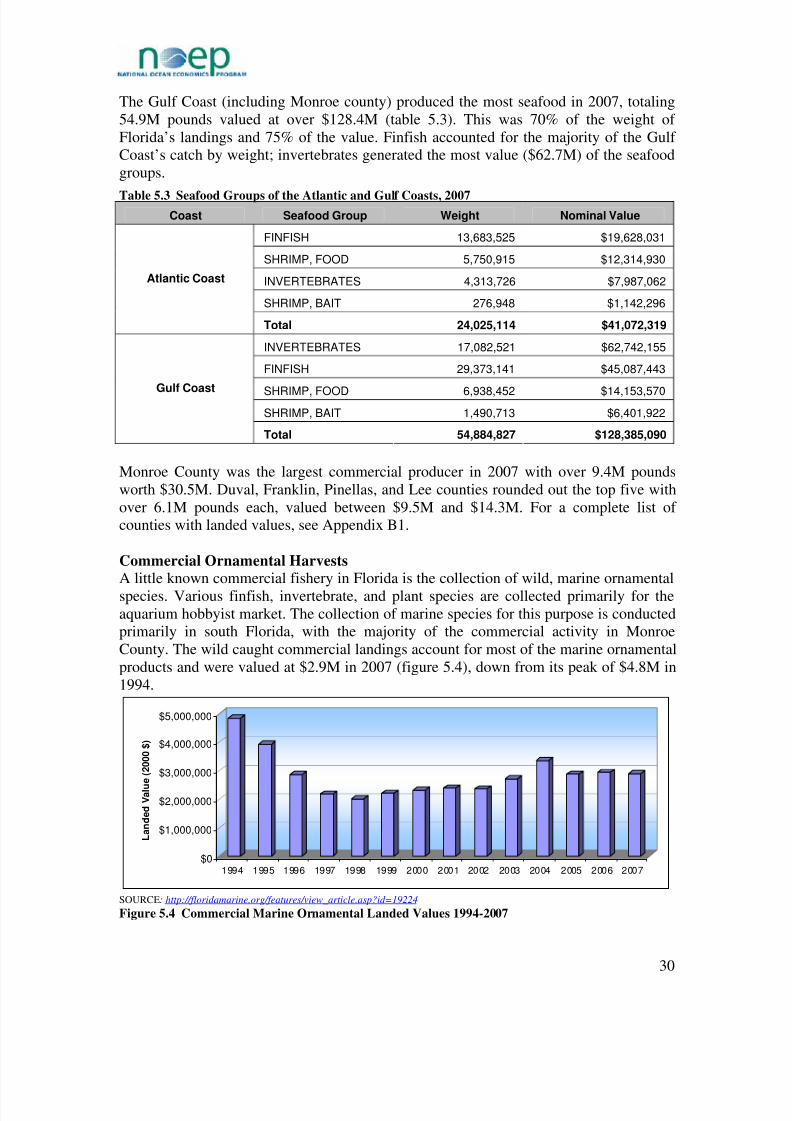
8/9/2019 Florida's Ocean and Coastal Economies Report Phase 2
http://slidepdf.com/reader/full/floridas-ocean-and-coastal-economies-report-phase-2 44/219
The Gulf Coast (including Monroe county) produced the most seafood in 2007, totaling54.9M pounds valued at over $128.4M (table 5.3). This was 70% of the weight of Florida’s landings and 75% of the value. Finfish accounted for the majority of the Gulf Coast’s catch by weight; invertebrates generated the most value ($62.7M) of the seafoodgroups.
Table 5.3 Seafood Groups of the Atlantic and Gulf Coasts, 2007Coast Seafood Group Weight Nominal Value
FINFISH 13,683,525 $19,628,031
SHRIMP, FOOD 5,750,915 $12,314,930
INVERTEBRATES 4,313,726 $7,987,062
SHRIMP, BAIT 276,948 $1,142,296
Atlantic Coast
Total 24,025,114 $41,072,319
INVERTEBRATES 17,082,521 $62,742,155
FINFISH 29,373,141 $45,087,443
SHRIMP, FOOD 6,938,452 $14,153,570
SHRIMP, BAIT 1,490,713 $6,401,922
Gulf Coast
Total 54,884,827 $128,385,090
Monroe County was the largest commercial producer in 2007 with over 9.4M poundsworth $30.5M. Duval, Franklin, Pinellas, and Lee counties rounded out the top five withover 6.1M pounds each, valued between $9.5M and $14.3M. For a complete list of counties with landed values, see Appendix B1.
Commercial Ornamental Harvests
A little known commercial fishery in Florida is the collection of wild, marine ornamentalspecies. Various finfish, invertebrate, and plant species are collected primarily for theaquarium hobbyist market. The collection of marine species for this purpose is conductedprimarily in south Florida, with the majority of the commercial activity in MonroeCounty. The wild caught commercial landings account for most of the marine ornamentalproducts and were valued at $2.9M in 2007 (figure 5.4), down from its peak of $4.8M in1994.
$0
$1,000,000
$2,000,000
$3,000,000
$4,000,000
$5,000,000
L a n d e d V a l u
e ( 2 0 0 0 $ )
1994 1995 1996 1997 1998 1999 2000 2001 2002 2003 2004 2005 2006 2007
SOURCE: http://floridamarine.org/features/view_article.asp?id=19224
Figure 5.4 Commercial Marine Ornamental Landed Values 1994-2007
30
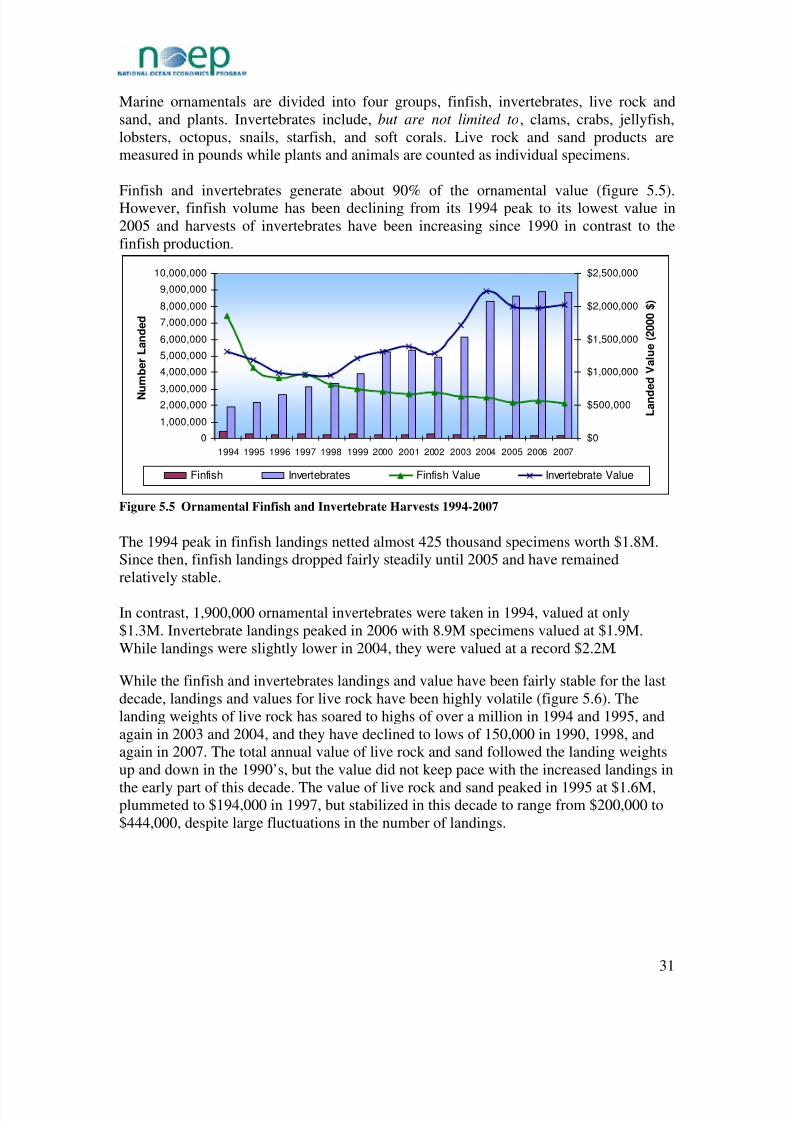
8/9/2019 Florida's Ocean and Coastal Economies Report Phase 2
http://slidepdf.com/reader/full/floridas-ocean-and-coastal-economies-report-phase-2 45/219
Marine ornamentals are divided into four groups, finfish, invertebrates, live rock andsand, and plants. Invertebrates include, but are not limited to, clams, crabs, jellyfish,lobsters, octopus, snails, starfish, and soft corals. Live rock and sand products aremeasured in pounds while plants and animals are counted as individual specimens.
Finfish and invertebrates generate about 90% of the ornamental value (figure 5.5).However, finfish volume has been declining from its 1994 peak to its lowest value in2005 and harvests of invertebrates have been increasing since 1990 in contrast to thefinfish production.
0
1,000,000
2,000,0003,000,000
4,000,000
5,000,000
6,000,000
7,000,000
8,000,000
9,000,000
10,000,000
1994 1995 1996 1997 1998 1999 2000 2001 2002 2003 2004 2005 2006 2007
N u m b e r L a n d e d
$0
$500,000
$1,000,000
$1,500,000
$2,000,000
$2,500,000
L a n d
e d V a l u e ( 2 0 0 0 $ )
Finfish Invertebrates Finfish Value Invertebrate Value
Figure 5.5 Ornamental Finfish and Invertebrate Harvests 1994-2007
The 1994 peak in finfish landings netted almost 425 thousand specimens worth $1.8M.Since then, finfish landings dropped fairly steadily until 2005 and have remainedrelatively stable.
In contrast, 1,900,000 ornamental invertebrates were taken in 1994, valued at only$1.3M. Invertebrate landings peaked in 2006 with 8.9M specimens valued at $1.9M.While landings were slightly lower in 2004, they were valued at a record $2.2M.
While the finfish and invertebrates landings and value have been fairly stable for the lastdecade, landings and values for live rock have been highly volatile (figure 5.6). Thelanding weights of live rock has soared to highs of over a million in 1994 and 1995, andagain in 2003 and 2004, and they have declined to lows of 150,000 in 1990, 1998, andagain in 2007. The total annual value of live rock and sand followed the landing weightsup and down in the 1990’s, but the value did not keep pace with the increased landings in
the early part of this decade. The value of live rock and sand peaked in 1995 at $1.6M,plummeted to $194,000 in 1997, but stabilized in this decade to range from $200,000 to$444,000, despite large fluctuations in the number of landings.
31

8/9/2019 Florida's Ocean and Coastal Economies Report Phase 2
http://slidepdf.com/reader/full/floridas-ocean-and-coastal-economies-report-phase-2 46/219
0
200,000
400,000
600,000
800,000
1,000,000
1,200,000
1,400,000
1994 1995 1996 1997 1998 1999 2000 2001 2002 2003 2004 2005 2006 2007
P o u n d s
$0
$200,000
$400,000
$600,000
$800,000
$1,000,000
$1,200,000
$1,400,000
$1,600,000
$1,800,000
L a n d e d V a l u e ( 2 0 0 0 $ )
Live Rock & Sand Value
Figure 5.6 Marine Ornamental Live Rock and Sand 1994-2007
The increase in the landing of live rock and sand in 1994 and 1995 was due to theincrease in the harvest of natural live rock, which gained in popularity during that period.However, the prohibition of the removal of natural live rock in the mid-1990’s caused asharp downturn in harvests. Leases for the planting of cultured live rock began to bedeveloped in the mid-1990’s, with initial harvests occurring in the 2000-2004 period.Cultured harvests have become somewhat erratic since. For further information aboutcommercial ornamental harvests, see Appendix B2.
Commercial Fishing Licenses
Commercial licenses are required by the State of Florida for any persons or companiesharvesting live sea products for profit, and for wholesale and retail dealers purchasingproducts from licensed fishers. For more information regarding commercial fishing
licenses, see Appendix B3.
Overall, the number of commercial marine licenses declined by 38% between 1994-95and 2006-07, from 52,911 to 32,856 (figure 5.7). For a list of commercial license sales bycounty, see Appendix B3.
32

8/9/2019 Florida's Ocean and Coastal Economies Report Phase 2
http://slidepdf.com/reader/full/floridas-ocean-and-coastal-economies-report-phase-2 47/219
0
10,000
20,000
30,000
40,000
50,000
60,000
94-95 95-96 96-97 97-98 98-99 99-00 00-01 01-02 02-03 03-04 04-05 05-06 06-07
Fiscal Year
Figure 5.7 Commercial Marine Fishing Licenses FY 1994-95 to FY2006-07
The number of retail and wholesale dealer licenses increased by 9% from 6,127 in 1994-
95 to 6,652 in 2006-07 probably reflecting the increased presence of imported seafood inthe market (figure 5.8). Saltwater Products licenses had the largest numeric decline,falling from 19,421 to 11,226, a 42% decline. Stone Crab licenses had the largestproportional decline, falling by 79%, from 6066 permits in 1995-96 to 1277 permits in2006-07. In 2001 a new limited access program was adopted which eliminated all theinactive permits, and the permits for stone crab went from being non-fee based to fee-based. The implementation of a fee-based permit resulted in inactive licenses beingremoved from the system.
0
2000
4000
6000
8000
10000
12000
1400016000
18000
20000
94-95 95-96 96-97 97-98 98-99 99-00 00-01 01-02 02-03 03-04 04-05 05-06 06-07
Fiscal Year
L i c e n s e - P e r m i t S a l e s
SALTWATER PRODUCTS RESTRICTED SPECIES RETAIL DEALER
BLUE CRAB STONE CRAB CRAWFISH/LOBSTER
WHOLESALE DEALER
Figure 5.8 Commercial Fishing License Types FY 1994-95 to 2006-07
The overall decline in total commercial fishing licenses is due primarily to declines in thenumber of saltwater product licenses issued since 1994. A major change occurred in1995, with the banning of entangling nets in Florida waters. This removed a large numberof the smaller, inshore craft from the fleet. The numbers of blue crab and stone crab
33

8/9/2019 Florida's Ocean and Coastal Economies Report Phase 2
http://slidepdf.com/reader/full/floridas-ocean-and-coastal-economies-report-phase-2 48/219
permits have also declined steadily since 1994, further reflecting the departure of thesmall-scale commercial fishing enterprise from the nearshore waters of Florida. Fuelingpart of this decline is the diminished availability of waterfront offloading facilities whereharvesters can make the initial sale to a first-handler.
AquacultureAquaculture represents an extremely diverse industry in Florida. More varieties of aquatic organisms are cultured in Florida than in any other state. The farm gate value of commercial aquaculture in Florida exhibited a general upward trend until 2005. However,year to year fluctuations reflect a changing market for Florida seafood products, as wellas an industry characterized by frequent entry and exits associated with new producersand speculative investors.
0
500
1000
1500
2000
2500
1987 1989 1991 1993 1995 1997 1999 2001 2003 2005
O p e r a t i o n s a n d
W o r k e r s
$0
$20
$40
$60
$80
$100
$120
S a l e s i n $ M i l l i o n ( 2 0 0 0 $ )
Num ber of Operations Num ber of Workers Total Sales
Figure 5.9 Aquaculture Operations, Workers, and Sales 1987-2005
The number of aquaculture operations grew fairly steadily from 1989 to 1999 when itpeaked at 712 firms. Since then the number of firms has declined until it reached itslowest point in 2005 with 359 firms reporting sales (figure 5.9). There were an additional351 firms that failed to report any earnings in 2005. The number of workers in theindustry trended upwards from 1991 until 2003, where it reached a peak of 2,144, but in2005 the number of workers plummeted to 1,055. The primary explanation for the largenumber of idle firms and the large drop in employment in the industry is the damagecaused by multiple hurricanes in 2004 and 2005. Workers include full-time workers, part-time workers, and unpaid workers.
Sales also declined significantly in 2005, but not to the extent of employment. Sales rose
from 1987 through 1997, where they peaked at $108.9M (figure 5.9). By 2003 sales haddropped slightly to $89.4M, before falling sharply in 2005 to $66.1M.
Farm-gate sales are divided into 5 major types of aquaculture products: Ornamental Fish,Aquatic Plants, Clams and Oysters, Alligators, and Other (figure 5.10).
34

8/9/2019 Florida's Ocean and Coastal Economies Report Phase 2
http://slidepdf.com/reader/full/floridas-ocean-and-coastal-economies-report-phase-2 49/219
$0
$10
$20
$30
$40
$50
$60
S a l e s i n $ M i l l i
o n
1987 1989 1991 1993 1995 1997 1999 2001 2003 2005
Ornamenta l Fish Aquatic Plants Clams, Oysters Alligators Other
Figure 5.10 Aquaculture Product Sales 1987-2005
Ornamental fish generate the largest share of sales revenue in the industry, accounting for$29.3M or nearly half of all revenue in 2005. Ornamental fish revenue peaked in 1997 at$61.4M, and declined thereafter. The decline in ornamental fish production and salessince 1997 is associated with several factors, including an increase in the competitionfrom imported product, a stagnating domestic market for freshwater ornamentals, andperiodic reporting problems. Revenue from aquatic plants, however, has risen fairlysteadily since 1987, peaking in 2001 at $20.7M and declining to $15.5M in 2005. Growthin revenue from clams and oysters, and from other aquaculture followed a similar pattern.Hard clams represent the single most important aquatic food item cultured in Florida.This industry began in the early 1990’s in the Indian River Region of Florida, but iscurrently centered in Levy County on the Gulf Coast. Recent declines in hard clamproduction are associated with fluctuating water quality conditions, seed availability, anddamage associated with hurricanes. For further information about aquaculture harvests,see Appendix B4.
5.3 Recreational Fisheries
Landings
Florida is a leading state in terms of marine recreational fishing participation. In terms of numbers of angler trips, Florida alone accounted for 33% of all marine angler trips takenin the United States during 2006. During that same year, Florida exceeded all other states
in terms of the numbers of fish harvested and released for recreation purposes.
According to National Marine Fisheries Service estimates, recreational anglers in Floridacaught 180.5M fish in 2006 with a weight of over 25M pounds (figure 5.11). Between1990 and 2006, the estimated weight of landed recreational fish increased slightly, whilethe number of fish caught more than doubled.
35

8/9/2019 Florida's Ocean and Coastal Economies Report Phase 2
http://slidepdf.com/reader/full/floridas-ocean-and-coastal-economies-report-phase-2 50/219
0
5
10
15
20
25
30
35
40
1990 1991 1992 1993 1994 1995 1996 1997 1998 1999 2000 2001 2002 2003 2004 2005 2006
M i l l i o n P
o u n d s
0
20
40
60
80100
120
140
160
180
200
M i l l i o n
F i s h
Weight Number Caught
Figure 5.11 Recreational Fish Landings 1990-2006
From 1991 through 2006, the estimated total number of fish landed in Florida’srecreational fishery cycled through a broad, but clearly identifiable range. The low end of the range is set at approximately 117M fish based on landings in 1996. The high end of the range is set at 186M, based on landings in 2004. Throughout the 1990’s, landingsvaried annually but the cycles tended to remain in the lower part of that range. In theearly part of this decade, landings began to steadily increase towards the high end of thatrange, peaking in 2004. There is a dip in recreational landings in 2005 that coincides witha decrease in the number of recreational licenses issued. Both of these declines may berelated to the unusually active hurricane season in 2005.
The number of fish caught has generally increased, while the aggregate weight has been
decreasing. This suggests that more, smaller fish are being landed (figure 5.12). Of thetop ten types of recreational fish, the Herring (a relatively small species) catch was thefastest growing from 1990 to 2006 and represented 37% of the 2006 catch, which mightexplain the apparent declining average weight. Landings of other larger fish remainedrelatively stable during the period or declined in numbers. For further information aboutrecreational fisheries landings, see Appendix B5.
36

8/9/2019 Florida's Ocean and Coastal Economies Report Phase 2
http://slidepdf.com/reader/full/floridas-ocean-and-coastal-economies-report-phase-2 51/219
0
10,000,000
20,000,000
30,000,000
40,000,000
50,000,000
60,000,000
70,000,000
1990 1991 1992 1993 1994 1995 1996 1997 1998 1999 2000 2001 2002 2003 2004 2005 2006
N u m b e r o f F i s h
CATFISHES DOLPHINS DRUMSGRUNTS JACKS HERRINGSPORGIES SEA BASSES SNAPPERSTUNAS AND MACKERELS
Figure 5.12 Top Ten Recreation Fish 1990-2006
The top ten species of fish during the 1990-2006 period has remained relatively stable.The numbers of Herring have increased over five times, which accounts for the greaterincrease in the number of fish caught compared with weight. Drum have nearly doubledwhile Dolphin have declined by a third.
Recreational Fishing Licenses
Florida’s recreational fishery is one of the largest in the nation and an importantcomponent of the state’s tourism industry. Nearly half the estimated recreational fishingtrips in Florida are made by visitors to the state. For further information aboutrecreational fishing license data collection, see Appendix B6.
Overall, the total number of recreational saltwater fishing licenses sold has increased by10% since 2004 (figure 5.13).
915,000
940,000
965,000
990,000
1,015,000
1,040,000
1,065,000
1,090,000
1,115,000
1,140,000
Year
L i c e n s e s S o l d
15,000,000
15,500,000
16,000,000
16,500,000
17,000,000
17,500,000
18,000,000
18,500,000
L i c e n s e R e v e n u e
Licenses Sold 1,021,297 993,339 1,091,912 1,118,753
Revenue $15,908 ,860 $15 ,834,334 $16 ,817,993 $18 ,056,772
2004 2005 2006 2007
Figure 5.13 Saltwater Fishing Licenses Sold 2004-2007
37

8/9/2019 Florida's Ocean and Coastal Economies Report Phase 2
http://slidepdf.com/reader/full/floridas-ocean-and-coastal-economies-report-phase-2 52/219
Table 5.4 Recreational License Sales 2004-2007
License Sales
License Group 2004 2005 2006 2007
Boat-Licenses 5,507 5,617 6,190 7,174
Individual Non-Resident 387,105 362,642 371,055 374,531Individual Resident 628,290 624,849 714,535 726,985
Other Licenses 395 231 132 383
Total 1,021,297 993,339 1,091,912 1,109,073
License Revenues (Nominal $)
License Group 2004 2005 2006 2007
Boat-Licenses $44,000 $41,200 $46,400 $64,400
Individual Non-Resident $4,739,275 $4,528,673 $4,622,991 $5,329,028
Individual Resident $10,091,885 $10,245,935 $11,130,822 $11,595,010
Other Licenses $18,982 $10,926 $4,630 $17,182
Total $14,894,142 $14,826,734 $15,804,843 $17,005,620SOURCE: Office of Licensing and Permitting Florida Fish and Wildlife Conservation Commission
Monroe and Lee counties account for the most sales with 8% and 6% of all 2007 sales,respectively. Pinellas, Dade, Collier, Bay, and Brevard counties each accounted just over4% of statewide sales in 2007. For a complete list of 2007 county license sales, seeAppendix B6.
As shown in table 5.4, Florida consistently attracts a large number of out-of-state anglers.These non-resident anglers contribute to a growing economic impact from marinerecreational fishing. During 2007, 33% of the total marine recreational license sales wereto non-residents.
0
200,000
400,000
600,000
800,000
P e r m i t s S o l d
$0
$2,000,000
$4,000,000
$6,000,000
$8,000,000
$10,000,000
$12,000,000
$14,000,000
R e v e n u e ( N o m i n a l )
Individual Non-Resident 387,105 362,642 371,055 374,531
Individual Resident 628,290 624,849 714,535 726,985
Non-Resident Revenue $4,739,275 $4,528,673 $4,622,991 $5,329,028
Resident Revenue $10,091,885 $10,245,935 $11,130,822 $11,595,010
2004 2005 2006 2007
Figure 5.14 Individual Recreational Fishing Licenses, Resident and Non-Resident 2004-2007
38
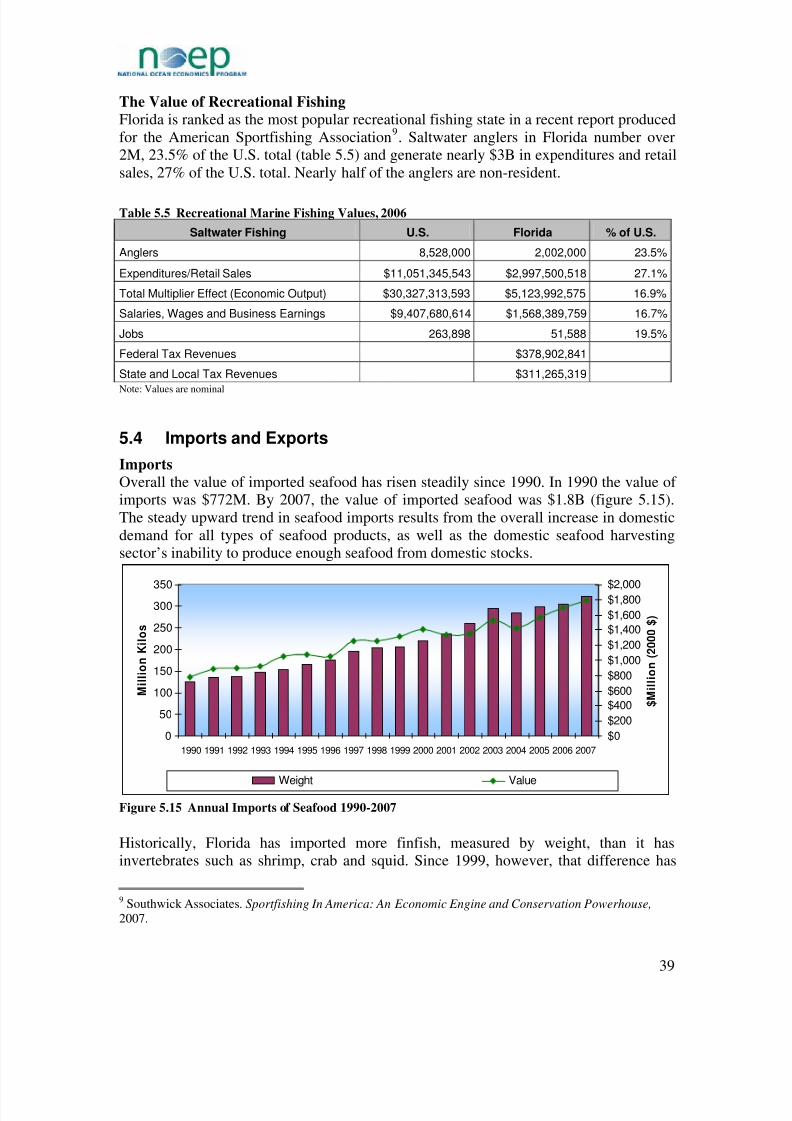
8/9/2019 Florida's Ocean and Coastal Economies Report Phase 2
http://slidepdf.com/reader/full/floridas-ocean-and-coastal-economies-report-phase-2 53/219
The Value of Recreational Fishing
Florida is ranked as the most popular recreational fishing state in a recent report producedfor the American Sportfishing Association
9. Saltwater anglers in Florida number over
2M, 23.5% of the U.S. total (table 5.5) and generate nearly $3B in expenditures and retailsales, 27% of the U.S. total. Nearly half of the anglers are non-resident.
Table 5.5 Recreational Marine Fishing Values, 2006
Saltwater Fishing U.S. Florida % of U.S.
Anglers 8,528,000 2,002,000 23.5%
Expenditures/Retail Sales $11,051,345,543 $2,997,500,518 27.1%
Total Multiplier Effect (Economic Output) $30,327,313,593 $5,123,992,575 16.9%
Salaries, Wages and Business Earnings $9,407,680,614 $1,568,389,759 16.7%
Jobs 263,898 51,588 19.5%
Federal Tax Revenues $378,902,841
State and Local Tax Revenues $311,265,319
Note: Values are nominal
5.4 Imports and Exports
Imports
Overall the value of imported seafood has risen steadily since 1990. In 1990 the value of imports was $772M. By 2007, the value of imported seafood was $1.8B (figure 5.15).The steady upward trend in seafood imports results from the overall increase in domesticdemand for all types of seafood products, as well as the domestic seafood harvestingsector’s inability to produce enough seafood from domestic stocks.
0
50
100
150
200
250
300350
1990 1991 1992 1993 1994 1995 1996 1997 1998 1999 2000 2001 2002 2003 2004 2005 2006 2007
M i l l i o n
K i l o s
$0
$200
$400
$600
$800
$1,000
$1,200
$1,400
$1,600
$1,800$2,000
$ M i l l i o n
( 2 0 0 0 $ )
Weight Value Figure 5.15 Annual Imports of Seafood 1990-2007
Historically, Florida has imported more finfish, measured by weight, than it hasinvertebrates such as shrimp, crab and squid. Since 1999, however, that difference has
9 Southwick Associates. Sportfishing In America: An Economic Engine and Conservation Powerhouse, 2007.
39

8/9/2019 Florida's Ocean and Coastal Economies Report Phase 2
http://slidepdf.com/reader/full/floridas-ocean-and-coastal-economies-report-phase-2 54/219
grown by an order of magnitude such that Florida now imports twice as much finfish asshellfish on a weight basis. Because of that large increase in imports of finfish, the valueof imported finfish, which was historically lower than invertebrates, actually surpassedthe value of imported invertebrates in 2002. In 1990, the value of imported invertebrateswas almost double the value of imported finfish, $278M versus $494M (figure 5.16). By
2007, the value of imported finfish had risen to $1.1B, while imports of invertebrates hadstabilized at $686M.
0
50
100
150
200
250
1990 1991 1992 1993 1994 1995 1996 1997 1998 1999 2000 2001 2002 2003 2004 2005 2006 2007
M i l l i o n K i l o s
$0
$200
$400
$600
$800
$1,000
$1,200
$ M i l l i o n ( 2 0 0 0 $ )
Finfish Invertebrates Finfish Value Invertebrates Value
Figure 5.16 Imports of Finfish and Shellfish 1990-2007
Exports
Overall, the real value of seafood exports rose fairly steadily from $29.4M in 1990 to$58.9M in 2000 (figure 5.17). The value of seafood exports fell sharply in the early partof this decade, but recovered strongly in 2006 and 2007. Seafood exports reached a nine-year low in 2002 with a value of $31.4M, but rose to all time highs in 2006 and 2007,with total values of $61.1M and $74.5M, respectively.
0
2
4
6
8
10
12
14
16
18
1990 19911992 199319941995 19961997 19981999 20002001 20022003 2004 20052006 2007
M i l l i o n K i l o s
$0
$10
$20
$30
$40
$50
$60
$70
$80
$ M i l l i o n ( 2 0 0 0 $ )
Export Weight Export Value
Figure 5.17 Seafood Exports 1990-2007
During the first part of this decade, when the value of seafood exports was relatively low,exports were dominated by finfish. As exports of valuable invertebrates such as shrimp,crab, and mussels began to increase in 2003, the value of exports began to climb (figure
40

8/9/2019 Florida's Ocean and Coastal Economies Report Phase 2
http://slidepdf.com/reader/full/floridas-ocean-and-coastal-economies-report-phase-2 55/219
5.18). By 2007, exports of invertebrates exceeded exports of finfish in weight as well asin value, and the total value of seafood exports was increasing dramatically.
Seafood exports, as well as other exports, increase during periods of a weakening U.S.dollar on the world market.
0
1
2
3
4
5
6
7
8
9
1990 1991 1992 1993 1994 1995 1996 1997 1998 1999 2000 2001 2002 2003 2004 2005 2006 2007
M i l l i o n K i l o s
$0
$10
$20
$30
$40
$50
$60
$ M i l l i o n ( 2 0 0 0 $ )
Finfish Invertebrates Finfish Value Invertebrates Value
Figure 5.18 Exports of Finfish and Invertebrates 1990-2007
Re-Exports
Re-exports are defined as imported seafood that is immediately exported, withoutprocessing in this country. These re-exports represent seafood products that are broughtinto Florida ports of entry, but do not enter into the Florida seafood market, and areinstead shipped to another foreign destination.
Seafood re-export information is maintained annually by the Fisheries Statistics and
Economics Division of the National Marine Fisheries Service based on data from theForeign Trade Division of the U.S. Census Bureau. For more information regardingseafood import/export data, see Appendix B7.
As with imports and exports, the weight and value of re-exports are increasing (figure5.19). Numerically, re-exports resemble imports in that the weight of finfish consistentlyexceeds the weight of invertebrates. On the other hand, they resemble exports in that thevalue of exported invertebrates frequently exceeds the value of finfish.
41
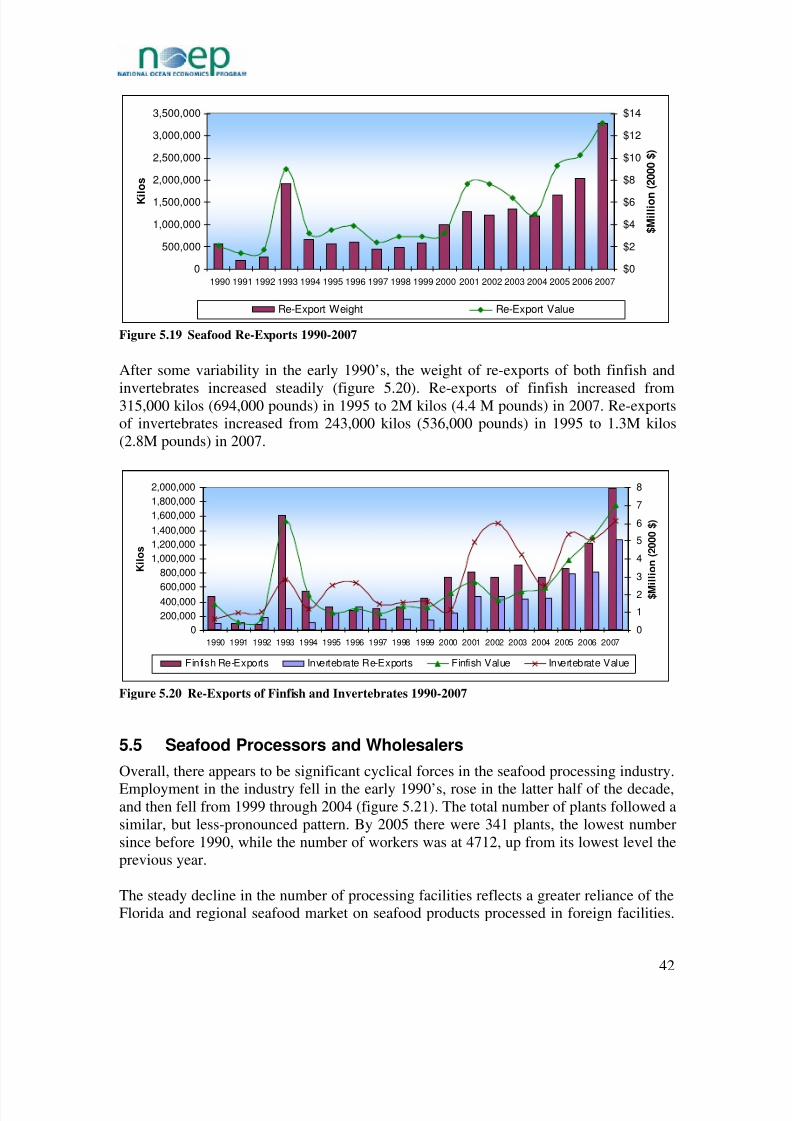
8/9/2019 Florida's Ocean and Coastal Economies Report Phase 2
http://slidepdf.com/reader/full/floridas-ocean-and-coastal-economies-report-phase-2 56/219
0
500,000
1,000,000
1,500,000
2,000,000
2,500,000
3,000,000
3,500,000
1990 1991 1992 1993 1994 1995 1996 1997 1998 1999 2000 2001 2002 2003 2004 2005 2006 2007
K i
l o s
$0
$2
$4
$6
$8
$10
$12
$14
$ M i l l i o n
( 2 0 0 0 $ )
Re-Export Weight Re-Export Value
Figure 5.19 Seafood Re-Exports 1990-2007
After some variability in the early 1990’s, the weight of re-exports of both finfish and
invertebrates increased steadily (figure 5.20). Re-exports of finfish increased from315,000 kilos (694,000 pounds) in 1995 to 2M kilos (4.4 M pounds) in 2007. Re-exportsof invertebrates increased from 243,000 kilos (536,000 pounds) in 1995 to 1.3M kilos(2.8M pounds) in 2007.
0
200,000
400,000600,000
800,000
1,000,000
1,200,000
1,400,000
1,600,000
1,800,000
2,000,000
1990 1991 1992 1993 1994 1995 1996 1997 1998 1999 2000 2001 2002 2003 2004 2005 2006 2007
K i l o s
0
1
2
3
4
5
6
7
8
$ M
i l l i o n ( 2 0 0 0 $ )
Finfish Re-Exports Invertebrate Re-Exports Finfish Value Invertebrate Value
Figure 5.20 Re-Exports of Finfish and Invertebrates 1990-2007
5.5 Seafood Processors and Wholesalers
Overall, there appears to be significant cyclical forces in the seafood processing industry.
Employment in the industry fell in the early 1990’s, rose in the latter half of the decade,and then fell from 1999 through 2004 (figure 5.21). The total number of plants followed asimilar, but less-pronounced pattern. By 2005 there were 341 plants, the lowest numbersince before 1990, while the number of workers was at 4712, up from its lowest level theprevious year.
The steady decline in the number of processing facilities reflects a greater reliance of theFlorida and regional seafood market on seafood products processed in foreign facilities.
42

8/9/2019 Florida's Ocean and Coastal Economies Report Phase 2
http://slidepdf.com/reader/full/floridas-ocean-and-coastal-economies-report-phase-2 57/219
For example, the number of blue crab processing facilities in Florida has declineddramatically over the last two decades. This is in part due to a decline in the availabilityof domestic blue crab landings, but also is due to the increase in imported processed crabmeat. Labor availability may also have played a role in the economically undiversifiedcoastal communities in which many of these facilities were located.
0
100
200
300
400
500
600
1990 1991 1992 1993 1994 1995 1996 1997 1998 1999 2000 2001 2002 2003 2004 2005
S e a f o o d P l a n t s
0
1,000
2,000
3,000
4,000
5,000
6,000
7,000
N u m b e r o f W o r k e r s
Seafood Processing Plants Processing Employment
Figure 5.21 Seafood Processing and Wholesale Plants 1990-2005
The number of processing plants has declined faster than wholesale facilities. This hasbeen particularly the case since 2001 (figure 5.22). As the need for processing capacityhas declined, the need for wholesale storage capacity and distribution capabilities has not.
0
50
100
150
200
250
300350
400
450
1990 1991 1992 1993 1994 1995 1996 1997 1998 1999 2000 2001 2002 2003 2004 2005
P l a n t s
0
500
1000
1500
2000
2500
3000
35004000
4500
5000
W o r k e r s
Processing Plants Wholesale Plants Processing Workers Wholesale Workers
Figure 5.22 Seafood Processing and Wholesale Plants 1990-2007
There is a high level of variation in production in the industry, with some annual changesof 20% or more. The year 1990 had the highest level of output in both pounds and dollarswith 126,000,000 pounds sold for $550.2M (figure 5.23). The last two years for whichthere is data, 2004 and 2005, suffered the lowest output for any year since 1990. In 2004,62,000,000 pounds of seafood were processed at a value of $212.3M, while in 2005,66,000,000 pounds were processed at a value of $216M. For further information onseafood processors and wholesalers see Appendix B8.
43
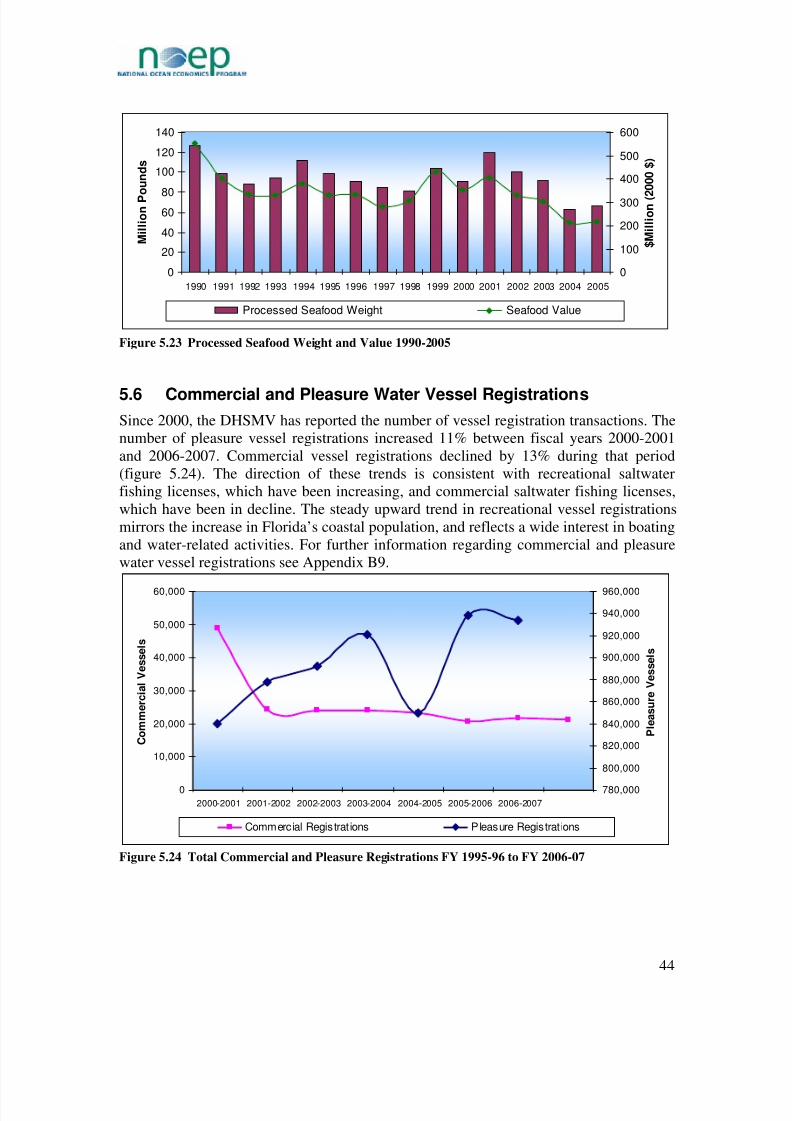
8/9/2019 Florida's Ocean and Coastal Economies Report Phase 2
http://slidepdf.com/reader/full/floridas-ocean-and-coastal-economies-report-phase-2 58/219
0
20
40
6080
100
120
140
1990 1991 1992 1993 1994 1995 1996 1997 1998 1999 2000 2001 2002 2003 2004 2005
M i l l i o n P o u n d s
0
100
200
300
400
500
600
$ M i l l i o n ( 2
0 0 0 $ )
Processed Seafood Weight Seafood Value
Figure 5.23 Processed Seafood Weight and Value 1990-2005
5.6 Commercial and Pleasure Water Vessel RegistrationsSince 2000, the DHSMV has reported the number of vessel registration transactions. Thenumber of pleasure vessel registrations increased 11% between fiscal years 2000-2001and 2006-2007. Commercial vessel registrations declined by 13% during that period(figure 5.24). The direction of these trends is consistent with recreational saltwaterfishing licenses, which have been increasing, and commercial saltwater fishing licenses,which have been in decline. The steady upward trend in recreational vessel registrationsmirrors the increase in Florida’s coastal population, and reflects a wide interest in boatingand water-related activities. For further information regarding commercial and pleasurewater vessel registrations see Appendix B9.
0
10,000
20,000
30,000
40,000
50,000
60,000
2000-2001 2001-2002 2002-2003 2003-2004 2004-2005 2005-2006 2006-2007
C o m m e r c i a l V e s s e l s
780,000
800,000
820,000
840,000
860,000
880,000
900,000
920,000
940,000
960,000
P l e a s u r e V e s s e l s
Commercial Registrat ions Pleasure Registrat ions
Figure 5.24 Total Commercial and Pleasure Registrations FY 1995-96 to FY 2006-07
44

8/9/2019 Florida's Ocean and Coastal Economies Report Phase 2
http://slidepdf.com/reader/full/floridas-ocean-and-coastal-economies-report-phase-2 59/219
5.7 Conclusion
There have been some major shifts in Florida’s fishing industries. Commercial landingscontinue to decline due to receding stocks and necessary protective measures, while theseafood import-export and recreational fishing industries are growing.
Commercial fish landings have declined 56% in weight and 42% in real value between1990 and 2007 (figure 5.25). To meet increased demand, seafood imports have grown158% in weight and 130% in value during the same period.
0
100
200
300
400
500
600
700
800
1990 1991 1992 1993 19941995 19961997 19981999 20002001 20022003 2004 20052006 2007
M
i l l i o n P o u n d s
0
200
400600
800
1,000
1,200
1,400
1,600
1,800
2,000
$ M
i l l i o n ( 2 0 0 0 $ )
Commercial Landings Seafood Impor ts Landings Value Impor ts Value
Figure 5.25 Commercial Fish Landings vs. Seafood Imports
Commercial landings produced just 80M pounds in 2007, valued at $171M. Ornamentalharvests were valued at $3.5M and have stabilized. Aquaculture value dropped to $75M
in 2005, partly due to hurricane damage after producing between $80M and $110M inprevious years.
Seafood imports rose to $2.1B in nominal value in 2007. Exports were valued at $89Mand re-exports were almost $16M. Seafood import-export, along with the weakeneddollar, has also helped maintain wholesale processor companies and their 2,500 workers.
Recreational fishing generates an estimated 52,000 jobs, $1.6B in salaries and earnings,and $3B in sales. Recreational fish landings have also increased to 180.5M fish in 2006.
45
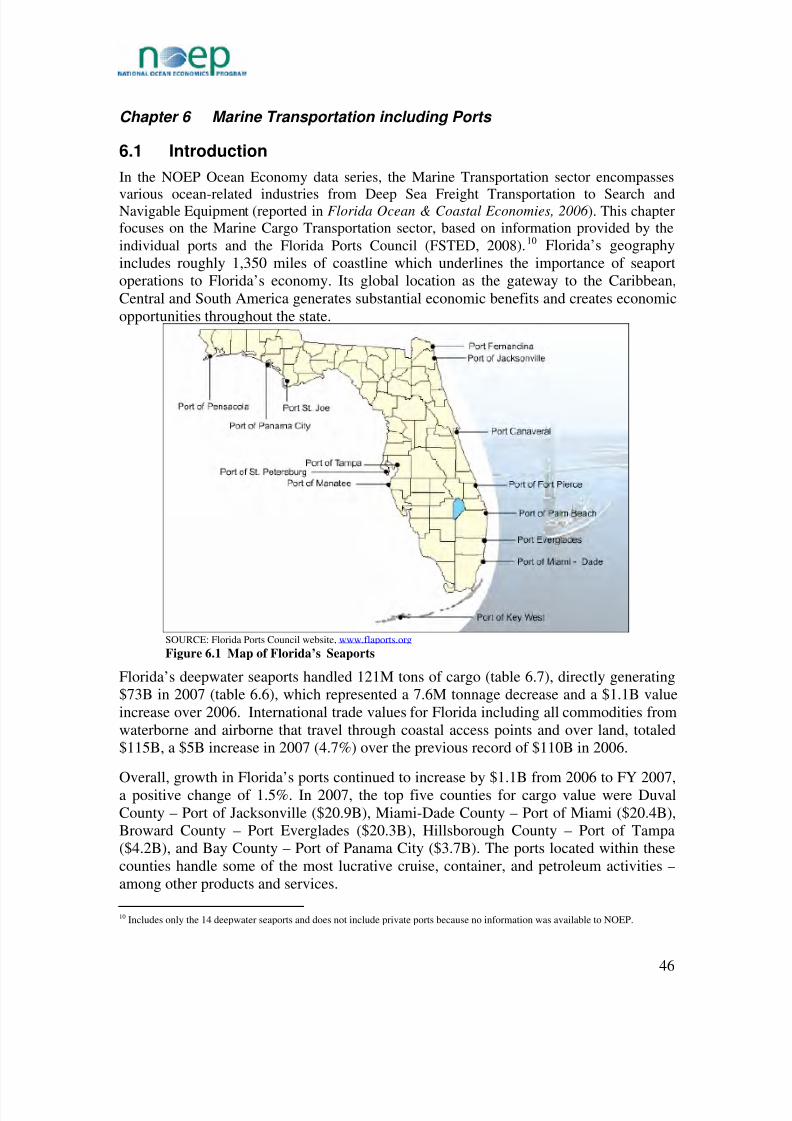
8/9/2019 Florida's Ocean and Coastal Economies Report Phase 2
http://slidepdf.com/reader/full/floridas-ocean-and-coastal-economies-report-phase-2 60/219
Chapter 6 Marine Transportation including Ports
6.1 Introduction
In the NOEP Ocean Economy data series, the Marine Transportation sector encompasses
various ocean-related industries from Deep Sea Freight Transportation to Search andNavigable Equipment (reported in Florida Ocean & Coastal Economies, 2006 ). This chapterfocuses on the Marine Cargo Transportation sector, based on information provided by theindividual ports and the Florida Ports Council (FSTED, 2008).10 Florida’s geographyincludes roughly 1,350 miles of coastline which underlines the importance of seaportoperations to Florida’s economy. Its global location as the gateway to the Caribbean,Central and South America generates substantial economic benefits and creates economicopportunities throughout the state.
SOURCE: Florida Ports Council website, www.flaports.org
Figure 6.1 Map of Florida’s Seaports
Florida’s deepwater seaports handled 121M tons of cargo (table 6.7), directly generating$73B in 2007 (table 6.6), which represented a 7.6M tonnage decrease and a $1.1B valueincrease over 2006. International trade values for Florida including all commodities fromwaterborne and airborne that travel through coastal access points and over land, totaled$115B, a $5B increase in 2007 (4.7%) over the previous record of $110B in 2006.
Overall, growth in Florida’s ports continued to increase by $1.1B from 2006 to FY 2007,a positive change of 1.5%. In 2007, the top five counties for cargo value were DuvalCounty – Port of Jacksonville ($20.9B), Miami-Dade County – Port of Miami ($20.4B),Broward County – Port Everglades ($20.3B), Hillsborough County – Port of Tampa($4.2B), and Bay County – Port of Panama City ($3.7B). The ports located within thesecounties handle some of the most lucrative cruise, container, and petroleum activities –among other products and services.
10 Includes only the 14 deepwater seaports and does not include private ports because no information was available to NOEP.
46

8/9/2019 Florida's Ocean and Coastal Economies Report Phase 2
http://slidepdf.com/reader/full/floridas-ocean-and-coastal-economies-report-phase-2 61/219
The economic contributions generated by Florida ports are not only an important local,state, and national asset, but also serve to facilitate globalization. Located within 2000miles of 22 foreign countries, Florida provides important access for products fromthroughout the United States for export. During the last decade, imports from LatinAmerica and the Caribbean have been robust and consistent regardless of economicconditions. However, in 2007 waterborne imports declined 5.6% and exports increased11.6%. The strength of the export market in Florida is exemplified by the competitivecontainerized cargo trade; Florida’s ports are one of the few places which can balanceinbound and outbound containers, a critical competitive advantage as a balance preventsa buildup in containers which can disrupt logistics planning.
6.2 National and State Comparisons
In 2007, many U.S. deepwater seaports experienced declines in the amount of containerspassing through (table 6.1) (FSTED, 2008). The three seaports that directly compete withFlorida were exceptions with increases in port container volumes from 2006 to 2007 and
they include: the Port of Savannah (20%), the Port of Houston (10%), and the Port of Hampton Roads (4%). Improving after Hurricane Katrina, the Port of New Orleans grewby 42% and surpassed the Port of Palm Beach in container shipments.
Table 6.1 U.S. Port Container Volumes, 1997, 2006, and 2007
Rank2007 Seaport 1997 2006 2007
% ChangeFY 06 to 07
10-YearCAGR∗
1 Los Angeles 2,960,000 8,469,980 8,355,039 -1.40% 10.90%
2 Long Beach 3,505,000 7,289,365 7,316,465 0.40% 7.60%
3 New York/New Jersey 2,457,000 5,092,806 5,299,105 4.10% 8.10%
4 Savannah 735,000 2,160,168 2,604,312 20.10% 13.50%
5 Oakland 1,531,000 2,391,598 2,307,289 -3.50% 4.50%
6 Hampton Roads 1,233,000 2,046,285 2,128,366 4.00% 5.90%7 Seattle 1,476,000 1,987,360 1,973,504 -0.70% 2.90%
8 Tacoma 1,158,000 2,067,186 1,924,934 -6.90% 5.20%
9 Houston 934,000 1,606,786 1,768,627 10.10% 6.60%
10 Charleston 1,218,000 1,968,474 1,754,376 -10.90% 3.70%
11 Port Everglades 719,685 864,030 948,687 9.80% 2.80%
12 Miami 761,183 976,514 884,945 -9.40% 1.50%
13 Jacksonville 675,196 768,239 710,073 -7.60% 0.50%
14 Baltimore - 627,947 610,466 -2.80% -
15 Wilmington (DE) - 262,856 284,352 8.20% -
16 Portland (OR) - 214,484 260,128 21.30% -
17 Philadelphia - 247,211 253,492 2.50% -
18 New Orleans - 175,957 250,649 42.40% -
19 Palm Beach 174,080 244,004 257,507 5.50% 4.00%
20 Boston - 200,113 220,339 10.10% -SOURCE: AAPA seaport data and independent analysis. Referenced from FSTED, 2008.
∗ CAGR (Compounded Annual Growth Rate) is the year-over-year growth rate of an investment over a specified period of time.
47
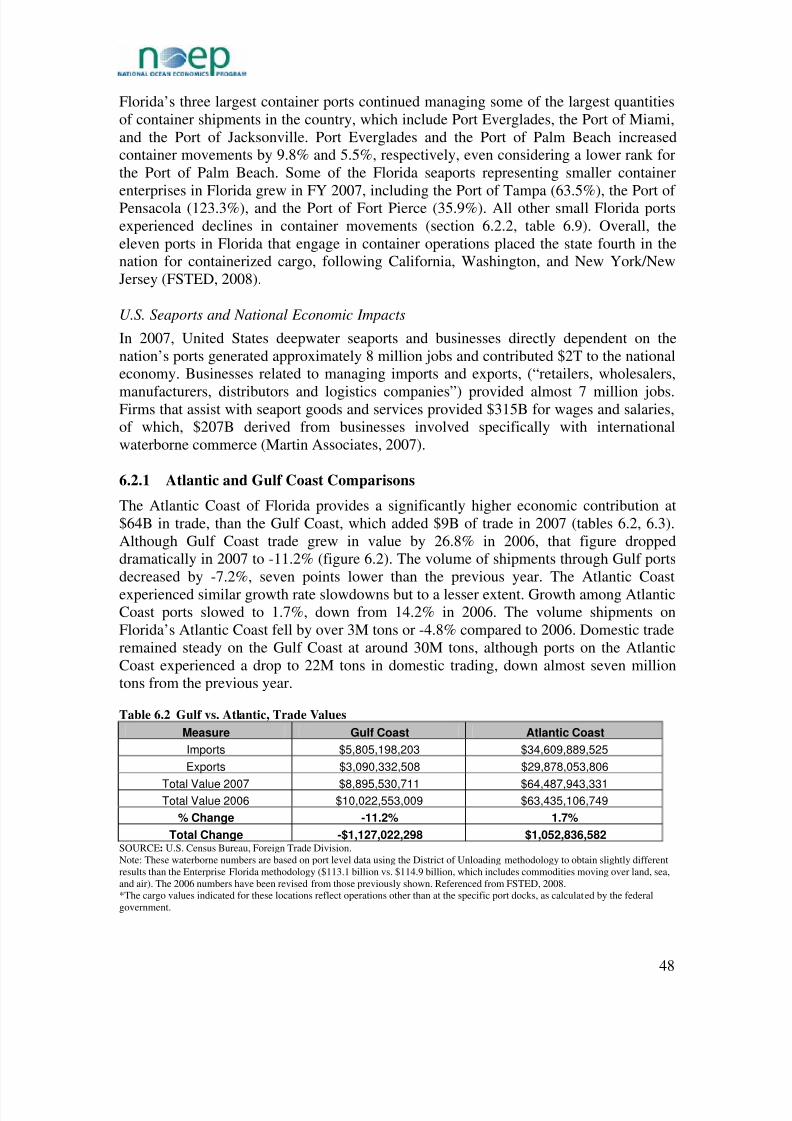
8/9/2019 Florida's Ocean and Coastal Economies Report Phase 2
http://slidepdf.com/reader/full/floridas-ocean-and-coastal-economies-report-phase-2 62/219
Florida’s three largest container ports continued managing some of the largest quantitiesof container shipments in the country, which include Port Everglades, the Port of Miami,and the Port of Jacksonville. Port Everglades and the Port of Palm Beach increasedcontainer movements by 9.8% and 5.5%, respectively, even considering a lower rank forthe Port of Palm Beach. Some of the Florida seaports representing smaller container
enterprises in Florida grew in FY 2007, including the Port of Tampa (63.5%), the Port of Pensacola (123.3%), and the Port of Fort Pierce (35.9%). All other small Florida portsexperienced declines in container movements (section 6.2.2, table 6.9). Overall, theeleven ports in Florida that engage in container operations placed the state fourth in thenation for containerized cargo, following California, Washington, and New York/NewJersey (FSTED, 2008).
U.S. Seaports and National Economic Impacts
In 2007, United States deepwater seaports and businesses directly dependent on thenation’s ports generated approximately 8 million jobs and contributed $2T to the nationaleconomy. Businesses related to managing imports and exports, (“retailers, wholesalers,
manufacturers, distributors and logistics companies”) provided almost 7 million jobs.Firms that assist with seaport goods and services provided $315B for wages and salaries,of which, $207B derived from businesses involved specifically with internationalwaterborne commerce (Martin Associates, 2007).
6.2.1 Atlantic and Gulf Coast Comparisons
The Atlantic Coast of Florida provides a significantly higher economic contribution at$64B in trade, than the Gulf Coast, which added $9B of trade in 2007 (tables 6.2, 6.3).Although Gulf Coast trade grew in value by 26.8% in 2006, that figure droppeddramatically in 2007 to -11.2% (figure 6.2). The volume of shipments through Gulf portsdecreased by -7.2%, seven points lower than the previous year. The Atlantic Coast
experienced similar growth rate slowdowns but to a lesser extent. Growth among AtlanticCoast ports slowed to 1.7%, down from 14.2% in 2006. The volume shipments onFlorida’s Atlantic Coast fell by over 3M tons or -4.8% compared to 2006. Domestic traderemained steady on the Gulf Coast at around 30M tons, although ports on the AtlanticCoast experienced a drop to 22M tons in domestic trading, down almost seven milliontons from the previous year.
Table 6.2 Gulf vs. Atlantic, Trade Values
SOURCE: U.S. Census Bureau, Foreign Trade Division.
Measure Gulf Coast Atlantic Coast
Imports $5,805,198,203 $34,609,889,525
Exports $3,090,332,508 $29,878,053,806
Total Value 2007 $8,895,530,711 $64,487,943,331Total Value 2006 $10,022,553,009 $63,435,106,749
% Change -11.2% 1.7%
Total Change -$1,127,022,298 $1,052,836,582
Note: These waterborne numbers are based on port level data using the District of Unloading methodology to obtain slightly differentresults than the Enterprise Florida methodology ($113.1 billion vs. $114.9 billion, which includes commodities moving over land, sea,and air). The 2006 numbers have been revised from those previously shown. Referenced from FSTED, 2008.*The cargo values indicated for these locations reflect operations other than at the specific port docks, as calculated by the federalgovernment.
48

8/9/2019 Florida's Ocean and Coastal Economies Report Phase 2
http://slidepdf.com/reader/full/floridas-ocean-and-coastal-economies-report-phase-2 63/219
Table 6.3 Gulf vs. Atlantic, Trade Volume
Measure Gulf Coast Atlantic Coast
Imports 18,256,657 32,013,943
Exports 7,855,119 11,231,035
Domestic 29,826,387 22,060,018
Total Volume 2007 55,938,163 65,304,996
Total Volume 2006 60,248,199 68,592,962
% Change -7.2% -4.8%
Total Change -4,310,036 -3,287,966SOURCE: Individual seaport data. Referenced from FSTED, 2008.
-20.0%
-10.0%
0.0%
10.0%
20.0%
30.0%
40.0%
50.0%
60.0%
Atlantic Volum e Gulf Volum e Atlantic Value Gulf Value
2005 2006 2007
SOURCE: Individual seaport data and U.S. Census Bureau, Foreign Trade Division. Referenced from FSTED, 2008. Figure 6.2 Percentage Changes of Cargo Values and Volume 2005-2007
6.2.2 County Comparisons (by Port)
Although Florida’s ports are all part of a state system, county totals are reported to provide local managers information about the engines that drive their local revenues.11 Each of Florida’s ports is located within an individual county. Those grouped by Gulf and Atlantic Coast are listed and illustrated below (table 6.4, figure 6.2).
Table 6.4 Associated Counties of the Individual Florida Ports
Gulf Coast Atlantic Coast
Port County Port County
Key West∗ Monroe Canaveral Brevard
Manatee Manatee Everglades Everglades
Panama City Bay Fernandina Nassau
Pensacola Escambia Fort Pierce St. Lucie
St. Joe Gulf Jacksonville Duval
St. Petersburg Pinellas Miami Miami/Dade
Tampa Hillsborough Palm Beach Palm Beach∗ The Port of Key West is located in the 33040 zip code of Monroe County and for this study is being included in the Gulf of Mexicoregion.
11 The NOEP has a policy of reporting count level data for all sectors to ensure comparability and consistency in reporting.
49

8/9/2019 Florida's Ocean and Coastal Economies Report Phase 2
http://slidepdf.com/reader/full/floridas-ocean-and-coastal-economies-report-phase-2 64/219
Florida’s Waterborne Trade Values
In 2007, Florida imported and exported over $73B worth of goods through its seaports toand from foreign countries (table 6.5), a 1.5% increase over 2006. Containerized cargoslightly decreased by 0.1% or $36M (FSTED, 2008).
Table 6.5 Total Value and Containerized Cargo Value
2007 2006
Seaport Total ValueContainerizedCargo Value Total Value
ContainerizedCargo Value
Change TotalValue 2006-
2007
Canaveral $589,237,166 $12,303,286 $663,864,116 $21,181,835 -11.2%
Everglades $20,298,083,644 $11,676,338,216 $17,980,876,535 $10,382,259,685 12.9%
Fernandina $370,042,527 $231,137,781 $398,110,141 $248,093,478 -7.1%
Fort Pierce $120,511,831 $10,349,013 $95,074,861 $4,965,581 26.8%
Jacksonville $20,936,022,863 $3,335,485,797 $20,623,343,689 $3,699,869,891 1.5%
Key West* $6,096,391 $1,893,634 $11,723,443 $5,967,381 -48.0%
Manatee $901,227,703 $172,065,973 $927,875,827 $234,987,014 -2.9%
Miami $20,363,437,047 $15,670,086,974 $20,883,511,146 $16,341,782,648 -2.5%
Palm Beach $1,810,608,253 $1,575,113,708 $1,923,266,887 $1,630,239,514 -5.9%Panama City $3,672,774,701 $1,164,970,230 $4,630,093,290 $1,529,645,282 -20.7%
Pensacola $10,802,653 $183,973 $42,834,256 $8,211,174 -74.8%
St. Petersburg $83,182,427 $872,240 $107,934 $43,397 76967.9%
Tampa $4,221,446,836 $494,650,356 $4,111,830,860 $274,064,160 2.7%
Total $73,383,474,042 $34,345,451,181 $72,292,512,985 $34,381,311,040 1.5%SOURCE: U.S. Census Bureau, Foreign Trade Division.Note: These waterborne numbers are based on port level data using the District of Unloading methodology to obtain slightly different results thanthe Enterprise Florida methodology ($113.1 billion vs. $114.9 billion, which includes commodities moving over land, sea, and air). The 2006numbers have been revised from those previously shown. Referenced from FSTED, 2008.*The cargo values indicated for these locations reflect operations other than at the specific port docks, as calculated by the federal government.
Table 6.6 presents the value of Florida’s waterborne international imports and exports. In2007, Florida’s seaports imported $40B (55.1%) and exported $33B (44.9%) worth of goods. Growth in Florida’s waterborne exports has increased over the past two years.Florida’s waterborne imports declined 5.6% to $40B in 2007, while waterborne exportsincreased 11.6% to $33B in 2007.
Table 6.6 Dollar Value of Florida’s Exports and Imports by Port, 2007
Port Imports Exports Total 2007 Total 2006% Change2006-2007
Canaveral $484,279,119 $104,958,047 $589,237,166 $663,864,116 -11.20%
Everglades $10,850,209,373 $9,447,874,271 $20,298,083,644 $17,980,876,535 12.90%
Fernandina $87,004,091 $283,038,436 $370,042,527 $398,110,141 -7.10%
Fort Pierce $7,044,074 $113,467,757 $120,511,831 $95,074,861 26.80%Jacksonville $11,938,334,438 $8,997,688,425 $20,936,022,863 $20,623,343,689 1.50%
Key West* $767,200 $5,329,191 $6,096,391 $11,723,443 -48.00%
Manatee $766,263,313 $134,964,390 $901,227,703 $927,875,827 -2.90%
Miami $10,677,045,463 $9,686,391,584 $20,363,437,047 $20,883,511,146 -2.50%
Palm Beach $565,972,967 $1,244,635,286 $1,810,608,253 $1,923,266,887 -5.90%
Panama City $3,099,999,043 $572,775,658 $3,672,774,701 $4,630,093,290 -20.70%
Pensacola $3,554,632 $7,248,021 $10,802,653 $42,834,256 -74.80%
50

8/9/2019 Florida's Ocean and Coastal Economies Report Phase 2
http://slidepdf.com/reader/full/floridas-ocean-and-coastal-economies-report-phase-2 65/219
Port Imports Exports Total 2007% Change
Total 2006 2006-2007
St. Petersburg* $79,481,990 $3,700,437 $83,182,427 $107,934 76967.90%
Tampa $1,855,132,025 $2,366,314,811 $4,221,446,836 $4,111,830,860 2.70%
Total $40,415,087,728 $32,968,386,314 $73,383,474,042 $72,292,512,985 1.50%SOURCE: U.S. Census Bureau, Foreign Trade Division.Note: These waterborne numbers are based on port level data using the District of Unloading methodology to obtain slightly differentresults than the Enterprise Florida methodology ($113.1 billion vs. $114.9 billion, which includes commodities moving over land, sea,and air). The 2006 numbers have been revised from those previously shown. Referenced from FSTED, 2008.*The cargo values indicated for these locations reflect operations other than at the specific port docks, as calculated by the federalgovernment.
Three of Florida’s ports represent 84% of the value generated by cargo shipping. Theports of Jacksonville, Miami, and Everglades almost equally shared Florida’s cargovalues in 2007, at approximately $20B for each port (figure 6.3).
Everglades
28%
Miami
28%
Key West
0%Jacksonville
28%
Pensacola
0%
Fernandina
1%
Manatee
1%
Palm Beach
2%
Panama City5%
Tampa
6%
St. Petersburg
0%
Canaveral
1%
Fort Pierce
0%
SOURCE: U.S. Census Bureau, Foreign Trade Division. Referenced from FSTED, 2008.
Figure 6.3 Distribution of Florida Seaports based on Total Value, FY 2006
Florida’s Waterborne Trade Volume
Florida’s waterborne trade in FY 2007 declined 5.9% from 128M tons to 121M tons.According to the Florida Seaport Transportation and Economic Development Council the
decline corresponds with trade decreases experienced across the nation, economicdownturn, and construction industry declines (FSTED, 2008).
Table 6.7 presents imports, exports, and domestic tonnage for Florida seaports in FY2007 and FY 2006. Imports at Florida’s seaports comprised 41.5% of the total 121M tonsin FY 2007, which is a slight decrease from 42% in FY 2006. Florida’s seaport exportscomprised 15.7% of all waterborne trade in FY 2007, compared to 13.6% in FY 2006.
51

8/9/2019 Florida's Ocean and Coastal Economies Report Phase 2
http://slidepdf.com/reader/full/floridas-ocean-and-coastal-economies-report-phase-2 66/219
Finally, domestic cargo represented 42.8% of all waterborne trade down from 44.1% inFY 2006.
Table 6.7 Florida’s Total Waterborne Trade, Tons
Seaport Imports Exports Domestic Total
Canaveral 3,008,441 219,115 344,650 3,572,206
Everglades 13,141,831 3,246,951 9,213,368 25,602,150Fernandina 107,324 440,384 - 547,708
Fort Pierce 61,000 265,000 130,000 456,000
Jacksonville 9,930,000 1,706,000 12,372,000 24,008,000
Manatee 7,448,910 1,368,158 - 8,817,068
Miami 4,373,190 3,461,942 - 7,835,132
Palm Beach 1,392,157 1,891,643 - 3,283,800
Panama City 855,844 331,353 115,150 1,302,347
Pensacola 446,254 26,318 52,671 525,243
Tampa 9,505,649 6,129,290 29,658,566 45,293,505
FY 06/07 50,270,600 19,086,154 51,886,405 121,243,159
FY 05/06 54,415,945 17,586,418 56,838,798 128,841,161
SOURCE: Individual seaport data. Referenced from FSTED, 2008.
Domestic cargo includes goods “transported in the coastwise trade between two or morestates or between the United States and Puerto Rico (FSTED, 2008).” Liquid and drybulk commodities include petroleum and phosphate products, sugar, aggregates, and areamong typical domestic cargo. Domestic cargo fell to 52M tons in FY 2007, whichrepresents an 8.7% decline compared to the previous year. Domestic tonnage helps tomeet Florida’s fuel demand and the construction industry’s needs. Petroleum is a majordomestic cargo good that is traded primarily through the Ports of Tampa, Everglades, andJacksonville (figure 6.4).
Jacksonville
20%
Everglades
22%
Tampa
38%
Pensacola
0%
Fort Pierce
0%
Panama City
1%
Manatee
7%
Miami
6%
Canaveral
3%
Palm Beach
3%
Fernandina
0%
SOURCE: Individual seaport data. Referenced from FSTED, 2008. Figure 6.4 Distribution of Florida’s Seaports by Tons, FY 2007
52

8/9/2019 Florida's Ocean and Coastal Economies Report Phase 2
http://slidepdf.com/reader/full/floridas-ocean-and-coastal-economies-report-phase-2 67/219
Import tonnage declined by 7.6% since FY 2006, while exports increased by 8.5%, whichdemonstrate the changing global market and the rise and fall of individual country’scurrencies (FSTED, 2008). In addition, high-value exports help to balance trade of Florida’s imports and exports. FY 2007 reversed the trend of increasing imports anddecreasing exports from the previous year. Figure 6.5 provides the 2007 volumes of
imports and exports for the individual Florida ports.
0
2
4
6
8
10
12
14
Fort Pierce Fernandina Pensacola Panama City Palm Beach Canaveral Miami Manatee Tampa Jacksonville Everglades
M i l l i o n s o f T o n s
Imports
Exports
SOURCE: Individual seaport data. Figure 6.5 Florida Ports Import vs. Export Tonnage, FY 2007
Table 6.8 depicts the different types of cargo that were carried through Florida’s seaportsin FY 2007. Liquid bulk, which includes mainly petroleum products, at approximately61M tons, made up 50% of the weight transferred through the seaports, dry bulk was32M tons (27%), general cargo 24M tons (20%), and break-bulk was 4M tons (3%)(figure 6.6). Containerized cargo is included within the general cargo category.
Table 6.8 Cargo Types Carried at Florida’s Seaports FY 2007Seaport Dry Bulk Liquid Bulk Breakbulk General Cargo* Total
Canaveral 1,806,341 1,251,171 - 514,694 3,572,206
Everglades 1,752,974 17,486,726 302,301 6,060,149 25,602,150
Fernandina - - 362,474 185,234 547,708
Fort Pierce 155,000 5,000 53,000 243,000 456,000
Jacksonville 6,163,000 9,983,000 1,341,000 6,521,000 24,008,000
Manatee 1,886,635 5,851,577 1,038,263 40,593 8,817,068
Miami - - 46,835 7,788,297 7,835,132
Palm Beach 774,073 1,179,519 109,113 1,221,095 3,283,800PanamaCity 313,764 39,029 652,212 297,342 1,302,347
Pensacola 442,921 46,432 35,890 - 525,243Tampa 19,060,630 24,854,949 - 1,377,926 45,293,505
Total 32,355,338 60,697,403 3,941,088 24,249,330 121,243,159SOURCE: Individual seaport data. Referenced from FSTED, 2008. *Includes containerized cargo.
53
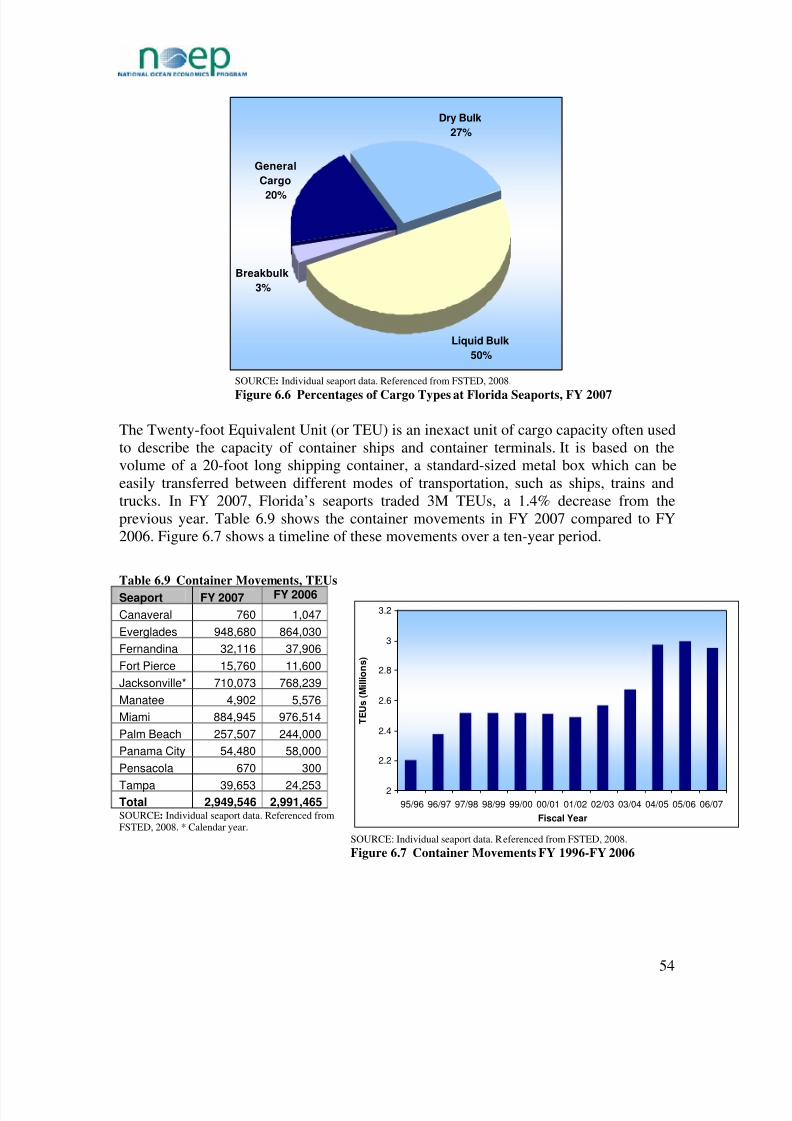
8/9/2019 Florida's Ocean and Coastal Economies Report Phase 2
http://slidepdf.com/reader/full/floridas-ocean-and-coastal-economies-report-phase-2 68/219
Dry Bulk
27%
Liquid Bulk
50%
Breakbulk
3%
General
Cargo
20%
SOURCE: Individual seaport data. Referenced from FSTED, 2008.
Figure 6.6 Percentages of Cargo Types at Florida Seaports, FY 2007
The Twenty-foot Equivalent Unit (or TEU) is an inexact unit of cargo capacity often usedto describe the capacity of container ships and container terminals. It is based on thevolume of a 20-foot long shipping container, a standard-sized metal box which can beeasily transferred between different modes of transportation, such as ships, trains andtrucks. In FY 2007, Florida’s seaports traded 3M TEUs, a 1.4% decrease from theprevious year. Table 6.9 shows the container movements in FY 2007 compared to FY2006. Figure 6.7 shows a timeline of these movements over a ten-year period.
Table 6.9 Container Movements, TEUs
Seaport FY 2007 FY 2006
Canaveral 760 1,047
Everglades 948,680 864,030
Fernandina 32,116 37,906
Fort Pierce 15,760 11,600
Jacksonville* 710,073 768,239
Manatee 4,902 5,576
Miami 884,945 976,514
Palm Beach 257,507 244,000
Panama City 54,480 58,000
Pensacola 670 300
Tampa 39,653 24,253Total 2,949,546 2,991,465SOURCE: Individual seaport data. Referenced fromFSTED, 2008. * Calendar year. SOURCE: Individual seaport data. Referenced from FSTED, 2008.
2
2.2
2.4
2.6
2.8
3
3.2
95/96 96/97 97/98 98/99 99/00 00/01 01/02 02/03 03/04 04/05 05/06 06/07
Fiscal Year
T E U s ( M i l l i o n s )
Figure 6.7 Container Movements FY 1996-FY 2006
54

8/9/2019 Florida's Ocean and Coastal Economies Report Phase 2
http://slidepdf.com/reader/full/floridas-ocean-and-coastal-economies-report-phase-2 69/219
Florida’s ports vary in container handling capacity, although some ports move moretonnage, others are importing and exporting more boxes of cargo. The Port of Evergladesmoves almost 900,000 TEU’s of cargo, the largest amount in Florida in FY 2007. Fourports comprise 95% of cargo TEU’s that transport through Florida’s ports (figure 6.8).
Jacksonville
24%
Miami
30%
Everglades
32%
Pensacola
0%
Canaveral
0%
Manatee
0%
Fort Pierce
1%
Fernandina
1%
Tampa
1%
Panama City
2%
Palm Beach
9%
SOURCE: Individual seaport data. Referenced from FSTED, 2008. Figure 6.8 Distribution of Florida Seaports based on Container Movements, 2007
6.2.3 Capital Improvements
Seaports continually need to update their capital assets in order to accommodate thechanging dynamics of the shipping industry. Typical capital improvements are expensiveand sometimes large-scale projects, which can include creating deeper channels, longer,stronger berths, and bigger cranes. This section examines the estimated expendituresneeded to complete capital improvements per individual port. The Collective SeaportFive-Year Capital Improvement Program outlines the estimated expenses required toundertake each of Florida’s seaports projected capital improvements.
Table 6.10 outlines the estimated cost of capital improvements, provided by theindividual seaports, and included in the most recent Collective Seaport Five-Year CapitalImprovement Program. Overall, Florida’s ports have determined their estimated fundingfor capital improvements at over $615M for FY 2008. All estimated capitalimprovements for the entire five-year period totals over $2B collectively for all of theports (FSTED, 2008). The top five most expensive port improvements for FY 2008 areall estimated to range from $30M-$300M. The Port of Jacksonville comprises 49% of allestimated port capital improvements at $293M for FY 2008 and include major road andsite improvements, followed by Port Everglades and Port of Tampa with 17% ($100M)and 11% ($69M) of all capital improvements, respectively (figure 6.9).
55
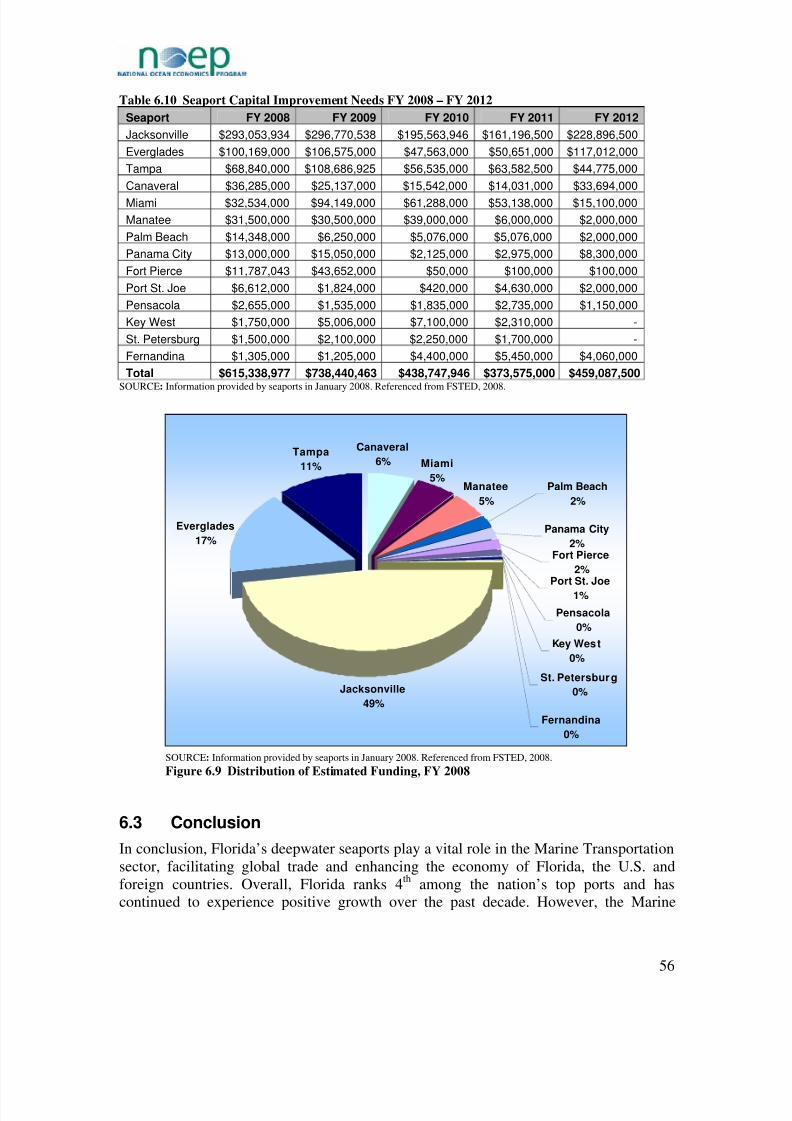
8/9/2019 Florida's Ocean and Coastal Economies Report Phase 2
http://slidepdf.com/reader/full/floridas-ocean-and-coastal-economies-report-phase-2 70/219
Table 6.10 Seaport Capital Improvement Needs FY 2008 – FY 2012
Seaport FY 2008 FY 2009 FY 2010 FY 2011 FY 2012
Jacksonville $293,053,934 $296,770,538 $195,563,946 $161,196,500 $228,896,500
Everglades $100,169,000 $106,575,000 $47,563,000 $50,651,000 $117,012,000
Tampa $68,840,000 $108,686,925 $56,535,000 $63,582,500 $44,775,000
Canaveral $36,285,000 $25,137,000 $15,542,000 $14,031,000 $33,694,000
Miami $32,534,000 $94,149,000 $61,288,000 $53,138,000 $15,100,000
Manatee $31,500,000 $30,500,000 $39,000,000 $6,000,000 $2,000,000
Palm Beach $14,348,000 $6,250,000 $5,076,000 $5,076,000 $2,000,000
Panama City $13,000,000 $15,050,000 $2,125,000 $2,975,000 $8,300,000
Fort Pierce $11,787,043 $43,652,000 $50,000 $100,000 $100,000
Port St. Joe $6,612,000 $1,824,000 $420,000 $4,630,000 $2,000,000
Pensacola $2,655,000 $1,535,000 $1,835,000 $2,735,000 $1,150,000
Key West $1,750,000 $5,006,000 $7,100,000 $2,310,000 -
St. Petersburg $1,500,000 $2,100,000 $2,250,000 $1,700,000 -
Fernandina $1,305,000 $1,205,000 $4,400,000 $5,450,000 $4,060,000
Total $615,338,977 $738,440,463 $438,747,946 $373,575,000 $459,087,500SOURCE: Information provided by seaports in January 2008. Referenced from FSTED, 2008.
Tampa
11%
Everglades
17%
Jacksonville
49%
Miami
5%
Canaveral
6%
Port St. Joe
1%
Fort Pierce
2%
Panama City
2%
Palm Beach
2%
Manatee
5%
Fernandina
0%
St. Petersburg
0%
Key West
0%
Pensacola
0%
SOURCE: Information provided by seaports in January 2008. Referenced from FSTED, 2008. Figure 6.9 Distribution of Estimated Funding, FY 2008
6.3 Conclusion
In conclusion, Florida’s deepwater seaports play a vital role in the Marine Transportationsector, facilitating global trade and enhancing the economy of Florida, the U.S. andforeign countries. Overall, Florida ranks 4
thamong the nation’s top ports and has
continued to experience positive growth over the past decade. However, the Marine
56

8/9/2019 Florida's Ocean and Coastal Economies Report Phase 2
http://slidepdf.com/reader/full/floridas-ocean-and-coastal-economies-report-phase-2 71/219
Transportation sector, along with a number of other ocean and coastal industries is notsheltered from financial volatility and a changing global market. Thus, the MarineTransportation sector has seen declines throughout the port industries as reported by theFY 2007 numbers and values. Although the volume of goods being traded has beenreduced, the value of these goods appreciated illustrating the ability of Florida’s trade
market to adapt. In an industry that generates $2T for the national economy, Florida’seconomic contribution is significant in terms of its share of the market at 3.7% or $73B inFY 2008 and growth rate of 105.3% over the past decade to help sustain the jobs, wages,and income for the State of Florida and its citizens.
57
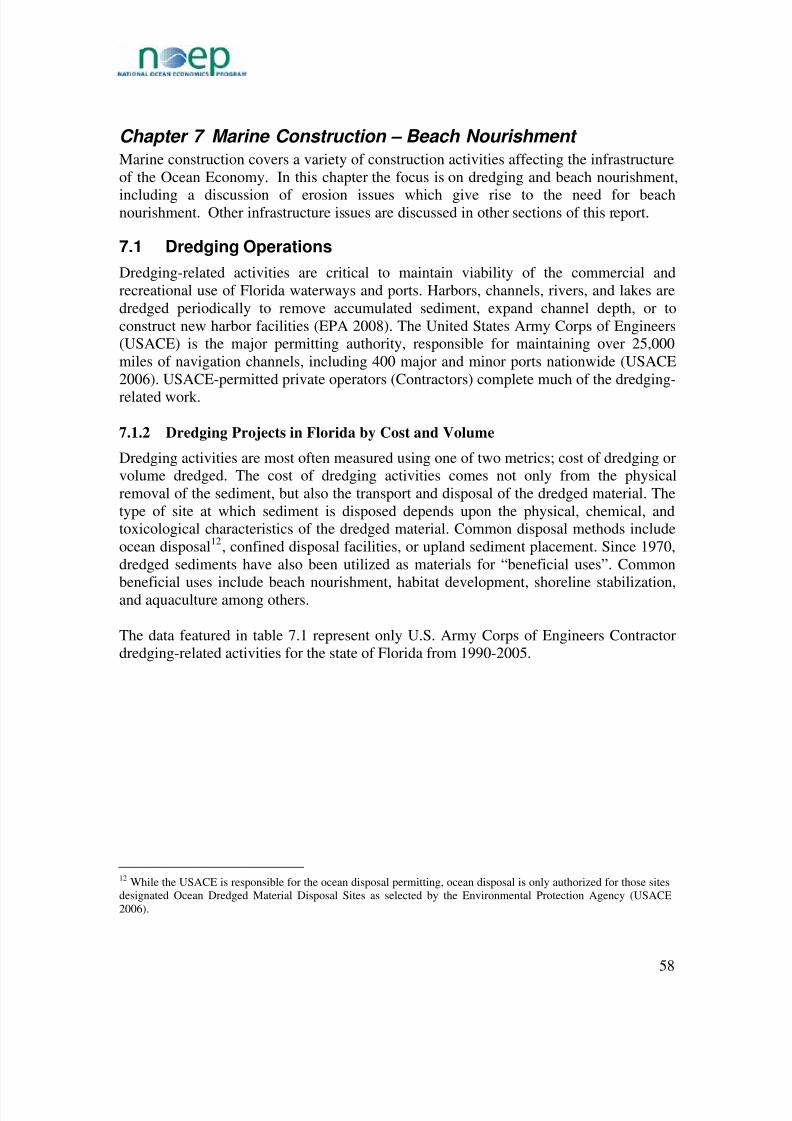
8/9/2019 Florida's Ocean and Coastal Economies Report Phase 2
http://slidepdf.com/reader/full/floridas-ocean-and-coastal-economies-report-phase-2 72/219
Chapter 7 Marine Construction – Beach Nourishment
Marine construction covers a variety of construction activities affecting the infrastructureof the Ocean Economy. In this chapter the focus is on dredging and beach nourishment,
including a discussion of erosion issues which give rise to the need for beachnourishment. Other infrastructure issues are discussed in other sections of this report.
7.1 Dredging Operations
Dredging-related activities are critical to maintain viability of the commercial andrecreational use of Florida waterways and ports. Harbors, channels, rivers, and lakes aredredged periodically to remove accumulated sediment, expand channel depth, or toconstruct new harbor facilities (EPA 2008). The United States Army Corps of Engineers(USACE) is the major permitting authority, responsible for maintaining over 25,000miles of navigation channels, including 400 major and minor ports nationwide (USACE2006). USACE-permitted private operators (Contractors) complete much of the dredging-
related work.
7.1.2 Dredging Projects in Florida by Cost and Volume
Dredging activities are most often measured using one of two metrics; cost of dredging orvolume dredged. The cost of dredging activities comes not only from the physicalremoval of the sediment, but also the transport and disposal of the dredged material. Thetype of site at which sediment is disposed depends upon the physical, chemical, andtoxicological characteristics of the dredged material. Common disposal methods includeocean disposal12, confined disposal facilities, or upland sediment placement. Since 1970,dredged sediments have also been utilized as materials for “beneficial uses”. Common
beneficial uses include beach nourishment, habitat development, shoreline stabilization,and aquaculture among others.
The data featured in table 7.1 represent only U.S. Army Corps of Engineers Contractordredging-related activities for the state of Florida from 1990-2005.
12 While the USACE is responsible for the ocean disposal permitting, ocean disposal is only authorized for those sitesdesignated Ocean Dredged Material Disposal Sites as selected by the Environmental Protection Agency (USACE2006).
58

8/9/2019 Florida's Ocean and Coastal Economies Report Phase 2
http://slidepdf.com/reader/full/floridas-ocean-and-coastal-economies-report-phase-2 73/219
Table 7.1 Time Series of Contracted Dredging by the USACE in Florida 1990-2005
Fiscal Year Volume (CY) Cost (2000 U.S.$)
1990 889,079 $ 4,561,192
1991 4,317,721 $ 3,851,074
1992 7,012,545 $ 24,840,169
1993 5,383,234 $ 16,725,430
1994 4,090,485 $ 18,807,199
1995 8,311,383 $ 20,896,532
1996 4,344,306 $ 15,983,943
1997 6,900,256 $ 17,524,366
1998 23,234,889 $ 24,007,049
1999 4,742,959 $ 15,538,584
2000 4,549,030 $ 40,878,494
2001 1,144,253 $ 18,931,045
2002 974,586 $ 4,267,356
2003 893,849 $ 6,134,090
2004 1,500 $ 174,095
2005 263,415 $ 3,273,356
Total 77,053,490 $ 236,393,975
Figure 7.1 displays the annual cost and volume of contracted dredging from 1990 through2005. Volume of dredged material peaked in 1998 with over $23M cubic yards removed.Since that time, dredging volumes have decreased and remained low. The highestexpenditures on dredging occurred in 2000 with a value of almost $41M, despite arelatively low volume of dredged material for the same year. Overall, costs increasedduring the period of 1990 to 2000 and have declined sharply since.
59

8/9/2019 Florida's Ocean and Coastal Economies Report Phase 2
http://slidepdf.com/reader/full/floridas-ocean-and-coastal-economies-report-phase-2 74/219
$0
$5,000,000
$10,000,000
$15,000,000
$20,000,000
$25,000,000
$30,000,000
$35,000,000
$40,000,000
$45,000,000
1990 1991 1992 1993 1994 1995 1996 1997 1998 1999 2000 2001 2002 2003 2004 2005
C o s t ( 2 0 0 0 U S $ )
0
5,000,000
10,000,000
15,000,000
20,000,000
25,000,000
V o l u m e ( C Y )
Volume (CY)
Cost (2000US$)
Figure 7.1 Time Series of Contracted Dredging by the USACE in Florida 1990-2005
7.2 Beach Nourishment
Over 485 miles, or approximately 59% of Florida’s beaches, are experiencing erosion.At present, about 387 of the state's 825 miles of sandy beaches have experienced ‘criticalerosion’, a level of erosion which threatens substantial development, recreational,
cultural, or environmental interests (Florida DEP, 2008). While some of this erosion canbe attributed to natural forces and coastal development, most of it is caused by thebuilding up of jetties and the construction and deepening of navigation inlets. Often, the jetties and inlet channels interrupt the natural flow of sand, causing a build-up of sand inthe inlet channels on one side of the jetty and a loss of sand to the beaches on the otherside of the jetty (Catanese Center-FAU, 2003).
Beaches are an important source of revenue for the state. Beaches have multiple benefitsincluding enhancing property values, protection from storm surges, providing habitat forplants and animals and providing employment, wages, and income to the state. In 2000,over 23.2 million tourists visited Florida’s beaches. Total spending, including direct and
indirect spending, by beach visitors was estimated at $41.6B, with $700M in sales taxrevenues from direct tourist spending (Catanese Center-FAU, 2003).
Beach nourishment is one method to restore beaches that have been eroded. A typicalbeach nourishment project includes dredging sand from offshore and then piping it ontothe beach. Bulldozers are then used to move this new sand around. Florida has led thenation in terms of spending for beach nourishment activities. From 1960-2007 Florida
60

8/9/2019 Florida's Ocean and Coastal Economies Report Phase 2
http://slidepdf.com/reader/full/floridas-ocean-and-coastal-economies-report-phase-2 75/219
spent $1.1B on beach nourishment activities. Currently local, state, and federal entitiesare managing over 192 miles of restored beaches in Florida (Florida DEP, 2008).
7.2.1 Beach Nourishment Projects in Florida compared to States by Cost and
Volume
Florida has spent the most of any state on beach nourishment activities since 1960 andaccounted for 40% of national combined total spending (figure 7.2). During this timeFlorida spent $1.1B followed by New Jersey ($545M) and New York ($228M). NorthCarolina, Virginia, and South Carolina all spent between $100M and $200M. NorthCarolina spent at $197M, Virginia spent $149M and South Carolina at $118M. Marylandand California, two drastically different sized states, spent $90M and $71M respectively.And, finally, Louisiana spent $50M and Georgia spent $25M. While data exists forTexas, many of the values were unable to be integrated into the database. The geographicdistribution, particularly of grouped states such as North Carolina, Virginia, and SouthCarolina, and the size of certain states versus their respective expenditures is notable.While Florida had the strongest expenditures, the two states following were smaller
northern states, and directly following New Jersey and New York were three Mid-Atlantic States.
Florida
New Jersey
New York
North Carolina
Georgia
Louisiana
Virginia South Carolina
California
Maryland
SOURCE: Western Carolina University PSDS beach nourishment database Figure 7.2 Top Ten Beach Nourishment States in the U.S. by Cost 1960-2007
While Florida was the location of the most spending for beach nourishment activities,California placed the most volume of sand on its beaches (figure 7.3). From 1960-2007California placed 664,474,853 cubic yards, followed by Florida (223,336,719 cy). NewJersey followed Florida at 148,368,829 cubic yards, and New York at 106,214,296 cubicyards. Virginia and Louisiana placed similar amounts of sand in beach nourishment
61
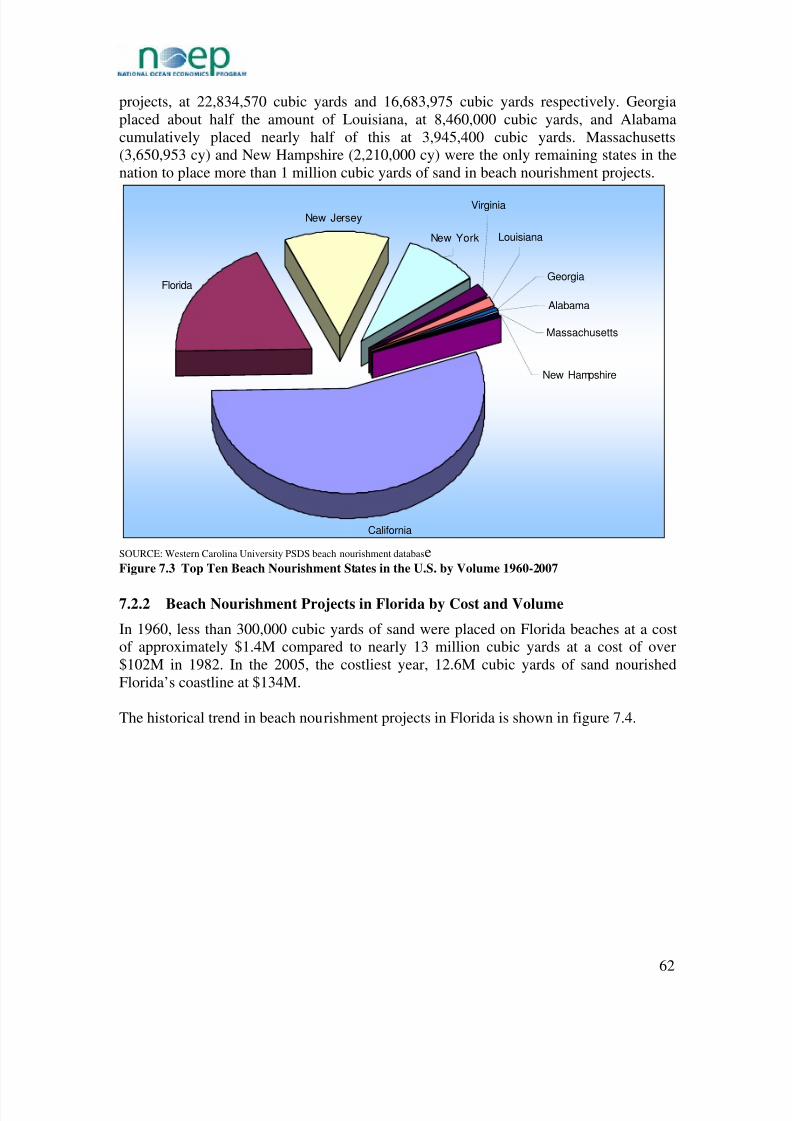
8/9/2019 Florida's Ocean and Coastal Economies Report Phase 2
http://slidepdf.com/reader/full/floridas-ocean-and-coastal-economies-report-phase-2 76/219
projects, at 22,834,570 cubic yards and 16,683,975 cubic yards respectively. Georgiaplaced about half the amount of Louisiana, at 8,460,000 cubic yards, and Alabamacumulatively placed nearly half of this at 3,945,400 cubic yards. Massachusetts(3,650,953 cy) and New Hampshire (2,210,000 cy) were the only remaining states in thenation to place more than 1 million cubic yards of sand in beach nourishment projects.
California
Florida
New Jersey
New York
Georgia
Alabama
Louisiana
Virginia
Massachusetts
New Hampshire
SOURCE: Western Carolina University PSDS beach nourishment databaseFigure 7.3 Top Ten Beach Nourishment States in the U.S. by Volume 1960-2007
7.2.2 Beach Nourishment Projects in Florida by Cost and Volume
In 1960, less than 300,000 cubic yards of sand were placed on Florida beaches at a costof approximately $1.4M compared to nearly 13 million cubic yards at a cost of over$102M in 1982. In the 2005, the costliest year, 12.6M cubic yards of sand nourishedFlorida’s coastline at $134M.
The historical trend in beach nourishment projects in Florida is shown in figure 7.4.
62

8/9/2019 Florida's Ocean and Coastal Economies Report Phase 2
http://slidepdf.com/reader/full/floridas-ocean-and-coastal-economies-report-phase-2 77/219
0
2000000
4000000
6000000
8000000
10000000
12000000
14000000
1960 1965 1970 1975 1980 1985 1990 1995 2000 2005
V o l u m e ( c u b
i c y a r d s )
$0
$200
$400
$600
$800
$1,000
$1,200
$1,400
$1,600
C o s t ( 1 0 0 , 0 0 0 U S $ )
Volume (CY)
Cost
SOURCE: Western Carolina University PSDS beach nourishment database
Figure 7.4 Cost and Volume of Beach Nourishment Projects in Florida 1960-2005
7.2.3 Beach Nourishment Projects within Florida’s Counties by Volume
The Atlantic Coast of Florida is the location for the largest number of beach nourishmentprojects. Although the Atlantic Coast makes up only 38% of the shoreline, 59% of thesand from these projects is in Atlantic Coast counties, while 41% of the volume of sand isfrom the Gulf Coast. Table 7.2 highlights the volume of sand associated with individualcounties from each coastline. Some key counties, particularly along the Atlantic Coast,are Duval, Brevard, Indian River, Palm Beach, and Miami-Dade Counties. In the Gulf region, Escambia, Bay, Pinellas, and Sarasota are notable counties.
Table 7.2 Volume of Beach Nourishment Projects by County 1944-2006GULF COAST ATLANTIC COAST
County Volume (cy) County Volume (cy)
Escambia 19,738,897 Nassau 6,768,235
Santa Rosa 75,300 Duval 12,241,000
Okaloosa 433,000 St. Johns 7,930,000
Walton 0 Flagler 0
Bay 13,865,240 Volusia 2,374,900
Gulf 1,332,000 Brevard 12,607,900
Franklin 138,000 Indian River 2,235,342
Wakulla 0 St. Lucie 4,866,940
Jefferson 0 Martin 3,919,576
Taylor 0 Palm Beach 49,343,405
Dixie 0 Broward 9,133,000
Levy 0 Miami-Dade 21,054,590
Citrus 0 Total 132,474,888
Hernando 0
63

8/9/2019 Florida's Ocean and Coastal Economies Report Phase 2
http://slidepdf.com/reader/full/floridas-ocean-and-coastal-economies-report-phase-2 78/219
GULF COAST
County Volume (cy)
Pasco 0
Hillsborough 0
Pinellas 15,884,094
Manatee 8,950,000
Sarasota 12,067,114
Charlotte 819,151
Lee 10,754,536
Collier 6,768,499
Monroe 66,000
Total 90,891,831 SOURCE: Western Carolina University PSDS beach nourishment database
Duval and Brevard County each accounted for approximately 10% of the volume of sandplaced along the Atlantic coastline from 1944 through 2006. Palm Beach and MiamiDade Counties made up the two largest contributors in the state. Palm Beach Countymade up 22% of state sand volume and Miami-Dade County contributed 9% of total sandvolume.
Along the Gulf Coast, the largest contributing county was Pinellas, a port county with 7%of Florida’s overall nourishment volume. Following Pinellas was Escambia County alongthe panhandle and bordering the Western edge of Florida. Escambia County contributedto 22% of the Gulf region’s volume in cubic yards of sand used in beach nourishment,and 9% of Florida sand placement. Bay County made up 15% of volume on the Gulf Coast, and 6% of volume in Florida as a whole. Sarasota County, located just one county
south of Pinellas County, made up 5% of total volume in Florida from 1944 through2006.
7.2.4 Funding for Beach Nourishment
Funding for beach nourishment activities in Florida comes from the Federal government,Emergency funds, State/Local funds, Local/Private sources, Non-federal sources, andfrom a Null category, which means there is no indication of where the data came from, orno available information for the project. Overall the Federal government has placed themost volume of sand on Florida’s beaches and spent the most money.
7.2.4.1 Sources of FundingThe total volume of sand placed on Florida’s beaches from 1960 to 2005 was 200M cubicyards at a cost of $817.2M (see table 7.3). During this time the Federal governmentplaced the most volume (72%) and spent the most money (87%) on beach nourishmentactivities, followed by State/Local agencies placing 14% of total volume on Florida’sbeaches and spending 7% of the total cost. Though Local/Private and Emergency sourcesdo not contribute a significant amount of funding, these are lower bound estimatesbecause not all activities have values associated with them.
64

8/9/2019 Florida's Ocean and Coastal Economies Report Phase 2
http://slidepdf.com/reader/full/floridas-ocean-and-coastal-economies-report-phase-2 79/219
Table 7.3 Funding Sources for Total Volume and Cost of Beach Nourishment 1960-2005
Funding Source Volume % Volume Cost % Cost
Local/Private 2,120,300 1.06% $ 5,048,875 0.62%
State/Local 28,919,284 14.49% $ 57,753,669 7.07%
Federal 144,599,859 72.47% $ 709,763,448 86.85%
Emergency13
355,300 0.18% $ 726,581 0.09%
Null/Other 23,532,746 11.79% $ 43,893,646 5.37%
Total 199,527,489 100.00% $ 817,186,219 100.00%SOURCE: Western Carolina University PSDS beach nourishment database
Figure 7.5 shows the break down by funding source of cost and volume placed for beachnourishment activities. The Federal government spent more money and placed morevolume than all of the other sources combined.
0% 10% 20% 30% 40% 50% 60% 70% 80%
Local/Private
State/Local
Non-federal
Federal
Emergency
Null
Percent of Program Funded
% Cost
% Volume
SOURCE: Western Carolina University PSDS beach nourishment database
Figure 7.5 Funding Sources for Total Volume and Cost of Beach Nourishment 1960-2005
7.2.4.2 Federal Funding Types by Volume
Because the Federal government places the most volume and incurs the greatest cost forbeach nourishment activities, this section determines where that money is being allocatedby volume. The majority of the volume has gone towards Storm and Erosion and
Navigation activities, with a combined contribution of 75% (table 7.4). Null was the thirdhighest for volume with 15% of total volume placed.
13The “Emergency” category in Table 7.3 and Figure 7.5 addresses the source where funding came from,while the “Emergency” category in Table 7.4 addresses what type of activity the Federal government’sfunding is going towards. As such, the values for the “Emergency” category in Table 7.4 can be seen withinthe “Federal” values of Table 7.3 and Figure 7.5.”
65

8/9/2019 Florida's Ocean and Coastal Economies Report Phase 2
http://slidepdf.com/reader/full/floridas-ocean-and-coastal-economies-report-phase-2 80/219
Table 7.4 Breakdown of Federal Funding Type for Total Volume 1960-2005
Funding Type Volume % VolumeFEMA Reimbursement 105,280 0.07%Minerals Management Service 1,500,000 1.01%Emergency
14 12,143,000 8.16%
Null/Other 22,996,113 15.45%
Navigation 37,074,088 24.91%Storm and Erosion 75,011,078 50.40%
Total 148,829,559 100.00%SOURCE: Western Carolina University PSDS beach nourishment database
7.2.4.3 DEP Regional Funding
The total number of miles of eroded beach has increased by 104 miles since 1989, from332 miles in 1989 to over 435 miles in 2002. In 1989, 218 miles of beach were ‘criticallyeroded’ and in 2003, approximately 333 miles were designated as ‘critically eroded’.Such erosion threatens private and public development and infrastructure and significantcultural and environmental resources (Schmidt & Woodruff, 1999). Of the critically
eroded shoreline in the state, just over 161 miles are being managed by the state”(Catanese Center-FAU, 2003).
Table 7.5 shows the different regions managed by Florida’s Department of Environmental Protection (DEP), including the miles of beach that are critically erodedand percent that is managed by the DEP. The Southwest Gulf is experiencing the mosterosion with 91 miles of its beaches critically eroded. This is followed by the SoutheastAtlantic (69 miles), the Panhandle Gulf (62 miles), and the Central Atlantic (55.8 miles).Monroe County, which makes up the Florida Keys, contains 7.7 miles of eroded beaches.The Southeast Atlantic has the highest percentage of beaches that are managed with 62%,followed by the Southwest Gulf (51%), the Central Atlantic (49%) and the Northeast
Atlantic (38%).Table 7.5 Department of Environmental Protection Regional Erosion, 2003
DEP
Region
Critically
Eroded Beaches
Percent
Managed
Northeast Atlantic 45.7 miles 38.0%
Central Atlantic 55.8 miles 49.0%
Southeast Atlantic 69.0 miles 62.0%
Florida Keys 7.7 miles 8.0%
Panhandle Gulf 62.0 miles 29.0%
Big Bend Gulf 1.7 miles 0%
Southwest Gulf 91.0 miles 51.0%
SOURCE: Catanese Center for Urban and Environmental Solutions at Florida Atlantic University 2003
Table 7.6 lists the counties in each DEP region.
14The “Emergency” category in Table 7.3 and Figure 7.5 addresses the source where funding came from,while the “Emergency” category in Table 7.4 addresses what type of activity the Federal government’sfunding is going towards. As such, the values for the “Emergency” category in Table 7.4 can be seen withinthe “Federal” values of Table 7.3 and Figure 7.5.”14
66

8/9/2019 Florida's Ocean and Coastal Economies Report Phase 2
http://slidepdf.com/reader/full/floridas-ocean-and-coastal-economies-report-phase-2 81/219
Table 7.6 Counties in Department of Environmental Protection Regions for Reference
DEP
Regions
Northeast
Atlantic
Central
Atlantic
Southeast
Atlantic
Florida
Keys
Panhandle
Gulf
Southwest
Gulf
Counties
in theRegion
DuvalFlagler
NassauSt. JohnsVolusia
BrevardMartin
St. Lucie/ IndianRiver
BrowardMiami-Dade
Palm Beach
Monroe Gulf Bay
EscambiaFranklinOkaloosaWalton
CharlotteCollier
LeeManateePinellasSarasota
SOURCE: Catanese Center for Urban and Environmental Solutions at Florida Atlantic University 2003
Figure 7.6 shows the sources of government funding in nominal values for beaches from1992-2002. During this time a total of 91 beach projects were completed or underway.From 1997-2002, about 55 miles of Florida’s beaches were restored or nourished. In2002, 27 miles of Florida’s beaches were restored or nourished (Catanese Center-FAU,2003).
SOURCE: Catanese Center for Urban and Environmental Solutions at Florida Atlantic University 2003Note: Nominal values
Figure 7.6 Main Sources of Funding for Beach Nourishment 1992-2002
Figure 7.7 breaks down the government funding totals by region from 1992-2002. TheSouthwest Gulf received the largest share of Federal funding, while the SoutheastAtlantic Coast received the largest share of both Local and State funding. The NortheastAtlantic Coast, the Panhandle Gulf and the Florida Keys received much less finding incomparison to the other regions.
67

8/9/2019 Florida's Ocean and Coastal Economies Report Phase 2
http://slidepdf.com/reader/full/floridas-ocean-and-coastal-economies-report-phase-2 82/219
Source: Catanese Center for Urban and Environmental Solutions at Florida Atlantic University 2003Note: Nominal values
Figure 7.7 Regional Funding for Beach Nourishment Projects 1992-2002
7.2.4 Additional Information: Beach Erosion
Erosion along Florida’s beaches is a major factor contributing to the need for beachnourishment projects. While construction projects and maintenance of ports, harbors,
jetties, and other infrastructure may require beach nourishment, the main cause fornourishment projects is the ever-present threat of erosion of Florida’s valuable coastline.Hurricanes and tropical storms can contribute significantly to the erosion of beaches, andespecially to those segments of shoreline already experiencing extreme rates of sedimentloss. The 2004 and 2005 Hurricane seasons alone tracked five hurricanes and tropicalstorms (Charley, Dennis, Frances, Jeanne, and Wilma) that passed through criticalerosion areas along Florida’s coastline. In addition, Hurricane Frances passed a secondand third time through two non-critically eroded zones, causing extensive erosion in theseotherwise moderately healthy areas. Figure 7.8 shows Florida’s 2005 Critical Erosionareas as classified by the State DEP Strategic Beach Management Plan.
68

8/9/2019 Florida's Ocean and Coastal Economies Report Phase 2
http://slidepdf.com/reader/full/floridas-ocean-and-coastal-economies-report-phase-2 83/219
SOURCE: Florida State Department of Environmental Protection Strategic Beach Management Plan
Figure 7.8 Map of Critical Erosion Areas in Florida
The Coastal Construction Control Line Program (CCCL) is an essential element of
Florida's coastal management program (CCCL, 2008). The CCCL was initiated by theFlorida legislature to protect coastal areas from poorly designed and improperly sitedstructures which can destroy or destabilize sensitive beach and dune areas. By adoptingthe CCCL, specific design and siting criteria are established for construction and otherrelated activities taking place in these sensitive areas. CCCL standards can be morestringent than those in the rest of the coastal building zone because of the higherlikelihood of damage to seaward areas during storm events. Figure 7.9 diagrams theCCCL as administered by the Florida Department of Environmental Protection. Noticethat there is significant overlap between the critical erosion areas and the CCCL, showingthat they both cover the same areas.
69

8/9/2019 Florida's Ocean and Coastal Economies Report Phase 2
http://slidepdf.com/reader/full/floridas-ocean-and-coastal-economies-report-phase-2 84/219
SOURCE: Florida State Department of Environmental Protection
Figure 7.9 Map of the Florida State Coastal Construction Control Line
7.3 ConclusionWhile some of the built infrastructure of Florida’s coast is discussed in other sections of this report, this chapter has highlighted the use of both dredging and beach nourishmentoperations to maintain and improve the vital coastline of the state. Dredging projects,permitted mostly through the U.S. Army Corps of Engineers (USACE), are typicallycarried out by private operators, or contractors. U.S. Army Corps of Engineers Contractoractivities dredged over 77M cubic yards of material out of Florida’s harbors, rivers, lakes,and channels from 1990-2005, at a cost of $236M. While disposal of dredged materialvaries, beneficial uses of clean dredge spoils for beach nourishment projects have beenoccurring since 1970.
Erosion along Florida’s coastline is also a pressing issue: 59% of Florida’s beaches areexperiencing erosion, and 387 of the state’s 825 miles of coastline are experiencingcritical erosion which threatens substantial development, recreational, cultural, orenvironmental assets. This may explain why from 1960-2007 Florida had the largestexpenditures in the nation for overall cost of beach nourishment projects, with 40% of national costs totaling $1.1B. Florida ranked second nationally in volume of sandnourished beaches, at 223M cubic yards from 1960-2007. The majority of activity is on
70

8/9/2019 Florida's Ocean and Coastal Economies Report Phase 2
http://slidepdf.com/reader/full/floridas-ocean-and-coastal-economies-report-phase-2 85/219
the Atlantic Coast with 59% of the sand placement from these projects, an area whichmakes up only 38% of the total U.S. coastline. The Federal government provided themajority of funds for beach nourishment activity, contributing $710M, or 87%, of totalfunds awarded from 1960-2005. The remainder of funds is provided by local, private,state, and emergency sources. The majority of the federal funds go towards storm and
erosion projects, which are over 50% of all activities. This is explainable in view of theamount of Florida’s beaches that are critically eroded, and the high number and intensityof storms which degrade Florida’s shorelines even further. Considering that totalspending by beach visitors was estimated at $41.6B in 2003, the money spent on beachnourishment activities is a necessary expense to sustain the massive tourism industry
ithin Florida which derives much of its revenue from beaches.w
71

8/9/2019 Florida's Ocean and Coastal Economies Report Phase 2
http://slidepdf.com/reader/full/floridas-ocean-and-coastal-economies-report-phase-2 86/219
Chapter 8 Coastal Tourism and Recreation – The Cruise Industry
8.1 Introduction to Florida’s Cruise Industry
Tourism & Recreation is the largest sector in Florida’s Ocean Economy and significantly
impacts the overall national economy. The sector includes the full range of tourism,leisure, and recreational activities that take place on coastal waters and in coastal areas.This chapter provides a discrete analysis of the cruise ship industry, since its vasteconomic influence warrants a separate discussion. The cruise ship industry is primarilymeasured by U.S. statistical codes in the transportation sector, but since tourism is theunderlying motive for those taking cruises and many of the impacts are on the tourismsector, it is appropriate to place it in the Tourism and Recreation sector.
The reader can refer to the Phase I report for further details regarding the other FloridaOcean Tourism & Recreation industries, which include Amusement and RecreationServices, Boat Dealers, Eating & Drinking Places, Hotels & Lodging Places, Marinas,
Recreational Vehicle Parks & Campsites, Scenic Water Tours, Sporting Goods Retailers,and Zoos, Aquaria. Table 8.1 provides a snapshot of the other Tourism & Recreationindustries and the associated economic outputs in 2004.
Table 8.1 Florida Ocean Tourism & Recreation Industries - Excluding Cruise Line, 2004
Industry Employment Wages GDP
Amusement and Recreation Services 5,487 $113,852,302 $1,057,498,800
Boat Dealers 4,196 $153,871,721 $328,553,700
Eating & Drinking Places 177,029 $2,637,139,074 $4,835,594,300
Hotels & Lodging Places 68,387 $1,573,117,698 $4,065,781,100
Marinas 3,508 $95,252,352 $219,512,200
Recreational Vehicle Parks & Campsites 1,013 $20,162,396 $52,110,500
Scenic Water Tours 1,414 $31,373,626 $58,059,900Sporting Goods Retailers 606 $19,707,476 $59,637,100
Zoos, Aquaria 1,002 $24,440,891 $44,418,600
Total 262,643 $4,668,917,536 $10,721,166,200SOURCE: National Ocean Economics Program
8.2 Overview of Florida’s Cruise Economy
Florida is an important national and world center for the cruise ship industry with asignificant proportion of embarkations occurring from Florida ports. Direct expendituresby cruise lines in Florida for 2006 resulted in 125,104 jobs and almost $6B in income forFlorida’s economy. The same year, the industry served over 14.2M passengers fromFlorida ports. However, there was a small decrease in passengers from FY2006 toFY2007, when the number of passengers slightly decreased to 14.1M. Yet, over the tenyear period from 1997 to 2007, the total number of embarkations and disembarkationsincreased by 42.8% from 8M to 14M (FSTED, 2008).
Multi-day cruise passengers constitute the staple of the Florida cruise industry. Florida’sports account for nearly 56% of all cruise embarkations nationally, handling more than
72

8/9/2019 Florida's Ocean and Coastal Economies Report Phase 2
http://slidepdf.com/reader/full/floridas-ocean-and-coastal-economies-report-phase-2 87/219
5M embarkations in 2006. The volume of passenger embarkations has continued toincrease even though Florida’s overall share has declined because of growth in otherareas. The state holds the largest share, 25%, of all resident passengers nationwide, over2M passengers. The number of Florida’s cruise passengers rose 35% from 2000 to 2006(CLIA, 2007).
Seven seaports in Florida engage in active cruise operations (see figure 8.1). Theseinclude ports Canaveral, Everglades, Jacksonville, Miami, and Tampa, all of which areports of embarkation (or cruise origination). Also noteworthy are ports in Key West andPalm Beach, which rank among Florida’s top tourist destination ports. For descriptions of individual Florida cruise ports, refer to Appendix C1. Florida also serves as acommercial hub for most of the cruise lines, housing their corporate and/or administrativeoffices.
Figure 8.1 Map of Florida’s Cruise Ports
Growth in the cruise industry in Florida is expected to continue, driven by a newgeneration of cruise ships, including super mega ships. At least 34 new cruise ships areprojected, with an additional 82,729 berths in the future, accounting for two-thirds of additions to the North American fleet. The arrival of larger cruise ships will requireFlorida’s ports to adapt capital facilities to accommodate the new generation of largerships.
73

8/9/2019 Florida's Ocean and Coastal Economies Report Phase 2
http://slidepdf.com/reader/full/floridas-ocean-and-coastal-economies-report-phase-2 88/219
8.3 National Comparisons of the Cruise Tourism Industry
Florida overwhelmingly leads the nation in Cruise industry statistics, including being thehome of the three largest cruise ports. Over 9M cruise passengers embarked on cruisesfrom U.S. ports in 2006. The top three Florida ports accounted for over 4M passengers oralmost 50% of the U.S. total cruise embarkations (table 8.2). Together, Florida’s ports
account for 56% of all embarkations in the United States (CLIA, 2007). For acomprehensive list of global embarkations see Appendix C2.
Table 8.2 Embarkations by Port 2004-2006
Port 2004 2005 2006Change
04'-06'% Change
04'-06'
Miami 1,682,000 1,771,000 1,890,000 119,000 6.7%
Port Canaveral 1,220,000 1,234,000 1,396,000 162,000 13.1%
Port Everglades 1,324,000 1,283,000 1,145,000 -138,000 -10.8%
Galveston 435,000 531,000 617,000 86,000 16.2%
Los Angeles 470,000 61,500 592,000 530,500 862.6%
New York 547,000 370,000 536,000 166,000 44.9%
Tampa 385,000 408,000 457,000 49,000 12.0%Long Beach 367,000 363,000 378,000 15,000 4.1%
Seattle 285,000 337,000 373,000 36,000 10.7%
Honolulu 171,000 236,000 318,000 82,000 34.7%
All Other Ports 1,145,000 1,476,000 1,299,000 -177,000 -12.0%
United States 8,100,000 8,612,000 9,001,000 389,000 4.5%SOURCE: Business Research and Economic Advisors
Florida’s cruise industry experienced slight growth for port embarkations, based on thetop three cruise ports during the period from 2004-2006, (table 8.2). Port Evergladesskewed the overall amount of change with negative growth. The decline for PortEverglades is attributed to various impacts including: Hurricane Wilma, less demand for
day-cruises, competition from new gambling venues, and a shift toward European cruisesrather than Caribbean (Florida, 2008).
0
200
400
600
800
1000
1200
1400
1600
1800
2000
Miami Port
Canaveral
Port
Everglades
Galveston Los
Angeles
New York Tampa Long
Beach
Seattle Honolulu All Other
Ports
T h o u s a n d s
2004
2005
2006
SOURCE: Business Research and Economic Advisors Figure 8.2 Embarkations by Port 2004-2006
74

8/9/2019 Florida's Ocean and Coastal Economies Report Phase 2
http://slidepdf.com/reader/full/floridas-ocean-and-coastal-economies-report-phase-2 89/219
8.4 State Economic Impacts of the Cruise Industry
Given the proximity for Florida residents to cruise homeports in Florida and along theGulf Coast and cruise destinations, the state leads the nation in resident cruise passengerswith over 2M Florida resident passengers, 25% of all U.S. resident cruise passengers(table 8.3). However, with more than twice as many embarkations as resident passengers,
the cruise industry in Florida is clearly a net generator of visitor activity in the state(Business, 2007).
Table 8.3 Florida's Share of U.S. Cruise Industry, 2006
Economic Impact Category Activity Levels in FloridaFlorida’s Percentage Share ofCruise Industry’s U.S. Impact
Passenger Embarkations 5,018,000 55.8%
Resident Cruise Passengers 2,279,000 25.1%
Expenditures (Millions) $5,847 33.1%
Total Employment 125,104 36.0%
Total Wages (Millions) $5,023 34.1%
Cruise Line Direct Employment 14,000 40.0%
SOURCE: Business Research and Economic Advisors
Overall, direct cruise line employment in Florida generated about 14,000 jobs orapproximately 40% of the total cruise industry employment for the United States (figure8.3). Florida’s share of the U.S. domestic cruise industry employment has declined as thecruise ship industry has grown in other parts of the country, notably Hawaii.
56%
25%
33%
36%
34%
40%
0% 10% 20% 30% 40% 50% 60%
Passenger Embarkations
Resident Cruise Passengers
Expenditures
Total Employment
Total Wages
Cruise Line Direct Employment
SOURCE: Business Research and Economic Advisors
Figure 8.3 Florida's Percentage Share of U.S. Cruise Industry, 2006
As a result of the cruise industry, Florida businesses received almost $6B in 2006, or one-third of the direct expenditures generated by the cruise industry in the United States thatyear. This represented nearly a 7% increase over 2005. Due to the scale of the industry,cruise ship related expenditures in Florida impacted just about all segments of theeconomy (table 8.4). These included tourism-related businesses, such as travel agencies,airlines, hotels, restaurants and providers of ground transportation, which were the main
75
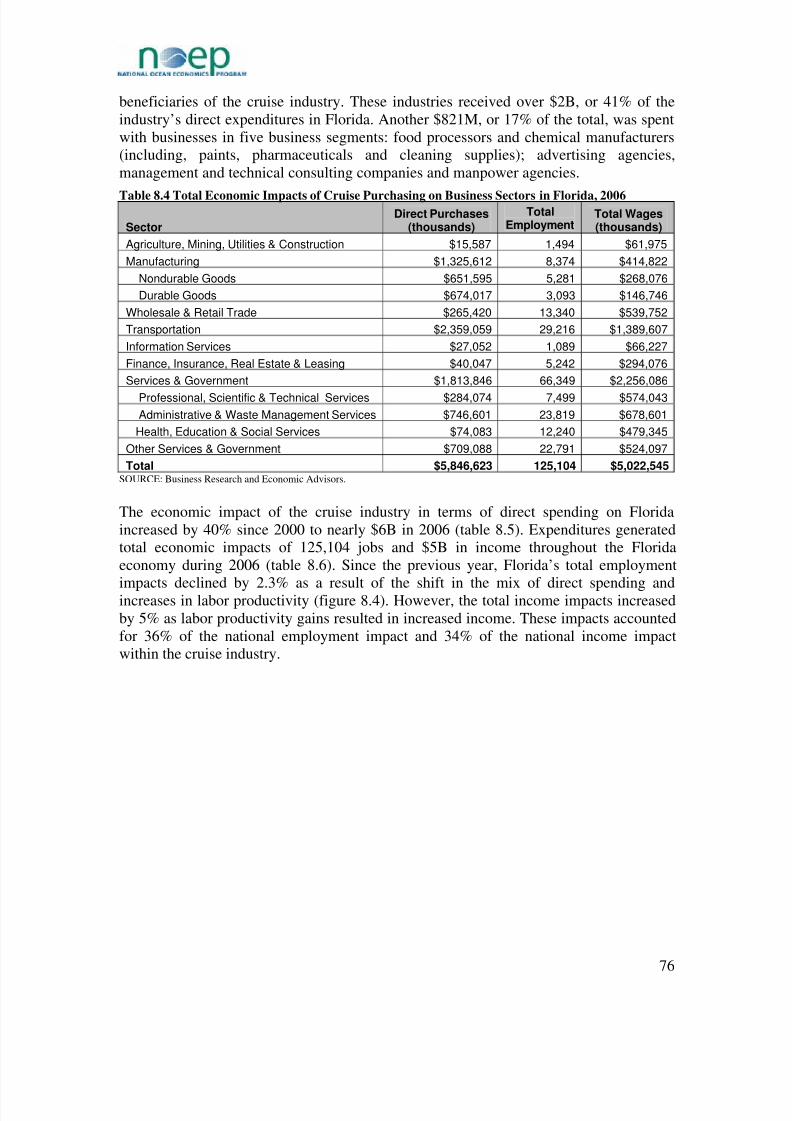
8/9/2019 Florida's Ocean and Coastal Economies Report Phase 2
http://slidepdf.com/reader/full/floridas-ocean-and-coastal-economies-report-phase-2 90/219
beneficiaries of the cruise industry. These industries received over $2B, or 41% of theindustry’s direct expenditures in Florida. Another $821M, or 17% of the total, was spentwith businesses in five business segments: food processors and chemical manufacturers(including, paints, pharmaceuticals and cleaning supplies); advertising agencies,management and technical consulting companies and manpower agencies.
Table 8.4 Total Economic Impacts of Cruise Purchasing on Business Sectors in Florida, 2006
SectorDirect Purchases
(thousands)
TotalEmployment
Total Wages(thousands)
Agriculture, Mining, Utilities & Construction $15,587 1,494 $61,975
Manufacturing $1,325,612 8,374 $414,822
Nondurable Goods $651,595 5,281 $268,076
Durable Goods $674,017 3,093 $146,746
Wholesale & Retail Trade $265,420 13,340 $539,752
Transportation $2,359,059 29,216 $1,389,607
Information Services $27,052 1,089 $66,227
Finance, Insurance, Real Estate & Leasing $40,047 5,242 $294,076
Services & Government $1,813,846 66,349 $2,256,086
Professional, Scientific & Technical Services $284,074 7,499 $574,043
Administrative & Waste Management Services $746,601 23,819 $678,601
Health, Education & Social Services $74,083 12,240 $479,345
Other Services & Government $709,088 22,791 $524,097
Total $5,846,623 125,104 $5,022,545SOURCE: Business Research and Economic Advisors.
The economic impact of the cruise industry in terms of direct spending on Floridaincreased by 40% since 2000 to nearly $6B in 2006 (table 8.5). Expenditures generatedtotal economic impacts of 125,104 jobs and $5B in income throughout the Floridaeconomy during 2006 (table 8.6). Since the previous year, Florida’s total employment
impacts declined by 2.3% as a result of the shift in the mix of direct spending andincreases in labor productivity (figure 8.4). However, the total income impacts increasedby 5% as labor productivity gains resulted in increased income. These impacts accountedfor 36% of the national employment impact and 34% of the national income impactwithin the cruise industry.
76

8/9/2019 Florida's Ocean and Coastal Economies Report Phase 2
http://slidepdf.com/reader/full/floridas-ocean-and-coastal-economies-report-phase-2 91/219
$0
$1,000
$2,000
$3,000
$4,000
$5,000
$6,000
$7,000
2000 2001 2002 2003 2004 2005 2006
( M i l l i o n s U
S $ )
50,000
70,000
90,000
110,000
130,000
150,000
# o f E m p l o y
e e s
Total Income
Direct Spending
Total Employment
SOURCE: Business Research and Economic Advisors
Figure 8.4 Employment, Income, and Direct Spending: Florida Cruise Industry 2000-2006
Table 8.5 Economic Impact of Cruise Industry on Direct Spending in Florida 2000-2006
Economic Impact of the Cruise Industry Direct Spending on Florida
Year Direct Spending ($ Millions) Direct Spending % Share of U.S.
2000 $3,546 36.8%
2001 $4,134 37.6%
2002 $4,523 37.8%
2003 $4,565 35.3%
2004 $5,157 35.1%
2005 $5,472 33.8%
2006 $5,847 33.1%SOURCE: Business Research and Economic Advisors
Table 8.6 Economic Impact of Cruise Industry on Florida Spending 2000-2006
Economic Impacts of the Cruise Industry on Florida Employment, 2000-2006
Year Total EmploymentEmployment %Share of U.S.
Total Income ($Millions)
Income % Shareof U.S.
2000 101,693 39.6% $3,020 34.6%
2001 116,845 39.6% $3,757 38.7%
2002 126,559 45.3% $4,292 40.3%
2003 130,750 44.3% $4,677 40.3%
2004 129,099 40.9% $4,554 36.7%
2005 128,042 38.8% $4,772 35.3%
2006 125,104 36.0% $5,023 34.1%
SOURCE: Business Research and Economic Advisors
77

8/9/2019 Florida's Ocean and Coastal Economies Report Phase 2
http://slidepdf.com/reader/full/floridas-ocean-and-coastal-economies-report-phase-2 92/219
8.5 Analysis of Individual Florida Cruise Ports
Florida’s share of the world cruise market was 42% in 2006.The state’s share has fallendue to increased cruising from other U.S. ports outside Florida and those outside NorthAmerica. The United States has maintained over three-fifths of the world cruise market,up to 75% in 2006, or 9M passengers, while the rest of the world has less than one-fifth
of the cruise business. In terms of total number of passengers, Florida’s cruising rose149% from 1990-2006 and 35% from 2000-2006.
0
1
2
3
4
5
6
7
8
9
10
1990 1995 2000 2001 2002 2003 2004 2005 2006
P a s s
e n g e r s ( M i l l i o n s )
Florida Total U.S. World
SOURCE: Business Research and Economic Advisors Figure 8.5 Total Global Embarkations 1990-2006
0%
10%
20%
30%
40%
50%
60%
70%
80%
1990 1995 2000 2001 2002 2003 2004 2005 2006
%
o f G l o b a l E m b a r k a t i o n s
Florida Total U.S. World
SOURCE: Business Research and Economic Advisors
Figure 8.6 Percent of Global Cruise Embarkations, 2006
Three of Florida’s cruise ports—the Port of Miami and Port Everglades in the south andPort Canaveral near Orlando, comprise nearly one-third of the global cruise market. Fora profile of South Florida’s cruise port industry, see Appendix C3. The ports of
78

8/9/2019 Florida's Ocean and Coastal Economies Report Phase 2
http://slidepdf.com/reader/full/floridas-ocean-and-coastal-economies-report-phase-2 93/219
Jacksonville and Tampa also contribute to Florida’s cruise industry on a smaller scale fora total of about half a million passengers annually, or 12% of the Florida market and 5%of the world cruising market (CLIA, 2007).
0.0
0.5
1.0
1.5
2.0
2.5
1990 1995 2000 2001 2002 2003 2004 2005 2006
E m b a r k a t i o n s ( M i l l i o n s )
Miami Port Canaveral Port Everglades Tampa
SOURCE: Business Research and Economic Advisors
Figure 8.7 Total Embarkations from Florida Ports 1990-200615
0%
10%
20%
30%
40%
50%
60%
70%
1990 1995 2000 2001 2002 2003 2004 2005 2006
% F l o r i d a E m b
a r k a t i o n s
Miami Port Canaveral Port Everglades Tampa
SOURCE: Business Research and Economic Advisors
Figure 8.8 Percentage Share of Florida Cruise Embarkations by Port 1990-2006
The ports of Miami, Everglades, and Canaveral led growth in Florida’s cruise industry,with Everglades growing at 44% from 2000-2006, followed by Canaveral at 38%, andMiami relatively unchanged at 12%. The Ports of Jacksonville and Tampa are alsogrowing as cruise ports, with the Port of Tampa showing the most growth, at 99% from
15 Port of Jacksonville began handling cruises in 2004 and totaled 130,000 cruises in 2006. Port of Palm Beach only has one-daycruises, so is not included here, although it does handle about half a million one-day cruises per year.
79

8/9/2019 Florida's Ocean and Coastal Economies Report Phase 2
http://slidepdf.com/reader/full/floridas-ocean-and-coastal-economies-report-phase-2 94/219
2000-2006 reflecting the emergence of Tampa as a location for cruise operations. Thestate’s cruising increased 35% during this same time period (BERA, 2007).
35%
99%
44%
38%
12%
0% 20% 40% 60% 80% 100%
% Growth
Florida
Port of Tampa
Everglades
Port Canaveral
Port of Miami
SOURCE: Business Research and Economic Advisors Figure 8.9 Percentage Growth in Cruising at Florida Ports 2001-2006
Cruise operations at Florida seaports have grown from a total of over 8M to 14Mpassengers (including embarkations and disembarkations)16 during FY 1996-1997 to2006-2007. This growth is primarily due to the increase in multi-day cruises from 6M inFY 1996-1997 to 11.2M in FY 2006-2007. One-day cruises increased from 2.5M to 2.9Mover the ten-year period, remaining relatively unchanged compared to multi-day cruisesthat have nearly doubled over the same timeframe (Florida, 2008).
Table 8.7 Cruise Operations, Embarkations and Disembarkations FY 2005 – FY 2007
County Seaport One-Day Multi-Day FY 04/05 FY 05/06 Total 06/07
Brevard Canaveral 1,612,526 2,663,396 4,388,851 4,542,056 4,275,922
Broward Everglades 719,888 2,690,058 3,801,464 3,239,154 3,409,546
Nassau Fernandina 0 0 220 0 0
Duval Jacksonville 0 259,816 275,123 256,798 259,816
Monroe Key West17
0 1,000,000 1,012,978 1,022,500 1,000,000
Miami-Dade Miami 0 3,787,410 3,605,201 3,731,457 3,787,410
Palm Beach Palm Beach 566,408 0 553,692 520,557 566,408
Pinellas St. Petersburg 0 0 120,000 43 0
Hillsborough Tampa 0 781,861 771,227 910,633 781,861
Total 2,898,222 11,182,541 14,528,756 14,233,198 14,081,363
SOURCE: 2008 Florida Ports Council
16 The cruise ports count embarkations and disembarkations, unlike the data presented above by the Cruise Lines Industry Association,which records only embarkations.17 Key West is a destination port, not a departure port, since ships do not originate from there. Total numbers in the table differ fromCLIA numbers that report only embarkations.
80

8/9/2019 Florida's Ocean and Coastal Economies Report Phase 2
http://slidepdf.com/reader/full/floridas-ocean-and-coastal-economies-report-phase-2 95/219
0
2
4
6
8
10
12
14
16
FY1997 FY1998 FY1999 FY2000 FY2001 FY2002 FY2003 FY2004 FY2005 FY2006 FY2007
C r u i s e P a s s e n g e r s ( M i l l i o n s )
One-Day Multi-Day Total
SOURCE: 2008 Florida Ports Council Figure 8.10 Embarkations and Disembarkations from Florida Ports by Length of Cruise
8.6 Conclusion
In summary, Florida’s cruise industry contributes a major portion of revenue andpassengers to the overall U.S. cruise industry economy. Florida dominates the cruiseindustry with almost 56% of the 9 million total passengers embarking on cruisesnationwide. The economic impacts of the cruise industry are also driven by Florida’sresidents. Of the 5 million passengers embarking on cruises from Florida ports, almosthalf are Florida residents contributing to the nearly $6B dollars in expenditures by thecruise industry in Florida. These economic contributions are spread over a number of different businesses such as agriculture, retail, transportation, and others, which accountfor over 125,000 jobs and $5M in wages. The cruise industry serves as a vital componentof the Coastal Tourism and Recreation sector in Florida and the United States.
81

8/9/2019 Florida's Ocean and Coastal Economies Report Phase 2
http://slidepdf.com/reader/full/floridas-ocean-and-coastal-economies-report-phase-2 96/219
Chapter 9 Coastal Real Estate
9.1 Coastal Real Estate Values
Measurement of the contribution of the ocean to the economy is most often done by
examining “flows” of economic activity such as employment, income, cargo, passengers,and the value of output. The discussion of the Ocean Economy elsewhere in this studyfollows this approach. But the ocean also has a profound effect on the “stock” of assetvalue stored in real estate. Coastal and shorefront properties in Florida, as elsewhere, arein greater demand and thus of higher value than similar real estate without a shorelocation. This value has been changing rapidly over the last few years, although theperiod of rapid appreciation throughout the state has come to an end. Understanding howthe value of coastal real estate is distributed across the state and how it has been changingis thus a key part of the Florida Ocean Economy.
Florida is fortunate to have an excellent property records system, which permits at least a
generalized analysis of property values in shoreline areas and other areas. While it is notpossible to determine the contribution of the ocean to the values of individual propertiesusing this data, it is possible to determine the aggregate property values statewide and bycounty and region.
This section explores coastal property values throughout Florida, starting with a statewideoverview and then providing additional detail for major regions and the coastal counties.For purposes of this discussion “coastal” property is defined as a parcel that is “seaward”of the nearest shore-parallel road. For most of Florida, this definition encompassesshorefront property plus one to two tiers of parcels inland from the shore-adjacent parcel.This definition permits a straightforward identification of parcels using geographic
information systems applied to the Florida property tax records. See Appendix D for adiscussion of the property value data system and the methods used for this analysis.
Florida’s 367,000 coastal properties were valued for tax purposes in 2006 at $181B,yielding $2B in property tax revenues. Coastal parcels made up 7.5% of the value of allreal estate in Florida. From 2002-2006, the number of parcels grew by about 10%, butthe value of parcels more than doubled reflecting the strong demand for coastal real estatein the early part of this decade.
Overwhelmingly, Florida’s coastal real estate is residential; 70% of the parcels and 80%of the value are in residential uses as classified under the State’s land use classification
system. Actually, when the northwestern region (with its heavy proportion of militaryland) is taken out, over 80% of land parcels are in residential uses. Of the residentialproperties, over half (60%) is in some form of collective ownership (cooperatives orcondominiums). The importance of residential land use is reinforced by the fact that of commercial properties on the coast (only 4% of parcels, but 7% of value), the vastmajority of commercial properties (71%) are hotels and lodging facilities. Though datafrom other states is lacking, few other states come close to Florida in the dominance of residential uses in its coastal property and property values.
82

8/9/2019 Florida's Ocean and Coastal Economies Report Phase 2
http://slidepdf.com/reader/full/floridas-ocean-and-coastal-economies-report-phase-2 97/219
The recent property value boom in Florida has left the impression that the entire state wasundergoing a transformation. While the property value appreciation affected all regionsof the state, there is a considerable amount of variation within the state. In 2007 thesoutheastern region accounted for the largest share of property values, which is not
surprising since this region includes the major metropolitan areas of southern Florida.The southwestern region had the highest average value, but the southeastern region hadthe highest residential value, reflecting the strong demand for shore property in urbanareas. The high values of urban coastal property are also reflected in the fact that thecoastal properties of the southeast region accounted for more than half of the value of allthe property taxes paid of all Florida coastal property.
The value of the coastal properties in the Northwest region make up the highest percentof total value, at more than 22%; the coastal proportion of total value was lowest in theBig Bend region. But taken together, the Big Bend and Northwest regions were the “hot”areas in terms of coastal value growth rates over 2002-2007. This reflects the fact that
much of the rest of Florida was already substantially built out along the shoreline, andthat these two Gulf Coast regions were where the high growth in property values wouldhave proportionately larger effects.
Among the coastal counties, Collier County in the Southwest region had the highestaverage parcel value in 2007 of $1,681,110, while Wakulla County in the Northwest hadthe lowest average value at $295,112. Bay (41%) and Monroe (38%) counties had thehighest proportion of their property values located in the coastal area; Jefferson County inthe Big Bend region had the lowest proportion (0.1%) Escambia County in theNorthwest showed the greatest growth in property values at 450% over 2002-2007, butthis was driven in large part by a particular piece of government property. That exampleaside, the largest coastal property value growth was in Taylor County (311%) and FlaglerCounty (200%).
The following sections of provide additional detail on property values for the state, itsregions, and counties. The time period used for measuring change represented a uniqueperiod of very high property value appreciation, which has come to an end as of 2008.The important role played by shore properties in Florida’s real estate values will bechanging over the next 2-4 years as the effects of the “boom” period work themselvesout. Those interested in the role of coastal property values will want to track changesclosely. It is likely that coastal properties will maintain their values better than inlandareas, but some areas such as those with very high average values or very fast recentappreciations may undergo more rapid depreciation even for coastal property.
Statewide Overview
Coastal real estate accounted for 7.5% of the total market value in Florida in 2006, upfrom 7.3% four years earlier in 2002. In 2007, there were 367,359 properties on Florida’sAtlantic and Gulf coasts, defined to be seaward of the nearby shore parallel road. Theseproperties had a market value of more than $181B as determined by the County PropertyAppraisers. These locally elected officials are charged by the state with establishing
83

8/9/2019 Florida's Ocean and Coastal Economies Report Phase 2
http://slidepdf.com/reader/full/floridas-ocean-and-coastal-economies-report-phase-2 98/219
property values as part of the process of determining property taxes paid to the state tofinance public education and paid to local authorities to finance their operations and debtservice. Property Appraisers establish values for all properties, whether the properties paytaxes or not. Properties are valued during the first six months of the year on the basis of their condition at the beginning of the year.
9%
70%
4%
4%
8%5%
Vacant Total Res idential Total Comm ercial
Ins titutional Governm ent Mis cellaneous
Figure 9.1 Number of Florida Coastal Properties by Land Use
Most Florida coastal properties (70%) have a residential land use. Vacant coastalproperties are at 9%, and 8% are owned by government (local, state, or federal).Coastal properties that are commercial are 4%, and another 4% are institutional, notfor profit enterprises such as churches and yacht clubs. Properties in a heterogeneousmiscellaneous category that includes a small number of agricultural properties, dunesand submerged lands make up 5%.
82%
0% 5%1%
5%
7%
Vacant Total Res idential Total CommercialInstitutional Government Miscellaneous
Figure 9.2 Value of Florida Coastal Properties by Land Use
The dominance of residential land uses is even greater in terms of the value of Floridacoastal real estate. More than 80% of Florida coastal real estate value is residentialand 7% is commercial. Vacant and government-owned properties each account for5%. Institutional and miscellaneous parcels have relatively small values.
84
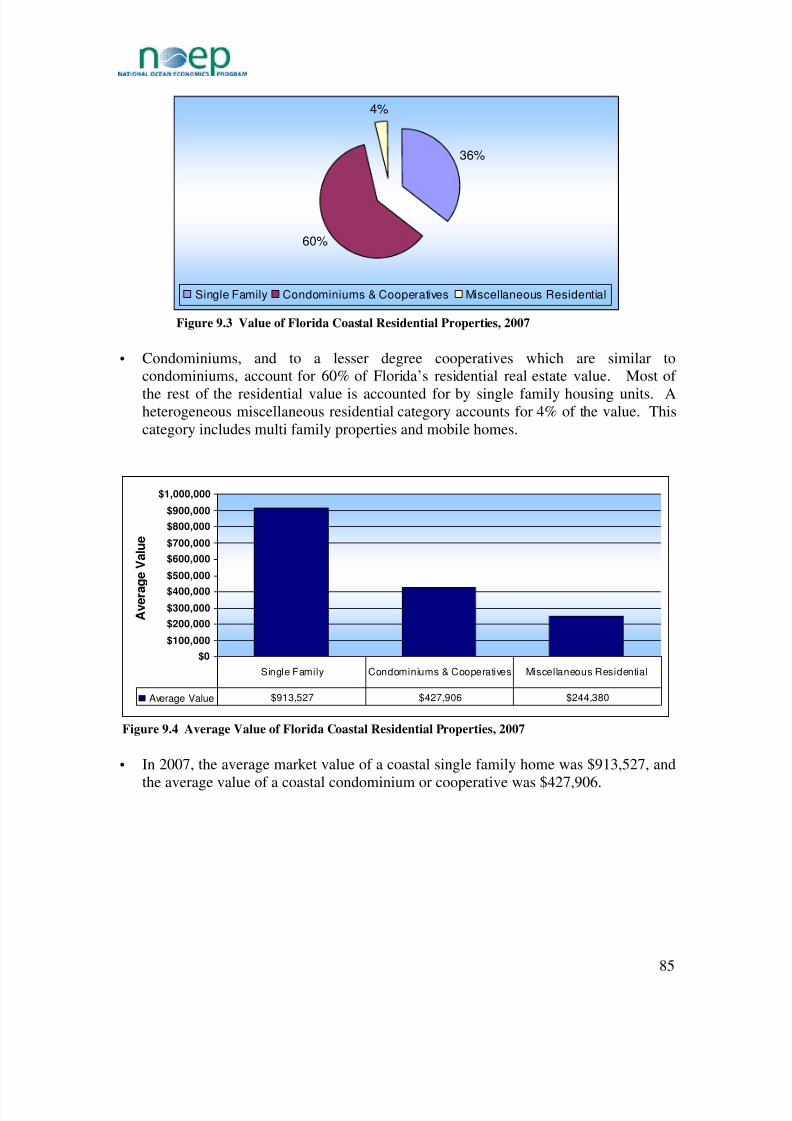
8/9/2019 Florida's Ocean and Coastal Economies Report Phase 2
http://slidepdf.com/reader/full/floridas-ocean-and-coastal-economies-report-phase-2 99/219
36%
60%
4%
Single Family Condominiums & Cooperatives Miscellaneous Residential
Figure 9.3 Value of Florida Coastal Residential Properties, 2007
Condominiums, and to a lesser degree cooperatives which are similar tocondominiums, account for 60% of Florida’s residential real estate value. Most of
the rest of the residential value is accounted for by single family housing units. Aheterogeneous miscellaneous residential category accounts for 4% of the value. Thiscategory includes multi family properties and mobile homes.
$0
$100,000
$200,000
$300,000
$400,000
$500,000
$600,000
$700,000
$800,000
$900,000
$1,000,000
A v e r a
g e V a l u e
Average Value $913,527 $427,906 $244,380
Single Family Condominiums & Cooperatives Miscellaneous Residential
Figure 9.4 Average Value of Florida Coastal Residential Properties, 2007
In 2007, the average market value of a coastal single family home was $913,527, and
the average value of a coastal condominium or cooperative was $427,906.
85
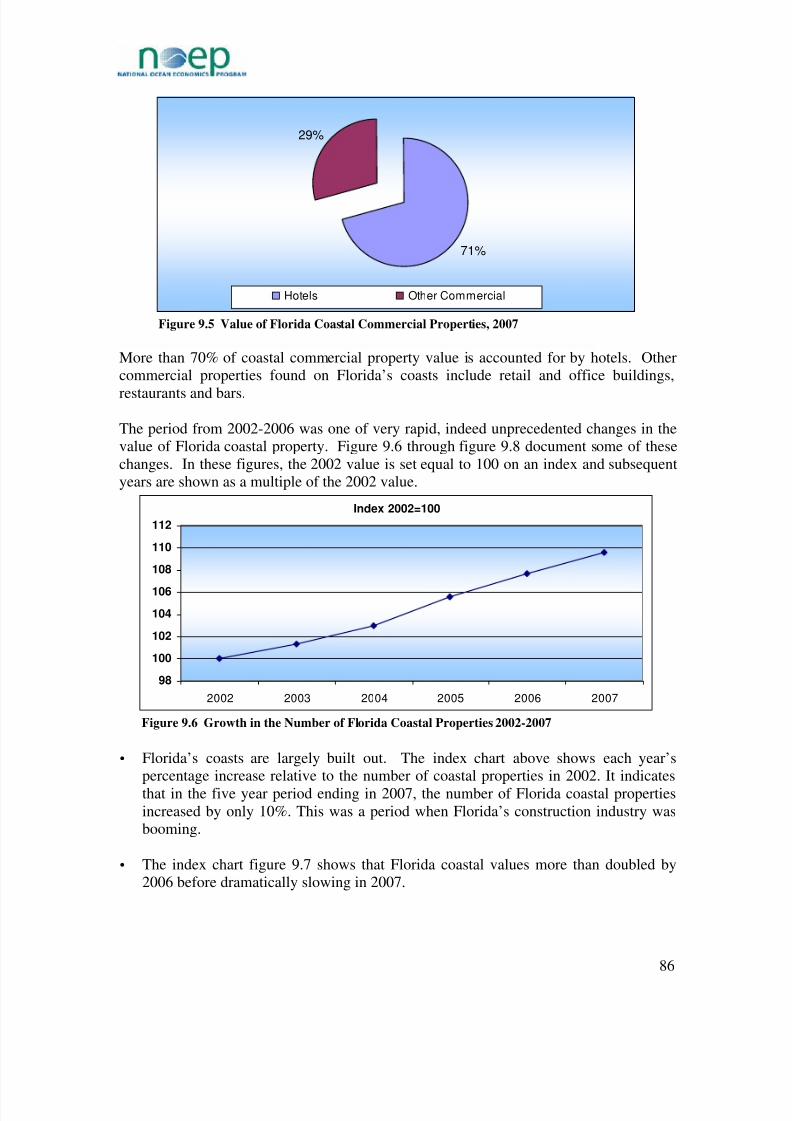
8/9/2019 Florida's Ocean and Coastal Economies Report Phase 2
http://slidepdf.com/reader/full/floridas-ocean-and-coastal-economies-report-phase-2 100/219
71%
29%
Hotels Other Commercial
Figure 9.5 Value of Florida Coastal Commercial Properties, 2007
More than 70% of coastal commercial property value is accounted for by hotels. Othercommercial properties found on Florida’s coasts include retail and office buildings,
restaurants and bars.
The period from 2002-2006 was one of very rapid, indeed unprecedented changes in thevalue of Florida coastal property. Figure 9.6 through figure 9.8 document some of thesechanges. In these figures, the 2002 value is set equal to 100 on an index and subsequentyears are shown as a multiple of the 2002 value.
Index 2002=100
98
100
102
104
106
108
110
112
2002 2003 2004 2005 2006 2007
Figure 9.6 Growth in the Number of Florida Coastal Properties 2002-2007
Florida’s coasts are largely built out. The index chart above shows each year’spercentage increase relative to the number of coastal properties in 2002. It indicatesthat in the five year period ending in 2007, the number of Florida coastal propertiesincreased by only 10%. This was a period when Florida’s construction industry wasbooming.
The index chart figure 9.7 shows that Florida coastal values more than doubled by2006 before dramatically slowing in 2007.
86
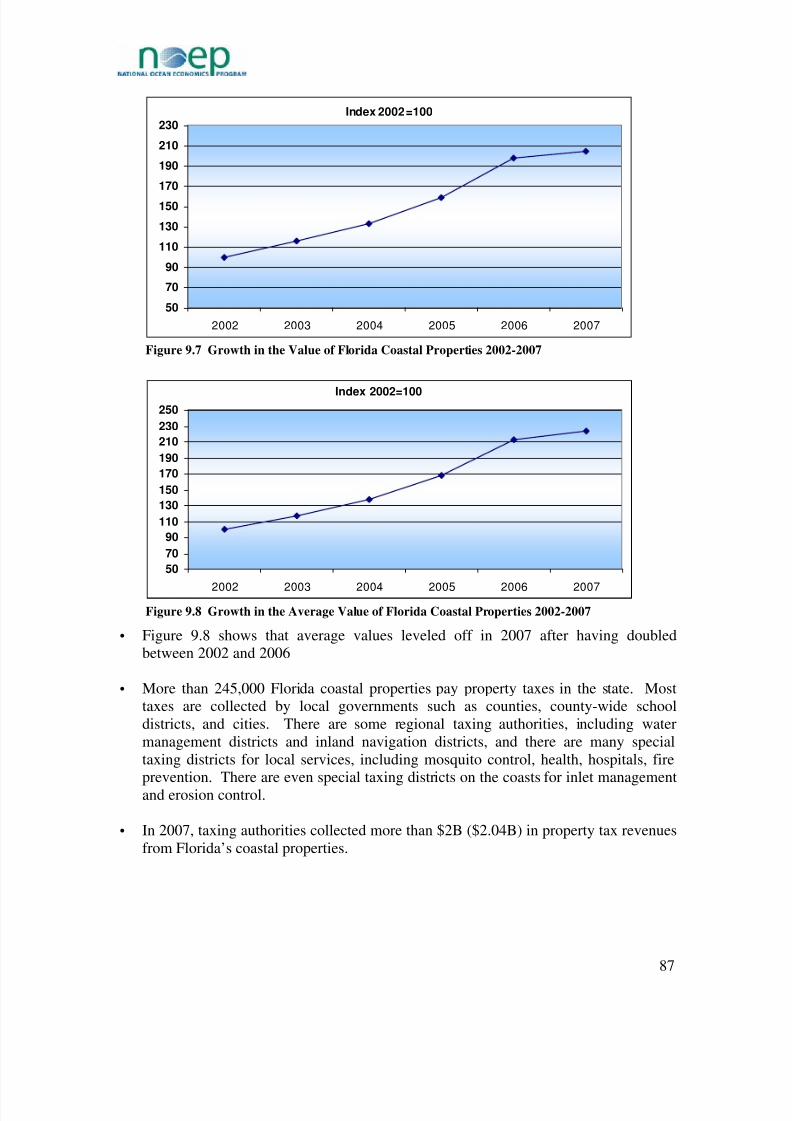
8/9/2019 Florida's Ocean and Coastal Economies Report Phase 2
http://slidepdf.com/reader/full/floridas-ocean-and-coastal-economies-report-phase-2 101/219
Index 2002=100
50
70
90
110
130
150
170
190
210
230
2002 2003 2004 2005 2006 2007
Figure 9.7 Growth in the Value of Florida Coastal Properties 2002-2007
Index 2002=100
50
70
90
110
130
150
170
190
210
230
250
2002 2003 2004 2005 2006 2007 Figure 9.8 Growth in the Average Value of Florida Coastal Properties 2002-2007
Figure 9.8 shows that average values leveled off in 2007 after having doubledbetween 2002 and 2006
More than 245,000 Florida coastal properties pay property taxes in the state. Mosttaxes are collected by local governments such as counties, county-wide schooldistricts, and cities. There are some regional taxing authorities, including watermanagement districts and inland navigation districts, and there are many specialtaxing districts for local services, including mosquito control, health, hospitals, fireprevention. There are even special taxing districts on the coasts for inlet managementand erosion control.
In 2007, taxing authorities collected more than $2B ($2.04B) in property tax revenuesfrom Florida’s coastal properties.
87

8/9/2019 Florida's Ocean and Coastal Economies Report Phase 2
http://slidepdf.com/reader/full/floridas-ocean-and-coastal-economies-report-phase-2 102/219
Florida’s Coastal Regions
The Florida Department of Environmental Protection (FDEP) identifies four beachregions on the state’s coasts: the Northeast and Southeast on the state’s Atlantic Coast,the Southwest and Northwest on the state’s Gulf Coast. An additional region known as
the Big Bend lies where Florida’s Gulf Coast turns from a northerly to a westerlydirection. This is not identified as a beach region because it lacks beaches – the coast islargely made up of mangroves and other natural vegetation.
88
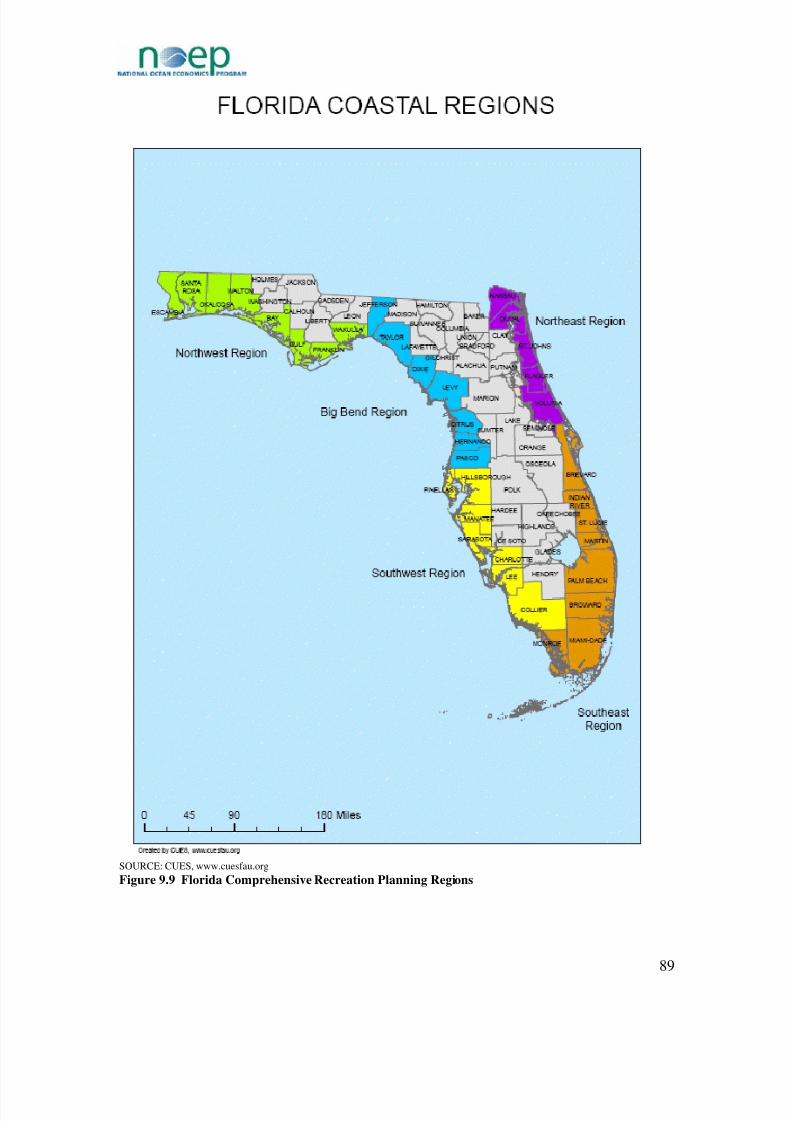
8/9/2019 Florida's Ocean and Coastal Economies Report Phase 2
http://slidepdf.com/reader/full/floridas-ocean-and-coastal-economies-report-phase-2 103/219
SOURCE: CUES, www.cuesfau.org
Figure 9.9 Florida Comprehensive Recreation Planning Regions
89

8/9/2019 Florida's Ocean and Coastal Economies Report Phase 2
http://slidepdf.com/reader/full/floridas-ocean-and-coastal-economies-report-phase-2 104/219
This report uses a regional classification made up of the FDEP beach regionssupplemented by the Big Bend. These regions group coastal counties that are relativelysimilar in their coastal activities together. For example, both the Northeast andNorthwest regions have beaches that attract large numbers of visitors in the summer andrelatively few in the winter.
Northeast
13%
Southwest
21%
Big Bend
2%
Northwest
17%
Southeast
47%
Figure 9.10 Distribution of the Number of Coastal Properties by Coastal Region, 2007
Almost half of coastal properties included in this study come from the Southeast coastof the state, the most intensively developed of the state’s coastal regions. Relativelyfew of the properties come from the Big Bend region, reflecting its lack of coastaldevelopment.
Northeast
11%
Southeast
45%
Southwest
27%
Big Bend
1%
Northwest
16%
Figure 9.11 Distribution of Coastal Property Values by Coastal Region, 2007
The Southeast region has the highest value of coastal properties.
Although the share of the Southwest region coastal property is only 21%, its coastalvalues jump to 27%, reflecting the high average value of parcels in that regionrelative to the other regions in the state.
90

8/9/2019 Florida's Ocean and Coastal Economies Report Phase 2
http://slidepdf.com/reader/full/floridas-ocean-and-coastal-economies-report-phase-2 105/219
$0 $200,000 $400,000 $600,000 $800,000 $1,000,000
Northeast
Southeast
Southwest
Big Bend
Northwest
Series1 $559,862 $649,703 $870,382 $338,046 $652,138
Northeas t Southeas t Southwes t Big Bend Northwes t
Figure 9.12 Distribution of Average Coastal Property Values by Coastal Region, 2007
The Southwest region has the highest average value of coastal properties, at$870,382.
0%
10%
20%
30%
40%
50%
60%
70%
80%
90%
100%
Northeast Southeast Southwest Big Bend Northwest
Residential Commercial Other
Figure 9.13 Distribution of Property Values by Land Use in Coastal Regions, 2007
Residential land uses account for about 80% of total coastal value in each of thestate’s five coastal regions, except for the Northwest where air force and navalfacilities ensure a large amount of valuable government-owned property. There isrelatively little commercial value in the less urbanized Big Bend and Northwestregions of the state.
91

8/9/2019 Florida's Ocean and Coastal Economies Report Phase 2
http://slidepdf.com/reader/full/floridas-ocean-and-coastal-economies-report-phase-2 106/219
$0 $500,000 $1,000,000 $1,500,000 $2,000,000 $2,500,000 $3,000,000 $3,500,000 $4,000,000 $4,500,000
Northeast
Southeast
Southwest
Big Bend
Northwest
Residential Commercial Other
Figure 9.14 Average Coastal Property Values by Land Use in Coastal Regions, 2007
Although the Southwest region has the highest average value for coastal propertiesoverall, this reflects its relatively high average residential value. The average valueof coastal commercial real estate is highest in the Southeast region of the state.Average values of all coastal land uses are lowest in the Big Bend region.
0 5 10 15 20 25
Northeast
Southeast
Southwest
Big Bend
Northwest
Percent 9.9 7.6 7.8 2.0 21.0
Northeast Southeas t Southwest Big Bend Northwest
Figure 9.15 Coastal Value as a Percent of Total Value in Coastal Regions, 2006
Coastal values accounted for more than 20% of total values in the Northwest region,more than twice the coastal share in the Northeast, the second highest share in thestate. In the southern half of the state, the coastal share was about 8%, and it wasonly 2% in the Big Bend region.
92

8/9/2019 Florida's Ocean and Coastal Economies Report Phase 2
http://slidepdf.com/reader/full/floridas-ocean-and-coastal-economies-report-phase-2 107/219
0 50 100 150 200 250
Northeast
Southeast
Southwest
Big Bend
Northwest
Percent 128.1 121.8 73.6 170.0 191.9
Northeast Southeast Southwest Big Bend Northwest
Figure 9.16 Percent Growth in Coastal Values in Coastal Regions 2002-2007
Coastal values more than doubled in all of Florida’s coastal regions between 2002
and 2007, except for the Southwest where the growth was 70%. The slower growthin the Southwest may reflect the major hurricanes of 2004 and 2005, especially thecategory 4 hurricane Charley which struck the center of the region in 2004. TheNorthwest region was also struck by a category 4 hurricane, but the point of landfallwas immediately west of the western boundary of the region.
$249.9
$1,017.9
$565.5
$6.8
$200.2
$0
$200
$400
$600
$800
$1,000
$1,200
Northeast Southeast Southwest Big Bend Northwest
M i l l i o n
$
Figure 9.17 Property Tax Revenues from Coastal Parcels by Region
Coastal properties in the southern half of the state pay a larger share of property taxesthan do coastal properties in the northern regions, while Big Bend properties make anegligible contribution to property tax revenues. About one half the property taxes inthe Southeast region are paid by coastal properties, and coastal properties account formore than one-quarter in the Southwest.
The coastal properties in the state paid more than $2B in property taxes in 2007. TheSoutheast region paid $1.0B and the Southwest region paid more than $500M
93

8/9/2019 Florida's Ocean and Coastal Economies Report Phase 2
http://slidepdf.com/reader/full/floridas-ocean-and-coastal-economies-report-phase-2 108/219
($565.5M). More than $200 million was paid by the Northeast Region ($249.9M)and the Northwest region ($200.2M), and the Big Bend paid $6.8M.
The Northeast Florida Coastal Region
The Northeast Florida coastal region consists of the five counties in the northeast corner
of the state ranging southwards through Nassau, Duval, St. Johns, Flagler and Volusiacounties. Nassau contains the beachfront communities of Fernandina Beach and AmeliaIsland. Duval is home to the large city of Jacksonville and the three beachfrontcommunities south of the St. Johns River: Atlantic Beach, Neptune Beach andJacksonville Beach. St Johns is home to Ponte Vedra Beach and St. Augustine Beach.Flagler County is home to Flagler Beach, and Volusia County is home to the beachfrontcommunities of Ormond Beach, Daytona Beach and New Smyrna Beach. Jacksonvillewas the historic point of entry to the state in the last half of the nineteenth century and thebeachfront communities in the Northeast region are among the most historic in the state.Jacksonville Beach, formerly known as Pablo Beach, was the site of Henry Flagler’s onlyhotel to serve summer season visitors, and the firm sands of Daytona Beach attracted
racing cyclists before the end of the 19th century. As the twentieth century began,automobile drivers used the beach as a racetrack.
11%
8%
15%
12%
54%
Nassau Duval St. Johns Flagler Volusia
Figure 9.18 Distribution of the Number of Coastal Properties by County Northeast Region, 2007
There were 32,271 coastal properties in the northeast Florida region in 2007, withmore than half the properties in Volusia County. The large number of properties inVolusia County reflected its lengthy and relatively intensely developed coastline.
94

8/9/2019 Florida's Ocean and Coastal Economies Report Phase 2
http://slidepdf.com/reader/full/floridas-ocean-and-coastal-economies-report-phase-2 109/219
13%
11%
23%
11%
42%
Nassau Duval St. Johns Flagler Volusia
Figure 9.19 Distribution of Coastal Property Values by County Northeast Region, 2007
The region’s properties had a value of $18.1B, with 42% in Volusia County and 23%in Duval County.
$659,115
$722,584
$852,143
$512,154
$441,607
$0 $200,000 $400,000 $600,000 $800,000 $1,000,000
Nassau
Duval
St. Johns
Flagler
Volusia
Figure 9.20 Distribution of Average Coastal Property Values in Northeast Coastal Region, 2007
St. Johns County had the highest average value of coastal properties ($852,143) in2007, followed by Duval and Nassau. The lowest average value was in VolusiaCounty.
95

8/9/2019 Florida's Ocean and Coastal Economies Report Phase 2
http://slidepdf.com/reader/full/floridas-ocean-and-coastal-economies-report-phase-2 110/219
0 5 10 15 20 25 30
Nassau
Duval
St. Johns
Flagler
Volusia
Figure 9.21 Coastal Value as a Percent of Total Value in Northeast Coastal Region, 2006
Coastal real estate accounted for the largest share of total property values in NassauCounty (25%) and the smallest share in Duval County, which contains the majormetropolitan area of Jacksonville inland from the county’s coast.
0 50 100 150 200 250
Nassau
Duval
St. Johns
Flagler
Volusia
Figure 9.22 Percent Growth in Coastal Value in Northeast Coastal Region 2002-2007
Coastal values grew most rapidly in Flagler County between 2002 and 2007, followedby Volusia County, the two southernmost counties in the region. The slowest growthin coastal value occurred in Nassau County, the northernmost county in the region.
96

8/9/2019 Florida's Ocean and Coastal Economies Report Phase 2
http://slidepdf.com/reader/full/floridas-ocean-and-coastal-economies-report-phase-2 111/219
0%
10%
20%
30%
40%50%
60%
70%
80%
90%
100%
Nassau Duval St. Johns Flagler Volusia
Residential Commercial Other
Figure 9.23 Distribution of Coastal Property Values by Land Use in Northeast Coastal Region, 2007
Residential land uses accounted for the largest share of the value in all five counties
in the Northeast Florida coastal region. Both St. Johns and Flagler counties had arelatively large amount of government-owned property. Commercial uses were arelatively small part of total coastal values in the region.
$0 $1,000,000 $2,000,000 $3,000,000 $4,000,000 $5,000,000
Nassau
Duval
St. Johns
Flagler
Volusia
Residential Commercial Other
Figure 9.24 Average Value of Coastal Properties by Land Use in Northeast Coastal Region, 2007
Commercial properties had much higher average values than residential and otherland uses in all five counties in the region. Flagler County had the highest average
commercial values, followed by St. Johns County.
97

8/9/2019 Florida's Ocean and Coastal Economies Report Phase 2
http://slidepdf.com/reader/full/floridas-ocean-and-coastal-economies-report-phase-2 112/219
$32.5
$22.3
$45.2
$21.8
$128.1
$0
$20
$40
$60
$80
$100
$120
$140
Nassau Duval St. Johns Flagler Volusia
M i l l i o n $
Figure 9.25 Property Tax Revenues from Coastal Parcels by County in Northeast Coastal Region, 2007
Property tax revenues received by taxing authorities from coastal real estate in theNortheast beach region ranged from about $22M in Duval and Flagler counties to
$128M in Volusia County in 2007.
The Southeast Florida Coastal Region
The Southeast Florida coastal region consists of the eight counties in the southeast cornerof the state ranging southwards through Brevard, Indian River, St. Lucie, Martin, PalmBeach, Broward, Miami-Dade and Monroe counties. Brevard contains the beachfrontcommunities of Cape Canaveral, Cocoa Beach, Satellite Beach, Indian Harbor Beach andMelbourne Beach, as well as Patrick Air Force Base and Cape Canaveral NationalSeashore. Indian River County contains Wabasso, Indian River Shores and Vero Beach.
St. Lucie and Martin counties contain beachfront communities on Hutchinson and JupiterIslands. St. Lucie County also has a nuclear power plant adjacent to the beach, withanother plant located in Miami-Dade County. Palm Beach County is home to beachfrontcommunities in Juno Beach, Palm Beach, Manalapan, Briny Breezes, Gulfstream andHighland Beach. Several cities in the county have large beachfront areas includingDelray Beach and Boca Raton. Several Broward County cities also have majorbeachfronts including Deerfield Beach, Pompano Beach, Fort Lauderdale, Hollywoodand Hallandale Beach. Miami-Dade County has the large beachfront community of Miami Beach, as well as several smaller communities. Monroe County consists of Everglades National park and the remarkable archipelago known as the Florida Keys.The islands in the Keys, of course, have two coasts.
98

8/9/2019 Florida's Ocean and Coastal Economies Report Phase 2
http://slidepdf.com/reader/full/floridas-ocean-and-coastal-economies-report-phase-2 113/219
6%4%
6%1%
19%
25%
13%
26%
Brevard Indian River St. Lucie Martin
Palm Beach Broward Miami-Dade Monroe
Figure 9.26 Distribution of the Number of Coastal Properties by County Southeast Region, 2007
There were 30,470 coastal properties in the Southeast Florida region in 2007, with
about one fourth of the properties in each of Broward and Monroe counties. Thelarge number of properties in Monroe County reflects the bi-coastal islands in theKeys, and the large number of parcels in Broward reflects the large number of largecondominium developments.
3% 4%4%
3%
29%
19%
17%
21%
Brevard Indian River St. Lucie Martin
Palm Beach Broward Miami-Dade Monroe
Figure 9.27 Distribution of Coastal Property Values by County in Southeast Region, 2007
The coastal properties had a value of $15.9B, with 29% in Palm Beach County and21% in Monroe County.
99

8/9/2019 Florida's Ocean and Coastal Economies Report Phase 2
http://slidepdf.com/reader/full/floridas-ocean-and-coastal-economies-report-phase-2 114/219
$406,301
$758,837
$398,231
$1,391,193
$981,690
$476,770
$893,717
$519,416
$0 $200,000 $400,000 $600,000 $800,000 $1,000,000 $1,200,000 $1,400,000 $1,600,000
Brevard
Indian River
St. Lucie
Martin
Palm Beach
Broward
Miami-Dade
Monroe
Figure 9.28 Distribution of Average Coastal Property Values in Southeast Coastal Region, 2007
Martin County had the highest average value of coastal properties ($1,391,193) in
2007, followed by Palm Beach and Miami-Dade. The lowest average value was inSt. Lucie County.
4.4
13.8
8.1
6.8
9.5
5.8
3.8
38.3
0 5 10 15 20 25 30 35 40 45
Brevard
Indian River
St. Lucie
Martin
Palm Beach
Broward
Miami-Dade
Monroe
Percent
Figure 9.29 Coastal Value as Percent of Total Value in Southeast Coastal Region, 2006
Coastal real estate accounted for the largest share of total property values in MonroeCounty (almost 40%). It had the smallest share in Miami-Dade County, whichcontains the major metropolitan area of Miami inland from the county’s coast.
100

8/9/2019 Florida's Ocean and Coastal Economies Report Phase 2
http://slidepdf.com/reader/full/floridas-ocean-and-coastal-economies-report-phase-2 115/219
0 20 40 60 80 100 120 140 160 180 200
Brevard
Indian River
St. Lucie
Martin
Palm Beach
Broward
Miami-Dade
Monroe
Percent Growth
Figure 9.30 Percent Growth in Coastal Value in Southeast Coastal Region 2002-2007
Coastal values grew most rapidly in Brevard County between 2002 and 2007,followed by Broward and Monroe counties. The slowest growth in average coastalvalues occurred in Martin and Palm Beach counties.
0%
10%
20%
30%
40%
50%60%
70%
80%
90%
100%
Brevard Indian River St. Lucie Martin Palm Beach Broward Miami-Dade Monroe
Residential Commercial Other
Figure 9.31 Distribution of Coastal Property Values by Land Use in Southeast Coastal Region, 2007
Residential land uses accounted for the largest share of coastal value in all eightcounties in the Southeast Florida coastal region. St. Lucie, Martin and Palm Beachcounties have relatively little coastal commercial development, while Broward andMiami-Dade have a relatively high commercial value. Brevard, St. Lucie andMonroe counties have relatively high government-owned coastal values.
101

8/9/2019 Florida's Ocean and Coastal Economies Report Phase 2
http://slidepdf.com/reader/full/floridas-ocean-and-coastal-economies-report-phase-2 116/219
$0 $5,000,000 $10,000,000 $15,000,000 $20,000,000
Brevard
Indian River
St. Lucie
Martin
Palm Beach
Broward
Miami-Dade
Monroe
Residential Commercial Other
Figure 9.32 Average Coastal Property Values by Land Use in Southeast Coastal Region, 2007
Commercial properties had much higher average values than residential and otherland uses in all eight counties in the region. Miami-Dade and Palm Beach had thehighest average coastal commercial values. Average commercial values wererelatively low outside the highly urbanized area of Palm Beach, Broward and Miami-Dade counties, with the exception of Martin County.
$30.1 $39.2 $41.1$26.2
$308.3
$245.6 $247.8
$79.6
$0
$50
$100
$150$200
$250
$300
$350
Brevard Indian River St. Lucie Martin Palm
Beach
Broward Miami-
Dade
Monroe
M i l l i o n $
Figure 9.33 Property Tax Revenue from Coastal Parcels by County in Southeast Coastal Region, 2007
Property tax revenues received by taxing authorities from coastal real estate in the
Southeast region were much higher in the highly urbanized counties of Palm Beach,Broward and Miami-Dade. One reason for this was the relatively larger amount of taxable value on the coasts of those counties.
102

8/9/2019 Florida's Ocean and Coastal Economies Report Phase 2
http://slidepdf.com/reader/full/floridas-ocean-and-coastal-economies-report-phase-2 117/219
The Southwest Florida Coastal Region
The Southwest Florida coastal region consists of the seven counties in the Southwestcorner of the state ranging northwards through Collier, Lee, Charlotte, Sarasota, Manatee,Hillsborough and Pinellas counties. Historically, this region developed from north (theTampa Bay Area) to south with much of the most recent development occurring in
Collier County at the southern end. Pinellas County in the north has a series of top rankedbeaches; Hillsborough, the next county south, has little by way of beaches but has amajor port. Manatee County has nice beaches on Anna Maria Island, and SarasotaCounty has top ranked beaches similar to those in Pinellas County. Charlotte County hasa relatively small beachfront, and Lee County to the south has famous beaches on itsoffshore islands. Collier County at the south end of the region has a well developedbeachfront, particularly at Naples and Marco Island.
8%
19%
4%
21%4%
22%
22%
Collier Lee Charlotte Sarasota Manatee Hil lsborough Pinellas
Figure 9.34 Distribution of Number of Coastal Properties by County Southwest Region, 2007
There were 51,469 coastal properties in the Southwest Florida region in 2007, withabout one fifth of the properties in each of Sarasota, Hillsborough and Pinellascounties. There were relatively few coastal properties in Charlotte County.
103

8/9/2019 Florida's Ocean and Coastal Economies Report Phase 2
http://slidepdf.com/reader/full/floridas-ocean-and-coastal-economies-report-phase-2 118/219
16%
16%
3%
22%4%
19%
20%
Collier Lee Charlotte Sarasota Manatee Hil lsborough Pinellas
Figure 9.35 Distribution of Coastal Property Values by County in Southwest Region, 2007
The coastal properties had a value of $44.8B, with 22% in Pinellas County and about20% in Hillsborough and Pinellas counties.
$1,681,110
$749,854
$582,432
$917,255
$795,698
$781,758
$787,787
$0 $500,000 $1,000,000 $1,500,000 $2,000,000
Collier
Lee
Charlotte
Sarasota
Manatee
Hillsborough
Pinellas
Figure 9.36 Distribution of Average Coastal Property Values in Southwest Coastal Region, 2007
Collier County had the highest average value of coastal properties ($1,681,110) in2007, followed by Sarasota County ($927,255). The lowest average value was inCharlotte County.
104

8/9/2019 Florida's Ocean and Coastal Economies Report Phase 2
http://slidepdf.com/reader/full/floridas-ocean-and-coastal-economies-report-phase-2 119/219
0 2 4 6 8 10 12 1
Collier
Lee
CharlotteSarasota
Manatee
Hillsborough
Pinellas
Percent4
Figure 9.37 Coastal Values as Percent of Total Value in Southwest Coastal Region, 2006
Coastal values in Sarasota County accounted for a larger share of the region’sproperty values.
Coastal real estate accounted for the largest share of total property values in SarasotaCounty (almost 40%), with the smallest share in Charlotte County.
0 20 40 60 80 100 120 140
Collier
Lee
Charlotte
Sarasota
Manatee
Hillsborough
Pinellas
Percent
Figure 9.38 Percent Growth in Coastal Value in Southwest Coastal Region 2002-2007
Coastal values grew most rapidly in Manatee County between 2002 and 2007,followed by Sarasota and Pinellas counties. The slowest growth in coastal valuesoccurred in Collier and Lee counties.
105

8/9/2019 Florida's Ocean and Coastal Economies Report Phase 2
http://slidepdf.com/reader/full/floridas-ocean-and-coastal-economies-report-phase-2 120/219
0%
20%
40%
60%
80%
100%
CollierLeeCharlotteSarasotaManateeHillsboroughPinellas
Residential Commercial Other
Figure 9.39 Distribution of Coastal Property Values by Land Use in Southwest Coastal Region, 2007
Residential land uses accounted for the largest share of coastal value in all sevencounties in the Southwest Florida coastal region. Commercial values are relativelymore important in Collier County and also in Hillsborough and Pinellas in the mosturbanized counties. Hillsborough and Pinellas also have relatively high government-owned coastal values.
$0 $2,000,000 $4,000,000 $6,000,000 $8,000,000 $10,000,000 $12,000,000 $14,000,000
Collier
Lee
Charlotte
Sarasota
Manatee
Hillsborough
Pinellas
Residential Commercial Other
Figure 9.40 Average Coastal Property Values by Land Use in Southwest Coastal Region, 2007
Commercial properties had much higher average values than residential and otherland uses in the seven county Southwest Florida region. Collier County had by far thehighest average coastal commercial value, and Charlotte County had the lowest.
106

8/9/2019 Florida's Ocean and Coastal Economies Report Phase 2
http://slidepdf.com/reader/full/floridas-ocean-and-coastal-economies-report-phase-2 121/219
$70.6
$98.6
$15.0
$110.9
$25.4
$102.0
$143.1
$0
$20
$40
$60
$80
$100
$120
$140
$160
CollierLeeCharlotteSarasotaManateeHillsboroughPinellas
M i l l i o n $
Figure 9.41 Property Tax Revenues from Coastal rcels by County in Southwest Coastal Region, 2007
he Big Bend Coastal Region
end range northwestward from the Tampa-St. Petersburg
Pa
Property tax revenues received by taxing authorities from coastal real estate in theSouthwest region were more than $100M in Pinellas, Sarasota and Hillsboroughcounties. Property tax revenues were small in Charlotte and Manatee counties.
T
The seven counties of the Big Barea through Pasco, Hernando, Citrus, Levy, Dixie, Taylor and Jefferson counties. Thetwo southernmost counties result primarily from urban spillovers from the Tampa Bayarea further south, accounting for almost 85% of the total population in the seven-countyregion. Jefferson and Dixie counties each have about 15,000 in population, and TaylorCounty has fewer than 25,000 residents. Jefferson County has only a single coastalparcel which is government-owned. The Big Bend region is remarkable for its lack of coastal beaches, a fact that inhibited the historical development of its coastal areas.
53%
10%
3%
15%
11%
8% 0%
Pasco Hernando Citrus Levy Dixie Taylor Jefferson Figure 9.42 Distribution of the Number of Coastal Properties by County Big Bend R on, 2007egi
There were 6,407 coastal properties in the Big Bend region in 2007, with over one-half of the properties in Pasco County. Hernando County had 10%, Levy County (thesite of the historic coastal community of Cedar Key) had 15% and Dixie County had11%.
107
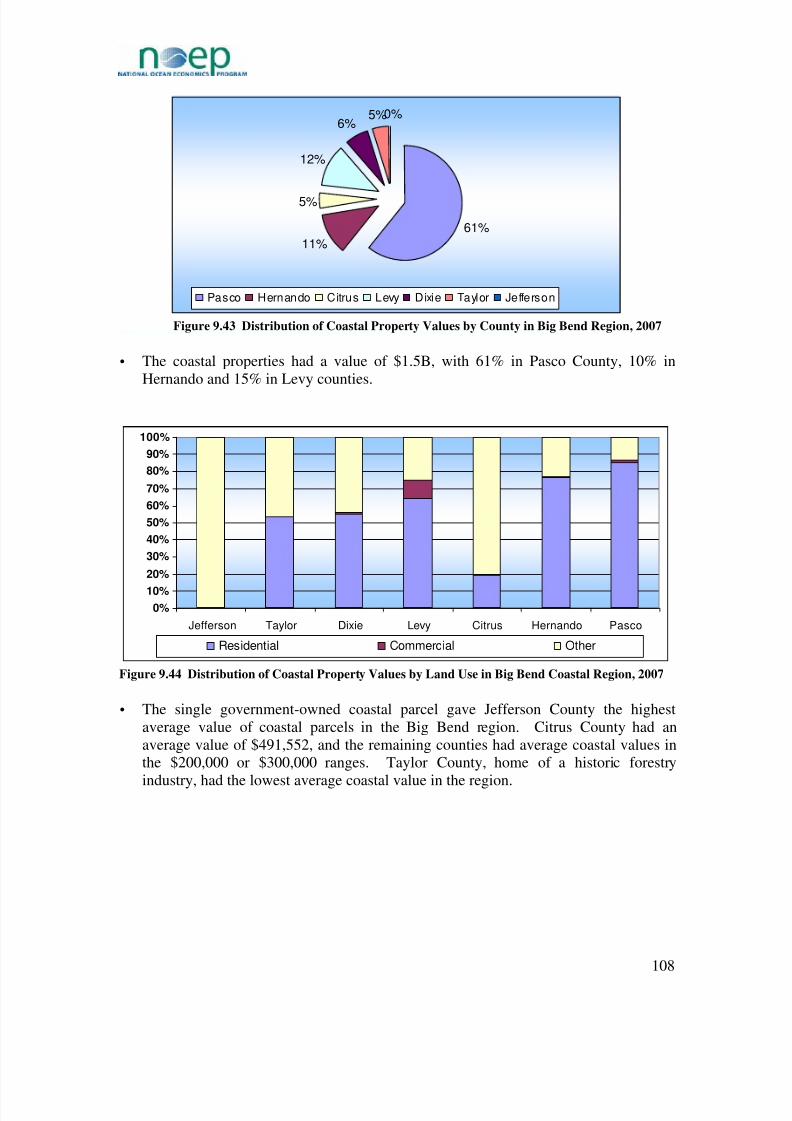
8/9/2019 Florida's Ocean and Coastal Economies Report Phase 2
http://slidepdf.com/reader/full/floridas-ocean-and-coastal-economies-report-phase-2 122/219
61%
11%
5%
12%
6%5%0%
Pasco Hernando Citrus Levy Dixie Taylor Jefferson
Figure 9.43 Distribution of Coastal Property Values by County in Big Bend Region, 2007
The coastal properties had a value of $1.5B, with 61% in Pasco County, 10% inHernando and 15% in Levy counties.
0%10%
20%
30%
40%
50%
60%
70%
80%
90%
100%
PascoHernandoCitrusLevyDixieTaylorJefferson
Residential Commercial Other
Figure 9.44 Distribution of Coastal Property Values by Land Use in Big Bend Coastal Region, 2007
The single government-owned coastal parcel gave Jefferson County the highestaverage value of coastal parcels in the Big Bend region. Citrus County had anaverage value of $491,552, and the remaining counties had average coastal values inthe $200,000 or $300,000 ranges. Taylor County, home of a historic forestry
industry, had the lowest average coastal value in the region.
108

8/9/2019 Florida's Ocean and Coastal Economies Report Phase 2
http://slidepdf.com/reader/full/floridas-ocean-and-coastal-economies-report-phase-2 123/219
2.6
1.2
0.5
4.2
5.4
4.4
0.1
0 1 2 3 4 5
Pasco
Hernando
Citrus
Levy
Dixie
Taylor
Jefferson
Percent 6
Figure 9.45 Coastal Value as Percent of Total Value in Big Bend Coastal Region, 2006
Coastal real estate accounted for small shares of total county property values in all thecounties of the Big Bend region. Only in Dixie County did the share exceed 5%.
115.3
187.0
223.1
153.4
236.3
311.1
0.0
0 50 100 150 200 250 300 350
Pasco
Hernando
Citrus
Levy
Dixie
Taylor
Jefferson
Percent
Figure 9.46 Percent Growth in Coastal Value in Big Bend Coastal Region 2002-2007
Coastal values grew most rapidly in Taylor County between 2002 and 2007, followedby Dixie and Citrus counties. The slowest growth in coastal values occurred in Pascoand Levy counties. Jefferson County had no coastal growth between 2002 and 2007.
109

8/9/2019 Florida's Ocean and Coastal Economies Report Phase 2
http://slidepdf.com/reader/full/floridas-ocean-and-coastal-economies-report-phase-2 124/219
0%
10%
20%
30%
40%50%
60%
70%
80%
90%
100%
PascoHernandoCitrusLevyDixieTaylorJefferson
Residential Commercial Other
Figure 9.47 Distribution of Coastal Property Values by Land Use in Big Bend Coastal Region, 2007
Residential land uses accounted for the largest share of coastal value in five of the
seven counties in the Big Bend Florida coastal region. Both Citrus and Jeffersoncounties have large amounts of government-owned coastal property. Commercialvalues are relatively unimportant on the region’s coast except for Levy County, hometo the historic community of Cedar Key.
$0 $200,000 $400,000 $600,000 $800,000 $1,000,000 $1,200,000 $1,400,000 $1,600,000 $1,800,000
Pasco
Hernando
Citrus
Levy
Dixie
Taylor
Jefferson
Residential Commercial Other
Figure 9.48 Average Coastal Property Values by Land Use in Big Bend Coastal Region, 2007
Commercial properties had much higher average values than residential and otherland uses in the region, except in Jefferson and Citrus counties. Pasco County had thehighest average coastal commercial value, and Dixie County had the lowest.
110
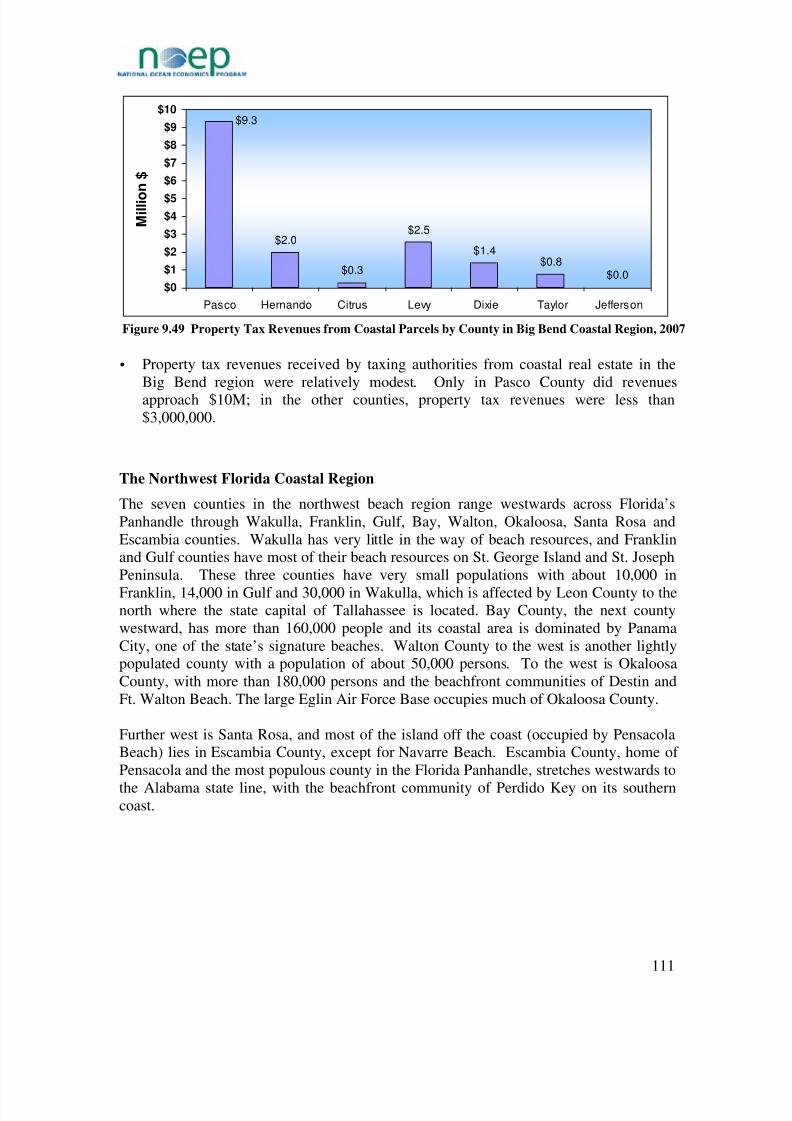
8/9/2019 Florida's Ocean and Coastal Economies Report Phase 2
http://slidepdf.com/reader/full/floridas-ocean-and-coastal-economies-report-phase-2 125/219
$2.0
$0.3
$2.5
$1.4$0.8
$0.0
$9.3
$0
$1
$2
$3
$4
$5
$6
$7
$8
$9
$10
Pasco Hernando Citrus Levy Dixie Taylor Jefferson
M i l l i o
n $
Figure 9.49 Property Tax Revenues from Coastal Parcels by County in Big Bend Coastal Region, 2007
Property tax revenues received by taxing authorities from coastal real estate in theBig Bend region were relatively modest. Only in Pasco County did revenuesapproach $10M; in the other counties, property tax revenues were less than$3,000,000.
The Northwest Florida Coastal Region
The seven counties in the northwest beach region range westwards across Florida’sPanhandle through Wakulla, Franklin, Gulf, Bay, Walton, Okaloosa, Santa Rosa andEscambia counties. Wakulla has very little in the way of beach resources, and Franklinand Gulf counties have most of their beach resources on St. George Island and St. JosephPeninsula. These three counties have very small populations with about 10,000 in
Franklin, 14,000 in Gulf and 30,000 in Wakulla, which is affected by Leon County to thenorth where the state capital of Tallahassee is located. Bay County, the next countywestward, has more than 160,000 people and its coastal area is dominated by PanamaCity, one of the state’s signature beaches. Walton County to the west is another lightlypopulated county with a population of about 50,000 persons. To the west is OkaloosaCounty, with more than 180,000 persons and the beachfront communities of Destin andFt. Walton Beach. The large Eglin Air Force Base occupies much of Okaloosa County.
Further west is Santa Rosa, and most of the island off the coast (occupied by PensacolaBeach) lies in Escambia County, except for Navarre Beach. Escambia County, home of Pensacola and the most populous county in the Florida Panhandle, stretches westwards to
the Alabama state line, with the beachfront community of Perdido Key on its southerncoast.
111
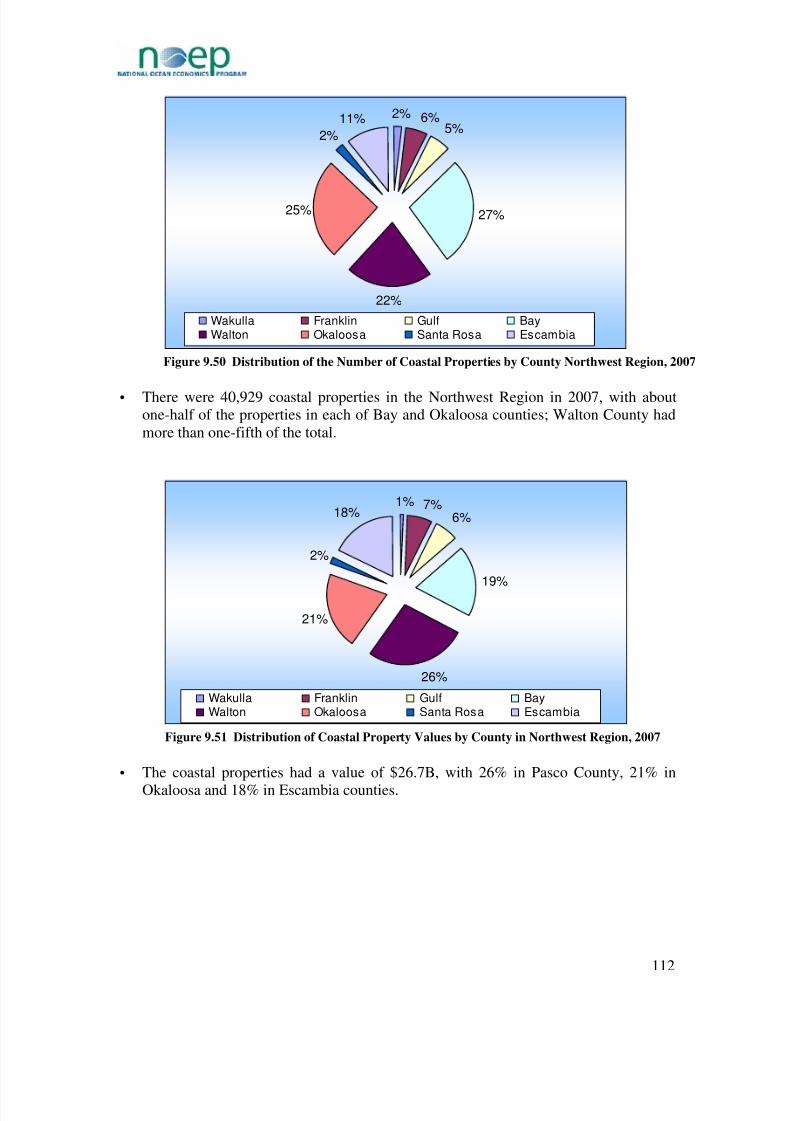
8/9/2019 Florida's Ocean and Coastal Economies Report Phase 2
http://slidepdf.com/reader/full/floridas-ocean-and-coastal-economies-report-phase-2 126/219
2% 6%5%
27%
22%
25%
2%
11%
Wakulla Franklin Gulf BayWalton Okaloosa Santa Rosa Escambia
Figure 9.50 Distribution of the Number of Coastal Properties by County Northwest Region, 2007
There were 40,929 coastal properties in the Northwest Region in 2007, with aboutone-half of the properties in each of Bay and Okaloosa counties; Walton County hadmore than one-fifth of the total.
1% 7%6%
19%
26%
21%
2%
18%
Wakulla Franklin Gulf BayWalton Okaloosa Santa Rosa Escambia
Figure 9.51 Distribution of Coastal Property Values by County in Northwest Region, 2007
The coastal properties had a value of $26.7B, with 26% in Pasco County, 21% in
Okaloosa and 18% in Escambia counties.
112

8/9/2019 Florida's Ocean and Coastal Economies Report Phase 2
http://slidepdf.com/reader/full/floridas-ocean-and-coastal-economies-report-phase-2 127/219
$295,112
$771,809
$765,694
$445,147
$802,119
$522,657
$580,075$1,073,146
$0 $200,000 $400,000 $600,000 $800,000 $1,000,000 $1,200,000
Wakulla
Franklin
Gulf
Bay
Walton
Okaloosa
Santa Rosa
Escambia
Figure 9.52 Distribution of Average Coastal Property Values in Northwest Coastal Region, 2007
Several large valuable government-owned coastal parcels, including Pensacola NavalAir Station, Fort Pickens State Park and Gulf Islands National Seashore, gave
Escambia County in the far west the highest average value of coastal parcels in theNorthwest Region. The lowest average value was in far east rural Wakulla County.
0 5 10 15 20 25 30 35 40 45
Wakulla
Franklin
Gulf
Bay
Walton
Okaloosa
Santa Rosa
Escambia
Percent
Figure 9.53 Coastal Value as Percent of Total Value in Northwest Coastal Region, 2006
Coastal real estate accounted for over 40% of total county property values in BayCounty. Coastal property value accounted for a higher proportion of the total in this
county than in any other Florida coastal county. It was even higher than in MonroeCounty with its Florida Keys archipelago. Coastal property values accounted for lessthan 10% in Okaloosa and Santa Rosa counties.
113

8/9/2019 Florida's Ocean and Coastal Economies Report Phase 2
http://slidepdf.com/reader/full/floridas-ocean-and-coastal-economies-report-phase-2 128/219
0 50 100 150 200 250 300 350 400 450 500
Wakulla
Franklin
Gulf
Bay
Walton
Okaloosa
Santa Rosa
Escambia
Percent
Figure 9.54 Percent Growth in Coastal Value in Northwest Coastal Region 2002-2007
Coastal values grew most rapidly in Escambia County between 2002 and 2007.However, much of this increase in value resulted from a sharp revaluation of government-owned property in the county in 2007. Private properties in Escambiaincreased by 169% between 2002 and 2007, which was the fifth highest rate amongthe eight counties in the Northwest region. County government-owned properties donot pay property taxes, and there are occasions where Property Appraisers makeadjustments to their values with a lag.
0%
10%
20%
30%
40%
50%
60%
70%
80%
90%
100%
Wakulla Franklin Gulf Bay Walton Okaloos a Santa Ros a Es cam bia
Residential Commercial Other
Figure 9.55 Distribution of Coastal Property Values by Land Use in Northwest Coastal Region, 2007
Residential land uses accounted for the largest share of coastal value in all of theeight counties in the Northwest Florida coastal region. Only Bay County has asubstantial amount of commercial land use on the beach.
114

8/9/2019 Florida's Ocean and Coastal Economies Report Phase 2
http://slidepdf.com/reader/full/floridas-ocean-and-coastal-economies-report-phase-2 129/219
$0 $2,000,000 $4,000,000 $6,000,000 $8,000,000 $10,000,000
Wakulla
Franklin
Gulf
Bay
Walton
Okaloosa
Santa Rosa
Escambia
Residential Commercial Other
Figure 9.56 Average Coastal Property Values by Land Use in Northwest Coastal Region, 2007
Setting Escambia aside, it is noteworthy that the rate of appreciation in propertyvalues was highest at the eastern end of the region and declined with movementwestward across the region, with one exception. It suggests that the category 4Hurricane Ivan which made landfall on the western boundary of Escambia County in2004 may have had adverse impacts on property appreciation across NorthwestFlorida, with the magnitude of the impact diminishing farther eastward from thelandfall. The exception is St. Joseph Peninsula in Gulf County, which juts out intothe Gulf making it more vulnerable to hurricanes to the west.
Commercial properties had generally higher average values than residential and other
land uses in the region, except in the less intensively developed coastal areas of SantaRosa, Gulf and Wakulla counties. The highest commercial values are in Escambiaand Bay counties.
$2.5
$12.7$10.0
$47.7$50.6
$67.7
$6.1$2.9
$0
$10
$20
$30
$40
$50
$60
$70
$80
Wakulla Frank lin Gulf Bay Walton Ok aloos a Santa Ros a Es cam bia
M
i l l i o n $
Figure 9.57 Property Tax Revenues from Coastal Parcels by County Northwest Coastal Region, 2007
115

8/9/2019 Florida's Ocean and Coastal Economies Report Phase 2
http://slidepdf.com/reader/full/floridas-ocean-and-coastal-economies-report-phase-2 130/219
Property tax revenues received by taxing authorities from coastal real estate in theNorthwest region were relatively modest, except for Bay, Walton and Okaloosacounties that provided over $50M in tax revenues.
9.2 Tourist-Oriented Coastal Property in FloridaAs noted previously, tourist-oriented property on Florida’s coasts includeaccommodations, restaurants and groceries, retail stores and shopping centers, andentertainment and recreational facilities.
Hotels
Hotels alone account for more than 70% of the total commercial property value in theareas near the shore.18 They are also a primary form of accommodation used bydomestic visitors to the s
19tate.
Home/Apt/Condo
34%
Condo/Timeshare
7%
Other
8%
Ship
3%
Second
Home/Apt/Condo
3%
Hotel/Motel/Bed&
Breakfast
45%
Figure 9.58 Type of Accommodations Used by Domestic Visitors to Florida
About 45% of domestic visitors to Florida stay in hotels, motels or the relatively smallnumber of bed and breakfast facilities. The Florida Division of Hotels and Restaurantslicenses lodging facilities in the state. In 2008, the number of licensed bed and breakfasts(BNBs) is less than 6% of the total of hotels/motels and BNBs. It is likely that BNBs areconsiderably smaller on average than hotels and motels.
18 Coastal Real Estate Study, page 3.19See 2006 Florida Visitor Study, p. 31.
116

8/9/2019 Florida's Ocean and Coastal Economies Report Phase 2
http://slidepdf.com/reader/full/floridas-ocean-and-coastal-economies-report-phase-2 131/219
Hotels/Motels
74%
Transient
Rooming Houses
4%
Transient
Apartments
17%
Bed & Breakfast
5%
Figure 9.59 Licenses for Tourist and Transient Housing in Florida, 2008
Tourists visiting Florida also stay with friends and relatives in private homes, in secondhomes and in homes owned by groups of friends and relatives. Many of these facilitiesare on the beach, but the real estate data do not provide a basis for distinguishingproperties used in this way from other properties with similar uses.
There were a total of 792 hotels and motels in the coastal counties of Florida in 2007 witha total market valuation of $6.7B. It was possible to match a number of the properties inthe real estate database to the properties in the license database and to obtain the capacityin rooms for the matched properties.20 The number of rooms per $1,000 of propertyvalue was computed for the matched properties by coastal region, and the capacities of other properties were extrapolated from these estimates. The coastal hotels and motels inFlorida have a total capacity of 90,742 rooms in 2008. These amounted to 23.5% of thetotal hotel and motel rooms in the state –almost one in four hotel/motel rooms in the stateare located along the state’s coasts.
Restaurants
Restaurants, like hotels, are important places where tourists in Florida spend their dollars.Both types of establishments, of course, receive the dollars of local residents as well astourists. The real estate database contains information on free standing restaurants –onproperty tax paying facilities which are not part of larger facilities, such as hotels andshopping centers.
There were 259 freestanding restaurants in the shore-adjacent zone of Florida’s coasts.These properties had a value of $418.8M. Matching restaurants in the real estate file torestaurants in the license files, and calculating the number of seats per $1,000 of value,resulted in an estimate of 77,424 seats in these free standing coastal restaurants. Theseproperties accounted for only a small percentage (2.5%) of the 3.5M seats in all licensedrestaurants in the state.
20 The names of the owners of the properties in the real estate database are not always the same as thenames of the licensees in the license database, particularly when the property tax bills are sent to banks orreal estate agencies rather than directly to the property owners. Licenses may also be issued to centralcorporate offices rather than individual properties.
117

8/9/2019 Florida's Ocean and Coastal Economies Report Phase 2
http://slidepdf.com/reader/full/floridas-ocean-and-coastal-economies-report-phase-2 132/219
Retail and Entertainment Facilities
The value of retail and entertainment facilities along Florida’s coasts amounted to $1.4Bin 2007. Of this, approximately two thirds was in retail facilities and one third was inentertainment facilities.
(Millions of Dollars)
Retail, $942
Entertainment
& Recreation,
$430
Figure 9.60 Value of Coastal Retail and Entertainment Properties, 2007
Coastal entertainment facilities include attractions, bars, arenas, stadiums and race tracks,theatres and golf courses. One-third of the value of these properties is accounted for byattractions, and over 30% is accounted for by golf courses. A fourth of the value isaccounted for by bars and nightclubs.
Attractions
35%
Bars &
Nightclubs
20%
Golf Courses
33%
Arenas,
Stadiums,
Tracks
9%
Theatres
3%
Figure 9.61 Entertainment & Recreation in Florida Coastal Properties, 2007
Tourist-Oriented Facilities in Coastal Regions
Coastal hotels and motels in Southeast Florida had a value of $3.9B in 2007, almost 60%of the value of coastal hotels and motels in the state. Southwest Florida had the secondlargest share (21.5%) and the share of the Big Bend area was relatively insignificant (less
then 1%).
118
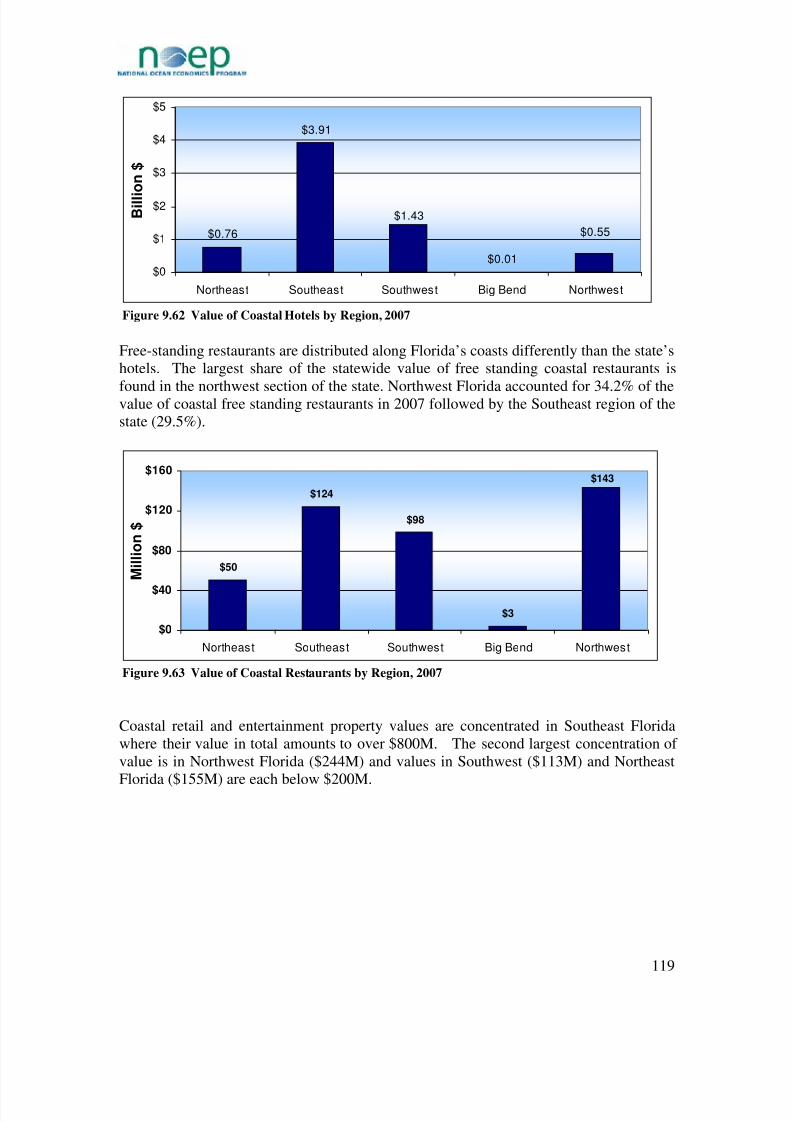
8/9/2019 Florida's Ocean and Coastal Economies Report Phase 2
http://slidepdf.com/reader/full/floridas-ocean-and-coastal-economies-report-phase-2 133/219
$0.76
$3.91
$0.01
$1.43
$0.55
$0
$1
$2
$3
$4
$5
Northeast Southeast Southwest Big Bend Northwest
B i l l i o n $
Figure 9.62 Value of Coastal Hotels by Region, 2007
Free-standing restaurants are distributed along Florida’s coasts differently than the state’shotels. The largest share of the statewide value of free standing coastal restaurants is
found in the northwest section of the state. Northwest Florida accounted for 34.2% of thevalue of coastal free standing restaurants in 2007 followed by the Southeast region of thestate (29.5%).
$50
$124
$98
$3
$143
$0
$40
$80
$120
$160
Northeast Southeast Southwest Big Bend Northwest
M i l l i o n $
Figure 9.63 Value of Coastal Restaurants by Region, 2007
Coastal retail and entertainment property values are concentrated in Southeast Floridawhere their value in total amounts to over $800M. The second largest concentration of value is in Northwest Florida ($244M) and values in Southwest ($113M) and Northeast
Florida ($155M) are each below $200M.
119
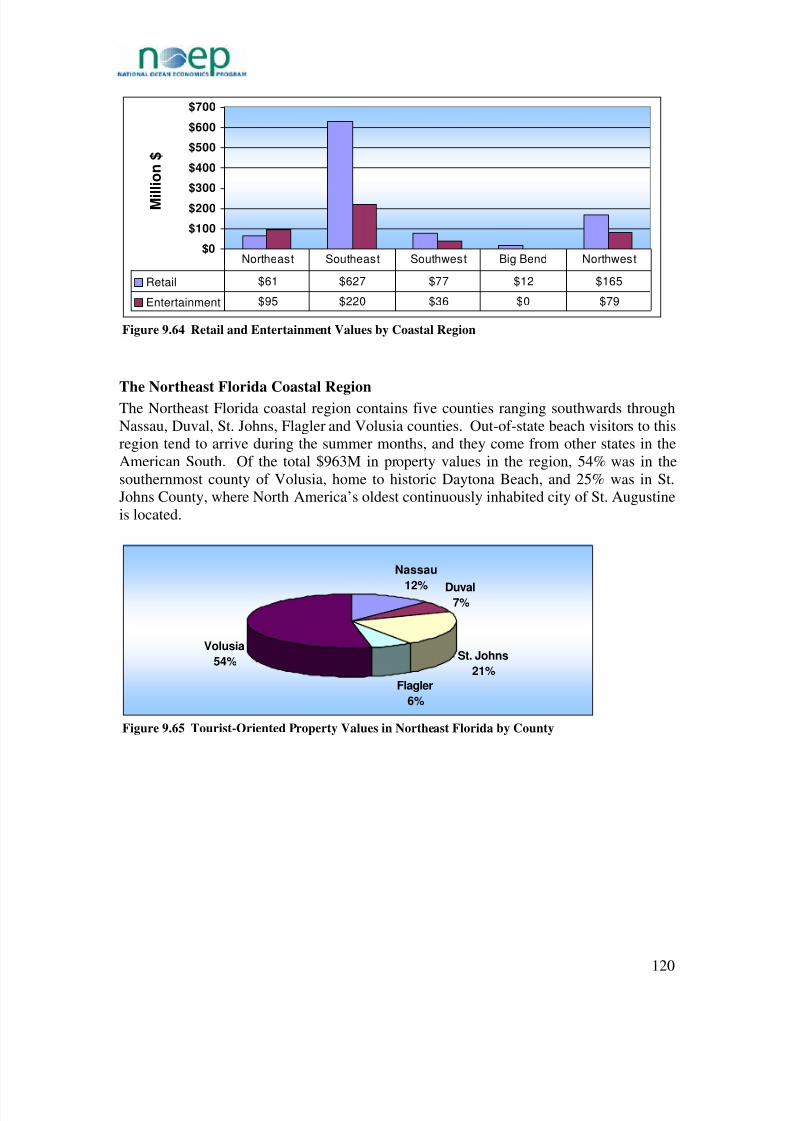
8/9/2019 Florida's Ocean and Coastal Economies Report Phase 2
http://slidepdf.com/reader/full/floridas-ocean-and-coastal-economies-report-phase-2 134/219
$0
$100
$200
$300
$400
$500
$600
$700
M i l l i o n $
Retail $61 $627 $77 $12 $165
Entertainment $95 $220 $36 $0 $79
Northeast Southeast Southwest Big Bend Northwest
Figure 9.64 Retail and Entertainment Values by Coastal Region
The Northeast Florida Coastal RegionThe Northeast Florida coastal region contains five counties ranging southwards throughNassau, Duval, St. Johns, Flagler and Volusia counties. Out-of-state beach visitors to thisregion tend to arrive during the summer months, and they come from other states in theAmerican South. Of the total $963M in property values in the region, 54% was in thesouthernmost county of Volusia, home to historic Daytona Beach, and 25% was in St.Johns County, where North America’s oldest continuously inhabited city of St. Augustineis located.
Nassau
12% Duval7%
St. Johns
21%
Flagler
6%
Volusia
54%
Figure 9.65 Tourist-Oriented Property Values in Northeast Florida by County
120

8/9/2019 Florida's Ocean and Coastal Economies Report Phase 2
http://slidepdf.com/reader/full/floridas-ocean-and-coastal-economies-report-phase-2 135/219
Hotel properties accounted for 79% of the tourist-oriented property value, andentertainment facilities accounted for 10%.
Hotels
79%
Restaurants
5%
Entertainment
10%
Retail
6%
Figure 9.66 Tourist-Oriented Property Values in Northeast Florida by Type
$0 $100 $200 $300 $400 $500 $600
Nassau
Duval
St. Johns
Flagler
Volusia
Million $
Hotels $75$42$158$1$482
Restaurants $20$5$18$2$6
Entertainment $12$3$21$56$3
Retail $13$17$9$0$22
NassauDuvalSt. JohnsFlaglerVolusia
Figure 9.67 Value of Tourist-Oriented Property in Northeast Florida by County, 2007
There was relatively little tourist-oriented property value in Flagler County except forentertainment properties. Free standing restaurants were the second largest source of tourist-oriented property in coastal Nassau County and entertainment properties were thesecond largest category in St. Johns County.
The Southeast Florida Coastal Region
Coastal Southeast Florida ranges southwards from Brevard County, through Indian River,St. Lucie, Martin, Palm Beach, Broward, Miami-Dade and Monroe counties. Out-of-state beach visitors to these counties tend to arrive in the winter months and include arelatively large number from the Northeast U.S.. Summer beach use tends to be
121
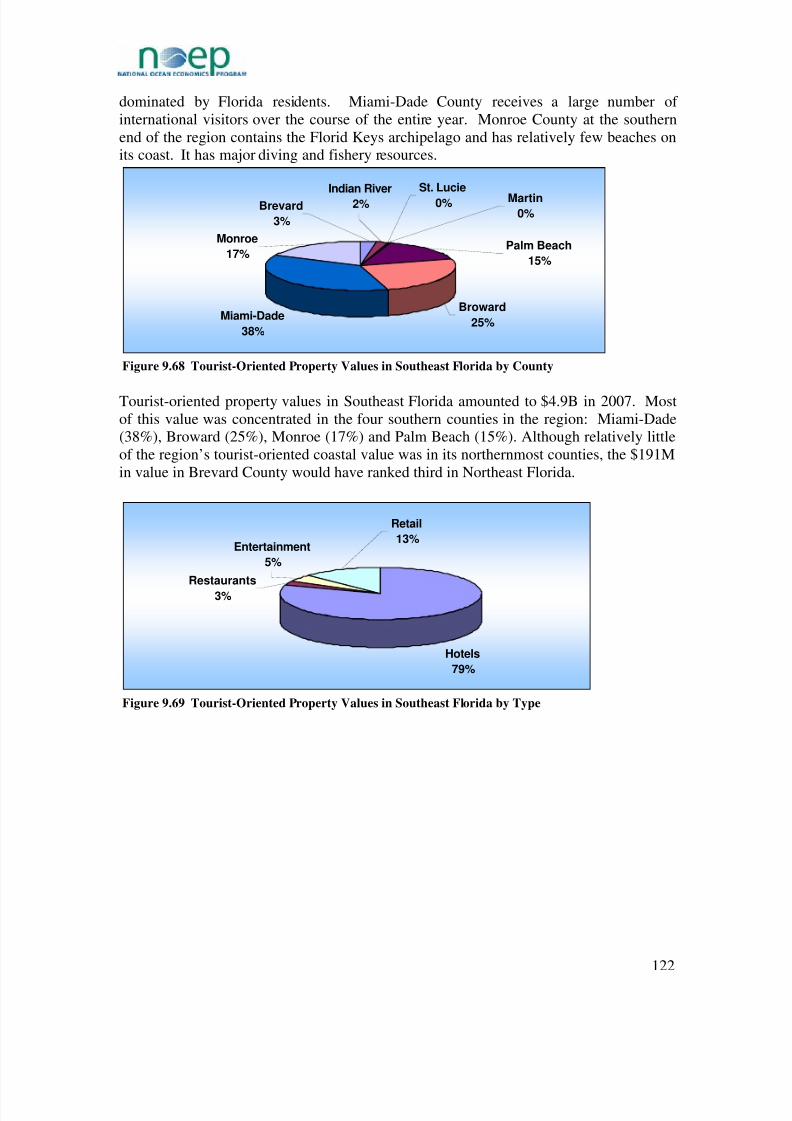
8/9/2019 Florida's Ocean and Coastal Economies Report Phase 2
http://slidepdf.com/reader/full/floridas-ocean-and-coastal-economies-report-phase-2 136/219
dominated by Florida residents. Miami-Dade County receives a large number of international visitors over the course of the entire year. Monroe County at the southernend of the region contains the Florid Keys archipelago and has relatively few beaches onits coast. It has major diving and fishery resources.
Miami-Dade
38%
Brevard
3%
Martin0%
Monroe
17%
Indian River
2%
Palm Beach
15%
St. Lucie
0%
Broward
25%
Figure 9.68 Tourist-Oriented Property Values in Southeast Florida by County
Tourist-oriented property values in Southeast Florida amounted to $4.9B in 2007. Mostof this value was concentrated in the four southern counties in the region: Miami-Dade(38%), Broward (25%), Monroe (17%) and Palm Beach (15%). Although relatively littleof the region’s tourist-oriented coastal value was in its northernmost counties, the $191Min value in Brevard County would have ranked third in Northeast Florida.
Hotels
79%
Restaurants
3%
Entertainment
5%
Retail
13%
Figure 9.69 Tourist-Oriented Property Values in Southeast Florida by Type
122

8/9/2019 Florida's Ocean and Coastal Economies Report Phase 2
http://slidepdf.com/reader/full/floridas-ocean-and-coastal-economies-report-phase-2 137/219
Hotel properties accounted for 79% of the tourist-oriented property value and retailfacilities accounted 13%.
$0 $200 $400 $600 $800 $1,000 $1,200 $1,400 $1,600 $1,800
Brevard
Indian River
St. Lucie
Martin
Palm Beach
Broward
Miami-Dade
Monroe
Million $
Hotels $104$32$10$11$537$976$1,679$562
Restaurants $6$15$4$0$11$32$12$44
Entertainment $2$8$0$0$67$45$79$19
Retail $29$36$1$2$120$165$47$228
BrevardIndian
RiverSt. LucieMartin
Palm
BeachBroward
Miami-
DadeMonroe
Figure 9.70 Value of Tourist-Oriented Properties in Southeast Florida by County, 2007
The Southwest Florida Coastal Region
The seven counties of coastal Southwest Florida range northward from Collier County,through Lee, Charlotte, Sarasota, Manatee, Hillsborough, and Pinellas counties. Out of
state beach visitors to these counties tend to arrive in the winter months and include arelatively large number from the Midwest U.S. Summer beach use tends to be dominatedby Florida residents. Hillsborough County, almost entirely inside Tampa Bay, hasrelatively few beaches on its coast and is the location of a major commercial port. Muchof Charlotte County is also cut off from the coast by the large Charlotte Harbor.
Pinellas
40%
Collier
16%
Sarasota
7%
Lee
20%
Manatee
6%
Charlotte
0%Hillsborough
11%
Figure 9.71 Tourist-Oriented Property Values in Southwest Florida by County
123

8/9/2019 Florida's Ocean and Coastal Economies Report Phase 2
http://slidepdf.com/reader/full/floridas-ocean-and-coastal-economies-report-phase-2 138/219
Pinellas County at the northern boundary accounts for 40% of the $1.6B tourist-orientedproperty in the region. The second and third largest shares are in Lee (20%) and Colliercounties (16%) at the region’s southern end.
Hotels
87%
Restaurants6%
Entertainment2%
Retail
5%
Figure 9.72 Tourist-Oriented Property Values in Southwest Florida by Type
Hotel properties accounted for 87% of the tourist-oriented property value, free standingrestaurants accounted for 6%, and retail facilities accounted for 5%.
$0 $100 $200 $300 $400 $500 $600 $700
Collier
Lee
Charlotte
Sarasota
Manatee
Hillsborough
Pinellas
Million $
Retail $0 $20 $0 $1 $5 $35 $16
Entertainment $14 $4 $1 $0 $6 $6 $6
Restaurants $0 $30 $0 $1 $5 $41 $20
Hotels $241 $280 $5 $106 $84 $105 $607
Collier Lee Charlotte Saras ota Manatee H ills borough Pinellas
Figure 9.73 Value of Tourist-Oriented Properties by County in Southwest Florida, 2007
The Big Bend Coastal Region
The Big Bend ranges northwest from the central part of Florida’s west coast throughPasco, Hernando, Citrus, Levy, Dixie, and Taylor counties before ending at JeffersonCounty in the state’s Panhandle. These counties lack beaches and have limited coastaldevelopment. Jefferson County has a single government-owned parcel on its coast and
124

8/9/2019 Florida's Ocean and Coastal Economies Report Phase 2
http://slidepdf.com/reader/full/floridas-ocean-and-coastal-economies-report-phase-2 139/219
other counties, especially Taylor, have coastal forestry parcels. The region has only$22M in tourist-oriented coastal property, and this is virtually all in Pasco and Hernandocounties (immediately north of the Tampa-St. Petersburg area) or in Levy County, hometo the historic port city of Cedar Key.
Taylor
0%
Citrus
2%
Dixie
2%Hernando
7%
Levy
78%
Pasco
11%
Jefferson
0%
Figure 9.74 Tourist-Orientated Property Values in the Big Bend Region by County
Retail properties account for the largest part of tourist-oriented coastal properties in theBig Bend region, reflecting the lack of demand for coastal lodging because of the absenceof beach resources.
Hotels
27%
Restaurants
15%Entertainment
2%
Retail
56%
Figure 9.75 Tourist-Oriented Property Values in the Big Bend Region by Type
125

8/9/2019 Florida's Ocean and Coastal Economies Report Phase 2
http://slidepdf.com/reader/full/floridas-ocean-and-coastal-economies-report-phase-2 140/219
$0 $2 $4 $6 $8 $10 $12
Pasco
Hernando
Citrus
Levy
Dixie
Taylor
Jefferson
Million $
Retail $0 $1 $0 $10 $0 $0 0
Entertainment $0 $0 $0 $0 $0 $0 0
Restaurants $1 $0 $1 $2 $0 $0 0
Hotels $1 $0 $0 $5 $0 $0 0
Pasco Hernando Citrus Levy Dixie Taylor Jefferson
Figure 9.76 Value of Tourist-Oriented Properties by County in the Big Bend Region, 2007
The Northwest Florida Coastal Region
The eight counties of Northwest Florida range westwards from Wakulla in the east,through Franklin, Gulf, Bay, Walton, Okaloosa, Santa Rosa and Escambia counties. Theregion contains $942M in coastal tourist-oriented properties, with 35% in Bay (largelyPanama City Beach), 33% in Okaloosa (including Destin) and Walton counties. There isalso substantial coastal tourist-oriented property in Escambia in the far west.
Okaloosa
33%
Gulf
0%
Walton
21%
Franklin
1%Escambia
10%
Bay
35%
Wakulla
0%
Santa Rosa
0%
Figure 9.77 Tourist-Oriented Property Values in Northwest Florida by County
126

8/9/2019 Florida's Ocean and Coastal Economies Report Phase 2
http://slidepdf.com/reader/full/floridas-ocean-and-coastal-economies-report-phase-2 141/219
Hotels account for 59% of the tourist-oriented property, followed by retail properties andfree standing restaurants.
Hotels
59%
Retail
18%Entertainment
8%
Restaurants
15%
Figure 9.78 Tourist-Oriented Property Values in Northwest Florida by Type
$0 $50 $100 $150 $200 $250 $300
Wakulla
Franklin
Gulf
Bay
Walton
Okaloosa
Santa Rosa
Escambia
Million $
Hotels $0$6$0$277$59$134$0$79
Restaurants $0$2$1$14$39$83$1$3
Entertainment $0$0$1$30$16$23$0$8
Retail $0$0$2$8$80$74$0$1
WakullaFranklinGulfBayWaltonOkaloosaSanta
RosaEscambia
Figure 9.79 Value of Tourist-Oriented Properties by County in Northwest Florida, 2007
9.3 Seasonal Housing
The U.S. Census Bureau defines Seasonal, Recreational, or Occasional Use Homes as“vacant units used or intended for use only in certain seasons or for weekends or otheroccasional use throughout the year. Seasonal units include those used for summer or wintersports or recreation, such as beach cottages and hunting cabins. Seasonal units also may
127

8/9/2019 Florida's Ocean and Coastal Economies Report Phase 2
http://slidepdf.com/reader/full/floridas-ocean-and-coastal-economies-report-phase-2 142/219
include quarters for such workers as herders and loggers. Interval ownership units, sometimescalled shared-ownership or time-sharing condominiums, also are included here”21.
Florida has the highest overall number of seasonal homes in the nation. In 2006, Floridaaccounted for almost 16% of all seasonal homes in the United States, totaling 655,447
seasonal homes. In 2006, the state of Florida ranked sixth in the nation for percentage of seasonal homes with 7.7% of all Florida homes being seasonal.
The five Florida counties with the largest percentage of seasonal homes in 2006 includedMonroe County (28%), Collier County (25%), Charlotte County (17%), Lee County(16%), and Orange County (16%). These figures represent tourist and second homedestinations with the Florida Keys, Naples, Punta Gorda and Fort Myers respective to thecounties listed above. Other large tourist destinations such as Miami and Orlando areabsent from this group, mainly due to high year-round resident populations.
Some Florida counties are also experiencing large increases in the numbers of seasonalhomes. Counties with the largest populations are also those with the largest share of Florida’s seasonal homes including Lee, Collier, Palm Beach, Miami-Dade, and Pinellascounties. These counties added the largest number of seasonal homes in the state from1990-2006. In 2006, the three counties with the largest number of seasonal homes werePalm Beach County with 67,511 seasonal homes comprising 10% of Florida’s total,Broward County had 58,225 or almost 9% of the total, and Lee County with 57,208 madeup almost 9% of all seasonal homes in Florida.
Table 9.1 shows the number of seasonal homes for the top 15 states in 1990 and 2006.Florida leads the nation in total number of seasonal homes for both years. In 1990,Michigan ranked second with 223,549 seasonal homes accounting for over 7% of theU.S. total, and New York ranked third with 212,625 seasonal homes, accounting foralmost 7% of the U.S. total. In 2006, California jumped to second place with 275,870seasonal homes, accounting for almost 7% of the U.S. total, and New York ranked thirdwith 255,667 seasonal homes, accounting for 6.1% of the U.S. total. From 1990-2006seasonal homes grew by about 57% in Florida, while overall U.S growth in seasonalhomes was 37%. States with the highest growth in seasonal homes from 1990-2006include Nevada at 174%, Hawaii at 160% and Tennessee at 127%.
Table 9.1 Seasonal Homes by State, 1990 and 2006
1990Rank State
Totalseasonalhomes
% ofU.Stotal
% ofU.S.total
Totalseasonalhomes State
2006Rank
1 Florida 417,670 13.55% 15.56% 655,647 Florida 1
2 Michigan 223,549 7.25% 6.55% 275,870 California 23 New York 212,625 6.90% 6.07% 255,667 New York 3
4 California 195,385 6.34%
5.86% 246,759 Michigan 4
21 The U.S. Census Bureau subdivides Vacant Units into seven categories: For Rent; Rented-NotOccupied; For Sale Only; Sold- not Occupied; Seasonal, Recreational or Occasional Use; For MigrantWorkers; and Other Vacant. Only Seasonal, Recreational, or Occasional Use homes are included in thisreport. For further information and definitions go to the ACS Census Website:http://www.census.gov/acs/www/index.html
128

8/9/2019 Florida's Ocean and Coastal Economies Report Phase 2
http://slidepdf.com/reader/full/floridas-ocean-and-coastal-economies-report-phase-2 143/219
1990Rank State
Totalseasonalhomes
% ofU.Stotal
% of TotalU.S.total
seasonal 2006homes State Rank
5 Texas 151,919 4.93% 4.60% 193,708 Texas 5
6 Wisconsin 150,601 4.89% 3.96% 166,866 North Carolina 6
7 Pennsylvania 144,359 4.68% 3.82% 160,989 Pennsylvania 7
8 Minnesota 105,122 3.41% 3.81% 160,512 Arizona 89 New Jersey 100,591 3.26% 3.61% 152,256 Wisconsin 9
10 North Carolina 98,714 3.20% 2.84% 119,636 New Jersey 10
11 Arizona 96,104 3.12% 2.62% 110,451 Minnesota 11
12 Massachusetts 90,367 2.93% 2.46% 103,599 Massachusetts 12
13 Maine 88,039 2.86% 2.35% 99,118 Maine 13
14 Colorado 63,814 2.07% 2.28% 95,893 Colorado 14
15 New Hampshire 57,135 1.85% 2.21% 93,096 South Carolina 15 SOURCE: U.S. Census Bureau
Table 9.2 shows the percentage of seasonal homes for selected states in 1990 and 2006.Florida ranked sixth in the nation for percentage of seasonal homes with almost 7% and
8%, respectively. The states with the highest percentage of seasonal homes in 2006 wereMaine with 14%, Vermont with 14% and New Hampshire with almost 10%. These top-ranking states have the highest percentage of seasonal homes, in part because of theirsmall population sizes.
Table 9.2 Percentage of Seasonal Homes, 1990 and 2006
Rank State 1990 2006 State Rank
1 Vermont 16.74% 14.34% Maine 1
2 Maine 15.00% 14.26% Vermont 2
3 New Hampshire 11.34% 9.62% New Hampshire 3
4 Wisconsin 7.33% 8.36% Alaska 4
5 Alaska 7.30% 8.21% Delaware 5
6 Florida 6.85% 7.68% Florida 6
7 Delaware 6.67% 6.67% Hawaii 7
8 Idaho 5.87% 6.48% Montana 8
9 Michigan 5.81% 6.16% Arizona 9
10 Arizona 5.79% 6.01% Wisconsin 10
11 Minnesota 5.69% 5.93% Wyoming 11
12 Montana 5.67% 5.47% Michigan 12
13 Wyoming 4.65% 5.13% Idaho 13
14 Colorado 4.32% 4.95% New Mexico 14
15 Massachusetts 3.65% 4.84% Minnesota 15SOURCE: U.S. Census Bureau
9.2.1 Seasonal Homes in Florida Counties
Figure 9.80 compares the percentage of homes that are seasonal within selected Floridacounties in 1990 and 2006. This figure represents the percentage of homes within eachcounty that are seasonal. For both 1990 and 2006, more than 20% of homes in CollierCounty were seasonal. The other two counties with a large percentage of seasonal homesare Monroe and Charlotte Counties. In 2006, Monroe County’s percentage of seasonal
129

8/9/2019 Florida's Ocean and Coastal Economies Report Phase 2
http://slidepdf.com/reader/full/floridas-ocean-and-coastal-economies-report-phase-2 144/219
homes leapt up to almost 29% surpassing Collier County as having the highestpercentage of seasonal homes in Florida. Another notable trend is the large growth inpercentage of seasonal homes in both Orange and Nassau counties from 1990-2006.While in Orange County the percentage of seasonal homes grew from 2% in 1990 to 16%in 2006, the total number of seasonal homes added was 3,023. Nassau County’s
percentage of seasonal homes grew from 4.5 % totaling 844 seasonal homes in 1990 toalmost 15% totaling 4,700 seasonal homes in 2006.
Counties with populations smaller than 65,000 were not included because of limited datain the 2006 ACS Census. Based on the 2000 Census, smaller counties with largepercentages of seasonal homes included Glades County with 24% seasonal homes, DixieCounty with almost 19%, Walton County with 26%, and Gulf County with 17%.
0.00%
5.00%
10.00%
15.00%
20.00%
25.00%
30.00%
35.00%
U n i t e d S t a t e s
F l o r i d a
C o l l i e r
M o n r o e
C h a r l o t t e
L e e
H i g h l a n d s
M a r t i n
M a n a t e e
S a r a s o t a
P a l m
B e a c h
P u t n a m
C i t r u s
F l a g l e r
I n d i a n R i v e r B a y
P a s c o
S t . L u c i e
B r o w a r d
O s c e o l a
L a k e
H e r n a n d o
P i n e l l a s
M a r i o n
P o l k
S t . J o h n s
V o l u s i a
O k a l o o s a
B r e v a r d
N a s s a u
M i a m i - D a d e C l a y
E s c a m b i a
H i l l s b o r o u g h
O r a n g e
S e m i n o l e
S a n t a R o s a
A l a c h u a
L e o n
D u v a l
% o f h o m e s t h a t a r e s e a s o n a l
1990
2006
SOURCE: U.S. Census Bureau
Figure 9.80 Percentage Seasonal Homes within Select Counties, 1990 and 2006
Figure 9.81 shows the number of seasonal homes for selected counties in 1990 and 2006.
These are arranged by 2006 highest population to lowest. The data determines that largercounties have much higher numbers of seasonal homes than smaller counties in Florida.There are exceptions: Hillsborough County, Duval and Orange Counties have muchsmaller numbers of seasonal homes despite having large populations. Collier andSarasota Counties have very high numbers of seasonal homes despite their comparativelylower population size.
130

8/9/2019 Florida's Ocean and Coastal Economies Report Phase 2
http://slidepdf.com/reader/full/floridas-ocean-and-coastal-economies-report-phase-2 145/219
0
10,000
20,000
30,000
40,000
50,000
60,000
70,000
80,000
M i a m i - D a d e
B r o w a r d
P a l m
B e a c h
P i n e l l a s
H i l l s b o r o u g h
O r a n g e D u v a l P o l k
B r e v a r d
V o l u s i a L e e
S t . L u c i e
P a s c o
S t . J o h n s
E s c a m b i a
M a n a t e e
M a r i o n L e
o n
A l a c h u a L a k e
C o l l i e r
S a r a s o t a
O k a l o o s a B a y
C h a r l o t t e
O s c e o l a C l
a y
H e r n a n d o
M a r t i n C i t r u s
I n d i a n R i v e r
S a n t a R o s a
S e m i n o l e
M o n r o e
H i g h l a n d s
P u t n a m
N a s s a u
N u m b e r o f S e a s o n a l H o m e s
1990
2006
SOURCE: U.S. Census Bureau
Figure 9.81 Seasonal Homes for Select Counties, 1990 and 2006 (arranged by population)
9.2.2 Rates of Change of Seasonal Homes
Figure 9.82 shows the change in number of seasonal homes for selected counties from1990-2006. Lee County experienced the largest increase in the number of seasonal
homes, followed by Collier County and Miami-Dade County. These three counties allgrew by more than 20,000 seasonal homes.
131

8/9/2019 Florida's Ocean and Coastal Economies Report Phase 2
http://slidepdf.com/reader/full/floridas-ocean-and-coastal-economies-report-phase-2 146/219
0 5,000 10,000 15,000 20,000 25,000 30,000
LeeCollier
Miami-DadePalm BeachPinellas
PolkSarasota
VolusiaMonroe
CharlotteBrowardSt. Lucie
OkaloosaOsceolaBrevardNassau
BayMartin
FlaglerOrange
Indian RiverLake
Santa RosaDuval
MarionManatee
SeminoleSt. JohnsCitrus
HighlandsHillsborough
AlachuaHernando
LeonEscambia
Clay
Number of seasonal homes
SOURCE: U.S. Census Bureau
Figure 9.82 Change in Number of Seasonal Homes for Select Counties 1990-2006
Figure 9.83 shows the rate of change of seasonal homes for selected counties from 1990-2006. Santa Rosa County experienced the largest rate of change, increasing from thecounty’s 1990 level of 349 seasonal homes to 3,085 homes in 2006. Santa Rosa also saw
a 146% growth in GDP, a 102% growth in population and an 85% growth in employmentfrom 1990-2006.
Duval, Alachua, and Nassau Counties also rank high in rate of change, but low in overallnumber of seasonal homes added due to the small number of seasonal homes in 1990. Afew counties that had large numbers of seasonal homes in 1990 also saw high growthrates through 2006, adding a significant share of seasonal homes to Florida’s total. From1990-2006 Miami-Dade County saw a 124% growth rate adding 23,574 seasonal homes,Collier County saw a 110% growth adding 24,895 homes, and Lee County saw an 82%growth rate adding 25,800 homes.
132

8/9/2019 Florida's Ocean and Coastal Economies Report Phase 2
http://slidepdf.com/reader/full/floridas-ocean-and-coastal-economies-report-phase-2 147/219
0.00% 100.00% 200.00% 300.00% 400.00% 500.00% 600.00% 700.00% 800.00% 900.00%
Santa RosaNassau
DuvalAlachuaFlagler
LeonSeminoleOkaloosa
Miami-DadeOsceola
CollierMonroe
St. LucieLee
PolkSt. Johns
VolusiaOrange
Indian RiverBay
CharlotteMartin
SarasotaBrevard
LakeCitrus
PinellasMarionEscambia
Palm BeachHighlandsHernando
HillsboroughManateeBroward
Clay
% change
SOURCE: U.S. Census Bureau
Figure 9.83 Rate of Change of Seasonal Homes 1990-2006
Figure 9.84 shows the annual change in seasonal homes for selected counties from 2002-200622. Hurricanes could have played a role in the large decrease in seasonal housing inSarasota and Pinellas Counties from 2003-2004 and in Miami-Dade, Palm Beach, Orange
and Polk Counties from 2004-2005. Of the fifteen counties depicted, eight experienced adecrease in seasonal homes from 2004-2005. This decrease may be due in part to thedamage associated with intense tropical storms and hurricanes. Between 2004 and 2005,eight out of the thirty costliest hurricanes in United States history occurred (NationalWeather Service, 2007)23. The physical and economic impacts of these coastal hazardsare a major factor determining seasonal housing populations of Florida and the Nation.
22 Only selected counties are depicted in the graph because the U.S. Census Bureau’s annual census collectsdata for those counties with populations over 65,000.23 Adjusted for inflation to year 2006 value.
133

8/9/2019 Florida's Ocean and Coastal Economies Report Phase 2
http://slidepdf.com/reader/full/floridas-ocean-and-coastal-economies-report-phase-2 148/219
-10,000
-5,000
0
5,000
10,000
15,000
D a d e C o u n t y
B r o w a r d C o u n t y
P a l m
B e a c h C o u n t y
P i n e l l a s C
o u n t y
H i l l s b o r o u g h C
o u n t y
O r a n g e C o u n t y
D u v a l C
o u n t y
P o l k C o u n t y
B r e v a r d C o u n t y
V o l u s i a C o u n t y
L e e C
o u n t y
P a s c o C o u n t y
E s c a m b i a
C o u n t y
M a n a t e e
C o u n t y
S a r a s o t a C o u n t y
C h a n g e i n N u m b r o f S e a s o n a l H o m e s
2002-2003
2003-2004
2004-2005
2005-2006
SOURCE: U.S. Census Bureau
Figure 9.84 Changes in Seasonal Homes for Selected Counties
Figures 9.85 and 9.86 show the growth in seasonal homes from 2000-2006 and from1990-2006, respectively. Counties depicted in blue are not included in the AmericanCommunity Survey.
Figure 9.85 shows that from 2000-2006 Santa Rosa, Flagler, Nassau and Seminolecounties saw the largest growth rates. This is due to their small number of seasonalhomes in 1990 causing higher percentage changes compared to other counties. BothEscambia and Pasco counties had negative growth rates during this period.
Figure 9.86 shows the growth rate for selected counties from 1990-2006. Counties withsmall numbers of seasonal homes in 1990 experienced the largest percent changes. Pascoand Putnam counties both had negative growth rates during this period.
134

8/9/2019 Florida's Ocean and Coastal Economies Report Phase 2
http://slidepdf.com/reader/full/floridas-ocean-and-coastal-economies-report-phase-2 149/219
SOURCE: U.S. Census Bureau
Figures 9.85 and 9.86 Growth in Seasonal Homes (percent change), 2000-2006 and 1990-2006
135

8/9/2019 Florida's Ocean and Coastal Economies Report Phase 2
http://slidepdf.com/reader/full/floridas-ocean-and-coastal-economies-report-phase-2 150/219
9.4 Conclusion
Florida leads the nation in number of seasonal homes. In 1990, Florida accounted for14% of all seasonal homes in the U.S. and in 2006 accounted for 16%. From 1990-2006the number of seasonal homes in Florida grew at a faster rate (57%) than the U.S. aswhole (37%).
Florida’s shoreline counties make up the majority of Florida’s seasonal homes. In 2006,Palm Beach, Broward and Lee Counties, all shoreline counties, had the largest number of seasonal homes. In 2006, the top three counties with the largest percentage of homes thatare seasonal were all shoreline counties and included Monroe County (28%), CollierCounty (25%) and Charlotte County (17%). The counties that saw the largest percentchange in seasonal homes were Duval, Alachua, and Nassau Counties, and are alsoshoreline counties. In conclusion, Florida’s shoreline counties provide a significantcontribution to seasonal housing numbers within the state.
136

8/9/2019 Florida's Ocean and Coastal Economies Report Phase 2
http://slidepdf.com/reader/full/floridas-ocean-and-coastal-economies-report-phase-2 151/219
Chapter 10 Marine Research and Education
10.1 Introduction
Marine Research
The marine research and education industry is made up of a variety of institutions,primarily in higher education and in the non-profit research sector. This is an importantpart of the Ocean Economy of coastal states, but one which is very difficult to measure asmuch of the activity takes place within institutions like universities that conduct a widevariety of non-marine activities in addition to marine research. To estimate thedimensions of the marine research and education sector requires a special supplementalsurvey.
In April 2008, NOEP sent a survey to all of Florida’s marine and coastal research andeducation institutions. Data was collected for FY 2007 and includes: annual budgets,employment figures, annual earned wages, number of students, sources of funding and
distribution of research funding.
The Institutions
Significant institutions or divisions that had a majority marine, coastal or watershed focuswere included in the survey. The final list was comprised of 55 institutions and divisions throughout the state. The survey was completed and returned by 39 of these institutions.24 Of the 39 respondents, 20 reported the number of students, all 39 reported employmentnumbers, 37 reported wages, 37 reported yearly budgets, 37 reported funding sources,and 33 reported on their research spending. The list of institutions is located at the end of this chapter (table 10.2).
10.2 Marine Institutions Survey Results
Annual Budgets
Annual budgets for marine and coastal research and education institutions in Floridatotaled $272.5M in FY 2007. The annual budget of an institution includes yearlyexpenses (operational costs), wages and overhead costs, but excludes fringe benefits. Thisnumber is an underestimate as only 37 of the reporting 39 institutions provided theiryearly budgets.
Total Wages
The amount of wages for the institutions totaled $154M; 37 of the 39 institutionsprovided information on total wages and this number reflects their combined total. Thisamount includes the total of wages and salaries within the institution, but does notinclude fringe benefits. The average wage for this sector is $52,708 which is higher thanthe state’s annual mean of $37,260 (Bureau of Labor Statistics, 2007). Total wage
24 See Appendix E for a list of institutions.
137

8/9/2019 Florida's Ocean and Coastal Economies Report Phase 2
http://slidepdf.com/reader/full/floridas-ocean-and-coastal-economies-report-phase-2 152/219
contribution from the marine research sector has been underestimated due to the numberof institutions that did not provide data for this survey.
Total Employees
The total number of employees within the institutions totaled 2,925. This number reflects
the combined total of all 39 institutions that returned a survey and provided employmentfigures. Total employees are calculated by a head count of all wage and salary employeesat the institution or within the relevant division.
Total Students
The total number of students within the institutions was 2,234; 20 of the 39 institutionsprovided data on student numbers and this number reflects their combined total. Thiscategory totaled the number of undergraduate and graduate students studying towards adegree in marine, watershed, or coastal science/policy in the institution or division. Thiscategory excludes students in K-12 education as well as student employees.
Table 10.1 Florida Marine Economic Indicators
Marine and Coastal Research and Education Institutions, FY2007
Total Annual Budgets $272,504,486
Total Annual Wages $154,144,562
Total Employment 2,925
Total Students 2,234
Sources of Funding
The survey asked respondents to report on sources of funding which were classified as:Federal, State/Local, Private, Foundations and Other; 37 of the 39 institutions provideddata on funding sources and these numbers reflect their combined totals. The Federalcategory accounted for the largest funding source at 62%, compared to Private Sourcesand Foundations which contributed the smallest percentage, both at 3% (figure 10.1).
138
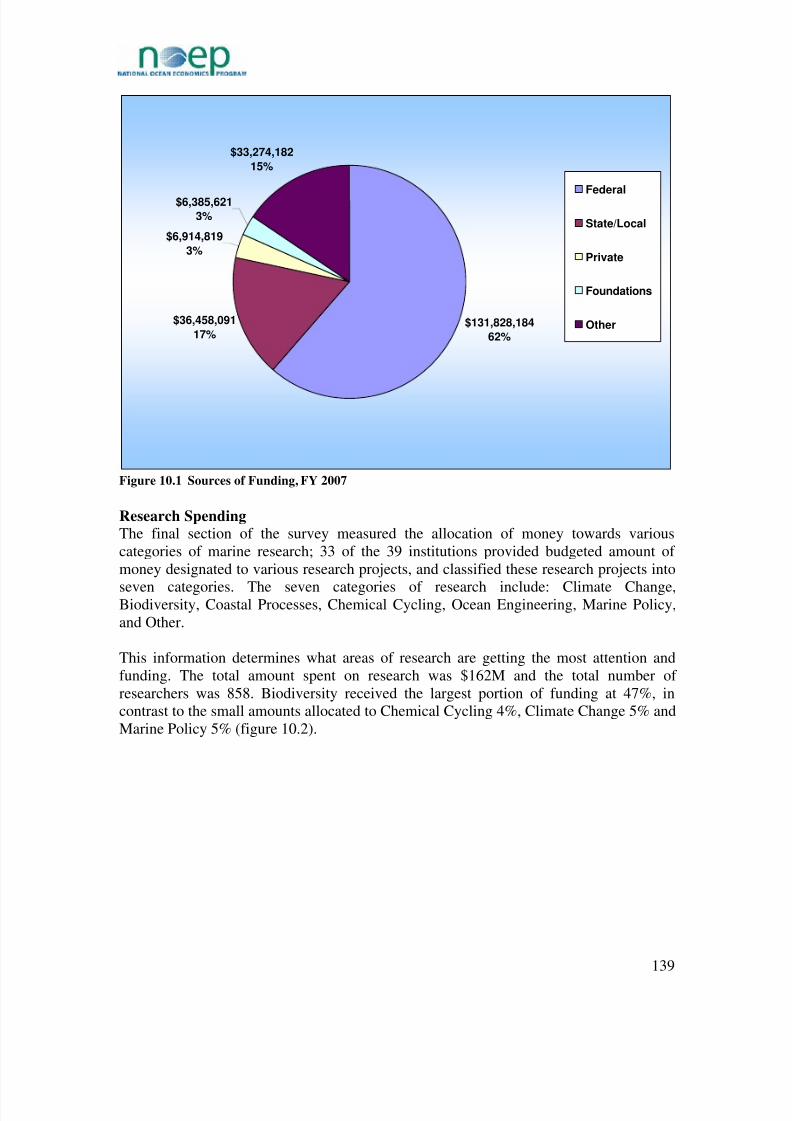
8/9/2019 Florida's Ocean and Coastal Economies Report Phase 2
http://slidepdf.com/reader/full/floridas-ocean-and-coastal-economies-report-phase-2 153/219
$131,828,184
62%
$36,458,091
17%
$6,914,819
3%
$6,385,621
3%
$33,274,182
15%
Federal
State/Local
Private
Foundations
Other
Figure 10.1 Sources of Funding, FY 2007
Research Spending The final section of the survey measured the allocation of money towards variouscategories of marine research; 33 of the 39 institutions provided budgeted amount of money designated to various research projects, and classified these research projects into
seven categories. The seven categories of research include: Climate Change,Biodiversity, Coastal Processes, Chemical Cycling, Ocean Engineering, Marine Policy,and Other.
This information determines what areas of research are getting the most attention andfunding. The total amount spent on research was $162M and the total number of researchers was 858. Biodiversity received the largest portion of funding at 47%, incontrast to the small amounts allocated to Chemical Cycling 4%, Climate Change 5% andMarine Policy 5% (figure 10.2).
139

8/9/2019 Florida's Ocean and Coastal Economies Report Phase 2
http://slidepdf.com/reader/full/floridas-ocean-and-coastal-economies-report-phase-2 154/219
$8,151,635
5%
$77,299,638
47%
$17,687,684
11%
$5,939,898
4%
$7,902,178
5%
$17,171,676
11%
$27,420,468
17%
Climate Change
Biodiversity
Chemical Processes
Chemical Cycling
Marine Policy
Ocean Engineering
Other
Figure 10.2 Areas of Research Spending, FY 2007
In a similar study conducted along the central coast of California the same findings weremade on research spending by marine research and education institutions. These findingsare surprising, as climate change has become such an important issue. While it is knownthat the oceans play a large role in global temperature balance and the carbon cycle, there
is still a great deal to be studied on the phenomena and its relation to the oceans. It seemsclear that more funding should be dedicated to climate change research and marine policyas we discover the enormous role that oceans play in our climate system.
Table 10.2 Major Marine and Coastal Research and Education Institutions in Florida, 2007
Institutions Responding Institutions
Florida Atlantic University
Center for Urban and Environmental Solutions Center for Urban and Environmental Solutions
Department of Ocean Engineering Department of Ocean Engineering
Department of Biological Sciences- MarineBiology ProgramDepartment of Chemistry and Biochemistry
Florida Gulf Coast University
Coastal Watershed Institute- Department ofMarine and Ecological Sciences
Coastal Watershed Institute- Department of Marineand Ecological Sciences
Florida International University
Biological Sciences (University Park Campus)-Marine Faculty
Biological Sciences (University Park Campus)-Marine Faculty
International Hurricane Research Center
140

8/9/2019 Florida's Ocean and Coastal Economies Report Phase 2
http://slidepdf.com/reader/full/floridas-ocean-and-coastal-economies-report-phase-2 155/219
Institutions Responding Institutions
Southeast Environmental Research Center Southeast Environmental Research Center
Florida State University
Department of Oceanography Department of Oceanography
Florida State University Coastal and Marine
Laboratory
Florida State University Coastal and Marine
Laboratory
New College of Florida
Division of Natural Sciences- Marine BiologyProgram
Division of Natural Sciences- Marine BiologyProgram
University of Florida
Department of Civil and Coastal Engineering
Department of Zoology
Archie Carr Center for Sea Turtle Research
Seahorse Key Marine Laboratory Seahorse Key Marine Laboratory
Department of Fisheries and Aquatic Sciences
Whitney Laboratory for Marine Bioscience Whitney Laboratory for Marine BioscienceUniversity of South Florida
College of Marine Science
University of West Florida
Department of Biology-Marine Biology
Community Outreach Research and LearningCenter (CORAL Center)Eckerd College
Department of Marine Science Department of Marine Science
Florida Institute of Technology
Department of Biological Sciences- Aquaculture
Program
Department of Biological Sciences- Aquaculture
ProgramDepartment of Biological Sciences-Marine BiologyProgram
Department of Biological Sciences-Marine BiologyProgram
Department of Marine and EnvironmentalSystems
Department of Marine and Environmental Systems
Jacksonville University
Department of Biology and Marine Science Department of Biology and Marine Science
Nova Southeastern University
Oceanographic Center Oceanographic Center
Rollins College
Marine Biology Program
University of MiamiRosenstiel School of Marine and Atmospheric Science(The School reported on behalf of all of the Divisions)
Division of Applied Marine Physics Division of Applied Marine Physics
Division of Marine and Atmospheric Chemistry Division of Marine and Atmospheric Chemistry
Division of Marine Affairs and Policy Division of Marine Affairs and Policy
Division of Marine Biology and Fisheries Division of Marine Biology and Fisheries
141

8/9/2019 Florida's Ocean and Coastal Economies Report Phase 2
http://slidepdf.com/reader/full/floridas-ocean-and-coastal-economies-report-phase-2 156/219
Institutions Responding Institutions
Division of Marine Geological Physics andGeophysics
Division of Marine Geological Physics andGeophysics
Division of Meteorology and PhysicalOceanography
Division of Meteorology and PhysicalOceanography
Undergraduate Marine and Atmospheric Science Undergraduate Marine and Atmospheric Science
University of Tampa
Marine Science Center Marine Science Center
Gulf Coast Research Laboratory
Statewide University-Based Programs
Florida Sea Grant College Program-University ofFlorida (Gulf of Mexico and Southeast Atlantic)
Florida Sea Grant College Program-University ofFlorida (Gulf of Mexico and Southeast Atlantic)
Private Non-Profit Marine Laboratories
Harbor Branch Oceanographic Institution, Inc. Harbor Branch Oceanographic Institution, Inc.
Mote Marine Laboratory, Inc. Mote Marine Laboratory, Inc.
State and Federal Agencies and Programs
Fish and Wildlife Research Institute- Florida Fishand Wildlife Conservation Commission
Fish and Wildlife Research Institute- Florida Fishand Wildlife Conservation Commission
NOAA National Marine Fisheries Service-Southeast Regional Office
NOAA National Marine Fisheries Service-Southeast Fisheries Science Center
NOAA National Marine Fisheries Service-SoutheastFisheries Science Center
Panama City Laboratory
NOAA Atlantic Oceanographic and MeteorologicalLaboratory
NOAA Atlantic Oceanographic and MeteorologicalLaboratory
NOAA Florida Keys National Marine Sanctuary NOAA Florida Keys National Marine Sanctuary
Apalachicola National Estuarine ResearchReserve
Rookery Bay National Estuarine ResearchReserve
Rookery Bay National Estuarine Research Reserve
Guana Tolomato Matanzas National EstuarineResearch Reserve
Guana Tolomato Matanzas National EstuarineResearch Reserve
NOAA National Undersea Research Center-Aquarius Reef Base/UNCW
NOAA National Undersea Research Center-Aquarius Reef Base/UNCW
USGS-Florida Integrated Science Center- Centerfor Coastal & Watershed Studies
USGS-Florida Integrated Science Center- Centerfor Coastal & Watershed Studies
Florida Department of Environmental Protection-Florida Geological Survey
Florida Department of Environmental Protection-Florida Geological Survey
Non-Profit and Private Organizations
Pigeon Key Foundation Pigeon Key Foundation
Marine Resources Development Foundation, Inc. Marine Resources Development Foundation, Inc.Hubbs Research Institute at Sea World Hubbs Research Institute at Sea World
Additional
Sanibel-Captiva Marine Laboratory
Sarasota Bay National Estuary Program Sarasota Bay National Estuary Program
Charlotte Harbor National Estuary Program Charlotte Harbor National Estuary Program
Charlotte Harbor Environmental Center Charlotte Harbor Environmental Center
142

8/9/2019 Florida's Ocean and Coastal Economies Report Phase 2
http://slidepdf.com/reader/full/floridas-ocean-and-coastal-economies-report-phase-2 157/219
Institutions Responding Institutions
SRI International (Marine Technology Program) SRI International (Marine Technology Program)
The Florida Aquarium Center for Conservationand Research
The Florida Aquarium Center for Conservation andResearch
Florida Institute of Oceanography Florida Institute of Oceanography
Conclusion
Florida’s Marine Research and Education sector greatly contributes to Florida’seconomy. From FY2007 annual budgets totaled $272.5M, and wages totaled $154M.While the data collected is an underestimate of the total contribution to Florida’seconomy, due to the 2/3 response rate from institutions, it is nonetheless valuable. Fromthe data collected, institutions received a majority of their funding from the FederalGovernment. And while just 5% of total research spending was allocated to Climate
Change and 5% to Marine Policy, it is clear that more funding should be directed towardsthose two categories as climate change becomes an important priority in the years tocome.
143

8/9/2019 Florida's Ocean and Coastal Economies Report Phase 2
http://slidepdf.com/reader/full/floridas-ocean-and-coastal-economies-report-phase-2 158/219
Part IV Coastal Recreation Activities and Assets
Chapter 11 Introduction and Overview
11.1 Non-Market Values
Much of the Florida coast is accessible to Florida residents for a variety of recreationalactivities including beach going, fishing, boating, scuba diving and snorkeling. Often,access to coastal areas is free or very low cost, but that does not mean that coastalresources do not represent a real economic value to Florida residents and visitors. In fact,it often is the case that resources that are available at the least cost have the highest value.Take, for example, our fascination with “low prices” and “sales” in the retail sector. Weusually regard the “best value” as being when we pay the lowest price for something wewant. The concept that we value items beyond what we pay for them is called “non-market values.” Because outdoor recreation opportunities are in high demand, but oftencome at low cost, economists have developed ways of estimating how much the publicwould pay for recreation if they had to. The willingness to pay for recreation, beyondwhat the public does pay is called “non-market value” and represents the net value addedof coastal recreational resources.
While hard to measure, the non-market value of coastal recreation has a substantialeconomic impact on state economies. The non-market value enjoyed by local residentsultimately factors into the higher prices people are willing to pay for homes near thecoast. Non-market value also reflects the maximum residents would be willing to pay togo to a substitute coastal site if their favorite part of the coast became inaccessible.Tourists who visit Florida to use its beaches or explore coral reefs also enjoy non-marketvalues in the same way as residents. A review of the estimates from the literature for thenon-market value associated with important coastal recreational activities is given inAppendix F1, with examples from Florida highlighted in italics (all values are adjusted to2007 dollars). Estimates differ due to differences in the quality of the recreationalopportunity, the preferences of the local public, and differences in the methods used toestimate the values.
While the literature differs on the exact non-market value associated with coastalrecreation, the findings demonstrate that the value of coastal recreation is substantial,from $5 per person day as a low estimate for the value of beach going in Florida to morethan $100 per person day for recreational fishing - one person day represents one visit, byone person, for one day or any part of a day.
In Phase I of the Florida Ocean Economics Report, we estimated the likely totaleconomic (non-market) value of coastal recreation in Florida, based on estimates of coastal visitation provided by the National Survey on Recreation and the Environment(Leeworthy and Wiley 2001.) In the chapter that follows, our collaborators from FloridaAtlantic University take this analysis further by examining the available data on localcoastal recreation in the state of Florida. Not surprisingly, the varied coast of Floridaoffers different recreational opportunities in different regions of the state. We foundgenerally that state and local agencies do not consistently collect good data on local
144
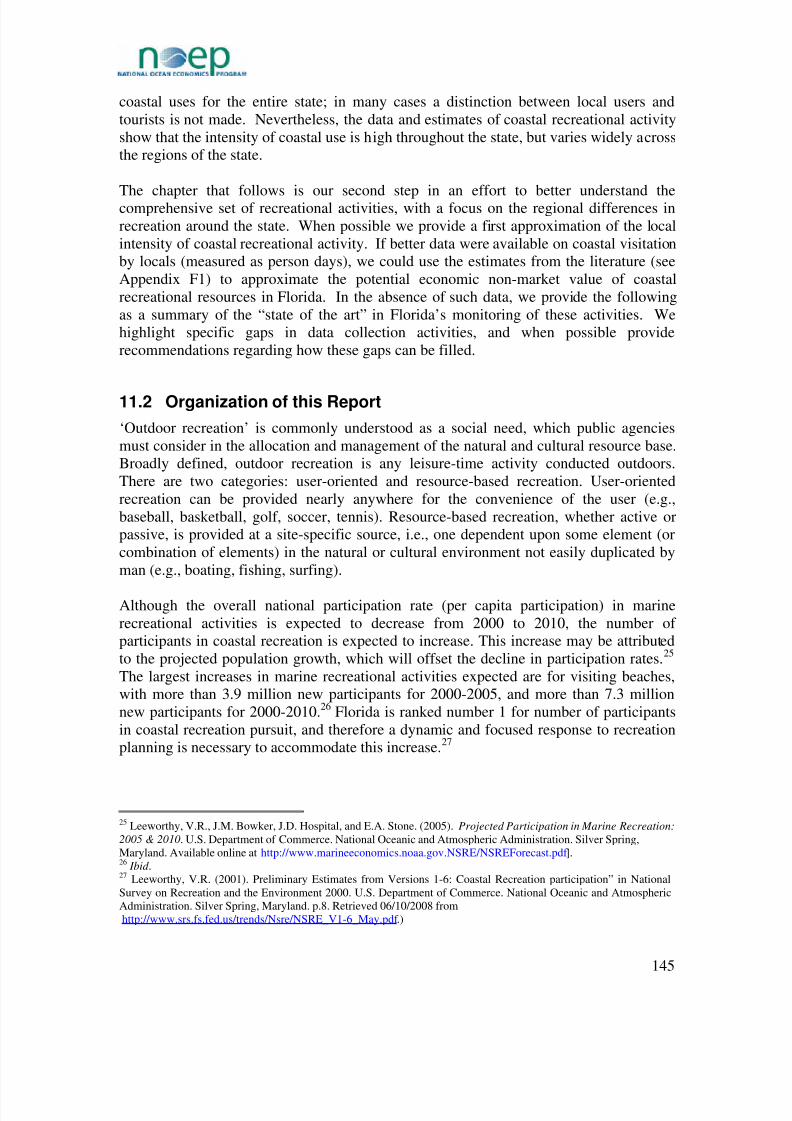
8/9/2019 Florida's Ocean and Coastal Economies Report Phase 2
http://slidepdf.com/reader/full/floridas-ocean-and-coastal-economies-report-phase-2 159/219
coastal uses for the entire state; in many cases a distinction between local users andtourists is not made. Nevertheless, the data and estimates of coastal recreational activityshow that the intensity of coastal use is high throughout the state, but varies widely acrossthe regions of the state.
The chapter that follows is our second step in an effort to better understand thecomprehensive set of recreational activities, with a focus on the regional differences inrecreation around the state. When possible we provide a first approximation of the localintensity of coastal recreational activity. If better data were available on coastal visitationby locals (measured as person days), we could use the estimates from the literature (seeAppendix F1) to approximate the potential economic non-market value of coastalrecreational resources in Florida. In the absence of such data, we provide the followingas a summary of the “state of the art” in Florida’s monitoring of these activities. Wehighlight specific gaps in data collection activities, and when possible providerecommendations regarding how these gaps can be filled.
11.2 Organization of this Report
‘Outdoor recreation’ is commonly understood as a social need, which public agenciesmust consider in the allocation and management of the natural and cultural resource base.Broadly defined, outdoor recreation is any leisure-time activity conducted outdoors.There are two categories: user-oriented and resource-based recreation. User-orientedrecreation can be provided nearly anywhere for the convenience of the user (e.g.,baseball, basketball, golf, soccer, tennis). Resource-based recreation, whether active orpassive, is provided at a site-specific source, i.e., one dependent upon some element (orcombination of elements) in the natural or cultural environment not easily duplicated byman (e.g., boating, fishing, surfing).
Although the overall national participation rate (per capita participation) in marinerecreational activities is expected to decrease from 2000 to 2010, the number of participants in coastal recreation is expected to increase. This increase may be attributed to the projected population growth, which will offset the decline in participation rates. 25 The largest increases in marine recreational activities expected are for visiting beaches,with more than 3.9 million new participants for 2000-2005, and more than 7.3 millionnew participants for 2000-2010.26 Florida is ranked number 1 for number of participantsin coastal recreation pursuit, and therefore a dynamic and focused response to recreationplanning is necessary to accommodate this increase.27
25 Leeworthy, V.R., J.M. Bowker, J.D. Hospital, and E.A. Stone. (2005). Projected Participation in Marine Recreation:
2005 & 2010. U.S. Department of Commerce. National Oceanic and Atmospheric Administration. Silver Spring,Maryland. Available online at http://www.marineeconomics.noaa.gov.NSRE/NSREForecast.pdf ].26 Ibid .27 Leeworthy, V.R. (2001). Preliminary Estimates from Versions 1-6: Coastal Recreation participation” in NationalSurvey on Recreation and the Environment 2000. U.S. Department of Commerce. National Oceanic and AtmosphericAdministration. Silver Spring, Maryland. p.8. Retrieved 06/10/2008 fromhttp://www.srs.fs.fed.us/trends/Nsre/NSRE_V1-6_May.pdf .)
145

8/9/2019 Florida's Ocean and Coastal Economies Report Phase 2
http://slidepdf.com/reader/full/floridas-ocean-and-coastal-economies-report-phase-2 160/219
As part of this statewide assessment, measures of coastal recreational activities at thecounty level are presented. Thirty-five counties in Florida are classified as coastalcounties. Due to the state’s diverse coastline and recreational activities, there is oftengreat variation in the measures of recreational activity in different areas around the state.It may be useful to analyze activity data on a regional basis for comparison purposes.
Thus, whenever possible throughout this report, information is presented for thefollowing regional groupings: Northeast, Northwest, Southeast, Southwest, and Big Bend(see figure 11.1).
The 35 coastal counties included by region are as follows:
Northeast : Duval, Flagler, Nassau, St. Johns, Volusia Northwest : Bay, Escambia, Franklin, Gulf, Okaloosa, Santa Rosa, Wakulla, WaltonSoutheast : Brevard, Broward, Indian River, Martin, Miami-Dade, Monroe, Palm Beach,St. LucieSouthwest : Charlotte, Collier, Hillsborough, Lee, Manatee, Pinellas, Sarasota Big Bend : Citrus, Dixie, Hernando, Jefferson, Levy, Pasco, Taylor
146

8/9/2019 Florida's Ocean and Coastal Economies Report Phase 2
http://slidepdf.com/reader/full/floridas-ocean-and-coastal-economies-report-phase-2 161/219
Figure 11.1 Florida Coastal Regions Map
147

8/9/2019 Florida's Ocean and Coastal Economies Report Phase 2
http://slidepdf.com/reader/full/floridas-ocean-and-coastal-economies-report-phase-2 162/219
Data to estimate the level of coastal use is presented for four main activities: recreationalboating; recreational saltwater fishing; scuba diving and snorkeling; and beach activities,including surfing. The best available data were used to document an activity at the finestscale feasible. Supporting variables, such as expenditures, for each of the four areas alsoare presented when available. To establish a baseline, a time series of data is reported for
a period of at least five years prior to the most recent data available, when feasible. Thefocus here is on recreational activities of both residents and visitors. Generally, there areat least three fundamental measures of recreation: a measure of the number of peopleparticipating in recreation (sometimes referred to as visitors or participants), the numberof user occasions (the number of times one person participated in one recreationalactivity), and the number of days these people spend participating in recreation(sometimes referred to as activity days, person days). One visitor may spend four daysat the beach thus accounting for one user occasion or four activity days. A local residentmay go to the coast one hundred times each year! Clearly, it is wrong to count thatresident as 100 visitors. Unfortunately, a standard does not exist for measuringrecreational activity across the state and in some cases reporting agencies refer to number
of people or number of visitors when they mean to refer to number of visits or activitydays. To be consistent, in the body of this report we have attempted to convert measuresof recreational activity, as reported in state reports and other information sources, toeither participants, user occasions or person days. The original data and the originalmeasures provided by the original sources are maintained in the data reported inAppendix F1.
It also is important to note here that we try to focus on recreation, as defined above, andnot on "tourism" as measured by stays in hotels, meals in restaurants, etc. The valuesassociated with those activities are discussed in the Phase I report. Finally, throughoutthis report, specific references are made to variations in data trends most likely the resultof the unusual incidence of major storm events during the 2004 and 2005 hurricaneseasons in Florida.
11.3 Impacts of the 2004 and 2005 Hurricane Seasons in Florida
The period since 1990 has seen a sharp increase in the number of hurricanes and tropicalstorms accompanied by federal major disaster or emergency declarations in Florida,compared to the previous 30-year period. Five hurricanes struck the state in the 1960s,and there was one tropical storm and one hurricane in the 1970s. There were twohurricanes in the 1980s and eight hurricanes and two tropical storms in the 1990s. Since2000, there have been eight more hurricanes and two more tropical storms. In 2004, arecord four hurricanes struck the state, along with one tropical storm, and in 2005, there
were three hurricanes that struck the state, plus the tropical storm winds from an offshorehurricane.
11.3.1 The 2004 Hurricane Season
In 2004, Florida became the first state since Texas in 1886 to experience four hurricanesin a single year. The first 2004 federal disaster declaration in Florida was made onAugust 13, 2004 for Hurricane Charley and Tropical Storm Bonnie. Charley, a category
148

8/9/2019 Florida's Ocean and Coastal Economies Report Phase 2
http://slidepdf.com/reader/full/floridas-ocean-and-coastal-economies-report-phase-2 163/219
four hurricane, was the strongest storm to hit the United States since Andrew in 1992.Frances, the category two hurricane which struck the state on September 5th, was muchless powerful, but it was followed less than three weeks later by Jeanne, a category three,which struck the state in almost the same location. Ivan, a category three hurricane,landed near Gulf Shores in Alabama on September 16th, about twelve miles west of the
Florida state line. It had a major impact on the state. Individuals were eligible forassistance in 27 of the state’s 67 counties as a result of Hurricane Charley; they wereeligible for assistance in 44 counties as a result of Frances, 37 counties as a result of Ivan,and 47 counties as a result of Jeanne.
As a result of the four disaster declarations, individuals in all 67 of the state’s countiesbecame eligible for disaster assistance. Indeed, 15 counties were included in all fourdisaster declarations, an additional 15 were included in three declarations, and 14 wereincluded in two declarations. The state’s remaining 23 counties were included in a singledeclaration. Although coastal counties are traditionally associated with hurricane-induceddamages, six of the 15 counties that experienced damages from all hurricanes in 2004
were away from the coast, as were seven of the counties that experienced damage fromthree hurricanes.
11.3.2 The 2005 Hurricane Season
Although 2004 stood out as the first time a state had been impacted by four hurricanessince Texas in 1886, Florida was again impacted by four hurricanes in 2005.Additionally, there were two tropical storms. The Florida season began with TropicalStorm Arlene which made landfall near Pensacola on June 11 th, followed by HurricaneDennis which landed at almost the same location almost one month later. Katrina landedas a category one hurricane at Hollywood, Florida, on August 25
th, before crossing the
peninsula and making its way north through the Gulf of Mexico to cause devastationalong coastal Mississippi and Louisiana, particularly in New Orleans. Hurricane Rita didnot make landfall in Florida, but it created tropical storm conditions in the Florida Keysas it traveled through the Florida Straits on September 20th. Storms arrived on oppositeends of Florida's east coast in October: Tropical Storm Tammy made landfall nearJacksonville on October 5th, and Hurricane Wilma landed near Everglades City as acategory 3 storm on October 24th.
Damage from the 2005 storms was less extensive than in 2004. Two storm-related federaldisasters were declared in Florida-one in connection with Hurricane Dennis and the otherin connection with Hurricane Wilma.
11.4 Coastal Recreation in Florida
The State of Florida, long considered a magnet for outdoor recreation enthusiasts, offersan abundance of natural areas and outdoor recreational facilities that attract millions of residents and tourists annually. An elongated peninsula totaling some 58,560 squaremiles, the state runs 450 miles from north to south and 470 miles east to west. No point in
149

8/9/2019 Florida's Ocean and Coastal Economies Report Phase 2
http://slidepdf.com/reader/full/floridas-ocean-and-coastal-economies-report-phase-2 164/219
the state is farther than 70 miles from the ocean.28 The state consists of fivephysiographic regions, the Western Highlands, Marianna Lowlands, Tallahassee Hills,Central Highlands, and the Coastal Lowlands. Each region, characterized by differentnatural resources and amenities, offers a variety of opportunities for outdoor recreation.
Managing coastal recreational resources, while ensuring their protection andpreservation, involves numerous local, state, regional, and federal agencies. Throughintergovernmental coordination and cooperation, together with active and dynamicplanning processes, Florida has made significant progress toward developing an outdoorrecreation program to meet the needs of its citizens and visitors alike.29
To set the framework for this report and to serve as a generalized guide to the levels of various outdoor recreational activities enjoyed in Florida, figures 11.2 through 11.6 showthe densities of public beaches, public parks, marine facilities (such as marinas, boatslips, dry-stack boat storage), and public boat ramps throughout the state. While thesemaps are not intended to provide definitive data on recreation amenities in Florida, they
support the overall perspective that Florida is an “ocean state” with many recreationactivities. The wide range of activities, whether it be boating, beach going, fishing, ordiving, is dependent on the state’s coasts and oceans. For information concerning themethodology used to generate maps used in this chapter, see Appendix G2.
28 Florida Department of Environmental Protection. (2000). Outdoor Recreation in Florida – 2000, theStatewide Comprehensive Outdoor Recreation Plan (herein referred to as SCORP), available online fromthe Florida Department of Environmental Protection athttp://www.dep.state.fl.us/parks/planning/forms/OutdoorRecreationinFlorida2000.pdf. p.2-2.
29 See SCORP, pp. 1-3 – 1-9.
150

8/9/2019 Florida's Ocean and Coastal Economies Report Phase 2
http://slidepdf.com/reader/full/floridas-ocean-and-coastal-economies-report-phase-2 165/219
151
Figure 11.2 Map of Public Beaches by County

8/9/2019 Florida's Ocean and Coastal Economies Report Phase 2
http://slidepdf.com/reader/full/floridas-ocean-and-coastal-economies-report-phase-2 166/219
Figure 11.3 Map of Public Parks by County
152

8/9/2019 Florida's Ocean and Coastal Economies Report Phase 2
http://slidepdf.com/reader/full/floridas-ocean-and-coastal-economies-report-phase-2 167/219
Figure 11.4 Map of Marine Facilities by County
153

8/9/2019 Florida's Ocean and Coastal Economies Report Phase 2
http://slidepdf.com/reader/full/floridas-ocean-and-coastal-economies-report-phase-2 168/219
Figure 11.5 Map of Boat Ramps by County
154

8/9/2019 Florida's Ocean and Coastal Economies Report Phase 2
http://slidepdf.com/reader/full/floridas-ocean-and-coastal-economies-report-phase-2 169/219
Figure 11.6 Map of Piers by County
155

8/9/2019 Florida's Ocean and Coastal Economies Report Phase 2
http://slidepdf.com/reader/full/floridas-ocean-and-coastal-economies-report-phase-2 170/219
Chapter 12 Park Visitation and Attendance
12.1 Introduction
To understand the role of the State of Florida in supplying coastal recreationalopportunities, such as park visitation by tourists and residents, it is useful to review the
comprehensive planning system that has been established to assess needs and meetdemands. The State Comprehensive Plan directs Florida to provide outdoor recreationalopportunities for the general public.30 The Florida Department of EnvironmentalProtection (FDEP) is the agency responsible for preparing and implementing amultipurpose plan,31 the Statewide Comprehensive Outdoor Recreation Plan (SCORP),32 with assistance from other state agencies providing access to public lands.33 SCORP isintended to serve as a framework, an information resource, and a guide for thedevelopment of a sustainable and integrated, diverse and balanced system of meetingFlorida’s current and future needs for outdoor recreational activities.
Planning for adequate recreational resources for its visitors and residents requires FDEP
to assimilate information from a variety of sources. FDEP engages in a variety of research activities in support of the plan, including periodic surveys to documentparticipation rates in particular activities. In addition, an inventory of recreationalresources is maintained and records are kept of such factors as park a ttendance andparticipant activities. These methods are used to develop Florida’s SCORP34 in a processused to estimate recreation needs statewide and in each of the state’s 11 planning regions.(See figure 12.1 and Appendix G1 for a list of Florida Comprehensive RecreationPlanning Regions and their associated counties.)
30 Chapter 187, Florida Statutes (2007). Available online athttp://www.flsenate.gov/Statutes/index.cfm?App_mode=Display_Statute&URL=Ch0187/ch0187.htm .
Seven goals and their related policies apply to providing outdoor recreational opportunities for the generalpublic. These have been compiled in the Appendices in SCORP.
31 See Sections 418.12 (Duties and Functions of Division of Recreation and Parks) and 375.021(Comprehensive Multipurpose Outdoor Recreation Plan), Florida Statutes (2007). Available online athttp://www.flsenate.gov/Statutes/index.cfm?App_mode=Display_Statute&Search_String=&URL=Ch0418/ SEC12.HTM&Title=->2007->Ch0418->Section%2012#0418.12andhttp://www.flsenate.gov/Statutes/index.cfm?App_mode=Display_Statute&Search_String=&URL=Ch0375/ SEC021.HTM&Title=->2007->Ch0375->Section%20021#0375.021, respectively.
32 Florida Department of Environmental Protection. (2000). Outdoor Recreation in Florida – 2000, theStatewide Comprehensive Outdoor Recreation Plan. Available online from the Florida Department of Environmental Protection at
http://www.dep.state.fl.us/parks/planning/forms/OutdoorRecreationinFlorida2000.pdf .
33 These other state agencies include the Florida Commission on Tourism, the Florida Fish and WildlifeConservation Commission, the Florida Department of Agriculture and Consumer Services, the FloridaDepartment of Transportation, and the five water management districts. Section 375.021(1), FloridaStatutes (2007).
34 See SCORP Chapter 5 – Outdoor Recreation Demand and Need for the detailed methodology used tocalculate statewide and regional supply and demand.
156

8/9/2019 Florida's Ocean and Coastal Economies Report Phase 2
http://slidepdf.com/reader/full/floridas-ocean-and-coastal-economies-report-phase-2 171/219
Figure 12.1 Florida Comprehensive Recreation Planning Regions
157

8/9/2019 Florida's Ocean and Coastal Economies Report Phase 2
http://slidepdf.com/reader/full/floridas-ocean-and-coastal-economies-report-phase-2 172/219
The most recently completed SCORP, entitled Outdoor Recreation in Florida – 2000,was approved by the state and federal governments in 2002, and efforts are currentlyunderway to update the plan by fall of 2008.
35Because projections of coastal recreation
are based on statistical estimates from statewide surveys, the plan cautions that data usedto determine demand at the statewide and planning district levels should not be used to
assess needs at the local or sub-regional (county) level because a statistically appropriatesample may not exist for at the sub-regional level. Instead, counties must prepare LocalGovernment Comprehensive Plans,36 which incorporate the results of periodic needsassessments for parks and other recreational amenities within the Recreation and OpenSpace Element as well as other components of these planning documents. It should alsobe noted that each of the 11 Regional Planning Councils in Florida must prepare aRegional Policy Plan to guide future growth and development.37
12.2 Florida’s State Parks
One of the largest in the country, the system of State Parks in Florida contributes to theallure of the Sunshine State. Covering more than 723,000 acres with 100 miles of white,sandy beaches, there are 161 parks, which offer swimming and diving, fishing andboating, and other activities year-around. State Parks support a variety of coastal useactivities. We first review activities within State Parks and later discuss state use activityfor each use type including State Parks and other areas of the Florida coast. The StateParks are divided for management purposes into the following five districts (figure12.2).38, 39
35 Telephone interview (February 20, 2008) with Patricia M. Evans, Office of Park Planning, Florida StateParks, Florida Department of Environmental Protection, Tallahassee, Florida. All 50 states must prepare anupdated SCORP every five years to be eligible for federal park funding appropriated by the National Park Service through the Federal Land and Water Conservation Fund.
36 The 1985 Florida Legislature enacted the Local Government Comprehensive Planning and LandDevelopment Regulation Act (Chapter 163, Part II, Florida Statutes), which is known as the GrowthManagement Act. This law requires all of Florida’s 67 counties and 410 municipalities to adopt LocalGovernment Comprehensive Plans to guide future growth and development. In addition to recreation andopen space, these plans include chapters or “elements” regarding coastal management, future land use, capitalimprovements, conservation, transportation, infrastructure, housing, and intergovernmental coordination. See,generally, http://www.dca.state.fl.us/fdcp/dcp/compplanning/index.cfm.
37
Section 186.507, Florida Statutes (2007). Available online athttp://www.flsenate.gov/statutes/index.cfm?mode=View%20Statutes&SubMenu=1&App_mode=Display_Statute&Search_String=186.507&URL=CH0186/Sec507.HTM.
38 For further information, see http://www.dep.state.fl.us/parks/districts.htm. Provided by Brady Harrison,OMCII GIS, Florida State Parks, Florida Department of Environmental Protection. Tallahassee, Florida.
39 It should be noted that these park management districts do not necessarily coincide with the five regionalgroupings of coastal counties identified above in figure 4.1.1 and the accompanying text.
158

8/9/2019 Florida's Ocean and Coastal Economies Report Phase 2
http://slidepdf.com/reader/full/floridas-ocean-and-coastal-economies-report-phase-2 173/219
District 1: The Northwest District ranges from Perdido Key on the Alabama line to St.George Island near Apalachicola to Maclay Gardens in Tallahassee. This region has 37State Parks, including nine beach parks along the Florida coastline.
40
District 2: The Northeast District stretches from Inverness to Fernandina and from
Jacksonville to the Suwannee River. There are 34 State Parks in this district, four of which are considered coastal beach State Parks.41
District 3: The Central District runs from Anastasia to Kissimmee Prairie. Its 30 StateParks offer cool springs and breathtaking beaches. In this district there are five coastalbeach parks.42
District 4: The Southwest District stretches from the Gulf of Mexico to the Lake WalesRidge and from Inverness to the Everglades. The 35 State Parks in this area featureswamps, a salt spring, the world’s longest fishing pier, and beautiful beaches. Among thenine coastal beach parks in this region
43is Caladesi Island State Park, which was recently
named as America’s top beach destination by Dr. Stephen P. Leatherman (also known as“Dr. Beach”) of Florida International University.44
District 5: The Southeast District covers nearly 300 miles from Fort Pierce to Key West.With 25 State Parks, this region of island parks, coral reefs, bays, and marshes is asdiverse as the communities and visitors served. There are 12 coastal beach State Parks inthis district.45
40 These include Bald Point State Park, Big Lagoon State Park, Camp Helen State Park, Deer Lake StatePark, Dr. Julian G. Bruce St. George Island State Park, Grayton Beach, Henderson Beach State Park, St.Andrews State Park, and T.H. Stone Memorial St. Joseph Peninsula State Park.
41 These include Amelia Island State Park, Big Talbot Island State Park, Fort Clinch State Park, and LittleTalbot Island State Park.
42 These include Anastasia State Park, Gamble Rogers Memorial State Recreation Area at Flagler Beach,North Peninsula, Sebastian Inlet State Park, and Washington Oaks Gardens State Park.
43 In addition to Caladesi Island State Park, there are Anclote Key Preserve State Park, Delnor-WigginsPass State Park, Don Pedro Island State Park, Egmont Key State Park, Gasparilla Island State Park,
Honeymoon Island State Park, Lovers Key State Park, and Stump Pass Beach State Park.
44 “ ‘Dr. Beach’ says Caladesi Island is nation’s best beach” in The Miami Herald . Retrieved 05/22/08 fromhttp://www.miamiherald.com/775/story/542901.html.
45 These include Avalon State Park, Bahia Honda State Park, Bill Baggs Cape Florida State Park, JohnPennekamp Coral Reef State Park, Fort Pierce Inlet State Park, Fort Zachary Taylor Historic State Park,Hugh Taylor Birch State Park, Indian Key Historic State Park, John U. Lloyd Beach State Park, John D.MacArthur Beach State Park, Oleta River State Park, and St. Lucie Inlet Preserve State Park.
159

8/9/2019 Florida's Ocean and Coastal Economies Report Phase 2
http://slidepdf.com/reader/full/floridas-ocean-and-coastal-economies-report-phase-2 174/219
SOURCE: Communication from Brady Harrison, Florida State Parks, Florida Department of Environmental Protection. Tallahassee,Florida. Emailed on May 29, 2008. Figure 12.2 Map of Florida State Park Districts
160

8/9/2019 Florida's Ocean and Coastal Economies Report Phase 2
http://slidepdf.com/reader/full/floridas-ocean-and-coastal-economies-report-phase-2 175/219
12.3 State and National Park Attendance
12.3.1 State Park Attendance
Attendance at State Parks peaked in 2003/2004 at 13M visits (where a visit is equivalentto a person day46, and day use visitors and campers are combined) and rose again in2006/2007. It increased 14% from 2001/2002 to 2006/2007. Declines may be due toincreased hurricane activity in 2004 and 2005, which particularly impacted the SoutheastDistrict.
11.0
11.5
12.0
12.5
13.0
13.5
14.0
Million Person Days
A t t e n d a n c e
( M i l l i o n P e r s o n D a y s )
State Parks Total Attendance 11.6 12.4 13.4 12.0 12.2 13.2
2001-2002 2002-2003 2003-2004 2004-2005 2005-2006 2006-2007
SOURCE: Florida Statistical Abstracts, T. 19.52, 2001-2007.
Figure 12.3 Attendance at Florida State Parks, FY2001-02 to FY 2006-07
0
1,000,000
2,000,000
3,000,000
4,000,000
5,000,000
6,000,000
N u m b e r o f
P e o p l e
NORTHEAST 1,427,419 1,252,197 1,600,410 1,491,422 1,369,693 1,450,275
NORTHWEST 1,737,473 1,970,938 2,254,182 1,887,727 1,787,319 2,131,712
SOUTHEAST 4,965,291 5,537,599 5,683,573 4,716,246 4,598,949 5,039,672
SOUTHWEST 2,754,901 2,967,019 3,270,069 3,288,961 3,799,166 3,777,841
BIG BEND 676,403 666,682 601,140 596,670 644,047 764,638
2001-2002 2002-2003 2003-2004 2004-2005 2005-2006 2006-2007
SOURCE: Florida Statistical Abstracts, T. 19.52, 2001-2007. Figure 12.4 Attendance at Florida State Parks by District, FY2001-02 to FY 2006-07
• Attendance at State Parks in every coastal district has remained fairly stable since2001/2002, with the Southeast having the highest attendance over time, at 5Mvisits (person days). State Park attendance in the Southwest District has been on a
46 Personal communication, John Reynolds, Florida State Parks.
161

8/9/2019 Florida's Ocean and Coastal Economies Report Phase 2
http://slidepdf.com/reader/full/floridas-ocean-and-coastal-economies-report-phase-2 176/219
continued increase, but attendance fell in the Southeast District in 2004/2005,when this region was battered by Hurricanes Frances, Jeanne, and Wilma. TheNortheast and Northwest Districts maintained a fairly flat pattern over the period,trailed by Big Bend.
Florida’s coastal State Parks are widely used for beach going, boating, and fishing. Werevisit each of these recreation activities in detail in the following chapters. For additionalinformation regarding State Park attendance by region and county, see Appendix H.
12.3.2 National Park Attendance
The three National Parks in Florida include Biscayne, Everglades, and Dry TortugasNational Parks. The charts in this section depict trends in park visitor attendance, bothtotal attendance and attendance by region, at these parks from 2001 to 2006. It shouldalso be noted that Florida is the site of four National Memorials and Monuments, twoNational Seashores, and two National Preserves. In addition, the state is home to 28National Wildlife Refuges, four National Forests, and 17 National Wilderness Areas. The
Florida Keys National Marine Sanctuary lies entirely within Monroe County at thesouthern tip of the state, and there are three National Estuarine Research Reserves:Apalachicola River and Bay, Guana-Tolomato-Matansas, and Rookery Bay.47
14
16
18
20
22
24
26
28
A t t e n
d a n c e
M i l l i o n s
o f V i s i t s
Total (All Coas tal Regions) 26.8 26.4 26.5 25.2 16.1 17.3
2001 2002 2003 2004 2005 2006
SOURCE: U.S. Department of the Interior, National Park Service. Florida Stat istical Abstracts, T. 19.53 and 19.54, 2003, 2005,2007.
Figure 12.5 Attendance at National Parks in Florida 2001-2006
Attendance at National Parks fell 38% from 2001 to 2006, with the greatest
decline from 2004 to 2005, possibly due to an increase in hurricane/storm activityduring those two years.
47 For location maps of these outdoor recreational resources in the State of Florida, see SCORP, Figures2.16 – 2.21 on pp. 2-42 – 2-57.
162

8/9/2019 Florida's Ocean and Coastal Economies Report Phase 2
http://slidepdf.com/reader/full/floridas-ocean-and-coastal-economies-report-phase-2 177/219
0.0
1.0
2.0
3.0
4.0
5.0
6.0
7.0
A t t e n d a n c e
( M i l l i o n s
o f V i s i t s )
NORTHEAST REGION 1.5 1.6 1.8 1.7 2.7 2.8
NORTHWEST REGION 4.5 4.6 4.9 4.2 1.3 2.0
SOUTHEAST REGION 6.4 6.1 5.5 5.6 3.1 2.9
2001 2002 2003 2004 2005 2006
SOURCE: U.S. Department of the Interior, National Park Service. Florida Statistical Abstracts, T. 19.53 and 19.54, 2003, 2005, 2007.
Figure 12.6 Attendance by Region at National Parks in Florida 2001-2006
• Until 2005, the Southeast region had the highest attendance at the regions’National Parks, but declined over time, peaking in 2001 at 6,357,000. Decreasedattendance from 2004 to 2005 in the Southeast and Northwest regions may be dueto increased hurricane activity in the fall of those years. The Northeast regioncontinued to increase in attendance and was not hit by hurricanes.
Table 12.1 provides attendance levels at the three National Estuarine Research Reserveslocated in Florida. FDEP provided six years of data for the Apalachicola River and Bayreserve. The Guana-Tolomato-Matanzas reserve has recorded attendance since 2005.Data extracted from DEP with regard to the Guana-Tolomato-Matanzas reserve gives the
total attendance values from both the Recreational Area and the Environmental EducationCenter, providing an aggregate attendance total. The Rookery Bay Reserve opened itsdoors in the fall of 2004; hence the lack of earlier data.48
Table 12.1 National Estuarine Research Reserves Attendance 2002 - 20072002 2003 2004 2005 2006 2007
Apalachicola River and Bay 11,259 11,612 12,142 10,439 9,457 7,060
Guana-Tolomato-Matanzas n/a n/a n/a 181,353 154,467 105,839
Rookery Bay 0 0 9,699 9,790 9,857 11,795
SOURCE: Communication with Linda Allen, Apalachicola River and Bay National Estuarine Research Reserve (NERR) (emailed onMay 13, 2008); Janet Zimmerman, Guana-Tolomato-Matanzas NERR (emailed on May 15, 2008); and Amelia Horadam, RookeryBay NERR (emailed on May 13, 2008).
Additional information on the National Parks in Florida can be found in The U.S. National Park System: An Economic Asset at Risk .49
48 Communication with Linda Allen, Apalachicola River and Bay National Estuarine Research Reserve(NERR) (emailed on May 13, 2008); Janet Zimmerman, Guana-Tolomato-Matanzas NERR (emailed onMay 15, 2008); and Amelia Horadam, Rookery Bay NERR (emailed on May 13, 2008).
49 See Hardner & Gullison (2006) for the case study on Biscayne Bay, p. 29. Retrieved 05/29/08 fromhttp://www.npca.org/park_assets/NPCA_Economic_Significance_Report.pdf.
163

8/9/2019 Florida's Ocean and Coastal Economies Report Phase 2
http://slidepdf.com/reader/full/floridas-ocean-and-coastal-economies-report-phase-2 178/219
12.4 Recreational Reef Use
Many visitors come to the State and National Parks of the Southeast region of the state toparticipate in reef-related activities. The coral reef tract in Southeast Florida lies off thecoast extending from Martin County (north of Palm Beach) to Monroe County and theFlorida Keys. Activities range from scuba diving and snorkeling to fishing and nature-
viewing from glass-bottom boats. Reef use is described in greater detail in those sectionsof the report which provide information on these specific activities.
A 2001 study, updated in 2008 provides information on reef use and related non-marketvalues associated with recreational use are shown in the following charts. 50 For furtherinformation on the values associated with reef use in Southeast Florida, see Appendix I.
0
2
4
6
8
10
M i l l i o n P e r s o n D
a y s
Reef Use 0.53 4.24 9.44 9.17 5.46
Martin Palm Beach Broward Miami-Dade Monroe
SOURCE : Johns, G., et al. 2001, 2004.
Figure 12.7 Recreational Reef Use by Counties
• Broward and Miami-Dade counties had highest usage of reefs, at 9M person-days.
50 Leeworthy, V.R. (2008). “Economics of Coral Reef Ecosystems.” Unpublished presentation. Coping with
Climate Change – 2008 Reef Resilience Conference. Key Largo, Florida. April 22, 2008. By emailcommunication on 05/07/2008, Dr. Leeworthy noted that this presentation summarized the reef valuationresults from two earlier studies; namely, the 2001 Socioeconomic Study of Reefs in Southeast Florida
(revised in 2003) by G. Johns, V. Leeworthy, F. Bell, and M. Bonn (available online athttp://marineeconomics.noaa.gov/Reefs/PDF's/Document.pdf ) and the 2004 Socioeconomic Study of Reefs
in Martin County, Florida by G. Johns and J.W. Milon (available online at http://marineeconomics.noaa.gov/Reefs/MartinCounty2004.pdf ).
164
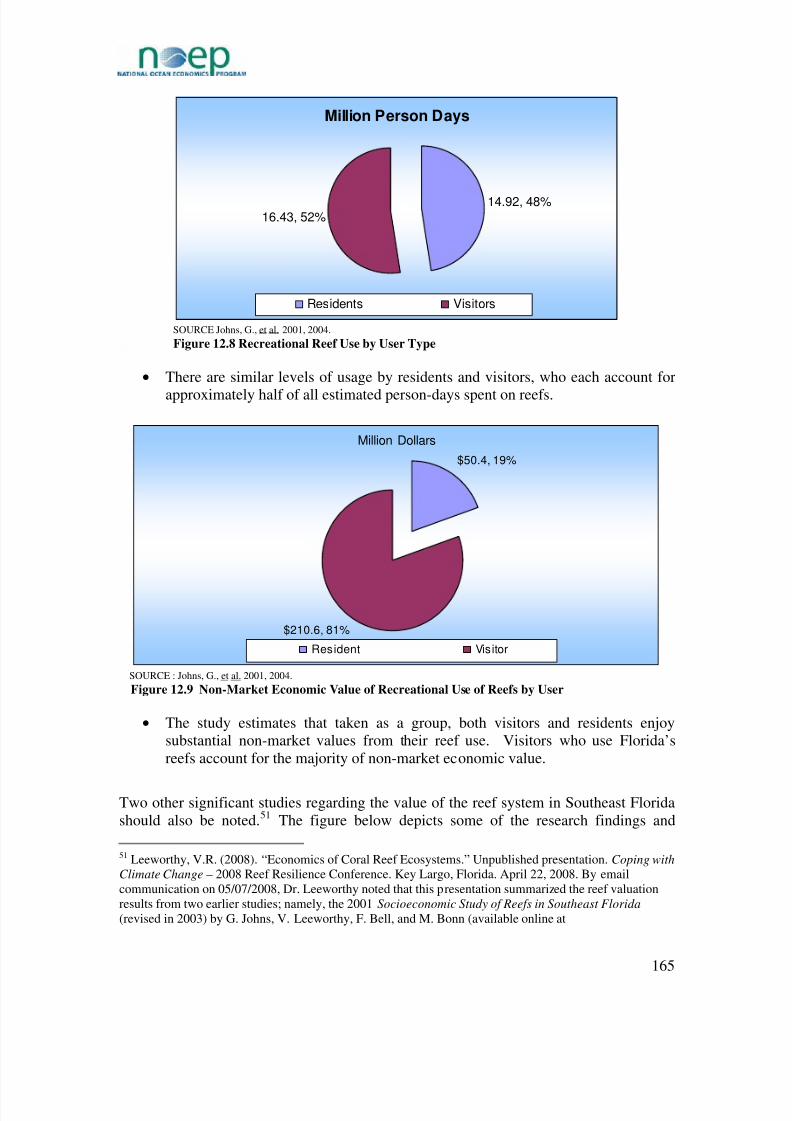
8/9/2019 Florida's Ocean and Coastal Economies Report Phase 2
http://slidepdf.com/reader/full/floridas-ocean-and-coastal-economies-report-phase-2 179/219
Million Person Days
14.92, 48%16.43, 52%
Residents Visitors
SOURCE Johns, G., et al. 2001, 2004.
Figure 12.8 Recreational Reef Use by User Type
• There are similar levels of usage by residents and visitors, who each account for
approximately half of all estimated person-days spent on reefs.
Million Dollars
$50.4, 19%
$210.6, 81%
Resident Visitor
SOURCE : Johns, G., et al. 2001, 2004.
Figure 12.9 Non-Market Economic Value of Recreational Use of Reefs by User
• The study estimates that taken as a group, both visitors and residents enjoysubstantial non-market values from their reef use. Visitors who use Florida’sreefs account for the majority of non-market economic value.
Two other significant studies regarding the value of the reef system in Southeast Floridashould also be noted.51 The figure below depicts some of the research findings and
51 Leeworthy, V.R. (2008). “Economics of Coral Reef Ecosystems.” Unpublished presentation. Coping with
Climate Change – 2008 Reef Resilience Conference. Key Largo, Florida. April 22, 2008. By emailcommunication on 05/07/2008, Dr. Leeworthy noted that this presentation summarized the reef valuationresults from two earlier studies; namely, the 2001 Socioeconomic Study of Reefs in Southeast Florida
(revised in 2003) by G. Johns, V. Leeworthy, F. Bell, and M. Bonn (available online at
165

8/9/2019 Florida's Ocean and Coastal Economies Report Phase 2
http://slidepdf.com/reader/full/floridas-ocean-and-coastal-economies-report-phase-2 180/219
highlights the importance of recreational fishing in this area, which includes MonroeCounty and the Florida Keys. 52
8.387.65
0.14
15.18
0
2
4
6
8
10
12
14
16
Snorke ling SCUBA Diving Fis hing Glas s-Bottom Boat
P e r s o n D a y s ( M i l l i o n s )
SOURCE Johns, G., et al. 2001, 2004.
Figure 12.10 Reef Use by Activity
• Fishing accounts for the most person-days of reef activity53
, at 15M person-days.
12.5 Data Gaps in Coastal Park Visitation
It is difficult to accurately compare older data on State Parks attendance with newer databecause of changes in the research methodology. SCORP was last approved by the stateand federal governments in 2002, and efforts are currently underway to revise the plan by
fall of 2008.54 The methodology used in the earlier study for documenting user-occasionscan no longer be supported; it is simply not cost-effective to use this methodologystatewide. Visit Florida is no longer a state agency, and its methodology for collectingvisitor information changed in 1999. The new method relies on a “participants-per-facility ratio,” which compares the number of one-time activity users per unit of supply.The participants-per-facility-ratio is the number of participants (resident and touristpopulations’ participation percentages) for each facility unit. Results will be displayed inthe new SCORP for 27 resource-based and user-oriented activities for each of the 11
http://marineeconomics.noaa.gov/Reefs/PDF's/Document.pdf ) and the 2004 Socioeconomic Study of Reefs
in Martin County, Florida by G. Johns and J.W. Milon (available online at
http://marineeconomics.noaa.gov/Reefs/MartinCounty2004.pdf ). For the study on artificial reef use inNorthwest Florida, see http://marineeconomics.noaa.gov/Reefs/nwfl.pdf . See alsohttp://marineeconomics.noaa.gov/Reefs/04-5294-Leeworthy.pdf .
52 Note that reef use is estimated in annual “person-days”; a person-day is defined as one person doing anactivity for a whole day or any part of a day.53 Note: Unable to determine if respondents participated in multiple activities per day.54 Telephone interview (February 20, 2008) with Patricia M. Evans, Office of Park Planning, Florida StateParks, Department of Environmental Protection, Tallahassee, Florida.
166

8/9/2019 Florida's Ocean and Coastal Economies Report Phase 2
http://slidepdf.com/reader/full/floridas-ocean-and-coastal-economies-report-phase-2 181/219
Regional Planning Councils. However, this method does not query the frequency of visitation. User occasions cannot be calculated without these frequencies. 55
While a great deal of data are available for the Florida Keys in Monroe County as well asSoutheast Florida (Miami Dade, Broward, and Palm Beach counties), there is a lack of
data for other regions of the state. Most reef use studies are concerned only with certaingeographic areas, rather than the state as a whole.
Florida counties generally do not have a good system in place for collecting county andmunicipal park data, such as attendance and user activities. Brevard County, for example,has divided the county into three regions, which do not consolidate their data forincorporation into a county-wide report. Also, economic impact studies for county parksdo not separate direct and indirect impacts.
Recommendations: The Florida Department of Environmental Protection (FDEP) shouldinclude specific usage questions in Visit Florida data and in the new SCORP survey
being developed for fall of 2008 so that various coastal activities are counted. Uniformcriteria should be established for all state, county, and local agencies that collect data onparks and beaches, so that there are no methodology changes, e.g., from activity days touser occasions.
The state would benefit greatly from an attempt to standardize the way in which visitordata is collected and reported across the state and for the many types of coastalrecreational activities. It also would be helpful if state and local agencies attempted todifferentiate between local users and tourists as these two groups have fundamentallydifferent impacts on the economy. If visitation data were collected in terms of persondays, or at least in a way that would lend itself to the calculation of user days, then localand regional agencies could use these data, combined with estimates of average spendingper person day and average non-market value per person day (taken from Florida’s manyrecreational studies or the literature) to estimate the ongoing contribution of theseactivities to local economic wellbeing.
Counties should be asked to provide parks user data, including demographics, to FDEPannually to supplement the SCORP study. The update should be based on actualquestions of specific uses, not projections as in the past.
FDEP should request that future beach studies in Florida include the origin anddestination of domestic and overseas tourists. 56
55 Communication (May 29, 2008) from Patricia M. Evans, Office of Park Planning, Florida State Parks,Department of Environmental Protection, Tallahassee, Florida.
56 (Most existing beach studies do include this information, but this is not a systematic way to provide theinformation, and it would be better to have a systematic question on Visit Florida that captures all tourists.)
167
8/9/2019 Florida's Ocean and Coastal Economies Report Phase 2
http://slidepdf.com/reader/full/floridas-ocean-and-coastal-economies-report-phase-2 182/219
Chapter 13 Recreational Boating in Florida
13.1 Introduction
A major study on boating and marinas is currently underway for the state of Florida byother contractors57. That information was not yet available to be included in this study,
but when available, it should be consulted to complete the economic picture of thisimportant part of the Florida economy. This section provides a brief overview of recreational boating based on available data. Florida ranked as the number onedestination in the U.S. for outdoor recreation in 2001 with more than 22M participants,including saltwater boating with approximately 4.3M participants.
58The Florida
Department of Environmental Protection also reported in 2001 that more than half of Florida’s residents and nearly one quarter of out-of-state visitors participated in eitherfreshwater or marine recreational boating.59 With 10,000 miles of streams and rivers andnearly 8,500 miles of tidal coastline (in addition to more than two million acres of freshwater lake surface), Florida offers a wide variety of recreational boatingopportunities for its residents and visitors. In fact, more than one million vessels were
registered or titled in the state in 2007, and approximately 97% of these were recreationalvessels.60 Vessel registration trends are indicated in the following graphs.61
57 Urban Harbors Institute, et al. (forthcoming in 2008).
Boating Access Facilities Inventory and Economic Study. University of Massachusetts-Boston, Mass.Prepared for Florida Fish and Wildlife Conservation Commission.
58 Leeworthy, Vernon R. and Peter C. Wiley. (2001). National Survey on Marine Recreation and the Environment 2000: Current Participation Patterns in Marine Recreation. A Report to the U.S. Departmentof Congress National Oceanographic Atmospheric Administration. Silver Spring, Maryland. Retrieved05/09/2008 from http://marineeconomics.noaa.gov/NSRE/NSRE_2.pdf . Cited in Sidman, Charles, TimothyFik, and Bill Sargent. (2004). A Recreational Boating Characterization
for Tampa and Sarasota Bays. Florida Sea Grant College Program, University of Florida. p. 1. Retrieved03/24/08 from http://nsgl.gso.uri.edu/flsgp/flsgps04001/flsgps04001_full.pdf .
59 Florida Department of Environmental Protection. (2006). Recreational Boating Access in Florida State
Parks. p. 1. Retrieved 05/09/2008 fromhttp://www.dep.state.fl.us/parks/planning/forms/boating%20report%2012-20-05.pdf .
60 Florida Department of Highway Safety and Motor Vehicles. (2007). Florida Vessel Owners: The Facts
and Figures. 2007 Alphabetical Vessel Statistics by County. Retrieved 05/09/2008 fromhttp://www3.hsmv.state.fl.us/Intranet/dmv/TaxCollDocs/vesselstats2007.pdf. In 2005, Florida took over asthe national leader with more registered recreational vessels (920,768) than any other state. Murray,Thomas & Associates, Inc. (2005). Florida’s Recreational Marine Industry – Economic Impact and
Growth: 1980-2005. p. iii. See, also, http://www.boatflorida.org/custom_pages/site_page_2708/index.html.
61 As used in this report, the vessel registration data obtained from the Florida Department of HighwaySafety and Motor Vehicles does not include canoes, kayaks, dealer vessels, or commercial vessels. Vessellengths ranged from less than 12 feet (Class A-1) to 110 feet or more (Class 5).
168

8/9/2019 Florida's Ocean and Coastal Economies Report Phase 2
http://slidepdf.com/reader/full/floridas-ocean-and-coastal-economies-report-phase-2 183/219
550,000
560,000
570,000
580,000
590,000
600,000
610,000
620,000
630,000
640,000
650,000
660,000
N u m b e r V e s s e l s R
e g i s t e r e d
Total (All Coastal Regions ) 585,521 603,518 620,645 640,362 591,132 648,416
2000-2001 2001-2002 2002-2003 2003-2004 2004-2005 2005-2006
SOURCE: Florida Department of Highway Safety and Motor Vehicles Figure 13.1 Florida Vessel Registration FY 2000-01 to FY 2005-06.
• The number of vessels registered remained steady after 2000/2001, at over600,000 vessels. The number of vessels registered rose 10% from 2000/2001 until2005/2006.
13.2 Boating within Florida’s Park System
Recreational boating represents an important segment of resident and tourist activitywithin the Florida park system. State Parks, in particular, have been designed with thefacilities and amenities needed to meet the demand for public water access. In 2000, 22%
of visitors to State Park s noted that they went sailing, canoeing, or boating at least onceduring their park visit.62 Approximately 5.5M residents and visitors used public boatramps that year.63
There are 129 Florida State Parks (2005 inventory64) with saltwater or freshwaterfrontage. Eighty-one of these waterfront parks (62%) offer public recreational boatingaccess, while 48 have no boating access. Boat ramps are available at 41 parks; 46 StateParks have launching areas for canoes and kayaks. Dockage for 425 boats is providedstatewide, including overnight dockage for 195 vessels.65
62
Florida Department of Environmental Protection. (2006). Recreational Boating Access in Florida State Parks . p. 3.Retrieved 05/09/2008 from http://www.dep.state.fl.us/parks/planning/forms/boating%20report%2012-20-05.pdf .
63 Florida Department of Environmental Protection. (2006). Recreational Boating Access in Florida State Parks . p. 1.Retrieved 05/09/2008 from http://www.dep.state.fl.us/parks/planning/forms/boating%20report%2012-20-05.pdf
64 Florida Department of Environmental Protection. (2006). Recreational Boating Access in Florida State Parks . p. 4.Retrieved 05/09/2008 from http://www.dep.state.fl.us/parks/planning/forms/boating%20report%2012-20-05.pdf .
65 Ibid
169

8/9/2019 Florida's Ocean and Coastal Economies Report Phase 2
http://slidepdf.com/reader/full/floridas-ocean-and-coastal-economies-report-phase-2 184/219
13.3 Boating Activity
Boaters across the nation and in Florida engage most often in recreational fishing andcruising.66 The average number of people on a boat both in Florida and nationally during
a typical outing, including the primary operator, is four.67 The following graphs presentestimates of recent trends in boater activity around the State of Florida, based oncalculations by CUES. These are not actual counts of boating activity, but estimates bythe CUES research team based on available data. The estimates are for both freshwaterand saltwater boating.
Fortunately, an economic study is underway by the Florida Fish and WildlifeConservation Commission (FWC) to assess the economic value of recreational boating inFlorida, with completion expected in fall 2008. The economic studies are designed toestimate the present and projected demand for boating facilities, quantify the economicimpact of recreational boating in Florida and estimate capital costs for new or improved
facilities. It is hoped that once this study is released, many of the economics of recreational boating in Florida will be clarified.
66 See, e.g., Strategic Research Group. (2003). 2002 National Recreational Boating Survey Report. Retrieved04/04/2008 from http://uscgboating.org/statistics/USCG_NRBS%202002-Report.pdf . [Recreational fishing, themost popular activity, was engaged in by 51.6% of survey respondents nationwide, while cruising was enjoyed by44.9% of respondents (p. 64). Florida boaters reported going fishing 55.5% of the time, and an additional 6.9% wereinvolved in a fishing tournament. 2002 National Recreational Boating Survey State Data Report. p. 23. Retrieved04/04/2008 from http://uscgboating.org/statistics/USCG_NRBS%202002-StateReport.pdf .] In a 2006 surveyprepared for the Florida Fish and Wildlife Conservation Commission, 71% of Florida boaters were found to have
engaged in recreational fishing and 70% went cruising. VAI / Market Research Online. (2006). 2006 Florida Recreational Boating Survey: Final Report . pp. 5, 19. Retrieved 05/09/2008 fromhttp://myfwc.com/Boating/waterways/Documents/Final2006RecBoatingStudyRpt.pdf .
67 VAI / Market Research Online. (2006). 2006 Florida Recreational Boating Survey: Final Report . pp. 5, 22.Retrieved 05/09/2008 from http://myfwc.com/Boating/waterways/Documents/Final2006RecBoatingStudyRpt.pdf .This is consistent with results from the Strategic Research Group. (2003). 2002 National Recreational Boating
Survey Report. pp. ii, 18. Retrieved 04/04/2008 from http://uscgboating.org/statistics/USCG_NRBS%202002-Report.pdf .
170

8/9/2019 Florida's Ocean and Coastal Economies Report Phase 2
http://slidepdf.com/reader/full/floridas-ocean-and-coastal-economies-report-phase-2 185/219
25.0
26.0
27.0
28.0
29.0
30.0
31.0
M i l l i o n P e r s o n D a y s
ALL COASTAL REGIONS 27.0 28.2 28.6 29.5 27.2 29.8
2000-2001 2001-2002 2002-2003 2003-2004 2004-2005 2005-2006
SOURCE: Sidman, C., et al. 2005 - 2007 Figure 13.2 Estimated Recreational Boating Activity FY 2000-01 to FY 2005-06.
• Using Sidman, C., et al. data CUES estimates that recreational boating persondays increased by 10% since 2000/2001 for all regions in Florida.68
0
2
4
6
8
10
12
14
Million Person Days
M i l l i o n
P e r s o n D a y s
NORTHEAST REGION 2.5 2.6 2.6 2.7 2.5 2.8
NORTHWEST REGION 2.4 2.6 2.6 2.7 2.5 2.7
SOUTHEAST REGION 10.7 11.1 11.2 11.5 10.6 11.5
SOUTHWEST REGION 7.9 8.4 8.4 8.7 8.0 8.8
BIG BEND 1.7 1.8 1.8 1.9 1.8 2.0
2000-2001 2001-2002 2002-2003 2003-2004 2004-2005 2005-2006
SOURCE: Sidman, C., et al. 2005 - 2007.
Figure 13.3 Estimated Recreational Boating Activity by Region FY 2000-01 to FY 2005-06
68 Note: Person-days calculated by multiplying Average Trips/Boater/Month/County Calculator X 12
Months X Vessel Registration. Specific calculator per county is based on the Sea Grant study of averagetrips/boater, using that # for neighboring counties, and SW #s for SE Florida (where the marine industryestimated that more than half their boaters went out weekly and about half of those several times a week).
171

8/9/2019 Florida's Ocean and Coastal Economies Report Phase 2
http://slidepdf.com/reader/full/floridas-ocean-and-coastal-economies-report-phase-2 186/219
• According to the CUES estimates, the Southeast region has the highest number of person-days for recreational boating at 11M, trailed closely by the Southwestregion at 10M. Each region shares similar trends for boating activity. 69 Foradditional information on recreational boating activity and vessel registration bycounty, see Appendix J1.
According to a survey by the Strategic Research Group, approximately 51% of Floridaboaters operated “open” motorboats on an annual basis during the survey period(September 2001-September 2002). Respondents reported using “cabin” motorboats 21%of the time (annually).70 In contrast, a 2006 survey revealed that recreational boaters inFlorida used open motorboats 77% of the time and cabin motorboats 30% and sailboats11% of the time annually (between July 2005 and June 2006). 71 Florida boaters took recreational trips about 4 days per month in both open and cabin motorboats. It wasreported that open motorboats and 6 days on sailboats. It was reported that openmotorboats were used an average of 47.82 days per year, and cabin motorboats weretaken out on an average number of 44.92 days per year, and sailboats were used 67.55
days per year.72 For additional information on recreational boating activity estimates, seeAppendix J2.
13.4 Boating and Recreational Reef Use
A popular destination for recreational boaters in the Southeast Florida region is the coralreef tract, which lies off the coast extending from Martin County (north of Palm Beach)to Monroe County and the Florida Keys.
Information on boating-related reef use and related non-market values associated withreefs is provided in section 12.4 of this report.
69 Note: Person-days calculated by multiplying Average Trips/Boater/Month/County Calculator X 12
Months X Vessel Registration. Specific calculator per county is based on the Sea Grant study of averagetrips/boater, using that # for neighboring counties, and SW #s for SE Florida (where the marine industryestimated that more than half their boaters went out weekly and about half of those several times a week).
70 Strategic Research Group. (2003). 2002 National Recreational Boating Survey State Data Report. p. 5.
Retrieved 05/14/2008 from http://uscgboating.org/statistics/USCG_NRBS%202002-StateReport.pdf .
71 VAI / Market Research Online. (2006). 2006 Florida Recreational Boating Survey: Final Report . pp. 2,8. Retrieved 05/09/2008 fromhttp://myfwc.com/Boating/waterways/Documents/Final2006RecBoatingStudyRpt.pdf . Boats used wereeither owned, rented or borrowed.
72 Strategic Research Group. (2003). 2002 National Recreational Boating Survey State Data Report. p. 6.Retrieved 05/14/2008 from http://uscgboating.org/statistics/USCG_NRBS%202002-StateReport.pdf .
172
8/9/2019 Florida's Ocean and Coastal Economies Report Phase 2
http://slidepdf.com/reader/full/floridas-ocean-and-coastal-economies-report-phase-2 187/219
13.5 Data Gaps
The Florida Department of Highway Safety and Motor Vehicles provides boatregistration data, which is collected systematically, but there is no detailed userinformation that accompanies these data. The data do not indicate whether the boaterplans on boating in freshwater or saltwater or what kind of activity the registered boat
will be used for, such as fishing, scuba diving, or cruising. While some boater surveys doask for information about the number of people on a boat during a typical outing (see,e.g., 2002 National Recreational Boating Survey Report and 2006 Florida Recreational
Boating Survey: Final Report ), it would be useful for planning and valuation purposes if other survey methodologies, such as those that are county- or region-specific, could bedesigned to collect this data.
Recommendations: Short of conducting annual surveys based on boater contactinformation from registration forms, it would be beneficial if boater registration formscould include questions regarding whether vessels will be used primarily in marine orfreshwater areas. Information also should be collected on where the applicant plans to
use the boat and for what activities. These data would help the Parks Departments in eachcounty with assessments regarding the need for future facilities, amenities, and boatingaccess points. Moreover, boater survey questions should be added to gauge the actualnumber of people on a boat, in addition to the boat operator, during a typical past year of boating.
The FWC Statewide Boating Access Facilities Inventory and Economic Study should beanalyzed, when available in late fall 2008, to see what data it provides on boater usage inspecific locations/parks/counties. As part of the FWC study, an exhaustive inventory of boating facilities and ramps was undertaken, that could be updated by counties in thefuture.
173

8/9/2019 Florida's Ocean and Coastal Economies Report Phase 2
http://slidepdf.com/reader/full/floridas-ocean-and-coastal-economies-report-phase-2 188/219
Chapter 14 Recreational Fishing in Florida
14.1 Introduction
Fishing continues to be a popular recreational activity in Florida, especially for boaters
across the state (see accompanying charts). In fact, Florida is recognized as the numberone fishing destination in the United States, according to a national survey conducted(primarily by telephone interview) in 2006 by the U.S. Census Bureau for the U.S. Fishand Wildlife Service.
73Survey results indicated that there were over 2M saltwater anglers
(both resident and non-resident) who fished in Florida in 2006 for a total of more than23.1M fishing days (person days).. These anglers spent in excess of $3B in-state, puttingFlorida in the lead nationally for angler expenditures. 74
-
100,000
200,000
300,000
400,000
500,000
600,000
700,000
N u m b e r o f L i c e n s e s
Florida Licenses 456,899 606,488 347,034 366,204
2004-2005 2006-2007 2004-2005 2006-2007
Resident Non-Resident
SOURCE: Florida Fish and Wildlife Conservation Commission Report (2004-2007) provided via email, January 2008 by Erin Rainey.
Figure 14.1 Saltwater Fishing and Sportsman Licenses for Residents and Non-Residents FY 2004-05 to
FY 2005-06
73 Southwick Associates. (2007; revised 2008). Sportfishing in America: An Economic Engine and
Conservation Powerhouse. Produced for the American Sportfishing Association with funding from theMultistate Conservation Grant Program. pp. 7-8. Retrieved 05/07/2008 fromhttp://www.asafishing.org/asa/images/statistics/resources/SIA_2008.pdf . The authors tabulate data derivedfrom U.S. Department of the Interior, Fish and Wildlife Service, and U.S. Department of Commerce, U.S.
Census Bureau. (2006). 2006 National Survey of Fishing, Hunting, and Wildlife-Associated Recreation.Retrieved 05/12/08 from http://www.census.gov/prod/2008pubs/fhw06-nat.pdf . See generally,http://www.census.gov/prod/www/abs/fishing.html. The Florida state report is available fromhttp://www.census.gov/prod/2008pubs/fhw06-fl.pdf .
74 Ibid. See also, Leeworthy, V.R. and P.C. Wiley. (2001). National Survey on Marine Recreation and the
Environment 2000: Current Participation Patterns in Marine Recreation. A Report to the U.S. Departmentof Congress National Oceanographic Atmospheric Administration. Silver Spring, Maryland. pp. 24-25.Retrieved 05/09/2008 from http://marineeconomics.noaa.gov/NSRE/NSRE_2.pdf .
174

8/9/2019 Florida's Ocean and Coastal Economies Report Phase 2
http://slidepdf.com/reader/full/floridas-ocean-and-coastal-economies-report-phase-2 189/219
-
100,000
200,000
300,000
400,000
500,000
600,000
700,000
N u m b e r o
f L i c e n s e s
TOTAL (ALL COASTAL REGIONS) 456,561 599,276 346,924 366,128
2004-2005 2005-2006 2004-2005 2005-2006
Resident Non-Resident
SOURCE: Florida Fish and Wildlife Conservation Commission Report (2004-2007) provided via email, January 2008 by Erin Rainey.
Figure 14.2 Saltwater Fishing and Sportsman Licenses for Residents and Non-Residents FY 2004-05 to
FY 2005-06, Coastal Regions Only
• There were 804,000 licenses issued in 2004/2005 and 972,000 in 2005/2006, withabout 60% issued to residents and 40% to non-resident. Total number of FishingLicenses has increased from 2004/2005 to 2005/2006 in all regions, though itincreased less among non-residents than residents. The number of licenses forresidents continues to be higher than those for non-residents.
-
50,000
100,000
150,000
200,000
250,000
N u m b e r o f
L i c e n s e s
NORTHEAST 45,258 57,444 19,486 23,806
NORTHWEST 54,339 73,636 93,261 108,988
SOUTHEAST 166,283 226,633 78,810 85,427
SOUTHWEST 143,865 186,286 124,597 118,041
BIG BEND 47,154 62,489 30,880 29,942
2004-2005 2006-2007 2004-2005 2006-2007
Resident Non-Resident
SOURCE: Florida Fish and Wildlife Conservation Commission Report (2004-2007) provided January 2008 by Erin Rainey
Figure 14.3 Saltwater Fishing and Sportsman Licenses for Residents and Non-Residents by Region FY
2004-05 to FY 2005-06
175

8/9/2019 Florida's Ocean and Coastal Economies Report Phase 2
http://slidepdf.com/reader/full/floridas-ocean-and-coastal-economies-report-phase-2 190/219
• All regions saw a rise in resident saltwater licenses; Southwest and Big Bend sawdeclines in non-resident saltwater licenses while other regions saw increases. TheSouthwest and Southeast regions accounted for nearly a third of total saltwaterlicenses issued in coastal regions in both years. The Southeast region had thehighest number of saltwater licenses among residents, a region known for its
premier fishing off the coast. The Northwest accounted for nearly a fifth of saltwater licenses issued in coastal regions in both years. The Southwest regionhad the highest number of saltwater licenses among non-residents.
• The Southeast and Southwest regions lead in saltwater fishing licenses issued toresidents in 2004/2005 and 2005/2006. The Southwest and Northwest regionslead in licenses issued to non-residents during this period. Additional informationon saltwater fishing and sportsman licenses by county can be found in AppendixK.
A common methodology for assessing the impact and breadth of sportfishing is toconduct random surveys statewide of those individuals who registered their boats withthe Florida Department of Highway Safety and Motor Vehicles.75 This technique wasused in a 2006 survey prepared for the Florida Fish and Wildlife ConservationCommission. The study revealed that 71% of respondents engaged in recreational fishingwhile boating,76 a finding which is slightly greater than that reported in other recentsurveys.77 Additional activities included recreational cruising, nature viewing,sightseeing, and visiting restaurants, among others.
75 Vessel registration data is presented in the section on Recreational Boating.
76 VAI / Market Research Online. (2006). 2006 Florida Recreational Boating Survey: Final Report .Prepared for the Florida Fish and Wildlife Conservation Commission. pp. 5, 19. Retrieved 05/09/2008 fromhttp://myfwc.com/Boating/waterways/Documents/Final2006RecBoatingStudyRpt.pdf .
77 See, e.g., Strategic Research Group. (2003). 2002 National Recreational Boating Survey Report. Retrieved 04/04/2008 from http://uscgboating.org/statistics/USCG_NRBS%202002-Report.pdf .[Recreational fishing, the most popular activity, was engaged in by 51.6% of survey respondentsnationwide (p. 64). The Strategic Research Group also determined that Florida boaters reported goingfishing 55.5% of the time, and an additional 6.9% were involved in a fishing tournament. 2002 National
Recreational Boating Survey State Data Report. p. 23. Retrieved 04/04/2008 from
http://uscgboating.org/statistics/USCG_NRBS%202002-StateReport.pdf .] See also, Sidman, C., T. Fik, andW. Sargent. (2004). A Recreational Boating Characterization for Tampa and Sarasota Bays. University of
Florida, Gainesville, Florida. Retrieved 03/24/2008 fromhttp://nsgl.gso.uri.edu/flsgp/flsgps04001/flsgps04001_full.pdf . [Fishing was the main activity for 64% of survey respondents (p. 51).]; Sidman, C., et al. (2005). A Recreational Boating Characterization for the
Greater Charlotte Harbor . University of Florida, Gainesville, Florida. Retrieved 03/24/2008 fromhttp://nsgl.gso.uri.edu/flsgp/flsgps05004.pdf . [Nearly 67% of boaters reported going fishing (p. 36).];Sidman, C., et al. (2006; revised 2007). A Recreational Boating Characterization of Sarasota County .University of Florida, Gainesville, Florida. Retrieved 03/23/2008 fromhttp://www.flseagrant.org/program_areas/waterfront/publications/TP152_A%20Recreational%20Boating%20Characterization%20of%20Sarasota_revised_2007_web.pdf . [Nearly 67% of respondents cited fishing astheir main activity (p. 50).]; Sidman, C., et al. (2007). A Recreational Boating Characterization of Brevard
176

8/9/2019 Florida's Ocean and Coastal Economies Report Phase 2
http://slidepdf.com/reader/full/floridas-ocean-and-coastal-economies-report-phase-2 191/219
14.2 Fishing and Recreational Reef Use by Anglers
A major research effort was undertaken recently for the Southeast Florida Coral Reef Initiative (SEFCRI).78 The authors used mail-back surveys and sampled those holding2006 Florida saltwater (recreational) fishing licenses throughout Martin, Palm Beach,Broward, and Miami-Dade counties
79. Survey results revealed two sub-populations of
recreational anglers in the region: one that fishes an average of one trip per month, andone that fishes three or more trips per month. More than half of the respondents in thesesurveys (52.8%) reported fishing over artificial reefs.80
-
10,000
20,000
30,000
40,000
50,000
60,000
70,000
80,000
90,000
N u
m b e r o f L i c e n s e s
Non-Resident 11,092 7,067 4,823 5,366 5,342 3,708 3,484 44,545
Resident 35,289 14,565 15,734 11,296 31,377 33,369 44,843 40,160
BrevardIndian
RiverSt. Lucie Martin
Palm
BeachBroward
Miami-
DadeMonroe
SOURCE: Florida Fish and Wildlife Conservation Commission Report (2004-2007) provided via email, January 2008 by ErinRainey.
Figure 14.4 Saltwater Fishing and Sportsman Licenses for Counties in Southwest Region, FY
2005/2006
• Monroe County had the highest number of saltwater fishing licenses in theSoutheast region, not unexpected with the Keys’ well-known fishing groundsoffshore. The County accounts for 27% of licenses in the region. Residentsaccount for most of the licenses in the Southeast region, except in MonroeCounty, which is about evenly split between residents and non-residents.
County. University of Florida, Gainesville, Florida. Retrieved 03/23/2008 fromhttp://edis.ifas.ufl.edu/SG081. [Approximately 53% of boaters surveyed went fishing (p. 35).]
78 Shivlani, M. and M. Villanueva. (2007). A Compilation and Comparison of Social Perceptions on Reef
Conditions and Use in Southeast Florida. Fishing, Diving and Other Uses Local Action Strategy Project 10- Final Report to Southeast Florida Coral Reef Initiative. Rosenstiel School of Marine and AtmosphericScience, University of Miami, Miami, Florida. Retrieved 03/07/2008 fromhttp://www.dep.state.fl.us/coastal/programs/coral/reports/FDOU/FDOU_Project_10_Final_Nov07.pdf .
79 Together, these counties comprise the “SEFCRI region” and serve as the geographic extent of SoutheastFlorida’s coral reef tract. They are part of a larger Southeast Florida region80 Shivlani, M. and M. Villanueva. (2007). A Compilation and Comparison of Social Perceptions on Reef
Conditions and Use in Southeast Florida. p. 138.
177

8/9/2019 Florida's Ocean and Coastal Economies Report Phase 2
http://slidepdf.com/reader/full/floridas-ocean-and-coastal-economies-report-phase-2 192/219
178
14.3 Data Gaps
The only systematically reported data for recreational fishing in Florida is the number of fishing licenses sold annually in each county. However, no detailed user information isassociated with this information. There is no collection of data on where applicants planon using their fishing licenses, whether on a boat or offshore or in which county location.
Also, there are some licenses with multiple uses, such as the Sportsman Gold licenses,which incorporate hunting and fishing or saltwater and freshwater fishing. Hence, there isno certainty that a person buying a Sportsman Gold license is fishing at all or engaging insaltwater fishing. Because recreational fishing is an important component of marine-dependent recreation in Florida, more should be done to better track the intensity andeconomic contribution of private recreational fishing.
Recommendation: Short of conducting annual surveys based on angler contactinformation from registration forms, more detailed user-oriented questions should beincluded in the application form for purchasing fishing licenses. These questions shouldask where an applicant plans to use the license and for what activity or purpose. Having
this information should help the Parks Departments in each county anticipate future usageand the facilities and amenities needed at each recreational fishing access point.

8/9/2019 Florida's Ocean and Coastal Economies Report Phase 2
http://slidepdf.com/reader/full/floridas-ocean-and-coastal-economies-report-phase-2 193/219
Chapter 15 Scuba Diving and Snorkeling in Florida
15.1 Introduction
Diving and snorkeling have become an important part of Florida’s Coastal Economy asboth residents and visitors access dive sites and their associated fauna and flora. 81 In fact,snorkeling and diving, which represent a significant sector of marine recreationalactivities nationwide, are ranked as the 8th and 13th most popular such activities,respectively, in the U.S.82 Further, it is anticipated that by the year 2010 at the nationallevel, participation in diving will increase by an estimated 17% in comparison with 2000levels; participation in snorkeling is expected to increase by 11% during the sametimeframe.
83
15.2 Recreational Reef Use
The socioeconomic characteristics of scuba diving and snorkeling have been studied insuch places as Northwest Florida (with its artificial reefs)84 and the Florida Keys,85 withthe most recent study having been conducted for the Southeast Florida Coral Reef Initiative (SEFCRI).86 Martin, Palm Beach, Broward, and Miami-Dade counties togethercomprise the “SEFCRI region” and serve as the geographic extent of Southeast Florida’scoral reef tract. They are part of a larger Southeast Florida region. Two other significantstudies regarding the value of the reef system in Southeast Florida, including the SEFCRIregion, should be noted. The table below depicts some of these research findings and
81 Shivlani, M., and M. Villanueva. (2007). A Compilation and Comparison of Social Perceptions on Reef
Conditions and Use in Southeast Florida. Fishing, Diving and Other Uses Local Action Strategy Project 10- Final Report to Southeast Florida Coral Reef Initiative. Rosenstiel School of Marine and AtmosphericScience, University of Miami, Miami, Florida. p. 104. Retrieved 05/15/2008 fromhttp://www.dep.state.fl.us/coastal/programs/coral/reports/FDOU/FDOU_Project_10_Final_Nov07.pdf .
82 Leeworthy, V.R., and P.C. Wiley. (2001). “Current Participation Patterns in Marine Recreation” in National Survey on Recreation and the Environment 2000. U.S. Department of Commerce. NationalOceanic and Atmospheric Administration. Silver Spring, Maryland]. Retrieved 05/15/2008 fromlinwoodp.bol.ucla.edu/dive.pdf .
83 Leeworthy, V.R., J.M. Bowker, J.D. Hospital, and E.A. Stone. (2005). Projected Participation in Marine
Recreation: 2005 & 2010. U.S. Department of Commerce. National Oceanic and AtmosphericAdministration.
84 Bell, F., M.A. Bonn, and V.R. Leeworthy. (1998). Economic Impact and Importance of Artificial Reefs in
Northwest Florida . Report for Office of Fisheries Management and Assistance Service Florida Departmentof Environmental Protection. Retrieved 05/15/2008 from http://marineeconomics.noaa.gov/Reefs/nwfl.pdf .
85 See, e.g., Leeworthy, V.R., and P.C. Wiley. (1996). Visitor Profiles: Florida Keys / Key West . U.S.Department of Commerce. National Oceanic and Atmospheric Administration. Silver Spring, Maryland.
86 See p. 104 in Shivlani and Villanueva (2007), endnote 76 (above), for listing of other studies.
179

8/9/2019 Florida's Ocean and Coastal Economies Report Phase 2
http://slidepdf.com/reader/full/floridas-ocean-and-coastal-economies-report-phase-2 194/219
highlights the importance of this area for recreational diving and snorkeling.87 Scubadiving accounts for nearly one-fourth of all recreational activities on reefs, at 7.65Mperson-days. Also, snorkeling represents a slightly larger proportion (27%) of allrecreational reef activities with 8.38M person-days.88
Table 15.1 provides information on expenditures made by scuba divers and snorkelers,with highest expenditures per day in the Keys and in the Northwest, at over $100/day.
Table 15.1 Expenditures for Scuba Diving and Snorkeling in Florida
Author Location Setting*Resident (R)/
Non Resident (NR) $/Day
Snorkeling
Leeworthy, et al. (2001) Southeast Florida A R 49.71
Southeast Florida N R 54.42
Hazen & Sawyer (2004) Martin County, FL A/N R 31.92
Scuba Diving
Leeworthy, et al. (2001) Southeast Florida A R 73.94
Southeast Florida N R 69.87
Bell, et al. (1998) Northwest Florida A R 52.42
Northwest Florida A NR 103.22**
102.74-104.01***
Northwest Florida A NR 80.4
79.21-83.47
Leeworthy & Bowker(1997)
Florida Keys/KeyWest
N R & NR 119.43
Hazen & Sawyer (2004) Martin County, FL A/N R 10.1
SOURCE: Adapted from Pendleton, L.H. & J. Rooke. (2006). Understanding the Potential Economic Impact of Scuba Diving and Snorkeling: California. Table 3, p. 14.
*A=Artificial Reef; N=Natural Reef **Expenditures were averaged across counties of Northwest Florida (Bay, Walton, Okaloosa, Rosa, and EscambiaCounties).***This is the range of expenditures for the counties of Northwest Florida.
The Leeworthy (2001) study in the Southeast Florida region focuses on scuba diving onartificial reefs only. These trips by Florida residents only were found to have resulted in$49.71 in expenditures per day per person. Leeworthy (2001) also studied scuba diving
87 Leeworthy, V.R. (2008). “Economics of Coral Reef Ecosystems.” Unpublished presentation. Coping with
Climate Change – 2008 Reef Resilience Conference. Key Largo, Florida. April 22, 2008. By e-mailcommunication on 05/07/2008, Dr. Leeworthy noted that this presentation summarized the reef valuationresults from the following studies: Johns, G.M., V.R. Leeworthy, F.W. Bell, and M.A. Bonn. (2001;revised in 2003). Socioeconomic Study of Reefs in Southeast Florida. Hazen and Sawyer Final Report.Retrieved 05/15/2008 from http://marineeconomics.noaa.gov/Reefs/PDF's/Document.pdf ; and Johns, G.M.,and J.W. Milon. (2004). Socioeconomic Study of Reefs in Martin County, Florida. Hazen and Sawyer FinalReport. Retrieved 05/15/2008 from http://marineeconomics.noaa.gov/Reefs/MartinCounty2004.pdf .
88 For additional data on economic values associated with reef use, including estimated person-days andmarket value, see the section on Recreational Boating
180

8/9/2019 Florida's Ocean and Coastal Economies Report Phase 2
http://slidepdf.com/reader/full/floridas-ocean-and-coastal-economies-report-phase-2 195/219
by Florida residents on natural reefs in the South Florida region. These trips were foundto generate $54.42 per day per person in expenditures. The studies conducted byLeeworthy illustrate that residents snorkeling in South Florida are more prone to maketrips to naturally occurring reefs than to artificial reefs.
Leeworthy also studied scuba diving activities in the South Florida region within thesame parameters utilized in the snorkeling studies. Regarding scuba diving tripsundertaken by residents to artificial reefs only, $73.94 was spent per day per person in theregion whereas trips to only naturally occurring reefs generated expenditures of $69.87per day per person.
The study conducted in 2004 by Hazen & Sawyer in Martin County, Florida focused onthe snorkeling and/or scuba diving activities which occurred only by Florida residents.These resident trips to both artificial and naturally occurring reefs were found to haveearned $31.92 per day. Martin County (north of Palm Beach County) is the leastpopulated of the three southern counties (Palm Beach, Broward, and Miami-Dade) that
comprise the South Florida region as discussed in the Leeworthy studies.
The Bell (1998) study discussed the scuba diving activities of both residents and non-residents in the Northwest Florida region only. Residential scuba diving on artificial reefswas found to generate expenditures of $52.42 per person day, whereas non-residentialtrips to artificial reefs were found to generate $103.22 per person day. These estimates,however, were averaged across the counties of Northwest Florida (Bay, Walton,Okaloosa, Rosa and Escambia Counties). When these same trips were taken as a range of expenditures across the same counties, the trips produced anywhere from $102.74 -$104.01 per person day. When the study conducted was not averaged across counties,Northwest Florida divers were estimated to have spent $80.40 per day when non-residents scuba-dove on artificial reefs.
15.3 Data Gaps
A recent study on recreational scuba diving and snorkeling in Calif ornia reported thatcost and earnings analysis related to these activities are lacking.89 The same generalstatement may be made with respect to statewide data for Florida; however, as this reporthas shown, there is some analysis of recreational scuba diving and snorkeling in selectedareas around the state. The coral reef tract off Southeast Florida has been a special area of focus because the reef system is a popular destination for divers and snorkelers who bothreside in and visit the area.
Recommendations: Surveys of reef user groups should be conducted statewide toevaluate expenditures and activity days. Further studies should canvas dive shops anddive operators, including charters, for more in-depth information on the value of recreational diving and surfing to the State of Florida.
89 See p. 6 in Pendleton and Rooke (2006).
181
8/9/2019 Florida's Ocean and Coastal Economies Report Phase 2
http://slidepdf.com/reader/full/floridas-ocean-and-coastal-economies-report-phase-2 196/219
Chapter 16 Beach Activities in Florida
16.1 Introduction
Florida may be considered an ocean state, as it is a peninsula dependent upon 825 milesof sandy beaches for the enjoyment of Florida residents and visitors alike. The publicvalues its beaches as important recreation areas for family outings and leisure activity.Beaches also provide natural resources for plant and animal habitat and storm protectionfor public infrastructure and private investments.
Florida leads other states in the nation in beach use. In FY 1999-2000, the top five states,for the number of participants in beach activities were Florida, California, SouthCarolina, New Jersey, and Texas. In terms of days of beach visitation, the top five stateswere Florida, California, Hawaii, New Jersey, and Texas.90
16.2 Beach Regions
The beaches of the state can be conveniently grouped into five regions: the NortheastRegion, the Southeast Region, Southwest Region, Northwest Region, and the Big BendRegion (see figure 11.1).
The Northeast Region ranges southwards from Nassau County through Duval, St. Johns,Flagler and Volusia counties. Florida’s northern beaches receive most of their visitsduring the summer season and most of their out-of-state visitors come from elsewhere inthe American South. Selected studies of Florida beaches will be reviewed that providedata consistent with these statements. In a study of beach use at Jacksonville Beach, 40%
of beach visits were made by out-of-state visitors, and the largest numbers of out-of-statevisits were made by residents of Georgia, North Carolina, and Alabama. 91
The Southeast Beach region ranges southward from Brevard County through IndianRiver, St. Lucie, Martin, Palm Beach, Broward, Miami-Dade and Monroe counties.These beaches are used year-round; many of their winter visitors are residents of thenortheastern states of the United States and most summer visitors are from Florida. Morethan 50% of beach visits occurred in the winter in the FY 1995-96 study of BrowardCounty, and more than 40% occurred in the winter during the FY 1997-98 study of Palm
90 Leeworthy, V.R. and P.C. Wiley. (2001). National Survey on Marine Recreation and the Environment
2000: Current Participation Patterns in Marine Recreation. A Report to the U.S. Department of CongressNational Oceanographic Atmospheric Administration. Silver Spring, Maryland. Retrieved 05/16/2008 fromhttp://marineeconomics.noaa.gov/NSRE/NSRE_2.pdf .
91 Stronge, W.B., et al., The Economic Impact of Summer Beach Tourism: a Case Study of Jacksonville
Beach, pp. 10-13. Published by the Center for Urban and Environmental Solutions, Florida AtlanticUniversity, Ft. Lauderdale, Florida, June 2006.
182

8/9/2019 Florida's Ocean and Coastal Economies Report Phase 2
http://slidepdf.com/reader/full/floridas-ocean-and-coastal-economies-report-phase-2 197/219
Beach Island.92 There is substantial use by international visitors of the beaches of Miami-Dade County on a year-round basis. Monroe County in the southern region, is home tothe Florida Keys archipelago, an area with abundant resources for boating, diving andfishing, but with limited beach resources.
The Southwest region ranges northwards from Collier County, through Lee, Charlotte,Sarasota, Manatee, Hillsborough and Pinellas counties. These beaches, like the othersouthern beaches in the State, also receive year-round use. The 1995-96 study of therestored beaches on Anna Maria Island, reported below, showed that winter beach visitswere 70% of the year round total.93 Additionally, out-of-state visitors made more than56% of winter visits. Many of the winter visitors are from the Midwest states of the U. S.,and most summer visitors are from Florida. More than 50% of the out-of-state visits tothe restored beaches on Anna Maria Island were by residents of the Midwest states. Morethan 77% of summer beach visits were made by residents of Florida. HillsboroughCounty in Tampa Bay has very limited beach resources, but is home to the major port of Tampa. Beach resources in Charlotte County are limited by the existence of Charlotte
Harbor.
There are substantial beach resources beginning in Franklin County in the east andranging westward through Gulf, Bay, Walton, Okaloosa, Santa Rosa and Escambiacounties. Wakulla County in the far east of the region has little in the way of beachresources. In the study of Panama City Beach reported below, Georgia, Alabama andTennessee accounted for about 60% of visits to the beaches of Panama City Beach in thesummer of 2004.94 In the study of Pensacola Beach, also reported below, Louisianaaccounted for more than 50% of the visits, and residents of Alabama and Georgiaaccounted for an additional 21% of the visits.
95
The counties northwest of the Tampa-St. Petersburg area, referred to as the Big Bendregion elsewhere in this report, do not attract as many tourists as the other regions. Due tothe prevalence of vegetative cover and lack of sandy beaches, most of the Big Bend
92 Stronge, W.B., and R.R. Schultz, Broward County Beaches: An Economic Study , pp. 45-47, and Stronge,W.B., Palm Beach Island, Recreational Beach Use 1997-98, p. 8. Both studies published by RegionalResearch Associates, Boca Raton, Florida. Available from the author. A third Regional ResearchAssociates study by Stronge and Schultz undertaken in 1995-96 showed that 61.9% of the out-of-stateresidents on the beaches in Delray Beach were from the Northeast states. Stronge, W.B. (2004). Tourism in
Paradise: The Economic Impact of Florida Beaches. Center for Environmental and Urban Solutions,Florida Atlantic University. Ft. Lauderdale, Florida. August 2004.
93 Stronge, W.B., and R.R. Schultz, The Anna Maria Island Beach Restoration: An Economic Study 1995-
96 , pp. 62-64.
94 Stronge, W.B., et al., The Economic Impact of Summer Beach Tourism: a Case Study of Panama City
Beach, pp. 10-13. Published by the Center for Urban and Environmental Solutions, Florida AtlanticUniversity, Ft. Lauderdale, Florida, September 2004.
95 Stronge, W.B., et al., The Economic Impact of Summer Beach Tourism: a Case Study of Pensacola
Beach, pp. 10-13. Published by the Center for Urban and Environmental Solutions, Florida AtlanticUniversity, Ft. Lauderdale, Florida, November 2007.
183

8/9/2019 Florida's Ocean and Coastal Economies Report Phase 2
http://slidepdf.com/reader/full/floridas-ocean-and-coastal-economies-report-phase-2 198/219
region is not considered a destination for those seeking beach-related activities. Althoughthere is public water access for boating and fishing, the number of person days isinsignificant.
16.3 Beach Attendance
Three groups of people enjoy the use of the Florida’s sandy beaches: out-of-state tourists,in-state tourists traveling more than 50 miles from home, and local residents. Surveys of out-of-state tourists and in-state tourists provide a basis for estimating annual beachactivity days (person days) spent by these two groups of users. The detailed methodologyis provided in Appendix L1. Note these are not actual counts of beach attendance, butestimates made using available data.
In order to present a complete overview of beach use in the state, information was drawnon the extent of local beach use from studies of individual beaches in the state’s beachregions. The resulting estimates are approximate because there is considerable variationin the extent of local use among the individual counties within each region, oftenreflecting the different sizes of the local populations. The studies of the individualbeaches were also undertaken over a considerable period of time; although, the pattern of beach use by geographic origin may not change dramatically because factors such asdistance to the beach and the size of populations at origins and destinations do not changesubstantially in the medium term. Studies of attendance along the state’s northernbeaches have been confined to the winter season when the large majority of beach visitsoccur. Nevertheless, the lack of information on winter beach use represents a limitationof the methodology – it is assumed that the geographic pattern of use is the same in thewinter as in the summer seasons.
The number of person days devoted to beach going at Florida’s beaches totaled 103.6M
person days in 2003, before falling to 99.8M person days in 2004. These data areestimates derived using the methodology in Appendix L1. Person days rose to 119.7M in2005, and they remained relatively flat at 120.2M in 2006, before falling back to 106.7Min 2007.
90
95
100
105
110
115
120
125
2003 2004 2005 2006 2007
M i l l i o n B e a c h P e r s o n D a y s
SOURCE: Communication with Jeffrey Eslinger, D.K. Schifflet Inc. Emailed in May 2008.
Figure 16.1 Estimated Annual Activity Days 2003 - 2007
184

8/9/2019 Florida's Ocean and Coastal Economies Report Phase 2
http://slidepdf.com/reader/full/floridas-ocean-and-coastal-economies-report-phase-2 199/219
The Southeast region led other regions in beach use, at 40.2M person days in 2007, witha high of 52.1M person days in 2006. The decline in person days in 2004 occurredprimarily along the state’s Gulf Coast and may have reflected unusual storm activity,particularly the category 4 hurricanes Charley and Ivan. The sharp dip in 2007 activity
days occurred in the Southeast region at a time of a state economic recession and sharplyhigher gasoline prices.
0
20
40
60
80
100
120
140
M i l l i o n P e r s o n D a y s
Northwest 14.1 12.1 12.9 10.2 14.9
Northeast 22.0 23.8 27.9 24.9 22.5
Southwest 24.4 21.3 26.9 27.5 29.1
Southeast 43.0 42.5 52.1 57.6 40.2
2003 2004 2005 2006 2007
SOURCE: Communication with Jeffrey Eslinger, D.K. Schifflet Inc. Emailed in May 2008. Figure 16.2 Estimated Beach Activity Days by Region 2003 - 2007
0
20
40
60
80
100
120
140
M i l l i o n P e r s o n D a y s
Florida Residents 15.1 14.6 26.4 21.7 24.0
Out of State Residents 42.1 39.6 38.2 42.0 36.1
Locals 46.3 45.6 55.1 56.5 46.6
2003 2004 2005 2006 2007
SOURCE: Communication with Jeffrey Eslinger, D.K. Schifflet Inc. Emailed in May 2008.
Figure 16.3 Estimated Beach Activity Days by Geographic Origin 2003 - 2007
The 2004 decline in beach person days was primarily a result of a decline in beachactivity by out-of-state tourists, although there were small declines in beach activity byin-state tourists and locals as well (see figures 16.2 and 16.3). The 2007 decline occurredas a result of a large decline in beach visits by local residents, which is consistent with the
185

8/9/2019 Florida's Ocean and Coastal Economies Report Phase 2
http://slidepdf.com/reader/full/floridas-ocean-and-coastal-economies-report-phase-2 200/219
economic recession and movement of families out-of-state. In 2007, Broward County hada decline in its population and the population of Palm Beach County was stagnant. Bothcounties experienced declines in public school enrollment, suggesting a loss of population with families. This loss in population may explain the decline in beachactivity days by local residents.
There was a smaller decline in visits by out-of-state residents and visits by Floridatourists actually increased. The latter may have reflected a substitution of Florida for out-of-state destinations by Florida tourists during the state economic recession.
16.4 State Beach Parks
Attendance at Florida state beach parks varies by region, but demonstrates strong use of beaches at the State Parks by over 11M visits (see figures below).
0
1,000,000
2,000,000
3,000,000
4,000,000
5,000,000
6,000,000
7,000,000
A t t e n d a n c e
NORTHEAST REGION 1,285,965 1,553,162 1,439,728 1,367,748 1,477,715
NORTHWEST REGION 1,555,854 1,602,780 1,465,977 1,467,414 1,765,828
SOUTHEAST REGION 5,773,885 5,928,014 4,864,655 4,946,612 5,377,670
SOUTHWEST REGION3,097,138 3,147,256 3,165,395 3,674,308 3,638,908
BIG BEND 350,469 245,605 266,953 319,905 340,343
2002-2003 2003-2004 2004-2005 2005-2006 2006-2007
SOURCE: Communication with Matthew M. Mitchell, Florida Department of Environmental Protection, State Parks. Emailed onFebruary 14, 2008 Figure 16.4 Florida State Parks Attendance by Beach Region FY 2002-03 to FY 2006-07
• The beach parks in the Southeast region attract the most visits, at over 5.4M visitsin FY 2006-2007. That region is trailed by attendance of the beach parks in theSouthwest region at 3.6M.
Additional figures accompanying this section, and found in Appendix L2, reveal thefollowing:
• St. Johns and Duval Counties have the highest attendance at beach State Parks inthe Northeast region at nearly 500,000 in FY 2006/2007.
• Bay County has the highest attendance at beach State Parks in the Northwestregion at over 900,000 in FY 2006/2007. Other counties in the region grouptogether at about 100,000-200,000 attendees.
186

8/9/2019 Florida's Ocean and Coastal Economies Report Phase 2
http://slidepdf.com/reader/full/floridas-ocean-and-coastal-economies-report-phase-2 201/219
• Monroe County has the highest attendance at beach State Parks in the Southeastregion at over 1.6M in FY 2006/2007. Declines in 2004 and 2005 were due toactive hurricane seasons. The Florida Keys have some very popular parks withwide appeal, including John Pennekamp, and attract visitors from national and
international areas, not just state visitors.
• Lee and Pinellas counties have the highest attendance at beach State Parks in theSouthwest region at over 1.2M visits in FY 2006/2007.
• Pasco County is the only county with attendance at beach State Parks in the BigBend region with 169,000 visits in FY 2006/2007.
16.5 Selected Studies of Florida Beaches
As noted above, information was drawn on beach attendance from a number of studies of
individual Florida beaches. These included a study of summer beach use in JacksonvilleBeach in 2005, a study of year-round beach use on Palm Beach Island in FY 1978-98, astudy of year-round use in Broward County in FY 1995-96, a study of year-round beachuse on Anna Maria Island in FY 1995-96, a study of summer beach use in Panama Citybeach in 2004, and a study of summer beach use in Pensacola Beach in 2007.96
16.5.1 Jacksonville Beach
During the summer season of 2005 (May through October), there were an estimated290,490 visits made to the beaches in Jacksonville Beach. The vast majority of visits tothe Jacksonville Beach area were made by non-residents of the city (79%). There weremore visits made by other Duval County residents than by Jacksonville Beach residentsand there were more out-of-state visits than visits from other Duval County residents.More than 60% of the beach use was by Floridians and almost 40% of the visitors werefrom out-of-state. Georgia, North Carolina, and Alabama are the largest source of out-of-state visitors to the beaches in the Jacksonville Beach area, accounting for about22% of all the beach visits.
In the summer of 2005, non-resident visitors made 232,074M visits to JacksonvilleBeach. These visitors spent $11M locally, with the largest share going to lodging ($2.8Mor 25.4%) and dining out ($2.7M or 24.8%). In the summer of 2005, out-of-countyvisitors made 144,592 visits to Jacksonville Beach. These visitors spent $9.5M in the
96 Stronge, W.B., et al. The Economic Impact of Beaches: a Case Study of Jacksonville Beach, Fort Lauderdale,Florida: Center for Urban and Environmental Solutions, 2006; Stronge, W.B., Palm Beach Island: Recreational Beach
Use 1997-98, Boca Raton, Florida: Regional Research Associates, 2006, (available from the author); Stronge, W.B.,and R.R. Schultz, Broward County Beaches: An Economic Study, 1995-96 , Boca Raton, Florida: Regional ResearchAssociates, 1997, (available from the author); Stronge, W.B., and R.R. Schultz, The Anna Maria Island Beach
Restoration: An Economic Study, 1995-96 , Boca Raton, Florida: Regional Research Associates, 1997, (available fromthe author).
187

8/9/2019 Florida's Ocean and Coastal Economies Report Phase 2
http://slidepdf.com/reader/full/floridas-ocean-and-coastal-economies-report-phase-2 202/219
county, with lodging as the largest item ($2.6M or 27.6%), followed by food andshopping.
Jacksonville Beach is also an attraction to out-of-state visitors. Such beach users makeexpenditures on not only Jacksonville Beach or elsewhere in Duval County, but also
elsewhere in the state. A total of 111,006M visits were made to the beaches in theJacksonville Beach area by those living outside Florida during the summer of 2005.These out-of-state visitors to the beaches of Jacksonville Beach spent $8.6M during theirstay in Florida. More than 75% was spent in the beach area, and 86.1% was spent withinDuval County. Direct spending by these out-of-state beach visitors was $8.6M.
16.5.2 Palm Beach Island
During 1997-98, there were an estimated 783,386 visits made to the beaches on PalmBeach Island. The vast majority of these visits were made by non-residents of the island(93.7%). More than 60% of visits were made by residents from elsewhere in Palm BeachCounty (60.1%), 6.4% of visits were made by Florida in-state tourists, and 27% were
made by out-of-state tourists.97
16.5.3 Broward County
A total of 7,169,446 visits were made to the 25 miles of beaches in Broward Countyduring 1995-96. More than 50% of the visits were made in the (November-April) winterseason (56.6%). A slight majority of winter visits were made by out-of-state visitors(50.1%), and a majority of summer visitors were from the local county (56.2%). Beachtourists spent $87M in Broward County during 1995-96, with $19.9M in the summer and$67.1M in the winter.
16.5.4 Anna Maria Island
During the summer of 1995 and the winter of 1996, the beaches of Anna Maria Island inManatee County in Southwest Florida were visited a total of 2,264,331 times. Thebeaches in the south of the island were restored by the Army Corps of Engineers in 1993,and these beaches were visited 1,032,939 times. More than 70% of these visits weremade in the winter season (70.4%). More than half the visits to the restored beaches weremade by out-of-state tourists (52.9%) and about one-in-three visits were made byresidents of the local county (32.8%).
16.5.5 Panama City Beach
During the summer season of 2004, an estimated 2M visits were made to Panama City
Beach and the adjacent areas east and west of the nearby inlets. The vast majority of summer visits to the Panama City Beach area were made by non-residents of the city andadjacent beach areas (94%). There were more than ten times as many visits made by out-of-state visitors (1,428,017) as were made by residents of the city and beach area(121,840). The dominance of out-of-state visitors is characteristic of Florida’s Panhandlesummer beach use and contrasts with the beaches in the southern part of the state where
97 0.2% of visits were made by persons of unknown geographic origin
188

8/9/2019 Florida's Ocean and Coastal Economies Report Phase 2
http://slidepdf.com/reader/full/floridas-ocean-and-coastal-economies-report-phase-2 203/219
in-state visitors tend to predominate in the summer. Georgia, Alabama and Tennesseealone account for about 60% of all visits to the beaches in the Panama City Beach area.
In the summer of 2004, non-residents made 1.942M visits to the Panama City Beach area.These visitors spent $265.6M locally, with the largest amounts spent on lodging
($110.9M or 41.8%) and dining out ($63.6M or 24%). In the summer of 2004, out-of-county visitors made 1.857M visits to the beaches in the Panama City Beach area. Thesevisitors spent $241.4M locally, primarily in the beach area.
Panama City Beach is also an attraction to out-of-state visitors. Such beach users makeexpenditures not only at Panama City Beach and elsewhere in Bay County but alsoelsewhere in the state. A total of 1.4M visits were made to the Panama City Beach areaby non-residents of the state during the summer of 2004. These out-of-state visitors spentover $168M during their stay in Florida, 97% of which was spent in Bay County.
16.5.6 Pensacola Beach
During the summer season of 2007, an estimated 718,496 visits made to PensacolaBeach. The vast majority of visits were made by non-residents of the city and itsenvironments on the beachfront (86%). About 25% of the beach use was by Floridiansand 75% of the visitors were from out-of-state. Louisiana was the largest source of out-of-state visitors in Pensacola Beach. This is typical of the western Panhandle in the state;Georgia is the largest source of visitors to the beaches in the eastern Panhandle. Alabamais an important source across the entire Northwest Florida region.
In the summer of 2007, non-resident visitors made 232,074M visits to Pensacola Beach.These visitors spent $11M locally, with the largest share going to lodging ($2.8M or25.4%) and dining out ($2.7M or 24.8%).
Out-of-county visitors made 144,592 visits and they spent $9.5M in Escambia and SantaRosa counties. Lodging was the largest expenditure item ($2.6M or 27.6%), followed byfood and shopping. The beaches of Pensacola Beach are also an attraction to out-of-statevisitors. Such beach users make expenditures not only on Pensacola Beach or elsewherein Escambia-Santa Rosa Counties but also elsewhere in the state. A total of 111,006 visitswere made to the beaches in the Pensacola Beach area by those living outside Floridaduring the summer of 2007. These out-of-state visitors spent $8.6M during their stay inFlorida. More than 75% was spent in the beach area and 86.1% was spent withinEscambia-Santa Rosa Counties.
16.6 Surfing in Florida
While surfing is a popular activity in all four Southeast Florida counties (Martin, PalmBeach, Broward, and Miami-Dade), it is largely seasonal and therefore limited. Existingdata about surfing in Florida are limited to specific areas, such as Cocoa Beach and theKeys or northwest Florida; demographics of Florida surfers; and extrapolated counts of surfers at a specific beach during a specific season. Unfortunately, no specific data existregarding surfing and its connections to tourism and the economy in Florida.
189

8/9/2019 Florida's Ocean and Coastal Economies Report Phase 2
http://slidepdf.com/reader/full/floridas-ocean-and-coastal-economies-report-phase-2 204/219
A survey of Cocoa Beach visitors in the winter of 2007 examined the purpose of theiractivity, including Swimming/Sunning, Walking/Shelling, Surfing, Fishing, and otherrecreational activities.
72%
6%
13%
5% 4%
Swimming/Sunning Walking/Shel ling Surfing Fishing Other
SOURCE: Stronge, William B. The Economic Impact of Winter Beach Tourism: A Case Study of Cocoa Beach. 2007.
Figure 16.5 Characteristics of Beach Visits to Cocoa Beach, Winter 2007
The majority (72%) of Cocoa Beach visitors were visiting to swim and sun, while only13% were visiting to surf.
0
100,000
200,000
300,000
400,000
500,000
600,000
700,000
N u m b e r o f B e a c h V i s i t s
Activity 622,731 51,395 112,211 39,402 30,837
Swimming/
SunningWalking/Shelling Surfing Fishing Other
SOURCE: Stronge, William B. The Economic Impact of Winter Beach Tourism: A Case Study of Cocoa Beach. 2007 Figure 16.6 Beach Visits by Purpose of Activity in Cocoa Beach, Winter 2007
In a recent survey (2007) of the surfing community by the Surfrider Foundation’ssouthern Florida chapters, members’ use of and views on southeast Florida coral reefswas surveyed over the internet. This group of stakeholders has not been previouslycharacterized in the region in terms of their use patterns, views on resource conditions, orattitudes toward management. However, previous research (Shivlani, 2006) did assesscoral reef awareness and characterized surfing activities across Southeast Florida, where3% of beach visitors and 7.5% of residents reported participating in surfing in the region.
190
8/9/2019 Florida's Ocean and Coastal Economies Report Phase 2
http://slidepdf.com/reader/full/floridas-ocean-and-coastal-economies-report-phase-2 205/219
Of the 151 respondents (from a total of 900 surfers surveyed), over two-thirds (66.2%)identified themselves as southeast Florida residents. Surfrider respondents hadconsiderable experience surfing in southeast Florida. On average, the surfers reported 11-15 years of experience. Altogether, 55% of the respondents had 11 years or more
experience surfing in southeast Florida and only 9% had been surfing for less than oneyear (SEFCRI, 2007).
Sebastian Inlet in Brevard County was preferred by 58% of the sample as a surf site thatthey visit, although only a small percentage of the respondents actually reside in that area.Sebastian Inlet offers the right surfing conditions that attract regional use. Surfers alsopreferred Jupiter Inlet (31.7%) in Palm Beach County, Delray Beach (22.8%) in PalmBeach County, Miami Beach (21.4%) in Miami-Dade County, and Lake WorthInlet/Pumphouse or Reef Road (20.7%) in Palm Beach County. All other sites attractedless than 20% of the surfers. However, 37% of the sample also listed “other sites;” 10%of these sites were located in Southeast Florida (SEFCRI, 2007). For further information
on surfing, see Appendix L3.
16.7 Data Gaps
Data on beach visitation is not as comprehensive as desirable. Economic studies arelimited to ad hoc case studies. A statewide protocol for collecting and analyzing beachvisitation is critical to managing this important resource.
No data exist regarding surfing and its connections to tourism and the economy inFlorida. Existing data about surfing in Florida are limited to specific areas, such as CocoaBeach and the Keys or NW Florida, demographics of Florida surfers, and extrapolatedcounts of surfers at a specific beach during a specific season.
Recommendation: FDEP should work with Visit Florida to ensure that the Visit Floridasurveys collect better data on local beach use, including questions on economic activity.FDEP should request that any future surfing studies should be more comprehensive,examining seasonality, possible fluctuation of beach visitors during surf festivals/competitions/events, location and success of coastal surf shops.
191

8/9/2019 Florida's Ocean and Coastal Economies Report Phase 2
http://slidepdf.com/reader/full/floridas-ocean-and-coastal-economies-report-phase-2 206/219
192
Chapter 17 Conclusion
This report has summarized the abundance of recreational activities available alongFlorida’s coasts and in its oceans. Based on the data, millions of visitors and residentsalike avail themselves of the many opportunities for recreation at the state’s beaches,
parks, and coastal waters. While it is difficult to define which activity is most important,all have appeal to varying groups. The Southeast and Southwest regions have consistentlyhigher beach going, boating, and fishing than other regions of the state. Trends are fairlystable over time, with the exception of severe hurricane periods, such as in 2004 and2005, when the trends turned downward. The data reinforced the need to preserveFlorida’s coastal resources for its multitude of recreation uses and the value it provides tothe state’s economy. In order to better manage recreation and coordinate planning for thefuture, it may well benefit the state to establish more comprehensive approaches tocollecting recreational use data.

8/9/2019 Florida's Ocean and Coastal Economies Report Phase 2
http://slidepdf.com/reader/full/floridas-ocean-and-coastal-economies-report-phase-2 207/219
Part V References
Chapter 1: Context for the Study
Murray, Thomas & Associates, Inc. 2005. Florida’s Recreational Marine Industry – Economic Impact and Growth: 1980-2005. p. iii. Cited in Marine IndustriesAssociation of Florida. Boating is Big Business in Florida. Retrieved 11/15/2007http://www.boatflorida.org/custom_pages/site_page_2708/index.html.
Urban Harbors Institute, et al. (forthcoming in 2008). Boating Access Facilities Inventory
and Economic Study. University of Massachusetts-Boston, Mass. Prepared forFlorida Fish and Wildlife Conservation Commission.
Chapter 2: Glossary of Terms and Definitions
Landefeld, J.S. and Robert Parker, BEA's Chain Indexes, Time Series, and Measures of Long Term Economic Growth. Survey of Current Business, May1997. It can bedownloaded from the BEA website athttp://www.bea.gov/bea/regional/gsp/help/OnlineHelp.htm
Chapter 5: Fishing and Seafood Industry
Fisheries Statistics and Economics Division of the National Marine Fisheries Service,Office of Science and Technology, NOAA.http://www.st.nmfs.noaa.gov/st1/trade/annual_data/TradeDataAnnualDistrictAllP
roducts.html.
Florida Agricultural Statistical Service.http://www.nass.usda.gov/Statistics_by_State/Florida/Publications/Aquaculture/index.asp
Florida Department of Highway Safety and Motor Vehicles.http://www.flhsmv.gov/html/revrpts.html.
Florida Fish and Wildlife Conservation Commission. Commercial Fisheries Landings in
Florida. http://floridamarine.org/features/view_article.asp?id=19224
National Marine Fisheries Service. Marine Recreational Fisheries Statistics Surveys.http://www.st.nmfs.noaa.gov/st1/recreational/index.html.
Office of Licensing and Permitting, Florida Fish and Wildlife Conservation Commission,2008.
193

8/9/2019 Florida's Ocean and Coastal Economies Report Phase 2
http://slidepdf.com/reader/full/floridas-ocean-and-coastal-economies-report-phase-2 208/219
Office of Science and Technology, Fisheries Statistics Division, of the National MarineFisheries Service. Fisheries of the United States.
Southwick Associates. 2007. Sportfishing In America: An Economic Engine and
Conservation Powerhouse.
Chapter 6: Marine Transportation including Ports
American Association of Port Authorities. 2008. Seaport data and independent analysis.Referenced from Florida Seaport Transportation and Economic Development(FSTED).
Florida Ports Council website. http://www.flaports.org
Martin Associates, 2007: The Local and Regional Economic Impacts of the U.S.
Deepwater Port System. A report to the American Association of Port Authorities.Martin Associates, Lancaster, PA, 12 pp.
Chapter 7: Coastal Construction-Beach Nourishment
Catanese Center for Urban and Environmental Solutions. June 2003. Economics of
Florida’s Beaches: The Impact of Beach Restoration. Florida Atlantic University.
Florida Department of Environmental Protection. 2008. Beach Erosion Control Program.
Florida Department of Environmental Protection. 2008. The Coastal ConstructionControl Line Permitting Program.
Schmidt & Woodruff. 1999. Shore & Beach.
Western Carolina University PSDS beach nourishment database.http://www.wcu.edu/1038.asp
Chapter 8: Coastal Tourism and Recreation-The Cruise Industry
Business Research and Economic Advisors. Oct. 2001. “The Contribution of the NorthAmerican Cruise Industry to the U.S. Economy in 2000.” Cruise LinesInternational Association.
Business Research and Economic Advisors. Aug. 2002. “The Contribution of the NorthAmerican Cruise Industry to the U.S. Economy in 2001.” Cruise LinesInternational Association.
194

8/9/2019 Florida's Ocean and Coastal Economies Report Phase 2
http://slidepdf.com/reader/full/floridas-ocean-and-coastal-economies-report-phase-2 209/219
Business Research and Economic Advisors. Aug. 2003. “The Contribution of the NorthAmerican Cruise Industry to the U.S. Economy in 2002.” Cruise LinesInternational Association.
Business Research and Economic Advisors. Aug. 2004. The Contribution of the North
American Cruise Industry to the U.S. Economy in 2003. Cruise LinesInternational Association.
Business Research and Economic Advisors. Aug 2005. “The Contribution of the NorthAmerican Cruise Industry to the U.S. Economy in 2004.” Cruise LinesInternational Association.
Business Research and Economic Advisors. Aug 2006. “The Contribution of the NorthAmerican Cruise Industry to the U.S. Economy in 2005.” Cruise LinesInternational Association.
Business Research and Economic Advisors. Aug. 2007. “The Contribution of the NorthAmerican Cruise Industry to the U.S. Economy in 2006.” Cruise LinesInternational Association.
Business Research and Economic Advisors. Aug. 2003. “The Cruise Industry in Florida.”Cruise Lines International Association.
Business Research and Economic Advisors. Aug. 2004. “The Cruise Industry in Florida.”Cruise Lines International Association.
Business Research and Economic Advisors. Aug. 2005. The Cruise Industry in Florida.Cruise Lines International Association.
Business Research and Economic Advisors. Aug. 2006. “The Cruise Industry in Florida.”Cruise Lines International Association.
Business Research and Economic Advisors. Sept. 2002. “The North American CruiseIndustry’s Contribution to the Florida Economy in 2001.” Cruise LinesInternational Association.
Business Research and Economic Advisors. 2007. “U.S. Economic Impact Analysis.”Cruise Lines International Association.
Cruise Line Industry Association. 2007. “The Cruise Industry: A $35.7 Billion Partner inU.S. Economic Growth.” 2006 Economic Summary.
Florida Ports Council. 2008. http://www.flaports.org/
National Ocean Economics Program Website. http://noep.mbari.org/
195

8/9/2019 Florida's Ocean and Coastal Economies Report Phase 2
http://slidepdf.com/reader/full/floridas-ocean-and-coastal-economies-report-phase-2 210/219

8/9/2019 Florida's Ocean and Coastal Economies Report Phase 2
http://slidepdf.com/reader/full/floridas-ocean-and-coastal-economies-report-phase-2 211/219
Leeworthy, V.R. 2001. Preliminary Estimates from Versions 1-6: Coastal Recreationparticipation in National Survey on Recreation and the Environment 2000. U.S.Department of Commerce. National Oceanic and Atmospheric Administration.Silver Spring, Maryland. p.8. Retrieved 06/10/2008 from
http://www.srs.fs.fed.us/trends/Nsre/NSRE_V1-6_May.pdf
Leeworthy, V.R., J.M. Bowker, J.D. Hospital, and E.A. Stone. 2005. Projected
Participation in Marine Recreation: 2005 & 2010. U.S. Department of Commerce. National Oceanic and Atmospheric Administration. Silver Spring,Maryland. Available online athttp://www.marineeconomics.noaa.gov.NSRE/NSREForecast.pdf
Pendleton, L. H., and J. Rooke. 2006. Understanding the Potential Economic Impact of
SCUBA Diving and Snorkeling: California. p. 3 [citing Table 2, Leeworthy, V.R.,and P.C. Wiley. (2001). “Current Participation Patterns in Marine Recreation” in
National Survey on Recreation and the Environment 2000. U.D. Department of Commerce. National Oceanic and Atmospheric Administration. Silver Spring,Maryland]. Retrieved 05/15/2008 from http://linwoodp.bol.ucal.edu/dive.pdf .
Chapter 12: Park Visitation and Attendance
Allen, Linda. 2008 May. Communication, [NERR] Apalachicola River and Bay NationalEstuarine Research Reserve (emailed on May 13, 2008)
Evans, Patricia M. 2008 May. Telephone interview, Office of Park Planning, FloridaState Parks, Florida Department of Environmental Protection, Tallahassee,Florida. (February 20, 2008, May 29, 2008).
Florida Department of Environmental Protection. 2000. Outdoor Recreation in Florida –
2000, the Statewide Comprehensive Outdoor Recreation Plan. Available onlinefrom the Florida Department of Environmental Protection athttp://www.dep.state.fl.us/parks/planning/forms/OutdoorRecreationinFlorida2000.pdf .
Florida Department of Environmental Protection. 2006. Recreational Boating Access in
Florida State Parks. p. 1. Retrieved 05/09/2008 fromhttp://www.dep.state.fl.us/parks/planning/forms/boating%20report%2012-20-05.pdf .
Florida Statistical Abstracts. “State Parks and Areas: Attendance at Parks by Departmentof Environmental Protection Districts in the State and Specified Counties of Florida.” Tables 19.52 and 19.53, fiscal years 2001-2007.
197
8/9/2019 Florida's Ocean and Coastal Economies Report Phase 2
http://slidepdf.com/reader/full/floridas-ocean-and-coastal-economies-report-phase-2 212/219
Florida Statutes. 2007. Chapter 187. Available online athttp://www.flsenate.gov/Statutes/index.cfm?App_mode=Display_Statute&URL=Ch0187/ch0187.htm .
Florida Statutes. 2007. Section 186.507. Available online at
http://www.flsenate.gov/statutes/index.cfm?mode=View%20Statutes&SubMenu=1&App_mode=Display_Statute&Search_String=186.507&URL=CH0186/Sec507.HTM.
Florida Statutes. 2007. See Sections 418.12 (Duties and Functions of Division of Recreation and Parks) and 375.021 (Comprehensive Multipurpose OutdoorRecreation Plan). Available online athttp://www.flsenate.gov/Statutes/index.cfm?App_mode=Display_Statute&Search_String=&URL=Ch0418/SEC12.HTM&Title=->2007->Ch0418->Section%2012#0418.12 andhttp://www.flsenate.gov/Statutes/index.cfm?App_mode=Display_Statute&Search
_String=&URL=Ch0375/SEC021.HTM&Title=->2007->Ch0375->Section%20021#0375.021, respectively.
Hardner & Gullison. 2006. The U.S. National Park System: An Economic Asset at Risk , p.29. Retrieved 05/29/08 fromhttp://www.npca.org/park_assets/NPCA_Economic_Significance_Report.pdf.
Horadam, Amelia. 2008 May. Rookery Bay NERR. (Emailed on May 13, 2008).
Johns, G., et al. 2001, 2004.
Leeworthy, V.R. 2008 Apr. “Economics of Coral Reef Ecosystems.” Unpublishedpresentation. Coping with Climate Change – 2008 Reef Resilience Conference.Key Largo, Florida. April 22, 2008
McCartney, Anthony. “ ‘Dr. Beach’ says Caladesi Island is nation’s best beach” in The
Miami Herald . Retrieved 05/22/08 fromhttp://www.miamiherald.com/775/story/542901.html.
Reynolds, John. Personal communication, Florida State Parks.
[SCORP] Statewide Comprehensive Outdoor Recreation Plan. 2000. Outdoor Recreationin Florida 2000. [FDEP] Florida Department of Environmental Protection .
State Parks and Areas: Attendance at Parks by Department of Environmental ProtectionDistricts in the State and Specified Counties in Florida, Fiscal Years 2001-2006.Florida Statistical Abstract, Table 19.52.
198
8/9/2019 Florida's Ocean and Coastal Economies Report Phase 2
http://slidepdf.com/reader/full/floridas-ocean-and-coastal-economies-report-phase-2 213/219
U.S. Department of the Interior, National Park Service. “National Park Systems:Recreational Visits to National Park Service Areas in Florida.” Table 19.53 and19.54. 2001-2006.
Zimmerman, Janet. 2008 May. Personal communication. Guana-Tolomato-Matanzas
NERR. (Emailed on May 15, 2008).
Chapter 13: Recreational Reef Use
2006 Florida Visitor Study: The State’s Official Source for Travel Planning. 2006.VisitFlorida, Tallahassee, Florida.
Florida Department of Environmental Protection. 2006. Recreational Boating Access in
Florida State Parks. p. 1, 3, & 4. Retrieved 05/09/2008 fromhttp://www.dep.state.fl.us/parks/planning/forms/boating%20report%2012-20-05.pdf .
Florida Department of Highway Safety and Motor Vehicles. 2007. Florida Vessel
Owners: The Facts and Figures. 2007 Alphabetical Vessel Statistics by County.Retrieved 05/09/2008 fromhttp://www3.hsmv.state.fl.us/Intranet/dmv/TaxCollDocs/vesselstats2007.pdf.
Johns, Grace M., et al. 2001. “Socioeconomic Study of Reefs in Southeast Florida - FinalReport.” October 19, 2001 as revised April 18, 2003, Hazen & Sawyer.
Leeworthy, Vernon R. 2008. “Economics of Coral Reef Ecosytems.” Unpublishedpresentation. Coping with Climate Change – 2008 Reef Resilience Conference. Key Largo, Florida. April 22, 2008.
Leeworthy, Vernon R. and Peter C. Wiley. 2001. National Survey on Marine Recreation
and the Environment 2000: Current Participation Patterns in Marine Recreation.A Report to the U.S. Department of Congress National OceanographicAtmospheric Administration. Silver Spring, Maryland. Retrieved 05/09/2008from http://marineeconomics.noaa.gov/NSRE/NSRE_2.pdf . Cited in Sidman,Charles, Timothy Fik, and Bill Sargent. (2004). A Recreational Boating
Characterization for Tampa and Sarasota Bays. Florida Sea Grant CollegeProgram, University of Florida. p. 1. Retrieved 03/24/08 fromhttp://nsgl.gso.uri.edu/flsgp/flsgps04001/flsgps04001_full.pdf .
Shivlani, M. 2006. South Florida Coral Reef Initiative (SEFCRI) Coral Reef Needs
Assessment Study. Available from:http://www.dep.state.fl.us/COASTAL/programs/coral/reports/SEFCRI_Coral_Reef_Needs_Assessment_Study.pdf .
Sidman, C., et al. 2005 - 2007.
199

8/9/2019 Florida's Ocean and Coastal Economies Report Phase 2
http://slidepdf.com/reader/full/floridas-ocean-and-coastal-economies-report-phase-2 214/219
Strategic Research Group. 2003. 2002 National Recreational Boating Survey State Data
Report. p. 5 & 6. Retrieved 05/14/2008 fromhttp://uscgboating.org/statistics/USCG_NRBS%202002-StateReport.pdf .
Urban Harbors Institute, et al. (forthcoming in 2008). Boating Access Facilities Inventory
and Economic Study. University of Massachusetts-Boston, Mass. Prepared forFlorida Fish and Wildlife Conservation Commission.
VAI / Market Research Online. 2006. 2006 Florida Recreational Boating Survey: Final
Report . p. 5, 8, & 22. Retrieved 05/09/2008 fromhttp://myfwc.com/Boating/waterways/Documents/Final2006RecBoatingStudyRpt.pdf .
Chapter 14: Recreational Boating in Florida
Florida Department of Environmental Protection. 2006. Recreational Boating Access in
Florida State Parks. p. 1. Retrieved 05/09/2008 fromhttp://www.dep.state.fl.us/parks/planning/forms/boating%20report%2012-2005.pdf .
Florida Division of Highway Safety and Motor Vehicles. 2007. Florida Vessel Owners:
The Facts and Figures. 2007 Alphabetical Vessel Statistics by County. Retrieved05/09/2008 fromhttp://www3.hsmv.state.fl.us/Intranet/dmv/TaxCollDocs/vesselstats2007.pdf. In2005.
Florida Fish and Wildlife Conservation Commission Report (2004-2007). 2008 Jan.Provided via email, January 2008 by Erin Rainey.
Leeworthy, V.R. and P.C. Wiley. 2001. National Survey on Marine Recreation and the
Environment 2000: Current Participation Patterns in Marine Recreation. AReport to the U.S. Department of Congress National Oceanographic AtmosphericAdministration. Silver Spring, Maryland. pp. 24-25. Retrieved 05/09/2008 fromhttp://marineeconomics.noaa.gov/NSRE/NSRE_2.pdf .
Murray, Thomas & Associates, Inc. 2005. Florida Recreational Marine Industry –
Economic Impact and Growth: 1980-2005. p. iii. Cited in Marine IndustriesAssociation of Florida. Boating is Big Business in Florida. Retrieved 11/15/2007from http://www.boatflorida.org/custom_pages/site_page_2708/index.html.
Pleasure Boat Registration by Coastal and Inland Counties, 2001-2006. 2008. FloridaDepartment of Highway Safety and Motor Vehicles, Revenue Report. FiscalYears 1999-2000 and 2000-2006. http://www.hsmv.state.fl.us, accessed February2008.
200

8/9/2019 Florida's Ocean and Coastal Economies Report Phase 2
http://slidepdf.com/reader/full/floridas-ocean-and-coastal-economies-report-phase-2 215/219
Shivlani, M. and M. Villanueva. 2007. A Compilation and Comparison of Social
Perceptions on Reef Conditions and Use in Southeast Florida. Fishing, Divingand Other Uses Local Action Strategy Project 10 - Final Report to SoutheastFlorida Coral Reef Initiative. Rosenstiel School of Marine and AtmosphericScience, University of Miami, Miami, Florida. Retrieved 03/07/2008 from
http://www.dep.state.fl.us/coastal/programs/coral/reports/FDOU/FDOU_Project_10_Final_Nov07.pdf .
Sidman, C., T. Fik, and W. Sargent. 2004. A Recreational Boating Characterization for
Tampa and Sarasota Bays. University of Florida, Gainesville, Florida. Retrieved03/24/2008 from http://nsgl.gso.uri.edu/flsgp/flsgps04001/flsgps04001_full.pdf .
Sidman, C. et al. 2005. A Recreational Boating Characterization for the Greater
Charlotte Harbor. University of Florida, Gainesville, Florida. Retrieved03/24/2008 from http://nsgl.gso.uri.edu/flsgp/flsgps05004.pdf .
Sidman, C. et al. 2006; revised 2007. A Recreational Boating Characterization of Sarasota County. University of Florida, Gainesville, Florida. Retrieved03/23/2008 fromhttp://www.flseagrant.org/program_areas/waterfront/publications/TP152_A%20Recreational%20Boating%20Characterization%20of%20Sarasota_revised2007_web.pdf .
Sidman, C. et al. 2007. A Recreational Boating Characterization of Brevard County. University of Florida, Gainesville, Florida. Retrieved 03/23/2008 fromhttp://edis.ifas.ufl.edu/SG081.
Southeast Florida Coral Reef Initiative, MOTE Study. A Recreational BoatingCharacterization of Brevard County.
Southwick Associates. 2007; revised 2008. Sportfishing in America: An Economic
Engine and Conservation Powerhouse. Produced for the American SportfishingAssociation with funding from the Multistate Conservation Grant Program. pp. 7-8. Retrieved 05/07/2008 fromhttp://www.asafishing.org/asa/images/statistics/resources/SIA_2008.pdf .
Strategic Research Group. 2003. 2002 National Recreational Boating Survey Report .Retrieved 04/04/2008 fromhttp://uscgboating.org/statistics/USCG_NRBS%202002-Report.pdf .
VAI/Market Research Online. 2006. 2006 Florida Recreational Boating Survey: Final
Report. pp. 5, 19. Retrieved 05/09/2008 fromhttp://myfwc.com/Boating/waterways/Documents/Final2006RecBoatingStudyRpt.pdf .
201
8/9/2019 Florida's Ocean and Coastal Economies Report Phase 2
http://slidepdf.com/reader/full/floridas-ocean-and-coastal-economies-report-phase-2 216/219
Chapter 15: Recreational Fishing in Florida
Bell, F., M.A. Bonn, and V.R. Leeworthy. 1998. Economic Impact and Importance of
Artificial Reefs in Northwest Florida. Report for Office of Fisheries Managementand Assistance Service Florida Department of Environmental Protection.
Retrieved 05/15/2008 from http://marineeconomics.noaa.gov/Reefs/nwfl.pdf .
Eslinger, Jeffrey. Private Communication. D.K. Schifflet Inc. 2008 May.Florida Saltwater Fishing and Sportsman Licenses for Residents and Non-Residents in
Coastal and Inland Counties. 2004-2007. FWC Report provided thru email byErin Rainey, January 2008.
Leeworthy, V.R. 2008 Apr. “Economics of Coral Reef Ecosystems.” Unpublishedpresentation. Coping with Climate Change – 2008 Reef Resilience Conference.Key Largo, Florida. April 22, 2008
Leeworthy, V.R., J.M. Bowker, J.D. Hospital, and E.A. Stone. 2005. Projected Participation in Marine Recreation: 2005 & 2010. U.S. Department of Commerce. National Oceanic and Atmospheric Administration.
Leeworthy, V.R., and P.C. Wiley. 2001. “Current Participation Patterns in MarineRecreation” in National Survey on Recreation and the Environment 2000. U.S.Department of Commerce. National Oceanic and Atmospheric Administration.Silver Spring, Maryland]. Retrieved 05/15/2008 fromlinwoodp.bol.ucla.edu/dive.pdf .
Mitchell, Matthew M. Private Communication. Florida Department of EnvironmentalProtection, State Parks. Emailed on February 14, 2008.
Pendleton, L. H., and J. Rooke. 2006. Understanding the Potential Economic Impact of
SCUBA Diving and Snorkeling: California. p. 3 [citing Table 2, Leeworthy, V.R.,and P.C. Wiley. (2001). “Current Participation Patterns in Marine Recreation” in National Survey on Recreation and the Environment 2000. U.D. Department of Commerce. National Oceanic and Atmospheric Administration. Silver Spring,Maryland]. Retrieved 05/15/2008 from http://linwoodp.bol.ucal.edu/dive.pdf .
Shivlani, M. and M. Villanueva. 2007. A Compilation and Comparison of Social
Perceptions on Reef Conditions and Use in Southeast Florida. Fishing, Divingand Other Uses Local Action Strategy Project 10 – Final Report to SoutheastFlorida Coral Reef Initiative. Rosenstiel School of Marine and AtmosphericScience, University of Miami, Miami, Florida. Retrieved 03/07/2008 fromhttp://www.dep.state.fl.us/coastal/program/coral/reports/FDOU/FDOU_Project_10_FinalNov07.pdf .
202

8/9/2019 Florida's Ocean and Coastal Economies Report Phase 2
http://slidepdf.com/reader/full/floridas-ocean-and-coastal-economies-report-phase-2 217/219
Southwick Associates. 2007; revised 2008. Sportfishing in America: An Economic
Engine and Conservation Powerhouse. Produced for the American SportfishingAssociation with funding from the Multistate Conservation Grant Program. pp. 7-8. Retrieved 05/07/2008 fromhttp://www.asafishing.org/asa/images/statistics/resources/SIA_2008.pdf .
Strategic Research Group. 2003. 2002 National Recreational Boating Survey Report .Retrieved 04/04/2008 fromhttp://uscgboating.org/statistics/USCG_NRBS%202002-Report.pdf .
Stronge, William B. 2007. The Economic Impact of Winter Beach Tourism: A CaseStudy of Cocoa Beach.
U.S. Department of the Interior, Fish and Wildlife Service, and U.S. Department of Commerce, U.S. Census Bureau. 2006. 2006 National Survey of Fishing,
Hunting, and Wildlife-Associated Recreation. Retrieved 05/12/08 from
http:/www.census.gov/prod/2008pubs/fhw06-nat.pdf. See generally,http://www.census.gov/prod/www/abs/fihsing.html. The Florida state report isavailable from http://www.census.gov/prod/2008pubs/fhw06-fl.pdf .
VAI/Market Research Online. 2006. 2006 Florida Recreational Boating Survey: Final
Report. pp. 5, 19. Retrieved 05/09/2008 fromhttp://myfwc.com/Boating/waterways/Documents/Final2006RecBoatingStudyRpt.pdf .
Chapter 16: Scuba Diving and Snorkeling in Florida
Bell, F., M.A. Bonn, and V.R. Leeworthy. 1998. Economic Impact and Importance of
Artificial Reefs in Northwest Florida. Report for Office of Fisheries Managementand Assistance Service Florida Department of Environmental Protection.Retrieved 05/15/2008 from http://marineeconomics.noaa.gov/Reefs/nwfl.pdf .
Leeworthy, Vernon R. 2008. “Economics of Coral Reef Ecosytems.” Unpublishedpresentation. Coping with Climate Change – 2008 Reef Resilience Conference. Key Largo, Florida. April 22, 2008.
Leeworthy, V.R. and P.C. Wiley. 2001. National Survey on Marine Recreation and the
Environment 2000: Current Participation Patterns in Marine Recreation. AReport to the U.S. Department of Congress National Oceanographic AtmosphericAdministration. Silver Spring, Maryland. Retrieved 05/16/2008 fromhttp://marineeconomics.noaa.gov/NSRE/NSRE_2.pdf .
Mote Study. 2005. Manatee Protection Plans; Lee County – 2004; Collier County – 1995;Broward County – 2007; Duval County – 1999 and 2003; Sarasota County –2003; Brevard County – 2003; St. Lucie County – 2001; Palm Beach County –
203

8/9/2019 Florida's Ocean and Coastal Economies Report Phase 2
http://slidepdf.com/reader/full/floridas-ocean-and-coastal-economies-report-phase-2 218/219
2005; and Citrus County Comprehensive Plan 1995 (with revisions through1998).
Park, T.A., J.M. Bowker, and V.R. Leeworthy. 2002. Valuing Snorkeling Visits to the
Florida Keys with State Revealed Preference Models. Journal of Environmental
Management. 65: 301-312.
Pendleton, L. H., and J. Rooke. 2006. Understanding the Potential Economic Impact of
SCUBA Diving and Snorkeling: California. p. 3 [citing Table 2, Leeworthy, V.R.,and P.C. Wiley. (2001). “Current Participation Patterns in Marine Recreation” in National Survey on Recreation and the Environment 2000. U.D. Department of Commerce. National Oceanic and Atmospheric Administration. Silver Spring,Maryland]. Retrieved 05/15/2008 from http://linwoodp.bol.ucal.edu/dive.pdf .
Shivlani, M. and M. Villanueva. 2007. A Compilation and Comparison of Social
Perceptions on Reef Conditions and Use in Southeast Florida. Fishing, Diving
and Other Uses Local Action Strategy Project 10 – Final Report to SoutheastFlorida Coral Reef Initiative. Rosenstiel School of Marine and AtmosphericScience, University of Miami, Miami, Florida. Retrieved 03/07/2008 fromhttp://www.dep.state.fl.us/coastal/program/coral/reports/FDOU/FDOU_Project_10_FinalNov07.pdf .
Stronge, W.B., Palm Beach Island, Recreational Beach Use 1997-98, p. 8.
Stronge, W.B. 2004. Tourism in Paradise: The Economic Impact of Florida Beaches. Center for Environmental and Urban Solutions, Florida Atlantic University. Ft.Lauderdale, Florida. August 2004.
Stronge, W.B., et al. 2004 Sept. The Economic Impact of Summer Beach Tourism: a Case
Study of Panama City Beach, pp. 10-13. Published by the Center for Urban andEnvironmental Solutions, Florida Atlantic University, Ft. Lauderdale, Florida.
Stronge, W.B., et al. 2006 June. The Economic Impact of Summer Beach Tourism: a Case
Study of Jacksonville Beach, pp. 10-13. Published by the Center for Urban andEnvironmental Solutions, Florida Atlantic University, Ft. Lauderdale, Florida.
Stronge, W.B., et al. 2007 Nov. The Economic Impact of Summer Beach Tourism: a Case
Study of Pensacola Beach, pp. 10-13. Published by the Center for Urban andEnvironmental Solutions, Florida Atlantic University, Ft. Lauderdale, Florida.
Stronge, W.B., and R.R. Schultz. Broward County Beaches: An Economic Study, pp. 45-47.
Stronge, W.B., and R.R. Schultz, The Anna Maria Island Beach Restoration: An
Economic Study 1995-96 , pp. 62-64.
204

8/9/2019 Florida's Ocean and Coastal Economies Report Phase 2
http://slidepdf.com/reader/full/floridas-ocean-and-coastal-economies-report-phase-2 219/219
Chapter 17: Beach Activities in Florida
Florida Statistical Abstracts. Fiscal years 2002-2006. Coastal National Parks,Recreational Visits. Table 19.53.
Florida Statistical Abstracts. Fiscal years 2001-2007. “State Parks and Areas: Attendanceat Parks by Department of Environmental Protection Districts in the State andSpecified Counties of Florida.” Tables 19.52 and 19.53.
Holland, Stephan M. et al. 2002. Florida Statewide Outdoor Recreation Resident
Participation Study, University of Florida.
Leeworthy, V.R. and P.C. Wiley. 2001. National Survey on Marine Recreation and the