flotek industries annual report€¦ · asset-light, specialty chemistry technology company...
TRANSCRIPT

FLOTEK INDUSTRIESANNUAL REPORT
2018
(NYSE:FTK)


FLOTEK INDUSTIRES
Mission
Flotek Industries Inc. partners with our clients to provide prescriptive, performance-enhancing chemistry technology that adds value to our clients’ assets and bottom lines. Driven by research and innovation, our
mission is to build trusted relationships with
our clients — we do that by communicating
honestly, upholding integrity in our data
and interactions, and caring for our
clients’ resources as if they were our own.
Character of the organization and its people
matters greatly at Flotek and our values will
not be compromised. We are committed to
delivering the highest standards of quality,
loyalty and service to be the best partners to
key industries where our technologies and
services make a difference.
APPLYING INNOVATIVE CHEMISTRY
01FLOTEK INDUSTRIES 2018 ANNUAL REPORT

FROM THE CEO
Letter to Shareholders
Dear fellow shareholders,
Over the past several years, the North
American oil and gas industry has seen one of
the most disruptive periods in recent history as
E&P companies seek to better capitalize on the
dynamic conditions of the market, including
the burgeoning opportunities offered through
exploitation of unconventional shale. Given
this environment, in 2017, Flotek initiated and
completed a significant transformation that
included divestment of non-core businesses
and aggressive cost reduction. Through these
wide-ranging initiatives, we exited 2017 as an
asset-light, specialty chemistry technology
company primarily focused on working directly
with the end-users of our products in the
energy, consumer & industrial and flavor &
fragrance industries.
Entering 2018, we saw the potential for
improvements in oil and gas fundamentals
despite the continued dynamic backdrop of
the industry. Now more than ever before, oil
and gas operators are squarely focused on
generating cash and delivering returns to
shareholders through a combination of capital
efficiency and investment in value-added
technologies that optimize production. Custom
chemistry prescribed for unique reservoir
characteristics provides an important solution
as it results in greater production, mitigates
the negative effects of parent-child well
communication and promotes continuous
production through enhanced waterflooding
programs, to name a few key benefits.
John Chisholm, CEO
02 FLOTEK INDUSTRIES 2018 ANNUAL REPORT

Operators’ ongoing demand for improved
well economics and pricing transparency
is driving a paradigm shift in the business
model to decouple the completion process.
This move to self-sourcing consumables
first began with diesel, moved heavily to
proppants in 2018 and is gaining momentum
in chemistry as operators, regardless of size,
are expanding and accelerating their efforts
to source chemistries directly. As a result,
during 2018 we continued to align more closely
with our clients — both operators and service
companies — to best position the Company for
long-term success through expansion of our
unique portfolio of proprietary products and
enhancement of our understanding of fluid
system design and applications.
I N N OVAT I N G F O R T H E F U T U R E
At its core, Flotek is driven by innovation.
For more than a decade, we have developed
leading-edge technologies and products
designed to meet the complex needs of our
clients. Leveraging our best-in-class, in-house
technical capabilities offered through our
Global Research & Innovation Center, at the
end of 2018, Flotek had 123 granted or pending
patents. This included 22 patents granted in
2018, which was the largest number granted
in a single year in the Company’s history, and
another clear indicator of Flotek’s continued
excellence in the innovation of new chemical
solutions. Of the patents granted in 2018, 20
were associated with our Complex nano-Fluid®
(CnF®) flagship line of technologies, which
are tailored to the unique characteristics of
the reservoir to increase fluid mobility by
modifying capillary pressures, contact angle
and interfacial tension. CnF® chemistries are
based on naturally sustainable and non-toxic
citrus oils that improve well performance and
productivity, thereby increasing operators’
return on investment.
During 2018, the Company celebrated the 10-year
anniversary of the first patent granted for
CnF®. Over the past decade, we have developed
more than 50 CnF® formulations that have
helped Flotek’s clients address challenges
in the lifecycle of the reservoir and field —
from drilling to cementing to completion and
stimulation activity designed to maximize
recovery in both new and mature fields.
Over the past year, we released numerous
performance analyses of CnF®, demonstrating
the effectiveness of our chemistries across a
variety of basins and reservoirs and applications
including completions, remediation, frac hits and
enhanced waterflooding.
Flotek’s heritage has been built upon CnF®,
which is a premium technology underpinned
by extensive Research & Innovation (R&I)
Flotek Patent Portfolio
03FLOTEK INDUSTRIES 2018 ANNUAL REPORT

that drives performance-enhancing results.
Recognizing the evolving needs of our clients
and the marketplace, in 2018, we also introduced
MicroSolv™ — a new line of stimulation
chemistries designed to deliver enhanced
cost-effective performance over conventional
surfactants by a significant margin. The
product lowers interfacial tension, mitigates
water blockages, reduces surface tension, aids
flowback of water-based frac fluids, improves
clean-up and reduces formation damage
created by phase trapping. The introduction of
MicroSolv™ expanded the Company’s patented
and conventional chemistry solutions we
prescribe and deliver directly to clients.
P R E S C R I P T I V E FL U I D S YS T E M S : D E L I V E R E D D I R E C T LY T O T H E W E L L S I T E
Most operators today optimize their completion
designs on a region-by-region basis, which is
why we have deepened our in-basin technical
knowledge base, fluid applications expertise and
logistics capabilities. In 2018, we transitioned
the majority of our business from delivering to
centralized in-basin locations to a full-service
provider of reservoir-centric fluid systems
delivered directly to our clients at the wellsite.
This holistic approach, which is the basis of our
Prescriptive Chemistry Management® (PCM®)
platform, allows Flotek to work hand-in-hand
with clients to achieve the full value of our
chemistry offerings. This includes CnF® and
other products that address a wide range of
reservoir and geologic challenges and price
points. This close partnership with clients also
allows Flotek the opportunity to accelerate the
development of optimal designs and applications
of our fluid systems, while delivering full
chemistry experience to our clients.
Client adoption has been strong as PCM®-
related revenue was the majority of our
domestic revenue in 2018 as compared to less
than 25% in 2017. In addition, we have seen
increased pull-through of our proprietary
value-added chemistries via our PCM®
platform, as well as growth in revenue per
client. While the transition to a full-service
delivery model impacted our operating margins
in 2018, we expect to benefit from increased
efficiencies in logistics and other aspects
of our operations during the second half of
2019 as a result of strategic changes we are
implementing in the first half of the year.
A D I S C I P L I N E D A P P R OAC H T O G R O W T H & P R O F I TA B I L I T Y
Concurrent with our strategic initiatives
designed to augment our value-added
technology offerings and evolve our business
model to one that is better positioned to thrive
in a dynamic and increasingly fragmented
environment, this past year we took further
steps to significantly adjust our cost structure.
I am pleased to report that during 2018 we
reduced collective spending on G&A and
research and innovation by $13 million, or 23%,
from full-year 2017 levels. During the first
half of 2019, we are executing on a number of
identified opportunities to further reduce costs
and ensure our long-term success.
04 FLOTEK INDUSTRIES 2018 ANNUAL REPORT

In 2018, we also enhanced our corporate
governance on multiple fronts, adding two
new strategic and independent directors to
Flotek’s Board of Directors (Board) following
the departure of three long-standing directors,
as well as appointing new chairpersons for
each of the Board’s committees. Additionally,
we restructured and enhanced our executive
leadership team, including the addition of a
highly-experienced Chief Financial Officer at
the end of 2018. Since the beginning of 2019,
we have taken further steps in our commitment
to strong corporate governance. This includes
separating the role of Chairman and Chief
Executive Officer effective as of the 2019 Annual
Meeting. The Board and the executive team will
continue to work closely together as we focus
on further leveraging our core strengths in an
environment of enhanced financial discipline.
U N L O C K I N G S H A R E H O L D E R VA L U E
In the fourth quarter of 2018, considerable
effort was focused on the negotiation and
due diligence that led to the sale of Florida
Chemical to Archer Daniels Midland Company
(ADM) for $175 million in the first quarter of
2019. With the closing of the transaction, Flotek
established itself as a pure play and leading
provider of high-performance chemistry
solutions to the upstream oil and gas industry.
Over the past few years, we felt the combined
value of our Consumer and Industrial
Chemistry Technologies and Energy Chemistry
Technologies segments had not been broadly
appreciated outside Flotek. To substantiate
our internal view, in the middle of 2018, we
began a process to discover and potentially
unlock the value of the consumer and industrial
part of our business. Around the same time,
we began discussions with ADM concerning
organic business opportunities. Through those
discussions, it became clear that the future
value of Florida Chemical’s industry-leading
capabilities and growing presence might be
best realized in the hands of ADM.
ADM is a highly regarded Fortune 50 corporation
recognized for its global leading presence in
transforming crops into agricultural and food
products, and Florida Chemical’s business
aligns extremely well with their expanding
nutrition and flavor and fragrance offerings.
And, while the fit between ADM and Florida
Chemical was convincing, it was also important
to both parties that Flotek’s relationship with
Aggressively Reducing Fixed Cost Structure
05FLOTEK INDUSTRIES 2018 ANNUAL REPORT
Florida Chemical would continue going forward.
As such, we entered into long-term reciprocal
supply agreements with ADM that allow Flotek
to secure critical supply of d-limonene for our
ongoing operations.
The transaction also provides the potential
for important new opportunities for growth
in Flotek’s ongoing business, and we look
forward to working closely with ADM to jointly
explore and develop next-generation chemistry
technologies for the oil and gas and agricultural
industries. We will focus on high-value bio-
based chemistries that align with our current
technology portfolio.
Importantly, we significantly increased
our financial flexibility as a result of the
transaction. After transaction fees and working
capital adjustments, as well as paying off
all of our outstanding debt and associated
accrued interest, net proceeds from the
transaction were approximately $111 million.
We have formed a committee comprised of
key members of the Board and executive
management to thoroughly evaluate and make
recommendations to the Board on how to best
deploy the net proceeds of the transaction.
These options could include returning capital
to shareholders, executing share buybacks,
funding organic growth projects, making
additional investments in the business that
increase long-term shareholder value and
exploring other alternatives.
L E A D I N G I N P E R F O R M A N C E C H E M I S T RY
Moving forward, we expect continued oil price
volatility and are focused on managing our
business in an approximate $50 per West Texas
Intermediate (WTI) barrel price environment.
Operators are facing diminishing returns as
mechanical variables have reached, and in
some cases exceeded, both their economic
and technical limits in well completion designs
and subsequent performance, which became
increasingly clear throughout 2018. In this
context, many operators are turning their
attention progressively to utilizing custom
chemistry as a means to optimizing exploitation
of hydrocarbons from the reservoir and
capital efficiency.
We believe Flotek is ideally positioned for
long-term success given our truly differentiated
approach to fluid design and best-in-class
innovation capabilities, and we will continue
with renewed focus on effectively illustrating
that value proposition to our clients and the
industry as a whole. Critical to our future
success is a deep base of technical expertise
and fluid designs across multiple basins and we
have responded by further integrating our team
of technical experts — ranging from chemists
Importantly, we significantly increased our financial flexibility as a result of the transaction.
06 FLOTEK INDUSTRIES 2018 ANNUAL REPORT

to reservoir engineers to geoscientists — into
our sales processes. Our clients appreciate
the deep understanding of the performance
of our advanced chemistries, which have now
been applied over thousands of wells across a
wide variety of basins and reservoirs, and we
will continue to expand upon our broad base of
experience and portfolio of innovative solutions.
In closing, we believe Flotek is solidly positioned
in an anticipated ongoing dynamic environment
and we will leverage our best-in-class chemistry
technologies and optimized cost position to
best ensure our long-term success. I want
to acknowledge the continued hard work and
dedication of all of our employees and strategic
guidance provided by our Board. We likewise
appreciate the continued support of our
shareholders, and look forward to keeping you
apprised of our progress.
Sincerely,
John W. Chisholm Chairman, President & CEO
Flotek Industries
We believe Flotek is ideally positioned for long-term success given our truly differentiated approach to fluid design and best-in-class innovation capabilities, and we will continue with renewed focus on effectively illustrating that value proposition to our clients and the industry as a whole.
07FLOTEK INDUSTRIES 2018 ANNUAL REPORT


UNITED STATESSECURITIES AND EXCHANGE COMMISSION
Washington, D.C. 20549
FORM 10-KANNUAL REPORT PURSUANT TO SECTION 13 OR 15(d) OF THE SECURITIES EXCHANGE ACT OF 1934For the fiscal year ended December 31, 2018
orTRANSITION REPORT PURSUANT TO SECTION 13 OR 15(d) OF THE SECURITIES EXCHANGE ACT OF 1934For the transition period from to
Commission File Number 1-13270
FLOTEK INDUSTRIES, INC.(Exact name of registrant as specified in its charter)
Delaware 90-0023731(State or other jurisdiction of
incorporation or organization)(I.R.S. Employer
Identification No.)10603 W. Sam Houston Parkway N. #300
Houston, TX 77064(Address of principal executive offices) (Zip Code)
(713) 849-9911(Registrant’s telephone number, including area code)
Securities registered pursuant to Section 12(b) of the Act:Title of each class Name of each exchange on which registered
Common Stock, $0.0001 par value New York Stock ExchangeSecurities registered pursuant to Section 12(g) of the Act:
NoneIndicate by check mark:
• if the registrant is a well-known seasoned issuer, as defined in Rule 405 of the Securities Act. Yes No • if the registrant is not required to file reports pursuant to Section 13 or Section 15(d) of the Act. Yes No • whether the registrant (1) has filed all reports required to be filed by Section 13 or 15(d) of the Securities Exchange Act of 1934 during the
preceding 12 months (or for such shorter period that the registrant was required to file such reports), and (2) has been subject to such filing requirements for the past 90 days. Yes No
• whether the registrant has submitted electronically every Interactive Data File required to be submitted pursuant to Rule 405 of Regulation S-T (§232.405 of this chapter) during the preceding 12 months (or for such shorter period that the registrant was required to submit such files). Yes No
• if disclosure of delinquent filers pursuant to Item 405 of Regulation S-K (§229.405 of this chapter) is not contained herein, and will not be contained, to the best of registrant’s knowledge, in definitive proxy or information statements incorporated by reference in Part III of this Form 10-K or any amendment to this Form 10-K.
• whether the registrant is a large accelerated filer, an accelerated filer, a non-accelerated filer, a smaller reporting company, or an emerging growth company. See the definitions of “large accelerated filer,” “accelerated filer,” “smaller reporting company,” and “emerging growth company” in Rule 12b-2 of the Exchange Act.
Large accelerated filer Accelerated filer Non-accelerated filer Smaller reporting company Emerging growth company
If an emerging growth company, indicate by check mark if the registrant has elected not to use the extended transition period for complying with any new or revised financial accounting standards provided pursuant to Section 13(a) of the Exchange Act.
• whether the registrant is a shell company (as defined in Rule 12b-2 of the Exchange Act). Yes No The aggregate market value of voting stock held by non-affiliates of the registrant as of June 30, 2018 (based on the closing market price on the NYSE Composite Tape on June 30, 2018) was approximately $150,815,000. At February 28, 2019, there were 57,350,015 outstanding shares of the registrant’s common stock, $0.0001 par value.
DOCUMENTS INCORPORATED BY REFERENCEThe information required in Part III of the Annual Report on Form 10-K is incorporated by reference to the registrant’s definitive proxy statement to be filed pursuant to Regulation 14A for the registrant’s 2019 Annual Meeting of Stockholders.

[THIS PAGE INTENTIONALLY LEFT BLANK]

i
TABLE OF CONTENTS
PART I . . . . . . . . . . . . . . . . . . . . . . . . . . . . . . . . . . . . . . . . . . . . . . . . . . . . . . . . . . . . . . . . . . . . . . . . . . . . . . . . . . . . . . . . . . .
Item 1. Business . . . . . . . . . . . . . . . . . . . . . . . . . . . . . . . . . . . . . . . . . . . . . . . . . . . . . . . . . . . . . . . . . . . . . . . . . . . . . .
Item 1A. Risk Factors . . . . . . . . . . . . . . . . . . . . . . . . . . . . . . . . . . . . . . . . . . . . . . . . . . . . . . . . . . . . . . . . . . . . . . . . . . .
Item 1B. Unresolved Staff Comments . . . . . . . . . . . . . . . . . . . . . . . . . . . . . . . . . . . . . . . . . . . . . . . . . . . . . . . . . . . . . .
Item 2. Properties . . . . . . . . . . . . . . . . . . . . . . . . . . . . . . . . . . . . . . . . . . . . . . . . . . . . . . . . . . . . . . . . . . . . . . . . . . . . .
Item 3. Legal Proceedings . . . . . . . . . . . . . . . . . . . . . . . . . . . . . . . . . . . . . . . . . . . . . . . . . . . . . . . . . . . . . . . . . . . . . .
Item 4. Mine Safety Disclosures. . . . . . . . . . . . . . . . . . . . . . . . . . . . . . . . . . . . . . . . . . . . . . . . . . . . . . . . . . . . . . . . . .
PART II . . . . . . . . . . . . . . . . . . . . . . . . . . . . . . . . . . . . . . . . . . . . . . . . . . . . . . . . . . . . . . . . . . . . . . . . . . . . . . . . . . . . . . . . . .
Item 5. Market for Registrant’s Common Equity, Related Stockholder Matters and Issuer Purchases of Equity Securities . . . . . . . . . . . . . . . . . . . . . . . . . . . . . . . . . . . . . . . . . . . . . . . . . . . . . . . . . . . . . . . . . . . . . . . . . . . . .
Item 6. Selected Financial Data . . . . . . . . . . . . . . . . . . . . . . . . . . . . . . . . . . . . . . . . . . . . . . . . . . . . . . . . . . . . . . . . . .
Item 7. Management’s Discussion and Analysis of Financial Condition and Results of Operations. . . . . . . . . . . . . .
Item 7A. Quantitative and Qualitative Disclosures About Market Risk . . . . . . . . . . . . . . . . . . . . . . . . . . . . . . . . . . . . .
Item 8. Financial Statements and Supplementary Data . . . . . . . . . . . . . . . . . . . . . . . . . . . . . . . . . . . . . . . . . . . . . . . .
Item 9. Changes in and Disagreements With Accountants on Accounting and Financial Disclosure . . . . . . . . . . . . .
Item 9A. Controls and Procedures. . . . . . . . . . . . . . . . . . . . . . . . . . . . . . . . . . . . . . . . . . . . . . . . . . . . . . . . . . . . . . . . . .
Item 9B. Other Information. . . . . . . . . . . . . . . . . . . . . . . . . . . . . . . . . . . . . . . . . . . . . . . . . . . . . . . . . . . . . . . . . . . . . . .
PART III . . . . . . . . . . . . . . . . . . . . . . . . . . . . . . . . . . . . . . . . . . . . . . . . . . . . . . . . . . . . . . . . . . . . . . . . . . . . . . . . . . . . . . . . .
Item 10. Directors, Executive Officers and Corporate Governance. . . . . . . . . . . . . . . . . . . . . . . . . . . . . . . . . . . . . . . .
Item 11. Executive Compensation . . . . . . . . . . . . . . . . . . . . . . . . . . . . . . . . . . . . . . . . . . . . . . . . . . . . . . . . . . . . . . . . .
Item 12. Security Ownership of Certain Beneficial Owners and Management and Related Stockholder Matters . . . .
Item 13. Certain Relationships and Related Transactions, and Director Independence. . . . . . . . . . . . . . . . . . . . . . . . .
Item 14. Principal Accounting Fees and Services . . . . . . . . . . . . . . . . . . . . . . . . . . . . . . . . . . . . . . . . . . . . . . . . . . . . .
PART IV . . . . . . . . . . . . . . . . . . . . . . . . . . . . . . . . . . . . . . . . . . . . . . . . . . . . . . . . . . . . . . . . . . . . . . . . . . . . . . . . . . . . . . . . .
Item 15. Exhibits and Financial Statement Schedules . . . . . . . . . . . . . . . . . . . . . . . . . . . . . . . . . . . . . . . . . . . . . . . . . .
SIGNATURES . . . . . . . . . . . . . . . . . . . . . . . . . . . . . . . . . . . . . . . . . . . . . . . . . . . . . . . . . . . . . . . . . . . . . . . . . . . . . . . . . . . .
1
1
4
14
14
14
15
16
16
17
19
37
39
75
75
75
76
76
76
76
76
76
77
77
79

ii
FORWARD-LOOKING STATEMENTS This Annual Report on Form 10-K (the “Annual Report”), and in particular, Part II, Item 7 – “Management’s Discussion and Analysis of Financial Condition and Results of Operations,” contains “forward-looking statements” within the meaning of the safe harbor provisions, 15 U.S.C. § 78u-5, of the Private Securities Litigation Reform Act of 1995. Forward-looking statements are not historical facts but instead represent the Company’s current assumptions and beliefs regarding future events, many of which, by their nature, are inherently uncertain and outside the Company’s control. The forward-looking statements contained in this Annual Report are based on information available as of the date of this Annual Report. The forward looking statements relate to future industry trends and economic conditions, forecast performance or results of current and future initiatives and the outcome of contingencies and other uncertainties that may have a significant impact on the Company’s business, future operating results and liquidity. These forward-looking statements generally are identified by words such as “anticipate,” “believe,” “estimate,” “continue,” “intend,” “expect,” “plan,” “forecast,” “project” and similar
expressions, or future-tense or conditional constructions such as “will,” “may,” “should,” “could” and “would,” or the negative thereof or other variations thereon or comparable terminology. The Company cautions that these statements are merely predictions and are not to be considered guarantees of future performance. Forward-looking statements are based upon current expectations and assumptions that are subject to risks and uncertainties that can cause actual results to differ materially from those projected, anticipated or implied. A detailed discussion of potential risks and uncertainties that could cause actual results and events to differ materially from forward-looking statements include, but are not limited to, those discussed in Part I, Item 1A – “Risk Factors” of this Annual Report and periodically in future reports filed with the Securities and Exchange Commission (the “SEC”).
The Company has no obligation to publicly update or revise any forward-looking statements, whether as a result of new information or future events, except as required by law.

1
PART I
Item 1. Business.
General
Flotek Industries, Inc. (“Flotek” or the “Company”) is a global, diversified, technology-driven company that develops and supplies chemistry and services to the oil and gas industries. Flotek also supplied high value compounds to companies that make food and beverages, cleaning products, cosmetics, and other products that are sold in consumer and industrial markets, classified as discontinued operations at December 31, 2018.
The Company was originally incorporated in the Province of British Columbia on May 17, 1985. In October 2001, the Company moved the corporate domicile to Delaware and effected a 120 to 1 reverse stock split by way of a reverse merger with CESI Chemical, Inc. (“CESI”). Since then, the Company has grown through a series of acquisitions and organic growth.
In December 2007, the Company’s common stock began trading on the New York Stock Exchange (“NYSE”) under the stock ticker symbol “FTK.” Annual reports on Form 10-K, quarterly reports on Form 10-Q, current reports on Form 8-K, and amendments to those reports filed or furnished pursuant to Section 13(a) or 15(d) of the Securities Exchange Act of 1934, as amended (the “Exchange Act”) are posted to the Company’s website, www.flotekind.com, as soon as practicable subsequent to electronically filing or furnishing to the SEC. Information contained in the Company’s website is not to be considered as part of any regulatory filing. As used herein, “Flotek,” the “Company,” “we,” “our,” and “us” refers to Flotek Industries, Inc. and/or the Company’s wholly owned subsidiaries. The use of these terms is not intended to connote any particular corporate status or relationship.
Recent Developments
During the fourth quarter of 2018, the Company initiated a strategic plan to sell its Consumer and Industrial Chemistry Technologies segment, which was completed in the first quarter of 2019. An investment banking advisory services firm was engaged and actively marketed this segment. Effective December 31, 2018, the Company has classified the assets, liabilities, and results of operations for this segment as “Discontinued Operations” for all periods presented.
During the fourth quarter of 2016, the Company initiated a strategic restructuring of its business to enable a greater focus on its core businesses in energy chemistry and consumer and industrial chemistry. During 2017, the Company completed the sale of substantially all of the assets and transfer of certain specified liabilities and obligations of each of the Drilling Technologies and Production Technologies segments. An investment banking advisory services firm was engaged and actively marketed these segments. The Company has classified the assets, liabilities, and results of operations for
these two segments as “Discontinued Operations” for all periods presented.
In August 2016, the Company opened its new Global Research & Innovation Center. This state-of-the-art research facility fosters the development of next-generation innovative chemistries and permits expanded collaboration between clients, leaders from academia, and Company scientists. These collaborative opportunities are important and distinguish the Company’s chemistry technologies and capability within the industry.
In July 2016, the Company acquired 100% of the stock and interests in International Polymerics, Inc. (“IPI”) and related entities for $7.9 million in cash consideration, net of cash acquired, and 247,764 shares of the Company’s common stock. IPI is a U.S. based manufacturer of high viscosity guar gum and guar slurry for the oil and gas industry with a wide selection of stimulation chemicals. During the third quarter of 2018, the Company discontinued the manufacturing of guar gum and guar slurry and sold the fixed assets used in this business line.
Description of Operations and Segments
The Company’s continuing operations have one strategic business segment: Energy Chemistry Technologies. The Consumer and Industrial Chemistry Technologies segment is classified as discontinued operations. In addition, the Drilling Technologies and Production Technologies segments were sold during 2017 and all historical information is classified as discontinued operations.
The Company offers competitive products and services derived from technological advances, some of which are patented, and experience in fluid systems applications that are responsive to industry demands in both domestic and international markets. Flotek operates and/or distributes its products in over 20 domestic and international markets.
Financial information about operating segments and geographic concentration is provided in Note 19 – “Segment and Geographic Information” in Part II, Item 8 – “Financial Statements and Supplementary Data” of this Annual Report.
Information about the Company’s one operating segment is below.
Energy Chemistry Technologies
The Energy Chemistry Technologies (“ECT”) segment designs, develops, manufactures, packages, distributes, delivers, and markets reservoir-centric fluid systems, including specialty and conventional chemistries, for use in oil and gas (“O&G”) well drilling, cementing, completion, remediation, and stimulation activities designed to maximize recovery in both new and mature fields. Flotek’s specialty

2
chemistries possess enhanced performance characteristics and are manufactured to perform in a broad range of basins and reservoirs with varying downhole pressures, temperatures and other well-specific conditions customized to customer specifications. This segment has technical services laboratories and a research and innovation laboratory that focus on design improvements, development and viability testing of new chemistry formulations, and continued enhancement of existing products. Flotek’s flagship patented chemistry technologies include Complex nano-Fluid®, Pressure reducing Fluids®, and MicroSolv™.
Chemistries branded Complex nano-Fluid® technologies (“CnF® products”) are patented both domestically and internationally and are proven strategically cost-effective performance additives within both oil and natural gas markets. The CnF® product mixtures are stable mixtures of plant derived oils, water, and surface active agents which organize molecules into nano structures. The combined advantage of solvents, surface active agents and water, and the resultant nano structures, improve well treatment results as compared to the independent use of solvents and surface active agents. CnF® products are composed of renewable, plant-derived ingredients and oils that are certified as biodegradable. CnF® chemistries help achieve improved operational and financial results for the Company’s customers in low permeability sand and shale reservoirs.
Chemistries branded Pressure reducing Fluids® technologies
(“PrF® products”) are a patented line of high molecular weight polymers used as friction reducers that reduce turbulence and maximize the use of the polymer at a lower loading rate. The products have proven efficacy in a broad range of water quality, including high brine and high iron environments.
Introduced in April 2018, chemistries branded MicroSolv™ are a patented line of microemulsion technologies designed to deliver cost-effective performance.
Discontinued Operations
Consumer and Industrial Chemistry Technologies. The Consumer and Industrial Chemistry Technologies (“CICT”) segment, reported as discontinued operations, sourced citrus oil domestically and internationally and processed citrus oils. Products produced from processed citrus oil include (1) high value compounds used as additives by companies in the flavors and fragrances markets and (2) environmentally friendly chemistries for use in the oil & gas industry and numerous other industries around the world. The CICT segment designed, developed, and manufactured products that were sold to companies in the flavor and fragrance industries and specialty chemical industry. These technologies are used within food and beverage, fragrance, and household and industrial cleaning products industries.
Drilling Technologies. The Drilling Technologies segment, reported as discontinued operations, provided downhole drilling tools for use in energy and mining activities. This segment assembled, rented, sold, inspected, and marketed
specialized equipment used in energy, mining, and industrial drilling activities. Established tool rental operations were located throughout the United States (the “U.S.”) and in a number of international markets.
Production Technologies. The Production Technologies segment, reported as discontinued operations, provided pumping system components, electric submersible pumps (“ESPs”), gas separators, production valves, and complementary services. Through the Company’s acquisition of International Artificial Lift, LLC (“IAL”), the Company provided a line of next generation hydraulic pumping units that served to increase and maximize production for oil and natural gas wells.
Seasonality
Overall, operations are not significantly affected by seasonality; however, winter weather conditions can pose delays in clients’ activity levels, primarily in oil and gas. Certain working capital components build and recede throughout the year in conjunction with established purchasing and selling cycles that can impact operations and financial position. With respect to the Company’s discontinued CICT segment, citrus oil inventories increase during the first and second quarters in-line with the citrus crop harvest and processing season. The performance of certain services within the Company’s remaining ECT segment can be susceptible to both weather and naturally occurring phenomena, including, but not limited to, the following:
• the severity and duration of winter temperatures in North America, which impacts natural gas storage levels, drilling activity, and commodity prices;
• the timing and duration of the Canadian spring thaw and resulting restrictions that impact activity levels;
• the timing and impact of hurricanes upon coastal and offshore operations; and
• the adverse weather and disease that affect citrus crops in Florida and Brazil which can negatively impact the availability of citrus oils and increase raw material costs for the ECT business unit.
Product Demand and Marketing
Demand for the Company’s energy chemistry products and services is dependent on levels of conventional and non-conventional oil and natural gas well drilling and completion activity, both domestically and internationally. Products in the Energy Chemistry Technologies segment are marketed directly to customers through the Company’s own sales force and through certain contractual agency arrangements. Established customer relationships provide repeat sales opportunities. The Company participates in industry trade shows and publishes technical papers and case studies examining the performance of its chemistries and methodologies for evaluating chemistries more effectively. While the Company’s primary marketing efforts remain focused in North America, a growing amount of resources and effort are focused on emerging international markets,

3
especially in the Middle East and North Africa (“MENA”) and South America. In addition to direct marketing and relationship development, the Company also markets products and services through the use of third party agents primarily in international markets.
Customers
The Company’s customers primarily include major integrated oil and natural gas companies, oilfield service companies, independent oil and natural gas companies, pressure pumping service companies, international supply chain management companies, and national and state-owned oil companies. In addition, customers in the discontinued operations at December 31, 2018, include household and commercial cleaning product companies, fragrance and cosmetic companies, and food and beverage manufacturing companies. In the one segment reported in continuing operations, the Company had two major customers for the year ended December 31, 2018, which accounted for 12% and 10% of consolidated revenue, one major customer for the year ended December 31, 2017, which accounted for 17% of consolidated revenue, and two major customers for the year ended December 31, 2016, which accounted for 22% and 16% of consolidated revenue. In aggregate, the Company’s largest three customers collectively accounted for 30%, 32%, and 48% of consolidated revenue for the years ended December 31, 2018, 2017, and 2016, respectively.
Research and Innovation
The Company is engaged in research and innovation activities focused on the design of reservoir specific, customized chemistries in the Energy Chemistry Technologies segment. In this segment, for the years ended December 31, 2018, 2017, and 2016, the Company incurred $10.4 million, $13.1 million, and $9.3 million, respectively, of research and innovation expense. In 2018, research and innovation expense was approximately 5.8% of consolidated revenue. The Company expects that its 2019 research and innovation investment will continue to remain a significant portion of overall spending to support new product development and customization initiatives for its clients.
Backlog
Due to the nature of the Company’s contractual customer relationships and the way they operate, the Company has historically not had significant backlog order activity.
Intellectual Property
The Company’s policy is to protect its intellectual property, both within and outside of the U.S. The Company considers patent protection for all products and methods deemed to have commercial significance and that may qualify for patent protection. The decision to pursue patent protection is dependent upon several factors, including whether patent protection can be obtained, cost-effectiveness, and alignment with operational and commercial interests. The Company believes its patent and trademark portfolio, combined with
confidentiality agreements, trade secrets, proprietary designs, and manufacturing and operational expertise, are necessary and appropriate to protect its intellectual property and ensure continued strategic advantage. Within its continuing operations, the Company currently has 50 issued patents and over six dozen pending patent applications filed in the U.S. and abroad on various chemical compositions and methods and software methods. In addition, the Company currently has 55 registered trademarks and over a dozen pending trademark applications filed in the U.S. and abroad, covering a variety of its goods and services.
Competition
The ability to compete in the oilfield services industry is dependent upon the Company’s ability to differentiate its products and services, provide superior quality and service, and maintain a competitive cost structure with sufficient raw material supplies. Activity levels in the oil field goods and services industry are impacted by current and expected oil and natural gas prices, oil and natural gas drilling activity, production levels, and customer drilling and completion designated capital spending. Domestic and international regions in which Flotek operates are highly competitive. The unpredictability of the energy industry and commodity price fluctuations creates both increased risk and opportunity for the products and services of both the Company and its competitors.
Certain oil and natural gas service companies competing with the Company are larger and have access to more resources. Such competitors could be better situated to withstand industry downturns, compete on the basis of price, and acquire and develop new equipment and technologies, all of which could affect the Company’s revenue and profitability. Oil and natural gas service companies also compete for customers and strategic business opportunities. Thus, competition could have a detrimental impact upon the Company’s business.
Raw Materials
Materials and components used in the Company’s servicing and manufacturing operations, as well as those purchased for sale, are generally available on the open market from multiple sources. Collection and transportation of raw materials to Company facilities, however, could be adversely affected by extreme weather conditions. Additionally, certain raw materials are available from limited sources. Disruptions to supply could materially impact sales. The prices paid for raw materials vary based on energy, citrus, and other commodity price fluctuations, tariffs, duties on imported materials, foreign currency exchange rates, business cycle position, and global demand. Higher prices for chemistries, citrus, polymers, and other raw materials could adversely impact future sales and contract fulfillments.
Citrus-based terpene (d-limonene) is an important feedstock for many of the Company’s formulations. In addition, the Company utilizes naturally derived terpenes from other sources and bio-based solvents from other natural sources.

4
The Company is diligent in its efforts to identify alternate suppliers, in its contingency planning for potential supply shortages and in its proactive efforts to reduce costs through competitive bidding practices. When able, the Company uses multiple suppliers, both domestically and internationally, to purchase raw materials on the open market. In connection with the sale of the CICT segment, Flotek entered into a long-term supply agreement, which will secure Flotek’s long-term supply of d-limonene.
Citrus greening disease has adversely affected the availability of citrus crops around the world, thereby negatively impacting the supply and increasing the price of citrus terpenes. The Company’s market position, inventory, and forward purchases helps ensure availability for its patented CnF® technologies. As mentioned previously, the Company has also developed new CnF® formulations utilizing alternative solvents. These new formulations not only diversify the Company’s dependence on citrus terpenes, but they also provide certain performance benefits necessary for specific customer and reservoir challenges.
Government Regulations
The Company is subject to federal, state, and local environmental, occupational safety, and health laws and regulations within the U.S. and other countries in which the Company does business. These laws and regulations strictly govern the manufacture, storage, transportation, sale, use, and disposal of chemistry products. The Company strives to ensure full compliance with all regulatory requirements and is unaware of any material instances of noncompliance.
The Company continually evaluates the environmental impact of its operations and attempts to identify potential liabilities and costs of any environmental remediation, litigation, or associated claims. Several products of the Energy Chemistry Technologies and discontinued Consumer and Industrial Chemistry Technologies segments are considered hazardous materials. In the event of a leak or spill in association with Company operations, the Company could be exposed to risk of material cost, net of insurance proceeds, to remediate any contamination. No environmental claims are currently being litigated, and the Company does not expect that costs related to remediation requirements will have a significant adverse effect on the Company’s consolidated financial position or results of operations.
Employees
At December 31, 2018, the Company had 273 employees in its continuing operations and 77 employees in its discontinued operations, exclusive of existing worldwide agency relationships. None of the Company’s employees are covered by a collective bargaining agreement and labor relations are generally positive. Certain international locations have staffing or work arrangements that are contingent upon local work councils or other regulatory approvals.
Available Information and Website
The Company’s website is accessible at www.flotekind.com. Annual reports on Form 10-K, quarterly reports on Form 10-Q, current reports on Form 8-K, and amendments to reports filed or furnished pursuant to Section 13(a) or 15(d) of the Exchange Act are available (see the “Investor Relations” section of the Company’s website), as soon as reasonably practicable, subsequent to electronically filing or otherwise providing reports to the SEC. Corporate governance materials, guidelines, by-laws, and code of business conduct and ethics are also available on the website. A copy of corporate governance materials is available upon written request to the Company.
The SEC maintains the www.sec.gov website, which contains reports, proxy and information statements, and other registrant information filed electronically with the SEC.
The 2018 Annual Chief Executive Officer Certification required by the NYSE was submitted on May 25, 2018. The certification was not qualified in any respect. Additionally, the Company has filed all principal executive officer and financial officer certifications as required under Sections 302 and 906 of the Sarbanes-Oxley Act of 2002 with this Annual Report. Information with respect to the Company’s executive officers and directors is incorporated herein by reference to information to be included in the proxy statement for the Company’s 2019 Annual Meeting of Stockholders.
The Company has disclosed and will continue to disclose any changes or amendments to the Company’s code of business conduct and ethics as well as waivers to the code of ethics applicable to executive management by posting such changes or waivers on the Company’s website.
Item 1A. Risk Factors.
The Company’s business, financial condition, results of operations, and cash flows are subject to various risks and uncertainties. Readers of this report should not consider any descriptions of these risk factors to be a complete set of all potential risks that could affect Flotek. These factors should be carefully considered together with the other information contained in this Report and the other reports and materials filed by the Company with the SEC. Further, many of these risks are interrelated and, as a result, the occurrence of certain
risks could trigger and/or exacerbate other risks. Such a combination could materially increase the severity of the impact of these risks on the Company’s business, results of operations, financial condition, or liquidity.
This Annual Report contains “forward-looking statements,” as defined in the Private Securities Litigation Reform Act of 1995, that involve risks and uncertainties. Forward-looking statements discuss Company prospects, expected revenue,

5
expenses and profits, strategic and operational initiatives, and other activities. Forward-looking statements also contain suppositions regarding future oil and natural gas industry conditions, as well as market conditions impacting the consumer and industrial business, both domestically and internationally. The Company’s results could differ materially from those anticipated in the forward-looking statements as a result of a variety of factors, including risks described below and elsewhere. See “Forward-Looking Statements” at the beginning of this Annual Report.
Risks Related to the Company’s Business
The Company’s business is largely dependent upon domestic and international oil and natural gas industry spending. Spending could be adversely affected by industry conditions or by new or increased governmental regulations, global economic conditions, the availability of credit, and lower oil and natural gas prices. All of these factors are beyond the Company’s control. The resulting reductions in customers’ expenditures could have a significant adverse effect on Company revenue, margins, and overall operating results.
The Company’s energy segment is dependent upon customers’ willingness to make operating and capital expenditures for exploration, development and production of oil and natural gas in both North American and global markets. Customers’ expectations of a decline in future oil and natural gas market prices could result in curtailed spending, thereby reducing demand for the Company’s products and services. Industry conditions are influenced by numerous factors over which the Company has no control, including the supply of and demand for oil and natural gas, domestic and international economic conditions, political instability in oil and natural gas producing countries and merger and divestiture activity among oil and natural gas producers and service companies.
The price for oil and natural gas is subject to a variety of factors, including, but not limited to:
• global demand for energy as a result of population growth, economic development, and general economic and business conditions;
• the ability of the Organization of Petroleum Exporting Countries (“OPEC”) to set and maintain production levels and the impact of non-OPEC producers on global supply;
• availability and quantity of natural gas storage;• import and export volumes and pricing of liquefied
natural gas;• pipeline capacity to critical markets and out of
producing regions;• political and economic uncertainty and socio-political
unrest;• cost of exploration, production and transport of oil and
natural gas;• technological advances impacting energy production
and consumption; and
• weather conditions.
The volatility of oil and natural gas prices and the consequential effect on exploration and production activity could adversely impact the activity levels of the Company’s customers.
One indicator of drilling and completion spending is drilling activity as measured by rig count, which the Company actively monitors to gauge market conditions and forecast product and
service demand. In addition, the U.S. Energy Information Administration (“EIA”) and other industry data sources report completion activity which is utilized by the Company. A reduction in drilling and completion activity could cause a decline in the demand for, or negatively affect the price of, some of the Company’s products and services. Domestic demand for oil and natural gas could also be uniquely affected by public attitude regarding drilling in environmentally sensitive areas, vehicle emissions and other environmental standards, alternative fuels, taxation of oil and gas, perception of “excess profits” of oil and gas companies, and anticipated changes in governmental regulation and policy.
Volatile economic conditions could weaken customer exploration and production expenditures, causing reduced demand for the Company’s products and services and a significant adverse effect on the Company’s operating results. It is difficult to predict the pace of industry growth, the direction of oil and natural gas prices, the direction and magnitude of economic activity, and to what extent these conditions could affect the Company. However, reduced cash flow and capital availability could adversely impact the financial condition of the Company’s customers, which could result in customer project modifications, delays or cancellations, general business disruptions, and delay in, or nonpayment of, amounts that are owed to the Company. This could cause a negative impact on the Company’s results of operations and cash flows.
Furthermore, if certain of the Company’s suppliers were to experience significant cash flow constraints or become insolvent as a result of such conditions, a reduction or interruption in supplies or a significant increase in the price of supplies could occur, adversely impacting the Company’s results of operations and cash flows.
The Company’s inability to develop and/or introduce new products or differentiate existing products could have an adverse effect on its ability to be responsive to customers’ needs and could result in a loss of customers, as well as adversely affecting the Company’s future success and profitability.
The oil and natural gas industry is characterized by technological advancements that have historically resulted in, and will likely continue to result in, substantial improvements in the scope and quality of oilfield chemistries and their function and performance. Consequently, the Company’s future success is dependent, in part, upon the Company’s

6
continued ability to timely develop innovative products and services. Increasingly sophisticated customer needs and the ability to anticipate and respond to technological and operational advances in the oil and natural gas industry is critical. If the Company fails to successfully develop and introduce innovative products and services that appeal to customers, or if existing or new market competitors develop superior products and services, the Company’s revenue and profitability could deteriorate.
Increased competition could exert downward pressure on prices charged for the Company’s products and services.
The Company operates in a competitive environment characterized by large and small competitors. Competitors with greater resources and lower cost structures or who are trying to gain market share may be successful in providing competing products and services to the Company’s customers at lower prices than the Company currently charges. This may require the Company to lower its prices, resulting in an adverse impact on revenues, margins, and operating results.
If the Company is unable to adequately protect intellectual property rights or is found to infringe upon the intellectual property rights of others, the Company’s business is likely to be adversely affected.
The Company relies on a combination of patents, trademarks, copyrights, trade secrets, non-disclosure agreements, and other security measures to establish and protect the Company’s intellectual property rights. Although the Company believes that existing measures are reasonably adequate to protect intellectual property rights, there is no assurance that the measures taken will prevent misappropriation of proprietary information or dissuade others from independent development of similar products or services. Moreover, there is no assurance that the Company will be able to prevent competitors from copying, reverse engineering, modifying, or otherwise obtaining and/or using the Company’s technology and proprietary rights to create competitive products or services. The Company may not be able to enforce intellectual property rights outside of the U.S. Additionally, the laws of certain countries in which the Company’s products and services are manufactured or marketed may not protect the Company’s proprietary rights to the same extent as do the laws of the U.S. Furthermore, other third parties may infringe, challenge, invalidate, or circumvent the Company’s patents, trademarks, copyrights and trade secrets. In each case, the Company’s ability to compete could be significantly impaired.
A portion of the Company’s products and services are without patent protection. The issuance of a patent does not guarantee validity or enforceability. The Company’s patents may not necessarily be valid or enforceable against third parties. The issuance of a patent does not guarantee that the Company has the right to use the patented invention. Third parties may have blocking patents that could be used to prevent the Company from marketing the Company’s own patented products and services and utilizing the Company’s patented technology.
The Company is exposed and, in the future, may be exposed to allegations of patent and other intellectual property infringement from others. The Company may allege infringement of its patents and other intellectual property rights against others. Under either scenario, the Company could become involved in costly litigation or other legal proceedings regarding its patent or other intellectual property rights, from both an enforcement and defensive standpoint. Even if the Company chooses to enforce its patent or other intellectual property rights against a third party, there may be risk that the Company’s patent or other intellectual property rights become invalidated or otherwise unenforceable through legal proceedings. If intellectual property infringement claims are asserted against the Company, the Company could defend itself from such assertions or could seek to obtain a license under the third party’s intellectual property rights in order to mitigate exposure. In the event the Company cannot obtain a license, third parties could file lawsuits or other legal proceedings against the Company, seeking damages (including treble damages) or an injunction against the manufacture, use, sale, offer for sale, or importation of the Company’s products and services. These could result in the Company having to discontinue the use, manufacture, and sale of certain products and services, increase the cost of selling certain products and services, or result in damage to the Company’s reputation. An award of damages, including material royalty payments, or the entry of an injunction order against the use, manufacture, and sale of any of the Company’s products and services found to be infringing, could have an adverse effect on the Company’s results of operations and ability to compete.
The loss of key customers could have an adverse impact on the Company’s results of operations and could result in a decline in the Company’s revenue.
The Company has critical customer relationships which are dependent upon production and development activity related to a handful of customers. In the segment reported in continuing operations, revenue derived from the Company’s three largest customers as a percentage of consolidated revenue for the years ended December 31, 2018, 2017, and 2016, totaled 30%, 32%, and 48%, respectively. Customer relationships are historically governed by purchase orders or other short-term contractual obligations as opposed to long-term contracts. The loss of one or more key customers could have an adverse effect on the Company’s results of operations and could result in a decline in the Company’s revenue.
Loss of key suppliers, the inability to secure raw materials on a timely basis, or the Company’s inability to pass commodity price increases on to customers could have an adverse effect on the Company’s ability to service customer’s needs and could result in a loss of customers.
Materials used in servicing and manufacturing operations, as well as those purchased for sale, are generally available on the open market from multiple sources. Acquisition costs and transportation of raw materials to Company facilities have historically been impacted by extreme weather conditions.

7
Certain raw materials used by the Energy Chemistry Technologies segment are available only from limited sources; accordingly, any disruptions to critical suppliers’ operations could adversely impact the Company’s operations. Prices paid for raw materials could be affected by energy products and other commodity prices; weather and disease associated with the Company’s crop dependent raw materials, specifically citrus greening; tariffs and duties on imported materials; foreign currency exchange rates; and phases of the general business cycle and global demand. The Energy Chemistry Technologies segment secures short and long term supply agreements for critical raw materials from both domestic and international vendors.
The prices of key raw materials including citrus terpenes and polymers are subject to market fluctuations which at times can be significant and unpredictable. The Company may be unable to pass along price increases to its customers, which could result in an adverse impact on margins and operating profits. The Company currently uses purchasing strategies designed, where possible, to align the timing of customer demand with supply commitments. However, the Company currently does not hedge commodity prices, but may consider such strategies in the future, and there is no guarantee that the Company’s purchasing strategies will prevent cost increases from resulting in adverse impacts on margins and operating profits.
The Company depends on a single-source supplier for citrus terpene, and the loss of this supplier could significantly harm the Company’s business, financial condition, and results of operations.
Citrus-based terpene (d-limonene) is an important feedstock for many of the Company’s formulations. The Company recently entered into a terpene Supply Agreement (the “Supply Agreement”) with Flotek’s former subsidiary, Florida Chemical Company, LLC (“FCC”), to serve as the Company’s exclusive supplier of terpene. The Company depends on FCC to provide it with terpene in a timely manner that meets its quality, quantity, and cost requirements. FCC may encounter problems that preclude it from supplying terpene on the terms set forth in the Supply Agreement, including with respect to pricing and production volumes. In the event that FCC encounters such problems or otherwise breaches the Supply Agreement, the Company’s inability to contract with alternative sources could result in a prolonged interruption in its ability to produce the Company’s formulations. Any such delays or interruptions could ultimately result in a significant increase in the price of the various formulations or a significant reduction in the Company’s margins on these formulations, which could adversely affect the Company’s business, financial condition, and results of operations.
If the Company loses the services of key members of management, the Company may not be able to manage operations and implement growth strategies.
The Company depends on the continued service of the Chief Executive Officer and President, the Chief Financial Officer, the Executive Vice President of Operations, and other key
members of the executive management team, who possess significant expertise and knowledge of the Company’s business and industry. Furthermore, the Chief Executive Officer and President serves as Chairman of the Board of Directors. The Company has entered into employment agreements with certain of these key members; however, at December 31, 2018, the Company only carried key man life insurance for the Chief Executive Officer and the Executive Vice President of Operations. Any loss or interruption of the services of key members of the Company’s management could significantly reduce the Company’s ability to manage operations effectively and implement strategic business initiatives. On December 31, 2018, Matthew B. Marietta departed from the Company as the Executive Vice President of Finance and Corporate Development (Principal Financial Officer), and H. Richard Walton retired as the Company’s Chief Accounting Officer. The Company can provide no assurance that appropriate replacements for key positions could be found should the need arise.
Failure to maintain effective disclosure controls and procedures and internal controls over financial reporting could have an adverse effect on the Company’s operations and the trading price of the Company’s common stock.
Effective internal controls are necessary for the Company to provide reliable financial reports, effectively prevent fraud and operate successfully as a public company. If the Company cannot provide reliable financial reports or effectively prevent fraud, the Company’s reputation and operating results could be harmed. If the Company is unable to maintain effective disclosure controls and procedures and internal controls over financial reporting, the Company may not be able to provide reliable financial reports, which in turn could affect the Company’s operating results or cause the Company to fail to meet its reporting obligations. Ineffective internal controls could also cause investors to lose confidence in reported financial information, which could negatively affect the trading price of the Company’s common stock, limit the ability of the Company to access capital markets in the future, and require additional costs to improve internal control systems and procedures.
Network disruptions, security threats and activity related to global cyber-crime pose risks to the Company’s key operational, reporting and communication systems.
The Company relies on access to information systems for its operations. Failures of, or interference with, access to these systems, such as network communications disruptions, could have an adverse effect on our ability to conduct operations and could directly impact consolidated reporting. Security breaches pose a risk to confidential data and intellectual property, which could result in damages to our competitiveness and reputation. The Company has policies and procedures in place, including system monitoring and data back-up processes, to prevent or mitigate the effects of these potential disruptions or breaches. However, there can be no assurance that existing or emerging threats will not have an adverse impact on our systems or communications networks.

8
The Company may pursue strategic acquisitions, joint ventures, and strategic divestitures, which could have an adverse impact on the Company’s business.
The Company’s past and potential future acquisitions, joint ventures, and divestitures involve risks that could adversely affect the Company’s business. Negotiations of potential acquisitions, joint ventures, or other strategic relationships, integration of newly acquired businesses, and/or sales of existing businesses could be time consuming and divert management’s attention from other business concerns. Acquisitions and joint ventures could also expose the Company to unforeseen liabilities or risks associated with new markets or businesses. Unforeseen operational difficulties related to acquisitions and joint ventures could result in diminished financial performance or require a disproportionate amount of the Company’s management’s attention and resources. Additionally, acquisitions could result in the commitment of capital resources without the realization of anticipated returns. Divestitures could result in the loss of future earnings without adequate compensation and the loss of unrealized strategic opportunities.
If the Company does not manage the potential difficulties associated with expansion successfully, the Company’s operating results could be adversely affected.
The Company has grown over the last several years through internal growth, strategic alliances, and strategic business and asset acquisitions. The Company believes future success will depend, in part, on the Company’s ability to adapt to market opportunities and changes, to successfully integrate the operations of any businesses acquired, expansion of existing product and service lines, and potentially expand into new product and service areas in which the Company may not have prior experience. Factors that could result in strategic business difficulties include, but are not limited to:
• failure to effectively integrate acquisitions, joint ventures or strategic alliances;
• failure to effectively plan for risks associated with expansion into areas in which management lacks prior experience;
• lack of experienced management personnel;• increased administrative burdens;• lack of customer retention;• technological obsolescence; and• infrastructure, technological, communication and
logistical problems associated with large, expansive operations.
If the Company fails to manage potential difficulties successfully, the Company’s operating results could be adversely impacted.
The Company’s ability to grow and compete could be adversely affected if adequate capital is not available.
The ability of the Company to grow and be competitive in the market place is dependent on the availability of adequate capital. Access to capital is dependent, in large part, on the Company’s cash flows and the availability of and access to equity and debt financing. The Company’s revolving loan agreements require approval and place limits on certain capital transactions and various business acquisitions and combinations. The Company cannot guarantee that internally generated cash flows will be sufficient, or that the Company will continue to be able to obtain equity or debt financing on acceptable terms, or at all. As a result, the Company may not be able to finance strategic growth plans, take advantage of business opportunities, or to respond to competitive pressures. However, with the remaining proceeds from the sale of the CICT segment, the Company has formed a Strategic Capital Committee to evaluate and make recommendations to the board of directors regarding the manner in which the remaining net proceeds from the sale will be deployed. The Company filed a “universal” shelf registration on September 21, 2017, to permit the ability to sell securities to the public in a timely manner and which it expects to keep active.
Failure to collect for goods and services sold to key customers could have an adverse effect on the Company’s financial results, liquidity and cash flows.
The Company performs credit analysis on potential customers; however, credit analysis does not provide full assurance that customers will be willing and/or able to pay for goods and services purchased from the Company. Furthermore, collectability of international sales can be subject to the laws of foreign countries, which may provide more limited protection to the Company in the event of a dispute over payment. Because sales to domestic and international customers are generally made on an unsecured basis, there can be no assurance of collectability. If one or more major customers are unwilling or unable to pay its debts to the Company, it could have an adverse effect of the Company’s financial results, liquidity and cash flows.
Unforeseen contingencies such as litigation could adversely affect the Company’s financial condition.
The Company is, and from time to time may become, a party to legal proceedings incidental to the Company’s business involving alleged injuries arising from the use of Company products, exposure to hazardous substances, patent infringement, employment matters, commercial disputes, and shareholder lawsuits. The defense of these lawsuits may require significant expenses, divert management’s attention, and may require the Company to pay damages that could adversely affect the Company’s financial condition. In
9
addition, any insurance or indemnification rights that the Company may have may be insufficient or unavailable to protect against potential loss exposures.
The Company’s current insurance policies may not adequately protect the Company’s business from all potential risks.
The Company’s operations are subject to risks inherent in the oil and natural gas industry, such as, but not limited to, accidents, blowouts, explosions, fires, severe weather, oil and chemical spills, and other hazards. These conditions can result in personal injury or loss of life, damage to property, equipment and the environment, as well as suspension of customers’ oil and gas operations. These events could result in damages requiring costly repairs, the interruption of Company business, including the loss of revenue and profits, and/or the Company being named as a defendant in lawsuits asserting large claims. The Company maintains insurance coverage it believes is adequate and customary to the oil and natural gas services industry to mitigate liabilities associated with these potential hazards. The Company does not have insurance against all foreseeable risks. Consequently, losses and liabilities arising from uninsured or underinsured events could have an adverse effect on the Company’s business, financial condition, and results of operations.
Regulatory pressures, environmental activism, and legislation could result in reduced demand for the Company’s products and services, increase the Company’s costs, and adversely affect the Company’s business, financial condition, and results of operations.
Regulations restricting volatile organic compounds (“VOC”) exist in many states and/or communities which limit demand for certain products. Although citrus oil is considered a VOC, its health, safety, and environmental profile is preferred over other solvents (e.g., BTEX), which is currently creating new market opportunities around the world. Changes in the perception of citrus oils as a preferred VOC, increased consumer activism against hydraulic fracturing or other regulatory or legislative actions by governments could potentially result in materially reduced demand for the Company’s products and services and could adversely affect the Company’s business, financial condition, and results of operations.
The Company is subject to complex foreign, federal, state, and local environmental, health, and safety laws and regulations, which expose the Company to liabilities that could adversely affect the Company’s business, financial condition, and results of operations.
The Company’s operations are subject to foreign, federal, state, and local laws and regulations related to, among other things, the protection of natural resources, injury, health and safety considerations, chemical exposure assessment, waste management, and transportation of waste and other hazardous materials. The Company’s operations expose the Company to risks of environmental liability that could result in fines,
penalties, remediation, property damage, and personal injury liability. In order to remain compliant with laws and regulations, the Company maintains permits, authorizations, registrations, and certificates as required from regulatory authorities. Sanctions for noncompliance with such laws and regulations could include assessment of administrative, civil and criminal penalties, revocation of permits, and issuance of corrective action orders.
The Company could incur substantial costs to ensure compliance with existing and future laws and regulations. Laws protecting the environment have generally become more stringent and are expected to continue to evolve and become more complex and restrictive into the future. Failure to comply with applicable laws and regulations could result in material expense associated with future environmental compliance and remediation. The Company’s costs of compliance could also increase if existing laws and regulations are amended or reinterpreted. Such amendments or reinterpretations of existing laws or regulations, or the adoption of new laws or regulations, could curtail exploratory or developmental drilling for, and production of, oil and natural gas which, in turn, could limit demand for the Company’s products and services. Some environmental laws and regulations could also impose joint and strict liability, meaning that the Company could be exposed in certain situations to increased liabilities as a result of the Company’s conduct that was lawful at the time it occurred or conduct of, or conditions caused by, prior operators or other third parties. Remediation expense and other damages arising as a result of such laws and regulations could be substantial and have a material adverse effect on the Company’s financial condition and results of operations.
Material levels of the Company’s revenue are derived from customers engaged in hydraulic fracturing services, a process that creates fractures extending from the well bore through the rock formation to enable natural gas or oil to flow more easily through the rock pores to a production well. Some states have adopted regulations which require operators to publicly disclose certain non-proprietary information. These regulations could require the reporting and public disclosure of the Company’s proprietary chemistry formulas. The adoption of any future federal or state laws or local requirements, or the implementation of regulations imposing reporting obligations on, or otherwise limiting, the hydraulic fracturing process, could increase the difficulty of oil and natural gas well production activity and could have an adverse effect on the Company’s future results of operations.
Regulation of greenhouse gases and/or climate change could have a negative impact on the Company’s business.
Certain scientific studies have suggested that emissions of certain gases, commonly referred to as “greenhouse gases,” which include carbon dioxide, methane, and other volatile organic compounds, may be contributory to the warming effect of the Earth’s atmosphere and other climatic changes. In response to such studies, the issue of climate change and the effect of greenhouse gas emissions, in particular emissions from fossil fuels, is attracting increasing worldwide attention.

10
For example, the Paris Agreement was signed in 2016, which sets forth a global framework to address climate change. However, in June 2017, the Trump Administration announced plans to withdraw from the Paris Agreement. Legislation and regulatory initiatives at the federal, regional, state, and local level have been considered and in some cases adopted in an effort to reduce greenhouse gases. Some states have individually or in regional cooperation imposed restrictions on greenhouse gas emissions under various policies and approaches, including establishing a cap on emissions, requiring efficiency measures, or providing incentives for pollution reduction, use of renewable energy sources, or use of replacement fuels with lower carbon content.
Existing or future laws, regulations, treaties, or international agreements related to greenhouse gases, climate change, and indoor air quality, including energy conservation or alternative energy incentives, could have a negative impact on the Company’s operations, if regulations resulted in a reduction in worldwide demand for oil, natural gas, and citrus oils. Other results could be increased compliance costs and additional operating restrictions, each of which could have a negative impact on the Company’s operations.
The Company and the Company’s customers are subject to risks associated with doing business outside of the U.S., including political risk, foreign exchange risk, and other uncertainties.
Revenue from the sale of products to customers outside the U.S. has been steadily increasing. The Company and its customers are subject to risks inherent in doing business outside of the U.S., including, but not limited to:
• governmental instability;• corruption;• war and other international conflicts;• civil and labor disturbances;• requirements of local ownership;• cartel behavior;• partial or total expropriation or nationalization;• currency devaluation; and• foreign laws and policies, each of which can limit the
movement of assets or funds or result in the deprivation of contractual rights or appropriation of property without fair compensation.
Collections from international customers and agents could also prove difficult due to inherent uncertainties in foreign law and judicial procedures. The Company could experience significant difficulty with collections or recovery due to the political or judicial climate in foreign countries where Company operations occur or in which the Company’s products are used.
The Company’s international operations must be compliant with the Foreign Corrupt Practices Act (the “FCPA”) and other
applicable U.S. laws. The Company could become liable under these laws for actions taken by employees or agents. Compliance with international laws and regulations could become more complex and expensive thereby creating increased risk as the Company’s international business portfolio grows. Further, the U.S. periodically enacts laws and imposes regulations prohibiting or restricting trade with certain nations. The U.S. government could also change these laws or enact new laws that could restrict or prohibit the Company from doing business in identified foreign countries. The Company conducts, and will continue to conduct, business in currencies other than the U.S. dollar. Historically, the Company has not hedged against foreign currency fluctuations. Accordingly, the Company’s profitability could be affected by fluctuations in foreign exchange rates.
The Company has no control over and can provide no assurances that future laws and regulations will not materially impact the Company’s ability to conduct international business.
The Company’s tax returns are subject to audit by tax authorities. Taxing authorities may make claims for back taxes, interest, and penalties.
The Company is subject to income, property, excise, employment, and other taxes in the U.S. and a variety of other jurisdictions around the world. Tax rules and regulations in the U.S. and around the world are complex and subject to interpretation. From time to time, taxing authorities conduct audits of the Company’s tax filings and may make claims for increased taxes and, in some cases, assess interest and penalties. The assessments for back taxes, interest, and penalties could be significant. If the Company is unsuccessful in contesting these claims, the resulting payments could result in a drain on the Company’s capital resources and liquidity.
Recent U.S. tax legislation, as well as future U.S. tax legislation, may adversely affect our business, results of operations, financial condition and cash flow.
Comprehensive tax reform legislation enacted in December 2017, commonly referred to as the Tax Cuts and Jobs Act (the “Tax Act”), made significant changes to U.S. federal income tax laws. The Tax Act, among other things, reduced the corporate income tax rate to 21%, partially limits the deductibility of business interest expense and net operating losses, imposes a one-time tax on unrepatriated earnings from certain foreign subsidiaries, taxes offshore earnings at reduced rates regardless of whether they are repatriated and allows the immediate deduction of certain new investments instead of deductions for depreciation expense over time. The Tax Act is complex and far-reaching, and the Company continues to evaluate the actual impact of its enactment on the Company. There may be material adverse effects resulting from the Tax Act that have not been identified and that could have an adverse effect on the Company’s business, results of operations, financial condition and cash flow.

11
Risks Related to the Company’s Industry
General economic declines (recessions), limits to credit availability, and industry specific factors could have an adverse effect on energy industry activity resulting in lower demand for the Company’s products and services.
Worldwide economic uncertainty can reduce the availability of liquidity and credit markets to fund the continuation and expansion of industrial business operations worldwide. The shortage of liquidity and credit combined with pressure on worldwide equity markets could continue to impact the worldwide economic climate. Geopolitical unrest around the world may also impact demand for the Company’s products and services both domestically and internationally.
Demand for the Company’s energy segment’s products and services is dependent on oil and natural gas industry activity and expenditure levels that are directly affected by trends in oil and natural gas prices. Demand for the Company’s energy products and services is particularly sensitive to levels of exploration, development, and production activity of, and the corresponding capital spending by, oil and natural gas companies, including national oil companies. One indication of drilling and completion activity and spending is rig count, which the Company monitors to gauge market conditions. In addition, the EIA and other industry data sources report completion activity which is utilized by the Company. Any prolonged reduction in oil and natural gas prices or drop in rig and/or completion count could depress current levels of exploration, development, and production activity. Perceptions of longer-term lower oil and natural gas prices by oil and natural gas companies could similarly reduce or defer major expenditures given the long-term nature of many large-scale development projects. Lower levels of activity could result in a corresponding decline in the demand for the Company’s oil and natural gas well products and services, which could have a material adverse effect on the Company’s revenue and profitability.
Events in global credit markets can significantly impact the availability of credit and associated financing costs for many of the Company’s customers. Many of the Company’s customers finance their drilling and completion programs through third-party lenders or public debt offerings. Lack of available credit or increased costs of borrowing could cause customers to reduce spending on drilling programs, thereby reducing demand and potentially resulting in lower prices for the Company’s products and services. Also, the credit and economic environment could significantly impact the financial condition of some customers over a prolonged period, leading to business disruptions and restricted ability to pay for the Company’s products and services. The Company’s forward-looking statements assume that the Company’s lenders, insurers, and other financial institutions will be able to fulfill their obligations under various credit agreements, insurance policies, and contracts. If any of the Company’s significant lenders, insurers and others are unable to perform under such agreements, and if the Company was unable to find suitable replacements at a reasonable cost, the
Company’s results of operations, liquidity, and cash flows could be adversely impacted.
A continuing period of depressed oil and natural gas prices could result in further reductions in demand for the Company’s products and services and adversely affect the Company’s business, financial condition, and results of operations.
The markets for oil and natural gas have historically been volatile. Such volatility in oil and natural gas prices, or the perception by the Company’s customers of unpredictability in oil and natural gas prices, could adversely affect spending levels. The oil and natural gas markets may be volatile in the future. The demand for the Company’s products and services is, in large part, driven by general levels of exploration and production spending and drilling activity by its customers. Future declines in oil or natural gas prices could adversely affect the Company’s business, financial condition, and results of operations.
New and existing competitors within the Company’s industry could have an adverse effect on results of operations.
The oil and natural gas industry is highly competitive. The Company’s principal competitors include numerous small companies capable of competing effectively in the Company’s markets on a local basis, as well as a number of large companies that possess substantially greater financial and other resources than does the Company. Larger competitors may be able to devote greater resources to developing, promoting, and selling products and services. The Company may also face increased competition due to the entry of new competitors including current suppliers that decide to sell their products and services directly to the Company’s customers. As a result of this competition, the Company could experience lower sales or greater operating costs, which could have an adverse effect on the Company’s margins and results of operations.
The Company’s industry has a high rate of employee turnover. Difficulty attracting or retaining personnel or agents could adversely affect the Company’s business.
The Company operates in an industry that has historically been highly competitive in securing qualified personnel with the required technical skills and experience. The Company’s services require skilled personnel able to perform physically demanding work. Due to industry volatility, the demanding nature of the work, and the need for industry specific knowledge and technical skills, current employees could choose to pursue employment opportunities outside the Company that offer a more desirable work environment and/or higher compensation than is offered by the Company. As a result of these competitive labor conditions, the Company may not be able to find qualified labor, which could limit the Company’s growth. In addition, the cost of attracting and retaining qualified personnel has increased over the past several years due to competitive pressures. In order to attract and retain qualified personnel, the Company may be required
12
to offer increased wages and benefits. If the Company is unable to increase the prices of products and services to compensate for increases in compensation, or is unable to attract and retain qualified personnel, operating results could be adversely affected.
Severe weather could have an adverse impact on the Company’s business.
The Company’s business could be materially and adversely affected by severe weather conditions. Hurricanes, tropical storms, flash floods, blizzards, cold weather, and other severe weather conditions could result in curtailment of services, damage to equipment and facilities, interruption in transportation of products and materials, and loss of productivity. If the Company’s customers are unable to operate or are required to reduce operations due to severe weather conditions, and as a result curtail purchases of the Company’s products and services, the Company’s business could be adversely affected.
A terrorist attack or armed conflict could harm the Company’s business.
Terrorist activities, anti-terrorist efforts, and other armed conflicts involving the U.S. could adversely affect the U.S. and global economies and could prevent the Company from meeting financial and other obligations. The Company could experience loss of business, delays or defaults in payments from payors, or disruptions of fuel supplies and markets if pipelines, production facilities, processing plants, or refineries are direct targets or indirect casualties of an act of terror or war. Such activities could reduce the overall demand for oil and natural gas which, in turn, could also reduce the demand for the Company’s products and services. Terrorist activities and the threat of potential terrorist activities and any resulting economic downturn could adversely affect the Company’s results of operations, impair the ability to raise capital, or otherwise adversely impact the Company’s ability to realize certain business strategies.
Risks Related to the Company’s Securities
The market price of the Company’s common stock has been and may continue to be volatile.
The market price of the Company’s common stock has historically been subject to significant fluctuations. The following factors, among others, could cause the price of the Company’s common stock to fluctuate significantly due to:
• variations in the Company’s quarterly results of operations;
• changes in market valuations of companies in the Company’s industry;
• fluctuations in stock market prices and volume;• fluctuations in oil and natural gas prices;• issuances of common stock or other securities in the
future;• additions or departures of key personnel;
• announcements by the Company or the Company’s competitors of new business, acquisitions, or joint ventures; and
• negative statements made by external parties, about the Company’s business, in public forums.
The stock market has experienced significant price and volume fluctuations in recent years that have affected the price of common stock of companies within many industries including the oil and natural gas industry. The price of the Company’s common stock could fluctuate based upon factors that have little to do with the Company’s operational performance, and these fluctuations could materially reduce the Company’s stock price. The Company could be a defendant in a legal case related to a significant loss of value for the shareholders. This could be expensive and divert management’s attention and Company resources, as well as have an adverse effect on the Company’s business, financial condition, and results of operations.
If the Company cannot meet the New York Stock Exchange continued listing requirements, the NYSE may delist the Company’s common stock.
The Company’s common stock is currently listed on the NYSE. In the future, if it is not able to meet the continued listing requirements of the NYSE, which require, among other things, that the average closing price of our common stock be above $1.00 over 30 consecutive trading days, the Company’s common stock may be delisted. The Company’s closing stock price on February 28, 2019 was $3.20, but on December 24, 2018, closed at a low of $1.01. If the Company is unable to satisfy the NYSE criteria for continued listing, its common stock would be subject to delisting. A delisting of its common stock could negatively impact the Company by, among other things, reducing the liquidity and market price of the its common stock; reducing the number of investors willing to hold or acquire the Company’s common stock, which could negatively impact its ability to raise equity financing; decreasing the amount of news and analyst coverage of the Company; and limiting the Company’s ability to issue additional securities or obtain additional financing in the future. In addition, delisting from the NYSE might negatively impact the Company’s reputation and, as a consequence, its business.
An active market for the Company’s common stock may not continue to exist or may not continue to exist at current trading levels.
Trading volume for the Company’s common stock historically has been very volatile when compared to companies with larger market capitalizations. The Company cannot presume that an active trading market for the Company’s common stock will continue or be sustained. Sales of a significant number of shares of the Company’s common stock in the public market could lower the market price of the Company’s stock.

13
The Company has no plans to pay dividends on the Company’s common stock, and, therefore, investors will have to look to stock appreciation for return on investments.
The Company does not anticipate paying any cash dividends on the Company’s common stock within the foreseeable future. The Company currently intends, subject to Board approval of recommendations by the Strategic Capital Committee described above, to retain future earnings to fund the development and growth of the Company’s business and to meet current debt obligations. Any payment of future dividends will be at the discretion of the Company’s board of directors and will depend, among other things, on the Company’s earnings, financial condition, capital requirements, level of indebtedness, statutory and contractual restrictions applying to the payment of dividends, and other considerations deemed relevant by the board of directors. Investors must rely on sales of common stock held after price appreciation, which may never occur, in order to realize a return on their investment.
Certain anti-takeover provisions of the Company’s charter documents and applicable Delaware law could discourage or prevent others from acquiring the Company, which may adversely affect the market price of the Company’s common stock.
The Company’s certificate of incorporation and bylaws contain provisions that:
• permit the Company to issue, without stockholder approval, up to 100,000 shares of preferred stock, in one or more series and, with respect to each series, to fix the designation, powers, preferences, and rights of the shares of the series;
• prohibit stockholders from calling special meetings;• limit the ability of stockholders to act by written
consent;• prohibit cumulative voting; and• require advance notice for stockholder proposals and
nominations for election to the board of directors to be acted upon at meetings of stockholders.
In addition, Section 203 of the Delaware General Corporation Law limits business combinations with owners of more than 15% of the Company’s stock without the approval of the board of directors. Aforementioned provisions and other similar provisions make it more difficult for a third party to acquire the Company exclusive of negotiation. The Company’s board of directors could choose not to negotiate with an acquirer deemed not beneficial to or synergistic with the Company’s strategic outlook. If an acquirer were discouraged from offering to acquire the Company or prevented from successfully completing a hostile acquisition by these anti-takeover measures, stockholders could lose the opportunity to sell their shares at a favorable price.
Future issuance of additional shares of common stock could cause dilution of ownership interests and adversely affect the Company’s stock price.
The Company is currently authorized to issue up to 80,000,000shares of common stock. The Company may, in the future, issue previously authorized and unissued shares of common stock, which would result in the dilution of current stockholders ownership interests. Additional shares are subject to issuance through various equity compensation plans or through the exercise of currently outstanding options. The potential issuance of additional shares of common stock may create downward pressure on the trading price of the Company’s common stock. The Company may also issue additional shares of common stock or other securities that are convertible into or exercisable for common stock in order to raise capital or effectuate other business purposes. Future sales of substantial amounts of common stock, or the perception that sales could occur, could have an adverse effect on the price of the Company’s common stock.
The Company filed a “universal” shelf registration on September 21, 2017, to permit the ability to sell securities to the public in a timely manner and which it expects to keep active.
The Company may issue shares of preferred stock or debt securities with greater rights than the Company’s common stock.
Subject to the rules of the NYSE, the Company’s certificate of incorporation authorizes the board of directors to issue one or more additional series of preferred stock and to set the terms of the issuance without seeking approval from holders of common stock. Currently, there are 100,000 preferred shares authorized, with no shares currently outstanding. Any preferred stock that is issued may rank senior to common stock in terms of dividends, priority and liquidation premiums, and may have greater voting rights than holders of common stock.
The Company’s ability to use net operating loss carryforwards and tax attribute carryforwards to offset future taxable income may be limited as a result of transactions involving the Company’s common stock.
Under section 382 of the Internal Revenue Code of 1986, as amended, a corporation that undergoes an “ownership change” is subject to limitations on the Company’s ability to utilize pre-change net operating losses (“NOLs”), and certain other tax attributes to offset future taxable income. In general, an ownership change occurs if the aggregate stock ownership of certain stockholders increases by more than 50 percentage points over such stockholders’ lowest percentage ownership during the testing period (generally three years). An ownership change could limit the Company’s ability to utilize existing NOLs and tax attribute carryforwards for taxable years including or following an identified “ownership change.” Transactions involving the Company’s common stock, even those outside the Company’s control, such as purchases or sales by investors, within the testing period could result in an “ownership change.” In addition, under the Tax Act, the ability to carry back NOLs to prior taxable years is generally eliminated, and while NOLs arising in tax years beginning after 2017 may be carried forward indefinitely, these post-2017 NOLs may only reduce 80% of the Company’s

14
taxable income in a tax year. Limitations imposed on the ability to use NOLs and tax credits to offset future taxable income could reduce or eliminate the benefit of the NOLs and tax attributes and could require the Company to pay U.S. federal income taxes in excess of that which would otherwise be required if such limitations were not in effect. Similar rules and limitations may apply for state income tax purposes.
Disclaimer of Obligation to Update
Except as required by applicable law or regulation, the Company assumes no obligation (and specifically disclaims any such obligation) to update these risk factors or any other forward-looking statement contained in this Annual Report to reflect actual results, changes in assumptions, or other factors affecting such forward-looking statements.
Item 1B. Unresolved Staff Comments.
Not applicable.
Item 2. Properties.
At December 31, 2018, the Company operated 16 manufacturing, warehouse, and research facilities in 7 U.S. states, one research facility in Calgary, Alberta, and sales offices in Tokyo, Japan and Dubai, United Arab Emirates. The Company owns 5 of these facilities and the remainder are leased with lease terms that expire from 2019 through 2037. In addition, the Company’s corporate office is a leased facility located in Houston, Texas. The following table sets forth facility locations:
SegmentOwned/Leased Location
Energy Chemistry Technologies Owned Marlow, Oklahoma
Owned Monahans, TexasOwned Raceland, LouisianaOwned Waller, TexasLeased Calgary, AlbertaLeased Canonsburg, PennsylvaniaLeased Denver, Colorado
SegmentOwned/Leased Location
Energy Chemistry Technologies Leased Dubai, United Arab Emirates
Leased Houston, TexasLeased Midland, TexasLeased Natoma, KansasLeased Oklahoma City, OklahomaLeased Raceland, Louisiana
Discontinued OperationsConsumer and Industrial Chemistry Technologies Owned Winter Haven, Florida
Leased Tokyo, JapanDrilling Technologies Leased Wysox, Pennsylvania
The Company considers owned and leased facilities to be in good condition and suitable for the conduct of business.
Item 3. Legal Proceedings.
Class Action Litigation
On March 30, 2017, the U.S. District Court for the Southern District of Texas granted the Company’s motion to dismiss the four consolidated putative securities class action lawsuits that were filed in November 2015, against the Company and certain of its officers. The lawsuits were previously consolidated into a single case, and a consolidated amended complaint had been filed. The consolidated amended complaint asserted that the Company made false and/or misleading statements, as well as failed to disclose material adverse facts about the Company’s business, operations, and prospects. The complaint sought an award of damages in an unspecified amount on behalf of a putative class consisting of persons who purchased the Company’s common stock between October 23, 2014 and November 9, 2015, inclusive. The lead plaintiff has appealed the District Court’s decision granting the motion to dismiss. On February 7, 2019, a three-judge panel of the United States Court of Appeals for the Fifth
Circuit issued a unanimous opinion affirming the District Court’s judgment of dismissal in its entirety.
In January 2016, three derivative lawsuits were filed, two in the District Court of Harris County, Texas (which have since been consolidated into one case), and one in the United States District Court for the Southern District of Texas, on behalf of the Company against certain of its officers and its current directors. The lawsuits allege violations of law, breaches of fiduciary duty, and unjust enrichment against the defendants.
The Company believes the lawsuits are without merit and intends to vigorously defend against all claims asserted. Discovery has not yet commenced. At this time, the Company is unable to reasonably estimate the outcome of this litigation.
In addition, as previously disclosed, the U.S. Securities and Exchange Commission had opened an inquiry related to similar issues to those raised in the above-described litigation. On August 21, 2017, the Company received a letter from the

15
staff of the SEC stating that the inquiry has been concluded and that the staff does not intend to recommend an enforcement action against the Company.
Other Litigation
The Company is subject to routine litigation and other claims that arise in the normal course of business. Management is not
aware of any pending or threatened lawsuits or proceedings that are expected to have a material effect on the Company’s financial position, results of operations or liquidity.
Item 4. Mine Safety Disclosures.
Not applicable.

16
PART II
Item 5. Market for Registrant’s Common Equity, Related Stockholder Matters and Issuer Purchases of Equity Securities.
The Company’s common stock began trading on the NYSE on December 27, 2007, under the stock ticker symbol “FTK.” As of the close of business on February 28, 2019, there were 57,350,015 shares of common stock outstanding held by approximately 9,800 holders of record. The Company’s closing sale price of the common stock on the NYSE on February 28, 2019 was $3.20. The Company has never declared or paid cash dividends on common stock. While the
Company regularly assesses the dividend policy, the Company has no current plans to declare dividends on its common stock and intends, subject to Board approval of recommendations by the Strategic Capital Committee described in Part I, Item 1A – “Risk Factors” of this Annual Report, to continue to use earnings and other cash in the maintenance and expansion of its business.
Securities Authorized for Issuance Under Equity Compensation Plans
Equity compensation plan information relating to equity securities authorized for issuance under individual compensation agreements at December 31, 2018 is as follows:
Plan Category
Number of Securities to beIssued Upon Exercise of
Outstanding Options,Warrants and Rights(1)
Weighted-Average Exercise
Price of OutstandingOptions, Warrants
and Rights(2)
Number of SecuritiesRemaining Available forFuture Issuance Under
Equity Compensation Plans(Excluding Securities
Reflected in Column(a)) (a) (b) (c)
Equity compensation plansapproved by security holders 1,352,138 $ — 1,492,737
Equity compensation plans notapproved by security holders — $ — —Total 1,352,138 $ — 1,492,737
(1) Includes shares for outstanding stock options (0 shares), restricted stock awards (1,050,372 shares), and restricted stock unit share equivalents (301,766 shares).
(2) The weighted-average exercise price is for outstanding stock options only and does not include outstanding restricted stock awards or restricted stock unit share equivalents that have no exercise price.
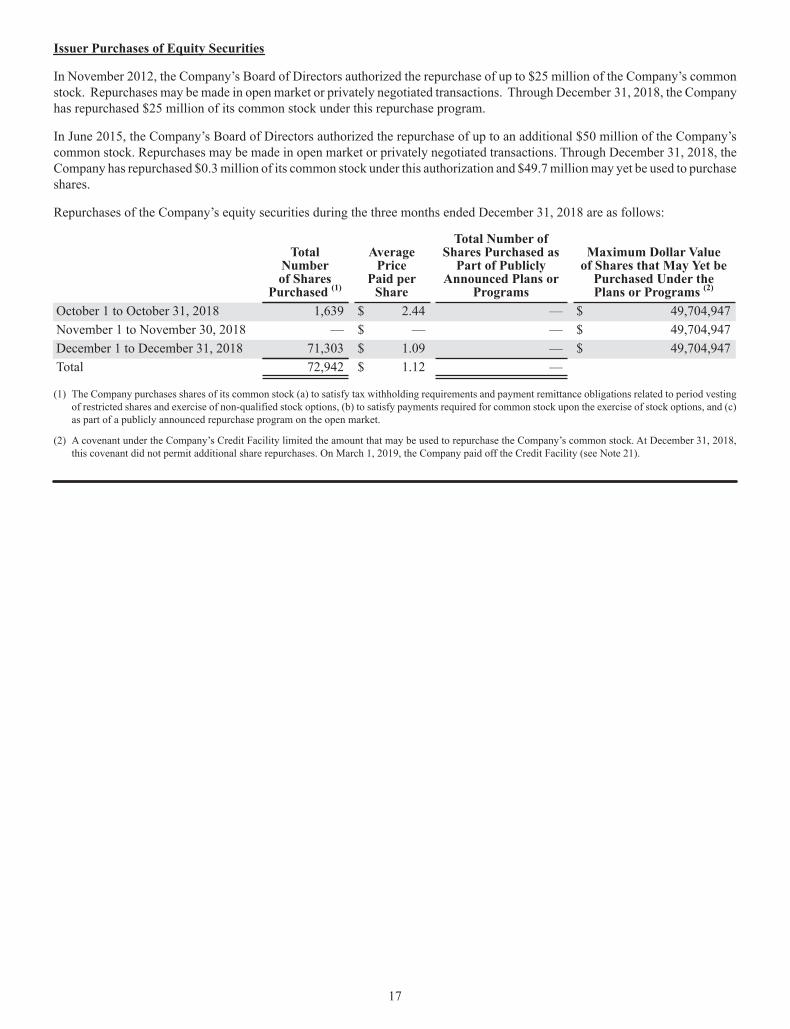
17
Issuer Purchases of Equity Securities
In November 2012, the Company’s Board of Directors authorized the repurchase of up to $25 million of the Company’s common stock. Repurchases may be made in open market or privately negotiated transactions. Through December 31, 2018, the Company has repurchased $25 million of its common stock under this repurchase program.
In June 2015, the Company’s Board of Directors authorized the repurchase of up to an additional $50 million of the Company’s common stock. Repurchases may be made in open market or privately negotiated transactions. Through December 31, 2018, the Company has repurchased $0.3 million of its common stock under this authorization and $49.7 million may yet be used to purchase shares.
Repurchases of the Company’s equity securities during the three months ended December 31, 2018 are as follows:
Total Numberof Shares
Purchased (1)
Average Price
Paid per Share
Total Number ofShares Purchased as
Part of PubliclyAnnounced Plans or
Programs
Maximum Dollar Valueof Shares that May Yet be
Purchased Under thePlans or Programs (2)
October 1 to October 31, 2018 1,639 $ 2.44 — $ 49,704,947November 1 to November 30, 2018 — $ — — $ 49,704,947December 1 to December 31, 2018 71,303 $ 1.09 — $ 49,704,947Total 72,942 $ 1.12 —
(1) The Company purchases shares of its common stock (a) to satisfy tax withholding requirements and payment remittance obligations related to period vesting of restricted shares and exercise of non-qualified stock options, (b) to satisfy payments required for common stock upon the exercise of stock options, and (c) as part of a publicly announced repurchase program on the open market.
(2) A covenant under the Company’s Credit Facility limited the amount that may be used to repurchase the Company’s common stock. At December 31, 2018, this covenant did not permit additional share repurchases. On March 1, 2019, the Company paid off the Credit Facility (see Note 21).

18
Item 6. Selected Financial Data.
The following table sets forth certain selected historical financial data and should be read in conjunction with Part II, Item 7 – “Management’s Discussion and Analysis of Financial Condition and Results of Operations” and Part II, Item 8 – “Financial Statements and Supplementary Data” of this Annual Report. The selected operating and financial position data as of and for each of the five years presented has been derived from audited consolidated Company financial statements, some of which appear elsewhere in this Annual Report. Financial data has been adjusted for discontinued operations, as indicated.
During the fourth quarter of 2018, the Company initiated a strategic plan to sell its Consumer and Industrial Chemistry Technologies segment, which was completed in the first quarter of 2019. An investment banking advisory services firm was engaged and actively marketed this segment. Effective December 31, 2018, the Company has classified the assets, liabilities, and results of operations for this segment as “Discontinued Operations” for all periods presented.
During the fourth quarter of 2016, the Company initiated a strategic restructuring of its business to enable a greater focus on its core businesses in energy chemistry and consumer and industrial chemistry. During 2017, the Company completed the sale or disposal of the assets and transfer or liquidation of liabilities and obligations of each of the Drilling Technologies and Production Technologies segments. The Company has classified the assets, liabilities, and results of operations for these two segments as “Discontinued Operations” for all periods presented.
During 2016 and 2015, the Company made one small acquisition each year, and in 2014, the Company made two small acquisitions. Insignificant non-recurring charges were incurred related to these acquisitions. The net income and non-recurring charges related to these acquisitions do not materially affect comparability.
Impairments recognized in 2016 and 2015 relate to the Drilling Technologies and Production Technologies segments and, therefore, are included in discontinued operations.
As of and for the year ended December 31, 2018 2017 2016 2015 2014 (in thousands, except per share data)Operating Data
Revenue (1) $ 177,773 $ 243,106 $ 188,233 $ 213,593 $ 268,761(Loss) income from operations (1) (69,811) (10,320) (16,968) 3,536 52,057
(Loss) income from continuing operations (1) $ (73,441) $ (17,504) $ (4,447) $ 1,489 $ 33,260Income (loss) from discontinued operations, net of tax 2,743 (9,891) (44,683) (14,951) 20,343Net (loss) income $ (70,698) $ (27,395) $ (49,130) $ (13,462) $ 53,603
(1) Amounts exclude impact of discontinued operations.
Per Share DataBasic earnings (loss) per share:
Continuing operations $ (1.26) $ (0.30) $ (0.08) $ 0.03 $ 0.61Discontinued operations, net of tax 0.05 (0.17) (0.80) (0.27) 0.37
Basic earnings (loss) per share $ (1.21) $ (0.47) $ (0.88) $ (0.24) $ 0.98Diluted earnings (loss) per share:
Continuing operations $ (1.26) $ (0.30) $ (0.08) $ 0.03 $ 0.60Discontinued operations, net of tax 0.05 (0.17) (0.80) (0.27) 0.37
Diluted earnings (loss) per share $ (1.21) $ (0.47) $ (0.88) $ (0.24) $ 0.97
Financial Position DataTotal assets $ 285,883 $ 329,888 $ 383,215 $ 403,090 $ 423,276Convertible senior notes, long-term debt, and capital lease obligations, less discount and current portion — — 7,833 18,255 25,398Stockholders’ equity 201,624 264,900 287,343 293,651 306,003

19
Item 7. Management’s Discussion and Analysis of Financial Condition and Results of Operations. The following discussion and analysis should be read in conjunction with the Consolidated Financial Statements and the related Notes to the Consolidated Financial Statements included elsewhere in this Annual Report. The following information contains forward-looking statements, which are subject to risks and uncertainties. Should one or more of these risks or uncertainties materialize, actual results could differ from those expressed or implied by the forward-looking statements. See “Forward-Looking Statements” at the beginning of this Annual Report.
Basis of Presentation
During the fourth quarter of 2018, the Company classified the Consumer and Industrial Chemistry Technologies segment as held for sale based on management’s intention to sell this business. During the fourth quarter of 2016, the Company also classified the Drilling Technologies and Production Technologies segments as held for sale based on management’s intention to sell these businesses. The Company’s historical financial statements have been revised to present the operating results of the Consumer and Industrial Chemistry Technologies, Drilling Technologies, and Production Technologies segments as discontinued operations. The results of operations of these segments are presented as “Loss from discontinued operations” in the statement of operations and the related cash flows of these segments has been reclassified to discontinued operations for all periods presented. The assets and liabilities of these segments have been reclassified to “Assets held for sale” and “Liabilities held for sale”, respectively, in the consolidated balance sheet for all periods presented, as applicable.
During 2017, the Company completed the sale or disposal of the assets and transfer or liquidation of liabilities and obligations of the Drilling Technologies and Production Technologies segments.
Results of operations of the Consumer and Industrial Chemistry Technologies segment for the years ended December 31, 2018, 2017, and 2016 are discussed below. Results of operations of the Drilling Technologies and Production Technologies segments for the year ended December 31, 2016 are discussed below.
Executive Summary
Flotek is a global, diversified, technology-driven company that develops and supplies chemistries and services to the oil and gas industries. Flotek also supplied high value compounds to companies that make food and beverages, cleaning products, cosmetics, and other products that are sold in consumer and industrial markets, classified as discontinued operations at December 31, 2018. Flotek operates in over 20 domestic and international markets.
The Company’s oilfield business includes specialty chemistries and logistics which enable its customers in pursuing improved efficiencies in the drilling and completion of their wells. Customers include major integrated oil and gas (“O&G”) companies, oilfield services companies, independent O&G companies, pressure-pumping service companies, national and state-owned oil companies, and international supply chain management companies. The Company also produced non-energy-related citrus oil and related products, classified as discontinued operations at December 31, 2018, including (1) high value compounds used as additives by companies in the flavors and fragrances markets and (2) environmentally friendly chemistries for use in numerous industries around the world, including the O&G industry. Additionally, the Company also provides automated bulk material handling, loading facilities, and blending capabilities.
Continuing Operations
The operations of the Company are categorized into one reportable segment: Energy Chemistry Technologies.
• Energy Chemistry Technologies designs, develops, manufactures, packages, and markets specialty chemistries used in O&G well drilling, cementing, completion, and stimulation. These technologies developed by Flotek’s Research and Innovation team enable customers to pursue improved efficiencies in the drilling and completion of wells.
Discontinued Operations
In 2018, the Consumer and Industrial Chemistry Technologies segment qualified for classification as a discontinued operation. The Drilling Technologies and Production Technologies segments were sold during 2017 and are classified as discontinued operations, as well.
• Consumer and Industrial Chemistry Technologies designed, developed, and manufactured products that are sold to companies in the flavor and fragrance industries and specialty chemical industry. These technologies are used by beverage and food companies, fragrance companies, and companies providing household and industrial cleaning products.
• Drilling Technologies assembled, rented, sold, inspected, and marketed downhole drilling equipment used in energy, mining, and industrial drilling activities.
• Production Technologies assembled and marketed production-related equipment, including pumping system components, electric submersible pumps (“ESP”), gas separators, valves, and services that support natural gas and oil production activities.

20
Market Conditions
The Company’s success is sensitive to a number of factors, which include, but are not limited to, drilling and well completion activity, customer demand for its advanced technology products, market prices for raw materials, and governmental actions.
Drilling and well completion activity levels are influenced by a number of factors, including the number of rigs in operation and the geographical areas of rig activity. Additional factors that influence the level of drilling and well completion activity include:
• Historical, current, and anticipated future O&G prices,
• Federal, state, and local governmental actions that may encourage or discourage drilling activity,
• Customers’ strategies relative to capital funds allocations,
• Weather conditions, and• Technological changes to drilling and completion
methods and economics.
Historical North American drilling activity is reflected in “TABLE A” below.
Customers’ demand for advanced technology products and services provided by the Company are dependent on their recognition of the value of:
• Chemistries that improve the economics of their O&G operations,
• Chemistries that meet the need of consumer product markets, and
• Chemistries that are economically viable, socially responsible, and ecologically sound.
Market prices for commodities, including citrus oils, can be influenced by:
• Historical, current, and anticipated future production levels of the global citrus (primarily orange) crops,
• Weather related risks,• Health and condition of citrus trees (e.g., disease and
pests), and• International competition and pricing pressures
resulting from natural and artificial pricing influences.
Governmental actions may restrict the future use of hazardous chemicals, including, but not limited to, the following industrial applications:
• O&G drilling and completion operations,• O&G production operations, and• Non-O&G industrial solvents.
TABLE A2018 2017 2016
2018 vs. 2017% Change
2017 vs. 2016% Change
Average North American Active Drilling RigsUnited States 1,032 876 509 17.8 % 72.1%Canada 191 206 130 (7.3)% 58.5%
Total 1,223 1,082 639 13.0 % 69.3%Average U.S. Active Drilling Rigs by Type
Vertical 63 70 60 (10.0)% 16.7%Horizontal 900 736 400 22.3 % 84.0%Directional 69 70 49 (1.4)% 42.9%
Total 1,032 876 509 17.8 % 72.1%Average North American Drilling Rigs by Product
Oil 961 812 471 18.3 % 72.4%Natural Gas 262 270 168 (3.0)% 60.7%
Total 1,223 1,082 639 13.0 % 69.3%
Source: Rig counts are per Baker Hughes (www.bakerhughes.com); Rig counts are the annual average of the reported weekly rig count activity.

21
Source: Rig counts are per Baker Hughes (www.bakerhughes.com); Rig counts are the annual average of the reported weekly rig count activity.Completions are per the U.S. Energy Information Administration (https://www.eia.gov/petroleum/drilling/) as of January 22, 2019.
Average U.S. rig activity increased by 17.8% in 2018 compared to 2017, and increased 72.1% from 2016 to 2017.
According to data collected by the U.S. Energy Information Administration (“EIA”) as reported on January 22, 2019, completions in the seven most prolific areas in the lower 48 states increased 25.4% in 2018 compared to 2017 and decreased 43.2% from 2016 to 2017.
Outlook for 2019
After a continuous decline in U.S. drilling activity beginning in mid-2014, the market began to gradually recover in the second quarter of 2016. Although oil and gas markets have improved, the level of drilling and completion activity remains lower than previous levels experienced before the downturn in 2014. Assuming the price for crude oil remains relatively stable and regulatory impediments are limited, the Company expects global oilfield activity to remain stable heading into 2019.
During 2018, the Company continued to analyze and promote the efficacy of its Complex nano-Fluid® (“CnF®”) chemistries and its Prescriptive Chemistry Management® (“PCM®”) offering. Although quarter-to-quarter performance may vary, the Company expects to continue to penetrate the market over time by demonstrating the efficacy of its CnF® chemistries and reservoir-centric full fluid systems via PCM®. The Company will continue to demonstrate the value and benefit of Flotek chemistries through comparative analysis of wells with and without Flotek chemistries and field validation results conducted in partnership with exploration and production (“E&P”) companies. Flotek is experiencing a notable shift in purchasing behaviors in which E&P companies are seeking
greater transparency, control and efficacy in their fluid systems, as they see diminishing returns on mechanical factors in their completion designs, such as proppant loading, fluid loading, and lateral length in their completion. As a result, they are focusing more on sourcing consumables, including chemistry, directly from manufacturers and providers of these products. This trend has created significant changes in Flotek’s customer base, product portfolio, and sales efforts and continues to influence changes in inventory and distribution strategies, capital allocation, and the business model for the Company. While these challenges are expected to persist in the near-term, the Company believes it can grow its client base and revenue opportunities over time. Additionally during the third quarter, the Company experienced increased demand for its products internationally, as unconventional activity has increased outside of the U.S. and international spending has begun to recover.
The Company continues to enhance and improve its patented and proven chemistries through its industry leading research and innovation staff who develop innovative and customer- responsive products, as well as create new chemistry technologies, which are expected to address oilfield challenges of the future and expand the Company’s future product lines. Completed in 2016, the Company’s Global Research & Innovation Center in Houston houses scientists, chemists, geologists, and reservoir, petroleum and geomechanical engineers who advance the development of next-generation innovative energy chemistries, as well as expanded collaboration among clients, leaders from academia, and Company scientists. These collaborative opportunities are an important and distinguishing capability within the industry and provide real-time product and fluid system development direct to the consumer.
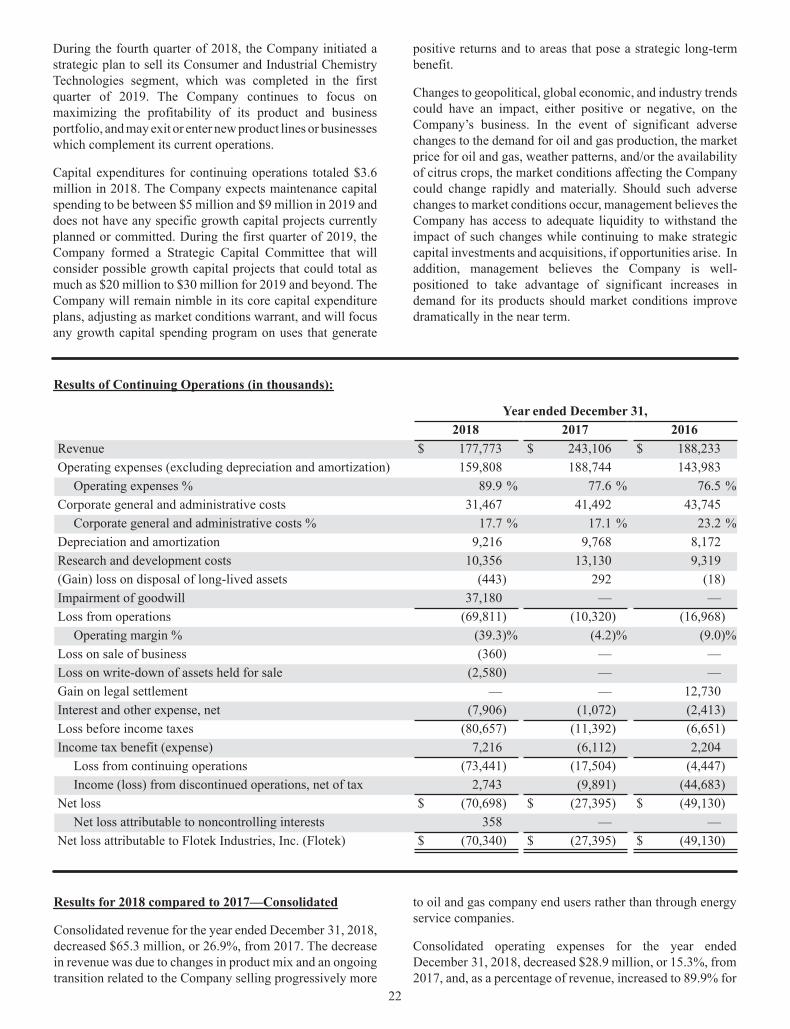
22
During the fourth quarter of 2018, the Company initiated a strategic plan to sell its Consumer and Industrial Chemistry Technologies segment, which was completed in the first quarter of 2019. The Company continues to focus on maximizing the profitability of its product and business portfolio, and may exit or enter new product lines or businesses which complement its current operations.
Capital expenditures for continuing operations totaled $3.6 million in 2018. The Company expects maintenance capital spending to be between $5 million and $9 million in 2019 and does not have any specific growth capital projects currently planned or committed. During the first quarter of 2019, the Company formed a Strategic Capital Committee that will consider possible growth capital projects that could total as much as $20 million to $30 million for 2019 and beyond. The Company will remain nimble in its core capital expenditure plans, adjusting as market conditions warrant, and will focus any growth capital spending program on uses that generate
positive returns and to areas that pose a strategic long-term benefit.
Changes to geopolitical, global economic, and industry trends could have an impact, either positive or negative, on the Company’s business. In the event of significant adverse changes to the demand for oil and gas production, the market price for oil and gas, weather patterns, and/or the availability of citrus crops, the market conditions affecting the Company could change rapidly and materially. Should such adverse changes to market conditions occur, management believes the Company has access to adequate liquidity to withstand the impact of such changes while continuing to make strategic capital investments and acquisitions, if opportunities arise. In addition, management believes the Company is well-positioned to take advantage of significant increases in demand for its products should market conditions improve dramatically in the near term.
Results of Continuing Operations (in thousands):
Year ended December 31, 2018 2017 2016Revenue $ 177,773 $ 243,106 $ 188,233Operating expenses (excluding depreciation and amortization) 159,808 188,744 143,983
Operating expenses % 89.9 % 77.6 % 76.5 %Corporate general and administrative costs 31,467 41,492 43,745
Corporate general and administrative costs % 17.7 % 17.1 % 23.2 %Depreciation and amortization 9,216 9,768 8,172Research and development costs 10,356 13,130 9,319(Gain) loss on disposal of long-lived assets (443) 292 (18)Impairment of goodwill 37,180 — —Loss from operations (69,811) (10,320) (16,968)
Operating margin % (39.3)% (4.2)% (9.0)%Loss on sale of business (360) — —Loss on write-down of assets held for sale (2,580) — —Gain on legal settlement — — 12,730Interest and other expense, net (7,906) (1,072) (2,413)Loss before income taxes (80,657) (11,392) (6,651)Income tax benefit (expense) 7,216 (6,112) 2,204
Loss from continuing operations (73,441) (17,504) (4,447)Income (loss) from discontinued operations, net of tax 2,743 (9,891) (44,683)
Net loss $ (70,698) $ (27,395) $ (49,130)Net loss attributable to noncontrolling interests 358 — —
Net loss attributable to Flotek Industries, Inc. (Flotek) $ (70,340) $ (27,395) $ (49,130)
Results for 2018 compared to 2017—Consolidated
Consolidated revenue for the year ended December 31, 2018, decreased $65.3 million, or 26.9%, from 2017. The decrease in revenue was due to changes in product mix and an ongoing transition related to the Company selling progressively more
to oil and gas company end users rather than through energy service companies.
Consolidated operating expenses for the year ended December 31, 2018, decreased $28.9 million, or 15.3%, from 2017, and, as a percentage of revenue, increased to 89.9% for

23
the year ended December 31, 2018, from 77.6% in 2017. The decrease in expenses was primarily attributable to decreased sales, lower stock compensation expense, and decreased headcount, partially offset by increased freight and other direct costs associated with manufacturing.
Corporate general and administrative (“CG&A”) expenses are not directly attributable to products sold or services provided. CG&A costs decreased $10.0 million, or 24.2%, for the year ended December 31, 2018, from 2017. As a percentage of revenue, CG&A rose from 17.1% to 17.7% for the year ended December 31, 2018, compared to 2017. The decrease in CG&A costs was primarily due to aggressive cost reduction measures which began in the last quarter of 2017, as well as lower incentive and stock compensation expense.
Depreciation and amortization expense for the year ended December 31, 2018, decreased by $0.6 million, or 5.7%, from 2017.
Research and Innovation (“R&I”) expense for the year ended December 31, 2018, decreased $2.8 million, or 21.1%, from 2017. The decrease in R&I is primarily attributable to reallocating personnel into operational roles.
During the second quarter of 2018, the Company recognized a goodwill impairment charge of $37.2 million in the Energy Chemistry Technologies reporting unit, which resulted from sustained under-performance, lower expectations, and additional risks associated with the reporting unit.
During the second quarter of 2018, the Company committed to a plan to divest the revenue generating assets associated with the Dalton, Georgia facility within the Energy Chemistry Technologies segment. As a result of this planned divestiture, the Company recorded a loss on write-down of assets held for sale of $2.6 million for the three months ended June 30, 2018. During the third quarter of 2018, the Company completed the sale and recorded a loss on the sale of the business of $0.4 million for the three months ended September 30, 2018.
Interest and other expense increased $6.8 million for the year ended December 31, 2018, compared to 2017, primarily due to $1.2 million and $1.9 million write-offs associated with the discontinuation of certain corporate projects during the second and fourth quarter of 2018, respectively, expenses related to winding down of certain business ventures, changes in foreign currency exchange rates, and increased borrowings on the revolving credit facility throughout 2018.
The Company recorded an income tax benefit of $7.2 million, yielding an effective tax benefit rate of 8.9%, for the year ended December 31, 2018, compared to an income tax provision of $6.1 million, yielding an effective tax rate of 53.7%, in 2017. In the second quarter of 2018, the Company determined that it was more likely than not that it will not realize the benefits of its gross deferred tax assets and, therefore, recorded a $15.5 million valuation allowance against the carrying value of net deferred tax assets. As all available evidence should be taken into consideration when assessing the need for a valuation
allowance, the subsequent events that occurred in the first quarter of 2019 (Note 21) provided a source of income to support the release of $11.5 million of the valuation allowance. As such, the Company reversed this portion of the valuation allowance during the fourth quarter of 2018.
During the fourth quarter of 2018, the Company initiated a strategic plan to sell its Consumer and Industrial Chemistry Technologies segment, which was completed in the first quarter of 2019. The Company recorded net income from discontinued operations of $2.7 million for the year ended December 31, 2018 for the classification of this segment as held for sale. The completion of this sale is expected to occur in the first quarter of 2019.
Results for 2017 compared to 2016—Consolidated
Consolidated revenue for the year ended December 31, 2017, increased $54.9 million, or 29.2%, from 2016. The increase in revenue was driven by the upturn in oilfield market activity.
Consolidated operating expenses for the year ended December 31, 2017, increased $44.8 million, or 31.1%, from 2016, and, as a percentage of revenue, increased to 77.6% for the year ended December 31, 2017, from 76.5% in 2016. These increases were primarily attributable to increased sales and associated headcount, as well as increased inventory, freight, and other direct costs associated with manufacturing.
CG&A expenses are not directly attributable to products sold or services provided. CG&A costs decreased $2.3 million, or 5.2%, for the year ended December 31, 2017 from 2016. As a percentage of revenue, CG&A declined from 23.2% to 17.1% for the year ended December 31, 2017, compared to 2016. The decrease in CG&A costs was primarily due to lower legal expenses and stock compensation expense, partially offset by costs associated with executive retirement.
Depreciation and amortization expense for the year ended December 31, 2017, increased $1.6 million, or 19.5%, from 2016. This increase was primarily attributable to the completion and equipping of the Global Research & Innovation Center in August 2016, along with other improvements to manufacturing facilities.
Research and Innovation (“R&I”) expense for the year ended December 31, 2017, increased $3.8 million, or 40.9%, from 2016. The increase in R&I is primarily attributable to increased personnel for new product development and Flotek’s commitment to remaining responsive to customer needs, increased demand, continued growth and refining of existing product lines, and the development of new chemistries which are expected to expand the Company’s intellectual property portfolio.
Interest and other expense decreased $1.3 million, or 55.6%, for the year ended December 31, 2017, compared to 2016, primarily due to the repayment of the term loan in May 2017, as well as decreasing the outstanding balance of the revolving credit facility throughout 2017.

24
The Company recorded an income tax provision of $6.1 million, yielding an effective tax provision rate of 53.7%, for the year ended December 31, 2017, compared to an income tax benefit of $2.2 million, yielding an effective tax benefit rate of 33.1%, in 2016.
As part of the Company’s strategic restructuring of its business to enable a greater focus on its core businesses in energy chemistry and consumer and industrial chemistry, the Company completed the sale or disposal of the assets and transfer or liquidation of liabilities and obligations of the Drilling Technologies and Production Technologies segments during 2017. The Company recorded a net loss from discontinued operations of $14.3 million for the year ended December 31, 2017.
Results by Segment
Energy Chemistry Technologies (“ECT”)(dollars in thousands) Year ended December 31,
2018 2017 2016Revenue $ 177,773 $ 243,106 $ 188,233(Loss) income from operations (36,817) 33,611 29,014Income from operations - excluding impairment 363 33,611 29,014
Operating margin % - excluding impairment 0.2% 13.8% 15.4 %
Results for 2018 compared to 2017—Energy Chemistry Technologies
ECT revenue for the year ended December 31, 2018, decreased $65.3 million, or 26.9%, from 2017, compared to a 25.4% increase in completion activity as measured by the EIA. ECT’s under-performance when compared to these market indicators was primarily attributable to product mix and an ongoing transition related to the Company selling progressively more to oil and gas company end users rather than through energy service companies.
Income from operations for the ECT segment decreased $70.4 million for the year ended December 31, 2018, compared to 2017, partially due to the $37.2 million goodwill impairment charge taken in the second quarter of 2018. Income from operations, excluding impairment, decreased $33.2 million, or 98.9%, for the year ended December 31, 2018, compared to 2017. This decrease is primarily a result of gross margin compression caused by reduced sales activity coupled with increases in material and labor costs, inventory reserve adjustments, and higher logistics expenditures, partially offset by a reduction in overhead expenses.
Results for 2017 compared to 2016—Energy Chemistry Technologies
ECT revenue for the year ended December 31, 2017, increased $54.9 million, or 29.2%, from 2016, compared to a 39.9% increase in completion activity as measured by the EIA. ECT performed along these market indicators by continuing to promote the benefits of its CnF® chemistries. Revenues increased with the increased customer demand resulting from improved oilfield market conditions.
Income from operations for the ECT segment increased $4.6 million, or 15.8%, for the year ended December 31, 2017, compared to 2016. This increase is primarily attributable to an increase in gross profit, increased activity associated with sales and marketing efforts in pursuit of growth opportunities, and cost reductions. The Company continues its commitment to research and innovation efforts within Energy Chemistry Technologies.
Discontinued Operations
During the fourth quarter of 2018, the Company classified the Consumer and Industrial Chemistry Technologies segment as held for sale based on management’s intention to sell the business. In addition, during the fourth quarter of 2016, the Company classified the Drilling Technologies and Production Technologies segments as held for sale based on management’s intention to sell these businesses. The Company’s historical financial statements have been revised to present the operating results of the Consumer and Industrial
Chemistry Technologies, Drilling Technologies, and Production Technologies segments as discontinued operations.
During 2017, the Company completed the sale or disposal of the assets and transfer or liquidation of liabilities and obligations of the Drilling Technologies and Production Technologies segments.
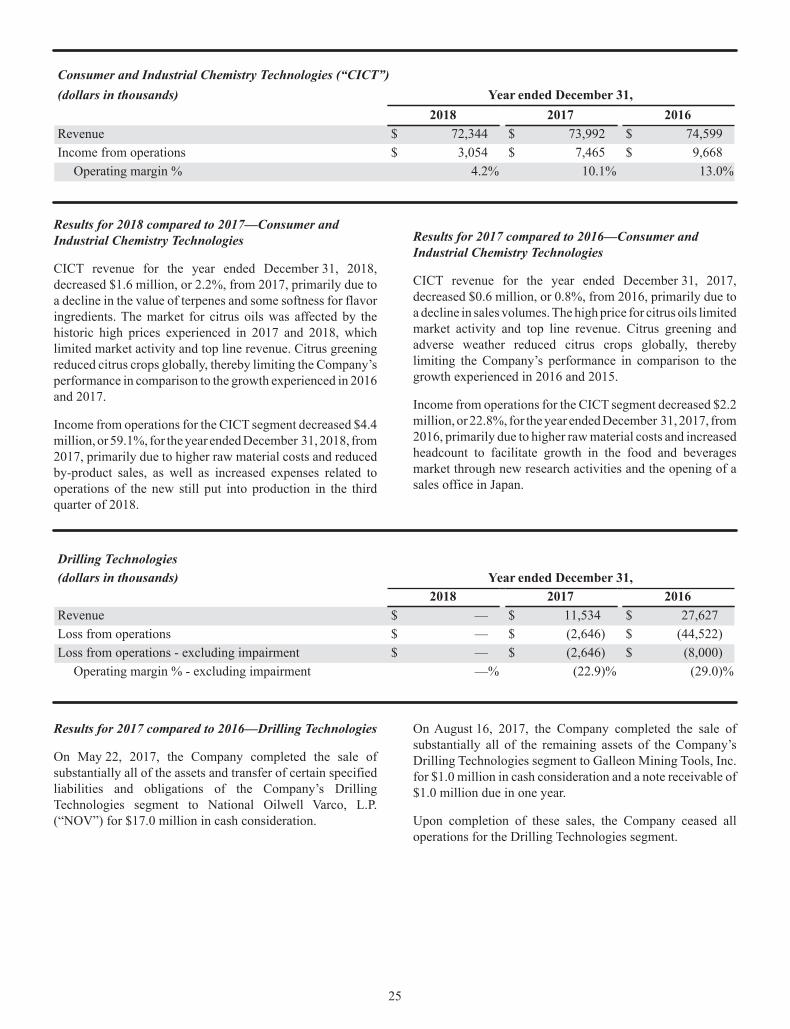
25
Consumer and Industrial Chemistry Technologies (“CICT”)(dollars in thousands) Year ended December 31,
2018 2017 2016Revenue $ 72,344 $ 73,992 $ 74,599Income from operations $ 3,054 $ 7,465 $ 9,668
Operating margin % 4.2% 10.1% 13.0%
Results for 2018 compared to 2017—Consumer and Industrial Chemistry Technologies
CICT revenue for the year ended December 31, 2018, decreased $1.6 million, or 2.2%, from 2017, primarily due to a decline in the value of terpenes and some softness for flavor ingredients. The market for citrus oils was affected by the historic high prices experienced in 2017 and 2018, which limited market activity and top line revenue. Citrus greening reduced citrus crops globally, thereby limiting the Company’s performance in comparison to the growth experienced in 2016 and 2017.
Income from operations for the CICT segment decreased $4.4 million, or 59.1%, for the year ended December 31, 2018, from 2017, primarily due to higher raw material costs and reduced by-product sales, as well as increased expenses related to operations of the new still put into production in the third quarter of 2018.
Results for 2017 compared to 2016—Consumer and Industrial Chemistry Technologies
CICT revenue for the year ended December 31, 2017, decreased $0.6 million, or 0.8%, from 2016, primarily due to a decline in sales volumes. The high price for citrus oils limited market activity and top line revenue. Citrus greening and adverse weather reduced citrus crops globally, thereby limiting the Company’s performance in comparison to the growth experienced in 2016 and 2015.
Income from operations for the CICT segment decreased $2.2 million, or 22.8%, for the year ended December 31, 2017, from 2016, primarily due to higher raw material costs and increased headcount to facilitate growth in the food and beverages market through new research activities and the opening of a sales office in Japan.
Drilling Technologies(dollars in thousands) Year ended December 31,
2018 2017 2016Revenue $ — $ 11,534 $ 27,627Loss from operations $ — $ (2,646) $ (44,522)Loss from operations - excluding impairment $ — $ (2,646) $ (8,000)
Operating margin % - excluding impairment —% (22.9)% (29.0)%
Results for 2017 compared to 2016—Drilling Technologies
On May 22, 2017, the Company completed the sale of substantially all of the assets and transfer of certain specified liabilities and obligations of the Company’s Drilling Technologies segment to National Oilwell Varco, L.P. (“NOV”) for $17.0 million in cash consideration.
On August 16, 2017, the Company completed the sale of substantially all of the remaining assets of the Company’s Drilling Technologies segment to Galleon Mining Tools, Inc. for $1.0 million in cash consideration and a note receivable of $1.0 million due in one year.
Upon completion of these sales, the Company ceased all operations for the Drilling Technologies segment.
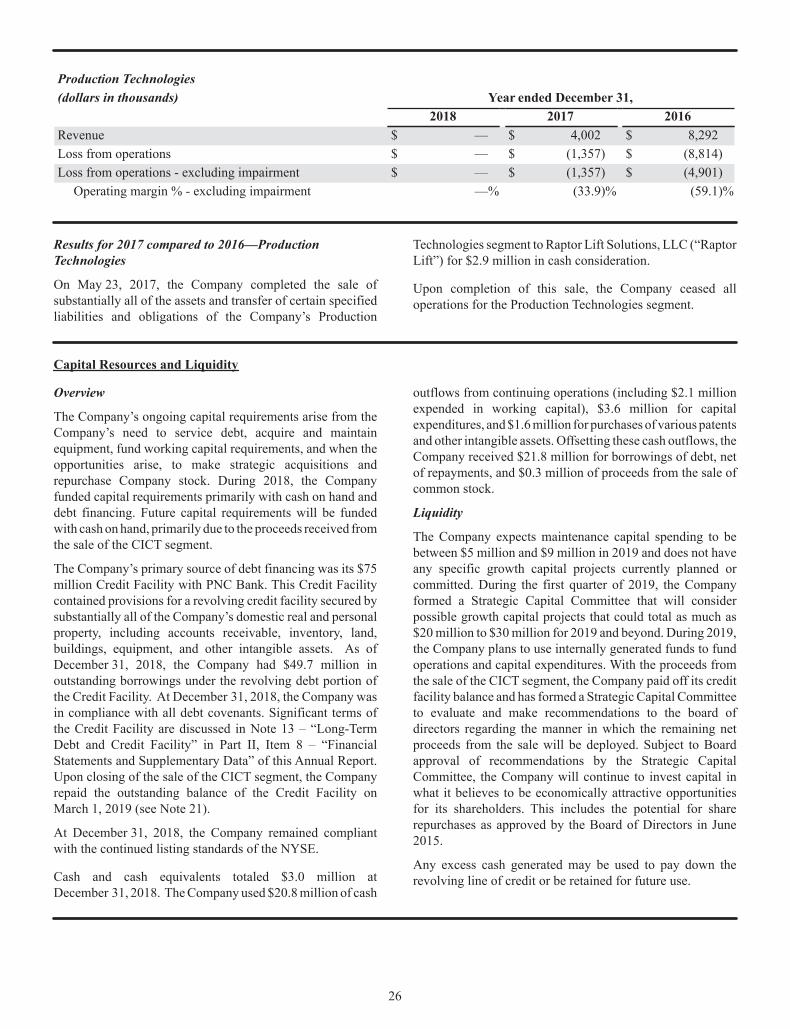
26
Production Technologies(dollars in thousands) Year ended December 31,
2018 2017 2016Revenue $ — $ 4,002 $ 8,292Loss from operations $ — $ (1,357) $ (8,814)Loss from operations - excluding impairment $ — $ (1,357) $ (4,901)
Operating margin % - excluding impairment —% (33.9)% (59.1)%
Results for 2017 compared to 2016—Production Technologies
On May 23, 2017, the Company completed the sale of substantially all of the assets and transfer of certain specified liabilities and obligations of the Company’s Production
Technologies segment to Raptor Lift Solutions, LLC (“Raptor Lift”) for $2.9 million in cash consideration.
Upon completion of this sale, the Company ceased all operations for the Production Technologies segment.
Capital Resources and Liquidity
Overview
The Company’s ongoing capital requirements arise from the Company’s need to service debt, acquire and maintain equipment, fund working capital requirements, and when the opportunities arise, to make strategic acquisitions and repurchase Company stock. During 2018, the Company funded capital requirements primarily with cash on hand and debt financing. Future capital requirements will be funded with cash on hand, primarily due to the proceeds received from the sale of the CICT segment.
The Company’s primary source of debt financing was its $75 million Credit Facility with PNC Bank. This Credit Facility contained provisions for a revolving credit facility secured by substantially all of the Company’s domestic real and personal property, including accounts receivable, inventory, land, buildings, equipment, and other intangible assets. As of December 31, 2018, the Company had $49.7 million in outstanding borrowings under the revolving debt portion of the Credit Facility. At December 31, 2018, the Company was in compliance with all debt covenants. Significant terms of the Credit Facility are discussed in Note 13 – “Long-Term Debt and Credit Facility” in Part II, Item 8 – “Financial Statements and Supplementary Data” of this Annual Report. Upon closing of the sale of the CICT segment, the Company repaid the outstanding balance of the Credit Facility on March 1, 2019 (see Note 21).
At December 31, 2018, the Company remained compliant with the continued listing standards of the NYSE.
Cash and cash equivalents totaled $3.0 million at December 31, 2018. The Company used $20.8 million of cash
outflows from continuing operations (including $2.1 millionexpended in working capital), $3.6 million for capital expenditures, and $1.6 million for purchases of various patents and other intangible assets. Offsetting these cash outflows, the Company received $21.8 million for borrowings of debt, net of repayments, and $0.3 million of proceeds from the sale of common stock.
Liquidity
The Company expects maintenance capital spending to be between $5 million and $9 million in 2019 and does not have any specific growth capital projects currently planned or committed. During the first quarter of 2019, the Company formed a Strategic Capital Committee that will consider possible growth capital projects that could total as much as $20 million to $30 million for 2019 and beyond. During 2019, the Company plans to use internally generated funds to fund operations and capital expenditures. With the proceeds from the sale of the CICT segment, the Company paid off its credit facility balance and has formed a Strategic Capital Committee to evaluate and make recommendations to the board of directors regarding the manner in which the remaining net proceeds from the sale will be deployed. Subject to Board approval of recommendations by the Strategic Capital Committee, the Company will continue to invest capital in what it believes to be economically attractive opportunities for its shareholders. This includes the potential for share repurchases as approved by the Board of Directors in June 2015.
Any excess cash generated may be used to pay down the revolving line of credit or be retained for future use.

27
Net Debt
Net debt represents total debt less cash and cash equivalents and combines the Company’s indebtedness and the cash and cash equivalents that could be used to repay that debt. Components of net debt are as follows (in thousands):
December 31, 2018 December 31, 2017Cash and cash equivalents $ 3,044 $ 4,584Current portion of long-term debt (49,731) (27,950)Net debt $ (46,687) $ (23,366)
Cash Flows
Cash flow metrics from the consolidated statements of cash flows are as follows (in thousands):
Year ended December 31, 2018 2017 2016Net cash (used in) provided by operating activities $ (20,816) $ 12,345 $ 1,192Net cash (used in) provided by investing activities (2,109) 14,526 (21,419)Net cash provided by (used in) financing activities 21,480 (27,285) 22,851Net cash flows (used in) provided by discontinued operations (7) 24 (6)Effect of changes in exchange rates on cash and cash equivalents (88) 151 (3)Net (decrease) increase in cash and cash equivalents $ (1,540) $ (239) $ 2,615
Operating Activities
During 2018, 2017, and 2016, cash (used in) provided by operating activities totaled $(20.8) million, $12.3 million, and $1.2 million, respectively. Consolidated net loss for 2018, 2017, and 2016 totaled $73.4 million, $17.5 million and $4.4 million, respectively.
Net non-cash contributions to net income in 2018, totaled $54.4 million. Contributory non-cash items consisted primarily of $37.2 million for the goodwill impairment charge in the second quarter of 2018, $9.6 million for depreciation and amortization expense, $7.1 million for stock compensation expense, $3.3 million for provisions related to accounts receivables and inventory reserves, $2.6 million for the loss on write-down of assets held for sale, $0.7 million for reduction in incremental tax benefit related to share-based awards, and $0.4 million for the loss on sale of business, partially offset by $6.0 million for changes to deferred income taxes and $0.4 million for net gain on sale of assets.
Net non-cash contributions to net income in 2017, totaled $23.9 million. Contributory non-cash items consisted primarily of $10.2 million for depreciation and amortization expense, $10.6 million for stock compensation expense, $2.0 million for reduction in incremental tax benefit related to share-based awards, $0.5 million for provisions related to accounts receivables and inventory reserves, $0.3 million for net loss on sale of assets, and $0.2 million for changes to deferred income taxes.
Net non-cash contributions to net income in 2016, totaled $3.3 million. Contributory non-cash items consisted primarily of $8.6 million for depreciation and amortization expense, $11.4 million for stock compensation expense, $2.5 million for reduction in incremental tax benefit related to share-based awards and $0.5 million for provisions related to accounts receivables, partially offset by $19.7 million for changes to deferred income taxes.
During 2018, changes in working capital used $2.1 million in cash, primarily resulting from increasing accounts receivables and income taxes receivable by $3.7 million and decreasingaccrued liabilities and interest payable by $8.8 million, partially offset by decreasing inventories and other current assets by $5.8 million and increasing accounts payable by $4.6 million.
During 2017, changes in working capital provided $6.0 million in cash, primarily resulting from decreasing accounts receivables, income taxes receivable, and other current assets by $24.1 million, partially offset by increasing inventories by $3.4 million and decreasing accounts payable and accrued liabilities by $14.7 million.
During 2016, changes in working capital provided $2.3 million in cash, primarily resulting from increasing accounts payable and accrued liabilities by $39.1 million, partially offset by increasing accounts receivables, inventories, income taxes receivable, and other current assets by $34.9 million and decreasing income taxes payable and interest payable by $2.0 million.

28
Investing Activities
Net cash used in investing activities was $2.1 million during 2018. Cash used in investing activities primarily included $3.6 million for capital expenditures and $1.6 million for the purchase of various patents and other intangible assets, partially offset by $1.7 million of proceeds received from the sale of revenue generating assets associated with a business line within the Energy Chemistry Technologies segment and $1.4 million of proceeds received from the sale of fixed assets.
Net cash provided by investing activities was $14.5 million during 2017. Cash provided by investing activities primarily included $18.5 million of proceeds received from the sale of the Drilling Technologies and Production Technologies segments and $0.7 million of proceeds received from the sale of fixed assets, partially offset by $4.2 million for capital expenditures and $0.5 million for the purchase of various patents and other intangible assets.
Net cash used in investing activities was $21.4 million during 2016. Cash used in investing activities primarily included $13.1 million for capital expenditures, $7.9 million associated with the purchase of 100% of the stock and interests of IPI, and $0.6 million for the purchase of patents and intangible assets.
Financing Activities
Net cash generated through financing activities was $21.5 million during 2018, primarily due to receiving $21.8 million for borrowings of debt, net of repayments, and receiving $0.3 million in proceeds from the sale of common stock. Cash generated through financing activities was partially offset by a loss from noncontrolling interest of $0.4 million, $0.2 million for purchases of treasury stock for tax withholding purposes related to the vesting of restricted stock awards and the exercise of non-qualified stock options and $0.1 million for payments of debt issuance costs.
Net cash used in financing activities was $27.3 million during 2017, primarily due to using $20.4 million for repayments of debt, net of borrowings, $5.2 million for the repurchase of common stock, $1.7 million for purchases of treasury stock for tax withholding purposes related to the vesting of restricted stock awards and the exercise of non-qualified stock options, and $0.6 million for payments of debt issuance costs. Cash used in financing activities was partially offset by receiving $0.7 million in proceeds from the sale of common stock.
During 2016, net cash generated through financing activities was $22.9 million. Cash generated through financing activities was primarily due to receiving $30.9 million in proceeds from the sale of common stock, inclusive of $30.1 million, net of issuance costs, from the private placement of 2.5 millioncommon shares on July 27, 2016. Cash generated through financing activities was partially offset by using $2.1 millionfor repayments of debt, net of borrowings, reductions in tax benefit related to stock-based compensation of $2.5 million, purchases of treasury stock for tax withholding purposes related to the vesting of restricted stock awards and the exercise of non-qualified stock options of $2.4 million, and payments of debt issuance costs of $1.2 million.
Off-Balance Sheet Arrangements
There have been no transactions that generate relationships with unconsolidated entities or financial partnerships, such as entities often referred to as “structured finance” or “special purpose entities” (“SPEs”), established for the purpose of facilitating off-balance sheet arrangements or other contractually narrow or limited purposes. As of December 31, 2018, the Company was not involved in any unconsolidated SPEs.
The Company has not made any guarantees to customers or vendors nor does the Company have any off-balance sheet arrangements or commitments that have, or are reasonably likely to have, a current or future effect on the Company’s financial condition, change in financial condition, revenue, expenses, results of operations, liquidity, capital expenditures, or capital resources that are material to investors.
Contractual Obligations
Cash flows from operations are dependent on a variety of factors, including fluctuations in operating results, accounts receivable collections, inventory management, and the timing of payments for goods and services. Correspondingly, the impact of contractual obligations on the Company’s liquidity and capital resources in future periods is analyzed in conjunction with such factors.
Material contractual obligations consist of repayment of amounts borrowed under the Company’s Credit Facility and payment of operating lease obligations.

29
Contractual obligations at December 31, 2018 are as follows (in thousands):
Payments Due by Period
TotalLess than
1 year 1 - 3 years 3 -5 yearsMore than
5 yearsBorrowings under revolving credit facility (1) $ 49,731 $ 49,731 $ — $ — $ —Operating lease obligations 19,458 2,562 4,290 3,352 9,254
Total $ 69,189 $ 52,293 $ 4,290 $ 3,352 $ 9,254
(1) The borrowing was classified as current debt. The weighted-average interest rate was 5.51% at December 31, 2018. Borrowings under the revolving credit facility were repaid in full on March 1, 2019.
Critical Accounting Policies and Estimates
The Company’s consolidated financial statements have been prepared in accordance with accounting principles generally accepted in the United States of America (“U.S. GAAP”). Preparation of these statements requires management to make judgments, estimates and assumptions that affect the amounts of assets and liabilities in the financial statements and revenue and expenses during the reporting period. Significant accounting policies are described in Note 2 – “Summary of Significant Accounting Policies” in Part II, Item 8 – “Financial Statements and Supplementary Data” of this Annual Report. The Company believes the following accounting policies are critical due to the significant, subjective, and complex judgments and estimates required when preparing the consolidated financial statements. The Company regularly reviews judgments, assumptions, and estimates to the critical accounting policies.
Basis of Presentation
During the fourth quarter of 2018, the Company classified the Consumer and Industrial Chemistry Technologies reportable segment’s operations as held for sale based on management’s intention to sell this business. In addition, during the fourth quarter of 2016, the Company classified the Drilling Technologies and Production Technologies reportable segments’ operations as held for sale based on management’s intention to sell these businesses. The operating results of these segments have been reported as discontinued operations in the consolidated financial statements. Amounts previously reported have been reclassified to conform to this presentation to allow for meaningful comparison of continuing operations.
Revenue Recognition
The Company recognizes revenues to depict the transfer of control of promised goods or services to its customers in an amount that reflects the consideration to which it expects to be entitled in exchange for those goods or services. Refer to Note 7 — “Revenue from Contracts with Customers” for further discussion on Revenue.
The Company recognizes revenue based on the Accounting Standards Codification (“ASC”) 606 five-step model when all of the following criteria have been met: (i) a contract with a customer exists, (ii) performance obligations have been identified, (iii) the price to the customer has been determined,
(iv) the price to the customer has been allocated to the performance obligations, and (v) performance obligations are satisfied.
Products and services are sold with fixed or determinable prices. Certain sales include right of return provisions, which are considered when recognizing revenue and deferred accordingly. Deposits and other funds received in advance of delivery are deferred until the transfer of control is complete.
For certain contracts, the Company recognizes revenue under the percentage-of-completion method of accounting, measured by the percentage of “costs incurred to date” to the “total estimated costs of completion.” This percentage is applied to the “total estimated revenue at completion” to calculate proportionate revenue earned to date. For the years ended December 31, 2018, 2017, and 2016, the percentage-of-completion revenue accounted for less than 0.1% of total revenue during the respective time periods. This resulted in immaterial unfulfilled performance obligations and immaterial contract assets and/or liabilities for which the Company did not record adjustments to opening retained earnings as of December 31, 2015 or for any periods previously presented.
As an accounting policy election, the Company excludes from the measurement of the transaction price all taxes assessed by a governmental authority that are both imposed on and concurrent with a specific revenue-producing transaction and collected by the entity from a customer.
Shipping and handling costs associated with outbound freight after control over a product has transferred to a customer are accounted for as a fulfillment cost and are included in cost of revenues.
Allowance for Doubtful Accounts
The Company performs ongoing credit evaluations of customers and grants credit based upon historical payment history, financial condition, and industry expectations, as available. Determination of the collectability of amounts due from customers requires the Company to use estimates and make judgments regarding future events and trends, including monitoring customers’ payment history and current credit worthiness, in order to determine that collectability is

30
reasonably assured. The Company also considers the overall business climate in which its customers operate.
These uncertainties require the Company to make frequent judgments and estimates regarding a customers’ ability to pay amounts due in order to assess and quantify an appropriate allowance for doubtful accounts. The primary factors used to quantify the allowance are customer delinquency, bankruptcy, and the Company’s estimate of its ability to collect outstanding receivables based on the number of days a receivable has been outstanding.
The majority of the Company’s customers operate in the energy industry. The cyclical nature of the industry may affect customers’ operating performance and cash flows, which could impact the Company’s ability to collect on these obligations. Additionally, some customers are located in international areas that are inherently subject to risks of economic, political, and civil instability.
The Company continues to monitor the economic climate in which its customers operate and the aging of its accounts receivable. The allowance for doubtful accounts is based on the aging of accounts and an individual assessment of each invoice. At December 31, 2018, the allowance was 3.1% of gross accounts receivable, compared to an allowance of 1.9% a year earlier. While credit losses have historically been within expectations and the provisions established, should actual write-offs differ from estimates, revisions to the allowance would be required.
Inventory Reserves
Inventories consist of raw materials, work-in-process, and finished goods and are stated at the lower of cost or market, using the weighted-average cost method. Finished goods inventories include raw materials, direct labor, and production overhead. The Company’s inventory reserve represents the excess of the inventory carrying amount over the amount expected to be realized from the ultimate sale or other disposal of the inventory.
The Company regularly reviews inventory quantities on hand and records provisions or impairments for excess or obsolete inventory based on the Company’s forecast of product demand, historical usage of inventory on hand, market conditions, production and procurement requirements, and technological developments. Significant or unanticipated changes in market conditions or Company forecasts could affect the amount and timing of provisions for excess and obsolete inventory and inventory impairments.
Significant changes have not been made in the methodology used to estimate the reserve for excess and obsolete inventory or impairments during the past three years. Specific assumptions are updated at the date of each evaluation to consider Company experience and current industry trends. Significant judgment is required to predict the potential impact which the current business climate and evolving market conditions could have on the Company’s assumptions.
Changes which may occur in the energy industry are hard to predict, and they may occur rapidly. To the extent that changes in market conditions result in adjustments to management assumptions, impairment losses could be realized in future periods.
At December 31, 2018 and 2017, the reserve for excess and obsolete inventory was $2.1 million and $0.4 million, or 7.2% and 1.1% of inventory, respectively.
Business Combinations
The Company allocates the fair value of purchase consideration to the assets acquired, liabilities assumed, and any non-controlling interests in the acquired entity generally based on their fair values at the acquisition date. The excess of the fair value of purchase consideration over the fair value of these assets acquired, liabilities assumed, and any non-controlling interests in the acquired entity is recorded as goodwill. The primary items that generate goodwill include the value of the synergies between the acquired company and Flotek and the value of the acquired assembled workforce. Acquisition-related expenses are recognized separately from the business acquisition and are recognized as expenses as incurred.
The purchase price allocation process requires management to make significant estimates and assumptions at the acquisition date with respect to the fair value of:
• intangible assets acquired from the acquiree;• tax assets and liabilities assumed from the acquiree;• stock awards assumed from the acquiree that are
included in the purchase price; and• pre-acquisition obligations and contingencies assumed
from the acquiree.
Although the Company believes the assumptions and estimates it has made in the past have been reasonable and appropriate, they are based in part on historical experience and information obtained from the management of the acquired companies and are inherently uncertain.
Goodwill
Goodwill is not subject to amortization, but is tested for impairment annually during the fourth quarter, or more frequently if an event occurs or circumstances change that would indicate a potential impairment. These circumstances may include, but are not limited to, a significant adverse change in the business climate, unanticipated competition, or a change in projected operations or results of a reporting unit. Goodwill is tested for impairment at a reporting unit level. At December 31, 2018, only the Consumer and Industrial Chemistry Technologies reporting unit had a goodwill balance.
During the annual testing, the Company assesses whether a goodwill impairment exists using both qualitative and quantitative assessments. The qualitative assessment involves determining whether events or circumstances exist that

31
indicate it is more likely than not that the fair value of a reporting unit is less than its carrying amount, including goodwill. If, based on this qualitative assessment, it is determined that it is not more likely than not that the fair value of a reporting unit is less than its carrying amount, the Company does not perform a quantitative assessment.
If the qualitative assessment indicates that it is more likely than not that the fair value of a reporting unit is less than its carrying amount or if the Company elects not to perform a qualitative assessment, a quantitative impairment test is performed to determine whether goodwill impairment exists at the reporting unit.
Effective during the fourth quarter of 2017, the Company adopted Accounting Standards Update (“ASU”) 2017-04, “Simplifying the Test for Goodwill Impairment,” which eliminated the second step of the two-step quantitative impairment test. Now, if quantitative impairment testing is performed, the Company compares the estimated fair value of each reporting unit which has goodwill to its carrying amount, including goodwill. To determine fair value estimates, the Company uses the income approach based on discounted cash flow analyses, combined, when appropriate, with a market-based approach. The market-based approach considers valuation comparisons of recent public sale transactions of similar businesses and earnings multiples of publicly traded businesses operating in industries consistent with the reporting unit. If the carrying amount of a reporting unit, including goodwill, exceeds its fair value, an impairment loss is recognized in an amount equal to that excess, limited to the amount of goodwill allocated to that reporting unit.
Prior to adoption of ASU 2017-04, if quantitative impairment testing was performed, the Company used a two-step quantitative impairment test to determine whether goodwill impairment exists at the reporting unit. The first step was to compare the estimated fair value of each reporting unit which has goodwill to its carrying amount, including goodwill. To determine fair value estimates, the Company used the income approach based on discounted cash flow analyses, combined, when appropriate, with a market-based approach. The market-based approach considers valuation comparisons of recent public sale transactions of similar businesses and earnings multiples of publicly traded businesses operating in industries consistent with the reporting unit. If the fair value of a reporting unit was less than its carrying amount, the second step of the impairment test was performed to determine the amount of impairment, if any. The second step compares the implied fair value of the reporting unit goodwill with the carrying amount of the goodwill. If the carrying amount of the reporting unit’s goodwill exceeded its implied value, an impairment loss was recognized in an amount equal to that excess.
The Company determines fair value using widely accepted valuation techniques, including discounted cash flows and market multiples analyses, and through use of independent fixed asset valuation firms, as appropriate. These types of analyses contain uncertainties, as they require management to make assumptions and to apply judgments regarding industry
economic factors and the profitability of future business strategies. The Company’s policy is to conduct impairment testing based on current business strategies, taking into consideration current industry and economic conditions as well as the Company’s future expectations. Key assumptions used in the discounted cash flow valuation model include, among others, discount rates, growth rates, cash flow projections, and terminal value rates. Discount rates and cash flow projections are the most sensitive and susceptible to change as they require significant management judgment. Discount rates are determined using a weighted average cost of capital (“WACC”). The WACC considers market and industry data, as well as Company-specific risk factors for each reporting unit in determining the appropriate discount rate to be used. The discount rate utilized for each reporting unit is indicative of the return an investor would expect to receive for investing in a similar business. Management uses industry considerations and Company-specific historical and projected results to develop cash flow projections for each reporting unit. Additionally, if appropriate, as part of the market-based approach, the Company utilizes market data from publicly traded entities whose businesses operate in industries comparable to the Company’s reporting units, adjusted for certain factors that increase comparability.
During annual goodwill impairment testing in 2018 and 2017, the Company first assessed qualitative factors to determine whether it was necessary to perform the quantitative impairment test. During annual goodwill impairment testing in 2016, the Company first assessed qualitative factors to determine whether it was necessary to perform the two-step goodwill impairment test.
As of the fourth quarter of 2018, the Company concluded it was not more-likely-than-not that there was an impairment of goodwill for the Consumer and Industrial Technologies (“CICT”) reporting unit based on the assessment of qualitative factors. During the fourth quarter of 2018, the final criterion was met for classifying the CICT reporting unit as held for sale. Therefore, the CICT reporting unit was reported as discontinued operations. After receiving initial interests from potential buyers, it was determined that the disposal proceeds, after considering selling costs, would result in excess over book value. As this was in-line with quantitative impairment tests performed in previous quarters for the CICT reporting unit, no further impairment assessment was needed.
During the second quarter of 2018, the Company concluded it was not more-likely-than-not that there was an impairment of goodwill for the CICT reporting unit based on the assessment of qualitative factors. CICT revenues have increased 1.3% for the six months ended June 30, 2018, versus the same period in 2017, while gross margins, as a percentage of revenue, decreased 450 basis points driven by product mix and higher raw material costs.
For the second quarter of 2018, the Company was not able to conclude that it was not more-likely-than-not that the estimated fair value of the Energy Chemistry Technologies (“ECT”) reporting unit exceeded the carrying amount.

32
Therefore, the Company performed a quantitative impairment test for the reporting unit. The results of the impairment test indicated that the carrying amount of the ECT reporting unit exceeded the estimated fair value of the reporting unit by approximately $37.8 million, or 25.6% of the carrying amount. To evaluate the sensitivity of the fair value calculations for the ECT reporting units, the Company applied a hypothetical 0.5% unfavorable change in the weighted average cost of capital, which would have reduced the estimated fair value of the ECT reporting unit by approximately $5.7 million. Additionally, reducing the revenue projections by 1.0% and holding gross margins steady reduced the estimated fair value approximately $4.4 million. These sensitivity analyses confirmed the need for an impairment for the ECT reporting unit. The Company recorded a full impairment of the goodwill for $37.2 million in the ECT reporting unit during the second quarter of 2018.
Key assumptions and estimates were based on the experience of the Company’s management, experience with past recessions within the oil and gas industry, and internal as well as published external perspectives of market activity. Key assumptions used in the discounted cash flow analysis included:
• Revenue and expenses experience industry level growth rates annually beyond 2019;
• Margins stay in the lower portion of historical ranges; and
• Working capital ratios remain consistent with historical levels.
Some of the factors that affected the change in results of the impairment test from the fourth quarter of 2017 to the second quarter of 2018 included:
• Declining revenue and margin compression in the first half of 2018.
• Mid-year sensitivity analysis decreased 2018 and 2019 expectations.
Based on the Company’s fourth quarter 2018 testing of goodwill for impairment for the CICT reporting unit, no impairment was recorded.
As of the fourth quarter of 2017, the Company was not able to conclude that it was not more-likely-than-not that the estimated fair value of the Energy Chemistry Technologies (“ECT”) and Consumer and Industrial Chemistry Technologies (“CICT”) reporting units exceeded the carrying amount of the respective reporting units. Therefore, the Company performed a quantitative impairment test for each of these reporting units. The results of the impairment test indicated that the estimated fair values of the two reporting units exceeded the carrying amount of their respective reporting units by approximately $34.7 million and $20.2 million, respectively, or an excess of 21% and 23%, respectively, over the carrying amount. Therefore, no impairment was deemed necessary for 2017. To evaluate the sensitivity of the fair value calculations of the ECT and CICT
reporting units, the company applied a hypothetical 10% unfavorable change in the weighted average cost of capital, which would have reduced the estimated fair value of the ECT and CICT reporting units by approximately $23.7 million and $12.4 million, respectively. These sensitivity analyses were not indicative of an impairment for the ECT and CICT reporting units.
Key assumptions and estimates were based on experience of the Company’s management, experience with past recessions within the oil and gas industry (specifically the 2008/2009 recession), and internal as well as published external perspectives of recovery timing. Key assumptions used in the discounted cash flow analysis included:
• Revenue and expenses grow 2% annually;• Margins stay in the lower portion of historical ranges;• Working capital ratios remain consistent with historical
levels;• Risk premium related to foreign country security,
government stability, and potential future foreign currency.
Based on the Company’s fourth quarter 2017 testing of goodwill for impairment at each reporting unit, no impairments were recorded.
As of the fourth quarter of 2016, the Company concluded it was not more likely than not that there was an impairment of goodwill for the Consumer and Industrial Chemistry Technologies or Energy Chemistry Technologies reporting units based on the assessment of qualitative factors. The Consumer and Industrial Chemistry Technologies reporting unit has outpaced prior years revenues and maintained strong margins. The Energy Chemistry Technologies reporting unit saw quarterly revenue improve throughout 2016 and reduced only 12% versus 2015 as market activity fell 43% during the same period. However, the segment continued to produce strong margins.
The Company was not able to conclude that it was not more likely than not that the estimated fair value of the Teledrift and Production Technologies reporting units exceeded the carrying amount of the respective reporting units, as of the fourth quarter of 2016. Therefore, the Company performed a Step 1 impairment test for each of these reporting units. The results of the Step 1 test indicated that the estimated fair values of the two reporting units exceeded the carrying amount of their respective reporting units by approximately $13.2 million and $6.7 million respectively, or an excess of 34% and 44%, respectively, over the carrying amount. Therefore, no further testing was required for these two reporting units. To evaluate the sensitivity of the fair value calculations of the Teledrift and Production Technologies reporting units, the Company applied a hypothetical 10% unfavorable change in the weighted average cost of capital, which would have reduced the estimated fair value of the Teledrift and Production Technologies reporting units by approximately $5.3 million and $4.2 million, respectively. These sensitivity analyses were

33
not indicative of an impairment for the Teledrift or Production Technologies reporting units.
As of the third quarter of 2016, the Company concluded it was not more likely than not that there was an impairment of goodwill for the Consumer and Industrial Chemistry Technologies reporting unit, the Energy Chemistry Technologies reporting unit, and the Teledrift reporting unit based on the assessment of qualitative factors. The Consumer and Industrial Chemistry Technologies reporting unit has seen increased revenues in 2016 compared to 2015 and has maintained margins in the range seen from 2014 through 2015. The Energy Chemistry Technologies reporting unit had an 11% decrease in revenue versus the 27% decline in market activity for the first quarter of 2016 compared to the fourth quarter of 2015, a 3% decrease in revenue versus the 35% decline in market activity for the second quarter of 2016 compared to the first quarter of 2016, and a 4% increase in revenue versus the 28% increase in market activity for the third quarter of 2016 compared to the second quarter of 2016, but continues to maintain gross margins. The Teledrift reporting unit, having passed the Step 1 impairment tests in the previous two quarters, had the highest revenue quarter for 2016 and improved margins. Teledrift revenue for the third quarter of 2016 increased 37% versus the second quarter of 2016 and improved gross margins by 8.4%.
For the first quarter of 2016, the Company was not able to conclude that it was not more likely than not that the estimated fair value of the Production Technologies and Teledrift reporting units exceeded the carrying amount of the respective reporting units. Therefore, the Company performed a Step 1 impairment test for each of these reporting units. The results of the Step 1 test indicated that the estimated fair values of the Production Technologies and the Teledrift reporting units exceeded the carrying amount of their respective reporting units by approximately $34.9 million and $2.1 million, respectively, or an excess of 153% and 5%, respectively, over the carrying amount. Therefore, no further testing was required for these two reporting units.
Again, for the second quarter of 2016, the Company was not able to conclude that it was not more likely than not that the estimated fair value of the Production Technologies and Teledrift reporting units exceeded the carrying amount of the respective reporting units. Therefore, the Company performed a Step 1 impairment test for each of these reporting units. The results of the Step 1 test indicated that the estimated fair values of the Production Technologies and the Teledrift reporting units exceeded the carrying amount of their respective reporting units by approximately $17.1 million and $2.2 million, respectively, or an excess of 77% and 6%, respectively, over the carrying amount. Therefore, no further testing was required for these two reporting units.
Once again, for the third quarter of 2016, the Company was not able to conclude that it was not more likely than not that the estimated fair value of the Production Technologies reporting unit exceeded the carrying amount of the reporting
unit. Therefore, the Company performed a Step 1 impairment test for this reporting unit. The results of the Step 1 test indicated that the estimated fair value of the Production Technologies reporting unit exceeded the carrying amount of the reporting unit by approximately $8.1 million, or an excess of 36.9% over the carrying amount. Therefore, no further testing was required for this reporting unit.
Key assumptions and estimates were based on experience of the Company’s management, experience with past recessions within the oil and gas industry (specifically the 2008/2009 recession), and internal as well as published external perspectives of recovery timing. Key assumptions used in the discounted cash flow analysis included:
• U.S. rig count bottoms during 2016 and begins to recover to average 532 rigs for the last two quarters of 2016. Average Rig count climbs to 725 in 2017, 880 in 2018, and 920 in 2019, and grows by 50 rigs annually for 2020 through 2023, and then holds flat through 2026;
• International revenue grows 3% annually;• Domestic rental revenue per rig and total domestic
revenue per rig dip to lows seen during the 2008/2009 downturn through 2017 and then slowly return to the lower end of the ranges seen between 2012 and 2014;
• International indirect expenses remain 3.5% of total international revenue;
• Domestic indirect expense percentages slowly return to historical levels;
• Margins stay in the lower portion of historical ranges;• Working capital ratios remain consistent; and• Risk premium related to foreign country security and
government stability.
Some of the factors that affected the change in results of the Step 1 impairment test from the fourth quarter of 2015 to the fourth quarter of 2016 included:
• Impairment testing of long-lived assets excluding goodwill resulted in a reduction to the balance sheet of $14.3 million for the Teledrift reporting unit in the first quarter of 2016.
• Impairment of inventory resulted in a reduction to the balance sheet of $1.3 million for the Teledrift reporting unit and $3.9 million for the Production Technologies reporting unit in the first quarter of 2016.
• Cost reduction initiatives during the first half of 2016 reduced direct and indirect expenses for the Drilling Technologies segment.
• Due to the surplus of rental tools and the low levels of drilling rig activity, capital expenditures for new rental tools will be minimal through 2019 in the Teledrift reporting unit.
Based on the Company’s fourth quarter 2016 testing of goodwill for impairment at each reporting unit, no impairments were recorded.

34
There are significant inherent uncertainties and judgments involved in estimating fair value. The Company cannot predict the occurrence of events or circumstances that could adversely affect the fair value of goodwill. Such events may include, but are not limited to, deterioration of the economic environment, increases in the Company’s weighted average cost of capital, material negative changes in relationships with significant customers, reductions in valuations of other public companies in the Company’s industry, or strategic decisions made in response to economic and competitive conditions. If actual results are not consistent with the Company’s current estimates and assumptions, impairment of goodwill could be required.
Long-Lived Assets Other than Goodwill
Long-lived assets other than goodwill consist of property and equipment and intangible assets that have determinable and indefinite lives. The Company makes judgments and estimates regarding the carrying amount of these assets, including amounts to be capitalized, depreciation and amortization methods to be applied, estimated useful lives, and possible impairments. Property and equipment and intangible assets with determinable lives are tested for impairment whenever events or changes in circumstances indicate the carrying amount of the asset may not be recoverable.
For property and equipment, events or circumstances indicating possible impairment may include a significant decrease in market value or a significant change in the business climate. An impairment loss is recognized when the carrying amount of an asset exceeds the estimated undiscounted future cash flows expected to result from the use of the asset and its eventual disposition. The amount of the impairment loss is the excess of the asset’s carrying amount over its fair value. Fair value is generally determined using an appraisal by an independent valuation firm or by using a discounted cash flow analysis.
For intangible assets with definite lives, events or circumstances indicating possible impairment may include an adverse change in the extent or manner in which the asset is being used or a change in the assessment of future operations. The Company assesses the recoverability of the carrying amount by preparing estimates of future revenue, margins, and cash flows. If the sum of expected future cash flows (undiscounted and without interest charges) is less than the carrying amount, an impairment loss is recognized. The impairment loss recognized is the amount by which the carrying amount exceeds the fair value. Fair value of these assets may be determined by a variety of methodologies, including discounted cash flows.
Intangible assets with indefinite lives are not subject to amortization, but are tested for impairment annually during the fourth quarter, or more frequently if an event occurs or circumstances change that would indicate a potential impairment. These circumstances may include, but are not limited to, a significant adverse change in the business climate, unanticipated competition, or a change in projected operations or results of a reporting unit.
The Company assesses whether an indefinite lived intangible impairment exists using both qualitative and quantitative assessments. The qualitative assessment involves determining whether events or circumstances exist that indicate it is more likely than not that the fair value of the indefinite lived intangible is less than its carrying amount. If, based on this qualitative assessment, it is determined that it is not more likely than not that the fair value of the indefinite lived intangible is less than its carrying amount, the Company does not perform a quantitative assessment.
If the qualitative assessment indicates that it is more likely than not that the indefinite-lived intangible asset is impaired or if the Company elects to not perform a qualitative assessment, the Company then performs the quantitative impairment test. The quantitative impairment test for an indefinite-lived intangible asset consists of a comparison of the fair value of the asset with its carrying amount. If the carrying amount of an intangible asset exceeds its fair value, an impairment loss is recognized in an amount equal to that excess. Fair value of these assets may be determined by a variety of methodologies, including discounted cash flows.
The development of future net undiscounted cash flow projections requires management projections of future sales and profitability trends and the estimation of remaining useful lives of assets. These projections are consistent with those projections the Company uses to internally manage operations. When potential impairment is identified, a discounted cash flow valuation model similar to that used to value goodwill at the reporting unit level, incorporating discount rates commensurate with risks associated with each asset, is used to determine the fair value of the asset in order to measure potential impairment. Discount rates are determined by using a WACC. Estimated revenue and WACC assumptions are the most sensitive and susceptible to change in the long-lived asset analysis as they require significant management judgment. The Company believes the assumptions used are reflective of what a market participant would have used in calculating fair value.
Valuation methodologies utilized to evaluate long-lived assets other than goodwill for impairment were consistent with prior periods. Specific assumptions discussed above are updated at each test date to consider current industry and Company-specific risk factors from the perspective of a market participant. The current business climate is subject to evolving market conditions and requires significant management judgment to interpret the potential impact to the Company’s assumptions. To the extent that changes in the current business climate result in adjustments to management projections, impairment losses may be recognized in future periods.
The domestic drilling industry has continued to deteriorate since the end of 2015 to levels not seen since April 1999. As the business of the Drilling Technologies segment is closely aligned with the drilling rig count and average U.S. drilling rig count declined 27% during the first quarter of 2016, the drop off in rig count led to a decline in revenue and gross profit of 37% and 69%, respectively, from the fourth quarter of 2015

35
for the Drilling Technologies segment. As a result of the continued drop in rig count and the significant decline in operations in the first quarter of 2016, the Company concluded these were events or circumstances that caused the Company to test its long-lived assets for impairment within the segment.
During the three months ended March 31, 2016, the Company completed testing for impairment of long-lived assets within the Drilling Technologies segment for four asset groups:
• Downhole Tools - primarily used in the vertical drilling market;
• International Drill Pipe - primarily used in foreign mining operations;
• Teledrift Domestic - primarily associated with the Measurement While Drilling (“MWD”) market in the U.S.; and
• Teledrift International - primarily associated with the MWD market in international markets.
Impairment indicators affected both asset groups that are tied directly to the domestic drilling market. While impairment indicators are not present for the International Drill Pipe or Teledrift International asset groups, the Company performed recoverability tests for all four asset groups.
The recoverability test indicated that the undiscounted estimated cash flows of the International Drill Pipe and Teledrift International asset groups exceeded the carrying amount of their respective asset groups by approximately $2.6 million and $64.1 million, respectively, or an excess of 98% and 906%, respectively. However, the undiscounted estimated cash flows of the Downhole Tools and Teledrift Domestic asset groups did not exceed the carrying amount of their respective asset groups, and therefore, the Company performed a discounted cash flow analysis on each asset group to determine the fair values.
Since the assets in the asset groups are not highly specialized, the Company assumed the current use of each asset would be a similar use as if the assets were sold. As such, the cash flow used in the recoverability test is the same cash flow used to create the discounted cash flow for fair value analysis. This testing indicated that the carrying amount of the Downhole Tools and Teledrift Domestic asset groups exceeded the fair value by $9.6 million and $14.3 million, respectively, or an excess of 69% and 56%, respectively. As a result, a combined impairment loss for these two asset groups of $23.9 million was recognized during the three months ended March 31, 2016.
Additionally, the business of the Production Technologies segment incurred similar declines with revenue and gross profit, falling approximately 30% and 42%, respectively. Therefore, the Company completed testing for impairment of long-lived assets within the Production Technologies segment. The recoverability test indicated that the undiscounted estimated cash flows for the segment exceeded the carrying amount of assets by $3.0 million, or an excess of
23%. As a result, no impairment of long-lived assets was recognized for the Production Technologies segment.
During the second quarter of 2016, the average U.S. drilling rig count fell 23% versus the first quarter of 2016. The Drilling Technologies segment held revenue relatively flat and improved margins when comparing the second and first quarters of 2016. As such, the Company determined that testing for impairment of long-lived assets was not warranted for the segment.
However, the Production Technologies segment results showed a decline in revenue of 8% and continuing negative margins when comparing the second and first quarters of 2016. Therefore, the Company completed testing for impairment of long-lived assets within the Production Technologies segment. The recoverability test indicated that the undiscounted estimated cash flows for the segment exceeded the carrying amount of assets by $4.4 million, or an excess of 34%. As a result, no impairment of long-lived assets was recognized for the Production Technologies segment.
During the third quarter of 2016, the average U.S. drilling rig count rose 14% versus the second quarter of 2016. The Drilling Technologies segment revenue increased 13% and improved margins when comparing the third and second quarters of 2016, while the Production Technologies segment results showed an increase in revenue of 15% and improved margins when comparing the third and second quarters of 2016. As such, the Company determined that testing for impairment of long-lived assets was not warranted for either segment.
During the fourth quarter of 2016, the average U.S. drilling rig count rose 23% versus the third quarter of 2016. The Drilling Technologies segment revenue increased 6% and showed slightly lower margins when compared to the third quarter of 2016 but still exceeded second quarter 2016 margins. The Production Technologies segment results showed an increase in revenue of 5% and improved margins when comparing the fourth and third quarters of 2016. As such, the Company determined that testing for impairment of long-lived assets was not warranted for either segment.
Key assumptions and estimates used in performing these recoverability tests were based on experience of the Company’s management, experience with past oil and gas industry downturns and recoveries, and internal, as well as published external, perspectives of recovery timing. Key assumptions used in the recoverability test included:
• Rental tools are the primary cash generating assets for each group;
• Remaining estimated useful life for each group was determined to be 7 years;
• Carrying amount of the asset group is the net book value of the assets as of March 31, 2016, for first quarter testing and June 30, 2016, for second quarter testing;
• Estimates of future cash flows for the group assumed the sale of the group at the end of the remaining useful life of the primary asset; and

36
• Since the Downhole Tools asset group includes product sales in the cash flow analysis, a portion of the inventory was included in the carrying amount of the asset group. The remaining portion of the inventory is normally utilized to repair and fabricate rental tools and is included in cost of goods sold.
There are significant inherent uncertainties and judgments involved in estimating fair value. The Company cannot predict the occurrence of events or circumstances that could adversely affect the fair value of the asset (asset group). Such events may include, but are not limited to, deterioration of the economic environment, increases in the Company’s weighted average cost of capital, material negative changes in relationships with significant customers, reductions in valuations of other public companies in the Company’s industry, or strategic decisions made in response to economic and competitive conditions. If actual results are not consistent with the Company’s current estimates and assumptions, additional impairment of long-lived assets could be required.
In 2018, 2017, and 2016, while testing annual indefinite lived intangible assets for impairment, the Company first assessed qualitative factors to determine whether it was necessary to perform the impairment test. Based on its qualitative assessment, the Company concluded there was no indication of the need for an impairment of indefinite lived intangibles, and therefore no further testing was required.
No impairment was recorded for property and equipment and intangible assets with determinable or indefinite lives during 2018 and 2017.
Fair Value Measurements
Fair value is defined as the amount that would be received for the sale of an asset or paid for the transfer of a liability in an orderly transaction between unrelated third party market participants at the measurement date. In determination of fair value measurements for assets and liabilities, the Company considers the principal, or most advantageous, market and assumptions that market participants would use when pricing the asset or liability. The Company categorizes financial assets and liabilities using a three-tiered fair value hierarchy, based upon the nature of the inputs used in the determination of fair value. Inputs refer broadly to the assumptions that market participants would use in pricing an asset or liability and may be observable or unobservable. Significant judgments and estimates are required, particularly when inputs are based on pricing for similar assets or liabilities, pricing in non-active markets, or when unobservable inputs are required.
Income Taxes
The Company’s tax provision is subject to judgments and estimates necessitated by the complexity of existing regulatory tax statutes and the effect of these upon the Company due to operations in multiple tax jurisdictions. Income tax expense is based on taxable income, statutory tax rates, and tax planning opportunities available in the various
jurisdictions in which the Company operates. The Company’s income tax expense will fluctuate from year to year as the amount of pretax income fluctuates. Changes in tax laws and the Company’s profitability within and across the jurisdictions may impact the Company’s tax liability. While the annual tax provision is based on the best information available to the Company at the time of preparation, several years may elapse before the ultimate tax liabilities are determined.
The Company uses the liability method in accounting for income taxes. Deferred tax assets and liabilities are recognized for temporary differences between financial statement carrying amounts and the tax bases of assets and liabilities and are measured using the tax rates expected to be in effect when the differences reverse. Deferred tax assets are also recognized for operating loss and tax credit carry forwards. The effect on deferred tax assets and liabilities of a change in tax rates is recognized in the results of operations in the period that includes the enactment date. A valuation allowance is used to reduce deferred tax assets when uncertainty exists regarding their realization.
A valuation allowance is recorded to reduce previously recorded tax assets when it becomes more likely than not such assets will not be realized. The Company evaluates, at least annually, net operating loss carry forwards and other net deferred tax assets and considers all available evidence, both positive and negative, to determine whether a valuation allowance is necessary relative to net operating loss carry forwards and other net deferred tax assets. In making this determination, the Company considers cumulative losses in recent years as significant negative evidence. The Company considers recent years to mean the current year plus the two preceding years. The Company considers the recent cumulative income or loss position of its filings groups as objectively verifiable evidence for the projection of future income, which consists primarily of determining the average of the pre-tax income of the current and prior two years after adjusting for certain items not indicative of future performance. Based on this analysis, the Company determines whether a valuation allowance is necessary.
In assessing the need for a valuation allowance in the second quarter of 2018, the Company considered all available objective and verifiable evidence, both positive and negative, including historical levels of pre-tax income (loss) both on a consolidated basis and tax reporting entity basis, legislative developments, and expectations and risks associated with estimates of future pre-tax income. As a result of this analysis, the Company determined that it is more likely than not that it will not realize the benefits of certain deferred tax assets and, therefore, recorded a valuation allowance against the carrying value of net deferred tax assets, except for deferred tax liabilities related to non-amortizable intangible assets and certain state jurisdictions. As all available evidence should be taken into consideration when assessing the need for a valuation allowance, the subsequent events that occurred in the first quarter of 2019 (Note 21) provided a source of income to support the release of $11.5 million of the valuation

37
allowance. As such, the Company reversed this portion of the valuation allowance during the fourth quarter of 2018.
The Company periodically identifies and evaluates uncertain tax positions. This process considers the amounts and probability of various outcomes that could be realized upon final settlement. Liabilities for uncertain tax positions are based on a two-step process. The actual benefits ultimately realized may differ from the Company’s estimates. Changes in facts, circumstances, and new information may require a change in recognition and measurement estimates for certain individual tax positions. Any changes in estimates are recorded in results of operations in the period in which the change occurs. At December 31, 2018, the Company performed an evaluation of its various tax positions and concluded that it did not have significant uncertain tax positions requiring disclosure. The Company’s policy is to record interest and penalties related to income tax matters as income tax expense.
Share-Based Compensation
The Company has stock-based incentive plans which are authorized to issue stock options, restricted stock, and other incentive awards. Stock-based compensation expense for stock options and restricted stock is determined based upon estimated grant-date fair value. This fair value for the stock options is calculated using the Black-Scholes option-pricing model and is recognized as expense over the requisite service period. The option-pricing model requires the input of highly subjective assumptions, including expected stock price
volatility and expected option life. For all stock-based incentive plans, the Company estimates an expected forfeiture rate and recognizes expense only for those shares expected to vest. The estimated forfeiture rate is based on historical experience. To the extent actual forfeiture rates differ from the estimate, stock-based compensation expense is adjusted accordingly.
Loss Contingencies
The Company is subject to a variety of loss contingencies that could arise during the Company’s conduct of business. Management considers the likelihood of a loss or impairment of an asset or the incurrence of a liability, as well as the Company’s ability to reasonably estimate the amount of loss, in determining potential loss contingencies. An estimated loss contingency is accrued when it is probable that a liability has been incurred or an asset has been impaired and the amount of loss can be reasonably estimated. Accruals for loss contingencies have not been recorded during the past three years. The Company regularly evaluates current information available to determine whether such accruals should be made or adjusted.
Recent Accounting Pronouncements
Recent accounting pronouncements which may impact the Company are described in Note 2 – “Summary of Significant Accounting Policies” in Part II, Item 8 – “Financial Statements and Supplementary Data” of this Annual Report.
Item 7A. Quantitative and Qualitative Disclosures About Market Risk.
The Company is exposed to market risk from changes in interest rates, foreign currency exchange rates, and commodity prices. Market risk is measured as the potential negative impact on earnings, cash flows, or fair values resulting from a hypothetical change in interest rates, commodity prices, or foreign currency exchange rates over the next year. The Company manages exposure to market risks at the corporate level. The portfolio of interest-sensitive assets and liabilities is monitored and adjusted to provide liquidity necessary to satisfy anticipated short-term needs. The Company’s risk management policies allow the use of specified financial instruments for hedging purposes only. Speculation on interest rates or foreign currency rates is not permitted. The Company does not consider any of these risk management activities to be material.
Interest Rate Risk
The Company is exposed to the impact of interest rate changes on any outstanding indebtedness under the revolving credit facility agreement and the term loan agreement both of which have a variable interest rate. The interest rate on advances under the revolving credit facility varies based on the level of borrowing under the revolving credit facility. Rates range (a)
between PNC Bank’s base lending rate plus 1.5% to 2.0% or (b) between the London Interbank Offered Rate (LIBOR) plus 2.5% to 3.0%. PNC Bank’s base lending rate was 5.50% at December 31, 2018, and would have permitted borrowing at rates ranging between 7.00% and 7.50%. The Company is required to pay a monthly facility fee of 0.25% on any unused amount under the commitment based on daily averages. At December 31, 2018, $49.7 million was outstanding under the revolving credit facility, with $(0.3) million borrowed as base rate loans at an interest rate of 7.50% and $50.0 millionborrowed as LIBOR loans at an interest rate of 5.51%.
The amount borrowed under the term loan was reset to $10.0 million as of September 30, 2016. Monthly principal payments of $0.2 million were required. On May 22, 2017, the Company repaid the outstanding balance of the term loan. No additional amount may be re-borrowed under the term loan.
Foreign Currency Exchange Risk
The Company presently has limited exposure to foreign currency risk. As a global company, Flotek operates in over 20 domestic and international markets. Flotek’s functional

38
currency is primarily the U.S. dollar. During 2018, approximately 3.0% of revenue was demarcated in non-U.S. dollar currencies and virtually all assets and liabilities of the Company are denominated in U.S. dollars. However, as the Company expands its international operations, non-U.S. denominated activity is likely to increase. The Company has historically performed no swaps and no foreign currency hedges. The Company may utilize swaps or foreign currency hedges in the future.
Commodity Risk
The Company purchases raw materials derived from citrus oils and, therefore, has a commodity risk inherent in orange harvests. In recent years, citrus greening has disrupted citrus
fruit production in Florida and Brazil which caused raw material feedstock cost to increase. Tropical storms and hurricanes, as experienced during 2017, can also impact the future citrus crop yields in growing regions. The Company believes that adequate global supply is available to meet the Company’s needs. The Company primarily relies upon long-term strategic supply relationships to meet its raw material needs which are expected to remain in place for the foreseeable future. Price increases have been passed along to the Company’s customers, where applicable. The Company presently does not have any commodity futures contracts but may consider utilizing forms of hedging from time to time in the future.

39
Item 8. Financial Statements and Supplementary Data.
REPORT OF INDEPENDENT REGISTERED PUBLIC ACCOUNTING FIRM
To the Stockholders and the Board of Directors ofFlotek Industries, Inc.
Opinion on Internal Control over Financial Reporting
We have audited Flotek Industries, Inc. and subsidiaries’ (the “Company”) internal control over financial reporting as of December 31, 2018, based on criteria established in Internal Control - Integrated Framework 2013 issued by the Committee of Sponsoring Organizations of the Treadway Commission (“COSO”). In our opinion, the Company maintained, in all material respects, effective control over financial reporting as of December 31, 2018, based on criteria established in Internal Control - Integrated Framework 2013 issued by COSO.
We also have audited, in accordance with the standards of the Public Company Accounting Oversight Board (United States) (“PCAOB”), the consolidated balance sheets of Flotek Industries, Inc. and subsidiaries as of December 31, 2018 and 2017, the related consolidated statements of operations, comprehensive income (loss), equity and cash flows for the years then ended, and the related notes (collectively referred to as the “consolidated financial statements”) and our report dated March 8, 2019 expressed an unqualified opinion on those consolidated financial statements.
Basis for Opinion
The Company’s management is responsible for maintaining effective internal control over financial reporting and for its assessment of the effectiveness of internal control over financial reporting, included in the accompanying Management’s Report on Internal Control over Financial Reporting. Our responsibility is to express an opinion on the Company’s internal control over financial reporting based on our audit. We are a public accounting firm registered with the PCAOB and are required to be independent with respect to the Company in accordance with the U.S. federal securities laws and the applicable rules and regulations of the Securities and Exchange Commission and the PCAOB.
We conducted our audit in accordance with the standards of the PCAOB. Those standards require that we plan and perform the audit to obtain reasonable assurance about whether effective internal control over financial reporting was maintained in all material respects. Our audit included obtaining an understanding of internal control over financial reporting, assessing the risk that a material weakness exists, and testing and evaluating the design and operating effectiveness of internal control based on the assessed risk. Our audit also included performing such other procedures as we considered necessary in the circumstances. We believe that our audit provides a reasonable basis for our opinion.
Definition and Limitations of Internal Control over Financial Reporting
A company’s internal control over financial reporting is a process designed to provide reasonable assurance regarding the reliability of financial reporting and the preparation of financial statements for external purposes in accordance with generally accepted accounting principles. A company’s internal control over financial reporting includes those policies and procedures that (1) pertain to the maintenance of records that, in reasonable detail, accurately and fairly reflect the transactions and dispositions of the assets of the company; (2) provide reasonable assurance that transactions are recorded as necessary to permit preparation of financial statements in accordance with generally accepted accounting principles, and that receipts and expenditures of the company are being made only in accordance with authorizations of management and directors of the company; and (3) provide reasonable assurance regarding prevention or timely detection of unauthorized acquisition, use, or disposition of the company’s assets that could have a material effect on the financial statements.
Because of its inherent limitations, internal control over financial reporting may not prevent or detect misstatements. Also, projections of any evaluation of effectiveness to future periods are subject to the risk that controls may become inadequate because of changes in conditions, or that the degree of compliance with the policies or procedures may deteriorate.
/s/ MOSS ADAMS LLP
Houston, TexasMarch 8, 2019

40
REPORT OF INDEPENDENT REGISTERED PUBLIC ACCOUNTING FIRM
To the Stockholders and the Board of Directors ofFlotek Industries, Inc.
Opinion on the Financial Statements
We have audited the accompanying consolidated balance sheets of Flotek Industries, Inc. and subsidiaries (the “Company”) as of December 31, 2018 and 2017, the related consolidated statements of operations, comprehensive income (loss), equity and cash flows for the years then ended, and the related notes (collectively referred to as the “consolidated financial statements”). In our opinion, the consolidated financial statements present fairly, in all material respects, the consolidated financial position of the Company as of December 31, 2018 and 2017, and the consolidated results of their operations and their cash flows for the years then ended, in conformity with accounting principles generally accepted in the United States of America.
We also have audited, in accordance with the standards of the Public Company Accounting Oversight Board (United States) (“PCAOB”), the Company’s internal control over financial reporting as of December 31, 2018, based on criteria established in Internal Control - Integrated Framework 2013 issued by the Committee of Sponsoring Organizations of the Treadway Commission and our report dated March 8, 2019 expressed an unqualified opinion on the Company’s internal control over financial reporting.
Change in Accounting Principle
As discussed in Note 7 to the consolidated financial statements, the Company changed its method of accounting for recognizing revenue due to the adoption of Accounting Standards Codification Topic No. 606.
Basis for Opinion
These consolidated financial statements are the responsibility of the Company’s management. Our responsibility is to express an opinion on the Company’s consolidated financial statements based on our audits. We are a public accounting firm registered with the PCAOB and are required to be independent with respect to the Company in accordance with the U.S. federal securities laws and the applicable rules and regulations of the Securities and Exchange Commission and the PCAOB.
We conducted our audits in accordance with the standards of the PCAOB. Those standards require that we plan and perform the audit to obtain reasonable assurance about whether the consolidated financial statements are free of material misstatement, whether due to error or fraud. Our audits included performing procedures to assess the risks of material misstatement of the consolidated financial statements, whether due to error or fraud, and performing procedures to respond to those risks. Such procedures included examining, on a test basis, evidence regarding the amounts and disclosures in the consolidated financial statements. Our audits also included evaluating the accounting principles used and significant estimates made by management, as well as evaluating the overall presentation of the consolidated financial statements. We believe that our audits provide a reasonable basis for our opinion.
/s/ MOSS ADAMS LLP
Houston, TexasMarch 8, 2019
We have served as the Company’s independent registered public accounting firm since 2017.

41
REPORT OF INDEPENDENT REGISTERED PUBLIC ACCOUNTING FIRM
To the Board of Directors and StockholdersFlotek Industries, Inc.
We have audited the accompanying consolidated statements of operations, comprehensive income (loss), equity and cash flows of Flotek Industries, Inc. and subsidiaries for the period ended December 31, 2016. These financial statements are the responsibility of the company’s management. Our responsibility is to express an opinion on these financial statements based on our audit.
We conducted our audit in accordance with the standards of the Public Company Accounting Oversight Board (United States). Those standards require that we plan and perform the audit to obtain reasonable assurance about whether the financial statements are free of material misstatement. An audit includes examining, on a test basis, evidence supporting the amounts and disclosures in the financial statements. An audit also includes assessing the accounting principles used and significant estimates made by management, as well as evaluating the overall financial statement presentation. We believe that our audit provides a reasonable basis for our opinion.
In our opinion, the consolidated financial statements referred to above present fairly, in all material respects, the results of operations and cash flows of Flotek Industries, Inc. and subsidiaries for the year ended December 31, 2016, in conformity with U.S. generally accepted accounting principles.
/s/ HEIN & ASSOCIATES LLP
Houston, TexasFebruary 8, 2017
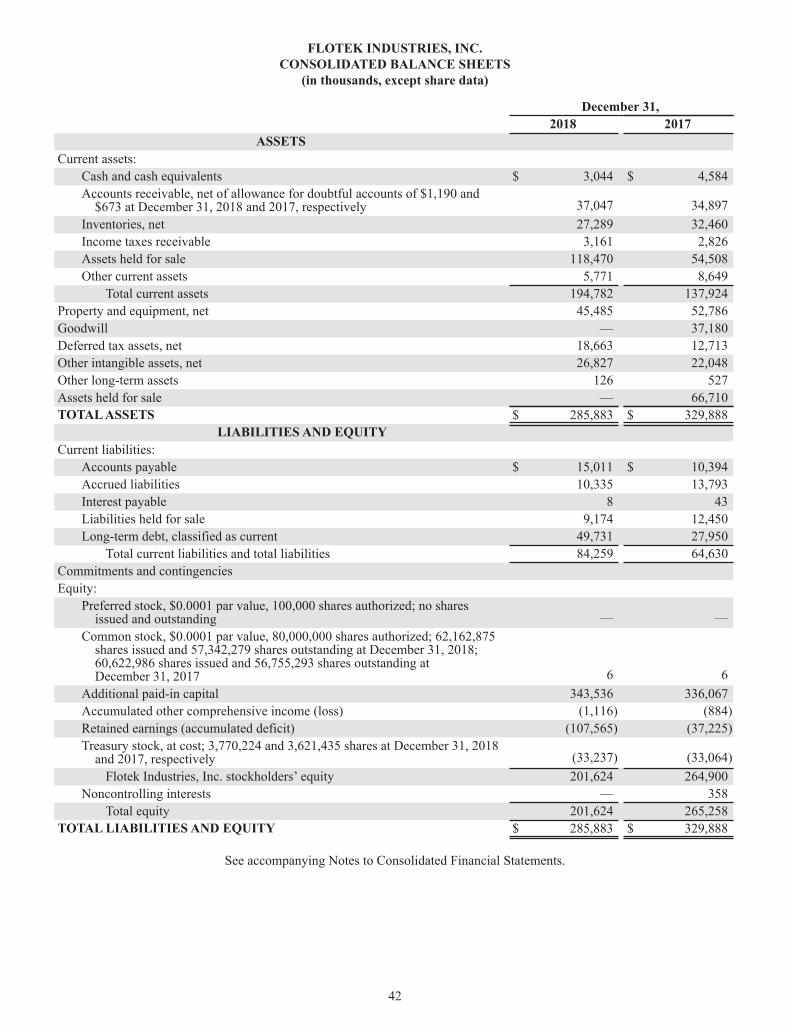
42
FLOTEK INDUSTRIES, INC.CONSOLIDATED BALANCE SHEETS
(in thousands, except share data)
December 31,2018 2017
ASSETSCurrent assets:
Cash and cash equivalents $ 3,044 $ 4,584Accounts receivable, net of allowance for doubtful accounts of $1,190 and $673 at December 31, 2018 and 2017, respectively 37,047 34,897Inventories, net 27,289 32,460Income taxes receivable 3,161 2,826Assets held for sale 118,470 54,508Other current assets 5,771 8,649
Total current assets 194,782 137,924Property and equipment, net 45,485 52,786Goodwill — 37,180Deferred tax assets, net 18,663 12,713Other intangible assets, net 26,827 22,048Other long-term assets 126 527Assets held for sale — 66,710TOTAL ASSETS $ 285,883 $ 329,888
LIABILITIES AND EQUITYCurrent liabilities:
Accounts payable $ 15,011 $ 10,394Accrued liabilities 10,335 13,793Interest payable 8 43Liabilities held for sale 9,174 12,450Long-term debt, classified as current 49,731 27,950
Total current liabilities and total liabilities 84,259 64,630Commitments and contingenciesEquity:
Preferred stock, $0.0001 par value, 100,000 shares authorized; no shares issued and outstanding — —Common stock, $0.0001 par value, 80,000,000 shares authorized; 62,162,875 shares issued and 57,342,279 shares outstanding at December 31, 2018; 60,622,986 shares issued and 56,755,293 shares outstanding at December 31, 2017 6 6Additional paid-in capital 343,536 336,067Accumulated other comprehensive income (loss) (1,116) (884)Retained earnings (accumulated deficit) (107,565) (37,225)Treasury stock, at cost; 3,770,224 and 3,621,435 shares at December 31, 2018 and 2017, respectively (33,237) (33,064)
Flotek Industries, Inc. stockholders’ equity 201,624 264,900Noncontrolling interests — 358
Total equity 201,624 265,258TOTAL LIABILITIES AND EQUITY $ 285,883 $ 329,888
See accompanying Notes to Consolidated Financial Statements.
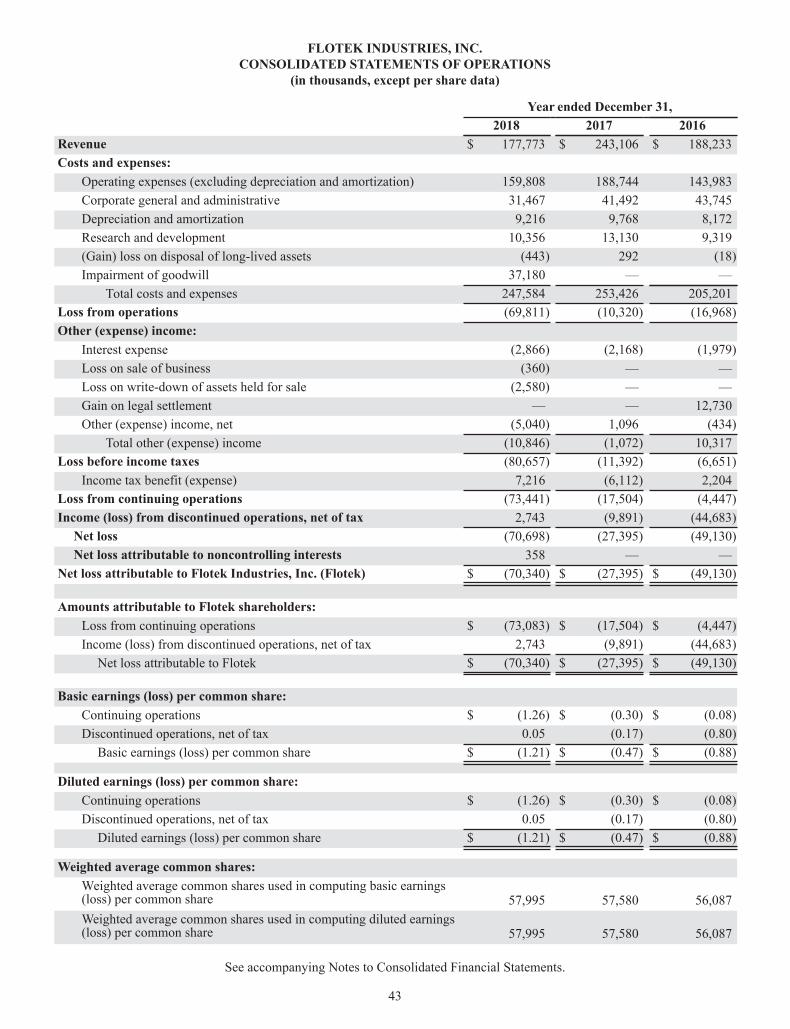
43
FLOTEK INDUSTRIES, INC.CONSOLIDATED STATEMENTS OF OPERATIONS
(in thousands, except per share data)
Year ended December 31, 2018 2017 2016Revenue $ 177,773 $ 243,106 $ 188,233Costs and expenses:
Operating expenses (excluding depreciation and amortization) 159,808 188,744 143,983Corporate general and administrative 31,467 41,492 43,745Depreciation and amortization 9,216 9,768 8,172Research and development 10,356 13,130 9,319(Gain) loss on disposal of long-lived assets (443) 292 (18)Impairment of goodwill 37,180 — —
Total costs and expenses 247,584 253,426 205,201Loss from operations (69,811) (10,320) (16,968)Other (expense) income:
Interest expense (2,866) (2,168) (1,979)Loss on sale of business (360) — —Loss on write-down of assets held for sale (2,580) — —Gain on legal settlement — — 12,730Other (expense) income, net (5,040) 1,096 (434)
Total other (expense) income (10,846) (1,072) 10,317Loss before income taxes (80,657) (11,392) (6,651)
Income tax benefit (expense) 7,216 (6,112) 2,204Loss from continuing operations (73,441) (17,504) (4,447)Income (loss) from discontinued operations, net of tax 2,743 (9,891) (44,683)
Net loss (70,698) (27,395) (49,130)Net loss attributable to noncontrolling interests 358 — —
Net loss attributable to Flotek Industries, Inc. (Flotek) $ (70,340) $ (27,395) $ (49,130)
Amounts attributable to Flotek shareholders:Loss from continuing operations $ (73,083) $ (17,504) $ (4,447)Income (loss) from discontinued operations, net of tax 2,743 (9,891) (44,683)
Net loss attributable to Flotek $ (70,340) $ (27,395) $ (49,130)
Basic earnings (loss) per common share:Continuing operations $ (1.26) $ (0.30) $ (0.08)Discontinued operations, net of tax 0.05 (0.17) (0.80)
Basic earnings (loss) per common share $ (1.21) $ (0.47) $ (0.88)
Diluted earnings (loss) per common share:Continuing operations $ (1.26) $ (0.30) $ (0.08)Discontinued operations, net of tax 0.05 (0.17) (0.80)
Diluted earnings (loss) per common share $ (1.21) $ (0.47) $ (0.88)
Weighted average common shares:Weighted average common shares used in computing basic earnings(loss) per common share 57,995 57,580 56,087Weighted average common shares used in computing diluted earnings(loss) per common share 57,995 57,580 56,087
See accompanying Notes to Consolidated Financial Statements.
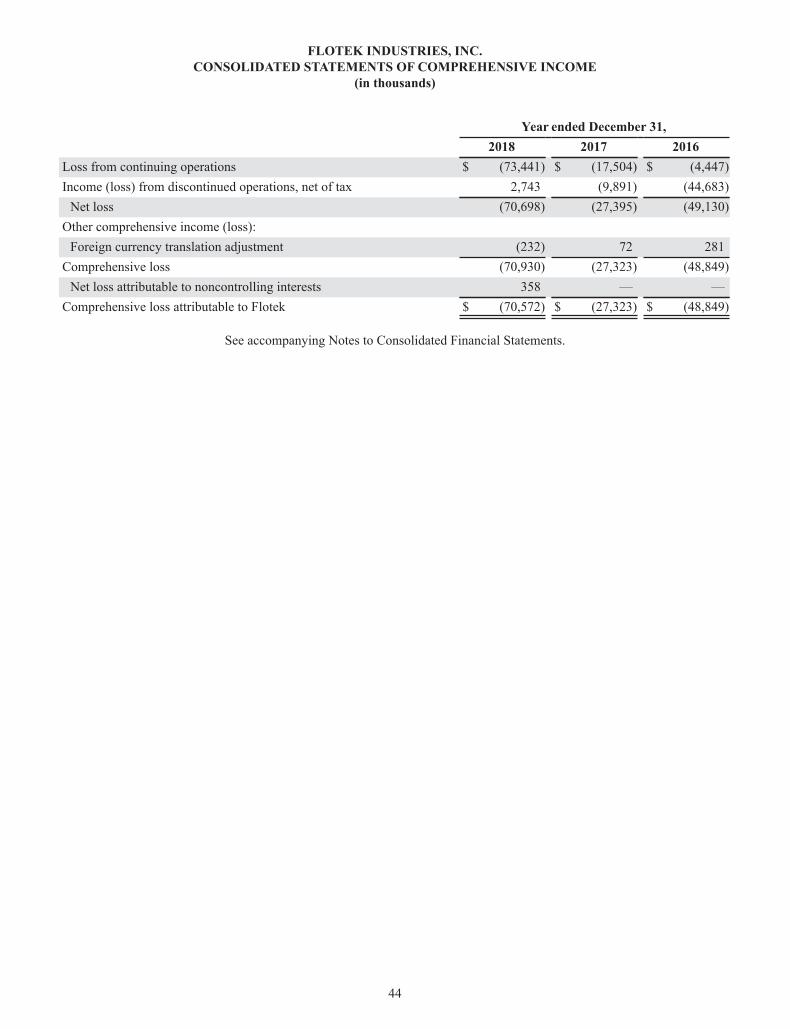
44
FLOTEK INDUSTRIES, INC.CONSOLIDATED STATEMENTS OF COMPREHENSIVE INCOME
(in thousands)
Year ended December 31,2018 2017 2016
Loss from continuing operations $ (73,441) $ (17,504) $ (4,447)Income (loss) from discontinued operations, net of tax 2,743 (9,891) (44,683)
Net loss (70,698) (27,395) (49,130)Other comprehensive income (loss):
Foreign currency translation adjustment (232) 72 281Comprehensive loss (70,930) (27,323) (48,849)
Net loss attributable to noncontrolling interests 358 — —Comprehensive loss attributable to Flotek $ (70,572) $ (27,323) $ (48,849)
See accompanying Notes to Consolidated Financial Statements.

45
FLOTEK INDUSTRIES, INC. CONSOLIDATED STATEMENTS OF EQUITY
(in thousands)
Common Stock Treasury StockAdditional
Paid-inCapital
AccumulatedOther
ComprehensiveIncome (Loss)
Retained Earnings
(AccumulatedDeficit)
Non-controllingInterests
TotalEquity
SharesIssued
ParValue Shares Cost
Balance, December 31, 2015 56,220 $ 6 1,785 $ (17,869) $ 273,451 $ (1,237) $ 39,300 $ 358 $ 294,009Net loss — — — — — — (49,130) — (49,130)Foreign currency translation adjustment — — — — — 281 — — 281Sale of common stock, net of issuance cost 2,450 — — — 30,090 — — — 30,090Stock issued under employee stock purchase plan — — (93) — 833 — — — 833Stock options exercised 114 — — — 184 — — — 184Restricted stock granted 653 — — — — — — — —Restricted stock forfeited — — 96 — — — — — —Treasury stock purchased — — 238 (2,350) — — — — (2,350)Stock surrendered for exercise of stock options — — 3 (50) — — — — (50)Excess tax benefit related to share-based awards — — — — (2,510) — — — (2,510)Stock compensation expense — — — — 13,076 — — — 13,076Stock issued in IAL acquisition 248 — — — 3,268 — — — 3,268
Balance, December 31, 2016 59,685 $ 6 2,029 $ (20,269) $ 318,392 $ (956) $ (9,830) $ 358 $ 287,701Net loss — — — — — — (27,395) — (27,395)Foreign currency translation adjustment — — — — — 72 — — 72Stock issued under employee stock purchase plan — — (113) — 654 — — — 654Common stock issued in payment of accrued liability — — — — 188 — — — 188Stock options exercised 663 — — — 5,884 — — — 5,884Restricted stock granted 275 — — — — — — — —Restricted stock forfeited — — 122 — — — — — —Treasury stock purchased — — 200 (1,729) — — — — (1,729)Stock surrendered for exercise of stock options — — 478 (5,863) — — — — (5,863)Stock compensation expense — — — — 10,949 — — — 10,949Stock issued in IPI acquisition — — — — — — — — —Repurchase of common stock — — 905 (5,203) — — — — (5,203)
Balance, December 31, 2017 60,623 $ 6 3,621 $ (33,064) $ 336,067 $ (884) $ (37,225) $ 358 $ 265,258Net loss — — — — — — (70,340) (358) (70,698)Foreign currency translation adjustment — — — — — (232) — — (232)Stock issued under employee stock purchase plan — — (111) — 341 — — — 341Restricted stock granted 1,540 — — — — — — — —Restricted stock forfeited — — 158 — — — — — —Treasury stock purchased — — 102 (173) — — — — (173)Stock compensation expense — — — — 7,128 — — — 7,128
Balance, December 31, 2018 62,163 $ 6 3,770 $ (33,237) $ 343,536 $ (1,116) $ (107,565) $ — $ 201,624
See accompanying Notes to Consolidated Financial Statements.

46
FLOTEK INDUSTRIES, INC.CONSOLIDATED STATEMENTS OF CASH FLOWS
(in thousands)
Year ended December 31, 2018 2017 2016Cash flows from operating activities:
Net loss attributable to Flotek Industries, Inc. (Flotek) $ (70,340) $ (27,395) $ (49,130)Income (loss) from discontinued operations, net of tax 2,743 (9,891) (44,683)Loss from continuing operations (73,083) (17,504) (4,447)
Adjustments to reconcile loss from continuing operations to net cash (used in) provided by operatingactivities:
Depreciation and amortization 9,216 9,768 8,172Amortization of deferred financing costs 400 472 424Provision for doubtful accounts 839 157 482Provision for excess and obsolete inventory 2,418 388 —Loss on sale of business 360 — —Loss on write-down of assets held for sale 2,580 — —(Gain) loss on sale of assets (443) 292 (18)Impairment of goodwill 37,180 — —Stock compensation expense 7,050 10,643 11,446Deferred income tax (benefit) provision (5,950) 181 (19,681)Reduction in tax benefit related to share-based awards 709 1,989 2,510Changes in current assets and liabilities:
Accounts receivable, net (2,606) 4,076 (10,905)Inventories 2,597 (3,442) (1,463)Income taxes receivable (1,116) 8,008 (8,189)Other current assets 3,177 12,001 (14,296)Accounts payable 4,631 (8,528) 6,365Accrued liabilities (8,740) (6,175) 32,769Income taxes payable — — (1,890)Interest payable (35) 19 (87)
Net cash (used in) provided by operating activities (20,816) 12,345 1,192Cash flows from investing activities:
Capital expenditures (3,559) (4,197) (13,072)Proceeds from sale of businesses 1,665 18,490 —Proceeds from sale of assets 1,387 689 115Payments for acquisitions, net of cash acquired — — (7,863)Purchase of patents and other intangible assets (1,602) (456) (599)
Net cash (used in) provided by investing activities (2,109) 14,526 (21,419)Cash flows from financing activities:
Repayments of indebtedness — (9,833) (15,564)Borrowings on revolving credit facility 277,599 383,160 338,460Repayments on revolving credit facility (255,818) (393,776) (325,043)Debt issuance costs (111) (579) (1,199)Reduction in tax benefit related to share-based awards — — (2,510)Purchase of treasury stock (173) (1,729) (2,350)Proceeds from sale of common stock 341 654 30,923Repurchase of common stock — (5,203) —Proceeds from exercise of stock options — 21 134Loss from noncontrolling interest (358) — —
Net cash provided by (used in) financing activities 21,480 (27,285) 22,851Discontinued operations:
Net cash provided by operating activities 1,296 4,102 874Net cash used in investing activities (1,303) (4,078) (880)
Net cash flows (used in) provided by discontinued operations (7) 24 (6)Effect of changes in exchange rates on cash and cash equivalents (88) 151 (3)
Net (decrease) increase in cash and cash equivalents (1,540) (239) 2,615Cash and cash equivalents at beginning of year 4,584 4,823 2,208Cash and cash equivalents at end of year $ 3,044 $ 4,584 $ 4,823
See accompanying Notes to Consolidated Financial Statements.

47
FLOTEK INDUSTRIES, INC.NOTES TO CONSOLIDATED FINANCIAL STATEMENTS
Note 1 — Organization and Nature of Operations
Flotek Industries, Inc. (“Flotek” or the “Company”) is a global, diversified, technology-driven company that develops and supplies chemistries and services to the oil and gas industries. Flotek also supplied high value compounds to companies that make food and beverages, cleaning products, cosmetics, and other products that are sold in consumer and industrial markets, classified as discontinued operations at December 31, 2018.
The Company’s oilfield business includes specialty chemistries and logistics which enable its customers in pursuing improved efficiencies in the drilling and completion of their wells. The Company also provides automated bulk material handling, loading facilities, and blending capabilities. In the segment reported as discontinued operations at December 31, 2018, the Company processed citrus oil to produce (1) high value compounds used as additives by companies in the flavors and fragrances markets and (2) environmentally friendly chemistries for use in numerous
industries around the world, including the oil and gas (“O&G”) industry.
Flotek operates in over 20 domestic and international markets. Customers include major integrated O&G companies, oilfield services companies, independent O&G companies, pressure-pumping service companies, national and state-owned oil companies, and international supply chain management companies. The Company also served customers who purchase non-energy-related citrus oil and related products, including household and commercial cleaning product companies, fragrance and cosmetic companies, and food manufacturing companies, reported as discontinued operations at December 31, 2018.
Flotek was initially incorporated under the laws of the Province of British Columbia on May 17, 1985. On October 23, 2001, Flotek changed its corporate domicile to the state of Delaware.
Note 2 — Summary of Significant Accounting Policies
Basis of Presentation
The Company’s consolidated financial statements have been prepared in accordance with the accounting principles generally accepted in the United States of America (“U.S. GAAP”).
The consolidated financial statements include the accounts of Flotek Industries, Inc. and all wholly-owned subsidiary corporations. Where Flotek owns less than 100% of the share capital of its subsidiaries, but is still considered to have sufficient ownership to control the business, results of the business operations are consolidated within the Company’s financial statements. The ownership interests held by other parties are shown as noncontrolling interests.
During the fourth quarter of 2018, the Company classified the Consumer and Industrial Chemistry Technologies segment as held for sale based on management’s intention to sell this business. In addition, during the fourth quarter of 2016, the Company classified the Drilling Technologies and Production Technologies segments as held for sale based on management’s intention to sell these businesses. The Company’s historical financial statements have been revised to present the operating results of the Consumer and Industrial Chemistry Technologies, Drilling Technologies, and Production Technologies segments as discontinued operations. The results of operations of these segments are presented as “Loss from discontinued operations” in the statement of operations and the related cash flows of these segments has been reclassified to discontinued operations for all periods presented. The assets and liabilities of the
Consumer and Industrial Chemistry Technologies segment have been reclassified to “Assets held for sale” and “Liabilities held for sale”, respectively, in the consolidated balance sheet for all periods presented.
During 2017, the Company completed the sale or disposal of the assets and transfer or liquidation of liabilities and obligations of each of the Drilling Technologies and Production Technologies segments.
All significant intercompany accounts and transactions have been eliminated in consolidation. The Company does not have investments in any unconsolidated subsidiaries.
Cash Equivalents
Cash equivalents consist of highly liquid investments with maturities of three months or less at the date of purchase.
Cash Management
The Company uses a controlled disbursement account for its main cash account. Under this system, outstanding checks can be in excess of the cash balances at the bank before the disbursement account is funded, creating a book overdraft. Book overdrafts on this account are presented as a current liability in accounts payable in the consolidated balance sheets.
Accounts Receivable and Allowance for Doubtful Accounts
Accounts receivable arise from product sales and services and are stated at estimated net realizable value. This value
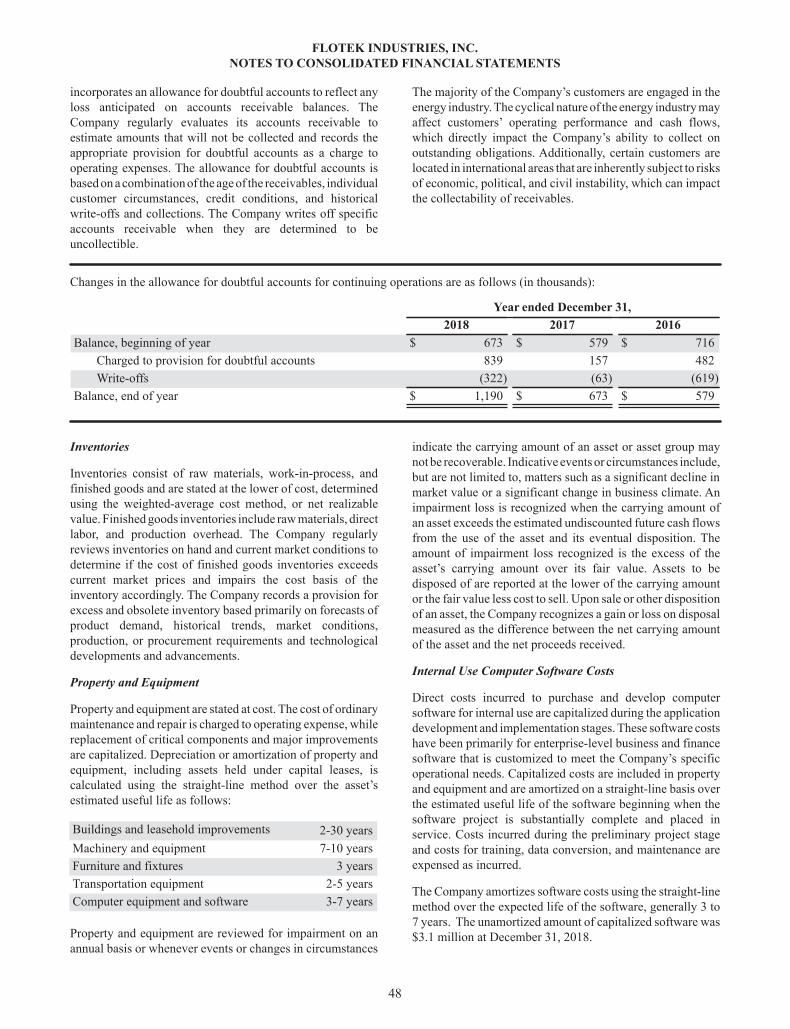
FLOTEK INDUSTRIES, INC.NOTES TO CONSOLIDATED FINANCIAL STATEMENTS
48
incorporates an allowance for doubtful accounts to reflect any loss anticipated on accounts receivable balances. The Company regularly evaluates its accounts receivable to estimate amounts that will not be collected and records the appropriate provision for doubtful accounts as a charge to operating expenses. The allowance for doubtful accounts is based on a combination of the age of the receivables, individual customer circumstances, credit conditions, and historical write-offs and collections. The Company writes off specific accounts receivable when they are determined to be uncollectible.
The majority of the Company’s customers are engaged in the energy industry. The cyclical nature of the energy industry may affect customers’ operating performance and cash flows, which directly impact the Company’s ability to collect on outstanding obligations. Additionally, certain customers are located in international areas that are inherently subject to risks of economic, political, and civil instability, which can impact the collectability of receivables.
Changes in the allowance for doubtful accounts for continuing operations are as follows (in thousands):
Year ended December 31, 2018 2017 2016Balance, beginning of year $ 673 $ 579 $ 716
Charged to provision for doubtful accounts 839 157 482Write-offs (322) (63) (619)
Balance, end of year $ 1,190 $ 673 $ 579
Inventories
Inventories consist of raw materials, work-in-process, and finished goods and are stated at the lower of cost, determined using the weighted-average cost method, or net realizable value. Finished goods inventories include raw materials, direct labor, and production overhead. The Company regularly reviews inventories on hand and current market conditions to determine if the cost of finished goods inventories exceeds current market prices and impairs the cost basis of the inventory accordingly. The Company records a provision for excess and obsolete inventory based primarily on forecasts of product demand, historical trends, market conditions, production, or procurement requirements and technological developments and advancements.
Property and Equipment
Property and equipment are stated at cost. The cost of ordinary maintenance and repair is charged to operating expense, while replacement of critical components and major improvements are capitalized. Depreciation or amortization of property and equipment, including assets held under capital leases, is calculated using the straight-line method over the asset’s estimated useful life as follows:
Buildings and leasehold improvements 2-30 yearsMachinery and equipment 7-10 yearsFurniture and fixtures 3 yearsTransportation equipment 2-5 yearsComputer equipment and software 3-7 years
Property and equipment are reviewed for impairment on an annual basis or whenever events or changes in circumstances
indicate the carrying amount of an asset or asset group may not be recoverable. Indicative events or circumstances include, but are not limited to, matters such as a significant decline in market value or a significant change in business climate. An impairment loss is recognized when the carrying amount of an asset exceeds the estimated undiscounted future cash flows from the use of the asset and its eventual disposition. The amount of impairment loss recognized is the excess of the asset’s carrying amount over its fair value. Assets to be disposed of are reported at the lower of the carrying amount or the fair value less cost to sell. Upon sale or other disposition of an asset, the Company recognizes a gain or loss on disposal measured as the difference between the net carrying amount of the asset and the net proceeds received.
Internal Use Computer Software Costs
Direct costs incurred to purchase and develop computer software for internal use are capitalized during the application development and implementation stages. These software costs have been primarily for enterprise-level business and finance software that is customized to meet the Company’s specific operational needs. Capitalized costs are included in property and equipment and are amortized on a straight-line basis over the estimated useful life of the software beginning when the software project is substantially complete and placed in service. Costs incurred during the preliminary project stage and costs for training, data conversion, and maintenance are expensed as incurred.
The Company amortizes software costs using the straight-line method over the expected life of the software, generally 3 to 7 years. The unamortized amount of capitalized software was $3.1 million at December 31, 2018.

FLOTEK INDUSTRIES, INC.NOTES TO CONSOLIDATED FINANCIAL STATEMENTS
49
Goodwill
Goodwill is the excess of cost of an acquired entity over the amounts assigned to identifiable assets acquired and liabilities assumed in a business combination. Goodwill is not subject to amortization, but is tested for impairment annually during the fourth quarter, or more frequently if an event occurs or circumstances change that would indicate a potential impairment. These circumstances may include an adverse change in the business climate or a change in the assessment of future operations of a reporting unit.
The Company assesses whether a goodwill impairment exists using both qualitative and quantitative assessments. The qualitative assessment involves determining whether events or circumstances exist that indicate it is more likely than not that the fair value of a reporting unit is less than its carrying amount, including goodwill. If, based on this qualitative assessment, it is determined that it is not more likely than not that the fair value of a reporting unit is less than its carrying amount, the Company does not perform a quantitative assessment.
If the qualitative assessment indicates that it is more likely than not that the fair value of a reporting unit is less than its carrying amount or if the Company elects not to perform a qualitative assessment, a quantitative impairment test is performed to determine whether goodwill impairment exists at the reporting unit.
The quantitative impairment test, used to identify both the existence of impairment and the amount of impairment loss, compares the estimated fair value of each reporting unit with goodwill to its carrying amount, including goodwill. To determine fair value estimates, the Company uses the income approach based on discounted cash flow analyses, combined, when appropriate, with a market-based approach. The market-based approach considers valuation comparisons of recent public sale transactions of similar businesses and earnings multiples of publicly traded businesses operating in industries consistent with the reporting unit. If the carrying amount of a reporting unit, including goodwill, exceeds its fair value, an impairment loss is recognized in an amount equal to that excess, limited to the amount of goodwill allocated to that reporting unit.
Other Intangible Assets
The Company’s other intangible assets have finite and indefinite lives and consist of customer relationships, trademarks, brand names, and purchased patents.
The cost of intangible assets with finite lives is amortized using the straight-line method over the estimated period of economic benefit, ranging from 2 to 95 years. Asset lives are adjusted whenever there is a change in the estimated period of economic benefit. No residual value has been assigned to these intangible assets.
Intangible assets with finite lives are tested for impairment whenever events or changes in circumstances indicate the carrying amount may not be recoverable. These conditions may include a change in the extent or manner in which the asset is being used or a change in future operations. The Company assesses the recoverability of the carrying amount by preparing estimates of future revenue, margins, and cash flows. If the sum of expected future cash flows (undiscounted and without interest charges) is less than the carrying amount, an impairment loss is recognized. The impairment loss recognized is the amount by which the carrying amount exceeds the fair value. Fair value of these assets may be determined by a variety of methodologies, including discounted cash flow models.
Intangible assets with indefinite lives are not subject to amortization, but are tested for impairment annually during the fourth quarter, or more frequently if an event occurs or circumstances change that would indicate a potential impairment. These circumstances may include, but are not limited to, a significant adverse change in the business climate, unanticipated competition, or a change in projected operations or results of a reporting unit.
The Company assesses whether an indefinite lived intangible impairment exists using both qualitative and quantitative assessments. The qualitative assessment involves determining whether events or circumstances exist that indicate it is more likely than not that the fair value of the indefinite lived intangible is less than its carrying amount. If, based on this qualitative assessment, it is determined that it is not more likely than not that the fair value of the indefinite lived intangible is less than its carrying amount, the Company does not perform a quantitative assessment.
If the qualitative assessment indicates that it is more likely than not that the indefinite-lived intangible asset is impaired or if the Company elects to not perform a qualitative assessment, the Company then performs the quantitative impairment test. The quantitative impairment test for an indefinite-lived intangible asset consists of a comparison of the fair value of the asset with its carrying amount. If the carrying amount of an intangible asset exceeds its fair value, an impairment loss is recognized in an amount equal to that excess. Fair value of these assets may be determined by a variety of methodologies, including discounted cash flows.
Business Combinations
The Company includes the results of operations of its acquisitions in its consolidated results, prospectively from the date of acquisition. Acquisitions are accounted for by applying the acquisition method. The Company allocates the fair value of purchase consideration to the assets acquired, liabilities assumed, and any noncontrolling interests in the acquired entity generally based on their fair values at the acquisition date. The excess of the fair value of purchase consideration over the fair value of these assets acquired, liabilities assumed,

FLOTEK INDUSTRIES, INC.NOTES TO CONSOLIDATED FINANCIAL STATEMENTS
50
and any noncontrolling interests in the acquired entity is recorded as goodwill. The primary items that generate goodwill include the value of the synergies between the acquired company and Flotek and the value of the acquired assembled workforce. Acquisition-related expenses are recognized separately from the business acquisition and are recognized as expenses as incurred.
Fair Value Measurements
The Company categorizes financial assets and liabilities using a three-tier fair value hierarchy, based on the nature of the inputs used to determine fair value. Inputs refer broadly to assumptions market participants would use to value an asset or liability and may be observable or unobservable. The hierarchy gives the highest priority to quoted prices in active markets for identical assets or liabilities (level 1) and the lowest priority to unobservable inputs (level 3). “Level 1” measurements are measurements using quoted prices in active markets for identical assets and liabilities. “Level 2” measurements are measurements using quoted prices in markets that are not active or that are based on quoted prices for similar assets or liabilities. “Level 3” measurements are measurements that use significant unobservable inputs which require a company to develop its own assumptions. When determining the fair value of assets and liabilities, the Company uses the most reliable measurement available.
Revenue Recognition
The Company recognizes revenues to depict the transfer of control of promised goods or services to its customers in an amount that reflects the consideration to which it expects to be entitled in exchange for those goods or services. Refer to Note 7 – “Revenue from Contracts with Customers” for further discussion on Revenue.
The Company recognizes revenue based on the Accounting Standards Codification (“ASC”) 606 five-step model when all of the following criteria have been met: (i) a contract with a customer exists, (ii) performance obligations have been identified, (iii) the price to the customer has been determined, (iv) the price to the customer has been allocated to the performance obligations, and (v) performance obligations are satisfied.
Products and services are sold with fixed or determinable prices. Certain sales include right of return provisions, which are considered when recognizing revenue and deferred accordingly. Deposits and other funds received in advance of delivery are deferred until the transfer of control is complete.
For certain contracts, the Company recognizes revenue under the percentage-of-completion method of accounting, measured by the percentage of “costs incurred to date” to the “total estimated costs of completion.” This percentage is applied to the “total estimated revenue at completion” to calculate proportionate revenue earned to date. For the years ended December 31, 2018, 2017, and 2016, the percentage-
of-completion revenue accounted for less than 0.1% of total revenue during the respective time periods. This resulted in immaterial unfulfilled performance obligations and immaterial contract assets and/or liabilities for which the Company did not record adjustments to opening retained earnings as of December 31, 2015 or for any periods previously presented.
As an accounting policy election, the Company excludes from the measurement of the transaction price all taxes assessed by a governmental authority that are both imposed on and concurrent with a specific revenue-producing transaction and collected by the entity from a customer.
Shipping and handling costs associated with outbound freight after control over a product has transferred to a customer are accounted for as a fulfillment cost and are included in cost of revenues.
Foreign Currency Translation
Financial statements of foreign subsidiaries are prepared using the currency of the primary economic environment of the foreign subsidiaries as the functional currency. Assets and liabilities of foreign subsidiaries are translated into U.S. dollars at exchange rates in effect as of the end of identified reporting periods. Revenue and expense transactions are translated using the average monthly exchange rate for the reporting period. Resultant translation adjustments are recognized as other comprehensive income (loss) within stockholders’ equity.
Comprehensive Income (Loss)
Comprehensive income (loss) encompasses all changes in stockholders’ equity, except those arising from investments from and distributions to stockholders. The Company’s comprehensive income (loss) includes net income (loss) and foreign currency translation adjustments.
Research and Development Costs
Expenditures for research activities relating to product development and improvement are charged to expense as incurred.
Income Taxes
During the year ended December 31, 2015, the Company restructured its legal entities such that there is only one U.S. tax filing group filing a single U.S. consolidated federal income tax return beginning in 2016.
The Company uses the liability method in accounting for income taxes. Deferred tax assets and liabilities are recognized for temporary differences between financial statement carrying amounts and the tax bases of assets and liabilities and are measured using the tax rates expected to be in effect when the differences reverse. Deferred tax assets and liabilities are recognized related to the anticipated future tax effects of

FLOTEK INDUSTRIES, INC.NOTES TO CONSOLIDATED FINANCIAL STATEMENTS
51
temporary differences between the financial statement basis and the tax basis of the Company’s assets and liabilities using statutory tax rates at the applicable year end. Deferred tax assets are also recognized for operating loss and tax credit carry forwards. The effect on deferred tax assets and liabilities of a change in tax rates is recognized in the results of operations in the period that includes the enactment date. A valuation allowance is used to reduce deferred tax assets when uncertainty exists regarding their realization.
A valuation allowance is recorded to reduce previously recorded tax assets when it becomes more likely than not that such assets will not be realized. The Company evaluates, at least annually, net operating loss carry forwards and other net deferred tax assets and considers all available evidence, both positive and negative, to determine whether a valuation allowance is necessary relative to net operating loss carry forwards and other net deferred tax assets. In making this determination, the Company considers cumulative losses in recent years as significant negative evidence. The Company considers recent years to mean the current year plus the two preceding years. The Company considers the recent cumulative income or loss position as objectively verifiable evidence for the projection of future income, which consists primarily of determining the average of the pre-tax income of the current and prior two years after adjusting for certain items not indicative of future performance. Based on this analysis, the Company determines whether a valuation allowance is necessary.
Historically, U.S. Federal income taxes are not provided on unremitted earnings of subsidiaries operating outside the U.S. because it is the Company’s intention to permanently reinvest undistributed earnings in the subsidiary. These earnings would become subject to income tax if they were remitted as dividends or loaned to a U.S. affiliate. Due to the 2017 Tax Cuts and Jobs Act, U.S. federal transition taxes have been recorded at December 31, 2017, for a one-time U.S. tax liability on those earnings which have not previously been repatriated to the U.S. Determination of the amount of unrecognized deferred U.S. income tax liability on these unremitted earnings is not practicable.
The Company has performed an evaluation and concluded that there are no significant uncertain tax positions requiring recognition in the Company’s financial statements.
The Company’s policy is to record interest and penalties related to income tax matters as income tax expense.
Earnings (Loss) Per Share
Basic earnings (loss) per common share is calculated by dividing net income (loss) available to common stockholders by the weighted average number of common shares outstanding for the period. Diluted earnings (loss) per share is calculated by dividing net income (loss) attributable to common stockholders, adjusted for the effect of assumed conversions of convertible notes and preferred stock, by the
weighted average number of common shares outstanding, including potentially dilutive common share equivalents, if the effect is dilutive. Potentially dilutive common shares equivalents consist of incremental shares of common stock issuable upon exercise of stock options and warrants, settlement of restricted stock units, and conversion of convertible notes and convertible preferred stock.
Debt Issuance Costs
Costs related to debt issuance are capitalized and amortized as interest expense over the term of the related debt using the straight-line method, which approximates the effective interest method. Upon the repayment of debt, the Company accelerates the recognition of an appropriate amount of the costs as interest expense.
Capitalization of Interest
Interest costs are capitalized for qualifying in-process software development projects. Capitalization of interest commences when activities to prepare the asset are in progress and expenditures and borrowing costs are being incurred. Interest costs are capitalized until the assets are ready for their intended use. Capitalized interest is added to the cost of the underlying assets and amortized over the estimated useful lives of the assets.
Stock-Based Compensation
Stock-based compensation expense for share-based payments, related to stock options, restricted stock awards, and restricted stock units, is recognized based on their grant-date fair values. The Company recognizes compensation expense, net of estimated forfeitures, on a straight-line basis over the requisite service period of the award. Estimated forfeitures are based on historical experience.
Use of Estimates
The preparation of financial statements in conformity with U.S. GAAP requires management to make estimates and assumptions that affect reported amounts of assets and liabilities, disclosure of contingent assets and liabilities, and reported amounts of revenue and expenses. Actual results could differ from these estimates.
Significant items subject to estimates and assumptions include application of the carrying amount and useful lives of property and equipment and intangible assets, impairment assessments, share-based compensation expense, and valuation allowances for accounts receivable, inventories, and deferred tax assets.
Assets and Liabilities Held for Sale
The Company classifies disposal groups as held for sale in the period in which all of the following criteria are met: (1) management, having the authority to approve the action, commits to a plan to sell the disposal group; (2) the disposal group is available for immediate sale in its present condition

FLOTEK INDUSTRIES, INC.NOTES TO CONSOLIDATED FINANCIAL STATEMENTS
52
subject only to terms that are usual and customary for sales of such disposal groups; (3) an active program to locate a buyer or buyers and other actions required to complete the plan to sell the disposal group have been initiated; (4) the sale of the disposal group is probable, and transfer of the disposal group is expected to qualify for recognition as a completed sale, within one year, except if events of circumstances beyond the Company’s control extend the period of time required to sell the disposal group beyond one year; (5) the disposal group is being actively marketed for sale at a price that is reasonable in relation to its current fair value; and (6) actions required to complete the plan indicate that it is unlikely that significant changes to the plan will be made or that the plan will be withdrawn.
A disposal group that is classified as held for sale is initially measured at the lower of its carrying amount or fair value less any costs to sell. Any loss resulting from this measurement is recognized in the period in which the held for sale criteria are met.
Subsequent changes in the fair value of a disposal group less any costs to sell are reported as an adjustment to the carrying amount of the disposal group, as long as the new carrying amount does not exceed the carrying amount of the asset at the time it was initially classified as held for sale. Upon determining that a disposal group meets the criteria to be classified as held for sale, the Company reports the assets and liabilities of the disposal group for all periods presented in the line items assets held for sale and liabilities held for sale, respectively, in the consolidated balance sheets.
Discontinued Operations
The results of operations of a component of the Company that can be clearly distinguished, operationally and for financial reporting purposes, that either has been disposed of or is classified as held for sale is reported in discontinued operations, if the disposal represents a strategic shift that has, or will have, a major effect on the Company’s operations and financial results.
General corporate overhead is not allocated to discontinued operations for all periods presented. Interest expense on debt required to be repaid as a result of disposal transactions is allocated to discontinued operations. Interest allocated to discontinued operations totaled $0.2 million and $0.4 million for the years ended December 31, 2017 and 2016, respectively.
Reclassifications
Certain prior year amounts have been reclassified to conform to the current year presentation. The reclassifications did not impact net loss.
New Accounting Pronouncements
(a) Application of New Accounting Standards
Effective January 1, 2018, the Company adopted the accounting guidance in Accounting Standards Update (“ASU”) No. 2014-09, “Revenue from Contracts with Customers.” This standard supersedes most of the existing revenue recognition requirements in U.S. GAAP under Accounting Standards Codification (“ASC”) 605 and establishes a new revenue standard, ASC 606. This new standard requires entities to recognize revenue at an amount that reflects the consideration to which the Company expects to be entitled in exchange for transferring goods or services to a customer. The new standard also requires significantly expanded disclosures regarding the qualitative and quantitative information of an entity’s nature, amount, timing, and uncertainty of revenue and cash flows arising from contracts with customers. The Company adopted ASC 606 using the full retrospective method. The adoption of this standard did not have a material impact on the Company’s consolidated financial statements. Refer to Note 7 — “Revenue from Contracts with Customers” for further information surrounding adoption of this new standard.
Effective January 1, 2018, the Company adopted the accounting guidance in ASU No. 2016-15, “Classification of Certain Cash Receipts and Cash Payments.” This standard addressed eight specific cash flow issues with the objective of reducing the existing diversity in practice. Implementation of this standard did not have a material effect on the consolidated financial statements and related disclosures. The Company applied this standard prospectively, where applicable, as there were no historical transactions affected by this implementation.
Effective January 1, 2018, the Company adopted the accounting guidance in ASU No. 2017-01, “Clarifying the Definition of a Business.” This standard provided additional guidance on whether an integrated set of assets and activities constitutes a business. Implementation of this standard did not have a material effect on the consolidated financial statements and related disclosures. The Company applied this standard prospectively and, therefore, prior periods were not adjusted. In addition, the Company had no activity during the year ended December 31, 2018 that was required to be treated differently under this ASU than previously issued guidance.
Effective January 1, 2018, the Company adopted the accounting guidance in ASU No. 2017-09, “Scope of Modification Accounting.” This standard provided guidance about which changes to the terms or conditions of a share-based payment award require an entity to apply modification accounting under Topic 718. Implementation of this standard

FLOTEK INDUSTRIES, INC.NOTES TO CONSOLIDATED FINANCIAL STATEMENTS
53
did not have a material effect on the consolidated financial statements and related disclosures. The Company applied this standard prospectively and, therefore, prior periods presented were not adjusted. There were no changes to the terms or conditions of current share-based payment awards during the year ended December 31, 2018.
(b) New Accounting Requirements and Disclosures
In February 2016, the Financial Accounting Standards Board (“FASB”) issued ASU No. 2016-02, “Leases.” This standard (ASC 842) requires the recognition of right of use (“ROU”) assets and lease liabilities by lessees for those leases classified as operating leases under previous U.S. GAAP (ASC 840). The lease liability represents the lessee’s obligation to make lease payments arising from a lease and will be measured as the present value of the future lease payments. The ROU asset represents the lessee’s right to use a specified asset for the lease term and will be measured at the lease liability amount, adjusted for lease prepayment, lease incentives received and the lessee’s initial direct costs. The pronouncement is effective for annual reporting periods beginning after December 15, 2018, including interim periods within that reporting period and should be applied using a modified retrospective transition approach, with early application permitted. In July 2018, the FASB issued ASU No. 2018-10 and ASU No. 2018-11, which provide codification and targeted improvements to the original guidance issued, as well as modifies the transition methods available upon adoption.
Certain practical expedients are provided when adopting the guidance. The Company plans to elect the package of practical expedients allowing the Company to not reassess whether any expired or existing contracts are, or contain, leases, the lease classification for any expired or existing leases, or initial direct costs for any expired or existing leases. The Company also plans to apply the hindsight practical expedient allowing the Company to use hindsight when determining the lease term and assessing impairment of expired or existing leases. In addition, the Company will elect to apply the short-term lease exception, and will therefore not record a ROU asset or corresponding lease liability for leases with a term of twelve months or less and instead recognize a single lease cost allocated over the lease term, generally on a straight line basis. Further, the Company plans to elect the practical expedient to not separate lease components from non-lease components and account for both as a single lease component for all asset classes.
The Company has substantially completed its evaluation of the impact on the Company’s lease portfolio. As part of the assessment, the Company formed an implementation work team, conducted training for the relevant staff regarding the potential impacts of ASC 842, and have concluded on the Company’s contract analyses and policy review. The Company engaged external resources to assist in the efforts of completing the analysis of potential changes to current accounting practices and are in the process of implementing
a new lease accounting system in connection with the adoption of the updated guidance. The impact of ASC 842 has been evaluated on the internal control over financial reporting and other changes in business practices and processes. The Company is in the process of finalizing its catalog of existing lease contracts and implementing changes to its systems.
The Company will adopt the new standard effective January 1, 2019 using the optional transition method. Consequently, the Company’s reporting for the comparative periods presented in the financial statements will continue to be in accordance with ASC 840. The adoption of this guidance will result in the addition of ROU assets and corresponding lease obligations to the consolidated balance sheet, yet the Company does not anticipate a significant impact on the consolidated statements of operations or cash flows. Upon adoption, the Company expects to record operating lease ROU assets and corresponding operating lease liabilities of approximately $19.5 million, representing the present value of future lease payments under operating leases with terms of greater than twelve months. The Company is continuing to evaluate the impact the pronouncement will have on the related disclosures.
In June 2016, the FASB issued ASU No. 2016-13, “Measurement of Credit Losses on Financial Instruments.” This standard replaces the incurred loss impairment methodology in current U.S. GAAP with a methodology that reflects expected credit losses and requires consideration of a broader range of reasonable and supportable information to inform credit loss estimates. The pronouncement is effective for fiscal years beginning after December 15, 2019, including interim periods within those fiscal years, with early adoption for the fiscal years beginning after December 15, 2018, including interim periods within those fiscal years. The Company is currently evaluating the impact the pronouncement will have on the consolidated financial statements and related disclosures.
In February 2018, the FASB issued ASU No. 2018-02, “Reclassification of Certain Tax Effects from Accumulated Other Comprehensive Income.” This standard allows a reclassification from accumulated other comprehensive income to retained earnings for stranded tax effects resulting from the 2017 Tax Cuts and Jobs Act. The pronouncement is effective for fiscal years beginning after December 15, 2018, and interim periods within those fiscal years, with early adoption permitted in any interim period. The Company is currently evaluating the impact the pronouncement will have on the consolidated financial statements and related disclosures.
In June 2018, the FASB issued ASU No. 2018-07, “Improvements to Nonemployee Share-Based Payment Accounting.” This standard expands the scope of Topic 718 to include share-based payment transactions for acquiring goods and services from nonemployees. The pronouncement is effective for fiscal years beginning after December 15, 2018, including interim periods within those fiscal years, with early

FLOTEK INDUSTRIES, INC.NOTES TO CONSOLIDATED FINANCIAL STATEMENTS
54
adoption permitted no earlier than an entity’s adoption date of Topic 606. The Company is currently evaluating the impact the pronouncement will have on the consolidated financial statements and related disclosures.
In August 2018, the FASB issued ASU No. 2018-13, “Disclosure Framework — Changes to the Disclosure Requirements for Fair Value Measurement.” This standard removes, modifies, and adds additional requirements for
disclosures related to fair value measurement in ASC 820. The pronouncement is effective for fiscal years beginning after December 15, 2019, including interim periods within those fiscal years, with early adoption permitted in any interim period. The Company is currently evaluating the impact the pronouncement will have on the consolidated financial statements and related disclosures.
Note 3 — Discontinued Operations
During the fourth quarter of 2018, the Company initiated and began executing a strategic plan to sell its Consumer and Industrial Chemistry Technologies (“CICT”) segment. An investment banking advisory services firm was engaged and actively marketed this segment.
The Company met all of the criteria to classify the CICT segment’s assets and liabilities as held for sale in the fourth quarter 2018. The Company has classified the assets,
liabilities, and results of operations for this segment as “Discontinued Operations” for all periods presented.
Disposal of the CICT reporting segment represented a strategic shift that will have a major effect on the Company’s operations and financial results.
During the first quarter of 2019, the Company entered into a material definitive agreement and, subsequently, completed the sale of the CICT segment (see Note 21).
The following summarized financial information has been segregated from continuing operations and reported as Discontinued Operations for the years ended December 31, 2018, 2017, and 2016 (in thousands):
Consumer and Industrial Chemistry Technologies2018 2017 2016
Discontinued operations:Revenue $ 72,344 $ 73,992 $ 74,599Operating expenses (65,940) (63,621) (62,673)Depreciation and amortization (2,760) (2,391) (2,257)Research and development (590) (515) (1)
Income from operations 3,054 7,465 9,668Other income (expense) 341 (284) 127
Income before income taxes 3,395 7,181 9,795Income tax expense (652) (2,730) (3,441)
Net income from discontinued operations $ 2,743 $ 4,451 $ 6,354

FLOTEK INDUSTRIES, INC.NOTES TO CONSOLIDATED FINANCIAL STATEMENTS
55
The assets and liabilities held for sale on the Consolidated Balance Sheets as of December 31, 2018 and 2017 are as follows (in thousands):
Consumer and Industrial Chemistry Technologies2018 2017
Assets:Accounts receivable, net $ 10,547 $ 11,121Inventories, net 52,069 43,299Other current assets 446 88Property and equipment, net 15,899 16,049Goodwill 19,480 19,480Other intangible assets, net 20,029 26,183
Assets held for sale 118,470 116,220Liabilities:
Accounts payable $ 8,883 $ 11,654Accrued liabilities 291 796
Liabilities held for sale $ 9,174 $ 12,450
During the fourth quarter of 2016, the Company initiated a strategic restructuring of its business to enable a greater focus on its core businesses in energy chemistry and consumer and industrial chemistry. The Company executed a plan to sell or otherwise dispose of the Drilling Technologies and Production Technologies segments. An investment banking advisory services firm was engaged and actively marketed these segments.
The Company met all of the criteria to classify the Drilling Technologies and Production Technologies segments’ assets and liabilities as held for sale in the fourth quarter 2016. The Company has classified the assets, liabilities, and results of operations for these two segments as “Discontinued Operations” for all periods presented.Disposal of the Drilling Technologies and Production Technologies reporting segments represented a strategic shift that would have a major effect on the Company’s operations and financial results.
On December 30, 2016, the Company sold a portion of its Drilling Technologies segment and recorded a loss of $1.2 million which is included in the loss from discontinued operations for the year ended December 31, 2016.
On May 22, 2017, the Company completed the sale of substantially all of the assets and transfer of certain specified
liabilities and obligations of the Company’s Drilling Technologies segment to National Oilwell Varco, L.P. (“NOV”) for $17.0 million in cash consideration, subject to normal working capital adjustments, with $1.5 million held back by NOV for up to 18 months to satisfy potential indemnification claims.
On May 23, 2017, the Company completed the sale of substantially all of the assets and transfer of certain specified liabilities and obligations of the Company’s Production Technologies segment to Raptor Lift Solutions, LLC (“Raptor Lift”) for $2.9 million in cash consideration, with $0.4 millionheld back by Raptor Lift to satisfy potential indemnification claims.
On August 16, 2017, the Company completed the sale of substantially all of the remaining assets of the Company’s Drilling Technologies segment to Galleon Mining Tools, Inc. for $1.0 million in cash consideration and a note receivable of $1.0 million due in one year.
The sale or disposal of the assets and transfer or liquidation of liabilities and obligations of these segments was completed in 2017. The Company has no continuing involvement with the discontinued operations.

FLOTEK INDUSTRIES, INC.NOTES TO CONSOLIDATED FINANCIAL STATEMENTS
56
The following summarized financial information has been segregated from continuing operations and reported as Discontinued Operations for the years ended December 31, 2017 and 2016 (in thousands):
Drilling Technologies Production Technologies2017 2016 2017 2016
Discontinued operations:Revenue $ 11,534 $ 27,627 $ 4,002 $ 8,292Cost of revenue (7,309) (18,667) (3,236) (7,881)Selling, general and administrative (6,963) (15,285) (1,759) (3,790)Depreciation and amortization — (1,714) — (584)Research and development (5) (64) (364) (888)Gain (loss) on disposal of long-lived assets 97 103 — (50)Impairment of inventory and long-lived assets — (36,522) — (3,913)
Loss from operations (2,646) (44,522) (1,357) (8,814)Other expense (96) (412) (52) (96)Loss on sale of businesses (1,600) (1,199) (479) —Loss on write-down of assets held for sale (6,831) (18,971) (9,718) (6,161)
Loss before income taxes (11,173) (65,104) (11,606) (15,071)Income tax benefit 4,138 23,661 4,299 5,477
Net loss from discontinued operations $ (7,035) $ (41,443) $ (7,307) $ (9,594)
At December 31, 2017, all remaining assets and liabilities of the discontinued operations were assumed by the Company’s continuing operations. These balances included $0.3 million of net accounts receivable, $1.4 million of sales price hold-back that was received during 2018, and $1.4 million of accrued liabilities partially settled in 2018, with the remainder to be settled in 2019.
Note 4 — Impairment of Inventory and Long-LivedAssets for Discontinued Operations
During the three months ended March 31, 2016, as a result of changes in the oil and gas industry that occurred since the beginning of 2016 and the corresponding impact on the Company’s business outlook, the Company evaluated the direction of its business activities. Crude oil prices, which appeared to have stabilized during the fourth quarter of 2015, fell further during the first quarter of 2016, decreasing approximately 21% from average prices seen in the fourth quarter of 2015. The U.S. drilling rig count declined from 698 at December 31, 2015 to 450 at April 1, 2016, a decline of 35.5%.
Due to the decreased rig activity and its impact on management’s expectations for future market activity, the Company further refocused operations of its Drilling Technologies segment. The Company decided to exit the business of building and repairing motors in all domestic markets. In addition, changes in drilling technique, including further escalation of the move to a dominance of pad drilling, reduced the marketability of certain other inventory items. The focus of the Production Technologies segment shifted to its new technologies for electric submersible pumps for the oil and gas industry and for hydraulic pumping units. Inventory
associated with older technologies for these items has been evaluated for impairment. As a result of these changes in focus and projected declines in asset utilization, the Company recorded a pre-tax impairment of inventories as noted below.
Changes in the business climate noted above and increasing operating losses experienced within the Drilling Technologies and Production Technologies segments during the three months ended March 31, 2016, caused the Company to test asset groups within these two segments for recoverability. Recoverability of the carrying amount of the asset groups was based upon estimated future cash flows while taking into consideration various assumptions and estimates, including future use of the assets, remaining useful life of the assets, and eventual disposition of the assets. Undiscounted estimated cash flows of two asset groups associated with domestic operations in the Drilling Technologies segment did not exceed the carrying amount of the respective asset groups. Therefore, the Company performed an analysis of discounted future cash flows to determine the fair value of each of these two asset groups. As a result of this testing, the Company recorded a pre-tax impairment of long-lived assets as noted below.

FLOTEK INDUSTRIES, INC.NOTES TO CONSOLIDATED FINANCIAL STATEMENTS
57
The Company recorded impairment charges during the three months ended March 31, 2016, as follows (in thousands):
Drilling Technologies:Inventories $ 12,653Long-lived assets:
Property and equipment 14,642Intangible assets other than goodwill 9,227
Production Technologies:Inventories 3,913
Total impairment $ 40,435
Based on the changes in the business climate discussed above and continuing operating losses experienced during the three months ended March 31, 2016, June 30, 2016, September 30, 2016, and December 31, 2016, goodwill within the Teledrift and Production Technologies reporting units was tested for impairment. However, no impairments of goodwill were recorded based upon this testing.
Note 5 — Assets Held for Sale
During the second quarter of 2018, the Company committed to a plan to divest the revenue generating assets associated with the Dalton, Georgia facility within the Energy Chemistry Technologies segment. The Company determined that the divestiture of this business line did not meet the criteria for discontinued operations presentation, as the commitment to divest this business line does not represent a strategic shift that will have a major effect on its operations and financial results. These assets were available for immediate sale in their present condition, subject to only usual and customary terms. During the three months ended June 30, 2018, a loss on write-down of assets held for sale of $2.6 million was recorded to state the assets at fair value less costs to sell.
The assets classified as held for sale at December 31, 2017 is as follows (in thousands):
Property and equipment, net $ 4,998Valuation allowance —Assets held for sale, net $ 4,998
On September 10, 2018, the Company completed the sale of the assets of the Dalton, Georgia facility to T&L Properties of Dalton, LLC for $1.8 million in cash consideration. The Company recorded a loss on the sale of the business of $0.4 million for the three months ended September 30, 2018.
Note 6 — Acquisitions
On July 27, 2016, the Company acquired 100% of the stock and interests in International Polymerics, Inc. (“IPI”) and related entities for $7.9 million in cash consideration, net of cash acquired, and 247,764 shares of the Company’s common
stock. IPI is a U.S. based manufacturer of high viscosity guar gum and guar slurry for the oil and gas industry with a wide selection of stimulation chemicals.
Note 7 — Revenue from Contracts with Customers
Effective January 1, 2018, the Company adopted ASC 606 using the full retrospective method applied to those contracts which were not completed as of December 31, 2015. As a result of electing the full retrospective adoption approach, results for reporting periods beginning after December 31, 2015 are presented under ASC 606.
There was no material impact upon the adoption of ASC 606. As revenue is primarily related to product sales accounted for at a point in time and service contracts that are primarily short-term in nature (typically less than 30 days), the Company did
not record any adjustments to retained earnings at December 31, 2015 or for any periods previously presented.
Revenues are recognized when control of the promised goods or services is transferred to the customer, in an amount that reflects the consideration the Company expects to be entitled to in exchange for those goods or services. In recognizing revenue for products and services, the Company determines the transaction price of purchase orders or contracts with customers, which may consist of fixed and variable consideration. Determining the transaction price may require

FLOTEK INDUSTRIES, INC.NOTES TO CONSOLIDATED FINANCIAL STATEMENTS
58
significant judgment by management, which includes identifying performance obligations, estimating variable consideration to include in the transaction price, and determining whether promised goods or services can be distinguished in the context of the contract. Variable consideration typically consists of product returns and is estimated based on the amount of consideration the Company expects to receive. Revenue accruals are recorded on an ongoing basis to reflect updated variable consideration information.
For certain contracts, the Company recognizes revenue under the percentage-of-completion method of accounting, measured by the percentage of “costs incurred to date” to the “total estimated costs of completion.” This percentage is applied to the “total estimated revenue at completion” to calculate proportionate revenue earned to date. For the years ended December 31, 2018, 2017, and 2016, the percentage-of-completion revenue accounted for less than 0.1% of total revenue during the respective time periods. This resulted in
immaterial unfulfilled performance obligations and immaterial contract assets and/or liabilities for which the Company did not record adjustments to opening retained earnings as of December 31, 2015 or for any periods previously presented.
The vast majority of the Company’s products are sold at a point in time and service contracts are short-term in nature. Sales are billed on a monthly basis with payment terms customarily 30 days from invoice receipt. In addition, sales taxes are excluded from revenues.
Disaggregation of Revenue
The Company has disaggregated revenues by product sales (point-in-time revenue recognition) and service revenue (over-time revenue recognition), where product sales accounted for over 95% of total revenue for the years ended December 31, 2018, 2017, and 2016.
The Company differentiates revenue and operating expenses (excluding depreciation and amortization) based on whether the source of revenue is attributable to products or services. Revenue and operating expenses (excluding depreciation and amortization) disaggregated by revenue source are as follows (in thousands):
Year ended December 31, 2018 2017 2016Revenue:
Products $ 172,412 $ 237,211 $ 182,294Services 5,361 5,895 5,939
$ 177,773 $ 243,106 $ 188,233Operating expenses (excluding depreciation and amortization):
Products $ 152,846 $ 182,330 $ 140,108Services 6,962 6,414 3,875
$ 159,808 $ 188,744 $ 143,983
Arrangements with Multiple Performance Obligations
The Company’s contracts with customers may include multiple performance obligations. For such arrangements, the total transaction price is allocated to each performance obligation in an amount based on the estimated relative standalone selling prices of the promised goods or services underlying each performance obligation. Standalone selling prices are generally determined based on the prices charged to customers (“observable standalone price”) or an expected cost plus a margin approach. For combined products and services within a contract, the Company accounts for individual products and services separately if they are distinct (i.e. if a product or service is separately identifiable from other items in the contract and if a customer can benefit from it on its own or with other resources that are readily available to the customer). The consideration is allocated between separate products and services within a contract based on the prices at
the observable standalone price. For items that are not sold separately, the expected cost plus a margin approach is used to estimate the standalone selling price of each performance obligation.
Contract Balances
Under revenue contracts for both products and services, customers are invoiced once the performance obligations have been satisfied, at which point payment is unconditional. Accordingly, no revenue contracts give rise to contract assets or liabilities under ASC 606.
Practical Expedients and Exemptions
The Company has elected to apply several practical expedients as discussed below:
• Sales commissions are expensed when incurred because the amortization period would have been one

FLOTEK INDUSTRIES, INC.NOTES TO CONSOLIDATED FINANCIAL STATEMENTS
59
year or less. These costs are recorded within segment selling and administrative expenses.
• The majority of the Company’s services are short-term in nature with a contract term of one year or less. For those contracts, the Company has utilized the practical expedient in ASC 606-10-50-14, exempting the Company from disclosure of the transaction price allocated to remaining performance obligations if the performance obligation is part of a contract that has an original expected duration of one year or less.
• The Company’s payment terms are short-term in nature with settlements of one year or less. The Company has utilized the practical expedient in ASC 606-10-32-18, exempting the Company from adjusting the promised amount of consideration for the effects of a significant financing component given that the period between when the Company transfers a promised good or service
to a customer and when the customer pays for that good or service will be one year or less.
• In most service contracts, the Company has the right to consideration from a customer in an amount that corresponds directly with the value to the customer of the Company’s performance completed to date. For these contracts, the Company has utilized the practical expedient in ASC 606-10-55-18, allowing the Company to recognize revenue in the amount to which it has a right to invoice.
Accordingly, the Company does not disclose the value of unsatisfied performance obligations for (i) contracts with an original expected length of one year or less and (ii) contracts for which the Company recognizes revenue at the amount to which it has the right to invoice for services performed.
Note 8 — Supplemental Cash Flow Information
Supplemental cash flow information is as follows (in thousands):
Year ended December 31, 2018 2017 2016Supplemental non-cash investing and financing activities:
Value of common stock issued in acquisitions $ — $ — $ 3,268Value of common stock issued in payment of accrued liability — 188 —Exercise of stock options by common stock surrender — 5,863 50
Supplemental cash payment information:Interest paid $ 2,502 $ 1,851 $ 2,024Income taxes (received, net of payments) paid, net of refunds (139) (10,195) 333
Note 9 — Inventories
Inventories are as follows (in thousands):
December 31,2018 2017
Raw materials $ 10,608 $ 13,462Work-in-process — 3Finished goods 18,798 19,363
Inventories 29,406 32,828Less reserve for excess and obsolete inventory (2,117) (368)
Inventories, net $ 27,289 $ 32,460

FLOTEK INDUSTRIES, INC.NOTES TO CONSOLIDATED FINANCIAL STATEMENTS
60
Changes in the reserve for excess and obsolete inventory are as follows (in thousands):
2018 2017 2016Balance, beginning of year $ 368 $ 50 $ 50
Charged to costs and expenses 2,418 388 —Deductions (669) (70) —
Balance, end of the year $ 2,117 $ 368 $ 50
Note 10 — Property and Equipment
Property and equipment are as follows (in thousands):
December 312018 2017
Land $ 4,372 $ 4,008Buildings and leasehold improvements 37,719 37,786Machinery and equipment 26,995 25,762Fixed assets in progress 581 3,573Furniture and fixtures 1,573 1,869Transportation equipment 1,852 1,802Computer equipment and software 9,370 12,044Property and equipment 82,462 86,844
Less accumulated depreciation (36,977) (34,058)Property and equipment, net $ 45,485 $ 52,786
Depreciation expense totaled $7.8 million, $8.4 million, and $6.6 million for the years ended December 31, 2018, 2017, and 2016, respectively.
During the years ended December 31, 2018, 2017, and 2016, no impairments were recognized related to property and equipment.
Note 11 — Goodwill
The Company has no reporting units which have a goodwill balance at December 31, 2018.
Goodwill is tested for impairment annually in the fourth quarter, or more frequently if circumstances indicate a potential impairment. During the fourth quarter of 2017, the Company adopted ASU 2017-04, which eliminates Step 2 from the goodwill impairment test. If the carrying amount exceeds the reporting unit’s fair value, the Company will recognize an impairment charge for the excess amount.
During the second quarter of 2018, the Company recognized a goodwill impairment charge of $37.2 million in the Energy Chemistry Technologies (“ECT”) reporting unit, which resulted from sustained under-performance and lower expectations related to the reporting unit. As a result of these factors, a qualitative analysis, and additional risks associated with the business, the Company concluded that sufficient indicators existed to require an interim quantitative assessment of goodwill for that reporting unit as of June 30, 2018. The fair value of the reporting unit was estimated based on an
analysis of the present value of future discounted cash flows. The significant estimates used in the discounted cash flows model included the Company’s weighted average cost of capital, projected cash flows and the long-term rate of growth. The assumptions were based on the actual historical performance of the reporting unit and took into account a recent weakening of operating results in an improving market environment. The excess of the reporting unit’s carrying value over the estimated fair value was recorded as the goodwill impairment charge during the three months ended June 30, 2018 and represented all of the ECT reporting unit’s goodwill.
During annual goodwill impairment testing for the year ended December 31, 2017, the Company first assessed the qualitative factors and was unable to conclude that it was not more likely than not that fair value of the ECT reporting unit exceeded the carrying amount of the reporting unit. Therefore, the Company performed the quantitative impairment test. The result of this testing indicated that the fair value of the ECT reporting unit exceeded the carrying amount, including goodwill, of the reporting unit.

FLOTEK INDUSTRIES, INC.NOTES TO CONSOLIDATED FINANCIAL STATEMENTS
61
During annual goodwill impairment testing for the year ended December 31, 2016, the Company first assessed qualitative factors to determine whether it was necessary to perform the two-step goodwill impairment test that the Company has historically used. The Company concluded that it was not more
likely than not that goodwill was impaired as of the fourth quarter of 2016, and therefore, further testing was not required.
No impairments of goodwill were recognized during the years ended December 31, 2017 and 2016.
Changes in the carrying amount of goodwill for the ECT reporting unit are as follows (in thousands):
Balance at December 31, 2016:Goodwill $ 37,180Accumulated impairment losses —
Goodwill balance, net 37,180Activity during the year 2017:
Goodwill impairment recognized —Acquisition goodwill recognized —
Balance at December 31, 2017:Goodwill 37,180Accumulated impairment losses —
Goodwill balance, net 37,180Activity during the year 2018:
Goodwill impairment recognized (37,180)Acquisition goodwill recognized —
Balance at December 31, 2018:Goodwill 37,180Accumulated impairment losses (37,180)
Goodwill balance, net $ —
Note 12 — Other Intangible Assets
Other intangible assets are as follows (in thousands):
December 31, 2018 2017
CostAccumulatedAmortization Cost
AccumulatedAmortization
Finite lived intangible assets:Patents and technology $ 18,884 $ 6,689 $ 9,457 $ 3,144Customer lists 15,367 5,259 15,367 4,505Trademarks and brand names 1,485 1,149 1,532 1,114
Total finite lived intangible assets acquired 35,736 13,097 26,356 8,763Deferred financing costs 1,924 496 1,791 96
Total amortizable intangible assets 37,660 $ 13,593 28,147 $ 8,859Indefinite lived intangible assets:
Trademarks and brand names 2,760 2,760Total other intangible assets $ 40,420 $ 30,907
Carrying amount:Other intangible assets, net $ 26,827 $ 22,048

FLOTEK INDUSTRIES, INC.NOTES TO CONSOLIDATED FINANCIAL STATEMENTS
62
Intangible assets acquired are amortized on a straight-line basis over two to 95 years. Amortization of intangible assets acquired totaled $1.4 million, $1.4 million, and $1.5 million for the years end ended December 31, 2018, 2017, and 2016, respectively.
Amortization of deferred financing costs totaled $0.4 million, $0.5 million, and $0.4 million for the years ended December 31, 2018, 2017, and 2016, respectively.
Estimated future amortization expense for other finite lived intangible assets, including deferred financing costs, at December 31, 2018 is as follows (in thousands):
Year ending December 31,2019 $ 2,3512020 2,3242021 2,3152022 2,0482023 1,821Thereafter 13,208Other amortizable intangible assets, net $ 24,067
During the years ended December 31, 2018, 2017, and 2016, no impairments were recognized related to other intangible assets.
Note 13 — Long-Term Debt and Credit Facility
Long-term debt is as follows (in thousands):
December 31,2018 2017
Long-term debt, classified as current:Borrowings under revolving credit facility $ 49,731 $ 27,950
Borrowing under the revolving credit facility is classified as current debt as a result of the required lockbox arrangement and the subjective acceleration clause.
Credit Facility
On May 10, 2013, the Company and certain of its subsidiaries (the “Borrowers”) entered into an Amended and Restated Revolving Credit, Term Loan and Security Agreement (as amended, the “Credit Facility”) with PNC Bank, National Association (“PNC Bank”). The Company may borrow under the Credit Facility for working capital, permitted acquisitions, capital expenditures and other corporate purposes. The Credit Facility continues in effect until May 10, 2022. Under terms of the Credit Facility, as amended, the Company has total borrowing availability of $75 million under a revolving credit facility. A term loan was repaid in May 2017 and may not be re-borrowed. In addition, the Company repaid the outstanding balance of the revolving credit facility on March 1, 2019 (see Note 21).
The Credit Facility was secured by substantially all of the Company’s domestic real and personal property, including accounts receivable, inventory, land, buildings, equipment and
other intangible assets. The Credit Facility contained customary representations, warranties, and both affirmative and negative covenants. The Company was in compliance with all debt covenants at December 31, 2018. In the event of default, PNC Bank may accelerate the maturity date of any outstanding amounts borrowed under the Credit Facility.
Effective June 13, 2018, the Company entered into an Eleventh Amendment to the Credit Facility which, among other things, maintained the maximum revolving advance amount at $75 million, but added a collateral block equal to $10 million minus the amount of any collateral value in excess of $75 million and, to the extent not duplicated, any inventory collateral in excess of $52 million. Compliance with the fixed charge coverage ratio and the leverage ratio was suspended through December 31, 2018, as long as there was not a financial covenant trigger event, which occurs if undrawn availability is less than $15 million at any month-end through December 31, 2018. At December 31, 2018, undrawn availability for this calculation was $25.1 million.
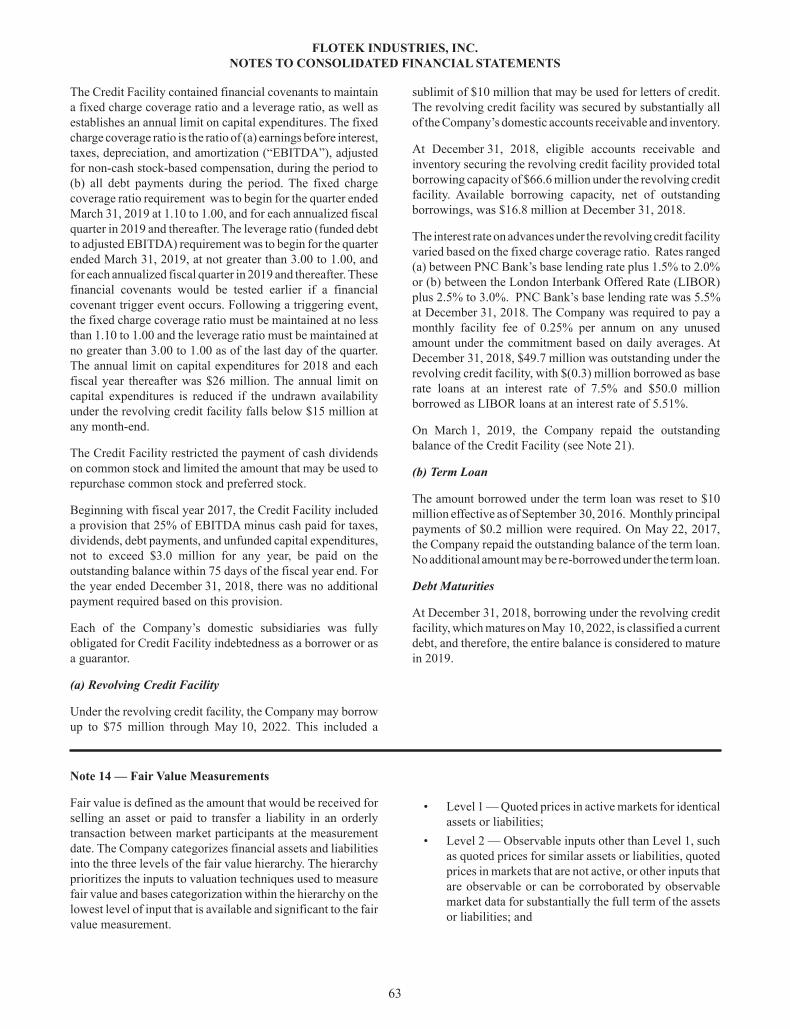
FLOTEK INDUSTRIES, INC.NOTES TO CONSOLIDATED FINANCIAL STATEMENTS
63
The Credit Facility contained financial covenants to maintain a fixed charge coverage ratio and a leverage ratio, as well as establishes an annual limit on capital expenditures. The fixed charge coverage ratio is the ratio of (a) earnings before interest, taxes, depreciation, and amortization (“EBITDA”), adjusted for non-cash stock-based compensation, during the period to (b) all debt payments during the period. The fixed charge coverage ratio requirement was to begin for the quarter ended March 31, 2019 at 1.10 to 1.00, and for each annualized fiscal quarter in 2019 and thereafter. The leverage ratio (funded debt to adjusted EBITDA) requirement was to begin for the quarter ended March 31, 2019, at not greater than 3.00 to 1.00, and for each annualized fiscal quarter in 2019 and thereafter. These financial covenants would be tested earlier if a financial covenant trigger event occurs. Following a triggering event, the fixed charge coverage ratio must be maintained at no less than 1.10 to 1.00 and the leverage ratio must be maintained at no greater than 3.00 to 1.00 as of the last day of the quarter. The annual limit on capital expenditures for 2018 and each fiscal year thereafter was $26 million. The annual limit on capital expenditures is reduced if the undrawn availability under the revolving credit facility falls below $15 million at any month-end.
The Credit Facility restricted the payment of cash dividends on common stock and limited the amount that may be used to repurchase common stock and preferred stock.
Beginning with fiscal year 2017, the Credit Facility included a provision that 25% of EBITDA minus cash paid for taxes, dividends, debt payments, and unfunded capital expenditures, not to exceed $3.0 million for any year, be paid on the outstanding balance within 75 days of the fiscal year end. For the year ended December 31, 2018, there was no additional payment required based on this provision.
Each of the Company’s domestic subsidiaries was fully obligated for Credit Facility indebtedness as a borrower or as a guarantor.
(a) Revolving Credit Facility
Under the revolving credit facility, the Company may borrow up to $75 million through May 10, 2022. This included a
sublimit of $10 million that may be used for letters of credit. The revolving credit facility was secured by substantially all of the Company’s domestic accounts receivable and inventory.
At December 31, 2018, eligible accounts receivable and inventory securing the revolving credit facility provided total borrowing capacity of $66.6 million under the revolving credit facility. Available borrowing capacity, net of outstanding borrowings, was $16.8 million at December 31, 2018.
The interest rate on advances under the revolving credit facility varied based on the fixed charge coverage ratio. Rates ranged (a) between PNC Bank’s base lending rate plus 1.5% to 2.0%or (b) between the London Interbank Offered Rate (LIBOR) plus 2.5% to 3.0%. PNC Bank’s base lending rate was 5.5%at December 31, 2018. The Company was required to pay a monthly facility fee of 0.25% per annum on any unused amount under the commitment based on daily averages. At December 31, 2018, $49.7 million was outstanding under the revolving credit facility, with $(0.3) million borrowed as base rate loans at an interest rate of 7.5% and $50.0 million borrowed as LIBOR loans at an interest rate of 5.51%.
On March 1, 2019, the Company repaid the outstanding balance of the Credit Facility (see Note 21).
(b) Term Loan
The amount borrowed under the term loan was reset to $10 million effective as of September 30, 2016. Monthly principal payments of $0.2 million were required. On May 22, 2017, the Company repaid the outstanding balance of the term loan. No additional amount may be re-borrowed under the term loan.
Debt Maturities
At December 31, 2018, borrowing under the revolving credit facility, which matures on May 10, 2022, is classified a current debt, and therefore, the entire balance is considered to mature in 2019.
Note 14 — Fair Value Measurements
Fair value is defined as the amount that would be received for selling an asset or paid to transfer a liability in an orderly transaction between market participants at the measurement date. The Company categorizes financial assets and liabilities into the three levels of the fair value hierarchy. The hierarchy prioritizes the inputs to valuation techniques used to measure fair value and bases categorization within the hierarchy on the lowest level of input that is available and significant to the fair value measurement.
• Level 1 — Quoted prices in active markets for identical assets or liabilities;
• Level 2 — Observable inputs other than Level 1, such as quoted prices for similar assets or liabilities, quoted prices in markets that are not active, or other inputs that are observable or can be corroborated by observable market data for substantially the full term of the assets or liabilities; and
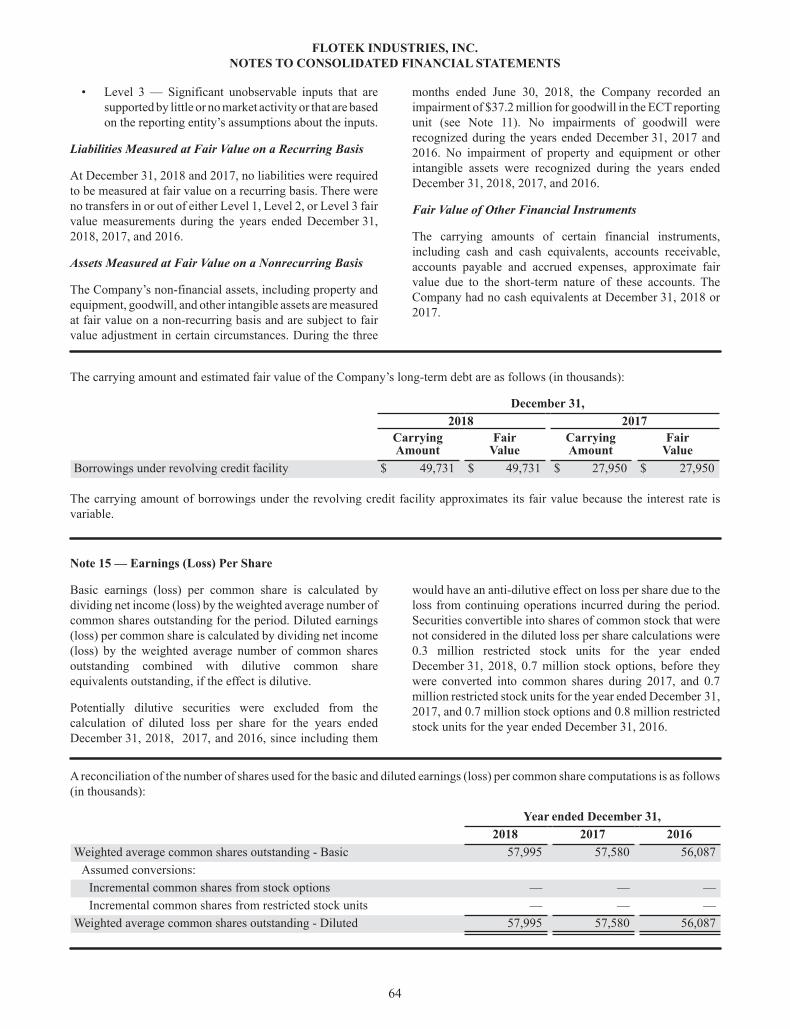
FLOTEK INDUSTRIES, INC.NOTES TO CONSOLIDATED FINANCIAL STATEMENTS
64
• Level 3 — Significant unobservable inputs that are supported by little or no market activity or that are based on the reporting entity’s assumptions about the inputs.
Liabilities Measured at Fair Value on a Recurring Basis
At December 31, 2018 and 2017, no liabilities were required to be measured at fair value on a recurring basis. There were no transfers in or out of either Level 1, Level 2, or Level 3 fair value measurements during the years ended December 31, 2018, 2017, and 2016.
Assets Measured at Fair Value on a Nonrecurring Basis
The Company’s non-financial assets, including property and equipment, goodwill, and other intangible assets are measured at fair value on a non-recurring basis and are subject to fair value adjustment in certain circumstances. During the three
months ended June 30, 2018, the Company recorded an impairment of $37.2 million for goodwill in the ECT reporting unit (see Note 11). No impairments of goodwill were recognized during the years ended December 31, 2017 and 2016. No impairment of property and equipment or other intangible assets were recognized during the years ended December 31, 2018, 2017, and 2016.
Fair Value of Other Financial Instruments
The carrying amounts of certain financial instruments, including cash and cash equivalents, accounts receivable, accounts payable and accrued expenses, approximate fair value due to the short-term nature of these accounts. The Company had no cash equivalents at December 31, 2018 or 2017.
The carrying amount and estimated fair value of the Company’s long-term debt are as follows (in thousands):
December 31, 2018 2017
CarryingAmount
FairValue
CarryingAmount
FairValue
Borrowings under revolving credit facility $ 49,731 $ 49,731 $ 27,950 $ 27,950
The carrying amount of borrowings under the revolving credit facility approximates its fair value because the interest rate is variable.
Note 15 — Earnings (Loss) Per Share
Basic earnings (loss) per common share is calculated by dividing net income (loss) by the weighted average number of common shares outstanding for the period. Diluted earnings (loss) per common share is calculated by dividing net income (loss) by the weighted average number of common shares outstanding combined with dilutive common share equivalents outstanding, if the effect is dilutive.
Potentially dilutive securities were excluded from the calculation of diluted loss per share for the years ended December 31, 2018, 2017, and 2016, since including them
would have an anti-dilutive effect on loss per share due to the loss from continuing operations incurred during the period. Securities convertible into shares of common stock that were not considered in the diluted loss per share calculations were 0.3 million restricted stock units for the year ended December 31, 2018, 0.7 million stock options, before they were converted into common shares during 2017, and 0.7 million restricted stock units for the year ended December 31, 2017, and 0.7 million stock options and 0.8 million restricted stock units for the year ended December 31, 2016.
A reconciliation of the number of shares used for the basic and diluted earnings (loss) per common share computations is as follows (in thousands):
Year ended December 31, 2018 2017 2016Weighted average common shares outstanding - Basic 57,995 57,580 56,087
Assumed conversions:Incremental common shares from stock options — — —Incremental common shares from restricted stock units — — —
Weighted average common shares outstanding - Diluted 57,995 57,580 56,087
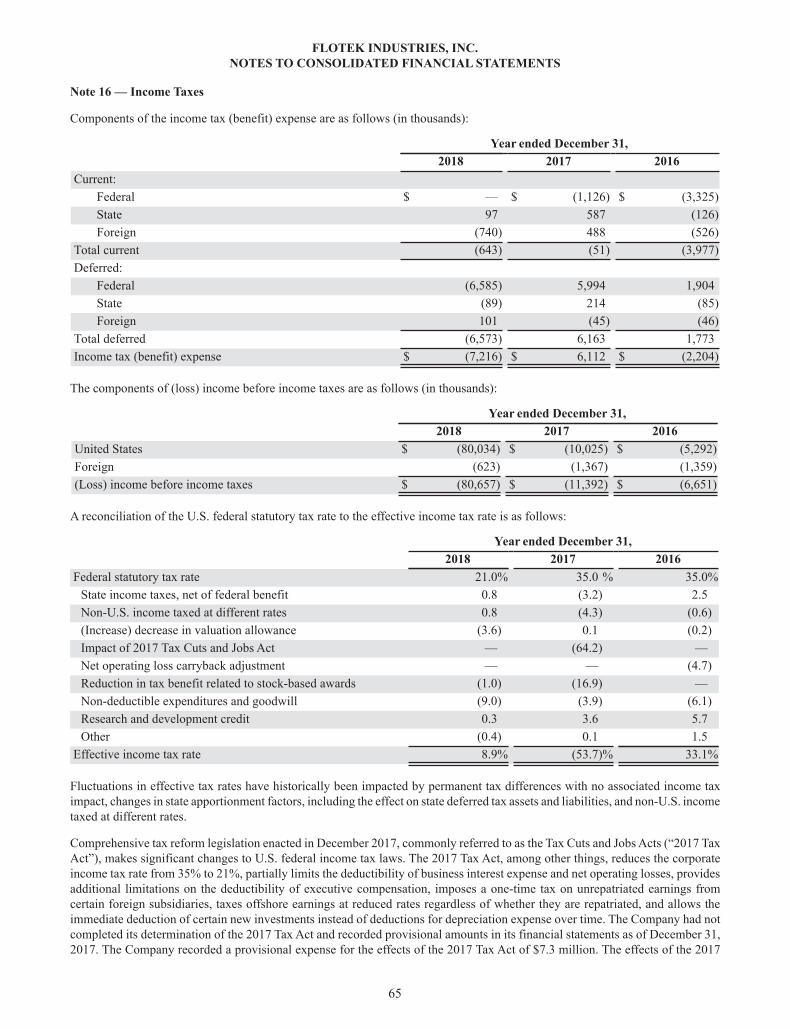
FLOTEK INDUSTRIES, INC.NOTES TO CONSOLIDATED FINANCIAL STATEMENTS
65
Note 16 — Income Taxes
Components of the income tax (benefit) expense are as follows (in thousands):
Year ended December 31, 2018 2017 2016Current:
Federal $ — $ (1,126) $ (3,325)State 97 587 (126)Foreign (740) 488 (526)
Total current (643) (51) (3,977)Deferred:
Federal (6,585) 5,994 1,904State (89) 214 (85)Foreign 101 (45) (46)
Total deferred (6,573) 6,163 1,773Income tax (benefit) expense $ (7,216) $ 6,112 $ (2,204)
The components of (loss) income before income taxes are as follows (in thousands):
Year ended December 31, 2018 2017 2016United States $ (80,034) $ (10,025) $ (5,292)Foreign (623) (1,367) (1,359)(Loss) income before income taxes $ (80,657) $ (11,392) $ (6,651)
A reconciliation of the U.S. federal statutory tax rate to the effective income tax rate is as follows:
Year ended December 31, 2018 2017 2016Federal statutory tax rate 21.0% 35.0 % 35.0%
State income taxes, net of federal benefit 0.8 (3.2) 2.5Non-U.S. income taxed at different rates 0.8 (4.3) (0.6)(Increase) decrease in valuation allowance (3.6) 0.1 (0.2)Impact of 2017 Tax Cuts and Jobs Act — (64.2) —Net operating loss carryback adjustment — — (4.7)Reduction in tax benefit related to stock-based awards (1.0) (16.9) —Non-deductible expenditures and goodwill (9.0) (3.9) (6.1)Research and development credit 0.3 3.6 5.7Other (0.4) 0.1 1.5
Effective income tax rate 8.9% (53.7)% 33.1%
Fluctuations in effective tax rates have historically been impacted by permanent tax differences with no associated income tax impact, changes in state apportionment factors, including the effect on state deferred tax assets and liabilities, and non-U.S. income taxed at different rates.
Comprehensive tax reform legislation enacted in December 2017, commonly referred to as the Tax Cuts and Jobs Acts (“2017 Tax Act”), makes significant changes to U.S. federal income tax laws. The 2017 Tax Act, among other things, reduces the corporate income tax rate from 35% to 21%, partially limits the deductibility of business interest expense and net operating losses, provides additional limitations on the deductibility of executive compensation, imposes a one-time tax on unrepatriated earnings from certain foreign subsidiaries, taxes offshore earnings at reduced rates regardless of whether they are repatriated, and allows the immediate deduction of certain new investments instead of deductions for depreciation expense over time. The Company had not completed its determination of the 2017 Tax Act and recorded provisional amounts in its financial statements as of December 31, 2017. The Company recorded a provisional expense for the effects of the 2017 Tax Act of $7.3 million. The effects of the 2017

FLOTEK INDUSTRIES, INC.NOTES TO CONSOLIDATED FINANCIAL STATEMENTS
66
Tax Act on the Company include three main categories: 1) remeasurement of the net deferred tax assets from 35% to 21%, which resulted in tax expense of $5.5 million; 2) a one-time tax on unrepatriated earnings from certain foreign subsidiaries of $0.2 million; and 3) additional limitations on the deductibility of executive compensation, which resulted in tax expense of $1.6 million. The Company completed its review of the 2017 Tax Act in 2018, and there were no material changes in the measurement period.
Deferred income taxes reflect the tax effect of temporary differences between the carrying amount of assets and liabilities for financial reporting purposes and the value reported for income tax purposes, at the enacted tax rates expected to be in effect when the differences reverse. The components of deferred tax assets and liabilities are as follows (in thousands):
December 31, 2018 2017Deferred tax assets:
Net operating loss carryforwards $ 30,241 $ 24,569Allowance for doubtful accounts 1,073 981Inventory valuation reserves 1,057 827Equity compensation 548 685Goodwill 1,089 —Accrued compensation 342 222Foreign tax credit carryforward 4,041 3,955Interest expense limitation 534 —Other 50 —
Total gross deferred tax assets 38,975 31,239Valuation allowance (4,042) (1,187)
Total deferred tax assets, net 34,933 30,052Deferred tax liabilities:
Property and equipment (6,613) (6,216)Intangible assets (9,657) (10,084)Goodwill — (365)Convertible debt — (619)Unearned revenue — (52)Prepaid insurance and other — (3)
Total gross deferred tax liabilities (16,270) (17,339)Net deferred tax assets $ 18,663 $ 12,713
As of December 31, 2018, the Company had U.S. net operating loss carryforwards of $127.5 million, including $106.7 million expiring in various amounts in 2029 through 2037 which can offset 100% of taxable income and $20.8 million that has an indefinite carryforward period which can offset 80% of taxable income per year. The ability to utilize net operating losses and other tax attributes could be subject to a significant limitation if the Company were to undergo an “ownership change” for purposes of Section 382 of the Tax Code.
Net deferred tax assets arise due to the recognition of income and expense items for tax purposes, which differ from those used for financial statement purposes. ASC 740, Income Taxes, provides for the recognition of deferred tax assets if realization of such assets is more likely than not. In assessing the need for a valuation allowance in the second quarter of 2018, the Company considered all available objective and
verifiable evidence, both positive and negative, including historical levels of pre-tax income (loss) both on a consolidated basis and tax reporting entity basis, legislative developments, and expectations and risks associated with estimates of future pre-tax income. As a result of this analysis, the Company determined that it is more likely than not that it will not realize the benefits of certain deferred tax assets and, therefore, recorded a $15.5 million valuation allowance against the carrying value of net deferred tax assets, except for deferred tax liabilities related to non-amortizable intangible assets and certain state jurisdictions. As all available evidence should be taken into consideration when assessing the need for a valuation allowance, the subsequent events that occurred in the first quarter of 2019 (Note 21) provided a source of income to support the release of $11.5 million of the valuation allowance which resulted in a deferred tax asset of $18.7 million. As such, the Company reversed this portion of the valuation allowance during the fourth quarter of 2018.

FLOTEK INDUSTRIES, INC.NOTES TO CONSOLIDATED FINANCIAL STATEMENTS
67
The Company has not calculated U.S. taxes on unremitted earnings of certain non-U.S. subsidiaries due to the Company’s intent to reinvest the unremitted earnings of the non-U.S. subsidiaries. At December 31, 2018, the Company had approximately $3.2 million in unremitted earnings for one of its foreign jurisdictions, which were not included for U.S. tax purposes. Due to the 2017 Tax Act, U.S. federal transition taxes have been recorded for a one-time U.S. tax liability on these earnings which have not previously been repatriated to the U.S. However, certain withholding taxes will need to be paid upon repatriation. It is not practicable to estimate the amount of the deferred tax liability on such unremitted earnings.
The Company has performed an evaluation and concluded there are no significant uncertain tax positions requiring recognition in the Company’s financial statements. The evaluation was performed for the tax years which remain
subject to examination by tax jurisdictions as of December 31, 2018, which are the years ended December 31, 2015 through December 31, 2018 for U.S. federal taxes and the years ended December 31, 2014 through December 31, 2018 for state tax jurisdictions.
At December 31, 2018, the Company had no unrecognized tax benefits.
In January 2017, the Internal Revenue Service notified the Company that it will examine the Company’s federal tax returns for the year ended December 31, 2014. No adjustments have been asserted and management believes that sustained adjustments, if any, would not have a material effect on the Company’s financial position, results of operations or liquidity.
Note 17 — Common Stock
The Company’s Certificate of Incorporation, as amended November 9, 2009, authorizes the Company to issue up to 80 millionshares of common stock, par value $0.0001 per share, and 100,000 shares of one or more series of preferred stock, par value $0.0001 per share.
A reconciliation of the changes in common shares issued is as follows:
Year ended December 31, 2018 2017Shares issued at the beginning of the year 60,622,986 59,684,669
Issued as restricted stock award grants 1,539,889 275,029Issued upon exercise of stock options — 663,288
Shares issued at the end of the year 62,162,875 60,622,986
Stock-Based Incentive Plans
Stockholders approved long term incentive plans in 2018, 2014, 2010, and 2007 (the “2018 Plan,” the “2014 Plan,” the “2010 Plan,” and the “2007 Plan,” respectively) under which the Company may grant equity awards to officers, key employees, non-employee directors, and service providers in the form of stock options, restricted stock, and certain other incentive awards. The maximum number of shares that may be issued under the 2018 Plan, 2014 Plan, 2010 Plan, and 2007 Plan are 3.0 million, 5.2 million, 6.0 million, and 2.2 million, respectively. At December 31, 2018, the Company had a total of 1.5 million shares remaining to be granted under the 2018 Plan, 2014 Plan, and 2010 Plan. Shares may no longer be granted under the 2007 Plan.
Stock Options
All stock options are granted with an exercise price equal to the market value of the Company’s common stock on the date of grant. Options expire no later than ten years from the date of grant and generally vest in four years or less. Proceeds
received from stock option exercises are credited to common stock and additional paid-in capital, as appropriate. The Company uses historical data to estimate pre-vesting option forfeitures. Estimates are adjusted when actual forfeitures differ from the estimate. Stock-based compensation expense is recorded for all equity awards expected to vest.
The fair value of stock options at the date of grant is calculated using the Black-Scholes option pricing model. The risk free interest rate is based on the implied yield of U.S. Treasury zero-coupon securities that correspond to the expected life of the option. Volatility is estimated based on historical and implied volatilities of the Company’s stock and of identified companies considered to be representative peers of the Company. The expected life of awards granted represents the period of time the options are expected to remain outstanding. The Company uses the “simplified” method which is permitted for companies that cannot reasonably estimate the expected life of options based on historical share option exercise experience. The Company does not expect to pay dividends on common stock. No options were granted to employees during 2018, 2017, and 2016.

FLOTEK INDUSTRIES, INC.NOTES TO CONSOLIDATED FINANCIAL STATEMENTS
68
The Black-Scholes option valuation model was developed to estimate the fair value of traded options that have no vesting restrictions and are fully-transferable. Because option valuation models require the use of subjective assumptions, changes in these assumptions can materially affect the fair value calculation. The Company’s options are not characteristic of traded options; therefore, the option valuation models do not necessarily provide a reliable measure of the fair value of options.
The total intrinsic value of stock options exercised during the years ended December 31, 2017 and 2016 was $2.3 million and $1.0 million, respectively. No stock options vested during the years ended December 31, 2018, 2017, and 2016.
At December 31, 2017, the Company had no remaining outstanding stock options.
Restricted Stock
The Company grants employees either time-vesting or performance-based restricted shares in accordance with terms specified in the Restricted Stock Agreements (“RSAs”). Time-vesting restricted shares vest after a stipulated period of time has elapsed subsequent to the date of grant, generally three years. Certain time-vested shares have also been issued with a portion of the shares granted vesting immediately. Performance-based restricted shares are issued with performance criteria defined over a designated performance period and vest only when, and if, the outlined performance criteria are met. During the year ended December 31, 2018, 84% of the restricted shares granted were time-vesting and 16% were performance-based. Grantees of restricted shares retain voting rights for the granted shares.
Restricted stock share activity for the year ended December 31, 2018 is as follows:
Restricted Stock Shares Shares
Weighted-Average Fair
Value at Date ofGrant
Non-vested at January 1, 2018 246,258 $ 12.24Granted to employees 1,287,484 3.67RSAs converted from 2016 restricted stock units 252,405 12.02Vested (578,114) 10.82Forfeited (157,661) 5.52
Non-vested at December 31, 2018 1,050,372 $ 3.47
The weighted-average grant-date fair value of restricted stock granted during the years ended December 31, 2018, 2017, and 2016 was $3.67, $10.62, and $11.92 per share, respectively. The total fair value of restricted stock that vested during the years ended December 31, 2018, 2017, and 2016 was $6.3 million, $8.6 million, and $15.4 million, respectively.
At December 31, 2018, there was $2.7 million of unrecognized compensation expense related to non-vested restricted stock. The unrecognized compensation expense is expected to be recognized over a weighted-average period of 2.0 years.
Restricted Stock Units
During the year ended December 31, 2018, the Company granted performance-based restricted stock units (“RSUs”) for 407,698 shares equivalents. The performance period for these share equivalents continues until December 31, 2019.
During the year ended December 31, 2017, the Company granted performance-based RSUs for 604,682 share equivalents, which had a performance period through December 31, 2018. No RSUs were earned during this performance period.

FLOTEK INDUSTRIES, INC.NOTES TO CONSOLIDATED FINANCIAL STATEMENTS
69
Restricted stock unit share activity for the year ended December 31, 2018 is as follows:
Restricted Stock Unit Shares Shares
Weighted-Average Fair
Value at Date ofGrant
RSU share equivalents at January 1, 2018 725,331 $ 16.412016 RSUs converted to RSAs in 2018 (252,405) 12.022017 share equivalents forfeited (121,514) 19.332017 share equivalents not earned (351,412) 18.562017 share equivalents — —2018 share equivalents granted 407,698 3.952018 share equivalents forfeited (105,932) 3.95
RSU share equivalents at December 31, 2018 301,766 $ 3.95
At December 31, 2018, there was $3.2 million of unrecognized compensation expense related to 2018 and 2017 restricted stock units. The unrecognized compensation expense is expected to be recognized over a weighted-average period of 1.3 years.
Employee Stock Purchase Plan
The Company’s Employee Stock Purchase Plan (“ESPP”) was approved by stockholders on May 18, 2012. The Company registered 500,000 shares of its common stock, currently held as treasury shares, for issuance under the ESPP. The purpose of the ESPP is to provide employees with an opportunity to purchase shares of the Company’s common stock through accumulated payroll deductions. The ESPP allows participants to purchase common stock at a purchase price equal to 85% of the fair market value of the common stock on the last business day of a three-month offering period which coincides with calendar quarters. Payroll deductions may not exceed 10% of an employee’s compensation and participants may not purchase more than 1,000 shares in any one offering period. In addition, for each calendar year, an employee may not be granted purchase rights for Flotek Stock valued over $25,000, as determined at the time such purchase right is granted. The fair value of the discount associated with shares purchased under the plan is recognized as share-based compensation expense and was $0.1 million, $0.1 million, and $0.1 million during the years ended December 31, 2018, 2017, and 2016, respectively. The total fair value of the shares purchased under the plan during the years ended December 31, 2018, 2017, and 2016 was $0.4 million, $0.8 million, and $1.0 million, respectively. The employee payment associated with participation in the plan was satisfied through payroll deductions. Effective after the third quarter 2018 purchase, the Company temporarily suspended the ESPP due to lack of shares.
Share-Based Compensation Expense
Non-cash share-based compensation expense related to restricted stock, restricted stock unit grants, and stock
purchased under the Company’s ESPP was $7.1 million, $10.6 million, and $11.4 million during the years ended December 31, 2018, 2017, and 2016, respectively.
Treasury Stock
The Company accounts for treasury stock using the cost method and includes treasury stock as a component of stockholders’ equity. During the years ended December 31, 2018, 2017, and 2016, the Company purchased 102,333shares, 199,644 shares, and 238,216 shares, respectively, of the Company’s common stock at market value as payment of income tax withholding owed by employees upon the vesting of restricted shares and the exercise of stock options. Shares issued as restricted stock awards to employees that were forfeited are accounted for as treasury stock. During the year ended December 31, 2018, there were no shares surrendered for the exercise of stock options. During the years ended December 31, 2017 and 2016, shares surrendered for the exercise of stock options were 478,287 and 3,225, respectively. These surrendered shares are also accounted for as treasury stock.
Stock Repurchase Program
In November 2012, the Company’s Board of Directors authorized the repurchase of up to $25 million of the Company’s common stock. Repurchases may be made in the open market or through privately negotiated transactions. Through December 31, 2018, the Company has repurchased $25 million of its common stock under this authorization.
In June 2015, the Company’s Board of Directors authorized the repurchase of up to an additional $50 million of the Company’s common stock. Repurchases may be made in the open market or through privately negotiated transactions. Through December 31, 2018, the Company has repurchased $0.3 million of its common stock under this authorization.
During the year ended December 31, 2018, the Company did not repurchase any shares of its outstanding common stock.
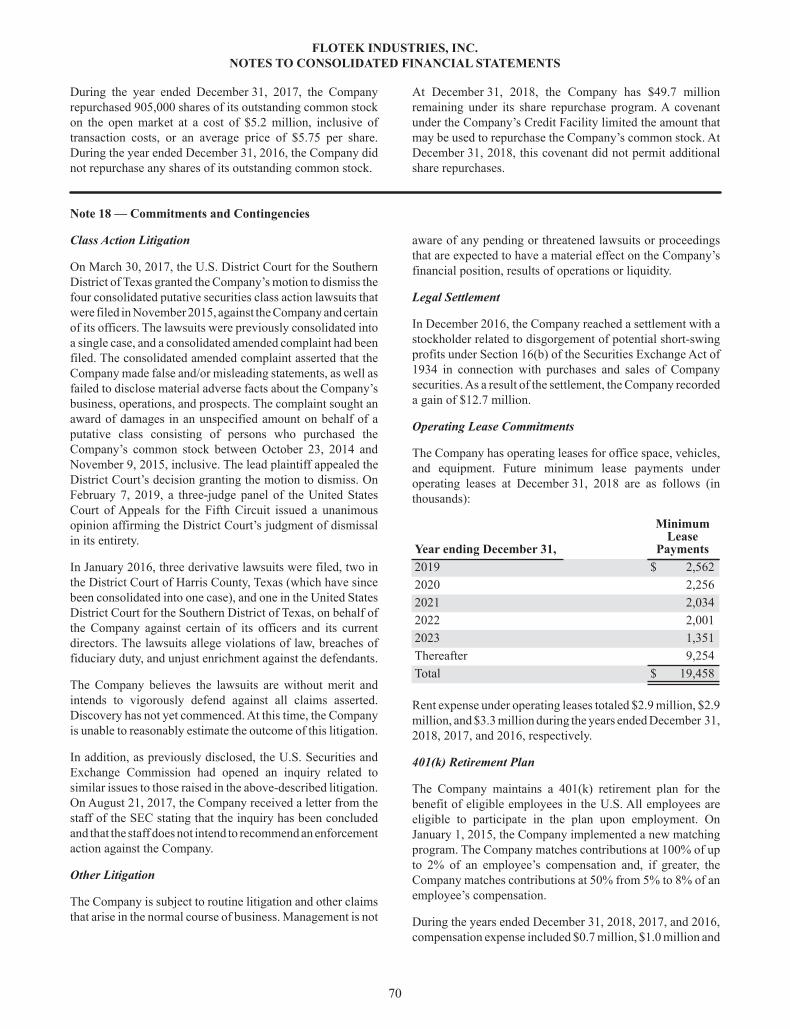
FLOTEK INDUSTRIES, INC.NOTES TO CONSOLIDATED FINANCIAL STATEMENTS
70
During the year ended December 31, 2017, the Company repurchased 905,000 shares of its outstanding common stock on the open market at a cost of $5.2 million, inclusive of transaction costs, or an average price of $5.75 per share. During the year ended December 31, 2016, the Company did not repurchase any shares of its outstanding common stock.
At December 31, 2018, the Company has $49.7 millionremaining under its share repurchase program. A covenant under the Company’s Credit Facility limited the amount that may be used to repurchase the Company’s common stock. At December 31, 2018, this covenant did not permit additional share repurchases.
Note 18 — Commitments and Contingencies
Class Action Litigation
On March 30, 2017, the U.S. District Court for the Southern District of Texas granted the Company’s motion to dismiss the four consolidated putative securities class action lawsuits that were filed in November 2015, against the Company and certain of its officers. The lawsuits were previously consolidated into a single case, and a consolidated amended complaint had been filed. The consolidated amended complaint asserted that the Company made false and/or misleading statements, as well as failed to disclose material adverse facts about the Company’s business, operations, and prospects. The complaint sought an award of damages in an unspecified amount on behalf of a putative class consisting of persons who purchased the Company’s common stock between October 23, 2014 and November 9, 2015, inclusive. The lead plaintiff appealed the District Court’s decision granting the motion to dismiss. On February 7, 2019, a three-judge panel of the United States Court of Appeals for the Fifth Circuit issued a unanimous opinion affirming the District Court’s judgment of dismissal in its entirety.
In January 2016, three derivative lawsuits were filed, two in the District Court of Harris County, Texas (which have since been consolidated into one case), and one in the United States District Court for the Southern District of Texas, on behalf of the Company against certain of its officers and its current directors. The lawsuits allege violations of law, breaches of fiduciary duty, and unjust enrichment against the defendants.
The Company believes the lawsuits are without merit and intends to vigorously defend against all claims asserted. Discovery has not yet commenced. At this time, the Company is unable to reasonably estimate the outcome of this litigation.
In addition, as previously disclosed, the U.S. Securities and Exchange Commission had opened an inquiry related to similar issues to those raised in the above-described litigation. On August 21, 2017, the Company received a letter from the staff of the SEC stating that the inquiry has been concluded and that the staff does not intend to recommend an enforcement action against the Company.
Other Litigation
The Company is subject to routine litigation and other claims that arise in the normal course of business. Management is not
aware of any pending or threatened lawsuits or proceedings that are expected to have a material effect on the Company’s financial position, results of operations or liquidity.
Legal Settlement
In December 2016, the Company reached a settlement with a stockholder related to disgorgement of potential short-swing profits under Section 16(b) of the Securities Exchange Act of 1934 in connection with purchases and sales of Company securities. As a result of the settlement, the Company recorded a gain of $12.7 million.
Operating Lease Commitments
The Company has operating leases for office space, vehicles, and equipment. Future minimum lease payments under operating leases at December 31, 2018 are as follows (in thousands):
Year ending December 31,
MinimumLease
Payments2019 $ 2,5622020 2,2562021 2,0342022 2,0012023 1,351Thereafter 9,254Total $ 19,458
Rent expense under operating leases totaled $2.9 million, $2.9 million, and $3.3 million during the years ended December 31, 2018, 2017, and 2016, respectively.
401(k) Retirement Plan
The Company maintains a 401(k) retirement plan for the benefit of eligible employees in the U.S. All employees are eligible to participate in the plan upon employment. On January 1, 2015, the Company implemented a new matching program. The Company matches contributions at 100% of up to 2% of an employee’s compensation and, if greater, the Company matches contributions at 50% from 5% to 8% of an employee’s compensation.
During the years ended December 31, 2018, 2017, and 2016, compensation expense included $0.7 million, $1.0 million and
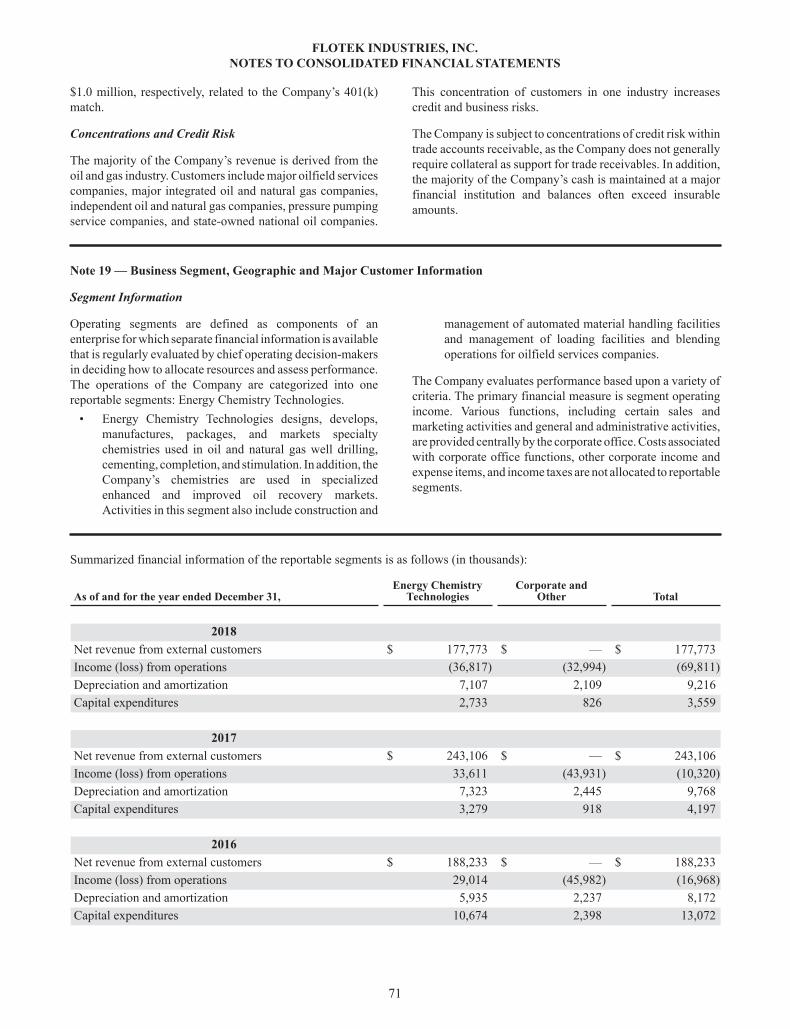
FLOTEK INDUSTRIES, INC.NOTES TO CONSOLIDATED FINANCIAL STATEMENTS
71
$1.0 million, respectively, related to the Company’s 401(k) match.
Concentrations and Credit Risk
The majority of the Company’s revenue is derived from the oil and gas industry. Customers include major oilfield services companies, major integrated oil and natural gas companies, independent oil and natural gas companies, pressure pumping service companies, and state-owned national oil companies.
This concentration of customers in one industry increases credit and business risks.
The Company is subject to concentrations of credit risk within trade accounts receivable, as the Company does not generally require collateral as support for trade receivables. In addition, the majority of the Company’s cash is maintained at a major financial institution and balances often exceed insurable amounts.
Note 19 — Business Segment, Geographic and Major Customer Information
Segment Information
Operating segments are defined as components of an enterprise for which separate financial information is available that is regularly evaluated by chief operating decision-makers in deciding how to allocate resources and assess performance. The operations of the Company are categorized into one reportable segments: Energy Chemistry Technologies.
• Energy Chemistry Technologies designs, develops, manufactures, packages, and markets specialty chemistries used in oil and natural gas well drilling, cementing, completion, and stimulation. In addition, the Company’s chemistries are used in specialized enhanced and improved oil recovery markets. Activities in this segment also include construction and
management of automated material handling facilities and management of loading facilities and blending operations for oilfield services companies.
The Company evaluates performance based upon a variety of criteria. The primary financial measure is segment operating income. Various functions, including certain sales and marketing activities and general and administrative activities, are provided centrally by the corporate office. Costs associated with corporate office functions, other corporate income and expense items, and income taxes are not allocated to reportable segments.
Summarized financial information of the reportable segments is as follows (in thousands):
As of and for the year ended December 31,Energy Chemistry
TechnologiesCorporate and
Other Total
2018Net revenue from external customers $ 177,773 $ — $ 177,773Income (loss) from operations (36,817) (32,994) (69,811)Depreciation and amortization 7,107 2,109 9,216Capital expenditures 2,733 826 3,559
2017Net revenue from external customers $ 243,106 $ — $ 243,106Income (loss) from operations 33,611 (43,931) (10,320)Depreciation and amortization 7,323 2,445 9,768Capital expenditures 3,279 918 4,197
2016Net revenue from external customers $ 188,233 $ — $ 188,233Income (loss) from operations 29,014 (45,982) (16,968)Depreciation and amortization 5,935 2,237 8,172Capital expenditures 10,674 2,398 13,072

FLOTEK INDUSTRIES, INC.NOTES TO CONSOLIDATED FINANCIAL STATEMENTS
72
Assets of the Company by reportable segments are as follows (in thousands):
December 31, 2018 December 31, 2017Energy Chemistry Technologies $ 139,205 $ 172,799Corporate and Other 28,208 35,871
Total segments 167,413 208,670Held for sale 118,470 121,218
Total assets $ 285,883 $ 329,888
Geographic Information
Revenue by country is based on the location where services are provided and products are used. No individual country other than the United States (“U.S.”) accounted for more than 10% of revenue. Revenue by geographic location is as follows (in thousands):
Year ended December 31, 2018 2017 2016U.S. $ 146,421 $ 219,517 $ 164,596Other countries 31,352 23,589 23,637Total $ 177,773 $ 243,106 $ 188,233
Long-lived assets held in countries other than the U.S. are not considered material to the consolidated financial statements.
Major Customers
Revenue from major customers, as a percentage of consolidated revenue, is as follows:
Year ended December 31,2018 2017 2016
Customer A 12.2% * *Customer B 10.1% * 16.4%Customer C * 16.7% 21.9%
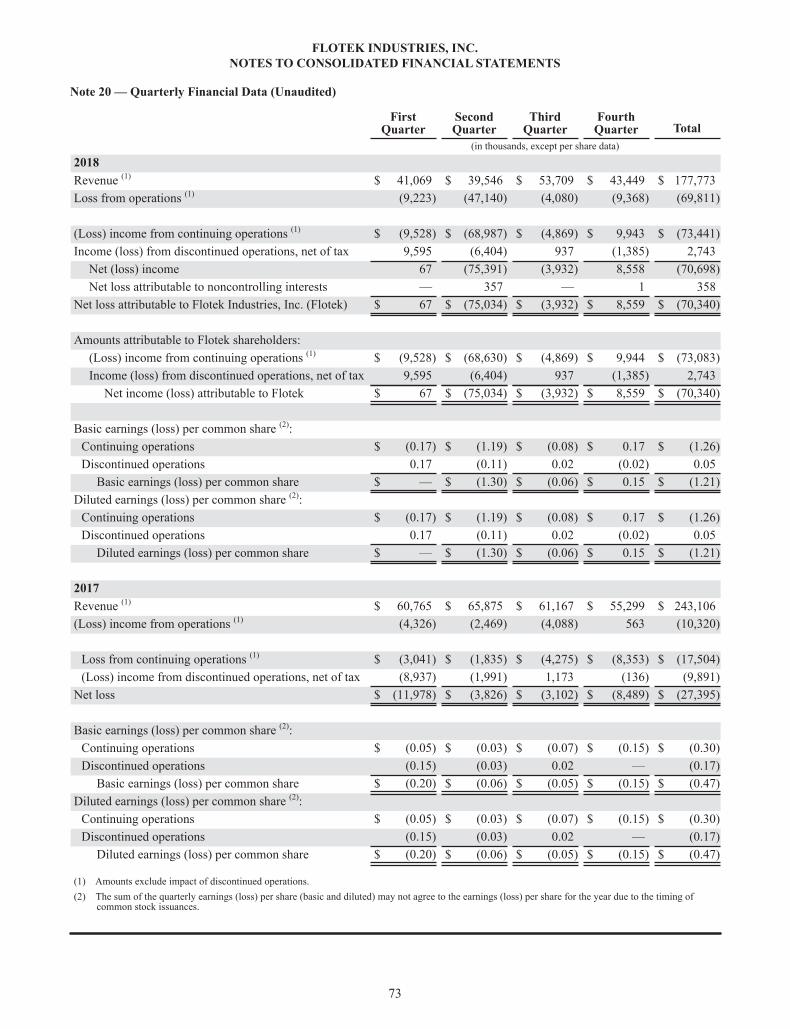
FLOTEK INDUSTRIES, INC.NOTES TO CONSOLIDATED FINANCIAL STATEMENTS
73
Note 20 — Quarterly Financial Data (Unaudited)
First Quarter
SecondQuarter
ThirdQuarter
FourthQuarter Total
(in thousands, except per share data)
2018Revenue (1) $ 41,069 $ 39,546 $ 53,709 $ 43,449 $ 177,773Loss from operations (1) (9,223) (47,140) (4,080) (9,368) (69,811)
(Loss) income from continuing operations (1) $ (9,528) $ (68,987) $ (4,869) $ 9,943 $ (73,441)Income (loss) from discontinued operations, net of tax 9,595 (6,404) 937 (1,385) 2,743
Net (loss) income 67 (75,391) (3,932) 8,558 (70,698)Net loss attributable to noncontrolling interests — 357 — 1 358
Net loss attributable to Flotek Industries, Inc. (Flotek) $ 67 $ (75,034) $ (3,932) $ 8,559 $ (70,340)
Amounts attributable to Flotek shareholders:(Loss) income from continuing operations (1) $ (9,528) $ (68,630) $ (4,869) $ 9,944 $ (73,083)Income (loss) from discontinued operations, net of tax 9,595 (6,404) 937 (1,385) 2,743
Net income (loss) attributable to Flotek $ 67 $ (75,034) $ (3,932) $ 8,559 $ (70,340)
Basic earnings (loss) per common share (2):Continuing operations $ (0.17) $ (1.19) $ (0.08) $ 0.17 $ (1.26)Discontinued operations 0.17 (0.11) 0.02 (0.02) 0.05
Basic earnings (loss) per common share $ — $ (1.30) $ (0.06) $ 0.15 $ (1.21)Diluted earnings (loss) per common share (2):
Continuing operations $ (0.17) $ (1.19) $ (0.08) $ 0.17 $ (1.26)Discontinued operations 0.17 (0.11) 0.02 (0.02) 0.05
Diluted earnings (loss) per common share $ — $ (1.30) $ (0.06) $ 0.15 $ (1.21)
2017Revenue (1) $ 60,765 $ 65,875 $ 61,167 $ 55,299 $ 243,106(Loss) income from operations (1) (4,326) (2,469) (4,088) 563 (10,320)
Loss from continuing operations (1) $ (3,041) $ (1,835) $ (4,275) $ (8,353) $ (17,504)(Loss) income from discontinued operations, net of tax (8,937) (1,991) 1,173 (136) (9,891)
Net loss $ (11,978) $ (3,826) $ (3,102) $ (8,489) $ (27,395)
Basic earnings (loss) per common share (2):Continuing operations $ (0.05) $ (0.03) $ (0.07) $ (0.15) $ (0.30)Discontinued operations (0.15) (0.03) 0.02 — (0.17)
Basic earnings (loss) per common share $ (0.20) $ (0.06) $ (0.05) $ (0.15) $ (0.47)Diluted earnings (loss) per common share (2):
Continuing operations $ (0.05) $ (0.03) $ (0.07) $ (0.15) $ (0.30)Discontinued operations (0.15) (0.03) 0.02 — (0.17)
Diluted earnings (loss) per common share $ (0.20) $ (0.06) $ (0.05) $ (0.15) $ (0.47)
(1) Amounts exclude impact of discontinued operations.(2) The sum of the quarterly earnings (loss) per share (basic and diluted) may not agree to the earnings (loss) per share for the year due to the timing of
common stock issuances.

FLOTEK INDUSTRIES, INC.NOTES TO CONSOLIDATED FINANCIAL STATEMENTS
74
Note 21 — Subsequent Events
On January 10, 2019, the Company entered into a Share Purchase Agreement with Archer Daniels-Midland Company (“ADM”) for the sale of all of the shares representing membership interest in its wholly owned subsidiary, Florida Chemical Company, LLC, which represents the CICT segment.
Effective February 28, 2019, the Company completed the sale of the CICT segment to ADM for $175.0 million in cash consideration, with $4.4 million temporarily held in escrow by ADM for post-closing working capital adjustments for up
to 90 days and $13.1 million temporarily held in escrow by ADM with releases at 6 months, 12 months, and 15 monthsto satisfy potential indemnification claims. The Company expects to recognize a gain on the sale of approximately $62 million to $66 million, pending post-closing adjustments.
Upon closing of the above transaction, the Company repaid the outstanding balance, interest, and fees related to the revolving credit facility on March 1, 2019, and subsequently terminated the Credit Facility with PNC Bank.
75
Item 9. Changes in and Disagreements With Accountants on Accounting and Financial Disclosure.
Not applicable.
Item 9A. Controls and Procedures.
Evaluation of Disclosure Controls and Procedures
The Company’s disclosure controls and procedures are designed to ensure that information required to be disclosed by the Company in reports filed or submitted under the Securities Exchange Act of 1934, as amended (the “Exchange Act”), is recorded, processed, summarized and reported within the time periods specified in the SEC’s rules and forms. The Company’s disclosure controls and procedures are also designed to ensure such information is accumulated and communicated to management, including the principal executive and principal financial officers, as appropriate to allow timely decisions regarding required disclosures. There are inherent limitations to the effectiveness of any system of disclosure controls and procedures, including the possibility of human error and the circumvention or overriding of controls and procedures. Accordingly, even effective disclosure controls and procedures can only provide reasonable assurance that control objectives are attained. The Company’s disclosure controls and procedures are designed to provide such reasonable assurance.
The Company’s management, with the participation of the principal executive and principal financial officers, evaluated the effectiveness of the design and operation of the Company’s disclosure controls and procedures as of December 31, 2018, as required by Rule 13a-15(e) of the Exchange Act. Based upon that evaluation, the principal executive and principal financial officers have concluded that the Company’s disclosure controls and procedures were effective as of December 31, 2018.
Management’s Report on Internal Control over Financial Reporting
The Company’s management is responsible for establishing and maintaining adequate internal control over financial reporting, as defined in Rule 13a-15(f) of the Exchange Act. The Company’s management, including the principal executive and principal financial officers, assessed the effectiveness of internal control over financial reporting as of December 31, 2018, based on criteria issued by the Committee of Sponsoring Organizations of the Treadway Commission (2013 Framework) (“COSO”) in Internal Control – Integrated Framework. Upon evaluation, the Company’s management has concluded that the Company’s internal control over financial reporting was effective in connection with the preparation of the consolidated financial statements as of December 31, 2018.
The effectiveness of the Company’s internal control over financial reporting as of December 31, 2018 has been audited by Moss Adams LLP, an independent registered public accounting firm, as stated in their report which is included herein.
Changes in Internal Control over Financial Reporting
There have been no changes in the Company’s system of internal control over financial reporting during the three months ended December 31, 2018 that have materially affected, or are reasonably likely to materially affect, the Company’s internal control over financial reporting.
Item 9B. Other Information.
None.
76
PART III
Item 10. Directors, Executive Officers and Corporate Governance.
The information required by this Item is incorporated by reference to the Company’s Definitive Proxy Statement for the 2019 Annual Meeting of Stockholders to be filed with the SEC within 120 days of year end.
Item 11. Executive Compensation.
The information required by this Item is incorporated by reference to the Company’s Definitive Proxy Statement for the 2019 Annual Meeting of Stockholders to be filed with the SEC within 120 days of year end.
Item 12. Security Ownership of Certain Beneficial Owners and Management and Related Stockholder Matters.
The information required by this Item is incorporated by reference to the Company’s Definitive Proxy Statement for the 2019 Annual Meeting of Stockholders to be filed with the SEC within 120 days of year end.
Item 13. Certain Relationships and Related Transactions, and Director Independence.
The information required by this Item is incorporated by reference to the Company’s Definitive Proxy Statement for the 2019 Annual Meeting of Stockholders to be filed with the SEC within 120 days of year end.
Item 14. Principal Accounting Fees and Services.
The information required by this Item is incorporated by reference to the Company’s Definitive Proxy Statement for the 2019 Annual Meeting of Stockholders to be filed with the SEC within 120 days of year end.

77
PART IV
Item 15. Exhibits and Financial Statement Schedules.
EXHIBIT INDEX
ExhibitNumber Exhibit Title
3.1 Amended and Restated Certificate of Incorporation (incorporated by reference to Exhibit 3.1 to the Company’s Form 10-Q for the quarter ended September 30, 2007).
3.2 Certificate of Amendment to the Amended and Restated Certificate of Incorporation (incorporated by reference to Exhibit 3.1 to the Company’s Form 10-Q for the quarter ended September 30, 2009).
3.3 Amended and Restated Bylaws, dated December 9, 2014 (incorporated by reference to Exhibit 3.1 to the Company’s Form 8-K filed on December 10, 2014).
3.4 Second Amended and Restated Bylaws, dated October 11, 2017 (incorporated by reference to Exhibit 3.1 to the Company’s Form 8-K filed on October 17, 2017).
4.1 Form of Certificate of Common Stock (incorporated by reference to Appendix E to the Company’s Definitive Proxy Statement filed on September 27, 2001).
4.2 Registration Rights Agreement, dated as of July 26, 2016, by and among the Company, Donald Bramblett, and Mark Kieper (incorporated by reference to Exhibit 4.6 to the Company’s Registration Statement on Form S-3 (File No. 333-212864) filed on August 3, 2016).
10.1 † 2010 Long-Term Incentive Plan (incorporated by reference to Appendix A to the Company’s Definitive Proxy Statement filed on July 13, 2010).
10.2 Amended and Restated Revolving Credit, Term Loan and Security Agreement dated May 10, 2013 (incorporated by reference to Exhibit 10.2 to the Company’s Form 8-K filed on May 13, 2013).
10.3 First Amendment to Amended and Restated Revolving Credit, Term Loan and Security Agreement dated December 31, 2013 (incorporated by reference to Exhibit 10.1 to the Company’s Form 8-K filed on January 7, 2014).
10.4 † 2014 Long-Term Incentive Plan (incorporated by reference to Exhibit A to the Company’s Definitive Proxy Statement filed on April 18, 2014).
10.5 Fifth Amended and Restated Service Agreement, dated as of April 15, 2014, between the Company, Protechnics II, Inc. and Chisholm Management, Inc. (incorporated by reference to Exhibit 10.1 to the Company’s Form 8-K filed on April 21, 2014).
10.6 † Letter Agreement, dated as of April 15, 2014, between the Company and John Chisholm (incorporated by reference to Exhibit 10.2 to the Company’s Form 8-K filed on April 21, 2014).
10.7 Second Amendment to Amended and Restated Revolving Credit, Term Loan and Security Agreement dated December 5, 2014 (incorporated by reference to Exhibit 10.1 to the Company’s Form 8-K filed on December 10, 2014).
10.8 Third Amendment to Amended and Restated Revolving Credit, Term Loan and Security Agreement dated June 19, 2015 (incorporated by reference to Exhibit 10.1 to the Company’s Form 8-K filed on June 24, 2015).
10.9 Fourth Amendment to Amended and Restated Revolving Credit, Term Loan and Security Agreement dated July 21, 2015 (incorporated by reference to Exhibit 10.1 to the Company’s Form 8-K filed on July 23, 2015).
10.10 † Employment Agreement, dated effective January 1, 2016 between the Company and Joshua A. Snively, Sr. (incorporated by reference to Exhibit 10.2 to the Company’s Form 8-K filed on January 7, 2016).
10.11 Fifth Amendment to Amended and Restated Revolving Credit, Term Loan and Security Agreement dated effective March 31, 2016 (incorporated by reference to Exhibit 10.1 to the Company’s Form 8-K filed on May 3, 2016).
10.12 Form of Subscription Agreement, dated as of July 26, 2016 (incorporated by reference to Exhibit 10.1 to the Company’s Form 8-K filed on August 1, 2016).
10.13 Sixth Amendment to Amended and Restated Revolving Credit, Term Loan and Security Agreement dated effective September 30, 2016 (incorporated by reference to Exhibit 10.1 to the Company’s Form 8-K filed on November 2, 2016).
10.14 † Retirement Agreement, dated February 14, 2017, between Robert M. Schmitz and the Company (incorporated by reference to Exhibit 10.1 to the Company’s Form 8-K filed on February 17, 2017).
10.15 † Retirement Agreement, dated February 16, 2017, between Steve Reeves and the Company (incorporated by reference to Exhibit 10.2 to the Company’s Form 8-K filed on February 17, 2017).
10.16 † Letter Agreement, dated February 13, 2017, among the Company, Protechnics II, Inc. and Chisholm Management, Inc. amending the Fifth Amended and Restated Service Agreement among such parties (incorporated by reference to Exhibit 10.3 to the Company’s Form 8-K filed on February 17, 2017).
10.17 Seventh Amendment to Amended and Restated Revolving Credit, Term Loan and Security Agreement and Sixth Amendment to Amended and Restated Revolving Credit, Term Loan and Security Agreement, dated effective as of March 31, 2017 (incorporated by reference to Exhibit 10.1 to the Company’s Form 8-K filed on May 1, 2017).

78
ExhibitNumber Exhibit Title
10.18 Asset Purchase Agreement, dated May 2, 2017, by and among National Oilwell DHT, L.P., Dreco Energy Services ULC, and National Oilwell Varco, L.P., the buyers, Teledrift Company, Turbeco, inc., Flotek Technologies ULC, and Flotek Industries FZE, the sellers, and Flotek Industries, Inc (incorporated by reference to Exhibit 10.2 to the Company’s Form 10-Q for the quarter ended June 30, 2017).
10.19 Eighth Amendment to Amended and Restated Revolving Credit, Term Loan and Security Agreement, dated effective as of June 7, 2017 (incorporated by reference to Exhibit 10.1 to the Company’s Form 10-Q for the quarter ended September 30, 2017).
10.20 Ninth Amendment to Amended and Restated Revolving Credit, Term Loan and Security Agreement, dated effective as of July 1, 2017 (incorporated by reference to Exhibit 10.2 to the Company’s Form 10-Q for the quarter ended September 30, 2017).
10.21 Tenth Amendment to Amended and Restated Revolving Credit, Term Loan and Security Agreement, dated effective as of September 29, 2017 (incorporated by reference to Exhibit 10.1 to the Company’s Form 8-K filed on October 3, 2017).
10.22 † Confidential Severance and Release Agreement, dated effective October 12, 2017, between the Company and Robert Bodnar (incorporated by reference to Exhibit 10.5 to the Company’s Form 10-Q for the quarter ended September 30, 2017).
10.23 † Employment Agreement, dated effective March 16, 2018, between the Company and Joshua A. Snively, Sr. (incorporated by reference to Exhibit 10.1 to the Company’s Form 8-K filed on March 22, 2018).
10.24 † Employment Agreement, dated effective March 16, 2018, between the Company and H. Richard Walton (incorporated by reference to Exhibit 10.2 to the Company’s Form 8-K filed on March 22, 2018).
10.25 † Employment Agreement, dated effective March 16, 2018, between the Company and Matthew B. Marietta (incorporated by reference to Exhibit 10.3 to the Company’s Form 8-K filed on March 22, 2018).
10.26 † Form of Restricted Stock Agreement, dated March 16, 2018, between the Company and Joshua A. Snively, Sr. and Matthew B. Marietta (incorporated by reference to Exhibit 10.4 to the Company’s Form 8-K filed on March 22, 2018).
10.27 † Form of Restricted Stock Agreement, dated March 16, 2018, between the Company and H. Richard Walton (incorporated by reference to Exhibit 10.5 to the Company’s Form 8-K filed on March 22, 2018).
10.28 † 2018 Long-Term Incentive Plan (incorporated by reference to Exhibit A to the Company’s Definitive Proxy Statement filed on March 30, 2018).
10.29 Eleventh Amendment to Amended and Restated Revolving Credit, Term Loan and Security Agreement dated June 13, 2018 (incorporated by reference to Exhibit 10.1 to the Company’s Form 8-K filed on June 13, 2018).
10.30 † Employment Agreement, dated effective December 20, 2018, between the Company and Elizabeth T. Wilkinson (incorporated by reference to Exhibit 10.1 to the Company’s Form 8-K filed on December 27, 2018).
10.31 † Form of Restricted Stock Agreement, dated December 27, 2018, between the Company and Elizabeth T. Wilkinson (incorporated by reference to Exhibit 10.2 to the Company’s Form 8-K filed on December 27, 2018).
21 * List of Subsidiaries.23.1 * Consent of Moss Adams LLP.23.2 * Consent of Hein & Associates LLP.31.1 * Rule 13a-14(a) Certification of Principal Executive Officer.31.2 * Rule 13a-14(a) Certification of Principal Financial Officer.32.1 ** Section 1350 Certification of Principal Executive Officer.32.2 ** Section 1350 Certification of Principal Financial Officer.
101.INS * XBRL Instance Document.101.SCH * XBRL Schema Document.101.CAL * XBRL Calculation Linkbase Document.101.LAB * XBRL Label Linkbase Document.101.PRE * XBRL Presentation Linkbase Document.101.DEF * XBRL Definition Linkbase Document.
* Filed with this Form 10-K.** Furnished with this Form 10-K, not filed.† Management contracts or compensatory plans or agreements.
79
SIGNATURES
Pursuant to the requirements of Section 13 or 15(d) of the Securities Exchange Act of 1934, the registrant has duly caused this report to be signed on its behalf by the undersigned, thereunto duly authorized.
FLOTEK INDUSTRIES, INC.
By: /s/ JOHN W. CHISHOLM John W. Chisholm President, Chief Executive Officer and Chairman of the Board
Date: March 8, 2019
Pursuant to the requirements of the Securities Exchange Act of 1934, this report has been signed below by the following persons on behalf of the registrant and in the capacities and on the dates indicated.
Signature Title Date
/s/ JOHN W. CHISHOLM President, Chief Executive Officer, and Chairman of the Board March 8, 2019John W. Chisholm (Principal Executive Officer) /s/ ELIZABETH T. WILKINSON Chief Financial Officer March 8, 2019Elizabeth T. Wilkinson (Principal Financial Officer and Principal Accounting Officer)/s/ MICHELLE M. ADAMS Director March 8, 2019Michelle M. Adams/s/ TED D. BROWN Director March 8, 2019Ted D. Brown/s/ L. MELVIN COOPER Director March 8, 2019L. Melvin Cooper /s/ L.V. “BUD” MCGUIRE Director March 8, 2019L.V. “Bud” McGuire/s/ DAVID NIERENBERG Director March 8, 2019David Nierenberg /s/ KATHERINE T. RICHARD Director March 8, 2019Katherine T. Richard

[THIS PAGE INTENTIONALLY LEFT BLANK]

EXHIBIT 21FLOTEK INDUSTRIES, INC.
LIST OF SUBSIDIARIES
Flotek Chemistry, LLC Flotek Ecuador Investments, LLC
Oklahoma Limited Liability Company Texas Limited Liability Company
Material Translogistics, Inc. Flotek Ecuador Management, LLC
Texas Corporation Texas Limited Liability Company
Flotek Industries FZE Flotek Chemical Ecuador Cia. Ltda.
Jebel Ali Free Zone Establishment Ecuador Limited Liability Company
Flotek Services, LLC Florida Chemical Company, Inc.
Panama Limited Liability Company Delaware Corporation
USA Petrovalve, Inc. Flotek Flavor & Fragrance, LLC
Texas Corporation Delaware Limited Liability Company
Turbeco, Inc. Flotek Gulf, LLC
Texas Corporation Omani Limited Liability Company
Flotek Export, Inc. Flotek Gulf Research, LLC
Texas Corporation Omani Limited Liability Company
Flotek Paymaster, Inc. Flotek Industries Holdings Limited
Texas Corporation England and Wales Corporation
Teledrift Company Flotek Industries UK Limited
Delaware Corporation England and Wales Corporation
Flotek International, Inc. Flotek Technologies ULC
Delaware Corporation British Columbia Unlimited Liability Company
Flotek Hydralift, Inc. Flotek Energetic Foundation - Making a Difference
Texas Corporation Texas Nonprofit Corporation

EXHIBIT 23.1
CONSENT OF INDEPENDENT REGISTERED PUBLIC ACCOUNTING FIRM
We consent to the incorporation by reference in the Registration Statements filed on Form S-8 (Nos. 333-157276, 333-172596, 333-174983, 333-183617, 333-198757, 333-213407, and 333-225865) and on Form S-3 (Nos. 333-161552, 333-166442, 333-166443, 333-173806, 333-174199, 333-189555, 333-212864 and 333-219618) of our reports dated March 8, 2019, relating to the consolidated financial statements of Flotek Industries, Inc. and subsidiaries which report expresses an unqualified opinion and includes an explanatory paragraph relating to the adoption of new accounting standards, and the effectiveness of internal control over financial reporting of Flotek Industries, Inc. and subsidiaries appearing in this Annual Report (Form 10-K) for the year ended December 31, 2018.
/s/ Moss Adams LLP
Houston, TexasMarch 8, 2019

EXHIBIT 23.2
CONSENT OF INDEPENDENT REGISTERED PUBLIC ACCOUNTING FIRM
We consent to the incorporation by reference in the Registration Statements filed on Form S-8 (Nos. 333-157276, 333-172596, 333-174983, 333-183617, 333-198757, 333-213407 and 333-225865) and on Form S-3 (Nos. 333-161552, 333-166442, 333-166443, 333-173806, 333-174199, 333-189555, 333-212864 and 333-219618) of Flotek Industries, Inc. and subsidiaries (the “Company”) of our reports dated February 8, 2017, relating to the consolidated financial statements of the Flotek Industries, Inc. and subsidiaries and the effectiveness of internal control over financial reporting of the Flotek Industries, Inc. and subsidiaries, appearing in the Annual Report on Form 10-K of Flotek Industries, Inc. and subsidiaries for the year ended December 31, 2018.
We also consent to the reference to our firm under the heading “Experts” in such Registration Statements.
/s/ Hein & Associates LLP
Houston, TexasMarch 8, 2019

Exhibit 31.1
CERTIFICATION
I, John W. Chisholm, certify that:
1. I have reviewed this Annual Report on Form 10-K of Flotek Industries, Inc.;
2. To the best of my knowledge, this report does not contain any untrue statement of a material fact or omit to state a material fact necessary to make the statements made, in light of the circumstances under which such statements were made, not misleading with respect to the period covered by this report;
3. To the best of my knowledge, the financial statements, and other financial information included in this report, fairly present in all material respects the financial condition, results of operations and cash flows of the registrant as of, and for, the periods presented in this report;
4. The registrant’s other certifying officer and I are responsible for establishing and maintaining disclosure controls and procedures (as defined in Exchange Act Rules 13a-15(e) and 15d-15(e)) and internal control over financial reporting (as defined in Exchange Act Rules 13a-15(f) and 15d-15(f)) for the registrant and have:
(a) Designed such disclosure controls and procedures, or caused such disclosure controls and procedures to be designed under our supervision, to ensure that material information relating to the registrant, including its consolidated subsidiaries, is made known to us by others within those entities, particularly during the period in which this report is being prepared;
(b) Designed such internal control over financial reporting, or caused such internal control over financial reporting to be designed under our supervision, to provide reasonable assurance regarding the reliability of financial reporting and the preparation of financial statements for external purposes in accordance with generally accepted accounting principles;
(c) Evaluated the effectiveness of the registrant’s disclosure controls and procedures and presented in this report our conclusions about the effectiveness of the disclosure controls and procedures, as of the end of the period covered by this report based on such evaluation; and
(d) Disclosed in this report any change in the registrant’s internal control over financial reporting that occurred during the registrant’s most recent fiscal quarter that has materially affected, or is reasonably likely to materially affect, the registrant’s internal control over financial reporting; and
5. The registrant’s other certifying officer and I have disclosed, based on our most recent evaluation of internal control over financial reporting, to the registrant’s auditors and the audit committee of the registrant’s board of directors:
(a) All significant deficiencies and material weaknesses in the design or operation of internal control over financial reporting which are reasonably likely to adversely affect the registrant’s ability to record, process, summarize and report financial information; and
(b) Any fraud, whether or not material, that involves management or other employees who have a significant role in the registrant’s internal control over financial reporting.
/s/ JOHN W. CHISHOLMJohn W. Chisholm
President, Chief Executive Officer andChairman of the Board
Date: March 8, 2019

Exhibit 31.2
CERTIFICATION
I, Elizabeth T. Wilkinson, certify that:
1. I have reviewed this Annual Report on Form 10-K of Flotek Industries, Inc.;
2. To the best of my knowledge, this report does not contain any untrue statement of a material fact or omit to state a material fact necessary to make the statements made, in light of the circumstances under which such statements were made, not misleading with respect to the period covered by this report;
3. To the best of my knowledge, the financial statements, and other financial information included in this report, fairly present in all material respects the financial condition, results of operations and cash flows of the registrant as of, and for, the periods presented in this report;
4. The registrant’s other certifying officer and I are responsible for establishing and maintaining disclosure controls and procedures (as defined in Exchange Act Rules 13a-15(e) and 15d-15(e)) and internal control over financial reporting (as defined in Exchange Act Rules 13a-15(f) and 15d-15(f)) for the registrant and have:
(a) Designed such disclosure controls and procedures, or caused such disclosure controls and procedures to be designed under our supervision, to ensure that material information relating to the registrant, including its consolidated subsidiaries, is made known to us by others within those entities, particularly during the period in which this report is being prepared;
(b) Designed such internal control over financial reporting, or caused such internal control over financial reporting to be designed under our supervision, to provide reasonable assurance regarding the reliability of financial reporting and the preparation of financial statements for external purposes in accordance with generally accepted accounting principles;
(c) Evaluated the effectiveness of the registrant’s disclosure controls and procedures and presented in this report our conclusions about the effectiveness of the disclosure controls and procedures, as of the end of the period covered by this report based on such evaluation; and
(d) Disclosed in this report any change in the registrant’s internal control over financial reporting that occurred during the registrant’s most recent fiscal quarter that has materially affected, or is reasonably likely to materially affect, the registrant’s internal control over financial reporting; and
5. The registrant’s other certifying officer and I have disclosed, based on our most recent evaluation of internal control over financial reporting, to the registrant’s auditors and the audit committee of the registrant’s board of directors:
(a) All significant deficiencies and material weaknesses in the design or operation of internal control over financial reporting which are reasonably likely to adversely affect the registrant’s ability to record, process, summarize and report financial information; and
(b) Any fraud, whether or not material, that involves management or other employees who have a significant role in the registrant’s internal control over financial reporting.
/s/ ELIZABETH T. WILKINSONElizabeth T. Wilkinson
Executive Vice President andChief Financial Officer
Date: March 8, 2019

Exhibit 32.1
CERTIFICATION PURSUANT TO 18 U.S.C. SECTION 1350,
AS ADOPTED PURSUANT TO SECTION 906 OF THE SARBANES-OXLEY ACT OF 2002
In connection with the Annual Report of Flotek Industries, Inc. (the “Company”) on Form 10-K for the year ended December 31, 2018, as filed with the Securities and Exchange Commission on the date hereof (the “Report”), the undersigned hereby certifies, pursuant to 18 U.S.C. §1350, as adopted pursuant to § 906 of the Sarbanes-Oxley Act of 2002, that:
(1) The Report fully complies with the requirements of section 13(a) or 15(d) of the Securities Exchange Act of 1934; and
(2) The information contained in the Report fairly presents, in all material respects, the financial condition and results of operations of the Company.
/s/ JOHN W. CHISHOLMJohn W. Chisholm
President, Chief Executive Officer andChairman of the Board
Date: March 8, 2019
Exhibit 32.2
CERTIFICATION PURSUANT TO 18 U.S.C. SECTION 1350,
AS ADOPTED PURSUANT TO SECTION 906 OF THE SARBANES-OXLEY ACT OF 2002
In connection with the Annual Report of Flotek Industries, Inc. (the “Company”) on Form 10-K for the year ended December 31, 2018, as filed with the Securities and Exchange Commission on the date hereof (the “Report”), the undersigned hereby certifies, pursuant to 18 U.S.C. §1350, as adopted pursuant to § 906 of the Sarbanes-Oxley Act of 2002, that:
(1) The Report fully complies with the requirements of section 13(a) or 15(d) of the Securities Exchange Act of 1934; and
(2) The information contained in the Report fairly presents, in all material respects, the financial condition and results of operations of the Company.
/s/ ELIZABETH T. WILKINSONElizabeth T. Wilkinson
Executive Vice President andChief Financial Officer
Date: March 8, 2019


A N N UA L M E E T I N G
Friday, May 24, 2019
10:00 am CDT
Flotek Industries
Global Headquarters
10603 W Sam Houston
Pkwy North
Suite 300
Houston, TX 77064
S T O C K E XC H A N G E L I S T I N G
The company’s common stock
trades on the New York Stock
Exchange, under the symbol
“FTK”.
T R A N S FE R AG E N T
American Stock Transfer &
Trust Company
6201 15th Ave.
Brooklyn, New York 11219
800-937-5449
AU D I T O R S
Moss Adams, LLP
500 Dallas St., Suite 2500
Houston, TX 77002
713-850-9814
B OA R D O F D I R E C T O R S
John W. Chisholm Outgoing Chairman of the Board* Member, Strategic Capital Committee
David Nierenberg Incoming Chairman of the Board* Member, Governance & Nominating Committee Member, Compensation Committee Chair, Strategic Capital Committee
L.V. “Bud” McGuire, Lead Director Member, Audit Committee Member, Governance & Nominating Committee
Michelle M. Adams, Director Chair, Compensation Committee Member, Governance & Nominating Committee
Ted D. Brown, Director Chair, Governance & Nominating Committee Member, Audit Committee Member, Compensation Committee Member, Strategic Capital Committee
L. Melvin Cooper, Director Chair, Audit Committee Member, Compensation Committee
Paul W. Hobby, Director** Member, Governance & Nominating Committee Member, Strategic Capital Committee
Kate Richard, Outgoing Director* Member, Strategic Capital Committee
L E A D E R S H I P T E A M
John W. Chisholm, Chief Executive Officer and President Member, Strategic Capital Committee
Elizabeth T. Wilkinson Chief Financial Officer Member, Strategic Capital Committee
William York Chief Administrative Officer
Danielle Allen Senior Vice President, Global Communications & Technology Commercialization
James Silas Senior Vice President, Research and Innovation
* Effective as of the 2019 Annual Meeting onMay 24, 2019
**Effective March 2019
2018
Flotek Industries

© FLOTEK INDUSTRIES 2019