flow and turbulence around thin fences in perpendicular
TRANSCRIPT

Netherlands Journal of Agricultural Science 35 (1987) 7-20
Flow and turbulence around thin fences in perpendicular and oblique flow direction
A. F. G. Jacobs and L. Wartena
Department of Physics and Meteorology, Agricultural University, Duivendaal 2, 6701 AP Wageningen, Netherlands.
Received 28 May 1986; accepted 16 October 1986
Key words: fence, flow, turbulence, flow direction, flow recovery, flow reduction, micrometeorology.
Abstract
A class of flows which occurs very often in nature as well as in engineering practice, is that of strongly perturbed shear layer flows. Despite several full-scale and wind tunnel studies, there is still much unknown about these shear flows, which are surprisingly complicated. That is why a full-scale field study was conducted in order to investigate the flow around a thin closed fence attached to the earth's surface. At nine locations around a thin closed fence attached to the earth's surface. At nine locations around the fence, mean wind profiles were measured simultaneously with sensitive cup anemometers. In addition, at three levels near the ground the r.m.s. values of the speed fluctuations were measured. The thermal stratification of the undisturbed flow was measured with a sonic anemometer/thermometer. The effect of the thermal stratification on the recovery of the wind profiles and speed fluctuations was studied as well as the effect of the incidence angle on the behaviour of the disturbed flow.
Introduction
In rural areas, man has applied shelterbelts to protect himself, his livestock and his acreage against the effects of high winds. This is done especially in the plain regions, in order to protect the soil from erosion by winds. Well-known are the extensive shelterbelts programmes carried out in the USSR and the USA in 1931 and 1934, respectively. In urban regions the importance of the knowledge of the atmospheric flow around man-made obstructions has also attained increasing recognition. Such flows have a major effect on turbulent diffusion from pollutants in their vicinity (Ogawa & Diosy, 1980). An extensive survey of advantages as well as disadvantages of applying of sheltering in agricultural practices can be found in Shah (1962) and more recently in Benndorf et al. (1980).
Despite several full-scale and wind tunnel studies, still little is known and under
7

A. F. G. JACOBS AND L. WARTENA
stood about the class of strongly perturbed shear flows. The cause of this is partly that these flows are surprisingly complicated (Bradshaw & Wong, 1972) and partly a lack of experimental data (Counihan et al., 1974).
The general objective of the present study was to contribute to a better understanding of this class of flows. To attain this objective, a full-scale experiment was carried out around a two-dimensional barrier attached to the earth's surface. Despite an uncontrollable atmospheric flow and high cost, an outdoor experiment was done because especially in nature this class of flows occurs very often, but it has been investigated less thoroughly than reduced model flows in a wind tunnel. Moreover, in simulating atmospheric phenomena there are still serious scaling problems (Raine & Stevenson, 1977; Ogawa & Diosy, 1980), consequently these results for outdoor applications remain of limited importance.
Materials and methods
In order to study a strongly perturbed shear flow, a closed thin fence was constructed on a flat terrain. The fence consisted of wooden plates with a thickness of 0.02 m, a height, H, of 2 m and a width, B, of 64 m. During the measurement campaign the heather was mowed. Its mean vegetation height was about 0.25 m and its mean
-10 -6 -2
• sonic
anem/therm
-mast location
2 6 10 * i i
20 -i-
30 -I-
-» fence
N
I 60 -i
• cup anemometer
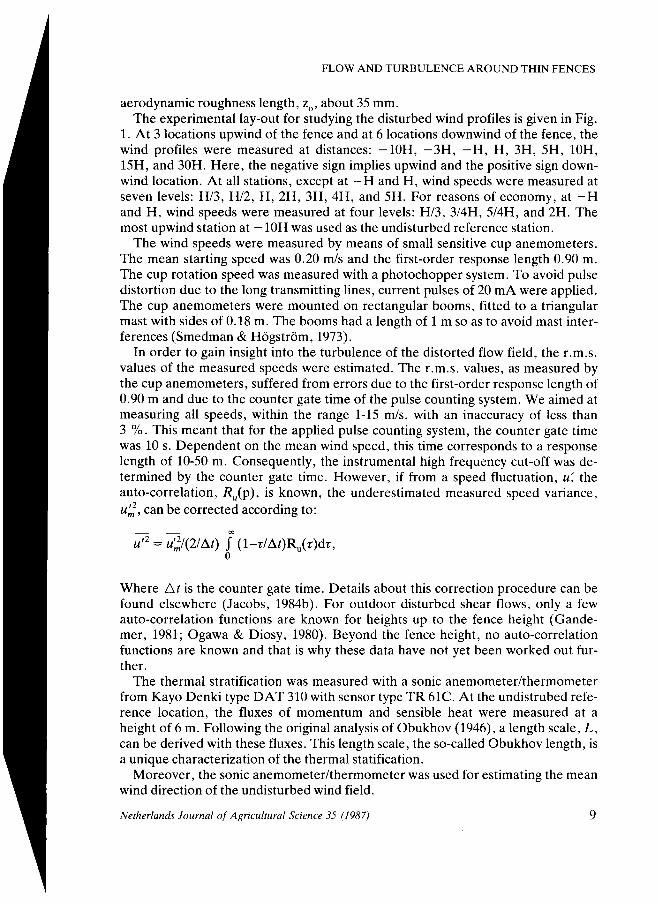
Fig. 1. The experimental lay-out. Distances and heights in meters.
8 Netherlands Journal of Agricultural Science 35 (1987)
FLOW AND TURBULENCE AROUND THIN FENCES
aerodynamic roughness length, z0, about 35 mm. The experimental lay-out for studying the disturbed wind profiles is given in Fig.
1. At 3 locations upwind of the fence and at 6 locations downwind of the fence, the wind profiles were measured at distances: -10H, -3H, — H, H, 3H, 5H, 10H, 15H, and 30H. Here, the negative sign implies upwind and the positive sign downwind location. At all stations, except at — H and H, wind speeds were measured at seven levels: H/3, H/2, H, 2H, 3H, 4H, and 5H. For reasons of economy, at —H and H, wind speeds were measured at four levels: H/3, 3/4H, 5/4H, and 2H. The most upwind station at -10H was used as the undisturbed reference station.
The wind speeds were measured by means of small sensitive cup anemometers. The mean starting speed was 0.20 m/s and the first-order response length 0.90 m. The cup rotation speed was measured with a photochopper system. To avoid pulse distortion due to the long transmitting lines, current pulses of 20 m A were applied. The cup anemometers were mounted on rectangular booms, fitted to a triangular mast with sides of 0.18 m. The booms had a length of 1 m so as to avoid mast interferences (Smedman & Högström, 1973).
In order to gain insight into the turbulence of the distorted flow field, the r.m.s. values of the measured speeds were estimated. The r.m.s. values, as measured by the cup anemometers, suffered from errors due to the first-order response length of 0.90 m and due to the counter gate time of the pulse counting system. We aimed at measuring all speeds, within the range 1-15 m/s, with an inaccuracy of less than 3 %. This meant that for the applied pulse counting system, the counter gate time was 10 s. Dependent on the mean wind speed, this time corresponds to a response length of 10-50 m. Consequently, the instrumental high frequency cut-off was determined by the counter gate time. However, if from a speed fluctuation, u, the auto-correlation, Äu(p), is known, the underestimated measured speed variance, u£, can be corrected according to:
u'2 = u'2/(2/At) ƒ (l-r/Ar)Ru(r)dr, 0
Where At is the counter gate time. Details about this correction procedure can be found elsewhere (Jacobs, 1984b). For outdoor disturbed shear flows, only a few auto-correlation functions are known for heights up to the fence height (Gande-mer, 1981; Ogawa & Diosy, 1980). Beyond the fence height, no auto-correlation functions are known and that is why these data have not yet been worked out further.
The thermal stratification was measured with a sonic anemometer/thermometer from Kayo Denki type DAT 310 with sensor type TR 61C. At the undistrubed reference location, the fluxes of momentum and sensible heat were measured at a height of 6 m. Following the original analysis of Obukhov (1946), a length scale, L, can be derived with these fluxes. This length scale, the so-called Obukhov length, is a unique characterization of the thermal statification.
Moreover, the sonic anemometer/thermometer was used for estimating the mean wind direction of the undisturbed wind field.
Netherlands Journal of Agricultural Science 35 (1987) 9

A. F. G. JACOBS AND L. WARTENA
All measured signals were transmitted to a van at a distance of 300 m downwind of the fence. Here, the pulses from the cup anemometers were counted and the continuous signals were digitized. On-line the data were reduced to runs of 30 min averages and the results were stored on cassette tape (TU-58). The mini-computer PDP-11/03 was used.
Results and discussion
Mean disturbed wind profiles In order to get a first impression of the mean disturbed wind field, the results of a thermally near-neutral run (H/L = -0.002) and nearly perpendicular angle of attack (|0| <1°) have been plotted in Fig. 2. The mean distorted wind profiles are given in dimensionless form; all speeds are non-dimensioned with the undisturbed speed, uH, at the fence height, H, and all distances and levels are non-dimensioned with the fence height. Moreover, in Fig. 2 the non-dimensioned speed deficits, (u0 - u)/uH, are given with uH the undisturbed speed at the same height. If, in fluid mechanics, quantities are non-dimensioned with characteristic quantities, it means that the same non-dimensional results will be found for different characteristic quantities. Here, uH and H are such characteristic quantities and that is why all results have been non-dimensioned with uH and H.
From this result, firstly the extension of the mean disturbed wind field can be deduced, which is highly asymmetrical. As a rough approximation, the distortion starts at —5H windward of the fence. At the leeward station 30H the mean wind profile is not yet completely recovered. The highest measuring level was 5H and at that height the speed disturbances are still perceptable, especially just over the fence.
Secondly, the sheltered region near the surface can be deduced. If the sheltered area near the surface (z = HI3) is defined as the area at which the reduction, R = (,uo - u)/u0, is at least 0.2, it can be calculated from Fig. 2, (Jacobs, 1984b) that this area extends to 24H downstream of the fence.
Thirdly, it can be deduced from Fig. 2 that between levels H and 2H the greatest vertical wind shear exists for all disturbed wind profiles.
In the analysis of the termal stratification effect, a thermally unstable (H/L = -0.09) and a thermally stable (H/L = 0.09) run have been selected with a nearly perpendicular incidence angle (4> < 1 °). The results for these runs have been plotted in Fig. 3.
In a thermally non-neutral stratification, the undisturbed wind speed profiles differ significantly from the neutral case. That is why a non-neutral stratification must yield differences in comparison with the neutral state. These effects can be seen quite clearly from the behaviour of the disturbed flow just around the fence. With increasing thermal instability an undisturbed wind profile contains increasing horizontal momentum near the surface (Monin & Yaglom, 1975). This means that with increasing instability, just in front of the fence, more mass has to be deflected in upward direction in order to pass the fence. Consequently, with increasing instability the reduction just behind the fence must increase and in addition just above the
10 Netherlands Journal of Agricultural Science 35 (1987)

FLOW AND TURBULENCE AROUND THIN FENCES

A. F. G. JACOBS AND L. WARTENA

5 z ~H" t4
3
1
°l
5
4
3
2-
1
°l
5
4
3
2-,
1
°(
5
4
3
1
H
Fig.
FLOW AND TURBULENCE AROUND THIN FENCES
id speed deficits in near-
U H
-neutral stratification (|H/L| <0.01) for several incidence
fAgricultural Science 35 (1987) 13

A. F. G. JACOBS AND L. WARTENA
fence the wind speed must increase as well. In a disturbed flow, the exchange process for momentum depends on the turbu
lence of the original undisturbed flow and on the new turbulence generated by the fence. The turbulence of the original flow, however, is highly dependent on the thermal stratification: an increasing instability is coupled with increasing turbulence. Consequently, a faster recovery is expected with increasing instability. This effect is shown quite clearly in the thermally unstable state. In the thermally stable state the opposite is expected, but the results do not indicate that. However, the speed deficits just behind the fence are smaller with increasing thermal stability. That is probably the reason why in the stable state the speed profile recovery near the surface is somewhat faster than in the thermally near-neutral state.
In order to study the effect of the incidence angle on the recovery of the distorted flow field, four near-neutral (|H/L| <0.01) runs have been selected with angles of attack of 13 °, 22 °, 32 °, and 40 °. The downwind results of the nondimensionized deficit profiles have been plotted in Fig. 4. It can be seen from these results that after apparent recovery has taken place, the next measuring station shows a little overshoot in the wind speed near the surface (in Fig. 4 the overshoot regions have been hatched). Here, by overshoot is meant a wind speed higher than in the undisturbed reference wind speed at the same level. Moreover, it can be deduced from this result that an overshoot region is followed by an undershoot region and that these regions shift to the fence with increasing incidence angle.
Physically, an overshoot in the wind speed near the surface, followed by an undershoot can be explained by means of a line vortex (Batchelor, 1977) that is deflected by the finite width of the fence (see Fig. 5). A line vortex is a small narrow
Fig. 5. The deflection of the line vortex near the surface, due to the finite width of the fence. + region of increasing speed; - region of decreasing speed.
14 Netherlands Journal of Agricultural Science 35 (1987)

FLOW AND TURBULENCE AROUND THIN FENCES
f
H
Fig. 6. The overshoot (+) and undershoot (—) areas for different incidence angle; x is mast location.
region with a high degree of rotation. The undisturbed fluid flow has a line vortex, determined by the speed gradient near the surface. Near the fence this line vortex is deflected due to the finite width of the fence. As a result, high momentum from above is transported downward at one side of the deflected line vortex and low momentum is transported upward at the other side of the vortex line behind the fence.
With the data of Fig. 4, the location of the regions where an overshoot of the wind speed near the incidence angle is found, which originates at the windward edge (Fig. 6) of the fence. The left part of this sector indicates an overshoot and the right part an undershoot of the wind speed. More details of the behaviour of the sheltered region near the surface can be found elsewhere (Jacobs, 1984b).
Turbulence properties In order to gain more insight in the turbulence properties of the disturbed flow, the r.m.s. values of the speed fluctuations around the fence were determined. In Fig. 7 the normalized speed fluctuations have been plotted for nearly perpendicular flow direction (<t> <1 °) and near-neutral stratification (H/L = —0.002). The r.m.s. values, ou, are non-dimensioned with the r.m.s. values, ouR, of the same height at the reference location. In Fig. 7, only the data for z<H have been plotted, because these data could only be corrected for instrumental cut-offs (Jacobs, 1985).
Ahead of the fence, the r.m.s. values decrease gradually at all levels below the fence height. A decrease is expected, because the mean streamline curvature causes a reduction of the turbulence intensity if the streamline deflection is upward
Netherlands Journal of Agricultural Science 35 (1987) 15

A. F. G. JACOBS AND L. WARTENA
1.2 <711 ffUR
0.6
0,8
1.0
0.4
0,2
0 10 5 0 5 10 15 20 25 30 X
Tf Fig. 7. The normalized r.m.s. values of the speed fluctuations for nearly perpendicular flow direction (O < 1 °) and near-neutral stratification (H/L = -0.002). z = H\ — • — z = HI2; — z = HI3.
(Wyngaard et al., 1968). Just behind the obstacle and below the fence height a minimum in the speed fluctuations is observed, whereas at the obstacle height the minimum is shifted downstream. Further downstream the speed fluctuations increase and, at the levels H/2 and H, even exceed the undisturbed values near the station x = 15H. At the lowest level, H/3, the speed fluctuations increase somewhat more slowly beyond x = 10H. Nevertheless, the undisturbed value is also exceeded near the location x = 30H.
In analysing the effect of the thermal stratification on the behaviour of the disturbed turbulence, runs in an unstable (H/L = -0.09) and in a stable (H/L = 0.07) stratification were selected and compared to the neutral state. The dimen-sionless r.m.s. values of the speed fluctuations have been plotted in Fig. 8. From this result it is easy to observe that the stratification effect on the turbulence is much greater than the effect on the speed deficits. In both the stable and unstable state, the speed fluctuations are reduced, but the increase rate is much higher for all levels since the stratification is more unstable. Besides, in the stable case it can be observed that the disturbed speed fluctuations remain below the undisturbed values for all levels and for all measuring stations.
As can be observed from Fig. 2, the greatest wind shear in the disturbed flow for all stability states occurs between the levels H and 2H and here mainly new turbulence is generated. Below the level H, the shear is quite small for all stability states. That is why it is reasonable to assume that below the fence height the increase of turbulent kinetic energy with increasing distance from the fence is mainly caused by a flux from above. Besides, the turbulence intensity in an unstable atmosphere is larger than in a stable atmosphere, in which the turbulence is strongly suppressed. Since a high turbulence intensity is coupled with better mixing, the increase in turbulence at the lower levels, in all probability, is faster with increasingly unstable stratification. The results of Fig. 8 show these effects remarkably clear.
In the analysis of the effect of the incidence angle on the behaviour of the turbulence, the nondimensionized r.m.s. values have been plotted in Fig. 9 for three
16 Netherlands Journal of Agricultural Science 35 (1987)

FLOW AND TURBULENCE AROUND THIN FENCES
H
Fig. 8. The normalized r.m.s. values of the speed fluctuations for three different thermal stratifications and nearby perpendicular incidence angle (<I> < 2 °). — HIL = -0.09; H/L = -0.002, HiL = 0.07.
Netherlands Journal of Agricultural Science 35 (1987) 17

A. F. G. JACOBS AND L. WARTENA
Fig. 9. The normalized r.m.s. values of the speed fluctuations for various incidence angles under thermally near-neutral conditions (|H/L|<0.01 ).
18 Netherlands Journal of Agricultural Science 35 (1987)

FLOW AND TURBULENCE AROUND THIN FENCES
near-neutral (|H/L |<0.01) runs and with angles of attack of 1 32 0 and 40 °. From this result some features can be observed.
Firstly, the wider the angle of attack with respect to the normal on the fence, the more the reduction of the turbulence. This result is not surprising for the area influenced just adjoining the fence narrows with increasing incidence angle.
Secondly, and a more interesting effect, are shown by the peaks. For example, at the heights H and 0.5H an extreme increase in the wind fluctuations is indicated in the = 32 ° result. The <ï> = 40 ° result, however, shows a faster recovery in the turbulence result at these levels and in addition shows a clear peak in the result of the height z = H/3. Next, if the turbulence results are compared with the deficits of Fig. 4, it can be observed that these peaks more or less coincide with the negative deficits. Or in other words, the peaks in the speed fluctuations coincide with the area where high momentum from above, with an excess high turbulence level, is transported downwardly.
Conclusions
The region around a closed thin fence where the mean wind profile has been disturbed extends to a level of about 5H above the fence and extends to a distance downwind of about 30H. Atmospheric instability enhances the wind profile disturbance; it also leads to a faster recovery of the wind speed profiles.
For agricultural practice this means, that for example plants near the surface are mechanically protected against strong winds within this distance from the fence.
The disturbed wind field above the fence height increases rapidly with increasing height and even exceeds the undisturbed wind field. For practical applications this always infers that the height of the fence must always be taller than the height of the protected crop.
The effect of thermal stratification on the turbulence behaviour is much greater than that on the mean wind. In a thermally stable atmosphere the turbulence near the surface (z = H/3) is strongly suppressed and recovers very slowly without exceeding the undisturbed value. In an unstable atmosphere the turbulence near the surface increases and exceeds the undisturbed value significantly.
Near the surface, especially in cases of bare soil, the stabilization of soil particals is influenced by strong winds as well as by the degree of turbulence. Strong winds mainly occur under thermally near-neutral circumstances. This means that close behind a fence (within a distance of about 10H), the stabilization is increased by the reduction of the mean wind field as well as by the reduction of the turbulence level. Hence, within this distance the stabilization of soil particles is very efficient. Beyond this distance the mean wind field is still reduced while the turbulence level is increased, so both effects are reversed. In practice this infers that in cases of soil stabilization the distance between rows of fences will be limitted to about 10H.
The angle of attack affects the recovery of the mean wind field as well as the behaviour of the speed fluctuations. The wider the incidence angle the faster the mean wind and turbulence level recover. Moreover, the peaks in the speed fluctua
Netherlands Journal of Agricultural Science 35 (1987) 19

A. F. G. JACOBS AND L. WARTENA
tions more or less coincide with the negative deficit area of the wind field near the earth's surface.
For agricultural practice this means that a single fence or a single row of trees only is to be applied in regions with a prevailing wind direction for strong winds. If this is not the case, combinations of fences have to applied in order to obtain the desired reduction.
The results of the disturbed mean wind profiles have been compared with the model results of Counihan et al. (1974). Details about this comparison can be found elsewhere (Jacobs, 1984a).
References
Batchelor, G. K., 1977. An introduction to fluid dynamics. Cambridge University Press, Cambridge, 615 pp.
Benndorf, D., F. Grunert & K. Klingbeil, 1980. Aero-Dynamische Grundlagen für Windschutzplanzungen. Zeitschrift für Meteorologie 30: 369-378.
Bradshaw, P. & F. Y. F. Wong, 1972. The reattachment and relaxation of a turbulent shear flow. Journal of Fluid Mechanics 52: 113-135.
Counihan, J., J. R. C. Hunt & P. S. Jackson, 1974. Wakes behind twodimensional surface obstacles in turbulent boundary layers. Journal of Fluid Mechanics 52: 529-563.
Gandemer, J., 1981. The aerodynamic characteristics of windbreaks, resulting in empirical rules. Journal of Industrial Aerodynamics 7: 15-36.
Jacobs, A. F. G., 1984a. The flow around a thin closed fence. Boundary-Layer Meteorology 28: 317-328.
Jacobs, A. F. G., 1984b. Windreduction near the surface behind a thin solid fence. Journal of Agricutu-ral Meteorology 33: 157-162.
Jacobs, A. F. G., 1985. Turbulence around a thin closed fence. Journal of Agricultural and Forest Meteorology 34: 315-321.
Monin, A. S., & A. M. Yaglom, 1975. Statistical fluid mechanics: Mechanics of turbulence. The MIT Press, 874 pp.
Obukhov, A. M., 1946. Turbulence in thermally inhomogeneous atmosphere. Izvestiya Akademie Nauk SSSR1, 4-5: 453-466.
Ogawa, Y. & P. G. Diosy, 1980. Surface roughness and thermal stratification effects on the flow behind a two-dimensional fence. Atmospheric Environment 14: 1301-1320.
Raine, J. K. & D. C. Stevenson, 1977. Wind protection on a simulated atmospheric boundary layer. Journal of Industrial Aerodynamics 2: 159-180.
Shah, S. R. H., 1962. Studies on wind protection. Institute for biological field research, Kemperberger-weg 11, Arnhem, Netherlands. Report 60/1962.
Smedman, A. & U. Högström, 1973. The mastra micro-meteorological field project. Boundary-Layer Meteorology 5: 529-573.
Wyngaard, J. C., H. Tennekes, J. L. Lumley & D. P. Margolis, 1968. Structure of turbulence in a curved mixing layer. Physics of Fluids 11: 1251-1253.
20 Netherlands Journal of Agricultural Science 35 (1987)