flow-based influence graph visual summarization · flow-based influence graph visual...
TRANSCRIPT

arX
iv:1
408.
2401
v3 [
cs.S
I] 3
0 O
ct 2
014
Flow-based Influence Graph Visual Summarization
Lei ShiSKLCS, Institute of SoftwareChinese Academy of Sciences
Beijing 100190, [email protected]
Hanghang TongComputer Science
City College, CUNYNew York, USA
Jie Tang and Chuang LinComputer Science
Tsinghua UniversityBeijing 100084, China
{jietang, chlin}@tsinghua.edu.cn
Abstract—Visually mining a large influence graph is appealingyet challenging. People are amazed by pictures of newscastinggraph on Twitter, engaged by hidden citation networks in aca-demics, nevertheless often troubled by the unpleasant readabilityof the underlying visualization. Existing summarization methodsenhance the graph visualization with blocked views, but haveadverse effect on the latent influence structure. How can wevisually summarize a large graph to maximize influence flows?In particular, how can we illustrate the impact of an individ ualnode through the summarization? Can we maintain the appealinggraph metaphor while preserving both the overall influencepattern and fine readability?
To answer these questions, we first formally define theinfluence graph summarization problem. Second, we propose anend-to-end framework to solve the new problem. Our methodcan not only highlight the flow-based influence patterns in thevisual summarization, but also inherently support rich graphattributes. Last, we present a theoretic analysis and reportour experiment results. Both evidences demonstrate that ourframework can effectively approximate the proposed influencegraph summarization objective while outperforming previousmethods in a typical scenario of visually mining academic citationnetworks.
I. I NTRODUCTION
Graphs are prevalent and have become a prevalent plat-form for the masses to interact and disseminate a variety ofinformation (e.g., influence, memes, opinions, rumors, etc.).How to make sense of an individual’s influence in the contextof such graphs?This, which is referred as Influence GraphSummarization (IGS) problem, is the central problem we aimto address in this paper. For example, how does a highly-cited paper impact the research community to raise severaltopic threads; and consequentially, how do these topics interactwith each other and lead to a new multi-disciplinary researchdirection? How does a senior researcher contribute to multipleresearch areas by influencing others?
Although closely related, IGS problem bears some subtledifference from the existing work. We briefly review threemost relevant topics. First (influence maximization), in the pastdecades, many elegant algorithms have been proposed for theso-called influence maximization problem [1]. While effectivein identifying who are most influential in the graph, the ques-tion of what makes them influentiallargely remains open. Sec-ond (graph visualization), many elaborate layout algorithmshave been designed and widely applied in recent years. Theycan draw medium-sized graphs aesthetically and faithfully, butcan not avoid the huge visual clutter on large influence graphs.Third (graph summarization), many interesting work has been
done in the context of graph clustering and compression.These works typically look for coherent/homogeneous regionsin graphs by optimizing a pre-defined loss function (e.g.,minimizing the inter-cluster connection, maximizing the intra-cluster density, minimizing the total description cost, etc).Despite their own success, most, if not all, of the existingwork on graph summarization tends to ignore the specificcharacteristics of influence graphs and how the end user wouldvisually perceive/read/consume the summarization results.
To be specific, we outline the following design objectivesthat differentiate our IGS problem from existing works.
• D1. Flow Rate Maximization. Quite different from extract-ing dense clusters on graph, the goal of IGS is to highlightthe flow of influence not only within but also acrossclusters. By maximizing the overall flow rate, IGS-basedsummarization outlines the strongest interaction amonggroups of nodes on a graph. For example, Figure 1 depictsthe influence of the famous power-law paper presentedat SIGCOMM’99. The evolution of research topics isrevealed, rather than the hot topics themselves.• D2. Localized Visualization. While a large graph can span
millions of nodes and prohibit any readable visual sum-marization, in IGS objective, we switch to summarize theinfluence of a single node on the graph (called the sourcenode). This localized visualization problem is at least asimportant as the overall summarization problem. Considera user navigating the citation graph of computer sciencepapers, after an overview of the entire field, likely she willdrill down to a few interested papers and examine theirinfluence separately.• D3. Rich Information. Most influence graphs have rich
attributes (e.g., the topic, venue of a scientific paper) andoften evolve over time (e.g., the publication date). Incor-porating these attributes to enhance the IGS performanceposes additional challenges to our work.
In this paper, we propose a unified framework to generateflow-based, localized visualsummarization over large-scaleinfluence graphs. The framework provides a seamless, end-to-end pipeline to solve the IGS problem by decomposingit into several key building blocks. It is flexible and admitsmany existing graph mining algorithms for each of its buildingblocks. Meanwhile, theoretic analysis shows that our methodis equivalent to the kernel k-mean clustering with a carefullydesigned kernel matrix so that the intra-cluster consistencyis also preserved. Finally, we conduct extensive empiricalevaluations to validate the effectiveness of the framework. Themain contributions of the paper can be summarized as:
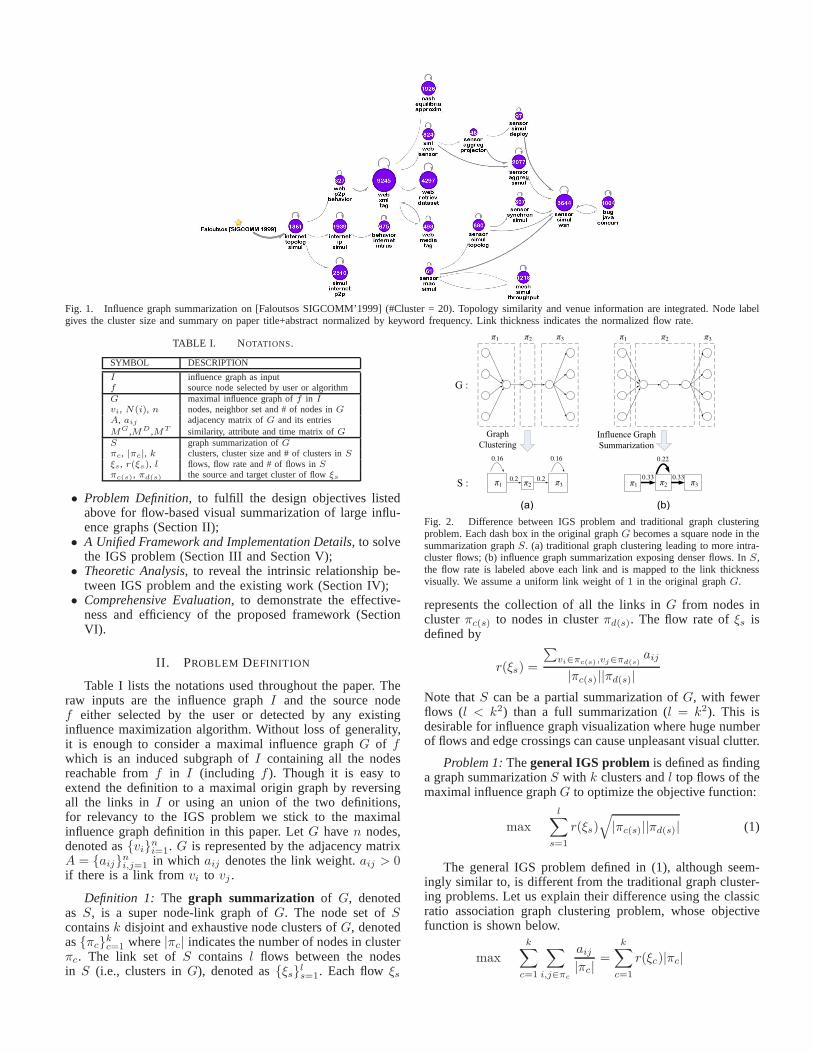
Fig. 1. Influence graph summarization on [Faloutsos SIGCOMM’1999] (#Cluster = 20). Topology similarity and venue information are integrated. Node labelgives the cluster size and summary on paper title+abstract normalized by keyword frequency. Link thickness indicates the normalized flow rate.
TABLE I. N OTATIONS.
SYMBOL DESCRIPTION
I influence graph as inputf source node selected by user or algorithmG maximal influence graph off in Ivi, N(i), n nodes, neighbor set and # of nodes inG
A, aij adjacency matrix ofG and its entriesMG,MD ,MT similarity, attribute and time matrix ofGS graph summarization ofGπc, |πc|, k clusters, cluster size and # of clusters inSξs, r(ξs), l flows, flow rate and # of flows inSπc(s), πd(s) the source and target cluster of flowξs
• Problem Definition, to fulfill the design objectives listedabove for flow-based visual summarization of large influ-ence graphs (Section II);
• A Unified Framework and Implementation Details, to solvethe IGS problem (Section III and Section V);
• Theoretic Analysis, to reveal the intrinsic relationship be-tween IGS problem and the existing work (Section IV);
• Comprehensive Evaluation, to demonstrate the effective-ness and efficiency of the proposed framework (SectionVI).
II. PROBLEM DEFINITION
Table I lists the notations used throughout the paper. Theraw inputs are the influence graphI and the source nodef either selected by the user or detected by any existinginfluence maximization algorithm. Without loss of generality,it is enough to consider a maximal influence graphG of fwhich is an induced subgraph ofI containing all the nodesreachable fromf in I (including f ). Though it is easy toextend the definition to a maximal origin graph by reversingall the links in I or using an union of the two definitions,for relevancy to the IGS problem we stick to the maximalinfluence graph definition in this paper. LetG haven nodes,denoted as{vi}ni=1. G is represented by the adjacency matrixA = {aij}
ni,j=1 in which aij denotes the link weight.aij > 0
if there is a link fromvi to vj .
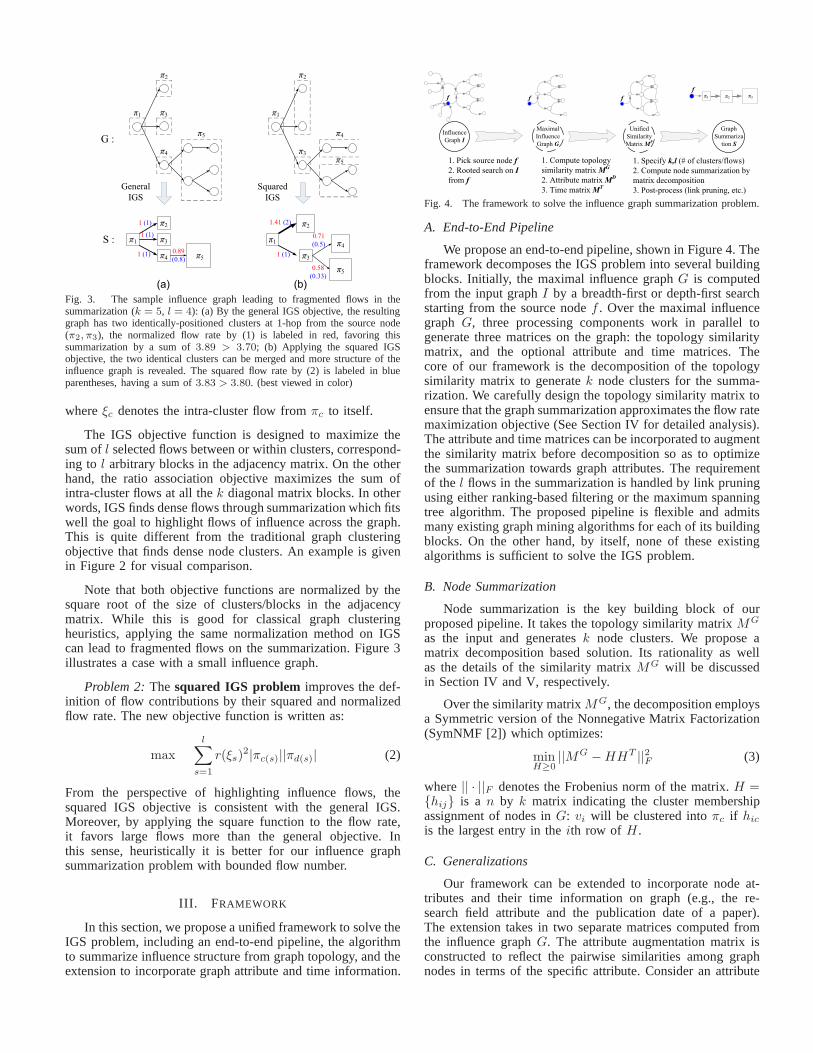
Definition 1: The graph summarization of G, denotedas S, is a super node-link graph ofG. The node set ofScontainsk disjoint and exhaustive node clusters ofG, denotedas{πc}
kc=1 where|πc| indicates the number of nodes in cluster
πc. The link set ofS contains l flows between the nodesin S (i.e., clusters inG), denoted as{ξs}ls=1. Each flowξs
1 32
1 2 3
1 32
1 2 3
0.16
0.2
0.16
0.2 0.33 0.33
0.22
Fig. 2. Difference between IGS problem and traditional graph clusteringproblem. Each dash box in the original graphG becomes a square node in thesummarization graphS. (a) traditional graph clustering leading to more intra-cluster flows; (b) influence graph summarization exposing denser flows. InS,the flow rate is labeled above each link and is mapped to the link thicknessvisually. We assume a uniform link weight of 1 in the originalgraphG.
represents the collection of all the links inG from nodes inclusterπc(s) to nodes in clusterπd(s). The flow rate ofξs isdefined by
r(ξs) =
∑
vi∈πc(s),vj∈πd(s)aij
|πc(s)||πd(s)|
Note thatS can be a partial summarization ofG, with fewerflows (l < k2) than a full summarization (l = k2). This isdesirable for influence graph visualization where huge numberof flows and edge crossings can cause unpleasant visual clutter.
Problem 1:Thegeneral IGS problem is defined as findinga graph summarizationS with k clusters andl top flows of themaximal influence graphG to optimize the objective function:
max
l∑
s=1
r(ξs)√
|πc(s)||πd(s)| (1)
The general IGS problem defined in (1), although seem-ingly similar to, is different from the traditional graph cluster-ing problems. Let us explain their difference using the classicratio association graph clustering problem, whose objectivefunction is shown below.
max
k∑
c=1
∑
i,j∈πc
aij
|πc|=
k∑
c=1
r(ξc)|πc|
5
1
1
1 (1)
3
4
5
4
2
2
31 (1)
1 (1)
1
3
4
2
5
0.89
(0.8)
1
1.41 (2)
3
2
1 (1)
0.71
(0.5) 4
50.58
(0.33)
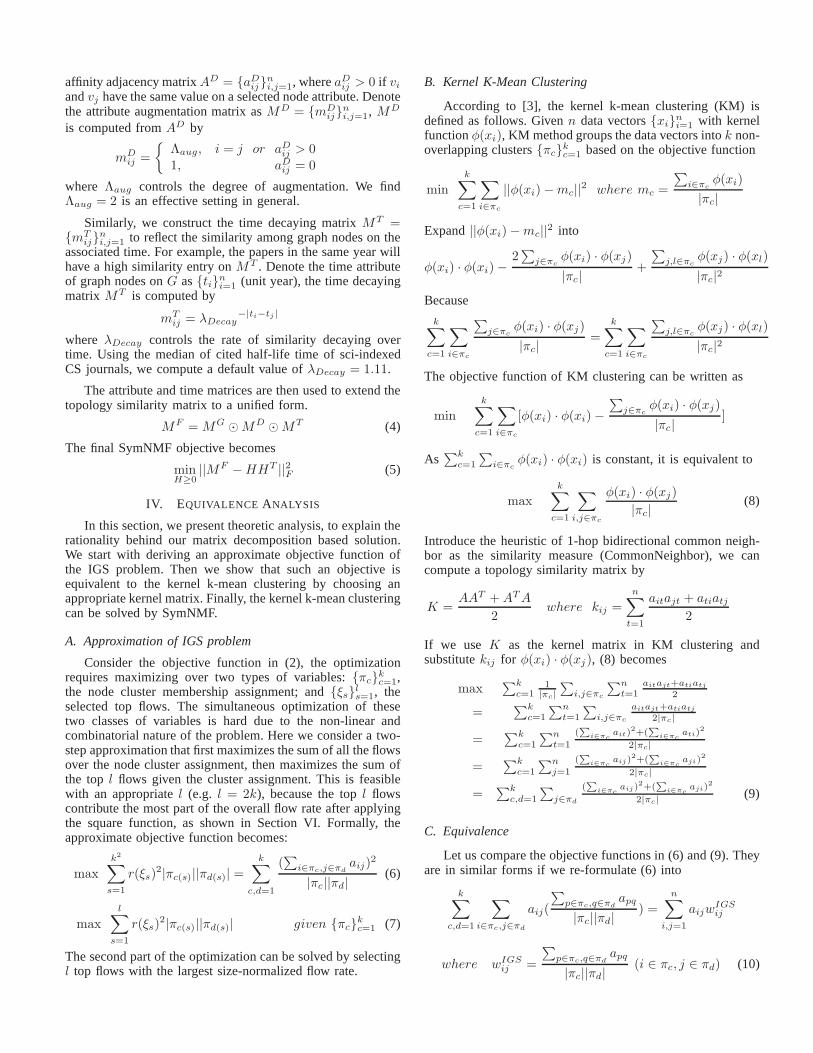
Fig. 3. The sample influence graph leading to fragmented flowsin thesummarization (k = 5, l = 4): (a) By the general IGS objective, the resultinggraph has two identically-positioned clusters at 1-hop from the source node(π2, π3), the normalized flow rate by (1) is labeled in red, favoring thissummarization by a sum of3.89 > 3.70; (b) Applying the squared IGSobjective, the two identical clusters can be merged and morestructure of theinfluence graph is revealed. The squared flow rate by (2) is labeled in blueparentheses, having a sum of3.83 > 3.80. (best viewed in color)
whereξc denotes the intra-cluster flow fromπc to itself.
The IGS objective function is designed to maximize thesum ofl selected flows between or within clusters, correspond-ing to l arbitrary blocks in the adjacency matrix. On the otherhand, the ratio association objective maximizes the sum ofintra-cluster flows at all thek diagonal matrix blocks. In otherwords, IGS finds dense flows through summarization which fitswell the goal to highlight flows of influence across the graph.This is quite different from the traditional graph clusteringobjective that finds dense node clusters. An example is givenin Figure 2 for visual comparison.
Note that both objective functions are normalized by thesquare root of the size of clusters/blocks in the adjacencymatrix. While this is good for classical graph clusteringheuristics, applying the same normalization method on IGScan lead to fragmented flows on the summarization. Figure 3illustrates a case with a small influence graph.
Problem 2:The squared IGS problem improves the def-inition of flow contributions by their squared and normalizedflow rate. The new objective function is written as:
max
l∑
s=1
r(ξs)2|πc(s)||πd(s)| (2)
From the perspective of highlighting influence flows, thesquared IGS objective is consistent with the general IGS.Moreover, by applying the square function to the flow rate,it favors large flows more than the general objective. Inthis sense, heuristically it is better for our influence graphsummarization problem with bounded flow number.
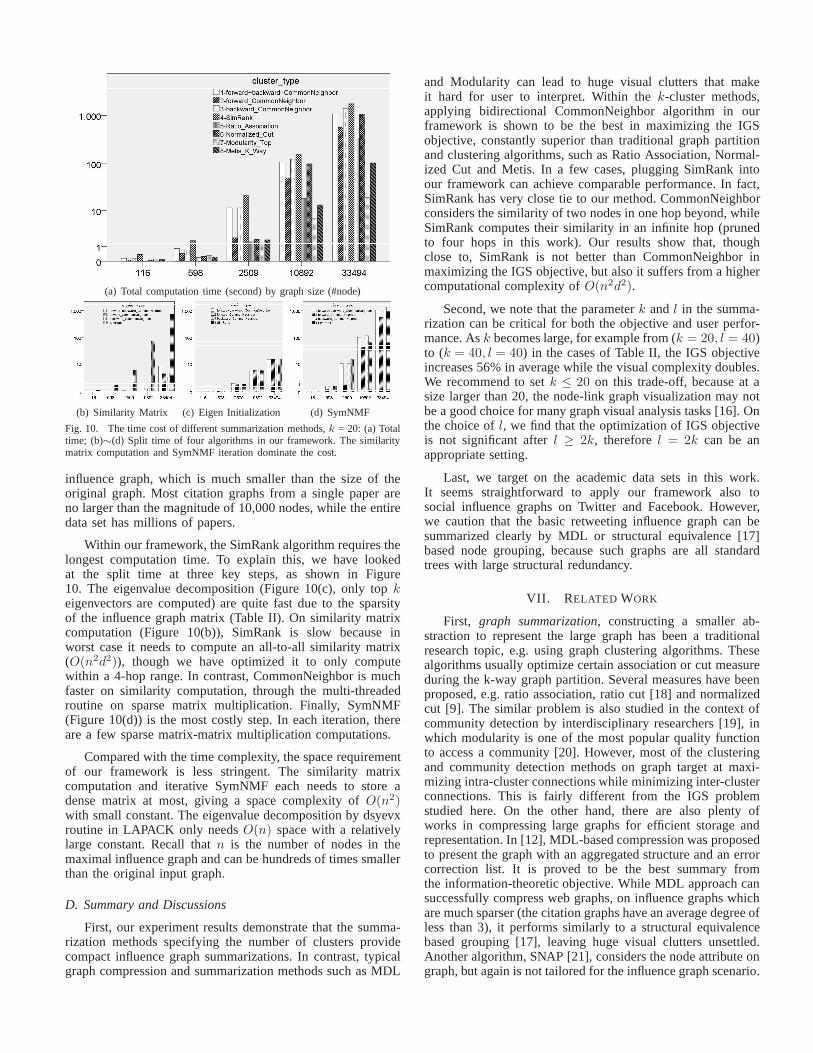
III. F RAMEWORK
In this section, we propose a unified framework to solve theIGS problem, including an end-to-end pipeline, the algorithmto summarize influence structure from graph topology, and theextension to incorporate graph attribute and time information.
1. Pick source node f
2. Rooted search on I
from f
1. Specify k,l (# of clusters/flows)
2. Compute node summarization by
matrix decomposition
3. Post-process (link pruning, etc.)
Influence
Graph I
f
1 2 3
Graph
Summariza
tion S
f
Maximal
Influence
Graph G
f
1. Compute topology
similarity matrix MG
2. Attribute matrix MD
3. Time matrix MT
f
Unified
Similarity
MatrixMF
Fig. 4. The framework to solve the influence graph summarization problem.
A. End-to-End Pipeline
We propose an end-to-end pipeline, shown in Figure 4. Theframework decomposes the IGS problem into several buildingblocks. Initially, the maximal influence graphG is computedfrom the input graphI by a breadth-first or depth-first searchstarting from the source nodef . Over the maximal influencegraph G, three processing components work in parallel togenerate three matrices on the graph: the topology similaritymatrix, and the optional attribute and time matrices. Thecore of our framework is the decomposition of the topologysimilarity matrix to generatek node clusters for the summa-rization. We carefully design the topology similarity matrix toensure that the graph summarization approximates the flow ratemaximization objective (See Section IV for detailed analysis).The attribute and time matrices can be incorporated to augmentthe similarity matrix before decomposition so as to optimizethe summarization towards graph attributes. The requirementof the l flows in the summarization is handled by link pruningusing either ranking-based filtering or the maximum spanningtree algorithm. The proposed pipeline is flexible and admitsmany existing graph mining algorithms for each of its buildingblocks. On the other hand, by itself, none of these existingalgorithms is sufficient to solve the IGS problem.
B. Node Summarization
Node summarization is the key building block of ourproposed pipeline. It takes the topology similarity matrixMG
as the input and generatesk node clusters. We propose amatrix decomposition based solution. Its rationality as wellas the details of the similarity matrixMG will be discussedin Section IV and V, respectively.
Over the similarity matrixMG, the decomposition employsa Symmetric version of the Nonnegative Matrix Factorization(SymNMF [2]) which optimizes:
minH≥0||MG −HHT ||2F (3)
where|| · ||F denotes the Frobenius norm of the matrix.H ={hij} is a n by k matrix indicating the cluster membershipassignment of nodes inG: vi will be clustered intoπc if hic
is the largest entry in theith row of H .
C. Generalizations
Our framework can be extended to incorporate node at-tributes and their time information on graph (e.g., the re-search field attribute and the publication date of a paper).The extension takes in two separate matrices computed fromthe influence graphG. The attribute augmentation matrix isconstructed to reflect the pairwise similarities among graphnodes in terms of the specific attribute. Consider an attribute
affinity adjacency matrixAD = {aDij}ni,j=1, whereaDij > 0 if vi
andvj have the same value on a selected node attribute. Denotethe attribute augmentation matrix asMD = {mD
ij}ni,j=1, MD
is computed fromAD by
mDij =
{
Λaug, i = j or aDij > 01, aDij = 0
where Λaug controls the degree of augmentation. We findΛaug = 2 is an effective setting in general.
Similarly, we construct the time decaying matrixMT ={mT
ij}ni,j=1 to reflect the similarity among graph nodes on the
associated time. For example, the papers in the same year willhave a high similarity entry onMT . Denote the time attributeof graph nodes onG as{ti}ni=1 (unit year), the time decayingmatrix MT is computed by
mTij = λDecay
−|ti−tj |
where λDecay controls the rate of similarity decaying overtime. Using the median of cited half-life time of sci-indexedCS journals, we compute a default value ofλDecay = 1.11.
The attribute and time matrices are then used to extend thetopology similarity matrix to a unified form.
MF = MG ⊙MD ⊙MT (4)
The final SymNMF objective becomes
minH≥0||MF −HHT ||2F (5)
IV. EQUIVALENCE ANALYSIS
In this section, we present theoretic analysis, to explain therationality behind our matrix decomposition based solution.We start with deriving an approximate objective function ofthe IGS problem. Then we show that such an objective isequivalent to the kernel k-mean clustering by choosing anappropriate kernel matrix. Finally, the kernel k-mean clusteringcan be solved by SymNMF.
A. Approximation of IGS problem
Consider the objective function in (2), the optimizationrequires maximizing over two types of variables:{πc}
kc=1,
the node cluster membership assignment; and{ξs}ls=1, theselected top flows. The simultaneous optimization of thesetwo classes of variables is hard due to the non-linear andcombinatorial nature of the problem. Here we consider a two-step approximation that first maximizes the sum of all the flowsover the node cluster assignment, then maximizes the sum ofthe top l flows given the cluster assignment. This is feasiblewith an appropriatel (e.g. l = 2k), because the topl flowscontribute the most part of the overall flow rate after applyingthe square function, as shown in Section VI. Formally, theapproximate objective function becomes:
max
k2∑
s=1
r(ξs)2|πc(s)||πd(s)| =
k∑
c,d=1
(∑
i∈πc,j∈πdaij)
2
|πc||πd|(6)
max
l∑
s=1
r(ξs)2|πc(s)||πd(s)| given {πc}
kc=1 (7)
The second part of the optimization can be solved by selectingl top flows with the largest size-normalized flow rate.
B. Kernel K-Mean Clustering
According to [3], the kernel k-mean clustering (KM) isdefined as follows. Givenn data vectors{xi}
ni=1 with kernel
functionφ(xi), KM method groups the data vectors intok non-overlapping clusters{πc}
kc=1 based on the objective function
mink
∑
c=1
∑
i∈πc
||φ(xi)−mc||2 where mc =
∑
i∈πcφ(xi)
|πc|
Expand||φ(xi)−mc||2 into
φ(xi) · φ(xi)−2∑
j∈πcφ(xi) · φ(xj)
|πc|+
∑
j,l∈πcφ(xj) · φ(xl)
|πc|2
Because
k∑
c=1
∑
i∈πc
∑
j∈πcφ(xi) · φ(xj)
|πc|=
k∑
c=1
∑
i∈πc
∑
j,l∈πcφ(xj) · φ(xl)
|πc|2
The objective function of KM clustering can be written as
mink
∑
c=1
∑
i∈πc
[φ(xi) · φ(xi)−
∑
j∈πcφ(xi) · φ(xj)
|πc|]
As∑k
c=1
∑
i∈πcφ(xi) · φ(xi) is constant, it is equivalent to
maxk
∑
c=1
∑
i,j∈πc
φ(xi) · φ(xj)
|πc|(8)
Introduce the heuristic of 1-hop bidirectional common neigh-bor as the similarity measure (CommonNeighbor), we cancompute a topology similarity matrix by
K =AAT +ATA
2where kij =
n∑
t=1
aitajt + atiatj
2
If we use K as the kernel matrix in KM clustering andsubstitutekij for φ(xi) · φ(xj), (8) becomes
max∑k
c=11
|πc|
∑
i,j∈πc
∑n
t=1aitajt+atiatj
2
=∑k
c=1
∑n
t=1
∑
i,j∈πc
aitajt+atiatj
2|πc|
=∑k
c=1
∑n
t=1
(∑
i∈πcait)
2+(∑
i∈πcati)
2
2|πc|
=∑k
c=1
∑n
j=1
(∑
i∈πcaij)
2+(∑
i∈πcaji)
2
2|πc|
=∑k
c,d=1
∑
j∈πd
(∑
i∈πcaij)
2+(∑
i∈πcaji)
2
2|πc|(9)
C. Equivalence
Let us compare the objective functions in (6) and (9). Theyare in similar forms if we re-formulate (6) into
k∑
c,d=1
∑
i∈πc,j∈πd
aij(
∑
p∈πc,q∈πdapq
|πc||πd|) =
n∑
i,j=1
aijwIGSij
where wIGSij =
∑
p∈πc,q∈πdapq
|πc||πd|(i ∈ πc, j ∈ πd) (10)

nj
d
nj
i
n
aij
d
caiji
n
c
Fig. 5. The weighting schema comparison in two objective functions: (a)influence graph summarization using the entire block; (b) kernel k-mean usingthe block’s column and row.
and re-formulate (9) into
k∑
c,d=1
1
2|πc|[∑
j∈πd
∑
i∈πc
aij(∑
p∈πc
apj) +∑
j∈πd
∑
i∈πc
aji(∑
q∈πc
ajq)]
=
n∑
i,j=1
aijwKMij
where wKMij =
∑
p∈πcapj
2|πc|+
∑
q∈πdaiq
2|πd|(i ∈ πc, j ∈ πd)
(11)Thus, both IGS and KM aim to maximize the weighted sumof graph adjacency matrix entries. In IGS, the weight ofeach entry is defined by the density of the belonging matrixblock (or flow). In KM, the weight is defined by the averagedensity of the column and row of the belonging matrix block.This is illustrated in Figure 5. Note that the heuristic ofthe CommonNeighbor based k-mean clustering is to put thegraph nodes with similar in- and out-neighborhoods together.The resulting matrix blocks after the clustering tend to haveuniform density distributions inside each block. Therefore,the density of the cross shape area in Figure 5(b) is a goodapproximation of the density of the shaded block area in Figure5(a), which explains the rationality of using kernel k-meanclustering to the general IGS problem.
Furthermore, it is known that the kernel k-mean clusteringproblem is equivalent to the trace maximization problem:
maxHT H=I,H≥0
Tr(HTKH)
where the kernel matrixK equals the topology similaritymatrix MG computed by CommonNeighbor. The trace max-imization problem can then be solved by SymNMF underspectral relaxations [2].
V. I MPLEMENTATION DETAILS
In this section, we provide some additional implementationdetails. As shown in Figure 4, our framework involves fourkinds of algorithm-driven building blocks. The rooted graphsearch follows the standard BFS/DFS implementation. Belowwe describe details for similarity matrix computation, nodesummarization and the link pruning for post-processing of thesummarization.
Similarity Matrix Computation . In Section IV, we haveshown that using the heuristic of common neighbors to con-struct the similarity matrix (CommonNeighbor) can approx-imate the objective function of the squared IGS problem.
Algorithm 1: Link Pruning Algorithm.
Input : Initial summarizationS0 ∼ {V,E}, # of flowsl, V = {πi}
ki=1, E = {ξs}
k2
s=1, flow rater(ξs)Output : Final summarizationSRankFilter(S0):begin
S ← S0;for s← 1 to k2 do // rate normalization
r(ξs)← r(ξs)√
|πc||πd|, ξs ∼ (πc, πd);
sortE by r(E) in decreasing order;for s← l + 1 to k2 do // pruning
removeE(s) from S;
for i← 1 to k do // link recovery
Ei ← subset ofE havingπi as destination;sortEi by r(Ei) in decreasing order;if Ei(0) 6∈ S then
addEi(0) to S;
This algorithm runs fast even for very large graphs due toa complexity ofO(md2) wherem is the number of links inGandd is the average node degree. We have implemented threeversions of the algorithm and it is shown that bidirectionalCommonNeighbor is generally better than one-directional for-ward or backward CommonNeighbor.
Node Summarization with SymNMF. The node summa-rization is done by applying SymNMF on similarity matrixMG(MF ), and using the factorized matrixH for clustermembership assignment. In our implementation, we applythe iterative SymNMF solver with the multiplicative updatingrule in [2] which guarantees convergence. In this iterativealgorithm, the initialization ofH is critical to the final result.We introduce nonnegative eigenvalue decomposition similar tothe method in [4] to compute a good initial factorization.
Link Pruning. The graph summarization by SymNMFneeds further post-processing to selectl top flows for thefinal summarizationS. According to (7), the top flows can beextracted after ranking by the normalized flow rate. The otherflows are then filtered out. This is illustrated in Algorithm1. Notice that in the link recovery section of the algorithm,we introduce a constraint to keep a connected graph in thesummarization. It is achieved by adding back the most denseflow going to each node cluster. An alternative choice is to usethe maximum spanning tree (MST) algorithm [5].
We implement the proposed framework and algorithms inJava, which provides excellent UI library for visualization. Themain computation routines are built on ParallelColt package [6]to optimize for multi-threading and sparse matrix operations.The speed of some core matrix decompositions (e.g., Eigen-value) are further improved by invoking ARPACK (for sparsematrix) and LAPACK (for dense matrix) implementation [7]through JNI invocations.
VI. EVALUATION
In this section, we evaluate the proposed IGS frame-work and the CommonNeighbor algorithms by comparing

(a) k = 10, l = 10 (b) k = 10, l = 20
(c) k = 20, l = 20 (d) k = 40, l = 40
Fig. 6. The performance in maximizing the IGS objective on five sample graphs. The flow rate is summed from the topl flows between all thek clusters.
with alternative graph summarization methods. Nine ap-proaches are considered: three usingCommonNeighboralgo-rithms to compute the similarity matrix for SymNMF (i.e.forward+backward, forward, and backward settings), one usingSimRankalgorithm [8] to compute the similarity matrix forSymNMF, the classical graph clustering algorithm withRatioAssociationandNormalized Cutobjectives [9], agglomerativeModularity-based graph clustering [10],Metis K-way graphpartition [11] and the Minimal Description Length (MDL)based graph summarization [12]. Note that Ratio Associationand Normalized Cut are implemented using their equivalentsimilarity matrix computation for SymNMF [13]. Metis parti-tion is implemented by official open source software package[14]. Modularity clustering is executed agglomeratively untilall clusters stop merging at the top level or the numberof clusters reachesk. For MDL, we implement the greedyalgorithm in [12]. The MDL algorithm can not specify thenumber of clusters, in fact, it generates 4,937 clusters on onemedium-sized influence graph. To ensure fair comparison (alarger number of clusters will lead to a much higher overallflow rate), we exclude MDL from numeric comparisons, butpresent its visual summarization results.
All the experiments are conducted on the same Linuxserver with two 8-core 2.9GHz Intel Xeon E5-2690 CPU and384GB of memory. All the LAPACK and ARPACK libs arecompiled locally to provide machine-optimized performance.Note that the modularity and Metis implementations are usingnative-version software package, not guaranteed to be opti-mized for multi-threading. The raw experiment data are papercitation graphs collected from ArnetMiner [15]. The influencegraphs are obtained by reversing the citation links.
TABLE II. C ITATION GRAPHS USED IN THE EXPERIMENT.
Source paper title Venue/Year Node Link
Analysis of a hybrid cutoff pri-ority scheme ...
Wireless Net-works 1998
116 148
Manifold-ranking based imageretrieval
ACM Multi-media 2004
598 895
Stochastic High-Level PetriNets and Applications
IEEE TC1988
2509 5256
Mining Frequent Patterns with-out Candidate Generation
SIGMOD2000
10892 22301
On Power-law Relationships ofthe Internet Topology
SIGCOMM1999
33494 86398
A. Flow Rate Maximization
We first pick five source papers from the data set togenerate maximal influence graphs, as listed in Table II. Theseinfluence graphs are summarized intok clusters, betweenwhich the topl flow rates are summed according to the squaredIGS objective in (2). Figure 6(a)∼(d) present the comparisonsamong eight summarization methods on the numeric objectivefunction.
The initial result in Figure 6(a) with a minimal graphsummarization (k = 10, l = 10) suggests that among threeCommonNeighbor algorithms, the bidirectional setting almostalways achieves the best performance in maximizing the IGSobjective (at least> 100% gain1), except on the largest graph(#Node=33,494), the backward CommonNeighbor obtains atiny advantage (1%). Further, comparing the bidirectionalCommonNeighbor to traditional graph summarization meth-ods, CommonNeighbor achieves much better performance than
1Percentage of performance gain (drop) bynew number−original number
original number× 100%, the same below.

k=24.8
k=45.1
k=58.4
k=65
Fig. 7. The squared IGS performance of 250 citation graphs with the number of nodes ranging from 100 to 10000. The cluster number is set tok = 20.
Ratio Association, Normalized Cut and Metis (at least> 20%,in average> 100%). In some cases, the performance ofCommonNeighbor is matched by SimRank (< 10% gain) oroutperformed by Modularity.
When we double the number of flows (k = 10, l = 20)in Figure 6(b), the sum of flow rates does not increasemuch on all algorithms (in average< 15%) and the overallcomparative patterns stay unchanged. This shows that thetop k flows already capture most of the flow rates on thegraph summarization. We then increase the number of clusters(k = 20, l = 20; k = 40, l = 40). The results in Figure6(c)(d) reveal that the objection function increases much asthe number of clusters increases (at least> 30%, in average> 90%, comparing Figure 6(c) with Figure 6(b)), except forModularity, which remains unchanged because their number ofclusters are already larger thank and kept stable. For example,the sample graph with 33,494 nodes stops at 71 clusters in thetop modularity level. On the comparative pattern, bidirectionalCommonNeighbor regains performance advantage over Sim-Rank and Modularity under a large number of clusters.
During the experiment, we have executed each algorithmcase three times and report their average performance. How-ever, the results in Figure 6 still show some randomnessdue to the nature of iterative NMF solver. To obtain moreaccurate result, we carefully sample 250 well-cited sourcepapers published in KDD and ICDM from the ArnetMinerdata set. The size of their maximal influence graphs arewithin the range of 100∼10,000 nodes. On each graph, similarexperiments are conducted as above given a setting ofk = 20.Finally in Figure 7, 250 graphs are categorized into 8 binsaccording to their size. The average performance in each binare reported for comparison. Results on the larger data setdemonstrate the same pattern with the five sample graphs.Bidirectional CommonNeighbor in most cases are the best,except for Modularity, which becomes better as the number ofnodes increases beyond 5,000. As mentioned, this is becausethe Modularity algorithm generates more clusters than theinitial setting of k = 20. As indicated by the labels abovethe Modularity performance (blue line), the number of clustersincreases from 24.8 in the first category to 65 among the largestgraphs. Increasing the number of flows for CommonNeighbordoes not optimize the objective function much.
B. Visualization
We evaluate the effectiveness of summarization methodsalso by comparing their visualization results: whether theyproduce a clean influence graph summarization with littlevisual clutter and whether the results are meaningful for userswith domain knowledge. We first pick the famous frequentpattern mining paper by Prof. Jiawei Han et al. as the sourceto generate the maximal influence graph. Then we executeseven typical summarization methods and depict their results inFigure 8(a)∼(g). At the first glance, the proposed bidirectionalCommonNeighor method generates a connected tree-like influ-ence graph summarization without edge crossing (Figure 8(a)).Compared to that, SimRank gets a similar visual form (Figure8(b)) due to the comparable objective function result, but thegenerated graph is not connected. The Metis result is also clean(Figure 8(f)), but all the clusters have a similar number ofnodes, making the summarized graph impractical for usage.Ratio Association and Normalized Cut look inferior due to thepoor graph connectivity (Figure 8(c)) and the flat influencehierarchy (Figure 8(d)). Modularity and MDL are the worstbecause of the visual clutter generated from the large numberof clusters remained in the summarization (Figure 8(e)(g)).
Taking a closer look at the visual summarizations, we findthat by CommonNeighbor, most flows represent at least 300citation links. While by SimRank, the critical flows linkingthe source node are fragmented, two of which only include 52and 83 citations. The same deficiency is found in the resultby Metis, where two highlighted flows only have 11 and 12citations. We also invite a senior researcher from the databaseand data mining community to evaluate the summarizationresult. With our interactive tool, she can switch between thetitle+abstract summary and the research field summary. Shecan also access paper details in each node cluster with a sortedlist by citation count. She mainly compares the visual summa-rization by CommonNeighbor and SimRank. In this case, sheprefers the result by CommonNeighbor in Figure 8(a) becausethe influence evolutions make more sense: the initial paperquickly raises much attention on pattern mining research suchas itemset and association rule mining, then the thread splitsinto four streams on general data management research (suchas web and uncertainty skyline analysis), trajectory analysis,subgraph analysis and application in software engineering(e.g.bug analysis). The thread of web data analysis gradually movesto web retrieval and finally leads to tag analysis and anomalybehavior detection. Compared with CommonNeighbor, Sim-

(a) CommonNeighbor (proposed) (b) SimRank (c) Ratio Association
(d) Normalized Cut (e) Modularity (f) Metis K-way (g) MDL
Fig. 8. Influence graph summarization results on [Han SIGMOD’2000] by different methods (k = 10, l = 20). Node label gives the number of papers in eachcluster and their content summary by either title+abstractkeywords in (a),(b) or the top 3 research fields in (c)∼(f). Link thickness indicates the normalizedflow rate. Some part of the graph is highlighted to show the number of citations as edge labels. Note that the modularity algorithm stops at 62 clusters and cannot merge any further. MDL produces 4,937 clusters, leavinga half of the visual complexity from the input graph.
Rank creates some false links, e.g. the direct flow from thefrequent pattern mining paper to uncertainty data analysis.
Furthermore, we ask our invited users to study the in-fluence of the well-known Internet power-law paper in SIG-COMM’1999. The maximal influence graph is summarizedby the bidirectional CommonNeighbor algorithm into Figure1 (in the second page). Note that in this case the influencegraph topology is augmented by the “venue” field of eachpaper to group the papers with similar research topic together.From the visual summarization, she learns that the SIGCOMMpaper directly influences the research on Internet topologyand simulation. Next, over the Internet topology topics, theP2P research becomes popular and after that the web-relatedresearch and XML. The most recent hot topic in this threadappears to be sensor network which corresponds well to hisdomain knowledge.
Our framework can also visualize one author’s influenceby summarizing the author influence graph. This graph isgenerated by adding one influence link between two authorsfor each citation between their papers. The maximal authorinfluence graph is then computed from a source author bytraversing the influence graph. As an example, we select Prof.Jiawei Han as the source author, and collect the influencedauthors within 2 hops. To limit the size of the influence graph,we only keep productive authors (i.e.≥ 30 paper publications)which gives a graph of 26,349 author nodes. The summariza-tion result applying bidirectional CommonNeighbor algorithm(k = 10) is shown in Figure 9. Our invited user acknowledgesthe validity of the result: Prof. Han has influenced multiplefields with his research, mainly data mining (DM), database(DB), AI and networking (Net). On his contribution to DB andDM fields, the influence is bidirectional, i.e. he is also heavilyinfluenced by the researchers there, as indicated by the groupof 109 authors in the picture (e.g. Raghu Ramakrishnan). The
Fig. 9. The summarization of Prof. Jiawei Han’s influence graph bybidirectional CommonNeighbor (k = 10).
most directly influenced field by the number of authors are AIand DM, as indicated by the group of 6,575 authors. The mostindirectly influenced field are Net and DM, as indicated by thegroup of 11,013 authors. Through the bridging of a group of21 authors (e.g. Rakesh Agrawal), he also impacts the Theory(The) research, represented by the group of 2,774 authors.
C. Scalability
The overall computation time for different summarizationmethods is illustrated in Figure 10(a). Our proposed algorithmsare more costly than efficient modularity clustering algorithm(O(nlog(n)) with small constant) and Metis k-way graphpartition (O(n +m)). However, the best of our methods cansummarize a 10,000-node maximal influence graph in 100seconds, and the overall time complexity is only slightly abovelinear. Note thatn here denotes the size of the maximal
(a) Total computation time (second) by graph size (#node)
(b) Similarity Matrix (c) Eigen Initialization (d) SymNMF
Fig. 10. The time cost of different summarization methods,k = 20: (a) Totaltime; (b)∼(d) Split time of four algorithms in our framework. The similaritymatrix computation and SymNMF iteration dominate the cost.
influence graph, which is much smaller than the size of theoriginal graph. Most citation graphs from a single paper areno larger than the magnitude of 10,000 nodes, while the entiredata set has millions of papers.
Within our framework, the SimRank algorithm requires thelongest computation time. To explain this, we have lookedat the split time at three key steps, as shown in Figure10. The eigenvalue decomposition (Figure 10(c), only topkeigenvectors are computed) are quite fast due to the sparsityof the influence graph matrix (Table II). On similarity matrixcomputation (Figure 10(b)), SimRank is slow because inworst case it needs to compute an all-to-all similarity matrix(O(n2d2)), though we have optimized it to only computewithin a 4-hop range. In contrast, CommonNeighbor is muchfaster on similarity computation, through the multi-threadedroutine on sparse matrix multiplication. Finally, SymNMF(Figure 10(d)) is the most costly step. In each iteration, thereare a few sparse matrix-matrix multiplication computations.
Compared with the time complexity, the space requirementof our framework is less stringent. The similarity matrixcomputation and iterative SymNMF each needs to store adense matrix at most, giving a space complexity ofO(n2)with small constant. The eigenvalue decomposition by dsyevxroutine in LAPACK only needsO(n) space with a relativelylarge constant. Recall thatn is the number of nodes in themaximal influence graph and can be hundreds of times smallerthan the original input graph.
D. Summary and Discussions
First, our experiment results demonstrate that the summa-rization methods specifying the number of clusters providecompact influence graph summarizations. In contrast, typicalgraph compression and summarization methods such as MDL
and Modularity can lead to huge visual clutters that makeit hard for user to interpret. Within thek-cluster methods,applying bidirectional CommonNeighbor algorithm in ourframework is shown to be the best in maximizing the IGSobjective, constantly superior than traditional graph partitionand clustering algorithms, such as Ratio Association, Normal-ized Cut and Metis. In a few cases, plugging SimRank intoour framework can achieve comparable performance. In fact,SimRank has very close tie to our method. CommonNeighborconsiders the similarity of two nodes in one hop beyond, whileSimRank computes their similarity in an infinite hop (prunedto four hops in this work). Our results show that, thoughclose to, SimRank is not better than CommonNeighbor inmaximizing the IGS objective, but also it suffers from a highercomputational complexity ofO(n2d2).
Second, we note that the parameterk andl in the summa-rization can be critical for both the objective and user perfor-mance. Ask becomes large, for example from (k = 20, l = 40)to (k = 40, l = 40) in the cases of Table II, the IGS objectiveincreases 56% in average while the visual complexity doubles.We recommend to setk ≤ 20 on this trade-off, because at asize larger than 20, the node-link graph visualization may notbe a good choice for many graph visual analysis tasks [16]. Onthe choice ofl, we find that the optimization of IGS objectiveis not significant afterl ≥ 2k, thereforel = 2k can be anappropriate setting.
Last, we target on the academic data sets in this work.It seems straightforward to apply our framework also tosocial influence graphs on Twitter and Facebook. However,we caution that the basic retweeting influence graph can besummarized clearly by MDL or structural equivalence [17]based node grouping, because such graphs are all standardtrees with large structural redundancy.
VII. R ELATED WORK
First, graph summarization, constructing a smaller ab-straction to represent the large graph has been a traditionalresearch topic, e.g. using graph clustering algorithms. Thesealgorithms usually optimize certain association or cut measureduring the k-way graph partition. Several measures have beenproposed, e.g. ratio association, ratio cut [18] and normalizedcut [9]. The similar problem is also studied in the context ofcommunity detection by interdisciplinary researchers [19], inwhich modularity is one of the most popular quality functionto access a community [20]. However, most of the clusteringand community detection methods on graph target at maxi-mizing intra-cluster connections while minimizing inter-clusterconnections. This is fairly different from the IGS problemstudied here. On the other hand, there are also plenty ofworks in compressing large graphs for efficient storage andrepresentation. In [12], MDL-based compression was proposedto present the graph with an aggregated structure and an errorcorrection list. It is proved to be the best summary fromthe information-theoretic objective. While MDL approach cansuccessfully compress web graphs, on influence graphs whichare much sparser (the citation graphs have an average degreeofless than 3), it performs similarly to a structural equivalencebased grouping [17], leaving huge visual clutters unsettled.Another algorithm, SNAP [21], considers the node attributeongraph, but again is not tailored for the influence graph scenario.
Second, visualization, over the past few decades, themethodology to draw node-link graphs has reached its ma-turity. On graphs with less than a few hundred nodes, theplanar graph drawing approach [22] and the force-directedalgorithm [23] can produce visually pleasant graph layoutsin real time, mainly by minimizing edge crossings. On largegraphs with a thousand or more nodes, the force-based al-gorithms can be extended by multilevel coarsening and fastforce approximation [24] and still generate a layout in reason-able time (e.g. less than a minute for million-node graphs).However, on real-world large graphs with small-world nature,including the influence graph discussed here, the resultinggraph layout still has numerous edge crossings. This leads tooverwhelming visual clutters detrimental to visual data miningtasks. Meanwhile, Shahaf et al. [25][26][27] studied the similarproblem of summarizing large amount of information into user-friendly visual maps. They developed intriguing methods todetect hidden linkage and document clusters from the keywordfrequency statistics. On a quite different focus, our method isbuilt on the graph with explicit linkage data while the textualcontent of each node can be absent or incomplete.
Third, considerable work has been conducted for studyingthe effects ofsocial influence. For example, Bakshy et al. [28]conducted randomized controlled trials to identify the effect ofsocial influence on consumer responses to advertising. Bondet al. [29] used a randomized controlled trial to verify thesocial influence on political voting behavior. Tang et al. [30]presented a Topical Affinity Propagation (TAP) approach toquantify the topic-level social influence in large networks.Kempe et al. [1] proposed to use a submodular function toformalize the influence maximization problem and develop agreedy algorithm to solve the problem with provable approxi-mation guarantee. Most of these works focus on the existenceof social influence or the nature of the information diffusionprocess and do not consider the summarization problem.Recently, Mehmood et al. proposed CSI [31], a model thatgeneralizes the classical Independent Cascade model to thecommunity level, built from the cascade-based communitydetection method [32]. CSI can produce similar visual formsto our result. However, the CSI model is computed fromthe probabilistic social influence graph and the informationpropagation log more engaged to the social influence scenario.In comparison, our method is more focused on the visualsummarization of large influence graphs in the objective ofmaximizing flows. We do not leverage the information propa-gation model and the associated log data in such scenarios.
VIII. C ONCLUSIONS
In this paper, we propose the influence graph summa-rization problem, study its linkage to the existing clusteringmethods, and present a unified framework to solve it. Theframework achieves all the three design objectives, including(1) flow rate maximization that highlights the evolution ofinfluence; (2) a localized visualization from the source node;and (3) easy to incorporate rich information on graph such asnode attribute and time. The framework is comprehensive andflexible. We provide both the SymNMF based solution andimplementation details. Through comprehensive evaluationswith real-world academic citation graphs, we demonstratethat our framework constantly outperforms classical methods,
such as graph clustering and compression algorithms, in bothquantitative performance and qualitative visual effects.
REFERENCES
[1] D. Kempe, J. Kleinberg, and E. Tardos, “Maximizing the spread ofinfluence through a social network,” inKDD, 2003, pp. 137–146.
[2] C. Ding, X. He, and H. D. Simon, “On the equivalence of nonnegativematrix factorization and spectral clustering,” inSDM, 2005.
[3] H. Zha, X. He, C. Ding, H. Simon, and M. Gu, “Spectral relaxation fork-means clustering,” inNIPS, 2001, pp. 1057–1064.
[4] C. Boutsidis and E. Gallopoulos, “SVD based initialization: A headstart for nonnegative matrix factorization,”Pattern Recognition, 2007.
[5] J. B. Kruskal, “On the shortest spanning subtree of a graph and the trav-eling salesman problem,”Proceedings of the American MathematicalSociety, vol. 7, no. 1, pp. 48–50.
[6] “Parallelcolt,” https://github.com/Danimoth/Parallel-Colt.
[7] “Intel math kernel library,” http://software.intel.com/en-us/intel-mkl/.
[8] G. Jeh and J. Widom, “Simrank: A measure of structural-contextsimilarity,” in KDD, 2002, pp. 538–543.
[9] J. Shi and J. Malik, “Normalized cuts and image segmentation,” IEEETransactions on Pattern Analysis and Machine Intelligence, vol. 22, pp.888–905, 1997.
[10] M. E. J. Newman, “Fast algorithm for detecting community structurein networks,”Physical Review E, vol. 69, no. 6, p. 066133, 2004.
[11] G. Karypis, V. Kumar, and V. Kumar, “Multilevel k-way partitioningscheme for irregular graphs,”Journal of Parallel and DistributedComputing, vol. 48, pp. 96–129, 1998.
[12] S. Navlakha, R. Rastogi, and N. Shrivastava, “Graph summarizationwith bounded error,” inSIGMOD. ACM, 2008, pp. 419–432.
[13] D. Kuang, H. Park, and C. Ding, “Symmetric nonnegative matrixfactorization for graph clustering,” inSDM, 2012, pp. 106–117.
[14] “Metis - serial graph partitioning and fill-reducing matrix ordering,”http://glaros.dtc.umn.edu/gkhome/metis/metis/overview/.
[15] J. Tang, J. Zhang, L. Yao, J. Li, L. Zhang, and Z. Su, “Arnetminer:extraction and mining of academic social networks,” inKDD, 2008,pp. 990–998.
[16] M. Ghoniem, J.-D. Fekete, and P. Castagliola, “A comparison of thereadability of graphs using node-link and matrix-based representations,”in InfoVis, 2004, pp. 17–24.
[17] F. Lorrain and H. C. White, “Structural equivalence of individuals insocial networks,”The Journal of Mathematical Sociology, vol. 1, no. 1,pp. 49–80, 1971.
[18] P. K. Chan, M. D. F. Schlag, and J. Y. Zien, “Spectral k-way ratio-cutpartitioning and clustering,”IEEE Trans. on CAD of Integrated Circuitsand Systems, vol. 13, no. 9, pp. 1088–1096, 1994.
[19] S. Fortunato, “Community detection in graphs,”Physics Reports, vol.486, no. 3-5, pp. 75–174, 2010.
[20] M. E. J. Newman and M. Girvan, “Finding and evaluating communitystructure in networks,”Physical Review E, vol. 69, p. 026113, 2004.
[21] Y. Tian, R. A. Hankins, and J. M. Patel, “Efficient aggregation for graphsummarization.” inSIGMOD, 2008, pp. 567–580.
[22] G. D. Battista, P. Eades, R. Tamassia, and I. G. Tollis,Graph Drawing:Algorithms for the Visualization of Graphs. Prentice Hall PTR, 1998.
[23] T. Kamada and S. Kawai, “An algorithm for drawing general undirectedgraphs,”Information Processing Letters, vol. 31, no. 1, pp. 7–15, 1989.
[24] Y. Hu, “Efficient and high quality force-directed graphdrawing,”Mathematica Journal, vol. 10, no. 1, pp. 37–71, 2005.
[25] D. Shahaf, J. Yang, C. Suen, J. Jacobs, H. Wang, and J. Leskovec,“Information cartography: creating zoomable, large-scale maps of in-formation,” in KDD, 2013, pp. 1097–1105.
[26] D. Shahaf, C. Guestrin, and E. Horvitz, “Trains of thought: Generatinginformation maps,” inWWW, 2012, pp. 899–908.
[27] D. Shahaf and C. Guestrin, “Connecting the dots betweennews articles,”in KDD, 2010, pp. 623–632.
[28] E. Bakshy, D. Eckles, R. Yan, and I. Rosenn, “Social influence in socialadvertising: evidence from field experiments,” inEC, 2012, pp. 146–161.

[29] R. M. Bond, C. J. Fariss, J. J. Jones, A. D. I. Kramer, C. Marlow, J. E.Settle, and J. H. Fowler, “A 61-million-person experiment in socialinfluence and political mobilization,”Nature, vol. 489, pp. 295–298,2012.
[30] J. Tang, J. Sun, C. Wang, and Z. Yang, “Social influence analysis inlarge-scale networks,” inKDD, 2009, pp. 807–816.
[31] Y. Mehmood, N. Barbieri, F. Bonchi, and A. Ukkonen, “Csi:Community-level social influence analysis,” inECML/PKDD, 2013, pp.48–63.
[32] N. Barbieri, F. Bonchi, and G. Manco, “Cascade-based communitydetection,” inWSDM, 2013, pp. 33–42.