flow-control-induced vibrations using pulsed dbd...
TRANSCRIPT
American Institute of Aeronautics and Astronautics
Flow-Control-Induced Vibrations using Pulsed
DBD Plasma Actuators
David Greenblatt,1 Alexander Treizer,
2 Alexander Eidelman
2 and Hanns Mueller-Vahl
2
Technion - Israel Institute of Technology, Technion City - Haifa 3200, Israel
This paper describes flow-control-induced vibrations using pulsed dielectric barrier
discharge (DBD) plasma actuators, in which boundary layer separation on a structure is
actively controlled to produce periodic loads that lead to its vibration. The concept is
intended for energy generation and is demonstrated experimentally using a one-degree-of-
freedom pivoted cylindrical body, mounted vertically within a blow-down wind tunnel.
Subcritical Reynolds numbers, less than 105, were considered where typical shedding
frequencies were several times larger than the system natural frequency. Static deflection
experiments were performed to determine the maximum imposed aerodynamic loads as a
function of control parameters and these were complimented with flow-field measurements.
Periodic loading of the cylinder was achieved by periodic modulation of the actuator. Large
amplitude oscillations were observed when the modulation frequency was close to the system
natural frequency. In contrast to natural vortex induced vibration, the large amplitude
oscillations were achieved by alternating dynamic separation and attachment of the
boundary layer. Estimation of the transient loads was performed using a system
identification technique and the power generated by the system was estimated on the basis of
a piecewise linear model. Peak estimated power coefficients were relatively small (0.042) but
the system is amenable to up-scaling because the power coefficient increases with the square-
root of the system dimensions.
Nomenclature
c absolute velocity, (u2+v
2)1/2
C linear damping due to external load
CD cylinder drag coefficient, 212/
DF U dh� �
CL lateral-force coefficient, 212/
LF U dh� �
C� momentum coefficient, 212/
BF U dh� �
d cylinder diameter
DC duty cycle
f body’s oscillation frequency
fex structural excitation frequency, 1/Tex
fion plasma ionization frequency
fn pendulum natural frequency
fp plasma pulsing frequency, 1/Tp
fv natural vortex shedding frequency
FB plasma body force
FL cylinder lateral-force
FD cylinder drag-force
F+ dimensionless plasma pulsing frequency, fpd/U�
h cylinder height
l rigid connecting rod length
P gross power produced
Pp plasma input power
Re Reynolds numbers, U�d/�
St cylinder-based Strouhal number, fvd/U�
1 Senior Lecturer, Faculty of Mechanical Engineering, Senior AIAA Member.
2 Graduate Student, Faculty of Mechanical Engineering.
1
50th AIAA Aerospace Sciences Meeting including the New Horizons Forum and Aerospace Exposition09 - 12 January 2012, Nashville, Tennessee
AIAA 2012-0902
Copyright © 2012 by the American Institute of Aeronautics and Astronautics, Inc. All rights reserved.
American Institute of Aeronautics and Astronautics
t time
Tatt time scale associated with forced flow attachment
Tatt time scale associated with forced flow separation
U� free-stream velocity
U* reduced velocity, U�/fnd
V voltage
Vpp peak-to-peak voltage
x free-stream direction
y cross-stream direction
� cylinder angle from forward stagnation point
�f DBD plasma forcing angle from forward stagnation point
� system deflection angle
� dimensionless time, TU�/d
�z non-dimensional spanwise vorticity, ½(v/x–u/y)d/U�
I. Introduction Flow-induced vibration (FIV) is a topic of interest in many engineering disciplines. The phenomenon is
alternatively referred to as vortex induced vibration (VIV), lock-on or synchronization. A common definition of
lock-on or synchronization is when a body’s oscillation frequency (f) and vortex formation frequency (fv), are close
to the natural frequency (fn) of the body within a regime of large-amplitude vibration (e.g. Williamson and
Govardhan, 2004). VIV is generally a problem that results in fatigue and structural failure of heat exchanger tubes,
ocean constructions, bridges, chimney stacks and vehicle components. Due to the important engineering need to
avoid the phenomenon, many fundamental studies have been carried out (see e.g. Blevins, 2006). Although
avoidance (e.g. Wong and Kokkalis, 1982) or active control (e.g. Cheng et al, 2003) are common engineering or
research objectives, other approaches aim to do the opposite. Instead of reducing, eliminating or avoiding VIV, the
phenomenon is exploited to harness energy as done, for example, by Bernitsas et al. (2008). The concept appears
suited to ocean and other flowing water resources where relatively large aspect ratio cylinders (h/D>>1) must be
used to ensure lock-on.
Extracting energy via an oscillatory or reciprocating motion, as opposed to using conventional rotary
turbines, has been attempted at least since the 1970s. Bade (1976) developed a wing with passive-pitch articulation
that was mounted on the end of a pivoted boom and Jeffery (1977) developed a vertical swinging-wing that was
pivoted and made to “flap” in the wind. McKinney and DeLauriert (1981) conducted an analytical and experimental
investigation of a wing that oscillates in both angle-of-attack and vertical translation with prescribed phasing
between the two motions. This so-called “wingmill” was capable of efficiencies comparable to rotary designs.
In this paper, we describe a technique of forced flow induced vibration that is not related to the natural vortex
formation and its associated frequency fv; neither is it based on passive or active airfoil pitching. Instead, the flow
about the body is actively controlled, or forced, with a view to driving the body at or near resonance. The technique
is explored here by actively controlling dynamic separation and attachment of the boundary layer over a small aspect
ratio cylindrical bob of a rigid-rod pendulum with one degree-of-freedom. For the experiments reported here,
surface-mounted dielectric barrier discharge (DBD) plasma actuators (see Corke et al, 2007) were used to control
flow separation, under subcritical conditions, by exciting the separated shear layer on the cylinder wall. DBD
actuators were selected due to their effectiveness in controlling flow separation on two-dimensional cylinders at
subcritical Reynolds numbers (see Thomas et al, 2008; Jukes and Choi, 2009). This is essentially a novel way of
producing reciprocating motion and hence one objective of this paper is to study the phenomenon by measuring the
applied loads, unsteady motions and flowfield. As in the studies cited above, a second objective is to assess the
viability of such a system for wind-energy generation in the form of oscillatory or reciprocating motion. To this end,
employing DBD plasma actuators at low duty cycles, and hence low power on the order of milliwatts, renders them
ideally suited to the present applications (e.g. Greenblatt et al, 2008).
In order to study the phenomenon and its applicability to energy-generation, the following procedure was
followed. A small wind tunnel model was constructed and equipped with DBD plasma actuators (section 2). A
simple linear system model was developed and this was used to estimate the theoretical maximum system power and,
together with experimental data, the natural system damping (section 3). This was followed by a parametric study
(section 4), complimented with flow-field measurements (section 5), aimed at identifying conditions under which the
effectiveness of the actuators are maximized. With this as background, open-loop forcing of the system was studied
2
American Institute of Aeronautics and Astronautics
in order to illustrate the basic nature of flow-control induced vibrations (section 6). Estimation of the transient loads
was performed using a system identification technique (section 7) and this was used to develop a model for the
forcing function and estimate the power produced. The consequences of up-scaling the system geometrically was
also considered.
II. Experimental Setup Experiments were performed in a low-speed blow-down wind tunnel with a 1x0.61m test section area and a
maximum wind speed of 55m/s. The maximum turbulence level in the center of the tunnel was 0.3% of the free-
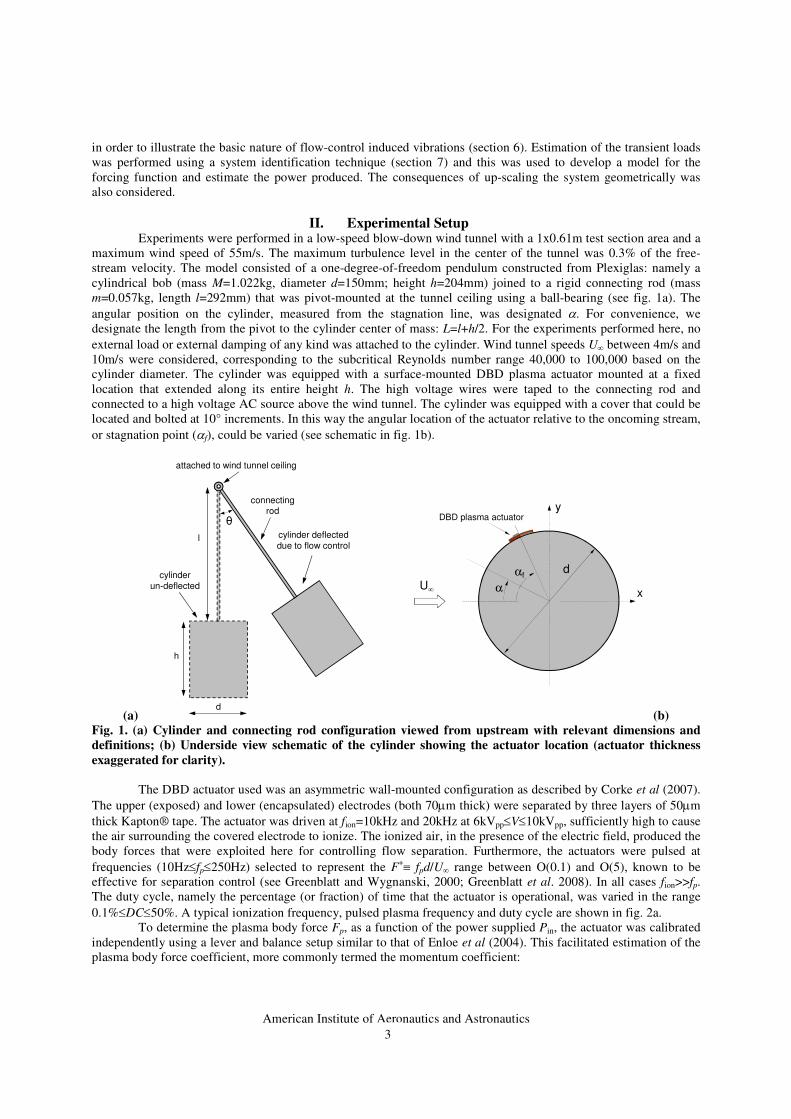
stream velocity. The model consisted of a one-degree-of-freedom pendulum constructed from Plexiglas: namely a
cylindrical bob (mass M=1.022kg, diameter d=150mm; height h=204mm) joined to a rigid connecting rod (mass
m=0.057kg, length l=292mm) that was pivot-mounted at the tunnel ceiling using a ball-bearing (see fig. 1a). The
angular position on the cylinder, measured from the stagnation line, was designated �. For convenience, we
designate the length from the pivot to the cylinder center of mass: L=l+h/2. For the experiments performed here, no
external load or external damping of any kind was attached to the cylinder. Wind tunnel speeds U� between 4m/s and
10m/s were considered, corresponding to the subcritical Reynolds number range 40,000 to 100,000 based on the
cylinder diameter. The cylinder was equipped with a surface-mounted DBD plasma actuator mounted at a fixed
location that extended along its entire height h. The high voltage wires were taped to the connecting rod and
connected to a high voltage AC source above the wind tunnel. The cylinder was equipped with a cover that could be
located and bolted at 10° increments. In this way the angular location of the actuator relative to the oncoming stream,
or stagnation point (�f), could be varied (see schematic in fig. 1b).
(a)
�
attached to wind tunnel ceiling
h
d
cylinder
un-deflected
cylinder deflected
due to flow controll
connectingrod
U�
αfd
α
DBD plasma actuator
x
y
(b)
Fig. 1. (a) Cylinder and connecting rod configuration viewed from upstream with relevant dimensions and
definitions; (b) Underside view schematic of the cylinder showing the actuator location (actuator thickness
exaggerated for clarity).
The DBD actuator used was an asymmetric wall-mounted configuration as described by Corke et al (2007).
The upper (exposed) and lower (encapsulated) electrodes (both 70�m thick) were separated by three layers of 50�m
thick Kapton® tape. The actuator was driven at fion=10kHz and 20kHz at 6kVppV10kVpp, sufficiently high to cause
the air surrounding the covered electrode to ionize. The ionized air, in the presence of the electric field, produced the
body forces that were exploited here for controlling flow separation. Furthermore, the actuators were pulsed at
frequencies (10Hzfp250Hz) selected to represent the F+� fpd/U� range between O(0.1) and O(5), known to be
effective for separation control (see Greenblatt and Wygnanski, 2000; Greenblatt et al. 2008). In all cases fion>>fp.
The duty cycle, namely the percentage (or fraction) of time that the actuator is operational, was varied in the range
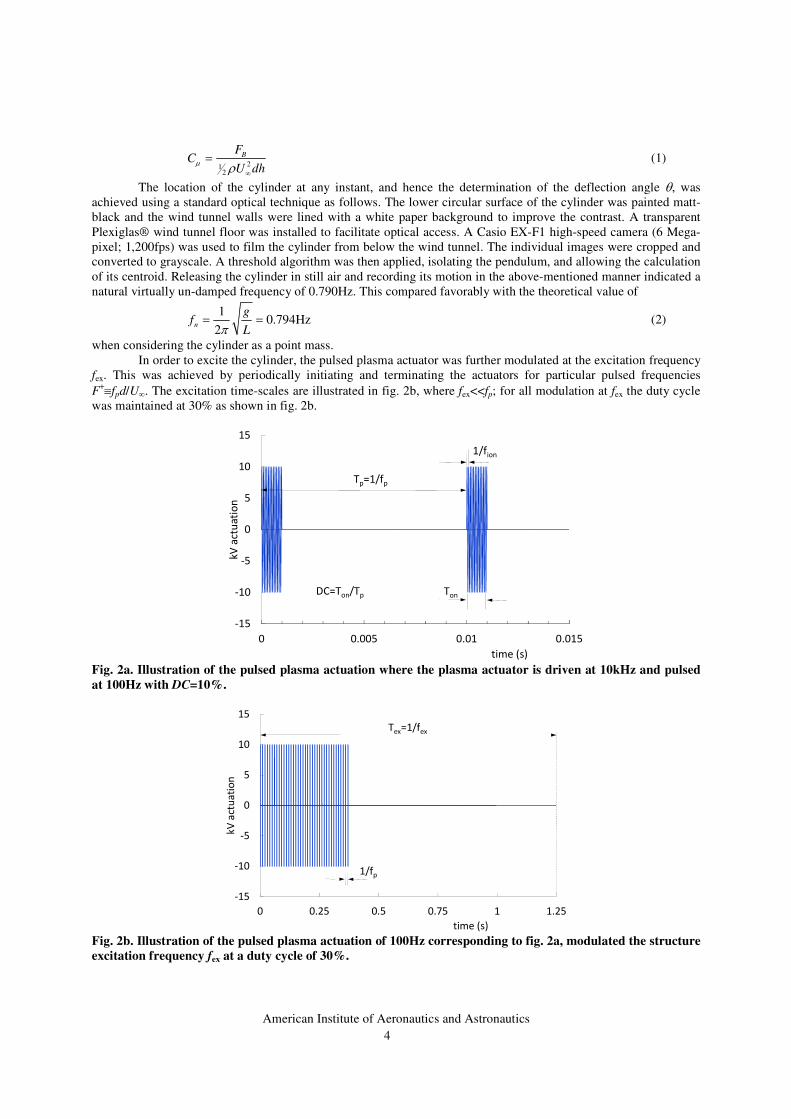
0.1%DC50%. A typical ionization frequency, pulsed plasma frequency and duty cycle are shown in fig. 2a.
To determine the plasma body force Fp, as a function of the power supplied Pin, the actuator was calibrated
independently using a lever and balance setup similar to that of Enloe et al (2004). This facilitated estimation of the
plasma body force coefficient, more commonly termed the momentum coefficient:
3
American Institute of Aeronautics and Astronautics
21
2
BF
CU dh
� � �
� (1)
The location of the cylinder at any instant, and hence the determination of the deflection angle �, was
achieved using a standard optical technique as follows. The lower circular surface of the cylinder was painted matt-
black and the wind tunnel walls were lined with a white paper background to improve the contrast. A transparent
Plexiglas® wind tunnel floor was installed to facilitate optical access. A Casio EX-F1 high-speed camera (6 Mega-
pixel; 1,200fps) was used to film the cylinder from below the wind tunnel. The individual images were cropped and
converted to grayscale. A threshold algorithm was then applied, isolating the pendulum, and allowing the calculation
of its centroid. Releasing the cylinder in still air and recording its motion in the above-mentioned manner indicated a
natural virtually un-damped frequency of 0.790Hz. This compared favorably with the theoretical value of
1
0.794Hz2
n
gf
L � � (2)
when considering the cylinder as a point mass.
In order to excite the cylinder, the pulsed plasma actuator was further modulated at the excitation frequency
fex. This was achieved by periodically initiating and terminating the actuators for particular pulsed frequencies
F+�fpd/U�. The excitation time-scales are illustrated in fig. 2b, where fex<<fp; for all modulation at fex the duty cycle
was maintained at 30% as shown in fig. 2b.
���
���
��
�
�
��
��
� ����� ���� �����
���
��� ��
� ������
�������
��� ��
������������
Fig. 2a. Illustration of the pulsed plasma actuation where the plasma actuator is driven at 10kHz and pulsed
at 100Hz with DC=10%.
���
���
��
�
�
��
��
� ���� ��� ���� � ����
���
��� ��
� ������
���������
����
Fig. 2b. Illustration of the pulsed plasma actuation of 100Hz corresponding to fig. 2a, modulated the structure
excitation frequency fex at a duty cycle of 30%.
4
American Institute of Aeronautics and Astronautics
Two dimensional particle image velocimetry (PIV) was performed at the cylinder center-span (at h/2) in
order to assess the flow state with and without actuation. For these measurements the cylinder pivot was locked
thereby preventing transverse motion of the cylinder. A 200mJ double-pulsed Nd-YAG laser was used in
conjunction with a 4 megapixel CCD camera mounted below the tunnel. A commercial seeding particle generator
was employed to generate particles of diameter 1�m (based on the manufacturer’s specifications) within the tunnel
plenum. Measurements for the baseline and selected control cases were performed using 200 image-pairs. Tests
performed showed this number of image pairs produced adequate convergence of the velocity field. Resolution of the
PIV images was 0.18mm/pixel. A decreasing size multi-pass approach was adopted, using 8�8 pixel interrogation
windows with 0% overlap for the final results.
Three types of PIV measurements were performed: random data acquired for baseline and control cases; phase-
resolved measurements within the forcing cycle; phase-resolved measurements within the attachment and separation
transients. These data are presented in section 5.
III. The System Model Development of the linear system model was performed by writing the equation governing the pendulum motion:
OI M� � ��� (3)
where I is the mass moment of inertia and OM� is the sum of the moments about the pivot point O. I is made up of
the contribution from the cylinder ML2, the contribution about its own axis (MH
2/12), the contribution from the rod
(ml2/3). Assuming small angles �, and in addition that m<<M and H
2/(12L
2)<<1 we can write the linear equation of
motion:
2 2( ) ( )L
ML cL C MgL F t L� � �� � � ��� � (4)
where c is the natural (self) damping coefficient of the system and C is an assumed linear damping due to an
external load. Although the cylinder experiments were conducted without an external load we introduce this
damping here for the purposes of estimating the system power output.
A. Maximum Theoretical Power
To estimate the maximum power generated, we assume zero natural damping ( 0c � ) and that the
pendulum is driven by a sinusoidal lateral forcing function:
( ) sin( )L L
F t C q S t��� (5)
Where q� is the dynamic pressure 212 U� � , CL is the lateral-force coefficient and S is the cylinder projected area
d�h. Dividing by ML2, equation (4) can now be written in the form:
22 sin( )L
l n n
C q St
ML� � � � � � ��� � ��� � (6)
where 2n n
f� � and the load damping ratio is 2( / ) / (2 )
l nC L M� �� . This equation has the well-known solution:
2
2 2 2 1/ 2
( / ) sin[ ( )]
[{1 ( / ) } {2 / } ]
L n
n n
C q S t� � � ��
� � �� �� �
�� �
(7)
where 1 2( ) tan [2 / ] / [1 ( / ) ]n n
� � �� � � ��� � � . The power produced by the system can be calculated by integration
of one cycle thus:
2 /
0( ) ( )
2L
P F t L t dt ��
�
� � � (8)
By forcing at the natural frequency (n
� �� ), we can show that
2
8L n s
P C DU A�
� �� (9)
where As is the area swept by the cylinder, namely max2
sA hL�� . Finally, we can write the power coefficient:
3 *1
2 2
L
P
s
CPC
U A U
� �
� � (10)
5
American Institute of Aeronautics and Astronautics
where the reduced velocity */
nU U f d�� . Providing that we do not violate the linear assumptions, the peak power
coefficient is only limited by the force coefficient and reduced velocity. This should be contrasted with the maximum
power coefficient (Betz limit) attainable by an open wind turbine of 16/27.
B. Natural System Damping
The natural system damping was determined by setting a particular flow velocity in the range 4m/sU�10m/s and
then releasing the cylinder from its maximum deflection angle (0 27.5� � � ). The recorded centroid locations were
used to determine �(t). In order to estimate the natural system damping, equation (4) was used in the form: 22 0
n n� �� � � �� � ��� � (11)
with the natural damping ratio / (2 )n
c M� �� .
���
� �!
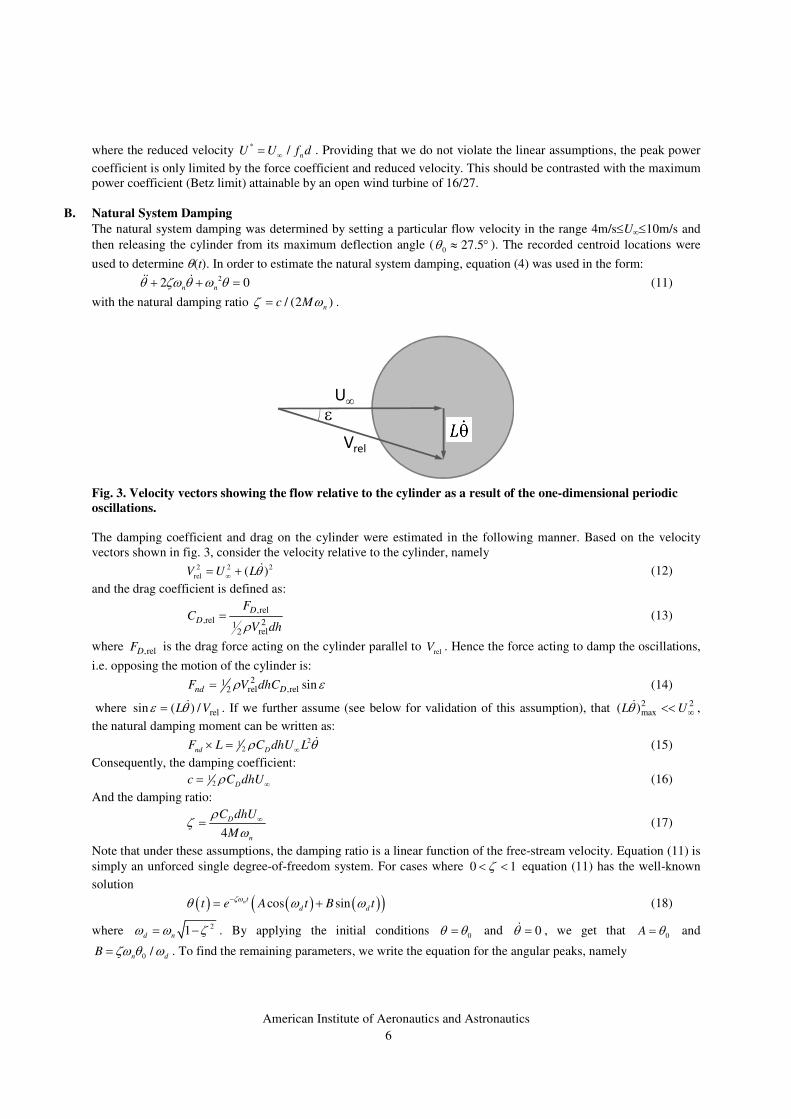
Fig. 3. Velocity vectors showing the flow relative to the cylinder as a result of the one-dimensional periodic
oscillations.
The damping coefficient and drag on the cylinder were estimated in the following manner. Based on the velocity
vectors shown in fig. 3, consider the velocity relative to the cylinder, namely
2 2 2
rel( )V U L��� � � (12)
and the drag coefficient is defined as:
,rel
,rel 21rel2
DD
FC
V dh�� (13)
where ,relDF is the drag force acting on the cylinder parallel to rel
V . Hence the force acting to damp the oscillations,
i.e. opposing the motion of the cylinder is:
21rel ,rel2 sinnd DF V dhC� �� (14)
where relsin ( ) /L V� �� � . If we further assume (see below for validation of this assumption), that 2 2max( )L U� ���� ,
the natural damping moment can be written as:
212nd D
F L C dhU L� ��� � � (15)
Consequently, the damping coefficient:
12 D
c C dhU� �� (16)
And the damping ratio:
4
D
n
C dhU
M
��
��� (17)
Note that under these assumptions, the damping ratio is a linear function of the free-stream velocity. Equation (11) is
simply an unforced single degree-of-freedom system. For cases where 0 1�� � equation (11) has the well-known
solution
� � � � � �� �cos sinnt
d dt e A t B t
��� � ��� � (18)
where 21d n
� � �� � . By applying the initial conditions 0
� �� and 0� �� , we get that 0
A �� and
0 /n d
B �� � �� . To find the remaining parameters, we write the equation for the angular peaks, namely
6

American Institute of Aeronautics and Astronautics
� � 0nt
t e��� � �� (19)
take logarithms and perform linear least-squares curve fitting to obtain n
� , d
� and � .
���
�
��
���
���
���
���
"��
� �� �� "� #�
θ �$�
� ������
���� ����!�%�
�� &��� �
��$
��������
���'���
���(���
���#���
Fig. 4. Experimental data showing cylinder damping at different wind tunnel speeds together with linear
model predictions based on least squares curve fitting.
This procedure was followed for 4U� � , 6, 8 and 10 m/s and the individual experiments, together with the
theoretical curves are shown in fig. 4. To obtain representative values, each experiment was performed 20 times and
the data was averaged. Two sets of calculations were performed: one with all contributions to the moment of inertia I
discussed in section 3 (full geometry) and the other with I=ML2 (simplified geometry). For all estimates, the full
geometry was used resulting in 0.781 0.006Hzd
f � � . Data for the damping ratio as a function of tunnel speed is
shown in fig. 5; error bars representing 95% confidence intervals were typically the same size as the symbols used in
the figure. It is evident that our linearizing assumption, namely 2 2max( )L U� ���� , is valid as the damping ratio is
clearly as linear function of tunnel speed. As expected using the simplified geometry has a small effect on the
damping ratio with consistent differences in damping coefficient of less than 3%.
���)
���)
���)
���)
���)
� � # ( ' �� ��
ζ
�� �����
����������
��!!�*����� +
� ��! � �%�*����� +
Fig. 5. Natural damping coefficient as a function of wind tunnel speed based on the linear approximation
assumed here.
7
American Institute of Aeronautics and Astronautics
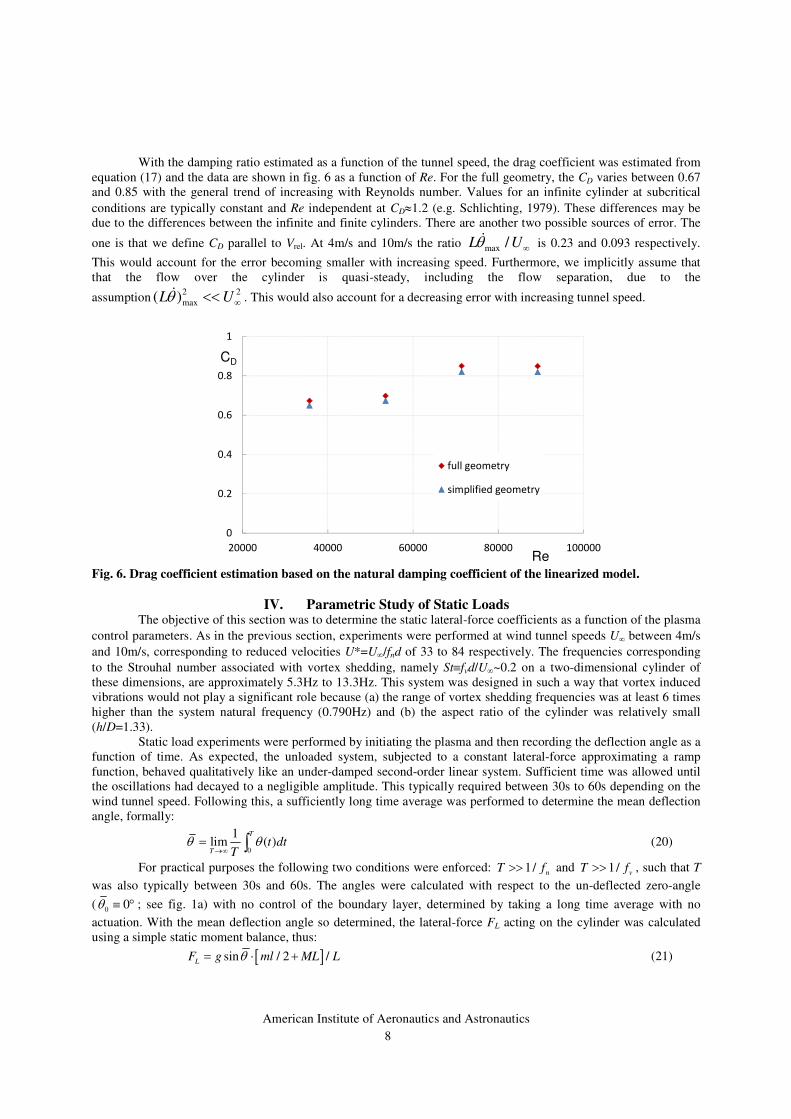
With the damping ratio estimated as a function of the tunnel speed, the drag coefficient was estimated from
equation (17) and the data are shown in fig. 6 as a function of Re. For the full geometry, the CD varies between 0.67
and 0.85 with the general trend of increasing with Reynolds number. Values for an infinite cylinder at subcritical
conditions are typically constant and Re independent at CD�1.2 (e.g. Schlichting, 1979). These differences may be
due to the differences between the infinite and finite cylinders. There are another two possible sources of error. The
one is that we define CD parallel to Vrel. At 4m/s and 10m/s the ratio max /L U� �� is 0.23 and 0.093 respectively.
This would account for the error becoming smaller with increasing speed. Furthermore, we implicitly assume that
that the flow over the cylinder is quasi-steady, including the flow separation, due to the
assumption2 2
max( )L U� ���� . This would also account for a decreasing error with increasing tunnel speed.
�
���
��#
��(
��'
�
����� #���� (���� '���� ������
CD
Re
��!!�*����� +
� ��! � �%�*����� +
Fig. 6. Drag coefficient estimation based on the natural damping coefficient of the linearized model.
IV. Parametric Study of Static Loads The objective of this section was to determine the static lateral-force coefficients as a function of the plasma
control parameters. As in the previous section, experiments were performed at wind tunnel speeds U� between 4m/s
and 10m/s, corresponding to reduced velocities U*=U�/fnd of 33 to 84 respectively. The frequencies corresponding
to the Strouhal number associated with vortex shedding, namely St�fvd/U�~0.2 on a two-dimensional cylinder of
these dimensions, are approximately 5.3Hz to 13.3Hz. This system was designed in such a way that vortex induced
vibrations would not play a significant role because (a) the range of vortex shedding frequencies was at least 6 times
higher than the system natural frequency (0.790Hz) and (b) the aspect ratio of the cylinder was relatively small
(h/D=1.33).
Static load experiments were performed by initiating the plasma and then recording the deflection angle as a
function of time. As expected, the unloaded system, subjected to a constant lateral-force approximating a ramp
function, behaved qualitatively like an under-damped second-order linear system. Sufficient time was allowed until
the oscillations had decayed to a negligible amplitude. This typically required between 30s to 60s depending on the
wind tunnel speed. Following this, a sufficiently long time average was performed to determine the mean deflection
angle, formally:
0
1lim ( )
T
Tt dt
T� �
��� � (20)
For practical purposes the following two conditions were enforced: 1/n
T f�� and 1/v
T f�� , such that T
was also typically between 30s and 60s. The angles were calculated with respect to the un-deflected zero-angle
(0
0� � � ; see fig. 1a) with no control of the boundary layer, determined by taking a long time average with no
actuation. With the mean deflection angle so determined, the lateral-force FL acting on the cylinder was calculated
using a simple static moment balance, thus:
� �sin / 2 /L
F g ml ML L�� � (21)
8

American Institute of Aeronautics and Astronautics
The lateral-force coefficient was calculated by conventional non-dimensionalization:
21
2
LL
FC
U dh� �
� (22)
as discussed in the previous section. Perturbations were introduced in 10° increments as described in section 2 for the
range 30°�f 120°. The greatest effect was observed when the perturbations were introduced close to the separation
angle (see below). An example of lateral-force coefficient data as a function of reduced frequency F+ is shown in fig.
7 for �f=60°, 70° and 80° with a plasma ionization frequency fion=10kHz and DC=10%. As a general rule, the
introduction of perturbations in the vicinity of the separation line (�f �70°) shows a marked effect on the lateral-
forces. It has been shown previously that amplification of the perturbations is rooted in the Kelvin-Helmholtz
instability mechanism associated with the separating shear layer (e.g. Greenblatt & Wygnanski, 2000). When
perturbations are introduced slightly upstream of the separation point, namely �f=60°, the perturbation amplitude
decays initially because there is no perturbation amplification mechanism. Although the perturbations decay
somewhat, they still have a significant effect on the separating shear layer and hence the lateral-force. With the
perturbations introduced just downstream of the separation point (�f =80°) the lateral-force is maximized for all
reduced frequencies considered. In generals, the optimum F+ is between 1 and 2 and at F
+ >2 the effectiveness
decreases; the rate at which effectiveness decreases depends upon the actuation location. When the perturbations
were introduced at a relatively large angle downstream of separation, namely �f =90°, no significant lateral-force was
recorded. Repeat experiments conducted at fion=20kHz produced similar results to those shown in fig. 7.
0
0.2
0.4
0.6
0.8
0.1 1 10
CL
F+
�f=60°
�f=70°
�f=80°
Fig. 7. Example of lateral-force coefficient data as a function of reduced frequency for different DBD plasma
forcing angles (Re=80,000; C����=0.17%, DC=10%).
These data are consistent with the observations of Thomas et al (2008) who studied separation control on
two-dimensional subcritical cylinder flows using both pulsed and non-pulsed DBD actuation. They observed that
simultaneous application of forcing on both sides of the cylinder eliminated vortex shedding and that wake
turbulence levels decreased significantly. Furthermore, they determined that forcing at F+=1 was most effective in
achieving these objectives. In a similar study, Jukes and Choi (2009) recorded more than 70% reduction in lift
fluctuations with a 32% drag reduction at F+=2 and C�=0.32%. They observed narrowing of the wake as the
perturbations promoted rolling-up of the shear-layer at the forcing frequency, but with no effect on the opposite side
of the wake. Considering the similar values of F+ for these investigations, as compared to the present one, it is
reasonable to assume that similar mechanisms are present in this investigation.
9

American Institute of Aeronautics and Astronautics
0
0.2
0.4
0.6
0.8
0.0001 0.001 0.01 0.1 1
CL
DC
fion=10kHz
fion=20kHz
Fig. 8. Example of lateral-force coefficient data as a function of duty cycle. �f=70°, F
+=1.0 and Re=80,000.
An investigations of separation control on airfoils showed that duty cycles between 1% and 50% had similar
effect in the lift force coefficients (Greenblatt et al, 2008). With perturbations introduced close to the separation
angle a similar result was observed here. fig. 8 illustrates that there is very little difference in lateral-force coefficient
for the range 0.1% to 50%. In the context of energy generation this result is important because the measured power
input was seen to be linearly dependent on duty cycle. Calibration of the actuator at DC=100% described in section 2
showed that at 10kHz, exciting the actuators at 8kVpp consumed Pin=75W/m. On the cylinder of height 150mm, this
reduced proportionally to 11.25W. Exciting the actuator at DC=0.1% thus required only 11.25mW. For energy
generation, two actuators are used alternately (see section 7) and therefore not pulsed continuously. Furthermore,
each actuator is typically operated for a time period <Tex/2 (see fig. 2b; also see section 7 and fig. 18 below). Hence
the total actuator Pin can be reduced to approximately 5mW for the present setup. This observation served as a major
motivating factor for using plasma actuators in the present investigation as it was a negligible fraction of the power
produced by the system.
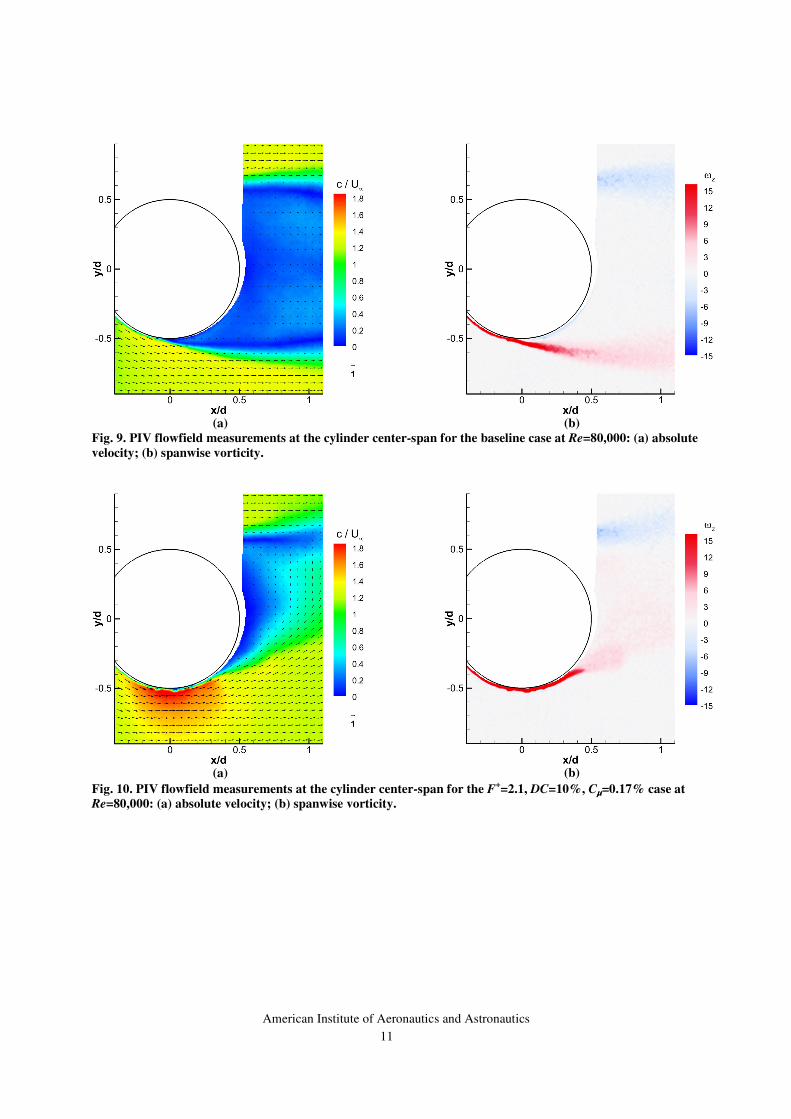
V. PIV Measurements Flowfield measurements were conducted using PIV, as described in section 2, where the pivot was fixed to
prevent transverse motion of the cylinder. The absolute velocity 2 2 1/2( )c u v� � together with velocity vectors and
the non-dimensional vorticity �z are shown for the baseline case (figs. 9a and 9b) and the F+=2.1, Cµ=0.17% case
(figs. 10a and 10b). Based on these data the baseline separation point was estimate to be ��80°, which is similar to
that observed on a two-dimensional cylinder (Jukes and Choi, 2009). With control applied the separation location
moves aft on the cylinder to ��120°. Additional PIV data acquired at F+=1 showed qualitatively similar results to
those in fig. 10 (not shown); this was anticipated due to the similarity in the lateral-force measurements shown in fig.
7. The relative insensitivity of the wake on the opposite side of the cylinder reported by Jukes and Choi (2009) was
also observed here at the cylinder center-span as seen when comparing figs. 9b and 10b.
10
American Institute of Aeronautics and Astronautics
(a)
(b)
Fig. 9. PIV flowfield measurements at the cylinder center-span for the baseline case at Re=80,000: (a) absolute
velocity; (b) spanwise vorticity.
(a)
(b)
Fig. 10. PIV flowfield measurements at the cylinder center-span for the F+=2.1, DC=10%, C����=0.17% case at
Re=80,000: (a) absolute velocity; (b) spanwise vorticity.
11

American Institute of Aeronautics and Astronautics
(a)
(b)
(c)
(e)
(g)
d)
(f)
(h)
Fig. 11. Phase-averaged transient flowfield measurements at the cylinder center-span following initiation of
the perturbations corresponding to forcing conditions of fig. 10: (a,b) one cycle after initiation of the
perturbations (Tp); (c,d) 2 cycles after initiation of the perturbations (2Tp); (e,f) 4 cycles; (g,h) 6 cycles.
12
American Institute of Aeronautics and Astronautics
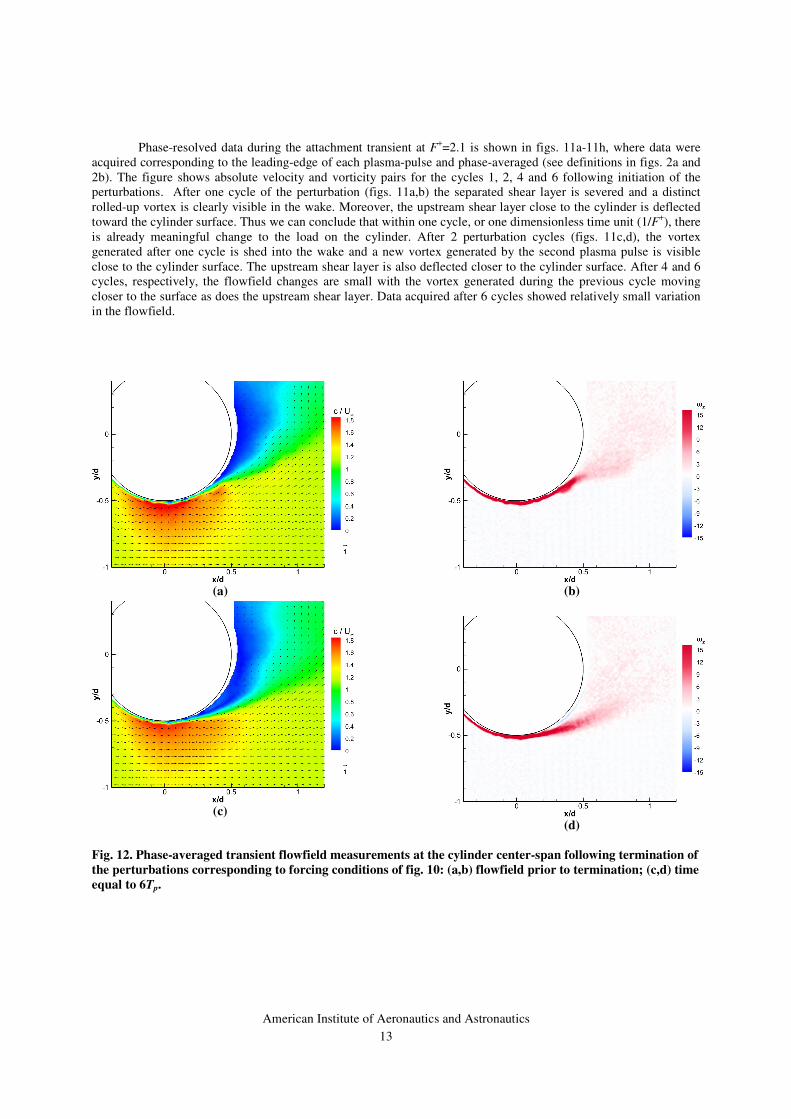
Phase-resolved data during the attachment transient at F+=2.1 is shown in figs. 11a-11h, where data were
acquired corresponding to the leading-edge of each plasma-pulse and phase-averaged (see definitions in figs. 2a and
2b). The figure shows absolute velocity and vorticity pairs for the cycles 1, 2, 4 and 6 following initiation of the
perturbations. After one cycle of the perturbation (figs. 11a,b) the separated shear layer is severed and a distinct
rolled-up vortex is clearly visible in the wake. Moreover, the upstream shear layer close to the cylinder is deflected
toward the cylinder surface. Thus we can conclude that within one cycle, or one dimensionless time unit (1/F+), there
is already meaningful change to the load on the cylinder. After 2 perturbation cycles (figs. 11c,d), the vortex
generated after one cycle is shed into the wake and a new vortex generated by the second plasma pulse is visible
close to the cylinder surface. The upstream shear layer is also deflected closer to the cylinder surface. After 4 and 6
cycles, respectively, the flowfield changes are small with the vortex generated during the previous cycle moving
closer to the surface as does the upstream shear layer. Data acquired after 6 cycles showed relatively small variation
in the flowfield.
(a)
(c)
(b)
(d)
Fig. 12. Phase-averaged transient flowfield measurements at the cylinder center-span following termination of
the perturbations corresponding to forcing conditions of fig. 10: (a,b) flowfield prior to termination; (c,d) time
equal to 6Tp.
13

American Institute of Aeronautics and Astronautics
(e)
(g)
(f)
(h)
Fig. 12(contd). Phase-averaged transient flowfield measurements at the cylinder center-span following
termination of the perturbations corresponding to forcing conditions of fig. 10: (e,f) flowfield at time equal to
12Tp; (g,h) time equal to 18Tp.
The main change was an elongation of the downstream vortex and its merging with the upstream shear
layer (see fig. 12a,b shown after 20 cycles). Hence, under these forcing conditions, it was concluded that the
attachment process occurs over the dimensional time att att
/ 7 /T U D F� ��� � , namely
att3.3� � .
The transient separation process (figs. 12a-12h) was studied by terminating the forcing but still acquiring data
locked to the forcing cycle frequency as done above in fig. 11. The first data set (fig. 12a,b) corresponds to 22
forcing cycles after initiation of the perturbations; after the 22nd
perturbation the forcing was terminated. It was
observed that the separation process was much slower than the attachment process. For example, after the equivalent
of six cycles subsequent to termination of the perturbations (figs. 12c,d), the shear layer is observed to be only
slightly deflected away from the cylinder as compared to that prior to termination in figs. 12a,b. After another 6
cycles, the shear layer continues its rather gradual transient deflection away from the surface. After another 6 cycles
the shear layer is approximating that of the fully separated shear layer, but still not fully separated as can be by
comparing it to figs. 9a,b. Under these conditions, we can conclude that the separation process occurs over the
dimensionless time sep sep / 18 /T U D F� �
�� � , namely �sep>8.6.
VI. Flow-Control-Induced Vibrations
To demonstrate the use of separation control to drive the system, the pulsed plasma actuator was modulated
at the excitation frequency fex. This was achieved by periodically initiating and terminating the actuators for
particular pulsed frequencies F+�fpd/U�, where fex<<fp. All experiments were initiated with the cylinder in its
baseline uncontrolled state with 0� � � . After initiation of the modulated forcing, sufficient time was allowed for
the transient behavior to decay. Instantaneous deflection angle data �(t) for F+=0.9 and DC=1% at different
14
American Institute of Aeronautics and Astronautics
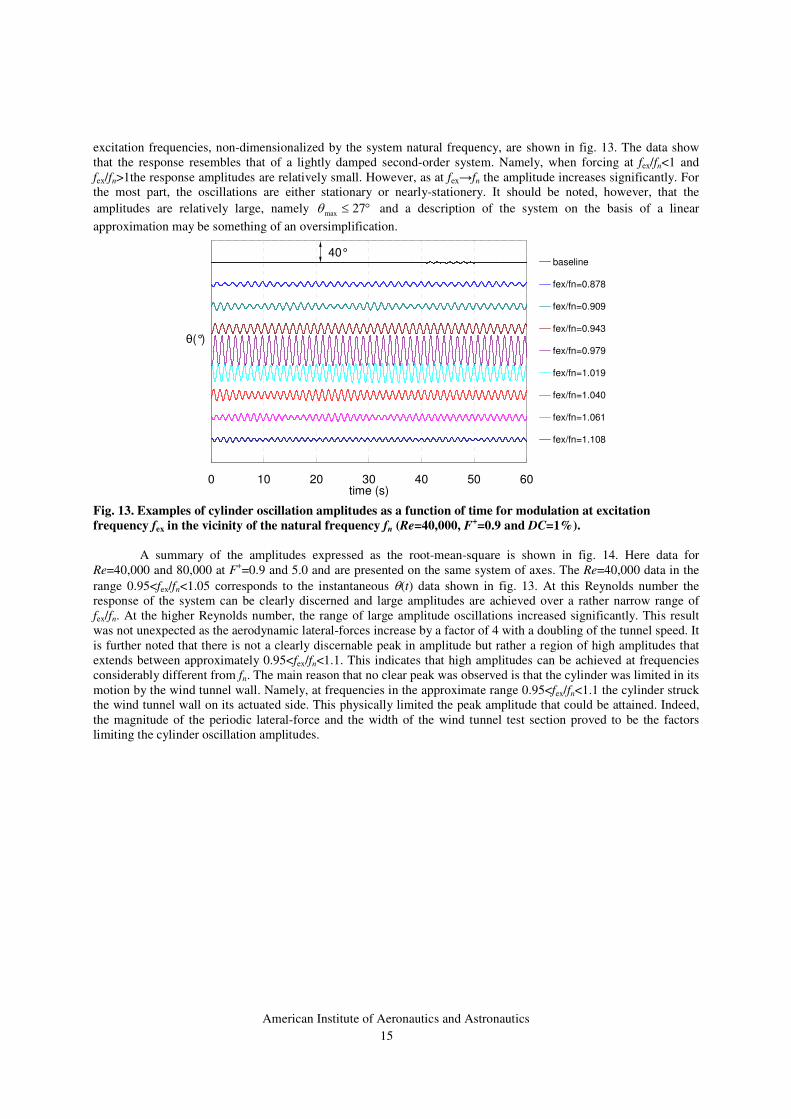
excitation frequencies, non-dimensionalized by the system natural frequency, are shown in fig. 13. The data show
that the response resembles that of a lightly damped second-order system. Namely, when forcing at fex/fn<1 and
fex/fn>1the response amplitudes are relatively small. However, as at fex�fn the amplitude increases significantly. For
the most part, the oscillations are either stationary or nearly-stationery. It should be noted, however, that the
amplitudes are relatively large, namely max 27� � and a description of the system on the basis of a linear
approximation may be something of an oversimplification.
0 10 20 30 40 50 60time (s)
�(°)
baseline
fex/fn=0.878
fex/fn=0.909
fex/fn=0.943
fex/fn=0.979
fex/fn=1.019
fex/fn=1.040
fex/fn=1.061
fex/fn=1.108
40°
Fig. 13. Examples of cylinder oscillation amplitudes as a function of time for modulation at excitation
frequency fex in the vicinity of the natural frequency fn (Re=40,000, F+=0.9 and DC=1%).
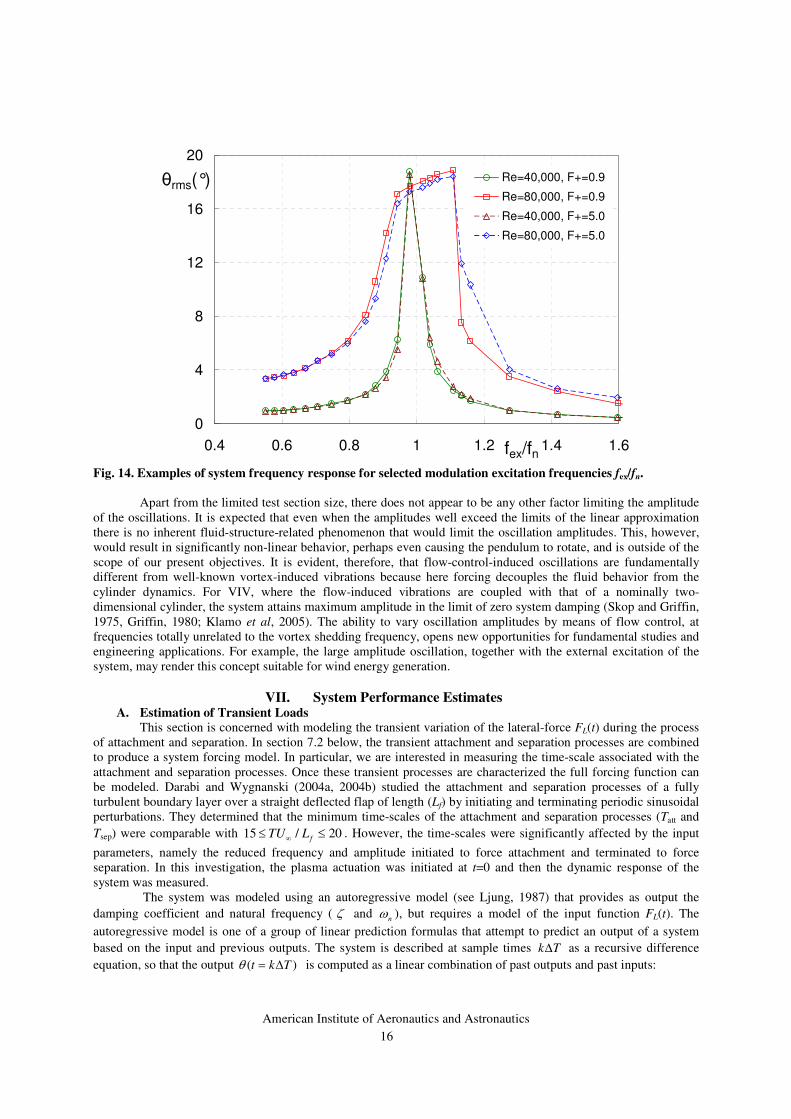
A summary of the amplitudes expressed as the root-mean-square is shown in fig. 14. Here data for
Re=40,000 and 80,000 at F+=0.9 and 5.0 and are presented on the same system of axes. The Re=40,000 data in the
range 0.95<fex/fn<1.05 corresponds to the instantaneous �(t) data shown in fig. 13. At this Reynolds number the
response of the system can be clearly discerned and large amplitudes are achieved over a rather narrow range of
fex/fn. At the higher Reynolds number, the range of large amplitude oscillations increased significantly. This result
was not unexpected as the aerodynamic lateral-forces increase by a factor of 4 with a doubling of the tunnel speed. It
is further noted that there is not a clearly discernable peak in amplitude but rather a region of high amplitudes that
extends between approximately 0.95<fex/fn<1.1. This indicates that high amplitudes can be achieved at frequencies
considerably different from fn. The main reason that no clear peak was observed is that the cylinder was limited in its
motion by the wind tunnel wall. Namely, at frequencies in the approximate range 0.95<fex/fn<1.1 the cylinder struck
the wind tunnel wall on its actuated side. This physically limited the peak amplitude that could be attained. Indeed,
the magnitude of the periodic lateral-force and the width of the wind tunnel test section proved to be the factors
limiting the cylinder oscillation amplitudes.
15
American Institute of Aeronautics and Astronautics
0
4
8
12
16
20
0.4 0.6 0.8 1 1.2 1.4 1.6fex/fn
�rms(°) Re=40,000, F+=0.9
Re=80,000, F+=0.9
Re=40,000, F+=5.0
Re=80,000, F+=5.0
Fig. 14. Examples of system frequency response for selected modulation excitation frequencies fex/fn.
Apart from the limited test section size, there does not appear to be any other factor limiting the amplitude
of the oscillations. It is expected that even when the amplitudes well exceed the limits of the linear approximation
there is no inherent fluid-structure-related phenomenon that would limit the oscillation amplitudes. This, however,
would result in significantly non-linear behavior, perhaps even causing the pendulum to rotate, and is outside of the
scope of our present objectives. It is evident, therefore, that flow-control-induced oscillations are fundamentally
different from well-known vortex-induced vibrations because here forcing decouples the fluid behavior from the
cylinder dynamics. For VIV, where the flow-induced vibrations are coupled with that of a nominally two-
dimensional cylinder, the system attains maximum amplitude in the limit of zero system damping (Skop and Griffin,
1975, Griffin, 1980; Klamo et al, 2005). The ability to vary oscillation amplitudes by means of flow control, at
frequencies totally unrelated to the vortex shedding frequency, opens new opportunities for fundamental studies and
engineering applications. For example, the large amplitude oscillation, together with the external excitation of the
system, may render this concept suitable for wind energy generation.
VII. System Performance Estimates A. Estimation of Transient Loads
This section is concerned with modeling the transient variation of the lateral-force FL(t) during the process
of attachment and separation. In section 7.2 below, the transient attachment and separation processes are combined
to produce a system forcing model. In particular, we are interested in measuring the time-scale associated with the
attachment and separation processes. Once these transient processes are characterized the full forcing function can
be modeled. Darabi and Wygnanski (2004a, 2004b) studied the attachment and separation processes of a fully
turbulent boundary layer over a straight deflected flap of length (Lf) by initiating and terminating periodic sinusoidal
perturbations. They determined that the minimum time-scales of the attachment and separation processes (Tatt and
Tsep) were comparable with 15 / 20fTU L� . However, the time-scales were significantly affected by the input
parameters, namely the reduced frequency and amplitude initiated to force attachment and terminated to force
separation. In this investigation, the plasma actuation was initiated at t=0 and then the dynamic response of the
system was measured.
The system was modeled using an autoregressive model (see Ljung, 1987) that provides as output the
damping coefficient and natural frequency ( � andn
� ), but requires a model of the input function FL(t). The
autoregressive model is one of a group of linear prediction formulas that attempt to predict an output of a system
based on the input and previous outputs. The system is described at sample times k T! as a recursive difference
equation, so that the output ( )t k T� � ! is computed as a linear combination of past outputs and past inputs:
16
American Institute of Aeronautics and Astronautics
1 1 2 2 0 1 1k k k na k na k k nb k nb
a a a b F b F b F� � � �� � � � �� � � � � � � � �� � (23)
Here k
� and k
F are the output and input respectively at t k T� ! . The system identification problem consists of
choosing the appropriate model structure (order of polynomials ,na nb ) and estimating the parameters (coefficients
,i i
a b ) in (23). By defining 1 2 1[ , ,..., , , ,..., ]
T
na o nba a a b b b" �
we can rewrite (23) as the equation A� "� , where � is
a vector of present output measurements and A is a matrix of past output and input measurements. An initial
estimation for " is achieved using least squares, then by performing an iterative technique (base on the truncated
Taylor series) we get the optimal set of parameters " .
Initial trials were performed using a ramp function described below:
att
att
att
0( )
L
tF t T
TF t
F t T
# �$
� %$ &'
(24)
The two parameters F and Tatt were varied systematically until the differences between the model and data (E) were
minimized, namely
mod data
data
| |min[ ] min
| |E
� ��
( )�� * +
, - (25)
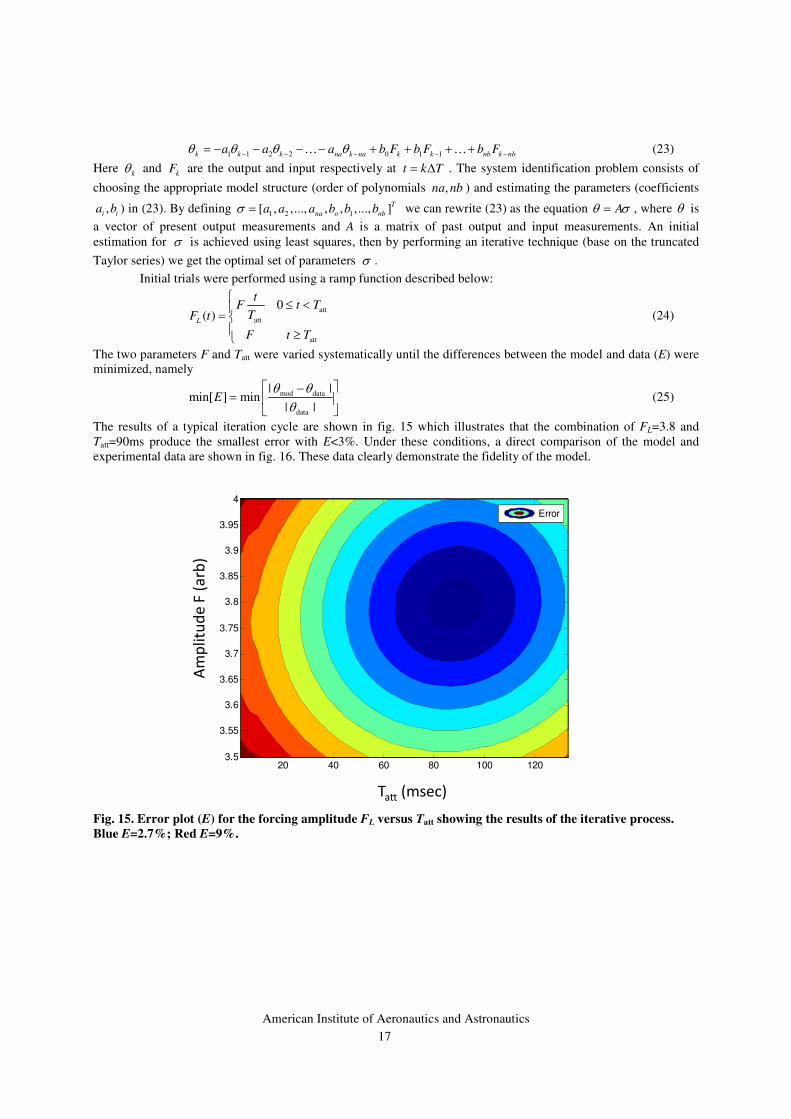
The results of a typical iteration cycle are shown in fig. 15 which illustrates that the combination of FL=3.8 and
Tatt=90ms produce the smallest error with E<3%. Under these conditions, a direct comparison of the model and
experimental data are shown in fig. 16. These data clearly demonstrate the fidelity of the model.
� [msec]
20 40 60 80 100 1203.5
3.55
3.6
3.65
3.7
3.75
3.8
3.85
3.9
3.95
4
Error
��� �����
,�
�! ��
%��-�� .
�
Fig. 15. Error plot (E) for the forcing amplitude FL versus Tatt showing the results of the iterative process.
Blue E=2.7%; Red E=9%.
17
American Institute of Aeronautics and Astronautics
0 1 2 3 4 5 6 7 8 9 10-0.05
0
0.05
0.1
0.15
0.2
0.25
0.3err=2.716
measured
model
error
������
θ � .�
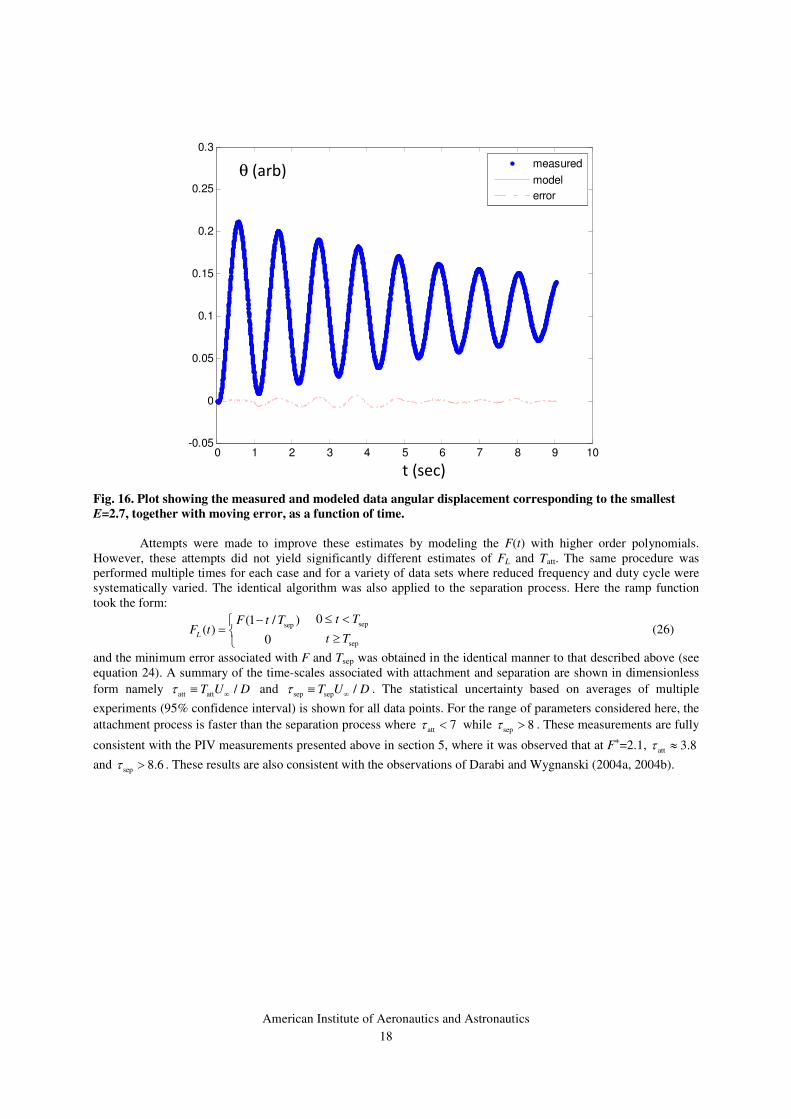
Fig. 16. Plot showing the measured and modeled data angular displacement corresponding to the smallest
E=2.7, together with moving error, as a function of time.
Attempts were made to improve these estimates by modeling the F(t) with higher order polynomials.
However, these attempts did not yield significantly different estimates of FL and Tatt. The same procedure was
performed multiple times for each case and for a variety of data sets where reduced frequency and duty cycle were
systematically varied. The identical algorithm was also applied to the separation process. Here the ramp function
took the form:
sepsep
sep
0(1 / )( )
0L
t TF t TF t
t T
��#� % &'
(26)
and the minimum error associated with F and Tsep was obtained in the identical manner to that described above (see
equation 24). A summary of the time-scales associated with attachment and separation are shown in dimensionless
form namely att att /T U D� �� and
sep sep /T U D� �� . The statistical uncertainty based on averages of multiple
experiments (95% confidence interval) is shown for all data points. For the range of parameters considered here, the
attachment process is faster than the separation process where att 7� � while
sep 8� � . These measurements are fully
consistent with the PIV measurements presented above in section 5, where it was observed that at F+=2.1,
att 3.8� �
and sep 8.6� � . These results are also consistent with the observations of Darabi and Wygnanski (2004a, 2004b).
18
American Institute of Aeronautics and Astronautics
0
2
4
6
8
10
12
14
0 1 2 3 4 5
τ
F+
DC=10%, attachment
DC=30%, attachment
DC=10%, separation
DC=30%, separation
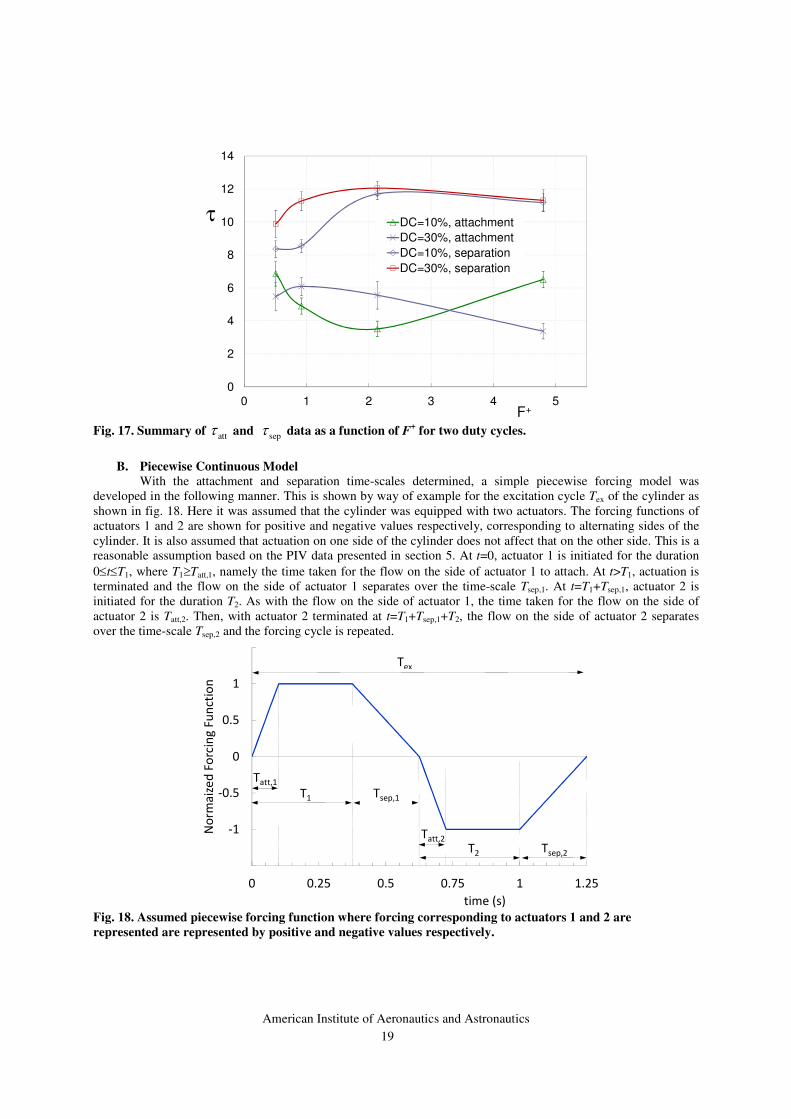
Fig. 17. Summary of att� and
sep� data as a function of F+ for two duty cycles.
B. Piecewise Continuous Model
With the attachment and separation time-scales determined, a simple piecewise forcing model was
developed in the following manner. This is shown by way of example for the excitation cycle Tex of the cylinder as
shown in fig. 18. Here it was assumed that the cylinder was equipped with two actuators. The forcing functions of
actuators 1 and 2 are shown for positive and negative values respectively, corresponding to alternating sides of the
cylinder. It is also assumed that actuation on one side of the cylinder does not affect that on the other side. This is a
reasonable assumption based on the PIV data presented in section 5. At t=0, actuator 1 is initiated for the duration
0tT1, where T1&Tatt,1, namely the time taken for the flow on the side of actuator 1 to attach. At t>T1, actuation is
terminated and the flow on the side of actuator 1 separates over the time-scale Tsep,1. At t=T1+Tsep,1, actuator 2 is
initiated for the duration T2. As with the flow on the side of actuator 1, the time taken for the flow on the side of
actuator 2 is Tatt,2. Then, with actuator 2 terminated at t=T1+Tsep,1+T2, the flow on the side of actuator 2 separates
over the time-scale Tsep,2 and the forcing cycle is repeated.
����
��
����
�
���
�
���
� ���� ��� ���� � ����
/� �
0�%�-�
�*�-���
��
� ������
���
���1�
�� ����1�
���1�
�� ����1�
Fig. 18. Assumed piecewise forcing function where forcing corresponding to actuators 1 and 2 are
represented are represented by positive and negative values respectively.
19

American Institute of Aeronautics and Astronautics
The forcing function shown in fig. 18 can be represented by the Fourier series:
ex ex
1
( ) [ sin 2 cos 2 ]n n
n
F t A n f t B n f t �
�
� �. (27)
Note that the function is not even and we must include the cosine terms. Evaluating the coefficients
indicated that the amplitude of the fundamental forcing frequency was significantly larger than the harmonics. The
largest harmonic was 3 1/ 0.1A A � with the remaining An and Bn significantly smaller. Given the relatively small
harmonics and the simplification associated with the piecewise forcing function shown in fig. 17, the assumption of
sinusoidal forcing as discussed in section 3 is justified. Furthermore, if we assume that the natural damping is small
( 1� �� , as shown in section 3.2) with the system load l
� ��� , then we can use the analysis of section 3 to
estimate the power coefficients. Based on the system dimensions considered here, the power coefficients (see
equation 10) and power (in mW) for different wind speeds and lateral-force coefficients are shown in table. 1. The
largest value, for U�=4m/s and CL=0.9, namely 0.042, is an order of magnitude less than that of a typical wind
turbine. Hence, at these small scales, the present concept does not appear to be viable as an alternative to
conventional wind turbines. It should also be noted that, although the absolute power produced here is small,
between 83mW and 776mW, it is still relatively large compared to the plasma input power possible of ~5mW (see
section 3).
Table 1. Predicted power coefficient/absolute power (mW) as a function of maximum lateral force coefficient
and wind speed for the present system.
Wind Speed U�(m/s)
CL 4 6 8 10
0.6 0.028/83 0.019/186 0.014/331 0.011/517
0.7 0.033/97 0.022/217 0.016/386 0.013/603
0.8 0.037/110 0.025/248 0.019/441 0.015/689
0.9 0.042/124 0.028/279 0.021/496 0.017/776
A. System Up-Scaling
Considering equation (10) it is evident that the power coefficient can be increased by increasing the lateral
forces, the natural frequency or the cylinder diameter. Lateral forces could in principle be increased using a more
effective form of boundary layer control. On the other hand, the natural frequency could be increased by shortening
the system length or adding a mechanical spring to the system. Consider, however, scaling-up the system linearly,
namely increasing its dimensions such that the ratios d/L=0.38 and d/h=0.74 are maintained constant. We consider
here a factor of 10 geometric up-scaling as a basis for our discussion (d=1.5m, h=2.04m and l=2.92m), resulting in
dimensions that are typical of a small kW-rated wind turbine.
The motivation for up-scaling the system can be shown by substituting the equation for the system natural
frequency of equation (2) into the power coefficient expression of equation (10) and, maintaining geometric
similarity d/L=0.38, the power coefficient can be written:
0.095P L
gLC C
U�
� (28)
Assuming no changes to the maximum lateral-force and wind speed, it is evident that the power coefficient increases
with L½. Hence the 10 fold increase in linear dimensions increases the power coefficient by more than 3. This is a
positive result, and serves as a motivator for proportionately increasing the dimensions of the system. Nevertheless,
although this may seem like as simple scaling problem, there are a number of important differences that must be
taken into account.
The first aspect is that the linear approximation detailed in section 3 will be questionable because the larger
dimensions result in 2max( / ) 2.8L U� � �� . This will result in a component normal to the lateral-force in the wind
direction that will change the natural damping significantly. Note, however, that if we added a second degree-of-
freedom to the system, the periodic variation in the drag force that results from actuation could also conceivably be
used to generate energy. Characterization of such a system would require a non-linear two degree-of-freedom model
and such an analysis is beyond the scope of the present paper.
20

American Institute of Aeronautics and Astronautics
An additional aspect to consider is the Reynolds number. For a mean wind speed of 5m/s, the Reynolds
number on the cylinder will be approximately 500,000 and clearly supercritical. With supercritical flows the
separation angle moves aft on the cylinder and it is not certain that DBD plasma actuators will have the same effect
on the lateral-forces when forcing the fully turbulent separation. This limitation might be overcome by enforcing
separation, for example using spoilers, rather than attempting to control turbulent boundary layer separation. These
aspects are also beyond the scope of this paper.
Future experimental and theoretical research will address a non-linear two degree-of freedom system with
linear loads attached to the system. Initially, experiments will be performed at subcritical Reynolds numbers in order
to validate system models and assumptions. This will be followed by the study of a similar system at supercritical
Reynolds numbers where the effects of different actuation methods will be examined. The observation that the
power coefficient increases with the square-root of the system dimensions may render this technique viable for
large-scale power generation.
VIII. Conclusions
This paper described a novel approach to wind energy generation by means of flow-control-induced
vibrations. The concept was demonstrated experimentally using a one-degree-of-freedom pivoted cylindrical bob,
mounted vertically in a wind tunnel. DBD plasma actuators were used to periodically control separation at
subcritical Reynolds numbers. The effectiveness of the actuators, together with their energy efficiency at low duty
cycles and ease of application, rendered them ideal for the present investigation. The power developed by the system
was estimated by means of a linear second order model.
Static load and flowfield measurements were consistent with published data near the cylinder centerline
and the parameters found to be effective in two dimensional geometries were also effective on the low aspect ratio
cylinder. Periodic loading of the cylinder was achieved by periodic modulation of the actuator in an open-loop
manner. As expected, large amplitude oscillations were observed when the modulation frequency was close to the
system natural frequency. In contrast to natural vortex induced vibration, the large amplitude oscillations were
achieved by alternating dynamic separation and attachment of the boundary layer. Estimation of the transient loads
was performed using a system identification technique and the power generated by the system was estimated on the
basis of a piecewise linear model.
Although the power coefficients were relatively small compared to a wind turbine, the system is amenable to
up-scaling because the power coefficient increases with the square-root of the system dimensions. Nevertheless, the
linear-model assumptions invoked here are violated with up-scaling and the effects of supercritical Reynolds
numbers must be taken into account.
References 1. Bade, P., “Flapping-Vane Wind Machine,” Proceedings of the International Conference of Appropriate
Technologies for Semiarid Areas: Wind and Solar Energy for Water Supply, 1976, pp. 83-88.
2. Bernitsas, M.M., Raghavan, K., Ben-Simon, Y., Garcia, E.M.H., “VIVACE (Vortex Induced Vibration Aquatic
Clean Energy): A New Concept in Generation of Clean and Renewable Energy From Fluid Flow, Journal of
Offshore Mechanics and Arctic Engineering, Vol. 130, pp. 041101-1 to 15, 2008.
3. Blevins, R.D., “Flow-Induced Vibration,” Krieger Publishing Company, 2ed, 2006.
4. Darabi A. and Wygnanski I., “Active management of naturally separated flow over a solid surface. Part 1. The
forced reattachment process,” Journal of Fluid Mechanics, Vol. 510, 2004, pp. 105-129.
5. Darabi A. and Wygnanski I., “Active management of naturally separated flow over a solid surface. Part 2. The
separation process,” Journal of Fluid Mechanics, Vol. 510, 2004, pp. 131-144.
6. Cheng, L., Zhou, Y. and Zhang, M.M., “Perturbed Interaction between Vortex Shedding and Induced
Vibration,” Journal of Fluids and Structures, Vol. 17, 2003, pp. 887–901.
7. Corke, T.C., Post, M.L. Orlov, D.M., “SDBD Plasma Enhanced Aerodynamics: Concepts, Optimization and
Applications,” Progress in Aerospace Sciences, Vol. 43, pp. 2007, pp. 193-217.
8. Enloe, C. L., McLaughlin, T. E., VanDyken, R. D., Kachner, K. D., Jumper, E. J., Corke, T. C., Post, M., and
Haddad, O., “Mechanisms and Responses of a Single Dielectric Barrier Plasma Actuator: Geometric Effects,”
AIAA Journal, Vol. 42, No. 3, 2004, pp. 595–604.
9. Govardhan, R. and Williamson, C.H.K., “Modes of Vortex Formation and Frequency Response of a Freely
Vibrating Cylinder,” Journal of Fluid Mechanics, Vol. 420, pp. 85-130, 2000.
10. Greenblatt, D. and Wygnanski, I., “The Control of Separation by Periodic Excitation,” Progress in Aerospace
Sciences, Volume 36, Issue 7, pp. 487-545, 2000.
21
American Institute of Aeronautics and Astronautics
11. Greenblatt, D., Göksel, B., Rechenberg, I., Schüle, C., Romann, D., Paschereit, “Dielectric Barrier Discharge
Flow Control at Very Low Flight Reynolds Numbers,” AIAA Journal, Vol. 46, No. 6, 2008, pp. 1528-1541.
12. Griffin, O.M. “Vortex-Excited Cross-Flow Vibrations of a Single Cylindrical Tube,” ASME Journal of Pressure
Vessel Technology, Vol. 102, 1980, pp. 158-166.
13. Jeffery, J.R., “Oscillating Aerofoil Project,” Report from the Pocklington School Design Centre, West Green,
Pocklington, York, England, 1977.
14. Jukes, T.N. and Choi, K-S., “Flow Control around a Circular Cylinder Using Pulsed Dielectric Barrier
Discharge Surface Plasma,” Physics of Fluids, Vol. 21, 084103, 2009.
15. Klamo, J.T., Leonard, A. and Roshko, A., “On the maximum amplitude for a freely vibrating cylinder in cross-
flow,” Journal of Fluids and Structures, Vol. 21, 2005, pp. 429-434.
16. Ljung, L. (1987), System Identification: Theory for the User, Prentice Hall, Englewood Cliffs, N.J. ISBN 0-13-
881640-9.
17. McKinney, W and DeLaurier, J, “The Wingmill: An Oscillating-Wing Windmill”, AIAA Journal of Energy,
Vol. 5, No. 2, 1981, pp. 109-115.
18. Schlichting, H., “Boundary Layer Theory,” McGraw-Hill, 1979.
19. Skop, R.A. and Griffin, O.M. “On a Theory for the Vortex-Excited Oscillations of Flexible Cylindrical
Structures,” Journal of Sound and Vibration, Vol. 41, 1975, pp. 263-274.
20. Thomas,�F.O. Kozlov, A. and Corke, T.C., “Plasma Actuators for Cylinder Flow Control and Noise Reduction,
AIAA Journal, Vol. 46, No. 8, August 2008, pp. 1921-1931.
21. Williamson, C.H.K. and Govardhan, R., “Vortex-Induced Vibrations,” Annual Review of Fluid Mechanics, Vol.
36, pp. 413-455, 2004.
22. Wong, H.Y. and Kokkalis, A., “A Comparative Study of Three Aerodynamic Devices for Suppressing Vortex-
Induced Oscillation,” Journal of Wind Engineering and Industrial Aerodynamics, Vol. 10, 1982, pp. 21-29.
22