flow health: software to assess deviation of river flows
TRANSCRIPT

Flow Health: Software to Assess Deviation of River
Flows from Reference and to Design a Monthly
Environmental Flow Regime
Technical Manual and User Guide Version 2.0
Christopher Gippel, Nick Marsh and Tory Grice
International WaterCentre, Brisbane
Fluvial Systems Pty Ltd, Stockton
Yorb Pty Ltd, Brisbane
September 2012

i
Document History and Status
Version Date Issued Prepared by
1.0 8 April 2012 Chris Gippel, Nick Marsh and Tory Grice
2.0 20 September 2012 Chris Gippel, Nick Marsh and Tory Grice
Document Management
Printed Not printed
Last saved 20 September 2012
Authors Christopher Gippel, Tory Grice and Nick Marsh
Organisation International WaterCentre, Fluvial Systems Pty and Yorb Pty Ltd
Document name Flow Health Software Technical Manual
Document version 2.0
Suggested citation:
Gippel, C.J., Marsh, N. and Grice, T. 2012. Flow Health - Software to assess the deviation of river flows from
reference and to design a monthly environmental flow regime. Technical Manual and User Guide, Version 2.0.
ACEDP Australia-China Environment Development Partnership, River Health and Environmental Flow in China.
International WaterCentre, Brisbane, Fluvial Systems Pty Ltd, Stockton, and Yorb Pty Ltd, Brisbane, September.
For further information on any of the information contained within this document contact:
Fluvial Systems Pty Ltd
PO Box 49
Stockton NSW 2295
Australia
Email: [email protected]
This publication may be of assistance to you, but the authors do not guarantee that the publication is without flaw
of any kind, or is wholly appropriate for your particular purposes and therefore disclaim all liability for any error,
loss or other consequence which may arise from you relying on information in this publication.

ii
Contents
User Guide ............................................................................................................................................................. 1
Overview ............................................................................................................................................................. 1
Purpose .......................................................................................................................................................... 1
User interface ................................................................................................................................................. 2
Input data ....................................................................................................................................................... 2
Output data ..................................................................................................................................................... 3
Define input data for analysis.............................................................................................................................. 3
Reference and test data ................................................................................................................................. 3
Select a file ..................................................................................................................................................... 4
Set up input units ............................................................................................................................................ 4
Set up the reference period ............................................................................................................................ 5
Reporting start ................................................................................................................................................ 5
Set up the test period ..................................................................................................................................... 5
Time series chart zooming ............................................................................................................................. 5
View Flow Health score results ........................................................................................................................... 6
Mosaic chart ................................................................................................................................................... 6
Line chart ........................................................................................................................................................ 7
Stacked area chart ......................................................................................................................................... 7
Table .............................................................................................................................................................. 8
Environmental flow analysis................................................................................................................................ 8
Minimum monthly flow .................................................................................................................................... 9
Design flow ................................................................................................................................................... 10
Generating new data time series ...................................................................................................................... 11
Compare data ................................................................................................................................................... 12
The Shortfalls series ..................................................................................................................................... 12
Viewing data comparisons............................................................................................................................ 12
Statistical data comparisons ......................................................................................................................... 14
Haines global flow class ............................................................................................................................... 14
Global options ................................................................................................................................................... 14
Language ..................................................................................................................................................... 15
Hemisphere .................................................................................................................................................. 15
Reporting year start (water year) .................................................................................................................. 15
Report minimum monthly and design flows .................................................................................................. 15
Range of variation thresholds ....................................................................................................................... 15
Technical Manual ................................................................................................................................................ 17
Introduction ....................................................................................................................................................... 17
Background to development of Flow Health ................................................................................................. 17

iii
How Flow Health can be used ...................................................................................................................... 17
Principles ...................................................................................................................................................... 17
Hydrological effects of flow regulation .......................................................................................................... 19
Hydrological indicators, attributes and metrics ............................................................................................. 20
Scoring flow deviation according to the natural range of variability .............................................................. 20
Hydrological data .............................................................................................................................................. 21
Available flow series ..................................................................................................................................... 21
Missing flow data .......................................................................................................................................... 21
Definition of water year and seasons ........................................................................................................... 23
Sub-indicators ................................................................................................................................................... 24
The suite of nine sub-indicators .................................................................................................................... 24
High flow volume (HF) and low flow volume (LF) ......................................................................................... 26
Highest monthly flow (HM) and lowest monthly flow (LM) ............................................................................ 27
Persistently higher flow (PH) ........................................................................................................................ 28
Persistently lower flow (PL) .......................................................................................................................... 28
Persistently very low (PVL) ........................................................................................................................... 29
Seasonality flow shift (SFS) .......................................................................................................................... 29
Flood flow interval (FFI) ................................................................................................................................ 30
Flow Health Index ......................................................................................................................................... 31
Ecological significance of the sub-indicators..................................................................................................... 31
Example Flow Health calculation ...................................................................................................................... 32
Step 1: Determine reference period ............................................................................................................. 32
Step 2: Determine the water year ................................................................................................................. 32
Step 3: Establish the reference distributions and thresholds ........................................................................ 32
Step 4: Calculate flow metric scores ............................................................................................................ 35
Presentation of Flow Health scores .................................................................................................................. 38
Flow Health metrics and environmental flows ................................................................................................... 40
Setting an environmental flow regime to meet Flow Health score targets .................................................... 40
Assessing the Flow Health score of an environmental flow regime .............................................................. 42
Calculation of annual Flow Health score of an environmental flow regime ................................................... 42
Generating new data time series ...................................................................................................................... 43
Discussion ........................................................................................................................................................ 44
References ....................................................................................................................................................... 44

1
User Guide
Overview
Purpose Flow Health is an application to assist in the assessment, design and management of river flow regimes. Its main
purpose is to provide an annual score for hydrology in river health assessment, but it can also be used as a tool
to assist environmental flow assessment.
Flow Health has four main functions:
To provide an annual score for the hydrology indicator in river health assessment
Flow Health analyses a time series of river flow or water level data based on a comparison with a reference
flow series (such as data collected prior to regulation, or a modelled natural flow series). For each year of the
test data being analysed, Flow Health calculates scores for 9 pre-defined ecologically-relevant hydrological
sub-indicators, which when given a value are called flow metrics. A score of 1 is close to reference and a
score of 0 is distant from reference. The 9 metric scores are also combined to form an overall Flow Health
score for each year of record. The results are displayed in a number of different graphical forms.
To recommend a minimum monthly environmental flow regime
Flow Health automatically produces the minimum monthly flow regime that achieves a score of 1 for all flow
metrics. This regime follows the natural pattern of the reference flows, and requires a fairly high percentage of
the natural flow. Using simple slider controls, users can interactively reduce the score of some or all of the
flow metrics to tailor a monthly regime that uses less water and achieves an acceptable Flow Health score.
To test the hydrological health of any monthly environmental flow regime
Flow Health can be used interactively to design a monthly flow regime. The monthly flows can be simply set
as a proportion of the reference flow, or users can choose any value for the flow in each month. As the user
interactively adjusts the monthly flow regime using simple slider controls, the volume of water required, and
the flow metrics are continuously updated and displayed.
To generate a synthetic monthly flow time series based on the designed environmental flow regime
After designing a potential monthly environmental flow regime, a time series of monthly flow data can be
generated that has the characteristics of that regime. This can be a simple repeating series, or one that is
based on the pattern of flows that occurred during the reference period. These synthetic data series can then
be substituted in the analysis as the reference or test flow series, and the Flow Health scores recalculated.
The sub-indicators used in Flow Health were devised on the basis of their ecological relevance, and because
they characterise the way river flows are usually affected by regulation (from dams and/or diversions).
As well as metric scores, Flow Health provides basic statistics that describe the data, such as the global flow
class, mean annual flow, mean monthly flows, flow percentiles, and shortfalls in the environmental flow regime
compared to the reference flow regime.
All of the data and graphs generated in Flow Health can be exported for inclusion within reports, or the data can
be further analysed by the user.
Flow Health is a universal tool that will describe the hydrological health of any river from any part of the world.
The scores are dimensionless, so the results can be directly compared between any rivers.

2
User interface The user interface is divided into two main sections. The upper part of the interface is for defining and viewing
input data. The lower part is for viewing and manipulating results. The data you see in this User Guide are
hypothetical – they are not from a real river. Some real river data are used in the Technical Manual.
Input data
Types of data River flow or water level time series data can be analysed in Flow Health. River flow data are expressed in the
form of total volume, in cubic metres, over a day or month, or as average flow, in cubic metres per second, over
a day or month; water level data from a river, lake or wetland are expressed in metres elevation. If your water
level data are expressed in metres from sea level, and your site is at a high elevation, it is suggested to rescale
your data so that the lowest expected value in the data (such as the bed of the river or lake) corresponds to zero
elevation.
Thus, acceptable types of data are:
Flow, in either total flow volume (i.e. m3) or average instantaneous flow (i.e. m
3/s)
Water level in metres elevation (m)
Data format Input data should be daily or monthly time series. If daily flow data are input, this will be detected and the data will
be aggregated to monthly flow. The input data should be in comma separated values file type (*.csv).
The input data file should have 2 columns; the first one is for date and the other is for flow or water level data. A
header row is allowed. The date should be entered using the conventional format for your area (e.g. dd/mm/yyyy
for Australia, and yyyy/mm/dd for China, mm/dd/yyyy for U.S.A.). Flow Health will expect the appropriate data
input format according to the region setting you have nominated on your computer.

3
Note: you can find sample reference and test flow data in the directory:
//Program Files / Flow Health / Sample data
Gap filling Flow Health requires data at regular monthly intervals to perform the analysis. If gaps in the data are detected
then these are automatically filled by using the median monthly flow for that month of the year. When any gap
filling occurs a warning will be displayed at the bottom of the screen, informing you of the percentage of missing
values in each of your inputs. You can view a list of each missing value along with its assigned value in your
saved results. Use this information to determine the level of confidence you have in the results.
If dates are missing from the input data file, then these are created within Flow Health. The relevant (i.e. from
reference or test period) median monthly flow value is then assigned to each of the gaps. If there is no median
monthly value available then the value assigned will be zero.
Output data Results are output as a comma separated values (*.csv) file. This file contains the following:
A summary of the input data, including any options that were defined and gaps that were found.
Overall Flow Health scores and individual flow metric scores for each year analysed.
Minimum monthly flow results, including sub-indicator target scores, annual and monthly flow volumes.
Design flow results, including metric target scores, annual and monthly flow volumes.
Various statistics describing the reference data sample and test data sample analysed in the Compare Data function.
Each of the output figures (charts and table) can be saved. When the “save chart” link is clicked the visible output
chart or table is saved as a jpg (*.jpg) file.
Define input data for analysis
Reference and test data Reference is the benchmark against which you compare the flow data of current interest. Reference usually
refers to flow data that are unimpaired through regulation by a dam or flow diversion. If you believe that your river
was ecologically healthy at a time when it was regulated to some degree, then you can use data from that time as
the reference. It is up to individual users to justify their choice of reference.
Test refers to the data of your interest for Flow Health scoring. This might be the entire historical data record, or
perhaps just recent years. If you include the reference period in the test period, the reference period will show
high Flow Health scores, as you would expect.
The input data can comprise one or two data files. You can load more than two data files, but a maximum of two
series can be analysed at one time.
If you have one data file, it will usually be a historical flow or water level time series measured at a gauging
station. In the time series graph displayed in Flow Health this single data series is labelled “Reference – Test” in
the data chart. When you analyse this data file in Flow Health, you will nominate which part of the record you
want to use as reference.
If your flow data come from a period of time when the river was regulated by a dam or from diversions, then you
do not have any historical reference data. This will not prevent you from undertaking a Flow Health analysis. In
this situation, you could, externally from Flow Health, generate a reference flow data series for your site using a
rainfall-runoff model (i.e. a modelled natural flow time series). This task is will require hydrological expertise and

4
rainfall data. Alternatively, you could generate a synthetic reference flow data file within Flow Health. The series
generated within Flow Health will not simulate the natural flow series. Rather, it will represent a repeating pattern
of monthly flows that you have designed. You will need to have some idea of what would represent a reasonable
pattern of reference flows in your river.
If you have two data files, they will usually be:
1. A test data file that is either:
o a historical flow or water level time series measured at a gauging station, or
o a modelled flow or water level time series for a given scenario (such as current river operation,
planned future operation, and perhaps also including a climate change scenario)
2. A reference data file that is a modelled natural flow time series (i.e. assuming no regulation, and
perhaps also including a climate change scenario).
In this situation, you will nominate which file is “Test” and which is “Reference” and these labels will appear in the
legend of the data chart. You can characterise reference hydrological conditions on the basis of all, or a chosen
period, of the reference data series.
Select a file The Select a file link allows you to browse your computer files to find the
data files you want to load. When you load the first file, on the data time
series chart it is sub-titled “Reference – Test”. When you load the
second file, it is not automatically assigned as Reference or Test. To
assign or re-assign the loaded files as Reference or Test, choose from
the drop down menu on the data file legend in the data time series chart.
The drop down menus on the data time
series chart legend also allow you to
Hide/Show, Remove, or Save… a data file
(which you would use if you generate a new
flow series within Flow Health).
Set up input units When inputting data, you will need to define
whether the data are Average flow rate
(m3/s), Total flow per period of time (m
3) or
water Level (m).
Next, define the scientific notation, or power
of ten, of the data (i.e. 1, 103, 10
6 or 10
9).
Flow Health will adjust your data depending
on the notation that you define. All input
data must be of the same input units and
the same scientific notiation for a given
analysis.

5
When you select the input units (Total or Average), a pop up dialog
might ask if you also want to report the results of the Flow Health
analysis in the same units. The reporting units can also be selected in
the Options menu (the link is on the upper right of the main interface
window). The pop up window will appear if the setting in the Options
menu is different to the one you are selecting in Input units. Your
choice does not alter the way Flow Health works; it is purely a matter
of user preference for how you would prefer the results presented (this
can also be changed in the options menu).
Set up the reference period You can define a specific period of the data series to use as
the reference for comparison with the test data. If the input
reference data file is modelled natural flows, then normally the
entire time series would be used. If the data file is historical
measured flows, select the start and end years of the period
when the river was unregulated, or had little regulation. The
start year will normally be the first year. Select the start year
and end year from the drop down lists.
The minimum allowable length of the reference period is
10 years. This prevents defining the reference flows on the
basis of a short and possibly unrepresentative data series. A
warning dialog will appear if you accidentally try to select a
reference period that is shorter than 10 years.
Reporting start The reporting start is the start of the water year as determined based on the setting in Options. By default the
water year start is the start of the dry season whereby the dry season is determined by considering the 6-monthly
moving average. If the Reporting start is October this means that the median across all years for the six month
period (October-March) is lower than the median flow across other 6-month periods.
Set up the test period Select the start year for the period from the drop down list. Do the same for the end year. This simply selects the
years that Flow Health scores will be reported. Normally the entire data series is selected.
Time series chart zooming The two time series charts (one on the main data input window, and one on Compare data) can be zoomed by
holding down the left mouse button and dragging the mouse diagonally to select part of the chart. Scrolling the
mouse will zoom in and out of the chart centred on the mouse location. Holding the right mouse button and
dragging will pan the chart. Double clicking the mouse (left or right buttons) on the chart will return it to its original
scale.

6
View Flow Health score results The lower half of the Flow Health interface window comprises seven tab headers. The first four of these tabs are
associated with viewing Flow Health score results in different ways. Click the tabs to navigate between the
different views.
The Flow Health scores represent a comparison of the characteristics of the flows in each year of the test series
with the characteristics of the flows over the reference period. The flows are characterised in terms of nine sub-
indicators, with each relating to a distinctive ecologically-relevant hydrological characteristic. The sub-indicators
characterise aspects of very low flows, low flows, high flows, flow seasonality and the interval between flood
flows. Each sub-indicator is identified by a descriptive label and an acronym. The metrics measure the deviation
in the sub-indicator between each test year and reference.
Although the descriptive labels of some of the sub-indicators contain the word ‘flow’, they can also be applied to
water level data. However, some sub-indicators may be of less relevance to lake and wetland levels than they
are to river flows. For example, the Flood Flow Interval (FFI) indicator characterises the length of time between
floods, and this might be unimportant for lakes.
For more information on how the metrics are calculated, see the technical section of this Manual.
Mosaic chart The Mosaic chart displays the annual Flow Health and flow metric scores for each test year in 5 classes of
deviation. Each class is represented as a colour. The mosaic chart gives an immediate visual impression of the
historical hydrological conditions of a river, even to non-hydrologists and river specialists.
Move the mouse over any of the ‘mosaic squares’ to view the exact score for that flow metric and year. The year
against which the scores are recorded is the calendar year in which at least 6 months of the water year fall, or the
calendar year of the end month for a July start. For example if the water year commences in July, then the score
attributed to the July – June water year will appear against the year in which the water year ends. If the water
year commences in say February, then the reporting calendar year is the year in which the water year starts. This

7
change in reporting year for different water year start months is to reflect the general assumption that the
calendar year associated with reporting have most of its months considered in that reporting year.
Line chart The Line chart displays the time series of flow metric scores for each test year. You can turn particular sub-
indicators on and off using the checkboxes to the left of the graph.
Stacked area chart The Stacked area chart is another way of displaying the time series of flow metric scores. Each coloured area
represents the accumulated flow metric scores for each test year, to give the combined Flow Health score.

8
Table The Table tab lists the Flow Health metric scores over each test year. You can re-sort the table from low to high
according to any column by left clicking on the column header. Another click will re-sort the table from high to low
for that column.
Environmental flow analysis While the primary purpose of Flow Health is to provide a hydrology index score for application to river health
assessment, it can also be used to generate and test environmental flow regimes, to estimate the volume of
water required to implement the regimes, and to estimate current shortfalls in the required volumes. Flow Health
can be used in the same way to generate and test lake and wetland water level regimes, but for this application,
volumes cannot be estimated.
It is important to recognise that environmental flow regimes generated entirely within Flow Health are based only
on hydrology, although the hydrological sub-indicators do have conceptual ecological relevance. There are many
instances where limited expertise, time or funding prevents a detailed environmental flow assessment being
undertaken. In these cases, Flow Health can quickly generate a preliminary regime that can be implemented as
an interim measure to provide a level of environmental protection.
The environmental flow design functions can be found on the Minimum monthly flow and Design flow tabs on the
lower half of the Flow Health interface window. Click the tabs to navigate between these two different ways of
generating or testing an environmental flow or water level regime.
The Minimum monthly flow method derives the environmental flow regime on the basis of achieving certain
target scores for the 9 flow metrics or overall Flow Health score. The highest target is a flow regime that scores 1
on every flow metric. This would represent a very low risk environmental flow regime, but the user can select
lower targets that require less water, but which carry higher environmental risk.
The Design Flow method derives the environmental flow regime on the basis of achieving a certain percentage
of the mean reference flow for each month. Alternatively, the user can select any values for the monthly flows
(perhaps values derived by a different method), and then check to see what scores this regime achieves for the
flow metrics.
Note: At this stage of the development and application of Flow Health, we cannot associate particular flow metric
scores with corresponding levels of ecological risk. In rivers with unregulated flow regimes, the annual Flow
Health score normally varies over the range 0.8 – 1.0, but a river with an average Flow Health score lower than
0.8 could still be regarded as healthy. There is no universally acceptable target level of river health, so users will
need to set target Flow Health scores on the basis of local considerations.
9
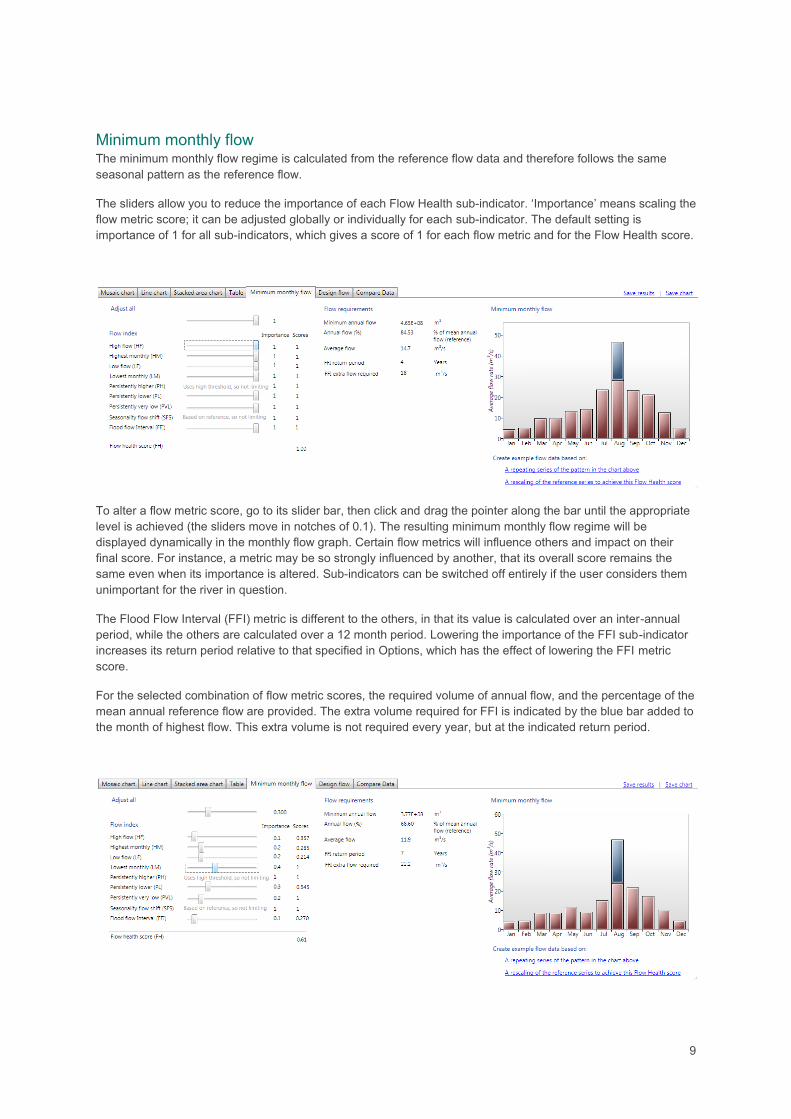
Minimum monthly flow The minimum monthly flow regime is calculated from the reference flow data and therefore follows the same
seasonal pattern as the reference flow.
The sliders allow you to reduce the importance of each Flow Health sub-indicator. ‘Importance’ means scaling the
flow metric score; it can be adjusted globally or individually for each sub-indicator. The default setting is
importance of 1 for all sub-indicators, which gives a score of 1 for each flow metric and for the Flow Health score.
To alter a flow metric score, go to its slider bar, then click and drag the pointer along the bar until the appropriate
level is achieved (the sliders move in notches of 0.1). The resulting minimum monthly flow regime will be
displayed dynamically in the monthly flow graph. Certain flow metrics will influence others and impact on their
final score. For instance, a metric may be so strongly influenced by another, that its overall score remains the
same even when its importance is altered. Sub-indicators can be switched off entirely if the user considers them
unimportant for the river in question.
The Flood Flow Interval (FFI) metric is different to the others, in that its value is calculated over an inter-annual
period, while the others are calculated over a 12 month period. Lowering the importance of the FFI sub-indicator
increases its return period relative to that specified in Options, which has the effect of lowering the FFI metric
score.
For the selected combination of flow metric scores, the required volume of annual flow, and the percentage of the
mean annual reference flow are provided. The extra volume required for FFI is indicated by the blue bar added to
the month of highest flow. This extra volume is not required every year, but at the indicated return period.

10
Design flow Design flow allows you to specify any flow regime by inputting a flow for each month (perhaps using a regime
determined by an entirely separate environmental flow assessment process) and it will interactively show the
Flow Health score of your chosen flow regime.
The default Design flow regime is calculated from the reference flow data. It is the mean flow for each month,
which will normally score 1 for each flow metric. This regime follows the same seasonal pattern as the reference
flow and requires 100 percent of the mean annual reference flow (more than 100 percent if you include a flood
flow).
If a flow regime is required that has the reference seasonal pattern, but which uses less water than the natural
flow regime, then the top slider bar can be used to reduce the proportion of the reference flow. All the monthly
flows will reduce as a fixed proportion of the reference mean annual flow. The FFI slider adjusts the return period,
and must be adjusted separately.
A specific flow can be set for any month by using the slider bar for that month.
Right click on the slider bar of any month for additional options for controlling the values for each month. One
possibility is to enter a specific flow value for each month from your keyboard. It is suggested you then lock these
values, otherwise they will reset if you use the ‘Proportion of annual flow’ slider bar.
The flow value for any month can be locked on its current value, or it can be set as a minimum or maximum. This
can be done for any number of months in any order. The locking, minimum and maximum functions are used
together with the ‘Proportion of annual flow’ slider bar. As the slider bar is moved, the flows for the months with
locked flows will either remain unaltered (or be interpreted as minimum or maximum flows), while the flows for the
unlocked months will vary. This function is used when you have specific flows in mind for certain months, but the
flows for the other months can or should follow the natural seasonality. Right click on the slider bar of any month
to unlock its value.

11
Changing the reporting units in the Options menu will cause all the monthly flow slider bars to reset. So, it is
suggested that you choose your preferred reporting units before you begin to design a flow regime.
Generating new data time series Underneath the charts displayed in the Design flow and Minimum monthly flow tabs you will find two links that are
used to create new time series data. When you click on either of these a time series is generated that then
appears in the main data display window, along with the original input data series.
A repeating series of the pattern in the chart above creates a simple time series that looks exactly like the annual
one you have designed, repeating over the length of the input data time series that you have nominated as the
reference time series. The FFI event will appear in the sequence with the return period that you have specified.
A rescaling of the reference series to achieve this Flow Health score creates a synthetic time series that has the
properties of the Flow Health regime that you have designed, but which is sensitive to the pattern of flows that
occurred in the reference time series. This simulates how the environmental flow regime might appear if it is
implemented in a river that is also under the influence of natural inflows. For example, the required high flows
occur in the months that were historically months of high flow. This synthetic data series will only be generated
over the length of the reference period that you have nominated using the date pickers.
After generating a new data series there are a number of ways that you might use it:
Save the data series and utilise it for another purpose outside of Flow Health.
Substitute the original reference data file, or reference period, with the new data series that you have
created (use the drop down menu in the legend of the main data display). The flow metric scores for the
test data will be recalculated (displayed in the mosaic, line or stacked area charts) against this new
reference series. This would be used in situations where you want to specify the reference using an
environmental flow regime of your design, rather than pre-regulation reference data. It is a way of
checking the performance (or compliance) of the historical river flows relative to the standards of an
environmental flow regime that you have designed.
Substitute the original test data file with the new data series that you have created (use the drop down
menu in the legend of the main data display). The flow metric scores for the new test data will be
recalculated (displayed in the mosaic, line or stacked area charts) against the original reference series.
This is a way of simulating implementation of the environmental flow regime that you have designed and
checking how it would perform relative to the standards of the pre-regulation reference flows.
If you began with a historical data series that lacked a period when flows were unimpaired by regulation
you can use expert opinion and other information in Design flow to create an ideal environmental flow
regime. Then generate a simple flow series for the length of your reference series. This can now be
used as the reference series against which you measure the hydrological health of the historical flows.
You can also design alternative environmental flow options that use less water, and then check the
performance of these relative to the original ideal environmental flow regime.

12
Compare data The Compare data function is used to examine statistical properties of the original or generated data time series
additional to the flow metric scores.
The Shortfalls series The Compare data function examines three data series. One is the Reference series and one is the Test series,
as selected in the main data display legend, with the length of each selected on the date pickers on the top half of
the Flow Health interface. The third series is a new series called Shortfalls. Shortfalls is the Reference monthly
flow series minus the Test monthly flow series, with only shortfalls being counted (surpluses are given the value
zero). The length of the Shortfalls series corresponds to the period of time where the Reference and Test series
overlap. If there is no temporal overlap, the Shortfalls series cannot be created.
Viewing data comparisons The three data series considered in Compare data can be viewed in two different forms. One is a time series
display, which works the same way as the main data display. Use the mouse to zoom into the chart to show the
detail of particular periods of interest. The second display shows the monthly averages of the three series, with
the averages calculated over the periods you have nominated in the date pickers on the top half of the Flow
Health interface.
By substituting different environmental flow time series that you have generated into the Reference series, you
can check the performance of the historical flow series against these different standards. On the monthly
averages chart, the average Shortfalls for each month are not simply the difference between the averages of the
Reference series and the Test series. This is because the Shortfalls do not include surpluses, when the Test
flows exceed the Reference flows. From the environmental flow perspective, flows that are less than desirable
are of concern, while those that exceed the targets are considered a bonus that does not cancel out the negative
impacts of flows that are lower than desirable.
The Monthly averages chart shows in which months there is likely to be a problem in meeting environmental flow
targets. The Surplus values indicate, for the historical flow series, how much additional water would have been
required in order to meet the environmental flow targets.

13
14
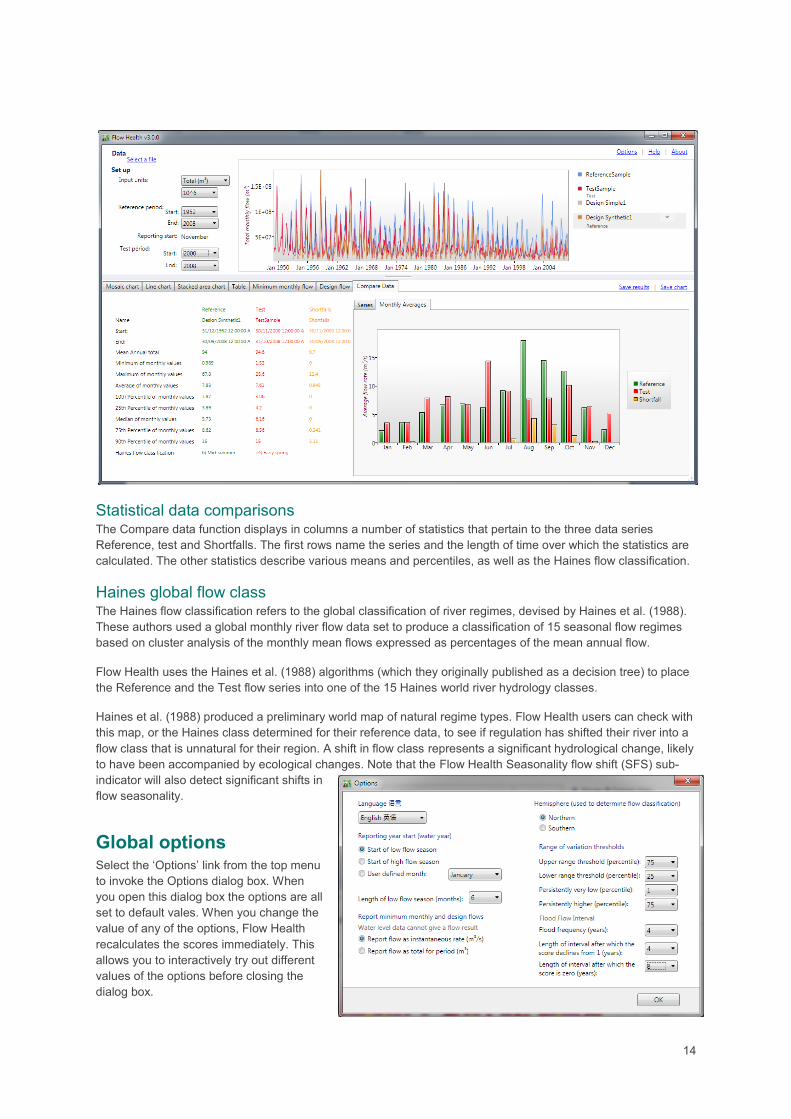
Statistical data comparisons The Compare data function displays in columns a number of statistics that pertain to the three data series
Reference, test and Shortfalls. The first rows name the series and the length of time over which the statistics are
calculated. The other statistics describe various means and percentiles, as well as the Haines flow classification.
Haines global flow class The Haines flow classification refers to the global classification of river regimes, devised by Haines et al. (1988).
These authors used a global monthly river flow data set to produce a classification of 15 seasonal flow regimes
based on cluster analysis of the monthly mean flows expressed as percentages of the mean annual flow.
Flow Health uses the Haines et al. (1988) algorithms (which they originally published as a decision tree) to place
the Reference and the Test flow series into one of the 15 Haines world river hydrology classes.
Haines et al. (1988) produced a preliminary world map of natural regime types. Flow Health users can check with
this map, or the Haines class determined for their reference data, to see if regulation has shifted their river into a
flow class that is unnatural for their region. A shift in flow class represents a significant hydrological change, likely
to have been accompanied by ecological changes. Note that the Flow Health Seasonality flow shift (SFS) sub-
indicator will also detect significant shifts in
flow seasonality.
Global options Select the ‘Options’ link from the top menu
to invoke the Options dialog box. When
you open this dialog box the options are all
set to default vales. When you change the
value of any of the options, Flow Health
recalculates the scores immediately. This
allows you to interactively try out different
values of the options before closing the
dialog box.

15
Language The text in the interface is available in English or Chinese. To change the interface language, select an option
from the Language drop down list.
Hemisphere Hemisphere refers to the location of the river being assessed. It is used only in the Haines global flow
classification.
Reporting year start (water year) In Flow Health, the year is automatically divided into a low flow and a high flow season, with both being 6 months
long. This is done on the basis of the natural seasonal pattern of flows in the reference period. You can change
the way the reporting year is determined, by nominating to use the start of the low or high flow season, or a
specific month as the start of the water year. If a specific month is defined, then the ‘Length of low flow season
(months)’ can also be specified. The default setting is to start the water year with the low flow season.
Report minimum monthly and design flows This option allows you to decide whether your results are displayed as a total volume (m
3) for the period or as an
average instantaneous rate (m3/s). The selected option will apply to all results in the ‘Minimum monthly flow’ and
‘Design flow’ tabs, except for the annual flow total, which is always given as a volume.
Range of variation thresholds Range of variation thresholds are applied to the reference flow and are used to calculate the Flow Health sub-
indicator metric scores. Different thresholds are applied to the Persistently very low (PVL) and Persistently higher
(PH) sub-indicators. The upper and lower thresholds for the other sub-indicators are applied globally.
The default settings for the basic upper and lower thresholds of the range of variation are the 75th
and 25th
percentiles. This means that if a flow attribute for a test year falls within this range of variation as defined for the
reference period, the sub-indicator score is 1. So, broadening the range of variation will give more scores of 1,
while narrowing it will give more scores less than 1.
In most circumstances, the range of variation thresholds should be left on the default settings. If the ranges of
variation are altered, then the resulting scores will not be comparable with the results from another river where
the default settings were used. If the range of variation settings are altered for a particular case, then this should
be noted when reporting the results.
To change a range of variation, select a percentile value from the associated drop down list to change the
threshold.
The Flood flow interval (FFI) range of variation thresholds are different to those for the other sub-indicators. This
metric is not calculated on the basis of the reference distribution of the intervals between flood flows of a given
frequency, but on the basis of a fixed interval. The reason for this is that in many cases the reference distributions
would be too short to reliably characterise the distribution of the intervals. Thus, in the Options dialog, first select
the flood frequency, which corresponds with flood recurrence interval in years. Then select the maximum interval
in years. After a flood occurs, the interval between the next flood begins counting. The score will remain on 1 until
the maximum interval is reached. After that, the score will begin to decline.
The FFI frequency of interest is site specific. The default frequency of every 4 years should be a reasonable
indicator of floods high enough to inundate most floodplain wetlands, and to re-shape channel morphology.
However, there is no certainty that a 4 year recurrence interval for monthly data corresponds to a 4 year
recurrence interval for instantaneous flow data. The statistical relationship between monthly peak flows and
instantaneous peak flows should be investigated for the river in question. This, plus knowledge of the flood peak
magnitude required to inundate the wetlands of interest, will help you set the appropriate flood frequency for FFI.
The “Length of interval after which the score declines from 1” is the interval that you deem to be the longest
tolerable by the wetland ecosystem before it suffers degradation. This interval might be the same as the
recurrence interval (appropriate in rivers with low variability of flood flows), or longer than the recurrence interval
(perhaps appropriate in rivers with high variability of flood flows). The “Length of interval after which the score is

16
zero” is the interval (from the last flood) where you deem the environmental benefits from that flood to no longer
provide any further benefit. For example you may expect that that benefits from a flood may continue at a high
level for say 4 years after a flood, and then decline to a FFI score of zero after a further 4 years, in which case
the length of interval after which the score is zero would be 8 years.

17
Technical Manual
Introduction
Background to development of Flow Health Flow Health software was developed on the basis of research undertaken by the International Water Centre in
2009 – 2012 for the Australia China Environment Development Program (ACEDP) River Health and
Environmental Flow in China Project. The ACEDP was a five-year, Australian Government, AusAID initiative with
the objective of supporting and improving policy development in China in the area of environmental protection
and natural resources management. Information and downloads concerning the ACEDP River Health and
Environmental Flow in China Project can be obtained from www.watercentre.org.
As part of the ACEDP River Health and Environmental Flow in China Project, Gippel et al. (2011) undertook work
to develop and trial methods suitable for characterising the hydrology of rivers in China (and elsewhere) in a way
that has direct meaning for ecological health, and in a way that offers advice to river managers on how to
manage flows to achieve improved river health, as necessary. The methods were applied to stations in the Gui
River (Pearl River Basin), Taizi River (Liao River Basin) and lower Yellow River (Yellow River Basin) catchments.
To overcome demonstrated limitations of existing approaches, the Index of Flow Deviation (IFD) was developed
by Gippel et al. (2011) as a way to measure flow alteration based on comparison with pre-regulation monthly flow
data. The IFD was designed to work with monthly historical flow data because in China it is often difficult to obtain
daily flow records, and not many locations have modelled flow data available. When the IFD concept was
developed as a software application, it was renamed Flow Health.
How Flow Health can be used Flow Health is an application to assist in the assessment, design and management of river flow regimes. Its main
purpose is to provide a score for the hydrology indicator in river health assessments, but it can also be used as a
tool to assist environmental flow assessment. Flow Health uses river flow time series data, and it can also use
water level data from rivers and lakes. This Technical Manual does not refer to the use of water level data, but
the same principles apply.
Flow Health is based on the concept of comparing the values of certain ecologically-relevant, hydrological
attributes of a river in a reporting year with the distributions of the values of the attributes under reference
conditions. The reference conditions are specific to each hydrology station. Reference is normally a period of
time when the river was unaffected, or relatively unaffected by human disturbance. The major relevant human
disturbance is a large dam constructed in the catchment somewhere upstream of the hydrology station. In the
Flow Health method, reference is derived from a period of hydrological record collected prior to large dam
construction, or from a time series of modelled natural flows.
The Flow Health metrics are sensitive to the common impacts of flow regulation on hydrology, and are also
sensitive to periods when flows are naturally much lower than usual. Both of these hydrological conditions are
important determinants of ambient ecological health.
Principles The underlying principles that guided development of Flow Health were:
Indicators should relate as closely as possible to the basic flow components of a natural flow regime
(Figure 1):
o cease-to-flow
o low flow period and high flow period baseflows
o high flows
o timing (seasonality)

18
Figure 1. The main ecologically relevant flow components.
Indicators should be intuitive, in the sense that each indicator should be associated with a readily
perceptible aspect of the flow regime that is generally regarded as of key importance to ecosystem
health
The reference is derived from the test river itself, preferably from pre-regulation data. An arbitrary
regionally- or nationally-universal standard is not being sought
The indicators should measure the deviation in hydrological characteristics relative to the natural
(expected) variation in those characteristics in the test river itself, which will allow the indicator scores to
be compared between rivers of different sizes and located across different regions
It must be possible to calculate an annual score
The indicators must be applicable to the situation where the available data are limited to monthly
historical time series, but modelled reference hydrology can be utilised if available
Indicators should be applicable to non-concurrent data to allow the comparison of measured before and
after regulation flow data.
Indicators should be easy to calculate using freely available software.
Non-parametric statistics are preferred over parametric statistics, to suit the typical non-normal
distribution of hydrological data
Once the scoring system has been set (which may be specific to each river health program), calculation
of the scores must not involve any subjective decision making on the part of the operator
Indicator scores should be scaled over the range 0 – 1, so that the hydrology indicator scores can be
readily compared with scores from other types of river health indicators
The suite of indicators should be parsimonious (as few as possible to characterise the flow regime in a
way that is meaningful to river managers and the public)
It must be possible to combine all or some of the individual indicators scores to achieve an overall
hydrological index score
The literature contains hundreds of hydrological attributes that ostensibly have ecological relevance. For example,
Growns and Marsh (2000) defined 333 attributes, and Kennard et al. (2010) used 120 attributes as the basis for
hydro-ecological classification of Australia’s rivers. The Indicators of Hydrologic Alteration (IHA) is a software
program developed by The Nature Conservancy that examines 33 IHA parameters and 34 Environmental Flow
Component (EFC) parameters (Richter et al., 1996; Richter et al., 2006). Other examples of ecologically relevant
hydrological attributes can be found in Hughes and James (1989), Clausen and Biggs (1997) and Puckridge et al.
(1998).
The development of Flow Health did not begin with the premise that the many previously described attributes
were deficient in characterising flow regimes. However, most of them are unsuitable for the purposes of Flow
Health for three main reasons:
Low flow season
baseflows
High flow season
baseflows
Large flow events
Moderate and small
flow events
Possible cease to flow events
Natural seasonality

19
(i) most of them are attributes that are exclusive to daily flow series, while Flow Health was designed
to work with monthly data,
(ii) many of them have dimensions and are sensitive to the flow type, while Flow Health metrics were
designed to work on, and be comparable between, rivers from any part of the world and of any size,
and
(iii) most of them are expressed as absolute values, while Flow Health uses metric values that describe
the degree of deviation from a reference condition.
The requirements that Flow Health work with monthly data, and report an annual score (and thus be based on
only 12 data values), place a major limitation on the potential number of statistics that can be used to
characterise a flow regime.
Hydrological effects of flow regulation Dams are usually built for the purposes of flood control, water storage (and subsequent release for supply, mainly
to irrigators), water diversion (where water is taken directly from the reservoir) and hydropower production. While
some hydropower dams are run of the river, many have some storage capacity. The different ways these types of
dams are operated means that they have different impacts on the river downstream (Figure 2). Many modern
dams are multipurpose, so they impact the hydrology of rivers in a range of ways (see Graf, 2006; Richter and
Thomas, 2007).
Figure 2. Typical ways that regulation impacts the hydrology of rivers.
Flood control dam
Water storage and supply dam
Water diversion
•Reduced high flow peaks
•Increased interval between flood peaks•Reduced high season flow volume
•Persistently higher flow in low season
•Reversal of flow seasonality
•Reduced high flow peaks
•Increased interval between flood peaks•Loss of small to moderate-sized floods
•Seasonal redistribution of flows
•Reduced high flow peaks
•Increased interval between flood peaks•Reduced high season flow volume
•Reduced low season flow volume
•Persistently lower flows in low season•Increased incidence of very low flows
Pre-regulation
Post-regulation

20
Hydrological indicators, attributes and metrics Flow Health calculates an overall hydrological indicator score for each year called the Flow Health score. This is
derived from 9 different hydrological sub-indicators that characterise attributes of the flow regime. These
attributes were selected to characterise the typical hydrological impacts of flow regulation (Figure 2) in terms of
the main ecologically relevant flow components (Figure 1).
A flow metric score for each sub-indicator is derived by comparing the value of the attribute in the test year
against the value it would be expected to take in the reference period, or under reference conditions.
Scoring flow deviation according to the natural range of variability River flows naturally vary about a mean condition, so any definition of the conditions suitable for ecosystem
health must include a range of normal variability. The Range of Variability Approach (RVA) (Richter et al., 1997)
identifies annual river management targets based on a natural range of variation in hydrological attributes. The
range could be defined by a standard range, such as ±1 standard deviation from the mean, 25th
to 75th percentile
(inter-quartile) range, or 16th
to 84th
percentile range (the range that includes 68 percent of values, as does
±1 standard deviation from the mean). The RVA method prescribes that flow regime characteristics should lie
within the targets for the same percentage of time as they did prior to regulation.
As a basic standard for any hydrological attribute, Flow Health adopts the inter-quartile range (25th
to 75th
percentile) within the natural flow series as the range within which the hydrological health score is 1 (over the
range 0 – 1). While the inter-quartile range is the default range of variation in Flow Health, users can select other
percentiles to define the upper and lower bounds of the range of variation. Deviations in an attribute beyond the
defined range potentially score less than 1 (depending on how deviations are scored).
In Flow Health, the 25th percentile reference flow (or other percentile, if selected by the user) for each month is a
critical threshold. The ecological significance of the 25th percentile statistic has not been tested, but it has been
utilised by others in the context of environmental flows. In the Texas Consensus Three-Zone Concept for setting
environmental flows (Mathews and Bao, 1991; Texas Parks and Wildlife Department, 2003; Gordon et al., 2004),
the middle flow zone, where the objective is to provide for minimum ecological maintenance, the natural monthly
25th
percentile flow is maintained. In a study of the Jiaojiang in Zhejiang Province, China, Gippel et al. (2009)
noted, for daily flows, a close correspondence between the 25th
percentile flow and the 50th
percentile baseflow
(separated from total flow using a recursive digital filter and assuming flow as strongly baseflow when the
baseflow index exceeded 0.9). The same observation was made in an environmental flows study of the Taizi
River (Gippel et al., 2011). Thus, the 25th
percentile flow may approximate the median baseflow conditions, which
would make it a reasonable basis for baseflow recommendations under average hydrological conditions.
The weighting of Flow Health scores when the attribute value deviates outside the reference inter-quartile range
is subjective. The default weightings were set according to expert judgement. It was reasoned that the weighting
should be different for the high flow and the low flow periods. Regulation by dams normally involves storing river
flows in the natural high flow season and either releasing the stored flows to the river downstream, or transferring
the water out of the river system, in the natural low season (Figure 2). This results in the typical hydrological
impacts of reduced flows in the high flow season, and either sustained increased or sustained decreased flows in
the low flow season. The consequences for the ecosystem of reduced flows in the low flow and high flow
seasons are well studied and known to be significant, so the metric scores for reduced attribute values were set
to vary linearly over the range 0 – 1 for attribute values in the range 0 – 25th
percentile in the reference
distribution (Figure 3). Observations of higher than expected flows in the high flow season would not normally be
associated with regulation, but with naturally occurring high precipitation events (which would occur despite
regulation), so such deviations did not attract a reduction in the score from 1. On the other hand, in a regulated
river, observations of sustained higher than expected flows in the low flow season would likely be associated with
flow releases from a dam to supply irrigation, domestic and industrial water downstream. Such higher than
natural flows may well have a negative impact on ecosystem health, but this impact was judged to be of lower
severity compared to the impact of a reduction in flows of the same order (Figure 3). Thus, the scoring system
was weighted according to the assumptions that: (i) flow reductions were more detrimental to river health than
flow increases, and (ii) occasional increased flows in the high flow season were not detrimental to river health
(Figure 4).

21
The general equations used for calculating the scores are (Figure 3):
Percentile in attribute reference distribution in the range: 25th percentile to 75
th percentile
(1)
Percentile in attribute reference distribution in the range: > 75th
percentile
(2)
(3)
Percentile in attribute reference distribution in the range: < 25th
percentile
(4)
Hydrological data
Available flow series Characterisation of flow alteration is usually with respect to regulation by dams and flow diversion, although
hydrology can also change in response to climate and land use change. In some places it is standard practice to
compare modelled impaired (regulated) data with modelled unimpaired (unregulated) data, which reflects the
wide availability of modelled data. Where modelled data are unavailable, it is acceptable to compare gauged pre-
regulation data with gauged post-regulation data.
Modelled data represent: (i) the current level of water resources development (“current series”), and (ii)
conditions unimpacted by water resources development (“reference series”) (Figure 5). These time series are
modelled on the basis of gauged data, modelled runoff, and knowledge of water diversions and dam operation. In
comparison to these two modelled time series, in a regulated river, the gauged historical data generally show a
pattern of decreasing flow through time (Figure 5).
In some countries, including China, modelled flow data are not widely available, and where such data series are
available they are usually limited to modelled reference at a monthly time-step. Also, while flow might be gauged
at many locations, daily data can be more difficult to source than monthly data. For these reasons, Flow Health
was deliberately devised to work with monthly historical data series. The reference hydrological conditions are
defined for a user-defined period of the historical record. If a modelled monthly reference time series is available,
it can be used within Flow Health as an alternative way of defining the reference hydrological conditions.
Missing flow data Calculation of Flow Health scores relies on comparison of distributions of data, so in most cases, missing data
does not prevent its application. Three of the sub-indicators are based on the occurrence of sequences of flow
above or below particular thresholds. For these sub-indicators, missing data interrupts the sequence, and the
sequence begins again when the data resume. This would introduce an error if in fact the flow sequence was
continuous. Thus, Flow Health software infills missing data with median monthly flows from the reference period
(for gaps in the reference series) or test period (for gaps in the test series). Infilled data are identified in the output
so that users can decide whether the results from certain years should be ignored or not.

22
Figure 3. Relationships used to convert attribute percentile in the reference distribution to attribute scores (Flow Health metric scores). Different relationships apply to low and high flow seasons for
percentiles > 75th
. Metric scores fall into five classes of deviation from the natural range of variation.
Figure 4. Generalised illustration depicting the principle of how the values of hydrological attributes in the reporting year are scored relative to the distribution of the attribute values in the reference period, to
give scores for the Flow Health metrics.
0.0
0.2
0.4
0.6
0.8
1.0
0% 25% 50% 75% 100%
Att
rib
ute
sco
re
Attribute percentile in reference distribution
Low f low season High f low season
Very large deviation
Large deviation
Moderate deviation
Small deviation
Very small deviation
75th
percentile25th
percentileMaximumMinimum
Fre
qu
en
cy o
f o
bs
erv
ati
on
s
in r
efe
ren
ce p
eri
od
75th
percentile25th
percentileMaximumMinimum
Fre
qu
en
cy o
f o
bs
erv
ati
on
s
in r
efe
ren
ce p
eri
od
High flow season hydrological attribute value
Low flow season hydrological attribute value
V large V small
Deviation from reference range of variation
SmallModerate
LargeVery small
Reference range
of variation
Small

23
Figure 5. Hypothetical time series of a flow attribute (e.g. annual, monthly or daily flow), showing the difference between modelled reference, modelled current and gauged historical series. In this
hypothetical case there is a sudden increase in the degree of flow regulation due to dam construction, followed by a gradual increase in the degree of regulation through time.
Definition of water year and seasons Before computing annual statistics it is necessary to decide the water year. The water year does not necessarily
coincide with the calendar year (beginning in January), although many hydrological statistics, such as rainfall
totals, are reported for the calendar year. Hydrological statistics relevant to industry, such as water allocations
available for irrigation, might be conveniently reported for the financial (or fiscal) year (beginning in July in
Australia and New Zealand). However, in most hydrological applications, it is preferable to use the interval known
as the “water year” or “hydrological year”. The main reason for using the water year is to avoid splitting the high
flow season between consecutive years, in which case the month with the lowest mean discharge may be the
ideal start of the water year (Gordon et al., 2004, p. 69). From the perspective of suitability of flows for ecosystem
health, the high flow and low flow seasons are considered to be of equal value, so it is desirable to fully contain
the low flow and the following high flow season within a single 12 month period. Thus, for a river health
hydrological index the water year ideally begins on the first month of the low flow season. This is the default
assumption in Flow Health
The high flow and low flow hydrological seasons may not coincide with the seasons used by authorities for
managing water allocations, the local agricultural seasons, or the local climate (temperature and rainfall) seasons.
The pattern of rainfall throughout the year can vary widely within a country, and the beginning of the low and high
flow seasons would be expected to vary regionally, and perhaps within river basins. The life cycles of the aquatic
biota will be adjusted to the local hydrological seasonality, so it is important to define the water year for each
gauge, using a systematic method.
Flow Health offers three options for defining the start of the water year:
User defined month
Start of the low flow season
Start of the high flow season
In some cases the user might have a good reason for selecting a particular start month. For example, an agency
might find it desirable to use the period established for other reporting purposes, or to fit within clearly defined
operational periods, such as the irrigation water supply period.
Flo
w p
ara
me
ter
Time (with increasing level of water resources development)
Gauged historical Modelled current Modelled reference
Dam
"Reference"
"Historical pre-dam" "Historical post-dam"
"Current"

24
In Flow Health, the water year concept applies to the natural seasonality of the river, so is determined on the
basis of reference hydrology data. The year is split into two seasons, the high flow season and the low flow
season. The user decides if these seasons are of equal length, or of specific lengths, by selecting the length of
the low flow season (the default is 6 months, for equal season lengths).
The method for calculating the start month of the low flow season involves summing the seasonal flows (i.e.
periods of 6 consecutive months) over the reference period using different start months. For each start month,
the median of the seasonal totals of all the years in the reference period is calculated. The start month with the
lowest median is deemed the low flow season start month. For example, at Corowa, a gauge on the River Murray,
Australia, the reference period is from 1910 when gauging began to 1935, just before Hume Dam was completed
(Figure 6). Over those 26 years, of all the six-month long periods, the period January to June had the lowest
median (Figure 7), so January – June is the low flow season and July – December is the high flow season.
Figure 6. Time series of monthly total discharge for Corowa on the River Murray, Australia for the reference period, prior to completion of Hume Dam in 1936.
Figure 7. Median of six-monthly discharge totals for Corowa on the River Murray, Australia for the reference period, prior to completion of Hume Dam in 1936. Jan-Jun is the lowest median.
Sub-indicators
The suite of nine sub-indicators The literature does not contain measures of hydrological deviation that satisfy all of the requirements set out here.
Thus, a suite of sub-indicators was devised to meet these needs. Nine Flow Health sub-indicators characterise
the main forms of ecologically relevant hydrological deviation from reference (Figure 2). The deviation could be
0
500
1,000
1,500
2,000
2,500
3,000
3,500
4,000
Mo
nth
ly t
ota
l fl
ow
(m
3x 1
06)
0
500
1,000
1,500
2,000
2,500
3,000
3,500
4,000
Med
ian
of
refe
ren
ce p
eri
od
six
-mo
nth
to
tals
(m
3x 1
06)

25
due to natural variation or regulation. Deviation due to natural variation (i.e. periods of unusually low or high flows)
will be scattered throughout the record, while deviation due to regulation will follow a well defined pattern.
Flow Health has nine sub-indicators: High Flow (HF), Low Flow (LF), Highest Monthly (HM), Lowest Monthly (LM),
Persistently Higher (PH), Persistently Lower (PL), Persistently Very Low (PVL), Seasonality Flow Shift (SFS) and
Flood Flow Interval (FFI). The metric of each Flow Health sub-indicator characterises the degree of deviation in a
specific aspect of the flow regime that is conceptually linked to ecological health (Figure 8 and Figure 9).
Figure 8. Illustration of eight of the nine aspects of the flow regime characterised by the Flow Health sub-indicators using a comparison of monthly flows for water year 1999/2000 at Liaoyang on the Taizi River,
China with reference period median monthly flows and 25th
percentile monthly flows.
Figure 9. Illustration of eight of the nine aspects of the flow regime characterised by the Flow Health sub-indicators using a comparison of monthly flows for water year 2007/2008 at Guilin on the Gui River,
China with reference period median monthly flows and 25th
percentile monthly flows.

26
HF is the sum of the monthly flows in the natural high flow period. LF is the sum of the monthly flows in the
natural low flow period. HM is the highest monthly flow in the year. LM is the lowest monthly flow in the year. PH
is a measure of how many sequential months in the natural low flow season were higher than expected. PL is a
measure of how many sequential months were lower than expected. PVL is a measure of how many sequential
months were much lower than expected. SFS if a measure of the degree to which the seasonality of the monthly
flows has been altered. FFI is a measure of the time interval between the last significant flood month.
Five of the nine Flow Health sub-indicators (i.e. HF, LF, HM, LM and SFS) use attributes that are sensitive to the
natural inter-annual variance of the attribute in the reference series. Thus, if these attributes are highly variable in
the reference series then high deviations in a test year would not attract a high deviation score. On the other
hand, in a river that naturally has low inter-annual variance, increased inter-annual variability of the attributes in
the regulated regime will attract a high deviation score. For most rivers, flow persistence (measured by sub-
indicators PL, PH and PVL) tends not to occur often under reference conditions, and when it occurs, it lasts for
only a few months. Thus, the reference distributions of persistence (characterised by few values over a limited
range) are not suitable as a reference from which to calculate a deviation metric score. So, the persistence sub-
indicator metrics are scored against a standard that covers the possible range of the sub-indicator values.
The FFI sub-indicator is different to the others, as it measures an inter-annual hydrological attribute. FFI
measures the time since the last significant flood event, which is characterised by a threshold monthly flow that is
determined from the reference flow distribution (Figure 10). A maximum tolerable interval is set and when this is
exceeded the FFI metric score begins to decline until it reaches zero, or another flood occurs and the score is
reset to 1.
Figure 10. Illustration of the time series of the interval since a reference monthly flow (flood) threshold was exceeded at Huayuankou on the lower Yellow River, China. In this example, the flood threshold was
not exceeded after 1983.
High flow volume (HF) and low flow volume (LF) The high flow volume (HF) metric score for a test year is based on the percentile in the reference period of the
sum of the flows over the high flow period. Any value of the seasonal total in a test year that exceeds the
maximum value of the total in the reference period is assigned a percentile of 1, and any value of the seasonal
total in a test year that is less than the minimum value of the total in the reference period is assigned a percentile
of 0.
The first step in the calculation of the HF metric is to establish the distribution of high flow period totals in the
reference period. For the test year, the high flow period total flow is determined, and then assigned the value of
the percentile of this total flow in the reference period distribution. Finally, a score is assigned to this value of the
percentile according to the relationships in Figure 3 (Equations 1 – 4). The low flow volume (LF) metric is
calculated in exactly the same way as the HF metric, except that is based on the total flow over the low flow
period.
0
5
10
15
20
25
30
0
20
40
60
80
100
120
140
160
Inte
rval
sin
ce l
ast
refe
ren
ce 1
in
4
year
flo
od
mo
nth
(years
)
An
nu
al
maxim
um
mo
nth
ly f
low
(m3
x 1
06)
Maximum monthly f low
Interval since reference 1 in 4 year f lood
Reference flood

27
It is possible to calculate a similar sub-indicator metric score for the annual flow, but this sub-indicator was not
included in the Flow Health suite because its value was strongly determined by the high season flow total and
was also reflected in the sum of HF and LF scores (Figure 11).
Figure 11. Time series of HF and LF scores, compared with annual score (not included in Flow Health) for three contrasting rivers in China. Note that the three time series cover different periods.
Highest monthly flow (HM) and lowest monthly flow (LM) The highest monthly flow (HM) metric score for a test year is based on the percentile in the reference period of
the maximum monthly flow. Any value of the maximum flow in a test year that exceeds the maximum value in the
reference period is assigned a percentile of 1, and any value of the maximum in a test year that is less than the
minimum in the reference period is assigned a percentile of 0.
The first step in the calculation of the HM metric is to establish the distribution of maximum monthly flows in the
reference period. For the test year, the maximum monthly flow is determined, and then assigned the value of the
percentile of this flow in the reference period distribution. Finally, a score is assigned to this value of the
percentile according to the relationships in Figure 3 (Equations 1 – 4). Although HM is calculated for the entire
year, Equation 2 is used to calculate the score when the percentile in the reference distribution is greater than the
75th
percentile (for the default range of variability).
0.0
0.1
0.2
0.3
0.4
0.5
0.6
0.7
0.8
0.9
1.0
0.0
0.2
0.4
0.6
0.8
1.0
1.2
1.4
1.6
1.8
2.0
1954
1955
1956
1957
1958
1959
1960
1961
1962
1963
1964
1965
1966
1967
1968
1969
1970
1971
1972
1973
1974
1975
1976
1977
1978
1979
1980
1981
1982
1983
1984
1985
1986
1987
1988
1989
1990
1991
1992
1993
1994
1995
1996
1997
1998
1999
2000
2001
2002
2003
2004
2005
2006
2007
An
nu
al
flo
w v
olu
me s
co
re
Seaso
nal
flo
w v
olu
me s
co
re
Benxi (Taizi River)
Low f low volume High f low volume Annual
0.0
0.1
0.2
0.3
0.4
0.5
0.6
0.7
0.8
0.9
1.0
0.0
0.2
0.4
0.6
0.8
1.0
1.2
1.4
1.6
1.8
2.0
1957
1958
1959
1960
1961
1962
1963
1964
1965
1966
1967
1968
1969
1970
1971
1972
1973
1974
1975
1976
1977
1978
1979
1980
1981
1982
1983
1984
1985
1986
1987
1988
1989
1990
1991
1992
1993
1994
1995
1996
1997
1998
1999
2000
2001
2002
2003
2004
2005
2006
2007
2008
2009
2010
An
nu
al
flo
w v
olu
me s
co
re
Seaso
nal
flo
w v
olu
me s
co
re
Guilin (Gui River system)
Low f low volume High f low volume Annual
0.0
0.1
0.2
0.3
0.4
0.5
0.6
0.7
0.8
0.9
1.0
0.0
0.2
0.4
0.6
0.8
1.0
1.2
1.4
1.6
1.8
2.0
1950
1951
1952
1953
1954
1955
1956
1957
1958
1959
1960
1961
1962
1963
1964
1965
1966
1967
1968
1969
1970
1971
1972
1973
1974
1975
1976
1977
1978
1979
1980
1981
1982
1983
1984
1985
1986
1987
1988
1989
1990
1991
1992
1993
1994
1995
1996
1997
1998
1999
2000
2001
2002
2003
2004
2005
2006
2007
2008
An
nu
al
flo
w v
olu
me s
co
re
Seaso
nal
flo
w v
olu
me s
co
re
Lijin (Yellow River)
Low f low volume High f low volume Annual

28
The lowest monthly flow (LM) metric is calculated in exactly the same way as the HM metric, except that is based
on the minimum monthly flow of the year. For LM, Equation 3 is used to calculate the score when the percentile
in the reference distribution is greater than the 75th percentile (for the default range of variability). The rationale
for reducing the score if LM is higher than expected is that a brief period of low flow in the year might be
important as a disturbance for some biota.
Persistently higher flow (PH) The persistently higher flow (PH) indicator is intended to reflect the existence of a period of time when the flow in
the test year is persistently (i.e. for two or more consecutive months) notably higher than the expected range in
the low flow period. Persistently higher flows could naturally occur in an unusually wet low flow season, or be
due to regulated delivery of water for irrigation in the low flow season. The indicator was designed to detect the
latter, which would be more likely to persistently exceed the upper range of reference flows than a natural event
(here, the upper range was defined as exceeding the 75th percentile). The first step in calculating the indicators is
to determine, for the flow of each month in the test year, its percentile in each corresponding month in the
reference period. Any value of the monthly flow in a test year that exceeds the maximum monthly value in the
reference period is assigned a percentile of 1, and any value of the monthly flow in a test year that is less than
the minimum monthly value in the reference period is assigned a percentile of 0. Each percentile is then scored
either +1 or 0, with 0 assigned if the monthly percentile value is less than or equal to the 75th percentile flow in
the reference period and +1 is assigned for values exceeding the 75th
percentile flow in the reference period. The
time series of these scores is then considered, with consecutive positive scores (+1) summed, until a score of
zero is encountered. The positive scores are then summed across the low flow period. Essentially, the process
counts the number of consecutive months in the low flow period having a flow that lies outside the upper range of
the flow for each month in the reference period. For each year, the maximum number of consecutive months with
a positive score is determined. The equations suggested here for calculating the scores are (assuming a low flow
period of 6 months duration):
For PH, annual maximum cumulative total = 6
(5)
For PH annual cumulative total ≤ 1
(6)
For PH, 6 > annual maximum cumulative total > 1
(7)
Persistently lower flow (PL) The persistently lower flow (PL) indicator is intended to reflect the existence of a period of time when the flow in
the test year is persistently (i.e. for two or more consecutive months) notably lower than the expected range.
Unlike the PH indicator which is limited to the low flow period, PL applies for the entire year. The first step in
calculating the indicators is to determine, for the flow of each month in the test year, its percentile in each
corresponding month in the reference period. Any value of the monthly flow in a test year that exceeds the
maximum monthly value in the reference period is assigned a percentile of 1, and any value of the monthly flow
in a test year that is less than the minimum monthly value in the reference period is assigned a percentile of 0.
Each percentile is then scored either 0 or -1, with 0 assigned if the monthly percentile value is equal to or
exceeds the 25th percentile in the reference period, and -1 assigned for values lower than the 25
th percentile. The
time series of these scores is then considered, with consequitive negative scores (-1) summed, until a score of
zero is encountered. Summing of the months with consecutive negative scores continues without interruption into
the next year and beyond, as necessary. Essentially, the process counts the number of consecutive months
having a flow that lies below the 25th
percentile flow for each month in the reference period. For each year, the
maximum number of consecutive months with a negative score is determined. Because the run of consecutive
months can continue into following years, the cumulative annual totals can potentially exceed 12 months, but an
uninterrupted 12 month run of low flows was considered long enough to score zero for this indicator. The
equations suggested here for calculating the scores are:

29
For PL, annual minimum cumulative total ≤ -12
(8)
For PL annual cumulative total ≥ -1
(9)
For PL, -12 < annual maximum cumulative total < -1
(10)
Persistently very low (PVL) Very low flows are defined as being less than or equal to the 1
st percentile flow in the reference series (for all
months and years combined). In rivers with a significant cease to flow component, this flow index will correspond
to zero flow. In some rivers it may be desirable to use another percentile to define very low flows, and this will not
change the nature of the PVL sub-indicator.
The first step in calculating the PVL metric is to determine, for the flow of each month in the test year, whether
the flow is less than or equal to the very low flow index. Any value of the monthly flow in a test year that is less
than the very low flow index is assigned a value of 1, otherwise a value of 0 is assigned. The time series of these
scores is then considered, with consecutive positive scores summed, until a score of zero is encountered.
Summing of the months with consecutive positive scores continues without interruption into the next year and
beyond, as necessary. Essentially, the process counts the number of consecutive months having a flow that lies
outside the 1st percentile flow in the reference period. For each year, the maximum number of consecutive
months with a positive score is determined. Because the run of consecutive months can continue into following
years, the annual cumulative totals can potentially exceed 12 months, but this would be in an extreme situation.
Normally, the 1st percentile flow in the reference series would be exceeded during the high flow season, even in a
regulated river, so here it was assumed that the lowest sub-indicator score of 0 would be assigned to annual
cumulative totals of 6 or higher. The equations used for calculating the scores are:
For PVL, annual maximum cumulative total ≥ 6
(11)
For PVL annual maximum cumulative total = 0
(12)
For PVL, 6 > annual maximum cumulative total > 0
(13)
Seasonality flow shift (SFS) The seasonality flow shift (FSS) sub-indicator is intended to detect shifting of the months of high and low flow to
other times of the year. In some highly regulated rivers, dam operation has completely reversed the seasonality
of flows.
The first step in calculating the SFS metric is to determine the rank of the median flow of each month in the
reference series. Ranking of monthly flows is then undertaken for each year in the reference period. Then, for
each reference year, for each month of the year, the absolute difference in the rank compared to the rank of the
median monthly flow in the reference series is determined. This difference in rank is a number in the range 0 – 11.
The mean deviation of the ranks (a number in the range 0 – 6) is then calculated for each reference year. This
distribution of annual mean deviation in ranks is the reference distribution against which the test years are
compared. In rivers that naturally have a highly variable seasonality of flows, the range of mean deviations in
ranks in the reference period will be wide, while for rivers that have consistent seasonality, the range will be
narrow.

30
For each test year, the mean of the deviations in rank of each month is calculated. A value of 6 represents
complete flow reversal, and 0 represents no change, relative to the reference seasonality. The equations used for
calculating the score for a test year are the same as the general equations (Equations 1 – 4), but modified for the
reverse order of the SFS distribution (i.e. a low raw value of SFS being desirable, rather than a high value being
undesirable for the other sub-indicators):
Percentile in reference distribution in the range: < 75th
percentile
(14)
Percentile in reference distribution in the range: > 75th percentile
(15)
Flood flow interval (FFI) The flood flow interval (FFI) sub-indicator is intended to detect reduced flood frequency, from the perspective of
flows that overtop the banks and inundate floodplain wetlands. The measure is not of flood frequency, but of the
interval between floods, which gets longer as frequency declines. It is the length of time between individual floods
that negatively impacts the ecology, rather than the average frequency. It is not possible to know from hydrology
alone the threshold flow magnitude that will overtop the channel banks and therefore constitute a flood. In
addition, floods are transient events, and their magnitude is not always closely related to the total flow of the
month in which they occur. Despite this, on most rivers, for months with significant floods, there is likely to be a
significant correlation between peak instantaneous flow of the month, and total monthly flow (e.g. Figure 12).
Users should check the validity of this assumption for the rivers they are investigating.
Figure 12. Relationships between the monthly average of mean daily flow and (i) monthly peak mean daily flow and (ii) monthly peak instantaneous flow, for pre-regulation and post-regulation periods at the
Barham gauge (409005) on the River Murray, Australia. Minor flooding begins at 24,600 ML/d. Data downloaded from www.vicwaterdata.net.
The first step in calculating the FFI metric is to set the flood frequency of interest. The default frequency in Flow
Health is 4 years. The magnitude of this event is determined as the 75th
percentile of the highest monthly flow in
each year in the reference period. In other words, 1 in 4 years in the reference period had flows equal to or higher
than this value. Next, a maximum interval between floods is set. This maximum interval refers to a period of time
over which there would be no negative ecological impacts, so the FFI score would be 1. A conservative value for
this maximum interval would be the same as the flood frequency, which is a default value of 4 years. In rivers
with an irregular pattern of flooding, this interval is likely to be longer. When the maximum interval is exceeded,
0
5,000
10,000
15,000
20,000
25,000
30,000
35,000
40,000
0 10,000 20,000 30,000 40,000
Mo
nth
ly p
eak f
low
(M
L/d
)
Monthly average mean daily flow (ML/d)
Pre-regulation (1913-1935)
0
5,000
10,000
15,000
20,000
25,000
30,000
35,000
40,000
0 10,000 20,000 30,000 40,000
Mo
nth
ly p
eak f
low
(M
L/d
)
Monthly average mean daily flow (ML/d)
Post-regulation (1936-2004)
Monthly peak mean daily f low
Monthly peak instantaneous f low

31
the FFI score begins to decline in a linear fashion until it reaches zero. The default interval length when FFI
reaches zero is 8 years after the last flood.This implies that if the 1 in 4 year flood has not occurred for 8 years or
more, the floodplain ecosystem health is severely impacted.
The calculation of FFI is based on the monthly time series, with the annual score being the score at the end of
the year. If N is the interval (in months) since the occurrence of a month when the flow was equal to or exceeded
the threshold monthly flow, then for the default threshold of the 1 in 4 year maximum monthly flow:
If N ≤ 48
(16)
If N > 96
(17)
If 48 < N ≤ 96
(18)
Flow Health Index The Flow Health Index combines the scores of the nine sub-indicators. The Persistently High (PH) metric, unlike
the others, would technically score positively (i.e. score = 1) when the flow in the river was zero for the entire year.
The PH metric rewards the absence of an undesirable condition, but in fact the PH sub-indicator loses its
meaning when the low flow period flows are depressed. If a total score was derived by simply averaging the nine
metric scores, then a river with no flow would score positively (0.125), when logically it should score zero. This
problem is resolved by using PH as a moderator of the Low Flow (LF) sub-indicator. The LF is multiplied by the
PH score to get modified LF score. The overall Flow Health index score is then calculated as the average of this
modified LF score and the other 7 individual metric scores. This gives a score within the range 0 – 1, with 1
representing a low degree of deviation from the reference hydrology.
Ecological significance of the sub-indicators The ecosystem significance of the HF and LF sub-indicators is that the total seasonal volume will reflect the
prevailing hydrological conditions (in particular, highlighting particularly dry years) and also indicate any major
reductions in total flow volume (and hence gross habitat area availability) due to flow regulation. Significant
regulation impacts would tend to be characterised by a sustained reduction in HF, perhaps also with a sustained
reduction in LF.
The ecosystem significance of the HM sub-indicator relates to the magnitude of flood flows which are critical for
inundating wetlands, cuing fish spawning behaviour, facilitating fish migration and mobilising sediment for
creation of physical habitat. The ecosystem significance of the LM sub-indicator is related to the magnitude of the
lowest flow of the year, when minimum flows are required for survival. HM and LM are not determined for the
high flow and low flow seasons respectively, but for the entire year. This is because the occurrence of a month of
very low flow can be problematic for the biota at any time of the year, and a significant flood or flow pulse event
(associated with the month of highest flow) can be beneficial to the biota at any time of year. Also, in regulated
rivers, the month of lowest flow could occur in the natural high flow season. It is recognised that the benefit of a
flow pulse may be greater in certain months, and in some months a pulse might have a negative impact on the
biota. If the highest flow month is aseasonal in the reporting year, this will be detected by the HF, LF, and SFS
sub-indicators.
The ecosystem significance of the PH sub-indicator relates to the situation of flows being artificially regulated at
significantly higher than reference magnitude for long periods through the natural low flow period. This can
reduce light penetration to the bed, and hence reduce primary production of benthic algae. Persistently elevated
low flows might also mean that invertebrates are not seasonally stressed, which could be a natural disturbance
process that plays a role in maintaining diversity. Higher than normal flows in the low flow period can also stress

32
riparian vegetation by waterlogging root zones, or preventing recruitment in exposed soils. In some places this
may hinder recruitment of fish species dependent on slackwaters and warm temperatures associated with low
flows.
The ecosystem significance of the PL sub-indicator relates to the situation of flows, either in the low or high flow
season, being depressed for long periods. This sub-indicator would usually indicate persistently depressed low
flow season flows, which would have implications for gross habitat area availability for fish and
macroinvertebrates. This flow condition would potentially allow colonisation of the stream bed by invasive
vegetation, or accumulation of fine sediments that settle out during periods of low flow.
The ecosystem significance of the PVL sub-indicator relates to the situation of flows being artificially regulated at
very low levels for long periods. The consequences of this drying or near-drying of the channel can be critical for
all organisms in the stream. Very low flows are often associated with the loss of riffle habitats, crowding of
organisms in pools, and degraded water quality, such as temperature extremes and increased risk of hypoxia
and high salinity.
The ecosystem significance of the SFS sub-indicator relates to the situation of the seasonal pattern of flows
being reversed, or partly reversed, due to storage of flows in reservoirs in the natural high flow season, and
release of water for downstream supply in the natural low flow season. The consequences of this can be
disruption of the natural timing of flow pulses and baseflows that stimulate the behaviour of aquatic organisms
whose life cycle has adapted to a particular seasonal pattern of flow.
The ecosystem significance of the FFI sub-indicator mainly relates to the occurrence of floods that inundate
floodplain wetlands. In some rivers such floods might also play an important role in scouring hardy plants from
channels and re-shaping channel morphology. During the interval between floods, wetlands can dry out, riparian
vegetation can become stressed, succession processes give rise to changes in the composition of floodplain
plant communities, plants that rely on regular floods for seed dispersal and propagation do not regenerate, and
channels can become overgrown due to lack of disturbance.
Example Flow Health calculation To illustrate application of Flow Health, an example is provided for Liaoyang gauging station on the Taizi River,
China, for the year 2000. In year 2000 the flows at Liaoyang were much different to the reference flow regime
(Figure 9).
Step 1: Determine reference period The reference period is the period of time when the hydrology was in the reference state. The reference state
might mean no dams, no pumping, or a tolerable level of regulation that did not degrade the ecosystem health
below the expected level. At Liaoyang, the selected reference period was prior to dams, which was before 1969.
Data were available from 1954, so the reference period was 1954 to 1968 inclusive (15 year long period).
Step 2: Determine the water year The median flow sum was calculated for each of the six-month periods for the reference time series (Table 1).
The first month of the six-month period with the smallest median sum is the start of the water year (Table 1).
Step 3: Establish the reference distributions and thresholds There are 18 reference period flow data distributions to consider when calculating Flow Health scores.
Flows for each month (Figure 13) – used for PH and PL
Low flow period total flows (Figure 14) – used for LF
High flow period total flows (Figure 14) – used for HF
Maximum monthly flow (Figure 15) – used for HM and FFI
Minimum monthly flow (Figure 15) – used for LM
All monthly flows (Figure 16) – used for PVL
Mean deviation in ranks of monthly flows from ranks of median monthly flows (Figure 17) – used for SFS
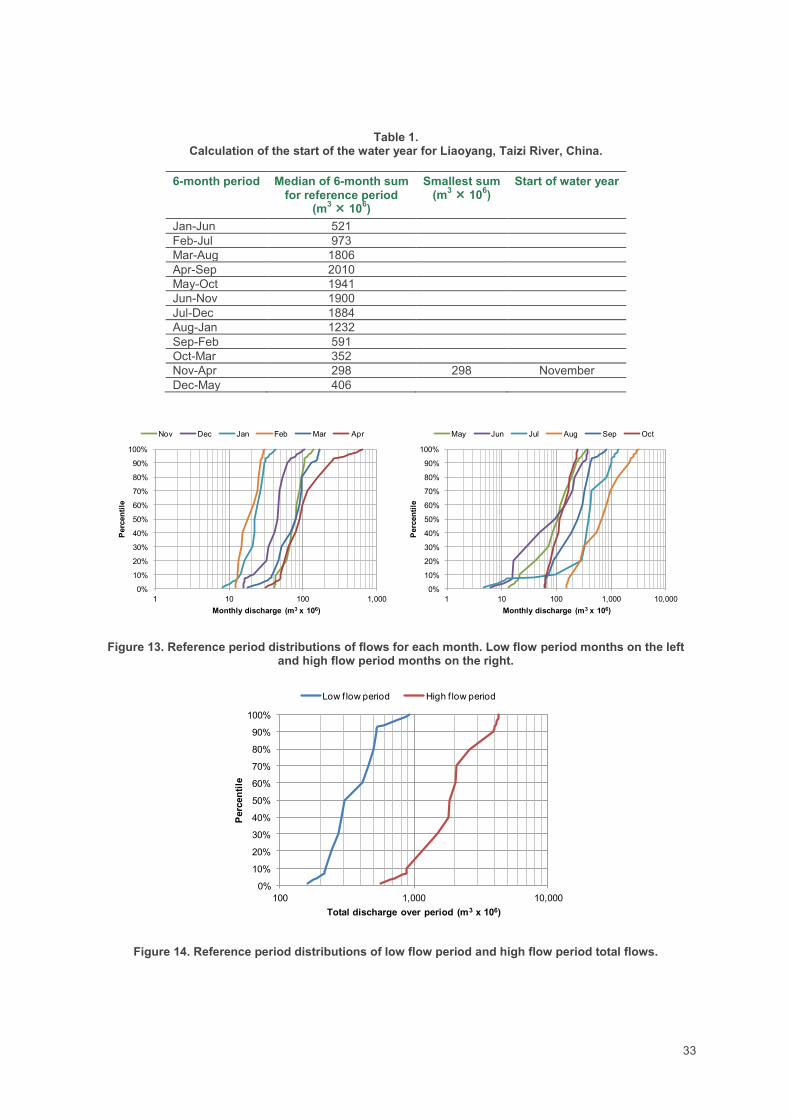
33
Table 1. Calculation of the start of the water year for Liaoyang, Taizi River, China.
6-month period Median of 6-month sum for reference period
(m3 10
6)
Smallest sum (m
3 10
6)
Start of water year
Jan-Jun 521
Feb-Jul 973
Mar-Aug 1806
Apr-Sep 2010
May-Oct 1941
Jun-Nov 1900
Jul-Dec 1884
Aug-Jan 1232
Sep-Feb 591
Oct-Mar 352
Nov-Apr 298 298 November
Dec-May 406
Figure 13. Reference period distributions of flows for each month. Low flow period months on the left and high flow period months on the right.
Figure 14. Reference period distributions of low flow period and high flow period total flows.
0%
10%
20%
30%
40%
50%
60%
70%
80%
90%
100%
1 10 100 1,000
Perc
en
tile
Monthly discharge (m3 x 106)
Nov Dec Jan Feb Mar Apr
0%
10%
20%
30%
40%
50%
60%
70%
80%
90%
100%
1 10 100 1,000 10,000
Perc
en
tile
Monthly discharge (m3 x 106)
May Jun Jul Aug Sep Oct
0%
10%
20%
30%
40%
50%
60%
70%
80%
90%
100%
100 1,000 10,000
Perc
en
tile
Total discharge over period (m3 x 106)
Low f low period High f low period

34
Figure 15. Reference period distributions of lowest annual monthly flow and highest annual monthly flow.
Figure 16. Reference period distribution of monthly flows for the entire year.
Figure 17. Reference period ranks of median flows of each month (left), and reference period distribution of annual mean deviation of monthly ranks from the reference ranks (right).
0%
10%
20%
30%
40%
50%
60%
70%
80%
90%
100%
1 10 100 1,000 10,000
Perc
en
tile
Monthly discharge (m3 x 106)
Lowest annual f low month Highest annual monthly f low
0%
10%
20%
30%
40%
50%
60%
70%
80%
90%
100%
1 10 100 1,000 10,000
Perc
en
tile
Monthly discharge (m3 x 106)
Entire year
8
10
11
12
9
7
6
4
2
1
3
5
1
2
3
4
5
6
7
8
9
10
11
12
Nov Dec Jan Feb Mar Apr May Jun Jul Aug Sep OctRan
k (
1 =
hig
hest
flo
w,
12 =
lo
west
flo
w)
Rank of reference median monthly f low
0%
10%
20%
30%
40%
50%
60%
70%
80%
90%
100%
0 1 2 3 4 5 6
Perc
en
tile
Annual mean deviation of monthly ranks from ranks of reference median monthly flows (range is 0 to 6)

35
The thresholds used to score the Flow Health sub-indicators are based on percentiles calculated for the
reference period distributions. Assuming the default range of variability, the critical thresholds are the 25th
and
75th
percentiles for each month and for the low and high flow periods. The 1st percentile flow for the entire year is
the threshold for the PVL sub-indicator (Table 2). The 75th
percentile flows are not required for the high flow
period (Figure 3).
Table 2. Reference distribution thresholds for Liaoyang, Taizi River, China.
Period 25th
%-ile (m
3 10
6)
75th
%-ile (m
3 10
6)
25th
%-ile of max. monthly
flow (m
3 10
6)
25th
%-ile of min.
monthly flow
(m3 10
6)
75th
%-ile of min.
monthly flow
(m3 10
6)
1st %-ile
(m3 10
6)
75th
%-ile of
annual mean
deviation in ranks
of monthly
flows
Lo
w f
low
pe
rio
d
November 63.6 92.3
December 33.1 50.5
January 18.0 27.9
February 14.3 24.7
March 49.2 95.3
April 60.8 132.4
Hig
h f
low
pe
rio
d
May 58.6 -
June 21.3 -
July 311.4 -
August 289.4 -
September 106.7 -
October 82.8 -
Low flow period 259.0 480.5
High flow period 1,330.3 -
All year 532.0 12.4 19.9 6.7 2.08
Step 4: Calculate flow metric scores
HF and LF In Year 2000, the total flow for the months November to April (low flow period) was 172.8 m
3 10
6 and for the
period May to October (high flow period) was 782.6 m3 10
6. These volumes equated to the 2.3 percentile and
5.3 percentiles respectively in the reference distributions (Figure 14). These percentiles scored 0.094 and 0.211
respectively (Table 3).
Table 3. Calculation of HF and LF for year 2000 at Liaoyang, Taizi River, China.
Flow Health sub-indicator Flow volume (m
3 10
6)
Percentile in reference period
(Figure 14)
Score
Low flow volume (LF) 172.8 2.3 0.09 (Eqn 4)
High flow volume (HF) 782.6 5.3 0.21 (Eqn 4)

36
HM and LM In Year 2000, the lowest monthly flow was 2.5 m
3 10
6 and the highest monthly flow was 447.1 m
3 10
6.
These volumes equated to the 0.00 percentile (lower than the minimum in the reference distribution) and 19.0
percentiles respectively in the reference distributions (Figure 15). These percentiles scored 0.00 and 0.76
respectively (Table 4).
Table 4. Calculation of HM and LM for year 2000 at Liaoyang, Taizi River, China.
Flow Health sub-indicator Flow volume (m
3 10
6)
Percentile in reference period
(Figure 15)
Score
Highest monthly flow (HM) 447.1 19.0 0.76 (Eqn 4)
Lowest monthly flow (LM) 2.5 0.0 0.00 (Eqn 4)
PH and PL In year 2000, only 2 months (December and February) were within the range of 25
th to 75
th percentile in the
reference series. July to October was a period of persistently low flow, and November was the fifth of a sequence
of low flow months that began in July the previous year. There were no particularly long periods of persistently
high flow (Table 5).
Table 5. Calculation of PH and PL for year 2000 at Liaoyang, Taizi River, China.
Monthly flow (m
3 10
6)
Percentile (P) in reference distribution
(Figure 13)
Cum. count
(P < 25% = -1;
25% ≤ P = 0) all months
Cum. count
(P > 75% = 1;
P ≤75% = 0) low flow season
Nov 15.9 0.0 -5* 0
Dec 34.4 32.5 0 0
Jan 30.8 93.4 0 1
Feb 20.9 64.0 0 0
Mar 26.6 4.3 -1 0
Apr 44.1 5.7 -2 0
May 447.1 100.0 0 -
Jun 319.1 90.6 0 -
Jul 6.2 2.4 -1 -
Aug 4.0 0.0 -2 -
Sep 2.5 0.0 -3 -
Oct 3.6 0.0 -4 -
Annual (min.) -5
Low flow season (max.) 1
Persistently high flow (PH) 1.00 (Eqn 6)
Persistently low flow (PL) 0.64 (Eqn 10)
* This value influenced by a sequence of low flow months that began in July the previous water year.

37
PVL In year 2000, the period July to October was persistently lower than the 1
st percentile monthly flow in the
reference series (Table 6). This resulted in a low score for this sub-indicator.
Table 6. Calculation of PVL for year 2000 at Liaoyang, Taizi River, China. The threshold 6.4 m
3 10
6 corresponds
to 1st
percentile for all months in the reference series (Figure 16).
Monthly flow (m
3 10
6)
Cumulative count
(flow ≥ 6.4 = 0;
flow < 6.4 = 1)
Nov 15.9 0
Dec 34.4 0
Jan 30.8 0
Feb 20.9 0
Mar 26.6 0
Apr 44.1 0
May 447.1 0
Jun 319.1 0
Jul 6.2 1
Aug 4.0 2
Sep 2.6 3
Oct 3.6 4
Annual (max.) 4
Persistently very low (PVL) 0.33 (Eqn 13)
SFS In year 2000, only November had the same rank as in the reference distribution (Table 7, Figure 18). The mean
deviation in ranks for the year was 5.2 (Table 7), which was higher than any value in the reference period (Figure
17). This resulted in a zero score for this sub-indicator, indicating a high degree of seasonal flow reversal relative
to that which occurred in the reference period.
Table 7. Calculation of SFS for year 2000 at Liaoyang, Taizi River, China. Rank in reference given in Figure 17.
Rank in reference Rank in year 2000 Difference in rank
Nov 8 8 0
Dec 10 4 6
Jan 11 5 6
Feb 12 7 5
Mar 9 6 3
Apr 7 3 4
May 6 1 5
Jun 4 2 2
Jul 2 9 7
Aug 1 10 9
Sep 3 12 9
Oct 5 11 6
Mean difference in rank 5.2
Percentile in reference period 100 (Figure 17)
Seasonality flow shift (SFS) 0.00 (Eqn 15)

38
Figure 18. Comparison of ranks of monthly flows in the year 2000 with the reference period. Data for Liaoyang, Taizi River, China.
FFI The 1 in 4 year reference flood threshold is 1263 m
3 10
6 (Table 2). This threshold was exceeded in August
1995, so by the end of year 2000, the interval since the previous flood was 62 months. Using Eqn 18, the FFI
score is 0.71.
Flow Health index The Flow Health index score is the average of seven sub-indicator metric scores and LF x PH. For presentation,
it is useful to retain the individual sub-indicator scores, to demonstrate which aspects of the flow regime have
deviated most from the reference condition (Table 8).
Table 8. Flow Health flow metric scores for year 2000 at Liaoyang, Taizi River, China. Maximum score is 1 for each
sub-indicator.
Flow Health sub-indicator Score for year 2000 Score for annual index
HF (High flow) 0.21 0.23
HM (Highest monthly) 0.76 0.82
LF (Low flow) 0.09 0.09 1.00 = 0.09
LM (Lowest monthly) 0.00 0.00
PH (Persistently higher) 1.00 -
PL (Persistently lower) 0.64 0.64
PVL (Persistently very low) 0.33 0.33
SFS (Seasonality flow shift) 0.00 0.00
FFI (Flood flow interval) 0.71 0.71
Flow Health index (average) 0.35
Presentation of Flow Health scores The Flow Health sub-indicators measure deviation from reference for nine aspects of monthly flow distributions,
and the Flow Health index combines the metric scores for these sub-indicators. The Flow Health software
computes scores for each flow metric and for the overall index. The scores can be computed for any period of
time within the input flow series, so for example the entire history of flow deviation can be calculated and
presents, or just a particular period of interest (such as the recent few years).
8
10
11
12
9
7
6
4
2
1
3
5
8
4
5
7
6
3
1
2
9
10
12
11
1
2
3
4
5
6
7
8
9
10
11
12
Nov Dec Jan Feb Mar Apr May Jun Jul Aug Sep OctRan
k (
1 =
hig
hest
flo
w,
12 =
lo
west
flo
w)
Reference Year 2000

39
The Flow Health software presents the scores in a number of formats:
Mosaic chart time series
Line chart time series
Stacked area chart time series
Table of index values
The line chart and stacked chart merely plot the values that are in the table. The line chart offers the option of
plotting only selected sub-indicators. The data in the table can be downloaded by the user.
The mosaic chart time series plots raw scores that have been placed within one of 5 classes of hydrological
deviation, which are differentiated by coloured cells (Figure 19). The five classes are described as very small,
small, moderate, large and very large. These descriptions have no implied meaning with respect to ecological
impacts; they are merely a convenient descriptive scale to accompany the numeric scale. The mosaic chart is
effective in providing a visual impression of the degree of flow deviation (i.e. relative flow health) over time, and
clearly indicates which of the nine aspects of the flow regime are impacted. Another effective way of presenting
the scores is in the form of a stacked area chart (Figure 19).
The annual Flow Health flow metric scores calculated over the time series for the Liaoyang gauge on the Taizi
River indicated a degree of inter-annual variability, which reflected natural variability in hydrological conditions
(Figure 19). The scores also showed a general decline when Guanyinge Dam began operation from 1996, and
the flow metric scores fell during the 1970s and 1980s, coincident with the operation of Tanghe and Shenwo
dams (Figure 19). The flow metric scores also varied cyclically, possibly in connection with natural climatic
variation.
Figure 19. Time series of Flow Health flow metric scores for Liaoyang gauge on the Taizi River, China. Regulation began in 1969. Flow metric scores are presented in 5 classes of deviation in mosaic chart
(top), and as stacked area chart (bottom).

40
Flow Health metrics and environmental flows
Setting an environmental flow regime to meet Flow Health score targets It follows that if the Flow Health index is a reasonable measure of the suitability of flows for ecosystem health,
then a flow regime that scored 1 in each of the flow metrics would be a low risk environmental flow regime. Flow
Health was not primarily developed with the intention of it being used in reverse to design an environmental flow
regime because:
Some environmental flow needs must be assessed and specified at the scale of daily flows
Environmental flow needs cannot be reliably assessed using only hydrological data (local hydraulic and
ecological data are required for a proper assessment)
Flow variability is an important dimension of environmental flow specifications, while Flow Health is
merely a statistical description of an actual flow series which is assumed to contain variability
While Flow Health was not intended as an environmental flow design tool, given the global interest in hydrological
methods that make inexpensive and expedient environmental flow recommendations, it is conceivable that Flow
Health will be applied in this way. Thus, it is of interest to know what minimum flow regime would produce a high
score under Flow Health.
Producing a score of 1 for each of the nine flow metrics is not simply a matter of achieving for each month the
25th
percentile flow of the reference series. This will give a score of 1 for LM, PH, PL, PVL and SFS, which are all
based on flows being at least equal to that of the 25th percentile reference monthly flow in each month. High flow
(HF), Low flow (LF) and Highest monthly (HM) are based on different distributions, and, for the stations tested
during development, score less than 1 if only the 25th
percentile reference flow for each month is provided in each
month. The percentile of reference monthly flow required to score 1 for these flow metrics for four Taizi River
gauging stations varied slightly by site (Table 9). FFI is an inter-annual statistic, so for a complete flow regime, it
must be specified separately to the annual monthly flows.
The minimum monthly flows required to give scores of 1 for all flow metrics were calculated for four Taizi River
gauging stations (Table 10, Figure 20). In Flow Health, the additional flow required to meet the LF and HF sub-
indicators is distributed among the relevant months according to the pattern of monthly median flows. In practice,
river managers could distribute this water in any way throughout the two seasons without affecting the HF and LF
flow metric scores. In Flow Health, the water required to achieve the HM flow metric score of 1 is added to the
month with the highest median flow. In reality, this water would be delivered by river managers in a more focused
way at the daily and hourly time-scale, to produce a higher magnitude flow event with duration shorter than one
month. Similarly, the flow required to satisfy the FFI requirement is expressed as a monthly flow, but it would
need to be delivered so as to achieve its objectives, which might be wetland inundation, vegetation disturbance,
sediment transport, or channel morphology re-shaping.
Table 9. Percentile of reference monthly flow required score 1 for HF, LF and HM flow metrics for four Taizi River,
China, gauging stations.
Percentile of reference monthly flow required to score 1 for flow metrics
Sub-indicator Benxi Liaoyang Xiaolinzi Tangmazhai
High flow volume (HF) (high flow months) 37.5 37.8 37.2 35.9
Low flow volume (LF) (low flow months) 34.2 34.4 37.4 37.3
Highest monthly flow (HM) (August) 46.2 37.4 37.8 50.0
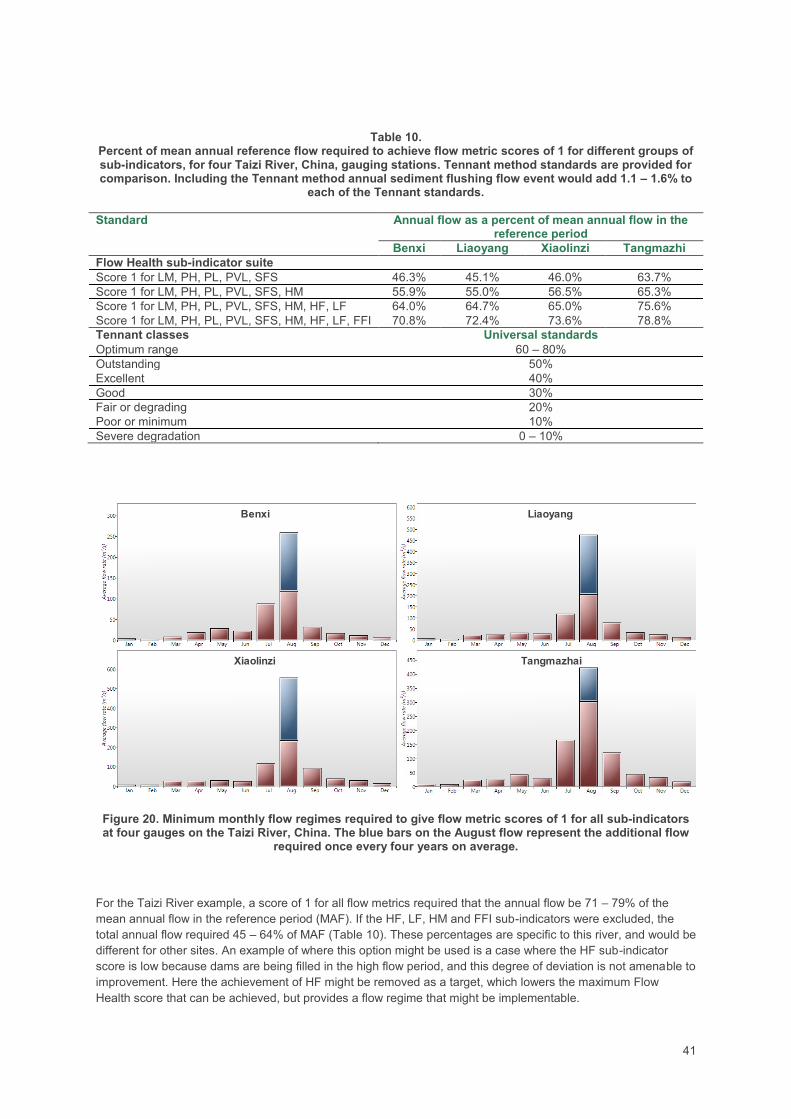
41
Table 10. Percent of mean annual reference flow required to achieve flow metric scores of 1 for different groups of sub-indicators, for four Taizi River, China, gauging stations. Tennant method standards are provided for comparison. Including the Tennant method annual sediment flushing flow event would add 1.1 – 1.6% to
each of the Tennant standards.
Standard Annual flow as a percent of mean annual flow in the reference period
Benxi Liaoyang Xiaolinzi Tangmazhi
Flow Health sub-indicator suite
Score 1 for LM, PH, PL, PVL, SFS 46.3% 45.1% 46.0% 63.7%
Score 1 for LM, PH, PL, PVL, SFS, HM 55.9% 55.0% 56.5% 65.3%
Score 1 for LM, PH, PL, PVL, SFS, HM, HF, LF 64.0% 64.7% 65.0% 75.6%
Score 1 for LM, PH, PL, PVL, SFS, HM, HF, LF, FFI 70.8% 72.4% 73.6% 78.8%
Tennant classes Universal standards
Optimum range 60 – 80%
Outstanding 50%
Excellent 40%
Good 30%
Fair or degrading 20%
Poor or minimum 10%
Severe degradation 0 – 10%
Figure 20. Minimum monthly flow regimes required to give flow metric scores of 1 for all sub-indicators at four gauges on the Taizi River, China. The blue bars on the August flow represent the additional flow
required once every four years on average.
For the Taizi River example, a score of 1 for all flow metrics required that the annual flow be 71 – 79% of the
mean annual flow in the reference period (MAF). If the HF, LF, HM and FFI sub-indicators were excluded, the
total annual flow required 45 – 64% of MAF (Table 10). These percentages are specific to this river, and would be
different for other sites. An example of where this option might be used is a case where the HF sub-indicator
score is low because dams are being filled in the high flow period, and this degree of deviation is not amenable to
improvement. Here the achievement of HF might be removed as a target, which lowers the maximum Flow
Health score that can be achieved, but provides a flow regime that might be implementable.
Benxi
TangmazhaiXiaolinzi
Liaoyang

42
The Flow Health metrics are range sensitive, which means that they are responsive to the natural variability of
river flows. Rivers with naturally low variability of monthly flows will require a higher percentage of MAF to
achieve flow metric scores of 1 than a river with naturally high variability of monthly flows.
It must be remembered that reference flow regimes naturally have years with Flow Health scores less than 1
(Figure 19), which highlights the need to build variability into environmental flow recommendations. Flow Health
can assist with design of environmental flow regimes, but it is not a flow implementation tool. Implementation of
environmental flows is a process that considers the flow recommendations in the context of current and
antecedent hydrological conditions, and the need to vary flows between years.
The Tennant method (Tennant, 1976), a popularly applied hydrological scaling method, recommends provision of
between 10% and 80% of MAF to achieve stream health of varying standards (Table 10). Although a flow regime
that scored highly on Flow Health would require about the same %MAF as a Tennant regime in the Outstanding
and Optimum condition (Table 10), there is no direct link between these two approaches, and the similarity
in %MAF for high stream health is coincidental. Also, a Tennant method regime has constant flow throughout
each of the high and low flow seasons, while a Flow Health-inspired regime has seasonal flow variability that
follows the natural pattern of the river in question (Figure 20).
Note: It is stressed that if Flow Health is used to produce an environmental flow recommendation, it should be
considered preliminary. Also, the flow in the high flow month, or in any periodic flood flow month, would need to
be distributed to produce a flow peak that was higher than the monthly average flow and have natural rates of
rise and fall.
Assessing the Flow Health score of an environmental flow regime There are many different ways to determine an environmental flow regime. In the absence of any other
information, one simple way is to set a regime based on the reference flow pattern that achieves a target Flow
Health score on selected flow metrics, as explained above. An alternative is to scale down the reference average
monthly flows, until an acceptable total volume of flow is achieved (which would relate to the water that is
available in the river, after agreed consumptive uses have been met). Another alternative is to determine the
environmental flows using an independent method. These two alternative approaches can be evaluated in Flow
Health, using the Design Flow function.
A comprehensive environmental flow assessment was undertaken on the lower Yellow River using the method of
Gippel et al. (2009). Two options were recommended, one was low risk to the environment, and one medium risk.
For the reach downstream of Xiaolangdi Dam (Huayuankou gauge), the low risk regime achieved a Flow Health
index score of 0.28 and required 42% of MAF; the medium risk regime achieved a Flow Health index score of
0.15 and required 29% of MAF (Figure 21). A similar regime was achieved by scaling reference monthly flows
(Figure 21). These environmental flow regimes represent a major reduction from reference flow volumes. This is
explained by the fact that in the Yellow River, flows can be reduced by a large percentage without eliminating the
hydraulic habitat necessary to maintain the ecological assets. In this case, the reduction in flows simply reduces
the area of available habitat. Higher flows could be justified if the objectives centred on providing a minimum area
of habitat. The lower Yellow River is an unusual river, and this result should not be interpreted as typical of rivers
in general.
Calculation of annual Flow Health score of an environmental flow regime An environmental flow regime is specified as a flow for each month, and perhaps including a periodic flood.
Alternatively, it is specified as achieving certain scores for the flow metrics. The inclusion of a periodic flood
means that some of the flow metrics (HM, HF and FFI) can vary from year to year. The annual score for a
specified regime is calculated within Flow Health by first generating a new flow series based on the
environmental flow regime that is the same length as the reference time series. The annual scores are calculated
for the environmental flow series and the minimum scores for each metric in the series are then reported as the
annual scores.

43
Figure 21. Monthly environmental flow regimes devised by a holistic environmental flow regime (top and middle), and by manipulating reference mean monthly flows within Flow Health (bottom). This example is for Huayuankou, lower Yellow River, China. The July flow is fixed, for the purpose of scouring sediment.
Generating new data time series Flow Health software can be used to generate two types of new data time series. The series based on the
designed environmental flow regime is created as a simple repeating time series. The synthetic time series based
on a rescaling of the reference series to achieve the desired Flow Health score is more complex.
The synthetic time series is created on the basis if the 12 values of monthly flow specified as the environmental
flow regime. Each month of the entire reference time series is then scaled according to the environmental flow
distribution, but there are constraints about retaining peak flows and minimum flows. The average Flow Health
Low risk environmental flow regime
Medium risk environmental flow regime
Target is 30%MAF; July flow is fixed; other months set as percent of reference monthly flows;
Flow Health index = 0.28Volume = 42%MAF
Flow Health index = 0.15Volume = 29%MAF
Flow Health index = 0.16Volume = 30%MAF

44
scores over the period are then checked. This process is repeated ten times – each time with a slightly different
scaling factor (based on the difference in calculated and desired Flow Health scores). The sequence with the
Flow Health score closest to that of the environmental flow regime is selected as the synthetic time series.
Discussion The Flow Health suite of sub-indicators was developed to meet the demand for an annual hydrological index that
was related to ecosystem health, which could be applied to rivers across a wide geographical range, and which
could be calculated using monthly gauged flow data. The approach can also be applied to water level data from
rivers and lakes. Given that Flow Health is a hydrology-only approach, and the monthly time-step is relatively
coarse from the perspective of ecological processes, the connection between the flow metric scores and
ecological health at any particular site is at the conceptual level.
Flow Health highlights impacts of flow regulation, and also highlights years of naturally lower than usual flows,
both of which are important determinants of ambient ecological health, as measured using bioassessment
methods.
The Flow Health approach cannot directly indicate changes in brief, low frequency events, such as brief spells of
cease to flow or flow pulse and flood event peaks. However, it is possible that certain characteristics of these
lower frequency events are significantly correlated with monthly flow volumes. Further investigation is required to
determine if this is the case, and if so, to what extent the correlations are consistent across different rivers.
Although Flow Health was not primarily intended for use as an environmental flow design tool, it could be used in
this way. If all nine flow metrics score 1, the recommended monthly flows would constitute a reasonably high
percentage of the reference flows (often greater than 60 percent of mean annual flow in the reference period).
However, such flow recommendations should always be regarded as preliminary, and used only for planning
purposes.
References Clausen, B. and Biggs, B. 1997. Relationships between benthic biota and hydrological indices in New Zealand
Streams. Freshwater Biology 38: 327–342.
Gippel, C.J., Bond, N.R., James, C. and Wang, X. 2009. An asset-based, holistic, environmental flows
assessment approach. Water Resources Development 25(2): 305-333.
Gippel, C.J., Zhang, Y., Qu, X., Kong, W., Bond, N.R., Jiang, X. and Liu, W. 2011. River health assessment in
China: comparison and development of indicators of hydrological health. ACEDP Australia-China Environment
Development Partnership, River Health and Environmental Flow in China. The Chinese Research Academy of
Environmental Sciences, the Pearl River Water Resources Commission and the International WaterCentre,
Brisbane, September.
Gordon, N.D., McMahon, T.A., Finlayson, B.L., Gippel, C.J. and Nathan, R.J. 2004. Stream Hydrology: An
Introduction for Ecologists. Second Edition, John Wiley & Sons, Chichester.
Graf, W.L. 2006. Downstream hydrologic and geomorphic effects of large dams on American rivers.
Geomorphology 79: 336-360.
Growns, J. and Marsh, N. 2000. Characterisation of flow in regulated and unregulated streams in eastern
Australia. Cooperative Research Centre for Freshwater Ecology Technical Report 3/2000. Cooperative Research
Centre for Freshwater Ecology and Centre for Environmental Applied Hydrology. University of Canberra,
Canberra. September.
Haines, A.T., Finlayson, B.L. and McMahon, T.A. 1988. A global classification of river regimes. Applied
Geography 8: 255-272.

45
Hughes, J. and James, B. 1989. A hydrological regionalization of streams in Victoria, Australia, with implications
for stream ecology. Australian Journal of Marine and Freshwater Research 40: 303–326.
Kennard, M.J., Pusey, B.J., Olden, J.D., Mackay, S.J., Stein, J.L. and Marsh, N. 2010. Classification of natural
flow regimes in Australia to support environmental flow management. Freshwater Biology 55: 171-193.
Mathews, R.C. Jr and Bao, Y. 1991. The Texas Method of preliminary instream flow assessment. Rivers
2(4):295-310.
Puckridge, J.T., Sheldon, F., Walker, K.F. and Boulton, A.J. 1998. Flow variability and the ecology of large rivers,
Marine and Freshwater Research 49: 55-72.
Richter, B.D., Baumgartner, J.V., Powell, J. and Braun, D.P. 1996. A method for assessing hydrologic alteration
within ecosystems. Conservation Biology 10: 1163-1174.
Richter, B.D., Baumgartner, J.V., Wigington, R. and Braun, D.P. 1997. How much water does a river need?
Freshwater Biology 37: 231-249.
Richter, B.D., Warner, A.T., Meyer, J.L. and Lutz, K. 2006. A collaborative and adaptive process for developing
environmental flow recommendations. River Research and Applications 22: 297-318.
Richter, B.D., and G.A. Thomas. 2007. Restoring environmental flows by modifying dam operations. Ecology and
Society 12(1): 12. [online] URL: http://www.ecologyandsociety.org/vol12/iss1/art12/.
Tennant, D.L. 1976. Instream flow regimens for fish, wildlife, recreation and related environmental resources.
Fisheries 1(4): pp. 6-10.
Texas Parks and Wildlife Department 2003. Environmental Flow Targets: Planning Criteria of the Consensus
State Water Plan. Austin.