flow of funds
TRANSCRIPT


• When aggressive investors or traders become nervous about the stock market, they usually sell stocks and place the funds into money market mutual funds.
• Margin debt, the amount of funds that customers at brokeragehouses borrow for commitments in stocks, has historically beenconsidered a sentiment indicator.
• The theory was that when markets became speculative andattracted the less-sophisticated and less-knowledgeableinvestors and traders, who began to trade on margin, the marketwas near a top.

• Today’s speculator, instead of borrowing from his brokeragefirm, can purchase and sell various highly leveraged derivativessuch as options and futures that avoid being reported to theexchanges as margin debt.
•It uses a 15-month rate of change as the indicator of margin debtexcess. When, over this period, the indicator crosses above –21%, abuy signal is generated, and when it crosses below 57%, a sellsignal is generated. Eighteen months after a buy signal, the stockmarket has advanced on average 47.2%, and on sell signals it onlyadvanced 2.0%. This has worked well in the period from 1970through 2010, but potential change in the parameters must beconsidered for the future.


A secondary offering is the offering of additional shares of stock in acompany that is already publicly traded, as opposed to a primaryoffering which occurs when stock in a newly publicly traded company isoffered. This is usually a bearish sign for two reasons.
First, it is a sign that more supply is coming into themarketplace, soaking up available funds. Following the basicprinciples of economics, as the supply of stock increases, theprice of stock will fall.
Second, the sellers, usually insiders, are liquidating. Theseinsiders will try to sell stock at times when they think the priceis relatively high.
Thus, an increase in public offerings is directly related to supply and demand for stock and is also a sentiment indicator.

Household Financial Assets
Money Supply
Bank Loan
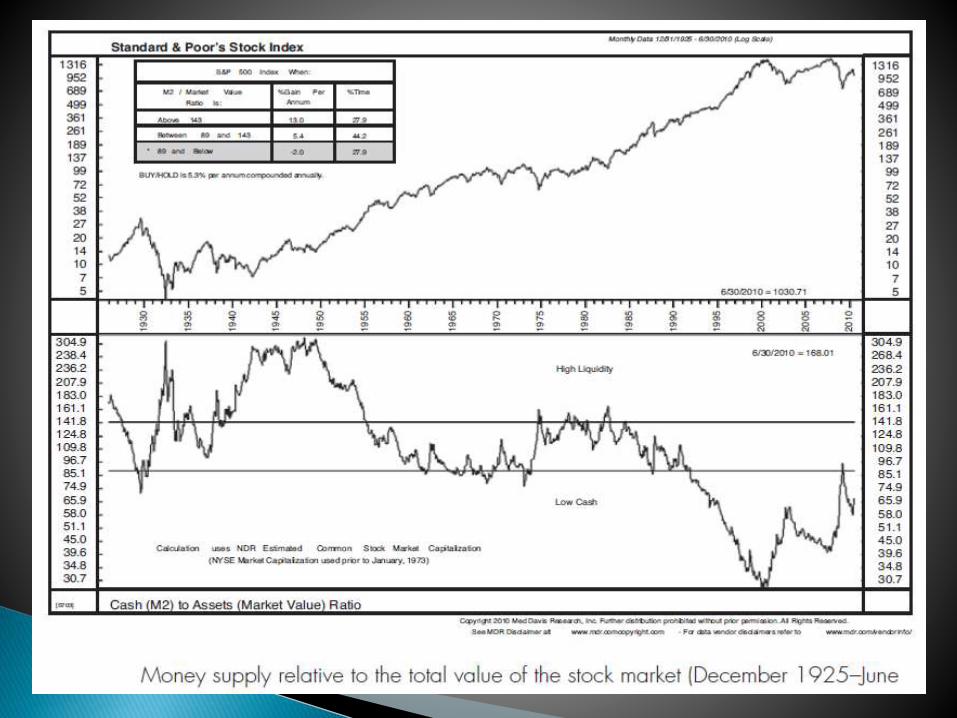
•Households, like corporations and governments, have different kinds of assets. They have both physical assets, such as cars and houses, as well as financial assets, such as stocks, bonds, mutualfunds, and banking accounts.•Some of their financial assets are liquid and some are not.•Liquid assets can be converted to cash quickly; cash, bank deposits, money market mutual funds, U.S. Treasury bonds, notes, and bills are liquid financial assets.• Other financial assets cannot always be converted to cash quickly; stocks generally are considered to be more liquid than other financial assets, such as pension funds, retirement accounts, profit-sharing accounts, unincorporated business ownership, trusts, mortgages, and life insurance.• A ratio of liquid financial assets to total assets shows how “liquid” households are—in other words, how easily they can raise cash if they need it. Generally, the more liquid households are, the more able they are to invest in stocks. When household liquidity is high, it is, therefore,favorable for the stock market, whereas low liquidity is negative for the stock market.

The data presented in above Figure shows a substantial decline inhousehold liquidity in the 1990s. This is one reason why consumerdebt rose so strongly and why households were unable to withstandthe severe economic contraction. During severe economiccontractions, one major source of funds for cash-strapped householdsis the stock market. Thus, this indicator, although it does not givemechanical signals, does measure the potential funds for stockdemand or supply.

• Expansion in the money supply is a measure of potential demand forstock, as well as other assets, and is, thus, a rough measure of thepotential for business and stock market expansion.• Increases in the money supply have been historically associated withincreases in economic growth and productivity.
Ned Davis Research has found that when this ratio exceeds 143, theamount of money available is large, and, consequently, the stock markettends to rise on average 13.0% per year versus an average 5.3% buy-and-hold average annual increase. On the other hand, when the ratiodips to 89 and below, money is scarce, and the stock market tends todecline. This relationship is highlighted in Figure below.

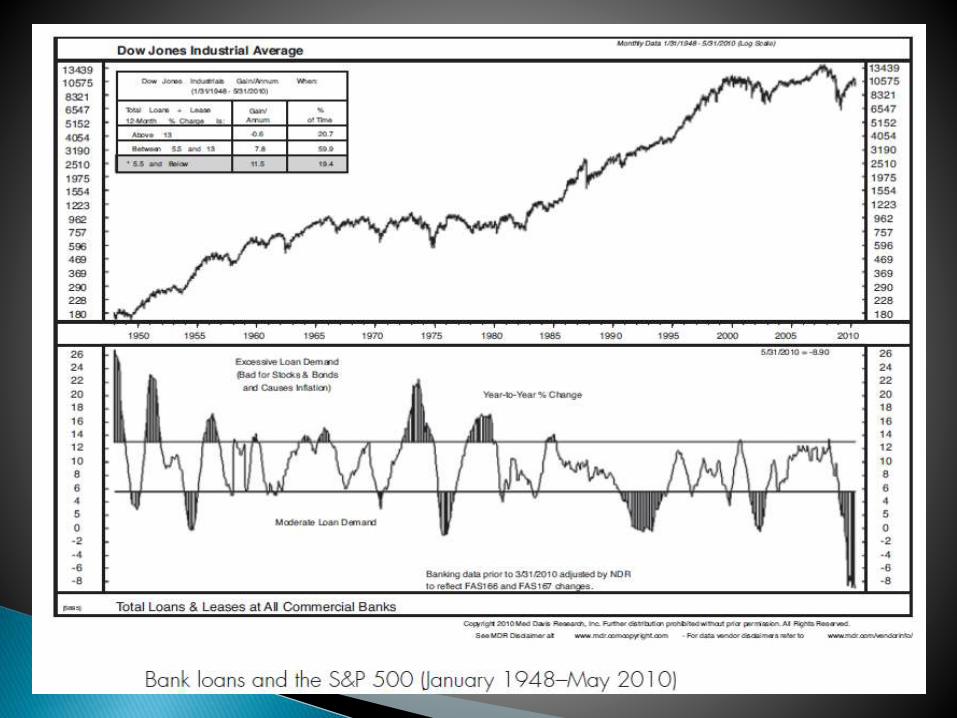
Generally, an increase in loan activity, the amount of loans beingcreated and existing, is a sign of increased business activity. It can alsobe a sign of increased speculation and/or a particular period whenbanks, because the yield curve is so much in their favor, become lessprudent in their lending policies.
Ned Davis Research found that since 1948, a year-to-year risein bank loans (and leases) greater than 13% indicated an overheatedeconomy and a high likelihood of a stock market decline. When bankloans only expanded at 5.5% or lower, the economy was healthier, andthe stock market rose on average 11.5% per year on average.

Short-Term Interest Rates
Long-Term Interest Rates

The theory behind using short-term interest rates as stock marketsignals is based on two assumptions.
First, interest-bearing investments are alternatives to stockinvestments. In other words, savers make choices about placingtheir investment funds in interest-bearing securities or thestock market. When interest rates are relatively high, theinterest-bearing securities look relatively more enticing.
Second, interest rates directly affect costs for corporations and,thus, corporate earnings.
The interest rate itself is important because the expected rate of returnin the stock market must be greater than the short-term interest ratefor investors to invest.

Federal Reserve policy indicators and short-term interest rates aregenerally very accurate, though often early, as a predictor of stock marketdirection. Figure on next slide shows the relationship between short-terminterest rate movements and the S&P500. During the speculative bubble in1998 to 2000 and its collapse into 2002, however, interest rates had littleeffect upon the market’s direction. Emotion had overcome logic, and therelationship between short-term interest rates and the market wasabandoned for greed to make easy money and fear of missing the nextupward wave in stock prices. Again, in the period between 2007 and 2009,when the stock market collapsed to a new 10-year low, lower short-terminterest rates had no positive effect on the stock market. Financial jargoncalls this behavior “pushing on a string,” when short-term rates do notcause incentives to buy stocks. The last time rates did not work was in the1920s speculative bubble and early 1930s collapse. They were reliable formore than 50 years thereafter.

As a rule, long-term bonds have tended to move in the same directionas the stock market. In other words, long-term interest rates havetended to move in the opposite direction from the stock market. As thebond market makes a major bottom, the stock market often makes amajor bottom also. At tops, the bond market tends to lead the stockmarket and is, thus, very often, an early indicator of trouble ahead forthe stock market. As in short-term interest rates, this relationshipbroke down during the period of the speculative bubble and collapsebetween 1998 and 2002 and between 2007 and 2009. Prior to thoseperiods, the relationship had been steady for over 50 years and willlikely return.

• The velocity of money is a measure of how fast money turns over in theeconomy. It is calculated as a ratio of personal income to M2.
• Historically, money velocity is related to inflation, as the faster moneycirculates, the more pressure exists on prices, and as a leading indicatorof long term interest rates, again because it reflects inflationary pressure.
In terms of being an indicator for the stock market, Ned Davis Researchhas found that when money velocity (a monthly figure) rises above its13-month moving average, the stock market has advanced 3.4% perannum on average. When money velocity declines below its 13-monthmoving average, the stock market has advanced 10.1% per annum. Thisrelationship is shown in Figure 10.9. Clearly, inflationary pressures fromincreased money velocity put a damper on stock market prices.


The Misery Index is a universal index that can be calculated for anycountry by simply summing the country’s inflation and unemploymentrates together. The original Misery Index has been modified to create theAmerican Misery Index. The American Misery Index is calculated byadding the inflation, unemployment, and interest rates. Figure 10.10shows how the level of the American Misery Index has related to theperformance of the DJIA since 1966. This figure shows the results ofbuying the DJIA whenever the American Misery Index falls by 0.3 pointsand selling the DJIA whenever the index rises by 3.2 points. The tradingaccuracy of this system is 75% favorable, and its gain per annum isgreater than the buy-and-hold gain per annum by over 4%. Because thecalculation of the Misery Index is easy and low-cost, the profitable resultsof this trading system appear valuable.


The Federal Reserve has three main tools for adjusting the money supply:
1. Changing the amount of reserves that banks are required to hold,
2. Hanging the discount rate, and
3. Buying and selling U.S. Treasury and federal agency securities through its open market operations. The third tool (open market operations) is the one that the Fed most often uses.
Iowa Electronic Markets

Whenever the Federal Reserve raises either the federal funds target rate, marginrequirements, or reserve requirements three consecutive times without a decline,the stock market is likely to suffer a substantial, perhaps serious, setback.
This simple rule is still relevant. Although it tends to lead a market top, it is something that should not be disregarded. As shown in Figure on next slide the rule has been followed by a median decline of 17%. Only two possible incorrect signals were given since 1915: The 1928 signal, prior to the 1929 crash, was possibly too early, and the 1978 signal was probably too late. Thus, this signal has an accuracy record of at least 87.5%.
The Two Tumbles and a Jump indicator was first mentioned in Fosback’s 1973 edition of Market Logic. It is essentially the opposite of Gould’s Three-Steps rule. Although it uses changes in the Federal Reserve funds target rate, margin requirements, and reserve requirements, it looks for two consecutive declines, or tumbles, in any of these policy variables. It has an excellent history of predicting the stock market rises. As Figure 10.13 demonstrates, the percentage of accuracy since 1915 is 84%, with some of the errors considered questionable.


Banks traditionally practice maturity intermediation, borrowing short-term funds and lending to corporations or individuals over longerperiods. Thus, they are said to “borrow short, and lend long.” Their profitdepends on the spread between the cost of funds, the short-terminterest rate, and the return from loaned funds, the long-term interestrate. As short-term interest rates rise, presumably from Federal Reservepolicy action and long-term interest rates remain steady or decline, theyield curve becomes flatter and the banks are unable to profit as muchfrom the spread. The yield curve, therefore, is a crude measurement ofbank potential profitability. Bank profitability affects interest rates, andinterest rates affect the stock market. Thus, the yield curve is aforecaster of stock market direction, and, historically, it has had anacceptable record of anticipating major turns in the stock market.
