flow of microfinance in assam under shg models: with...
TRANSCRIPT

150
Chapter-3FlowofMicrofinanceinAssamunderSHGModels
WithSpecialReferencetoBarpetaDistrict
31 Introduction
The growing evidence of microfinance performance and success stories in the
World established microfinance activities to a new level for its socialistic motives
of helping the poor people despite having its commercialisation aspects It is only
microfinance and no other system of finance which proved effective and
sustainable mostly for the deprived women and ignored sections of people of our
society in either formal or informal system of financial service history
Microfinance is the sense of small scale financial products and services for
unbanked poor and deprived section of the society residing in rural and semi-
urban areas and in urban slums It is the source of loans savings and other basic
financial services for the poor (CGAP) (Khanka 2010) In India microfinance
sector made remarkable progresses over the years in terms of huge clients reached
loan disbursed and outstanding refinancing savings giving access to income
generation scope to self-employment empowerment and also in linking to banking
services by its SHG-Bank linkage programme thus paving the way for financial
inclusions (Das 2012) Its magic performance and flow of credit to the needy
borrowers made microfinance a household name and also for the result of benefits
accrued by the poor from its services (Srinivasan 2009) If we look back to the
performance of flow of microfinance and other services from now to its formal
starting under the initiative of NABARD in 1992 then it seems that it has given
151
tremendous results The initiative taken in 1992 to make the traditional and formal
banks to extend financial services to deprived sections through informal Self Help
same has been recognised as a decentralised cost effective and fastest growing
access to variety a of sustainable financial services from the banking system by
becoming members of nearly 8 million SHGs (NABARD 2012)
Microfinance services under its various programmes have emerged over the past
two decades as the important tools for economic development and the
constrained and vulnerable in various countries with an acute aim of poverty
alleviation (Dutta amp Upadhaya 2013) While in the first decade of the programmes
the task was experimenting the potential of SHGs and its system to organise people
towards savings extending loans among the group members and to work in group
spirit to serve as social collateral to provide loan the second decade laid emphasis
on establishing the reliability of the models across the regions The movement of
linking of SHGs to bank of only 500 SHGs in 1992 had grown over 05 million
SHGs by March 2002 and further to 8 million SHGs by March 2012 Together 8
million SHGs of the poor maintain a balance of over `6550 crore in the Savings
bank accounts with the Banks Over 44 million SHGs are regularly availing credit
facilities from the Banks During 2011-12 alone over 115 million Groups availed
loans amounting to ` 16535 crore from Banks and together 44 million Groups
having loans to the extent of ` 36340 crore as outstanding against them with the
financing banks as on 31st March 2012 Under the SHG-Bank linkage programme
152
over 103 million rural households have now access to regular savings through 796
million SHGs linked to banks and about 27 of these SHGs are savings linked
through the SGSY programme-the rural poverty programme of GOI (Government
of India) Interestingly bulk of their savings is used for internal lending which is
over 70 and only the balance is kept to the banks Over 79 of SHGs linked to
banks are exclusively women groups the most distinguishing features of
microfinance sector in our country
Further over 436 million SHGs have now access to direct credit facilities from the
banks and total bank loans outstanding against these groups is over `36340 crore
by March 2012 with an average of ` 83500 per group About 115 million SHGs
were extended fresh loans to the extent of ` 16535 crore during 2011-12 by all
banks and averaging `1 44000 per group with a growth rate of 137 over the last
year (NABARD 2012) But it is to be mentioned here that the services of
microfinance in terms of flow of credit clients reached etc are not uniformly
spread over in the country and disparities are found and following diagram has been
presented to understand the geographical spread of SHG-Bank linkage programme
in India as on 31st March 2012
153
Figure-31 Geographical Spread and Penetration of SHGs in India 2012-13
Source Status of Microfinance in India 2012-13 PDF Report-NABARD link httpindiamicrofinancecomstatus-microfinance-india-2012-2013-pdf-report-nabardhtml
So the programme is unequally spread over in the country as depicted in the above
map further it is obvious from the same that geographical reach of the programme
is moderately spread in the North-East Region (NER) leaving Manipur and
Nagaland and a bit highly spread over in the state of Tripura and Mizoram The
NER of India possess an interesting case for the study of Indian microfinance the
unusual topography low population low level of commercialisation and
infrastructure transport communication and power bottlenecks have restricted the
154
reach and spread of financial services As a result formal microfinance initiatives
began lately from the rest of the country (Das D ) The loan received in 2011-12
accounts for only 273 percent of the total loans received in India By the end of
March 2012 the total amount of loan disbursed in the NER was only ` 4512874
lakh of which 42 percent was in Assam Tripura accounted for 5128 percent and
no other state received more than 5 percent (NABARD 2012)
32 Microfinance in Assam
Assam is one of the relatively backward states of our country characterized by low
per-capita income poor rate of capital formation slow growth of state income in-
adequate infrastructure facilities geographical isolation and communication
bottleneck inadequate exploitation of natural resources poverty etc though very
rich in natural resources (Roy) As per 2011 (provisional) census report population
population and
86 percent is rural population Assam is still one of the industrially backward states
and remains predominantly an agrarian economy where 53 percent of total
population depends on agriculture and allied activities (Statistical Hand Book of
Assam 2006) Capital deficiency is another serious problem for Assam thus why
Assam is under-developed As the per capita income in Assam is very poor the
savings potential is also low but the marginal propensity to consume of the people
of Assam is very high on account of sub-standard living conditions of the majority
economy cannot develop due to lack of capital formation (Sarmah 2010)
Credit facility which is an important factor for development is also very poor in
Assam the per capita bank credits in Assam stood at ` 667 in 1995 as against
` 2285 for all India The credit deposit ratio in Assam stood at 235 in 1970 as
against 559 of India and in 2006 the credit deposit ratio in Assam was 424
155
percent as against 725 percent for all India Further in 2011 the credit deposit
ratio in Assam was 356 as against 751 for all India (Quarterly Statistics on
Deposits and Credit of Schedule Commercial Banks March 2007 to March 2011)
Thus the lending policy of the commercial banks is far from generous for the poor
of the State of Assam Thus in the absence of large scale credit facilities industries
in the private sector cannot grow satisfactorily The above facts about Assam
economy are presented to depict the credit gap from formal sector and the acute
need for alternative sources of formal or informal financial service just to cater the
growing needs of finance in Assam
Farmers in Assam are facing a chronic problem of lack of adequate financial
facilities from the very beginning and they have been depending on village money
lenders who charge a very high rate of interest (Dhar 2009) (Das Dutta Kakoti amp
Deka 2011) Thus as an informal source of finance for the poor micro-credit also
existed in Assam and the poor people borrowed mainly consumption loan from
those money lenders or Mahajans (ie Capitalist) for their emergency needs
(Baruah 2012) Hence micro-credit
Assam as well and that gradually developed and converted into
microfinance and the details about its reasons has already been mentioned in
chapter-1
So from a long time the provision of micro-credit existed in Assam especially in
the villages and was used by the farmers and the poor people as a source of finance
instead of having many difficulties Thus exact date of microfinance cannot be
taken into account but from 1992 function of microfinance started with a new
concept and strategy in the whole country as well as in Assam and thus was the
beginning of microfinance in a bold-way in the State NABARD launched the Self
Help Group (SHG)-bank linkage programme in 1992 in Assam (Dhar 2009) The
SHG-bank linkage is thrift based programme which offers provisions of thrift
156
credit and other financial services of small amount basically for the poor people
The available literature indicate that the SHG-bank linkage programme has
emerged as an alternative source of credit for the rural people of Assam and also
enables the members to engage in income generating activities NABARD has
devised region-specific strategies and interventions and accordingly special focus
is being given on the NER The programme has not progressed in Assam at the
same pace as that in the rest of the country for the reason of lack of awareness
among farmers the uncertain law and other situation and apprehension of bankers
regarding recovery of loans etc The SHG movement in southern states of India has
been successful to a great degree in uplifting the socio-economic conditions of the
down-trodden which can also be achieved in Assam if adequate encouragement
and help is provided to them (Roy) However a silent revolution of empowering
the downtrodden more particularly the women to live a better life is going on in
Assam The concept of SHGs as a changing agent has come quite late in Assam as
compared to other parts of the country It has received tremendous response
especially among the rural women and that is being proved as by March 2002
there were only 18005 SHGs throughout the state of which 10849 SHGs were
women groups During 2004-05 20528 SHGs have been credit linked with bank
loan of ` 773224 lakh and NABARD has sanctioned grant assistance of ` 7670
lakh to 26 NGOs and ` 1095 lakh to three constituents of Assam GraminVikash
Bank viz Pragjyotish Gaolia Bank Subansiri Gaolia Bank and Lakhimi Gaolia
Bank for the promotion of SHGs in Assam (Executive Summary Part-I An
Overview of State Focus Paper 2006-07) Again according to Nanda Talukdar
Foundation study upper Assam has been benefited more from the state government
initiative even though the actual intention was to benefit lower Assam (Roy) But
the programme has gather momentum from the year 2001-02 onwards and by the
end of March 2012 a total of 276565 SHGs have been bank linked and out of that
157
218763 are only women groups in Assam and of the total SHGs 145821 SHGs
were credit linked (NABARD 2012)
The Assam regional office of NABARD has played a vital role by providing
financial assistance of ` 41606 lakh to 119 NGO-SHPI24 projects for promotion
and credit linkage of SHGs and by 31st Oct 2011 a total of 16409 SHGs are credit
linked in Assam as against ` 35806 lakh grants assistance provided to 119 NGOs
for the promotion of 14259 SHGs up to 31st Oct 2010 To facilitate and to establish
system for meeting the demand of credit two Microfinance Institutions (MFIs)
ASOMI and RGVN have been sanctioned an amount of ` 100 lakh each towards
capital support by NABARD (Economic Survey Assam 2011-12) Again in areas
where the NGOs and Bank network is weak a scheme for assisting Individual
Rural Volunteers (IRVs) for the promotion and linkage of SHGs was introduced
and the scheme is currently implemented through the RRBs and SBI in Assam
NABARD has sanctioned an assistance of ` 13518 lakh to utilise the services of
751 IRVs in all the 27 districts of Assam for promotion and credit linkage of 7510
SHGs with banks Swarnajayanti Gram Swarojgar Yojana (SGSY) is the mother
programme of poverty alleviation programmes and by March 2011 194 lakh
SHGs have been covered under the ambit of bank credit in Assam out of which
102166 SHGs have been covered only by SGSY programme
North Eastern Development Finance Corporation Ltd (NEDFi) is also playing an
active role in microfinance service in NER by implementing its microfinance
schemes which is instrumental for financial inclusion and is supporting the NGOs
for on lending to the needy borrowers (ie preferably to SHGs and to individual
borrowers) and by March 2011 the corporation has succeeded in reaching-out
24 NGO-SHPIsare the Non-government Self-help Groups Promotional Institution who is engaged for the management and promotion and credit linkage of SHG for their active and sustainable performance
158
159983 beneficiaries of which 83 are women in the NER through 421
NGOsMFIs In Assam total cumulative sanctions and disbursements of loans
figures are over ` 80 crore and ` 77 crore respectively
Amount in Lakh
160
Some important factors that can drive the growth of microfinance sector in Assam
are mentioned below Again Assam is the only leader State (followed by Tripura)
in NER in the performance of microfinance under SHG models in terms of SHG
formation Savings Loaning reaching to beneficiaries etc and that is owing to the
following important reasons
Assam is the hub for all major commercial and non-commercial
activities in the NER which gives it an edge over other states moreover
all important offices are also located in the state
Assam is already having a number of MFIs and some of the big MFIs
are RGVN ASOMI Bandhan etc Thus microfinance has already
begun in the state and there is no need to start from scratch (Sarma
2010)
Microfinance sector in Assam is growing rapidly and much can be expected from it
It will benefit the rural people especially women and deprived of formal financial
system in meeting their credit needs and other financial services to strengthen their
economic condition The Chief Minister of Assam Mr Tarun Gogoi in an
interview said his government has given importance to this sector for its magic
performance in the world with the poor people and after recognising success story
of Bangladesh further mentioned he had already talked with Md Yunus the
Grameen Bank pioneer for suggestion for further effective implementation of the
microfinance programme in our state He is interested to implement the programme
especially in insurgency affected area to cope the young brains in income
generating and self-employment avenues and hopefully that will help to mitigate
the growing problems of insurgency in the state (Tribune 2007) (Devi 2012)
161
33 ProgrammesSchemes for Microfinance Services in Assam
Microfinance becomes an effective and sustainable means of finance for the poor
especially for the rural poor and women as for them there was no financial
assistancemechanism in our huge formal financial networks only due to their
inability to produce guarantees or collateral to enjoy the financial service mainly
the loancredit facilities The working spirit skills labour potentialities etc of the
poor people were never been softly recognised and credit worthiness was the only
condition to avail the credit facility for them But the success story of Grameen
Bank of Bangladesh channelized the thoughts about poor people including women
to a new way and now it is believed they are not in
need of charity rather needs more exposure and easy access to credit (Yunus amp
Jolis 2007) To spread the services of microfinance for the benefits of needy people
and to achieve other greater objectives like poverty alleviation financial inclusion
rural development self-employment economic empowerment women
empowerment etc the apex authorities introduce some policy measures to
accomplish those specific objectives Those policy measures or initiatives taken to
extend the service of microfinance to the targeted people what are called the
microfinance schemes or programmes
Again 86 percent of total population of Assam are living in rural areas and most of
them are with poor living conditions and such situation barely demand for various
schemes which can be used for their development and also for the development of
the rural Assam Aiming the same and from the sixth five year plan onwards
various self-employment generation programmes have been implemented in Assam
as in other parts of the country A brief interpretation of some of the popular
schemesprogrammes which directly or indirectly contributed and helped to extend
Microfinance Services in Assam are mentioned below
162
i Integrated Rural Development Programme (IRDP) The IRDP was
launched in the state in 2nd Oct 1980 and seek to promote self-employment
by developing productive assets and providing inputs to the rural poor
through a mix of subsidy and bank credit and by integrating multiplicity of
agencies and programmes The main objective of the programme is to
provide financial assistance to the identified rural poor families for taking
up income generating activities in the primary secondary and tertiary sector
of the rural economy and the programme was implemented in 5050
financial assistance of the central and state government The programme
implemented through District Rural Development Agencies (DRDA) at the
district level Thus the basic objective of IRDP was to promote self-
employment of the poor households along with transfer of productive assets
so that they can earn income sufficient to cross the poverty line The number
of families assisted by IRDP in Assam in 1991-92 was 46416 with the
amount of credit disbursed ` 1974 crore The beneficiaries during 1998-99
included 11477 small farmers 18040 marginal farmers 11145 agricultural
labourers and 6602 rural artisans with the credit disbursement of `3964
crore and subsidy amounted to ` 2284 crore (Dhar 2009)
ii Development of Women and Children in Rural Areas (DWCRA) The
programme on DWCRA was introduced in the year 1982-83 on Pilot
Project basis The objective of the programme is to provide women
members of rural families below poverty line with opportunity of self-
employment on a sustained basis Under this scheme income generating
activities are taken up by formation of group of 10-15 women having same
economic background In 1995-96 a total of 856 groups of women were
formed in Assam and of which 635 groups were engaged in economic
activities with financial assistance of `19338 lakh During 1998-99 a total
163
of 2868 groups were formed in Assam with the financial expenditure of `
42361 lakh (Dhar 2009)
iii Training of Rural Youth for Self-employment (TRYSEM) The National
Scheme of training of Rural Youth for Self-employment is a programme for
generating self-employment opportunities by imparting training to the rural
youth in various trades and skills In Assam the scheme has been in
operation since 1979-80 as a supporting component of IRDP During the
year 1998-99 under this programme a total of 6714 numbers of youth were
trained in various trades and vocations with the financial allocation of `
27179 lakh (Dhar 2009)
iv Swarnjayanti Gram Swarozgar Yojana (SGSY) The SGSY is the major
programme for the self-employment of rural poor of our country The
programme came into effect from 01041999 after review and restructuring
of earlier programmes like IRDP TRYSEM DWCRA Supply of Toolkits
in Rural Areas (SITRA) and Ganga Kalyan Yojana (GKY) besides Million
Wells Scheme (MWS) and those earlier programmes were not in operation
after the introduction of the SGSY (SGSY 2010) This a holistic
programme covering all aspects of Self-employment such as organization
of the rural poor into Self-help Groups (SHGs) and their capacity building
selection of key activities planning of activity cluster training credit
marketing support etc The scheme is funded by the central and state Govt
at the ratio of 7525 The objective of the scheme is to assist the rural poor
families (Swarozgaries) to come above poverty line by providing them
income generating assets through Bank loan and Government subsidy The
DRDAs at the district level are the sole authority for implementation of the
programme (Dhar 2009) By March 2012 a total of 2123 lakh SHGs are
164
linked with the total amount of savings amounted to ` 139525 crore as
against of 1694 lakh SHGs with amount of savings was ` 129262 crore by
31st March 2010 under SGSY scheme and loan disbursed during 2011-12
amounted to ` 264356 crore to 210 lakh SHGs and balance of outstanding
loan up to 31st March 2012 amounted to ` 805483 crore with 1216 lakh
SHGs under SGSY scheme in India (NABARD 2012) (Srinivasan 2009)
(Gogoi 2013)
v Special SGSY This programme is also functional since 1999-2000 in the
Muga industry in Assam in eight selected districts namely Goalpara
Dhubri Kamrup Lakhimpur Dhemaji Kokrajhar Karbi-Anglong and
Golaghat During 2001-2002 an amount of `33334 lakh was spent and
2219 numbers of Swarozgaries were assisted as against 2462 Swarozgaries
with an expenditure of ` 6322 lakh in 2000-2001 (Dhar 2009)
vi National Rural Livelihood Mission (NRLM)25 The National Rural
Livelihood Mission (NRLM) was established in June 2010 by the
Government of India to be implemented in all States of the country to
establish efficient and sustainable institutions of the rural poor for enabling
them to increase household income NRLM mainly encompasses four inter-
related tasks (a) mobilizing all rural poor households into effective self-
help groups (SHGs) and SHG federations (b) enhancing access to credit
and other financial technical and marketing services (c) building
capacities and skills for gainful and sustainable livelihoods and (d)
improving the delivery of social and economic support services to poor
25Compiled from Procurement Manual of National Rural Livelihoods Project Ministry of Rural Development Government of India Retrieved from httpruralnicinsitesdownloadslatestNRLM20Procurement20Manualpdf
165
Under NRLM Government of India is availing a credit from the
International Development Association (IDA) for implementing the
National Rural Livelihood Project (NRLP) to broadly support the following
components (i) Institution and human capacity development at the
National State District and Sub-District level (ii) State Livelihood Support
towards establishment of institutional platforms of the rural poor for
improved access to financial livelihood and public services (iii) Innovation
and Partnership to identify and partner innovative ideas which address the
livelihood needs of the rural poor (iv) Project management and monitoring
and learning systems
Under NRLM federated structures of Self Help Groups (SHGs) will be
formed at different levels (village block district) for undertaking value
chain linked activities in dairy agri-business and similar enterprises for
better production storage marketing etc of the produce of the members of
the SHGs These groups would undertake procurement of goods works and
services in line with the selected value added activity (NRLM) The
(Gogoi 2013)
vii 26 This scheme is for extending
microfinance services only in the state of Assam and the major thrust of the
having the vast expansion of the
formal financial system in the country credit facilities have not adequately
covered the need of small loan of our people at the grass root level The
is a
special initiative taken-up by the Govt of Assam to expand micro credit
26 Khudra Reen (means Small Loan) implemented by Assam Financial Corporation Paltan Bazar Guwahati Retrieved from httpwwwafconlinegovindocumentbroucherpdf and httpwwwafconlinegovinpdfmfnbbrochure Englishpdf
166
activities in the State by making available micro credit to Self-help Groups
(SHGs) Joint Liability Groups (JLGs) through NBFCs Sec-25 Companies
Registered Cooperative Thrift amp Credit Societies at cheaper rate of interest
The objective of the scheme is to encourage the practice of informal savings
and credit and help to inculcate the habit of borrowing and repayment
amongst the small and mid-sized agriculturists self-employed persons and
entrepreneurs in the rural as well as urban areas of Assam This would
enable their productive participation in the development of the State (Chief
Ministers Micro Finance Scheme-Assam Financial Corporation (CMMFS)
Khudra Reen) (Chief Ministers Micro Finance Schemes- Assam Financial
Corporation )
So above mentioned are the popular microfinance programmesschemes
implemented in Assam from time to time to extend the service of microfinance
especially to the rural poor Apart from these schemesprogrammes some other
activity based micro-credit services are also provided and are in operation in many
parts of Assam which are benefiting the poor people The microfinance
intermediaries NGOs MFIs etc have also developed some need based
programmes according to the suitability of local conditions and beneficiaries
demand like Entrepreneurship Loan Individual Loan for Shops Farming Loan etc
to provide microfinance service
ASOMI one of the leading MFIs of Assam has its own scheme for Self-
Employment of the rural people and it provides loan for (i) Agricultural Activities
(ii) Dairy Framing (iii) Piggery Farming (iv) Weaving and Ari polo (v) Cane amp
Bamboo Industry (vi) Ready-made Garments Industry Operation Rainbow is
another bold step of ASOMI the objective of this mission is to bring White
Revolution by milk production Blue Revolution by fish production Green
167
Revolution and Yellow Revolution by agricultural production etc (Bharali
2010)
Similarly RGVN is also offering individual programme for microfinance services
the Credit and Savings Programme RGVN-CSP programme of RGVN was
initiated to provide credit and other financial services to the people who are unable
to access the formal sector and poor women empowerment is their main criteria
though the programme started in 1995 but it is after 2005 the RGVN-CPS geared
up their services and are basically operating in twelve districts in Assam Another
programme known as Entrepreneurship Development Programme (EDP) which is
now modified as Entrepreneurship Development Loans (ENL) provide credit
facility to undertake entrepreneurial activity as self-employment (Deb 2012) CSP
delivers credit via two broad delivery modes such as Group Lending Model and
Individual Lending Model Under Group Lending Model poor women amp men are
provided credit through Self Help Groups (SHGs) and Joint Liability Groups
(JLGs) On the other hand Entrepreneurship Development Loan (EDL) comes
under Individual Lending Model (Borbora amp Sarma)
offers bigger loan to women who want
(Chartering into Untenured
Frontier Targetting the Hard Core Poor) for the need of women belongs to the
poorest of the poor community (Vikash 2008) Microfinance and Health
Protection (MAHP) Initiative etc (Bandhan)
168
34 Operating Models of Microfinance in Assam
The concept of microfinance involves informal and flexible approach for the credit
needs of poor It is equally important to provide the services of microfinance
- an effective manner to reap the
maximum benefits for both the lenders and borrowers and also for the sustainability
of the both Thus microfinance services are provide applying various
demands and others
factors and those microfinance service methodologies are established as Models of
microfinance (Shodhganga) In Assam also according to the needs and capacity of
the borrowers and other local conditions some models are in operation for lending
micro-credit to the beneficiaries and some are home grown models of Assam The
models which are popularly in operation are mentioned below
i) Self-help Group (SHG) Models it comprises three credit linkage models viz SHG Model-I SHG Model-II and SHG Model-III
ii) Joint Liability Group (JLG) Model
iii) Microfinance Institution (MFI) Model
iv) Individual Lending Model
v) Partnership Model
vi) Business Correspondent and Business Facilitators Model
So the models mentioned above are developed at the national level taking help or
example from many countries like from Bangladesh for SHG Models JLG Model
etc and discussion about these models have been given in Chapter-1 Apart from
the above mentioned models RGVN have developed certain need based micro-
credit delivery mechanism slightly different and efficient to meet the needs of the
borrowers of Assam Those programmes are-
169
vii) Entrepreneurship Development Program (EDP)27 Under this
method SHG or JLG loanee members who have good credit records
from last three months or those who have attained a certain level to
absorb more credit and shown entrepreneurial ability by virtue of their
work are availed credit facility and the amount of loan varies from `
15000 to `40000
viii) JLG Cluster Loan SHG Preliminary In this model the individuals
who are earning a very low income in urban rural and semi urban
groups are targeted ie small vegetable sellers fast food vendors
bangle sellers rickshaw pullers etc The maximum loan amount
approved is `2000 and the rate of interest charged is as low as 7 pa
ix) Micro Enterprise Loan Under this system the targeted customer is
different they are the educated men and women who are unemployed
with visible entrepreneurial ability The loan amount is higher and that
ranges from ` 25000 to `50000 Interest rate is same as JLG Cluster
loan but administrative cost is 5 in this case
Whatever be the system methods or methodology used to extend microfinance
services but their ultimate motive is to extend the benefits of micro-credit to the
grass-root level people who are mostly deprived from formal financial system and
are in need of financial support to improve their economic condition living
standard poverty condition and to develop their empowerment level In Barpeta
District of Assam all the models of microfinance mentioned above are more or less
functional but it is mainly dominated by SHG models as such many rural people
27 these are the RGVN special system of microfinance delivery programme designed and developed according to the needs and suitability of the borrower of the locality and these information have been collected from the article written by B Deb on Microfinance and Poverty Alleviation A case study on Rgvn-Csp published in India Journal of Applied Research Vol 2 Issue 3 December 2012
170
of the district understand SHG is a synonym of microfinance and SHG is the only
way out to get loans from the intermediaries So there is lack of awareness among
the people in the district which came to light during the field survey Again HDFC
and Axis Banks in the district stated partnership model microfinance recently with
some NGOs and extending microfinance service by forming groups in the locality
area of NGOs
35 Various Intermediaries of Microfinance in Assam
The success of microfinance programmes depends to a greater extent on its service
delivery mechanism support system and management from the intermediaries who
deal in microfinance To spread the service of micro finance in the state both
government and non-government departments and organisations have been working
from a long time and facilitating the service of small loan ie micro-credit savings
and partially other banking services Those departments and organisations which
are in e and they are involve
in many types of activities like selection of beneficiaries formation of groups
promotion of groups nurturing training financial assistance etc In the apex level
of the state some organisations which are contributing to the development of
microfinance are SIDBI NABARD and NEDNi They are the pioneer in
promoting microfinance service in Assam by providing finance support system to
NGOs and MFIs for on lending the service to the beneficiaries (Sharma 2011) The
government agencies like DRDA and its supporting office like Municipality
Boards Town Committees and Block Offices etc are the supporting and
implementing agencies at every town blocks and village levels of the microfinance
programmes popularly the IRDP SGSY and then NRLM etc
Microfinance becomes a sustainable alternative strategy among the developing
countries to cover its poor and hard-core poor and to save them from the grave of
171
poverty (Sundaram 2007) Thus many policy initiatives followed by various
programmes and schemes are being introduced from time to time to reach the poor
people to eradicate their vulnerable conditions by assisting financial service which
is the life-blood for their all-around development But providing this service only
by government agencies is not sufficient to cover the huge segment of people
demands and in Assam where 86 percent is (Census 2011) rural population it
seems as an impossible task to meet such target As such the service of
microfinance are also providing through NGOs MFIs etc for speedy coverage and
distribution of the benefits and all those Agencies Departments NGOs MFIs etc
are the intermediaries of microfinance NGOs are playing a significant role in the
empowerment of disadvantages women helping them stand on their own through
various socio-economic programmes (Mathaw amp Verghese 2011) vocational
training and other similar program
contribute to their socio-economic empowerment health awareness and general
sensitization such as education employment etc (Asif 2011) And their role
ranges from fulfilling the basic necessity of women to empowering them and lead
to the development of their families (Chatterjee amp Dar 2011) Literature suggests
that NGO interventions positively contribute to women empowerment (Lalitha
2011) In Assam also there are some home grown NGOsMFIs along with outside
organisations which deal in microfinance A list of those NGOsMFIs operating in
Assam is given below
i) RGVN (NE) Microfinance Ltd
ii) ASOMI (Asomi Finance Pvt Ltd)
iii) Bandhan (originally an NGO registered under West Bengal Societies Act But from April 2014 it obtained the banking license from RBI and
iv) Prochesta
v) Sanchays
172
vi) Namghar and Pujaghar
vii) Aasha
viii) Ujjivan
ix) Youth Vo
x) Volunteers for Village Development (VVD)
These are the organisations popularly working as NGOs or MFIs in different parts
of Assam and some of them are also performing in outside of the state in
microfinance and helping in the selection formation promotion nurturing training
of SHGs and more importantly linking those SHGs and beneficiaries with the
Banks thus moving forward the rural masses towards financial inclusion Their
performance is faster and in some cases NGOs are found more active in dealing
with people then GO (Government Organisation) (Desai 2005) and recognising
their performance more importance has been given to these organisations and the
areas where formal organisation and banking services are poor microfinance
services are extended involving local NGOsMFIs also known as SHG bank
linkage programme through NGOsMFIs ie falls under SHG Model-III Though
a good numbers of NGOsMFIs are existing in Assam but the microfinance service
are popularly dominated by only three of such organisation viz RGVN ASOMI
and Bandhan in the state and as well in some neighbouring states
Apart from those leading microfinance intermediaries in Assam many small
organisations are also found active in almost every district of Assam and popularly
working in their respective districts and within their limited areas and provides
microfinance service Interestingly some of the organisation are also accepting
deposits from the people and availing credit facilities as well They follow the
simple procedure of granting loan and make daily weekly or otherwise collection
and most of them are running their service out of their own funds As in Barpeta
district some of such organisations are Shibam Socio-Economic Development
173
Society Jyoti Finance Trupati Finance Anchalik Gram Unnayon Parishad etc
Similarly a number of NGOs are also working in the neighbouring Nalbari district
areas and are concerned with the formation and nurturing of SHGs namely
Weavers Development Society (WDS) Gramya Vikash Mancha (GVM)
DREAMS (Baruah 2012) AASHA (All Assam Socio economic Health
association) PITCCOSS (Pioneer Thrift amp Credit Co-operative Service Society
Ltd) Jivan-Jyoti Silpa Samabay Samiti Ltd Pragjyotika MaaLaxmi Economic
Development Society etc VITAL (Socio-Economic Development Society)
ORAITHA Economic Development Fund etc are in Baksa district of Assam (Das
D) In recent year some Private Sector Banks viz Axis Bank HDFC Bank have
also started functioning in Barpeta district in collaboration with some NGOs to
provide microfinance by forming SHGs and otherwise
36 Magnitude and Trend of Microfinance under SHG Models in the Period
Study
Microfinance has received considerable attention among the researchers policy
makers and financial service providers and is also considered as a powerful
instrument for achieving financial inclusion alleviation of poverty enabling the
rural poor to increase their income opportunities and reduce economic vulnerability
(Ghosh 2012) The Self-Help Group (SHG) - Bank linkage programme
implemented by NABARD since 1992 has become the only dominated model of
microfinance in India in terms of both numbers of borrowers bank loans disbursed
and loans outstanding savings etc Further to cope with the growing demand and
need for microfinance in the country the system of linking of SHGs have been
changed and designed for implementing through the GOs as well as NGOsMFIs
etc thus under SHG Models we have three credit linkage models in India which
are named as SHG Model-I SHG Model-II and SHG Model-III Microfinance
174
through SHGs has reached such a position in India that it is acknowledged as the
biggest microfinance programme in the world The progress of SHG-Bank linkage
programme in India was slow up to 1999 as only 32995 groups were credit linked
during the period 1992 to 1999 and since then the programme is growing rapidly
(Shodhganga) The researcher made an effort to present the magnitude and trend of
microfinance in the study period from 2007-08 to 2011-12 ie for five years under
the SHG Models and to attain the same necessary calculations discussions have
been made with the help of tables and diagrams Again this part of the study has
been sub-divided in to the following heads to cover the entire issue of the
magnitude and trend of microfinance generally in India and Assam and especially
in Barpeta District more clearly and elaborately thus sub-divided into
Position in India
Position in Assam
Position in Barpeta District of Assam
37 Position in India
Microfinance under SHG-Bank linkage programme has reached to over 103 crore
rural households and have access to regular savings through 796 lakh SHGs linked
to banks by March 2012 and 27 of these SHGs are savings linked through
SGSY programme the rural poverty alleviation programme of government of India
The Small beginning of linking only 500 SHGs to Banks in 1992 had grown to over
5 lakh SHGs by March 2002 and further to 7960 lakh SHGs by March 2012 in
India and the share of southern States are highest in the total number of SHGs
linked which stands to 46 while the share of North-East States remain small and
stands only 461 by March 2012 the lowest among all the regions The overall
175
progress under SHG-Bank linkage programme covering three SHG models are
given in the following table
177
From the above table progress under SHG-Bank linkage programme can be clearly
understood if we consider the SHG Savings with banks in the period of study it
has recorded a total growth of 5889 percent with an average growth of 1178
percent pa The growth rate of the same came below the average growth rate of the
period and recorded to only 730 and 670 percent respectively in 2010-11 and
2011-12 Together the 7960 lakh SHGs maintained a balance of over `655141
crore in the Saving Bank accounts with the Banks up to March 2012 with the total
growth of 7307 percent and an average growth of 1461 percent pa in the period
but recorded a negative growth of 67 percent in 2011-12 that owing to the decline
of formation of SHG under SGSY and also for increasing awareness at the SHG
level about the benefits of using the savings for internal lendingloaning
During 2011-12 alone 1148 lakh SHGs availed loans amounting to ` 1653477
crore from Banks in India which records a total growth of 8685 percent from
2007-08 to 2011-12 and an average growth of 1737 percent pa during the period
of study But the growth rate of the same was almost nil in 2010-11 and it was
only 001 percent Again the position of outstanding loans with SHGs reveals that
in 2007-08 outstanding amount of loans was ` 1510478 crore against 3527 lakh
SHGs which increased to ` 36340 crore with 4353 lakh SHGs by the end of
March 2012
Thus total growth came to 10169 percent in outstanding amount of loans during
the period of study As a result the position of total loan (ie total of loan
disbursed and loan outstanding) during 2011-12 stands to the amount of `
5287477 crore with 5502 lakh SHGs which recorded the total growth of 12073
percent from 2007-08 to 2011-12 and an average growth rate of 2415 percent pa
during the study period So it is seen that the growth rate of SHG are
comparatively coming down and a sharp fall occurred in loan disbursed and loan
178
outstanding from 2008-09 it even records negative growth in 2010-11 and 2011-
12 as given in the table The trend position and performance of SHG-Bank linkage
programme under SHG Model-I and Model-II is presented with the help of
following diagram
Figure-33 Position of SHG Savings with Banks Loan Disbursed and Loan Outstanding in India 2007-08 to 2011-12 (Amount in Crore)
Source Status of Microfinance in India 2011-12 2009-10 amp 2008-09 of NABARD
Again the areas where the banking services or branches of banks are not sufficient
or banks being over work-loaded the microfinance service in those places are
provided through NGOs and MFIs and that has developed the concept of MFI-Bank
linkage model (SHG Model-III) where the funding agenciesbanks etc provide
bulk loan to those organizations for on lending to the beneficiaries and SHGs
These intermediaries take care of SHGs in the formation nurturing promotion
training etc to sustaining them towards income generation by providing
microfinance mainly through SHGs In recent years this model has grown rapidly
and their service volumes have also increased in India (Gadiapannivar) The
performance under this model in India is present in the following table
05000
10000150002000025000300003500040000
2007-08 2008-09 2009-10 2010-11 2011-12
Performence under SHG Model-I amp II in India
Amount of Savings Loan Disbursed Loan Outstanding
180
Thus the performance of total amount of loan disbursed under this model
registered a total growth of 16421 percent and an average growth of 3284 percent
pa in the disbursement of loans from 2007-08 to 2011-12 but it recorded a
negative growth of 213 and 3839 percent respectively in 2010-11 and 2011-12
Again in case amount of loan outstanding with MFIs the balance of that in 2007-
08 was only ` 274884 crore with 1109 MFIs in India and that had reached to the
amount of` 1145035 crore with 1960 MFIs by the end of March 2012 Further
and more importantly negative growth had been registered which stands at 3253
percent from 2009-10 to 2011-12 in the amount of total loans availed but prior to
that the growth rate was positive Again the growth rate of MFIs who were
disbursed loans for on lending the beneficiaries had also slightly come-down to
negative in the last two financial years of the study by 395 and 13 in 2010-11
and 2011-12 respectively In all the performances under model-III are shrinking
gradually in India and that can also be seen from the following figure where the
highest performance was recorded only in the year 2009-10 and afterwards the
same passages downwards
Figure-34 Position of Total Loan Loan Disbursed and Loan Outstanding under MFI-Bank linkage (SHG Model-III) in India 2007-08 to 2011-12 (Amount `in Crore)
Source Status of Microfinance in India 2011-12 2009-10 amp 2008-09 of NABARD
0
5000
10000
15000
20000
25000
2007-08 2008-09 2009-10 2010-11 2011-12
Performance under SHG Model-III in India
Total Amount of Loan Loan Disbursed Loan Outstanding
181
37a SHG Model-wise Comparative Performance of Microfinance in India
The SHG model-wise performance can be seen from the following table where it
has been depicted that SHG-Bank linkage model (comprises model-I amp II) where
banks directly lends to SHG together provided more amount of loans than the
MFI-Bank linkage (ie under model-III) during the period of study Interestingly
if we consider the model-wise loan performance ratio as calculated in the following
table it is found that the lending positions under model-III are gradually improved
from 2007-08 to 2011-12 as the ratio of lending comes from 5081 to 3171 by the
end of March 2012 with best performance ratio in the year 2009-10 which was
1721
of Total loans
184
38 Position in Assam
The performance under the SHG Models of microfinance in Assam is impressive in
comparison to the other states of NER but among the other regions of the country
its performance and position is relatively poor and from last a decade its relative
position in terms of geographical coverage reaching rural populations formation of
SHG loan disbursed loan outstanding savings with banks participation of
NGOsMFIs and people etc in microfinance have improved a lot and are further
expanding The number of SHGs having savings with banks in Assam is 276565
which is only 347 percent of the total SHGs of India and amount of savings stands
to ` 984598 crore which is only 150 percent of total savings with the banks in
India by March 2012 Assam is occupying the leading position in microfinance in
the NER as of the total SHGs having savings in banks 7542 percent (ie of the
total 366718 SHGs) SHGs only belong to Assam and of the total amount of savings
of NER ie ` 1525175 crore 6456 percent only belong to SHGs of Assam
During the period of study the SHGs formed under its models along with savings
positions loans disbursed and loans outstanding in total and that to exclusively all-
women SHGs are presented in the following table
186
In Assam the total SHGs linked to Banks up to March 2012 is 276565 lakh
which was only 149719 SHGs by the end of March 2008 thus the total growth
recorded in linking of SHGs to banks is 8472 percent and an average growth of
1694 percent pa during the period of study The accumulated amount of Savings
of SHGs in different Banks with 276565 lakh SHGs is `984598 lakh by March
2012 and that was only ` 580006 lakh by the end of March 2008 which
accumulated the total growth in Savings as 6976 percent and an average growth of
1395 percent pa during the study period and the growth rate of same was highest
in 2011-12 which stands as 2012 percent An analysis about the growth of SHGs
with savings and with saving amount of SHGs during the period of study are
presented in the following diagram and its reveals that during 2007-08 and 2008-
09 the growth of SHGs with savings and amount of savings of the total SHGs and
all-women SHGs were steady and in increasing trend but in the later part in the
period of study ie 2009-10 to 2011-12 the growth rates and position have
fluctuated considerably and decreased which can be observed from the following
diagram
Growth Rate ()
188
Again the amount of loans disbursed during 2011-12 alone was `1874698 lakh to
the 28012 SHGs in Assam and the same was only `886910 lakh to the 20318
SHGs at the beginning of the period of the study Thus it recorded a total growth of
11137 percent in the amount of loan disbursed and 3787 percent in SHGs in five
years period of study and an average growth rate of 2227 percent pa in amount of
loans disbursed and at 757 percent pa in SHGs The growth of the same was
highest in the year 2008-09 to 7698 percent in the amount of loans disbursed The
loans disbursed to all-women SHGs are also considerable during the period of
study which is found in an average of 8293 percent in Assam during the period
of study and an increasing trend has been replicated in the formation of all-women
SHGs as shown in the table-35 A Comparative analysis of SHGs in loan disbursed
and with amount of loan disbursed is presented with the help of following diagram
to show the performance during the period of study
Growth Rate ()
190
The relative growth positions was highest in 2008-09 during the period of study
and surprisingly the growth rate of all other factors as shown in the above diagram
come down to negative level in 2011-12 thus a huge fluctuation has been noticed
during the period Another important fact came-out of the diagram is that from
2009-10 onwards the growth rates are considerably declining and stands to negative
growth by the end of the period of the study
As regards balance of loans outstanding with SHGs it reveals that in 2007-08 the
amount of loans outstanding was only ` 2422437 lakh as against 75405 SHGs
and with an average growth of 2676 percent pa in the amount of loans
outstanding and 1124 percent pa in SHGs with loans outstanding the amount of
loans outstanding reached to ` 6302164 lakh as against 117809 SHGs by March
2012 There is no negative growth that has recorded in any year during the period
of study thus recognising the expansion of microfinance service year after year
The growth rates of SHGs in loans outstanding and amount of loan outstanding
with all-women SHGs are also impressive and records the growth more than 80
percent in both the respect A diagrammatic presentation has been made as under to
analyse the relative position of the factors with loans outstanding in Assam during
the period of study
Growth Rate ()
192
Thus total amount of loan provided (ie loan disbursed and loans outstanding) up
to March 2012 to 145821 SHGs in Assam reached to ` 8176862 lakh which
recorded a total growth of 14708 percent and an average growth of 2942 percent
pa during the period of study The amount of total loans availed to all-women
SHG in 2007-08 was ` 2416816 lakh to the 76090 SHGs and by an average
annual growth of 3708 percent pa in amount of loans outstanding and 1185
percent in SHGs the same reached to the balance of ` 6897173 lakh against
121177 SHG by March 2012 Which is the highest growth recorded in
microfinance service in the NER and Assam is holding the leading position in
microfinance service
38a Analysing Performance of Microfinance under SHG Models in Assam
The performance of microfinance under each of the SHG-bank linkage models (ie
SHG model-I amp II) and MFI-bank linkage model (ie SHG model-III) is presented
in table-36 and it is found that maximum amount of loans have been given to the
beneficiaries together under model-I amp II which was in average 7404 percent pa
of the grand total amount of loans and the same under model-III was only 2596
percent pa during the same period under study in Assam Again the total growth
made in five years in the total amount of loans is 12493 percent together under
model-I and II and that under model-III records a total growth of 25952 percent in
five years under study Thus in terms of amount of total loans SHG-bank linkage
models records more expansion and flow of micro-credit than MFI-bank linkage
model but in terms of growth the MFI-bank linkage model (ie model-III) records
better growth so microfinance service under model-III is considerably increasing
and spreading in Assam Again the total amount of loans provided together under
model-I and II in 2007-08 was 8354 percent which came down to 7605 percent by
March 2012 and the same under model-III was only 1646 percent in 2007-08 and
193
has increased to 2395 percent by March 2012 of the grand total amount of loans
given jointly under all the SHG models in Assam
Table-36 SHG Model-wise Performance of Microfinance in Assam from 2007-08 to 2011-12 (Amount ` in Lakh)
Particulars
Under SHG Model-I amp II Under SHG Model-III Grand Total of Loans under SHG
Models- I II amp III
Loan Disbursed
Loan Outstanding
Total Amount of Loan
(X)
Loan Disbursed
Loan Outstanding
Total Amount of Loan (Y)
2007-08 1021264 (1836)
1743364 (2198)
2764628 (2013)
227352 (3568)
317366 (4621)
544719 (6873) 3309347
2008-09 1362358 (3340)
2521286 (4462)
3883644 (4048)
415116 (8259)
556887 (7547)
971518 (7835) 4855162
2009-10 1478359 (851)
2867412 (1373)
4345083 (1188)
1097091 (16429)
1426836 (15622)
2524614 (15986) 6869698
2010-11 1588320 (744)
3408841 (1888)
4997161 (1501)
922130 (-1595)
1499297 (508)
2421427 (-409) 7418588
2011-12 1944458 (2242)
4273228 (2536)
6218504 (2444)
612447 (-3358)
1346729 (-1018)
1958358 (-1912) 8176862
Source Status of Microfinance in India NABARD amp Table-3 amp 4 above Note The model-wise allocation of microfinance in Assam as shown in table- 36 have been obtained by calculation with the help of all India average ratepercentage of flow of microfinance under each of the models as shown in table-34 above Because NABARD do not published such information in its reports state or region wise rather as a whole for the country Figures in the parenthesis are the growth rates
A diagrammatic presentation has also been made to analyse and to show the
relative performance of microfinance in Assam under each of the SHG models
From the diagram it can be seen that all the factors ie loans disbursed loans
outstanding and total amount of loans under the SHG models are in regular
increasing trend only with the little exception of decreasing trends in 2011-12
under model-III
Amount in Lakh
195
So SHG-bank linkage models remain dominant in providing microfinance service
to the people of Assam because the performance in all the factors as mentioned
above are higher than MFI-bank linkage model in absolute figures The amount of
loans disbursed together under model-I and II in 2007-08 was ` 1021264 lakh
which records a total growth of 9040 percent in five years with an average growth
of 1808 percent pa and reached to `1944458 lakh by March 2012 and the same
under model-III was ` 227352 lakh in 2007-08 which recorded a total growth of
16938 percent in five years period with an average growth of 3388 percent pa
and reached to `612447 lakh by March 2012 Again in case of balance of loans
outstanding with SHGs the amount of loans outstanding under model-I and II
together was amounted to `1743364 lakh and recorded total growth of 14511
percent in five years from 2007-08 to 2011-12 with an annual growth of 1902
percent pa and reached to ` 4273228 lakh by March 2012 The same under
model-III was `317366 lakh in 2007-08 and recorded a total growth of 32434
percent with an annual growth of 6487 percent in the period of study and reached
to ` 1346729 lakh by March 2012 Thus the progress and growth trend under
model-III are relatively better than together under model-I and II during the period
of study in Assam The details progress and growth pattern under each of the SHG
models are presented in following diagram to access the performance more clearly
196
Figure-310 Growth Trend of Microfinance under SHG Model- I ampII in Assam from 2007-08 to 2011-12
Source Table-36 So the growth trend as depicted in the above diagram was to the maximum level in
2008-09 and after that there was a sharp fall in growth of all the factors ie loan
disbursed loans outstanding and in total amount of loans in 2009-10 Again slow
progress is recorded which can be seen in the diagram from 2010-11 onwards
interestingly during the period of five years none of the factors have recorded any
negative growth together under SHG model- I amp II
Again to know the same under SHG model-III another diagrammatic presentation
has been made in figure-311 to access the progress and performance in terms of
growth rates of loans disbursed outstanding and total loans more clearly and it is
found that with steady increasing growth from 2007-08 in all the loans factor it
reached the highest level of growth in the year 2009-10 and after that there was a
sharp down-fall in the growth in all the factors of loans in 2010-11 and thereafter
further down-fall was recorded which can be observed from the diagram and
recorded negative growth in all the factors of loans from 2010 to 2012 leaving the
factor outstanding loans in 2010-11 which was slightly positive among the other
loan factors Thus huge fluctuations have been found in microfinance service under
0
10
20
30
40
50
2007-08 2008-09 2009-10 2010-11 2011-12
Growth Trend of Microfinance together under SHG Model-I amp II in Assam
Loan Disbursed Loan Outstanding Total Amount of Loan
197
model-III in Assam The incident which occurred in Andhra Pradesh in 2010 the
change of microfinance programme from SGSY to NRLM etc are some of the
reasons for such huge fluctuation under model-III in our country including Assam
decreasing interest of funding institutions and banks to MFIs for huge NPAs is also
another reason behind such fluctuations
39 Microfinance in Barpeta District of Assam
As informal source of finance the practice of microfinance was in Barpeta District
from ancient time in various forms and not exactly in the form what we called
-
credit
Growth Rate ()
199
Poor people used to borrow from the money lenders or from local capitalist mostly
by mortgaging their valuables like jewellery lands cattle etc as security for the
loan credit Most of them basically borrowed consumption type loans or loans in
case of acute needs of the family with very high rate of interest which even stood
more than the principal sum of money they borrowed (IIBF 2010) (Yunus 2007)
So history of microfinance in Barpeta District of Assam had no exceptions from
the rest of the country The cooperative system was an initiation in the field of
financial service for the poor in Assam and as well in Barpeta District and the role
of rural credit cooperative have some impact in the life of rural people though is
unable to bring such revolution among the rural people in the villages and of remote
areas
If we concentrate on the movement or start-up of microfinance services in the
district then it is after the introduction of SGSY programme the major poverty
alleviation programme of GOI in the 2000 but as reported by the district official
from 2004-05 the programme start progressing by forming SHGs in voluminous
manner and prior to that the progress was not impressive Considering the fact the
researcher considers the period of study from 2007-08 to 2011-12 ie for five
years and the progress and performance under the SHG models of microfinance of
the said period only have been shown in this study Again under the SHG models
three SHG-credit linkage models exist but in Barpeta district no such SHG were
found during the field survey who are directly formed and nurtured by the banks in
the district which comes under SHG model-I Limited bank branches works
overload limited banks staffs lack of interest of banks etc are some of the general
reasons for non-operational of model-I in the district As such the present study is
confine to the rest of the two models ie SHG Model-II and SHG Model-III in
Barpeta District of Assam The detailed information and data of microfinance
relating to the study about Barpeta District are presented in the following table
201
39a Magnitude and Progress of SHG in Barpeta District
Total SHGs linked to Banks and MFIs of the District up to the end of March 2012
has grown to 15 477 which was 11346 SHGs during 2007-08 thus the same
recorded a total growth of 3641 percent and an average growth of 728 percent pa
during the period of study in linking SHG together under SHG model-II and III
The least growth rate recorded during the period was 555 percent in the year 2011-
12 The position of all-women SHGs in Barpeta District is impressive and having
reached beyond the national average of 80 percent (NABARD 2012) Women
members occupied the lion share in microfinance in the district as all-women
SHGs in the District have increased to 15261 of the total SHGs up to March 2012
which is 9860 percent of total SHGs of the district The position of all-women
SHG in the district in 2007-08 was comparatively a bit poor as there was 10952
SHGs and that stood to 9653 percent of the total SHG of that year Thus total
growth of all- women SHGs in the district comes to 3934 percent in the five years
with an average growth of 787 percent pa A diagrammatic presentation has been
made with the help of total SHGs all-women SHGs and active SHGs in figure-
312 to show the magnitude and progress of SHGs in Barpeta District and it is
found that during the period of study SHGs in the district records slow progress
year after year almost at the same rate of growth in all the factors of SHG Of the
total SHG only 8392 SHGs are reported as Active30 SHG in the district and that is
only 5422 percent of the total SHG Thus near to half of the total SHGs in the
district are found defunct and those SHGs are no longer in existence or not
interested in SHG activities As reported by the intermediaries of microfinance in
the district most of those defunct SHGs were formed with the intention to take the
benefits of subsidy and while they found no more subsidies they stopped working
and their SHGs became inactive
30Active amp defunct SHGs here recorded as per the records and information of SHGs intermediaries of Barpeta District
202
A diagrammatic presentation has been made with help of total SHGs comparing
with all-women SHGs and active SHGs in the district during the period of study as
follows
Figure-312 Total All-Women and Active SHGs Positions in Barpeta District of Assam from 2007-08 to 2011-12
Source Table-37
So it can be observed from the above diagram that a steady incremental trend and
progress have been recorded during the period of study in the district in all the
factors of SHG and most importantly no abnormal fluctuation has been recorded
during the period of study
39b Growth Trend of SHG in Barpeta District
While SHGs growth position is considered the growth trend of the same have
gradually come down from 2007-08 to 2011-12 which can be viewed from the
following in figure-313 which is prepared taking the growth rates of the total all-
women and active SHGs of Barpeta District
0
20004000
6000
8000
1000012000
14000
16000
2007-08 2008-09 2009-10 2010-11 2011-12
SHGs of Barpeta District of Assam
Total Nos of SHG All Women SHG Total Active SHG
Growth Rate ()
204
It is clearly depicted in the above diagram that the SHG growth rate and position
have come down from 2009-10 onwards and those growth rates come even below
10 percent in the district the growth rates was maximum in 2008-09 as viewed in
the above diagram The position of active SHGs in terms of growth during the
period of study recorded a total growth of 3610 and an average growth of 722
percent pa in the study period But the growth rate of the same was very poor as
376 percent during 2011-12 Thus growth rate of active SHGs come down during
2011-12 even below the average rate This indicates the slow progress in the
formation and leaves question marks to the sustainability of SHGs in the district
owing to the poor management limited credit flow subsidy provision under SGSY
rural people participation in NREGA etc in the district has weaken the
performance
39c Magnitude of Loans Provided under SHG Models in Barpeta District
The total amount of loans availed to the beneficiaries or SHG members in Barpeta
District occupy only 936 percent of the total amount of loans availed in Assam
comprising of loans disbursed and loans outstanding during 2011-12 The share of
district in the state were same with little difference in the whole period of study as
it was 1362 percent in 2007-08 the highest score in period under study 952
percent in 2008-09 900 percent in 2009-10 and 929 percent in 2010-11 and those
with an average share of 1016 percent pa during the five years period under
study31 The amounts of loans disbursed to the SHGs in the district were `161569
lakh in 2007-08 which with an average incremental growth of 3039 percent pa
reached to `284031 lakh by March 2012 with the exception of negative growth
of 144 percent during 2011-12 during the period of study As regards amount of
loans outstanding with SHGs in the district the records reveal that it was ` 289089
31The share total amount of loans availed during the period under study are calculated taking the figures of total loans of Assam and of Barpeta District year after year from Table-36 amp 37 as mentioned above
205
lakh in 2007-08 and the amount of loans outstanding balance rose to `481183 lakh
which seems near to double by the end of March 2012 thus recognising
considerable growth in financing during the period of study All-women SHGs
constitute the lion share in the district and of the total amount of loans given to all-
women SHGs 8174 percent pa are provided only to those SHGs in the district
with little variation during the period of study A diagrammatic presentation has
been made with the help of amount of total loans loans to all-women SHG loans
disbursed and loans outstanding to have a clear picture about the magnitude of
microfinance in the district during the period of study which is as follows
Amount in lakh
207
It can be observed from the diagram that the position of loan factors is gradually
increasing maintaining the same sequence and rate year after year during the
period of study thus the loan factors are normally growing which is a healthy sign
of development of microfinance position and services in the district
39d Analyzing the Growth Trend of Loans under SHG Models in Barpeta
District
To know the actual picture of performance and progress of microfinance more
precisely in the district through its lending to the SHGs under the SHG models
effort were made to find out the growth pattern of loans availed to SHGs during the
period under study with the help of diagram as given in figure-315 It is depicted in
the same that considerable ups and downs have been recorded in the growth rates
among the loan factors during the period of study in the district and in some cases
negative rates of growth have also occurred
Growth Rate ()
209
The amount of loan disbursed to the SHGs during year 2011-12 was `284031
lakh and that recorded a total growth in disbursing loans to SHGs from 2007-08 to
2011-12 of 13364 percent with an average growth of 2673 percent pa during the
period of study But during 2011-12 the rate of growth of the same was negative to
144 percent in the district Again the amount of loan outstanding with the SHGs in
the district up to March 2012 was `481183 lakh which recorded a total growth
of 6645 percent and an average growth of 1329 percent pa during the period of
study The growth of loans outstanding was negative in 2008-09 and highest in
2009-10 to 4630 percent again fell in 2010-11 and increased a little in 2011-12
As all-women SHGs have occupied the lion share in the district and up to March
2012 the total amount of loans disbursed to those SHGs were ` 658773 lakh and
that recorded a total growth of 9109 percent with an average growth of 1822
percent pa during the period of study Of the total amount of loans maximum
amount of loans are availed to the all-women SHG in the district which in average
was 8174 percent pa during the period of study Further of the total amount of
loans availed (ie loans disbursed and loans outstanding) against the SHGs in the
district recorded a total growth of 8634 percent in five years with an average
growth of 1727 percent pa during the period of study
39e Analyzing SHG Model-wise performance of SHGs in Barpeta District
As among the three SHG-credit linkage models SHG Model-II and Model-III are
functional in the district and no such SHGs were found which are directly formed
under Model-I as such analysis of this part are confine to the models which are
operating and functional in the Barperta District Again details as regards SHG
models have already been mentioned in chapter-1 but for the sake of convenience a
brief outline of two functional models in the district are given below
210
SHG Model-II Under this model SHGs are formed and nurtured by the
intermediaries which includes GOs and NGOs and after a certain period and on
satisfactory performance in group management and group funds handling (ie
savings of members) they are being linked to banks for loans In Barpeta District
the task of formation nurturing linking etc of SHGs under SHG Model-II are
performed under the blocks by the Blocks official at the block and village level and
after their satisfaction and scrutiny about the performance of the group they send it
to the DRDA office for the approval and sanction of loans While assessing the
performance of SHGs (the Blocks official and sometimes persons from banks also
join in the process) for grading the SHGs on their performance on the basis of
some parameters where they mainly consider the following five points of SHG and
(ie five point formula) for grading
and promotion of SHG and includes
1 Weekly Meeting
2 Weekly Savings
3 Internal Credit
4 Recovery of Internal Credit
5 Records keeping
On satisfactory performance evaluation the list of SHGs are sent to DRDA for the
sanction of loan and DRDA may call some groups for talking if they feel the need
and after their needful verification they send the list of SHGs to the banks and a
copy to the respective blocks for record keeping and the groups are availed loans
through banks thus the groups are being linked with bank branches
SHG Model-III Under this model some NGOs and MFIs as intermediaries avail
bulk amount of loan from various funding institutionsbanks for on lending to the
groups The intermediaries take care of the groups in all respect and directly finance
the groups The groups in return have to follow the instruction of those
211
intermediaries and have to repay the loan as per the time and size of installment
fixed by them In Barpeta District ASOMI Bandhan RGVN are the leading MFIs
dealing with SHGs to provide micro-credit under this model The selection
procedure promotion criteria etc of SHG depends upon the intermediary which
slightly varies among the service providing intermediaries but the basic objectives
remain same
A detailed SHG model-wise break-up of SHGs in the district are given in the
following table
213
If we consider the model-wise SHG formation performance in the district more
numbers of SHG are being formed under model-II than model-III and that in terms
of ratio which was 1010 1 in 2007-08 and that has improved a little towards
model-III and in 2011-12 the ratio of SHG formation stands at 8761 under
model-II to III An analytical diagrammatic presentation has been made to show the
performance in the formation of SHGs under each of the models as follow
215
From the above it can be easily understood that more SHGs were formed under
SHG model-II in comparison to the model-III but in both the models the trend of
formation of SHGs are common during the period The quantum of all-women
SHG formed under each model is high and different but their trends of progress
under each of the model are alike But in the quality assessment of SHG under
each model the half of SHGs formed under model-II have gone defunct as per their
records and those SHGs are not in touch with the intermediaries and the same in
case of model-III is very efficient and only a meagre percentage of SHGs is
reported as defunct in the district Thus SHGs formed under model-III is well
managed by those intermediaries and more sustainable in comparison to model-II
under study To have precise outcome on the issue of quality and sustainability of
SHGs under each of models a diagrammatic presentation has been made as
follows
216
Figure-317 SHG Model-wise Quality and Sustainability Position of SHGs in terms of Active and Defunct SHGs in Barpeta District
Source Table-38
In year-wise comparison of the active SHGs under each of the SHG models it is
clear that SHGs formed and managed under model-III are more active and
sustainable and that in an average is 9126 percent pa SHGs under this model are
found more active during the period of study in the district and that in case of
model-II is only 5164 percent pa in average during the same period of study in the
district Thus an average gap of 3962 percent pa or SHG model-II is lagging
behind by the same percentage from model-III in the sustainability of SHG during
the period of study
39f Growth Trend of SHGs under SHG Model-II in Barpeta District
The growth trend and position of the SHGs formed under model-II in the district
taking the growth factors of total SHGs formed total all-women SHGs and total
active SHGs the following diagrammatic presentation has been made in figure-
318
2007-08 2008-09 2009-10 2010-11 2011-12
5296 5318 5128 509 4987
8767 8994 9181 9455 9231
Comperative Quality amp Sustainability Position of SHGs in Barpeta District
Active SHGs under Model-II Active SHGs under Model-III
Growth Rate ()
218
The diagram clearly indicates that the growth trend in all the factors are gradually
coming down from 2007-08 to 2011-12 and more importantly the trend line of
active SHG is under all the trend lines presented in the diagram which is very
important to be considered and more important line among all the trend lines
presented in the diagram Thus positions of SHG under model-II are gradually
deteriorating and very poor during 2011-12 in the district and during the period of
study
39g Growth Trend of SHGs under SHG Model-III in Barpeta District
The growth pattern of SHGs in the district under model-III is shown in the figure-
319 and it is clearly understood from the same that the growth was highest during
2008-09 in the periods of study and after that there was sharp fall in the growth
rates in all the factors of SHGs growth rates under consideration but from 2010-11
to 2011-12 a slow progressive growth has been noticed in the diagram which is a
good sign
Growth Rate ()
220
Again the growth rate and trend of active SHG is above all the growth lines in the
figure which is found just reverse under model-II as mentioned earlier Thus from
the two diagrammatic presentations it is clear that by the end of the period under
study all the growth lines under model-II records downwards movement and the
same under model-III records upward movement or in progressive trend
39h Analysing SHG Model-wise Magnitude and Trend of Microfinance in
Barpeta District
The details of microfinance performance under each of the SHG models in the
district are presented in table-39 and it is found from the same that model-III has
performed well in terms of providing more amount of loans to the beneficiaries in
comparison to model-II if we consider the model-wise loaning performance ratio
as given in the table more amount of loans or microfinance has been availed under
model-III in all through the period of study and the average ratio of lending under
these two models comes to 0731 pa during the period of study The amount of
loan disbursed under model-II in 2007-08 was only ` 38685 lakh which at an
average annual growth of 2197 percent reached to `81181 lakh during 2011-12
and in case of loan outstanding with SHG in the district it was an amount of `
157351 lakh in 2007-08 which rose to the balance of loans outstanding to
`256484 lakh thus registered a total growth of 63 percent in period of study But
position of loans disbursed under model-III was ` 122884 lakh in 2007-08 which
with an average annual growth of 1301 percent reached to ` 202850 lakh by
March 2012 in the district including a negative growth of 176 percent in 2011-12
Again about the amount of loans outstanding with SHG in the district it was only
` 131773 lakh in 2007-08 which rose to ` 224699 lakh by March 2012 thus
registered a total growth of 7052 percent during the period of study
222
The all-women SHGs constitute the major share in the district thus an effort was
made to know the amount of loans provided to them and the total amount of loans
provided to those SHG under model-II was ` 144987 lakh in 2007-08 which by
registering an average growth of 2033 percent pa reached to ` 271696 lakh by
March 2012 The same under model-III was ` 199793 lakh in 2007-08 rose with
an average growth of 1818 percent pa and reached to ` 298333 lakh by March
2012 Further the women SHGs are given in an average 7579 percent of the total
amount loans under model-II during the whole period of study and the same under
model-III was in an average of 8589 percent during same period of study in the
district Thus under model-III 1010 percent more amount of loans had been
extended to the all-women SHGs in the district in all through the period of study
Again total amount of loans provided under model-II in the district was ` 196036
lakh in 2007-08 which increased with an average growth rate of 1524 percent pa
and reached to ` 252362 lakh in 2011-12 and the same under model-III was `
254657 lakh in 2007-08 which rose to ` 259989 lakh by recording an average
growth of 1306 percent pa during the entire period of study Surprisingly despite
having such huge volume of SHG under model-II (ie 9099 of the total SHG in
the district) in the district only 4350 percent of the grand total amounts of loans
were provided to SHGs in 2007-08 and that under model-III was 5650 percent to
only 901 percent of the total SHGs of the said period This huge disparity signifies
that the SHGs under model-III were availed more amount of loans and SHGs under
model-II were under-served or extended poor amounts of loan Again if we
consider the same for the year 2011-12 an amount of ` 252362 lakh which is
4227 percent of the grand total amount of loans were extended to the beneficiaries
under model-II in the district and under model-III the same was ` 259989 lakh
which is 5773 percent of the grand total amount of loans provided in the same
period of study The magnitude and trend of microfinance in the district is also
presented with a diagram in figure-320 to understand the scenario more clearly
Amount in Lakh
224
Simply it can be understand from the diagram that in all the factors of loans to the
SHGs performance under model-III is more lucrative and provided more amounts
year after year thus model-III holds better position in the magnitude of loans in
Barpeta district of Assam
39i Analyzing the Comparative Growth Trend of Microfinance under SHG
Model-II and III in Barpeta District
The growth trend of microfinance under each of the SHG models under study
behave and move in reverse way as under model-II the growth trends fluctuate
considerably during the period of study in the district but the growth trends under
model-III slowly progressed from 2007-08 to 2009-10 and thereafter gradually fell
up to the end of the period under study But progress under model-III was almost
steady in comparison to model-II in the same period of study The Comparative
growth position can better be understood from the following diagram which is
prepared taking all the growth rates of loans in Barpeta District in the following
diagram
Growth Rate ()
226
So the growth trends under model-II were negative except in loan disbursed in
2008-09 which reached to the top level in 2009-10 and again fell down in 2010-10
and in 2011-12 consecutively But those under model-III experienced almost a flat
and steady growth during the period of study The growth of loans disbursed under
model-II was 1920 percent in 2007-08 which maintained an average incremental
growth of 2118 percent all through the period but registered a negative growth of
064 percent in 2011-12 The same under model-III was 1833 percent in 2007-08
and recorded an average incremental growth of 1467 percent pa during the period
of study but that stands to 176 percent negative growth in 2011-12 In the case of
growth rate of loans outstanding with the SHGs in the district it was only 1295
percent in 2007-08 which reached to 2270 percent in 2011-12 registering two
negative growths of 2141 and 250 percent respectively in 2008-09 and 2010-11
But under model-III the same was only 432 percent in 2007-08 which reached to
1715 percent in 2011-12 by registering an average growth of 1241 percent pa all
through the period of study and no negative growth had been registered in the
period The growth pattern of loans to all-women SHG is a strong factor in the
district because more than 80 percent SHGs fall under this category and in 2007-
08 it registered a growth of 1555 percent and that also maintained an average
growth of 2033 percent pa all through the period under study and stands at 1507
percent in 2011-12 overcoming a negative growth of 2027 percent in 2008-09
under model-II and the same under model-III was 1840 percent in 2007-08 and
registered an average growth of 1818 percent pa during the period of study and
reached to 1150 percent in 2001-12
Further Intermediaries-wise SHGs Position and Trend with their loans position
during the period of study in Barpeta District under Model-II and III are presented
with the help of following two diagrams
Nos of SHG
Amount in Lakh
229
The outcomes of the above diagrams is very clear as maximum SHGs are formed
under model-II by block intermediaries as shown in figure-322 but availed less
amount of loans to those few percentage of SHGs On the contrary very few
percentage of SHGs are formed under Model-III by NGOsMFIs in the district but
maximum amount of loans are availed towards those SHGs those groups are
getting more loans or frequent loans in comparison to the SHGs formed under
model-II in the district during the period of study that are shown in figure-323
310 Analyzing Comparative Growth Position of SHGs in India Assam and in
Barpeta District under the SHG Models
After going through the positions of microfinance in India Assam and in Barpeta
district as mentioned above where mixed responses are found and to show the
relative position more precisely efforts were made to have comparative study with
the core factor of performance in terms of growth trends of SHGs right from
national level to the district level and that will depict the picture more clearly As
such their performances have been presented with the help of following two
diagrams as follows in figure-324 and figure-325
Growth Rate ()
Growth Rate ()
232
In both the figures given above it is clearly depicted that there is a sharp fall in the
performance of SHGs and loans extended to them from 2009-10 onwards in all
sector of microfinance ie in India Assam and as well in Barpeta District of
Assam The position was favourable from 2007-08 to the 2009-10 as highest
growth rates were recorded during that period as shown in the figures Such drastic
down-fall in both in the growth of SHGs and in microfinance (ie in extending
total amount of loans) during the period had weakened the service of microfinance
spreads and base in the country The incidents that had occurred in Andhra Pradesh
where 30 farmers had committed suicide within a span of 45 days in 2010 after a
few MFIs used coercive recovery tactics (Patra 2011) is a strong reason for such
adverse scenario as after such incidents many financing banks and institutions
stopped financing to MFIs The subsidy provision under SGSY programme also
weakened the base of a group of SHGs which were formed only to take the
benefits of subsidy and not SHGs as a means of self-employment provisions is also
added to the reason of such downfall in the performance of microfinance sector in
our country Again the change of programme from SGSY now to newly introduced
NRLM also concentrate a lot in the change of the functional structures power and
management and also weakens the rapid growth and speeds of microfinance sector
in the country during the period under study
311 Conclusion
During the period under study the performance under microfinance service has
been moved in two way dimensions as in the first half of the period ie from
2007-08 to 2009-10 the performance was in progressive trend in India Assam and
as well in Barpeta district of Assam but in the later part of the period of study the
performance and progress experienced downfall While we consider the magnitude
of microfinance services in Assam in terms of SHG with saving in banks it is
found that only 347 percent SHGs belong to Assam and same is 1879 percent
233
highest in the country in case of Andhra Pradesh by the end of March 2012 The
relative position of Assam in NER is good as Assam occupied 7542 percent of the
total SHGs of the region and that with the amount of savings of `984598 lakh
which stands at 6456 percent of the total amount of savings of NER Thus Assam
is in leading position in the region followed by Tripura and then Meghalaya
(NABARD 2012) In case of amount of loans disbursed to SHGs in 2011-12
Assam is having only 113 percent of the total amount of loans disbursed in India
and among NER it is 4154 percent followed by Tripura and Manipur
On SHG model-wise analysis it is found that SHG-bank linkage models (together
SHG Model-I amp II) remain in dominant position in terms of volume of SHGs and
absolute amount of loans availed to SHGs in the country than MFI-bank linkage
model (ie SHG Model-III) during the period of study But in Barpeta District of
Assam some variation in the model-wise performance has been found during the
period of study as model-II is found popular and covered more number of members
and is able to form more numbers of SHGs in comparison to that of under model-
III As of the total SHGs in the district 8975 percent are formed under model-II
and only1025 percent SHGs are under model-III in 2011-12 Again total amount
of loans given to SHGs under model-II in the same period was ` 337665 lakh
which was 4413 percent of the grand total amount of loans under both the models
and the rest 5587 percent were given to only 1025 percent of the total SHGs in
the district Thus SHGs under model-III are given more amount of loans or
frequent loans in comparison to the SHG under model-II in the district during the
period of study In terms of growth factors under each of these two models growth
trends under model-II both in case of SHG and in amount of loans to them more
fluctuations or ups and downs were recorded during the period of study and by the
end of the period particularly in 2010-11 and 2011-12 the growth trends were
down-falling in the district But the same under model-III were almost steady
during the period of study with a bit high in 2009-10 and a bit low in latter part of
the period of study particularly in 2010-11 to 2011-12 in the district Again in
234
terms of sustainability of SHGs formed under each of the SHG models also varies
a lot The SHGs formed managed and financed under model-II are half in an
average of the total are defunct SHGs and only 50 percent of them survive or are
functional in the district but the same under model-III is found more than 91
percent as active and functional during the period of study in the district Thus
over-all performance of SHGs under SHG model-III in the district during the period
of study is better than SHGs under model-II in respect of service quantum of
loans growth trends and sustainability etc
References
(2006) Statistical Hand Book of Assam Guwahati Directorate of Economics and
Statistics Government of Assam
Asif M (2011 November) Role of NGOs in India YOJANA 55 pp 8-10
Bandhan (nd) Bandhan Hope for the Poor Product Information Broucher of Bandhan
West Bengal India Bandhan
Baruah P B (2012) Impact of Microfinance on Poverty A Study of Twenty Self-Help
Groups in Nalbari District Assam Journal of Rural Development 31(2) 223-234
Bharali S (2010 July 18) An Institute Promotion of Secure Sustainable Livelihood
ASOMI Barta 6(6)
Borbora S amp Sarma G K (nd) Microfinance Institutions Sustainability and Outreach
Retrieved May 2 2014 from httpwwwwbiconprocom314-borborapdf
CGAP (nd) Consultative Group to Assist the Poor Retrieved from wwwcgaporg
Chatterjee N amp Dar M A (2011 November) Role of NGOs in Rural Development
YOJANA 55 pp 17-20
Chief Ministers Micro Finance Scheme-Assam Financial Corporation (CMMFS) Khudra
Reen (nd) Retrieved May 1 2014 from httpwwwafconlinegovin
documentbroucherpdf
Chief Ministers Micro Finance Schemes- Assam Financial Corporation (nd) Retrieved
May 1 2014 from httpwwwafconlinegovinpdfmfnbbrochure Englishpdf
Das D (nd) Informal Microfinance in Assam Empirical Evidence from Nalbari and
Baksa Districts Retrieved November 2013 from IFMR Centre for Microfinance
235
Research httpwwwifmrleadorgcmfwp-contentuploadsattachmentscsy1685
informal20MF20in20Assampdf
Das K (2012 January- March) Financial Inclusion-A Gateway to Sustainable
Development for the Impoverished Journal of Rural Development NIRD 31(1)
115-128
Das R L Dutta D N Kakoti P amp Deka S N (2011) Rural and Microfinance
Guwahati BLJ Publication
Deb B (2012) Microfinance and Poverty Alleviation A Case Study on Rgvn-Csp Indian
Journal of Applied Research 71-74
Desai V (2005) NGOs Gender Mainstreaming and Urban Communities in Mumbai
Gender and Development 13(2) 90-98
Devi M (2012 January 20) Rural Industrialisation for Development The Assam Tribune
Guwahati p 6
Dhar P K (2009) The Economy of Assam Including Economy of Narth East India New
Delhi Kalyani Publishers
Dutta J amp Upadhaya M (2013 August 23) Green Microfinance for Eco-friendly
Development The Assam Tribune (English Daily News Paper) p 6
Economic Survey Assam 2011-12 (nd) Retrieved April 30 2014 from
httpwwwecostatassamnicinads_economic20survey-2011-12pdf
Executive Summary Part-I An Overview of State Focus Paper 2006-07 (nd) Retrieved
April 30 2014 from httpwwwnabardorgpdfAssam20EXECUTIVE
20SUMMARYpdf
Gadiapannivar R D (nd) IFMR Centre for Microfinance Retrieved November 2013
from wwwifmracincmf httpwwwifmrleadorgcmf
Ghosh M (2012 July-Sept) Microfinance and Rural Poverty in India SHG-Bank Linkage
Programme Journal of Rural Development 31(3) 347-363
Gogoi P (2013) Economic Empowerment of Rural Women Through Income Generating
Activities In B M Doley (Ed) Women in Rural Development (Seminar Volume)
(pp 36-45) Guwahati Publication Board Silapathar College Dhemaji Assam
IIBF (2010) Rural Banking New Delhi Indian Institute of Banking amp Finance by
Macmillion
Khanka S S (2010) Microfinance in India From Evolution to Revolution In J U
Ahmed D Bhagat amp G Singaiah (Eds) Microfinance in India Issues and
Challenges (pp 3-14) Guwahati DVs Publications
236
Lalitha N (2011 February) Sustainable Management of Local Resources YOJANA 55
pp 32-35
Mathaw J amp Verghese J (2011 November) Non Governmental Organisation in India
YOJANA 55 pp 12-14
NABARD (2012) Status of Microfinance in India 2011-12 Mumbai NABARD
NRLM (nd) NRLM Procurement Manual- Ministry of Rural Development Retrieved
May 1 2014 from httpruralnicinsitesdownloadslatestNRLM
20Procurement20Manualpdf
Patra D R (2011 December) Death of Microfinance in India BFM Banking Finance
Markets A Planman Financial-IIPM Think Tank Publication 1(10) pp 28-33
RBI (nd) Quarterly Statistics on Deposits and Credit of Schedule Commercial Banks
March 2007 to March 2011 Mumbai Reserve Bank of India
Roy A (nd) Microfinance and Rural Development in the North East India Retrieved
December 2013 from httpwwwpbrcoinBrochure0006pdf
Sarmah V (2010) Microfinance Vission 2015 Northeast Region India Retrieved July
2013 from httpwwwaccessdevorgdownloadsmicrofinance_vision_2015pdf
SGSY (2010) Swarnjayanti Gram Swarozgar Yojana (SGSY) Retrieved May 1 2014
from httpwwwcsjpgoaorgwp-contentuploads201010sjgsypdf
Sharma A K (2011 December) Micro Finance in the North East YOJANA pp 8-10
Shodhganga (nd) Chapter-3 Microfinance Trends Problems and Prospects Retrieved
June 2013 from httpshodhgangainflibnetacinbitstream10603303111
n_chapter203pdf
Srinivasan N (2009) Microfinance India State of the Sector Report 2009 Delhi
ACCESS Sage
Sundaram I S (2007) Microfinance in India Delhi BR Publishing Corporation
Tribune A (2007 May 7) Self-help Groups and Rural Development The Assam Tribune
Guwahati p 6
Vikash (2008 March) About the Issue Microfinance Focus II(IV) 3
Yunus M amp Jolis A (2007) Banker To The Poor The Story of the Grameen Bank New
Delhi Penguin Books
----0----

Amount in Lakh
160
Some important factors that can drive the growth of microfinance sector in Assam
are mentioned below Again Assam is the only leader State (followed by Tripura)
in NER in the performance of microfinance under SHG models in terms of SHG
formation Savings Loaning reaching to beneficiaries etc and that is owing to the
following important reasons
Assam is the hub for all major commercial and non-commercial
activities in the NER which gives it an edge over other states moreover
all important offices are also located in the state
Assam is already having a number of MFIs and some of the big MFIs
are RGVN ASOMI Bandhan etc Thus microfinance has already
begun in the state and there is no need to start from scratch (Sarma
2010)
Microfinance sector in Assam is growing rapidly and much can be expected from it
It will benefit the rural people especially women and deprived of formal financial
system in meeting their credit needs and other financial services to strengthen their
economic condition The Chief Minister of Assam Mr Tarun Gogoi in an
interview said his government has given importance to this sector for its magic
performance in the world with the poor people and after recognising success story
of Bangladesh further mentioned he had already talked with Md Yunus the
Grameen Bank pioneer for suggestion for further effective implementation of the
microfinance programme in our state He is interested to implement the programme
especially in insurgency affected area to cope the young brains in income
generating and self-employment avenues and hopefully that will help to mitigate
the growing problems of insurgency in the state (Tribune 2007) (Devi 2012)
161
33 ProgrammesSchemes for Microfinance Services in Assam
Microfinance becomes an effective and sustainable means of finance for the poor
especially for the rural poor and women as for them there was no financial
assistancemechanism in our huge formal financial networks only due to their
inability to produce guarantees or collateral to enjoy the financial service mainly
the loancredit facilities The working spirit skills labour potentialities etc of the
poor people were never been softly recognised and credit worthiness was the only
condition to avail the credit facility for them But the success story of Grameen
Bank of Bangladesh channelized the thoughts about poor people including women
to a new way and now it is believed they are not in
need of charity rather needs more exposure and easy access to credit (Yunus amp
Jolis 2007) To spread the services of microfinance for the benefits of needy people
and to achieve other greater objectives like poverty alleviation financial inclusion
rural development self-employment economic empowerment women
empowerment etc the apex authorities introduce some policy measures to
accomplish those specific objectives Those policy measures or initiatives taken to
extend the service of microfinance to the targeted people what are called the
microfinance schemes or programmes
Again 86 percent of total population of Assam are living in rural areas and most of
them are with poor living conditions and such situation barely demand for various
schemes which can be used for their development and also for the development of
the rural Assam Aiming the same and from the sixth five year plan onwards
various self-employment generation programmes have been implemented in Assam
as in other parts of the country A brief interpretation of some of the popular
schemesprogrammes which directly or indirectly contributed and helped to extend
Microfinance Services in Assam are mentioned below
162
i Integrated Rural Development Programme (IRDP) The IRDP was
launched in the state in 2nd Oct 1980 and seek to promote self-employment
by developing productive assets and providing inputs to the rural poor
through a mix of subsidy and bank credit and by integrating multiplicity of
agencies and programmes The main objective of the programme is to
provide financial assistance to the identified rural poor families for taking
up income generating activities in the primary secondary and tertiary sector
of the rural economy and the programme was implemented in 5050
financial assistance of the central and state government The programme
implemented through District Rural Development Agencies (DRDA) at the
district level Thus the basic objective of IRDP was to promote self-
employment of the poor households along with transfer of productive assets
so that they can earn income sufficient to cross the poverty line The number
of families assisted by IRDP in Assam in 1991-92 was 46416 with the
amount of credit disbursed ` 1974 crore The beneficiaries during 1998-99
included 11477 small farmers 18040 marginal farmers 11145 agricultural
labourers and 6602 rural artisans with the credit disbursement of `3964
crore and subsidy amounted to ` 2284 crore (Dhar 2009)
ii Development of Women and Children in Rural Areas (DWCRA) The
programme on DWCRA was introduced in the year 1982-83 on Pilot
Project basis The objective of the programme is to provide women
members of rural families below poverty line with opportunity of self-
employment on a sustained basis Under this scheme income generating
activities are taken up by formation of group of 10-15 women having same
economic background In 1995-96 a total of 856 groups of women were
formed in Assam and of which 635 groups were engaged in economic
activities with financial assistance of `19338 lakh During 1998-99 a total
163
of 2868 groups were formed in Assam with the financial expenditure of `
42361 lakh (Dhar 2009)
iii Training of Rural Youth for Self-employment (TRYSEM) The National
Scheme of training of Rural Youth for Self-employment is a programme for
generating self-employment opportunities by imparting training to the rural
youth in various trades and skills In Assam the scheme has been in
operation since 1979-80 as a supporting component of IRDP During the
year 1998-99 under this programme a total of 6714 numbers of youth were
trained in various trades and vocations with the financial allocation of `
27179 lakh (Dhar 2009)
iv Swarnjayanti Gram Swarozgar Yojana (SGSY) The SGSY is the major
programme for the self-employment of rural poor of our country The
programme came into effect from 01041999 after review and restructuring
of earlier programmes like IRDP TRYSEM DWCRA Supply of Toolkits
in Rural Areas (SITRA) and Ganga Kalyan Yojana (GKY) besides Million
Wells Scheme (MWS) and those earlier programmes were not in operation
after the introduction of the SGSY (SGSY 2010) This a holistic
programme covering all aspects of Self-employment such as organization
of the rural poor into Self-help Groups (SHGs) and their capacity building
selection of key activities planning of activity cluster training credit
marketing support etc The scheme is funded by the central and state Govt
at the ratio of 7525 The objective of the scheme is to assist the rural poor
families (Swarozgaries) to come above poverty line by providing them
income generating assets through Bank loan and Government subsidy The
DRDAs at the district level are the sole authority for implementation of the
programme (Dhar 2009) By March 2012 a total of 2123 lakh SHGs are
164
linked with the total amount of savings amounted to ` 139525 crore as
against of 1694 lakh SHGs with amount of savings was ` 129262 crore by
31st March 2010 under SGSY scheme and loan disbursed during 2011-12
amounted to ` 264356 crore to 210 lakh SHGs and balance of outstanding
loan up to 31st March 2012 amounted to ` 805483 crore with 1216 lakh
SHGs under SGSY scheme in India (NABARD 2012) (Srinivasan 2009)
(Gogoi 2013)
v Special SGSY This programme is also functional since 1999-2000 in the
Muga industry in Assam in eight selected districts namely Goalpara
Dhubri Kamrup Lakhimpur Dhemaji Kokrajhar Karbi-Anglong and
Golaghat During 2001-2002 an amount of `33334 lakh was spent and
2219 numbers of Swarozgaries were assisted as against 2462 Swarozgaries
with an expenditure of ` 6322 lakh in 2000-2001 (Dhar 2009)
vi National Rural Livelihood Mission (NRLM)25 The National Rural
Livelihood Mission (NRLM) was established in June 2010 by the
Government of India to be implemented in all States of the country to
establish efficient and sustainable institutions of the rural poor for enabling
them to increase household income NRLM mainly encompasses four inter-
related tasks (a) mobilizing all rural poor households into effective self-
help groups (SHGs) and SHG federations (b) enhancing access to credit
and other financial technical and marketing services (c) building
capacities and skills for gainful and sustainable livelihoods and (d)
improving the delivery of social and economic support services to poor
25Compiled from Procurement Manual of National Rural Livelihoods Project Ministry of Rural Development Government of India Retrieved from httpruralnicinsitesdownloadslatestNRLM20Procurement20Manualpdf
165
Under NRLM Government of India is availing a credit from the
International Development Association (IDA) for implementing the
National Rural Livelihood Project (NRLP) to broadly support the following
components (i) Institution and human capacity development at the
National State District and Sub-District level (ii) State Livelihood Support
towards establishment of institutional platforms of the rural poor for
improved access to financial livelihood and public services (iii) Innovation
and Partnership to identify and partner innovative ideas which address the
livelihood needs of the rural poor (iv) Project management and monitoring
and learning systems
Under NRLM federated structures of Self Help Groups (SHGs) will be
formed at different levels (village block district) for undertaking value
chain linked activities in dairy agri-business and similar enterprises for
better production storage marketing etc of the produce of the members of
the SHGs These groups would undertake procurement of goods works and
services in line with the selected value added activity (NRLM) The
(Gogoi 2013)
vii 26 This scheme is for extending
microfinance services only in the state of Assam and the major thrust of the
having the vast expansion of the
formal financial system in the country credit facilities have not adequately
covered the need of small loan of our people at the grass root level The
is a
special initiative taken-up by the Govt of Assam to expand micro credit
26 Khudra Reen (means Small Loan) implemented by Assam Financial Corporation Paltan Bazar Guwahati Retrieved from httpwwwafconlinegovindocumentbroucherpdf and httpwwwafconlinegovinpdfmfnbbrochure Englishpdf
166
activities in the State by making available micro credit to Self-help Groups
(SHGs) Joint Liability Groups (JLGs) through NBFCs Sec-25 Companies
Registered Cooperative Thrift amp Credit Societies at cheaper rate of interest
The objective of the scheme is to encourage the practice of informal savings
and credit and help to inculcate the habit of borrowing and repayment
amongst the small and mid-sized agriculturists self-employed persons and
entrepreneurs in the rural as well as urban areas of Assam This would
enable their productive participation in the development of the State (Chief
Ministers Micro Finance Scheme-Assam Financial Corporation (CMMFS)
Khudra Reen) (Chief Ministers Micro Finance Schemes- Assam Financial
Corporation )
So above mentioned are the popular microfinance programmesschemes
implemented in Assam from time to time to extend the service of microfinance
especially to the rural poor Apart from these schemesprogrammes some other
activity based micro-credit services are also provided and are in operation in many
parts of Assam which are benefiting the poor people The microfinance
intermediaries NGOs MFIs etc have also developed some need based
programmes according to the suitability of local conditions and beneficiaries
demand like Entrepreneurship Loan Individual Loan for Shops Farming Loan etc
to provide microfinance service
ASOMI one of the leading MFIs of Assam has its own scheme for Self-
Employment of the rural people and it provides loan for (i) Agricultural Activities
(ii) Dairy Framing (iii) Piggery Farming (iv) Weaving and Ari polo (v) Cane amp
Bamboo Industry (vi) Ready-made Garments Industry Operation Rainbow is
another bold step of ASOMI the objective of this mission is to bring White
Revolution by milk production Blue Revolution by fish production Green
167
Revolution and Yellow Revolution by agricultural production etc (Bharali
2010)
Similarly RGVN is also offering individual programme for microfinance services
the Credit and Savings Programme RGVN-CSP programme of RGVN was
initiated to provide credit and other financial services to the people who are unable
to access the formal sector and poor women empowerment is their main criteria
though the programme started in 1995 but it is after 2005 the RGVN-CPS geared
up their services and are basically operating in twelve districts in Assam Another
programme known as Entrepreneurship Development Programme (EDP) which is
now modified as Entrepreneurship Development Loans (ENL) provide credit
facility to undertake entrepreneurial activity as self-employment (Deb 2012) CSP
delivers credit via two broad delivery modes such as Group Lending Model and
Individual Lending Model Under Group Lending Model poor women amp men are
provided credit through Self Help Groups (SHGs) and Joint Liability Groups
(JLGs) On the other hand Entrepreneurship Development Loan (EDL) comes
under Individual Lending Model (Borbora amp Sarma)
offers bigger loan to women who want
(Chartering into Untenured
Frontier Targetting the Hard Core Poor) for the need of women belongs to the
poorest of the poor community (Vikash 2008) Microfinance and Health
Protection (MAHP) Initiative etc (Bandhan)
168
34 Operating Models of Microfinance in Assam
The concept of microfinance involves informal and flexible approach for the credit
needs of poor It is equally important to provide the services of microfinance
- an effective manner to reap the
maximum benefits for both the lenders and borrowers and also for the sustainability
of the both Thus microfinance services are provide applying various
demands and others
factors and those microfinance service methodologies are established as Models of
microfinance (Shodhganga) In Assam also according to the needs and capacity of
the borrowers and other local conditions some models are in operation for lending
micro-credit to the beneficiaries and some are home grown models of Assam The
models which are popularly in operation are mentioned below
i) Self-help Group (SHG) Models it comprises three credit linkage models viz SHG Model-I SHG Model-II and SHG Model-III
ii) Joint Liability Group (JLG) Model
iii) Microfinance Institution (MFI) Model
iv) Individual Lending Model
v) Partnership Model
vi) Business Correspondent and Business Facilitators Model
So the models mentioned above are developed at the national level taking help or
example from many countries like from Bangladesh for SHG Models JLG Model
etc and discussion about these models have been given in Chapter-1 Apart from
the above mentioned models RGVN have developed certain need based micro-
credit delivery mechanism slightly different and efficient to meet the needs of the
borrowers of Assam Those programmes are-
169
vii) Entrepreneurship Development Program (EDP)27 Under this
method SHG or JLG loanee members who have good credit records
from last three months or those who have attained a certain level to
absorb more credit and shown entrepreneurial ability by virtue of their
work are availed credit facility and the amount of loan varies from `
15000 to `40000
viii) JLG Cluster Loan SHG Preliminary In this model the individuals
who are earning a very low income in urban rural and semi urban
groups are targeted ie small vegetable sellers fast food vendors
bangle sellers rickshaw pullers etc The maximum loan amount
approved is `2000 and the rate of interest charged is as low as 7 pa
ix) Micro Enterprise Loan Under this system the targeted customer is
different they are the educated men and women who are unemployed
with visible entrepreneurial ability The loan amount is higher and that
ranges from ` 25000 to `50000 Interest rate is same as JLG Cluster
loan but administrative cost is 5 in this case
Whatever be the system methods or methodology used to extend microfinance
services but their ultimate motive is to extend the benefits of micro-credit to the
grass-root level people who are mostly deprived from formal financial system and
are in need of financial support to improve their economic condition living
standard poverty condition and to develop their empowerment level In Barpeta
District of Assam all the models of microfinance mentioned above are more or less
functional but it is mainly dominated by SHG models as such many rural people
27 these are the RGVN special system of microfinance delivery programme designed and developed according to the needs and suitability of the borrower of the locality and these information have been collected from the article written by B Deb on Microfinance and Poverty Alleviation A case study on Rgvn-Csp published in India Journal of Applied Research Vol 2 Issue 3 December 2012
170
of the district understand SHG is a synonym of microfinance and SHG is the only
way out to get loans from the intermediaries So there is lack of awareness among
the people in the district which came to light during the field survey Again HDFC
and Axis Banks in the district stated partnership model microfinance recently with
some NGOs and extending microfinance service by forming groups in the locality
area of NGOs
35 Various Intermediaries of Microfinance in Assam
The success of microfinance programmes depends to a greater extent on its service
delivery mechanism support system and management from the intermediaries who
deal in microfinance To spread the service of micro finance in the state both
government and non-government departments and organisations have been working
from a long time and facilitating the service of small loan ie micro-credit savings
and partially other banking services Those departments and organisations which
are in e and they are involve
in many types of activities like selection of beneficiaries formation of groups
promotion of groups nurturing training financial assistance etc In the apex level
of the state some organisations which are contributing to the development of
microfinance are SIDBI NABARD and NEDNi They are the pioneer in
promoting microfinance service in Assam by providing finance support system to
NGOs and MFIs for on lending the service to the beneficiaries (Sharma 2011) The
government agencies like DRDA and its supporting office like Municipality
Boards Town Committees and Block Offices etc are the supporting and
implementing agencies at every town blocks and village levels of the microfinance
programmes popularly the IRDP SGSY and then NRLM etc
Microfinance becomes a sustainable alternative strategy among the developing
countries to cover its poor and hard-core poor and to save them from the grave of
171
poverty (Sundaram 2007) Thus many policy initiatives followed by various
programmes and schemes are being introduced from time to time to reach the poor
people to eradicate their vulnerable conditions by assisting financial service which
is the life-blood for their all-around development But providing this service only
by government agencies is not sufficient to cover the huge segment of people
demands and in Assam where 86 percent is (Census 2011) rural population it
seems as an impossible task to meet such target As such the service of
microfinance are also providing through NGOs MFIs etc for speedy coverage and
distribution of the benefits and all those Agencies Departments NGOs MFIs etc
are the intermediaries of microfinance NGOs are playing a significant role in the
empowerment of disadvantages women helping them stand on their own through
various socio-economic programmes (Mathaw amp Verghese 2011) vocational
training and other similar program
contribute to their socio-economic empowerment health awareness and general
sensitization such as education employment etc (Asif 2011) And their role
ranges from fulfilling the basic necessity of women to empowering them and lead
to the development of their families (Chatterjee amp Dar 2011) Literature suggests
that NGO interventions positively contribute to women empowerment (Lalitha
2011) In Assam also there are some home grown NGOsMFIs along with outside
organisations which deal in microfinance A list of those NGOsMFIs operating in
Assam is given below
i) RGVN (NE) Microfinance Ltd
ii) ASOMI (Asomi Finance Pvt Ltd)
iii) Bandhan (originally an NGO registered under West Bengal Societies Act But from April 2014 it obtained the banking license from RBI and
iv) Prochesta
v) Sanchays
172
vi) Namghar and Pujaghar
vii) Aasha
viii) Ujjivan
ix) Youth Vo
x) Volunteers for Village Development (VVD)
These are the organisations popularly working as NGOs or MFIs in different parts
of Assam and some of them are also performing in outside of the state in
microfinance and helping in the selection formation promotion nurturing training
of SHGs and more importantly linking those SHGs and beneficiaries with the
Banks thus moving forward the rural masses towards financial inclusion Their
performance is faster and in some cases NGOs are found more active in dealing
with people then GO (Government Organisation) (Desai 2005) and recognising
their performance more importance has been given to these organisations and the
areas where formal organisation and banking services are poor microfinance
services are extended involving local NGOsMFIs also known as SHG bank
linkage programme through NGOsMFIs ie falls under SHG Model-III Though
a good numbers of NGOsMFIs are existing in Assam but the microfinance service
are popularly dominated by only three of such organisation viz RGVN ASOMI
and Bandhan in the state and as well in some neighbouring states
Apart from those leading microfinance intermediaries in Assam many small
organisations are also found active in almost every district of Assam and popularly
working in their respective districts and within their limited areas and provides
microfinance service Interestingly some of the organisation are also accepting
deposits from the people and availing credit facilities as well They follow the
simple procedure of granting loan and make daily weekly or otherwise collection
and most of them are running their service out of their own funds As in Barpeta
district some of such organisations are Shibam Socio-Economic Development
173
Society Jyoti Finance Trupati Finance Anchalik Gram Unnayon Parishad etc
Similarly a number of NGOs are also working in the neighbouring Nalbari district
areas and are concerned with the formation and nurturing of SHGs namely
Weavers Development Society (WDS) Gramya Vikash Mancha (GVM)
DREAMS (Baruah 2012) AASHA (All Assam Socio economic Health
association) PITCCOSS (Pioneer Thrift amp Credit Co-operative Service Society
Ltd) Jivan-Jyoti Silpa Samabay Samiti Ltd Pragjyotika MaaLaxmi Economic
Development Society etc VITAL (Socio-Economic Development Society)
ORAITHA Economic Development Fund etc are in Baksa district of Assam (Das
D) In recent year some Private Sector Banks viz Axis Bank HDFC Bank have
also started functioning in Barpeta district in collaboration with some NGOs to
provide microfinance by forming SHGs and otherwise
36 Magnitude and Trend of Microfinance under SHG Models in the Period
Study
Microfinance has received considerable attention among the researchers policy
makers and financial service providers and is also considered as a powerful
instrument for achieving financial inclusion alleviation of poverty enabling the
rural poor to increase their income opportunities and reduce economic vulnerability
(Ghosh 2012) The Self-Help Group (SHG) - Bank linkage programme
implemented by NABARD since 1992 has become the only dominated model of
microfinance in India in terms of both numbers of borrowers bank loans disbursed
and loans outstanding savings etc Further to cope with the growing demand and
need for microfinance in the country the system of linking of SHGs have been
changed and designed for implementing through the GOs as well as NGOsMFIs
etc thus under SHG Models we have three credit linkage models in India which
are named as SHG Model-I SHG Model-II and SHG Model-III Microfinance
174
through SHGs has reached such a position in India that it is acknowledged as the
biggest microfinance programme in the world The progress of SHG-Bank linkage
programme in India was slow up to 1999 as only 32995 groups were credit linked
during the period 1992 to 1999 and since then the programme is growing rapidly
(Shodhganga) The researcher made an effort to present the magnitude and trend of
microfinance in the study period from 2007-08 to 2011-12 ie for five years under
the SHG Models and to attain the same necessary calculations discussions have
been made with the help of tables and diagrams Again this part of the study has
been sub-divided in to the following heads to cover the entire issue of the
magnitude and trend of microfinance generally in India and Assam and especially
in Barpeta District more clearly and elaborately thus sub-divided into
Position in India
Position in Assam
Position in Barpeta District of Assam
37 Position in India
Microfinance under SHG-Bank linkage programme has reached to over 103 crore
rural households and have access to regular savings through 796 lakh SHGs linked
to banks by March 2012 and 27 of these SHGs are savings linked through
SGSY programme the rural poverty alleviation programme of government of India
The Small beginning of linking only 500 SHGs to Banks in 1992 had grown to over
5 lakh SHGs by March 2002 and further to 7960 lakh SHGs by March 2012 in
India and the share of southern States are highest in the total number of SHGs
linked which stands to 46 while the share of North-East States remain small and
stands only 461 by March 2012 the lowest among all the regions The overall
175
progress under SHG-Bank linkage programme covering three SHG models are
given in the following table
177
From the above table progress under SHG-Bank linkage programme can be clearly
understood if we consider the SHG Savings with banks in the period of study it
has recorded a total growth of 5889 percent with an average growth of 1178
percent pa The growth rate of the same came below the average growth rate of the
period and recorded to only 730 and 670 percent respectively in 2010-11 and
2011-12 Together the 7960 lakh SHGs maintained a balance of over `655141
crore in the Saving Bank accounts with the Banks up to March 2012 with the total
growth of 7307 percent and an average growth of 1461 percent pa in the period
but recorded a negative growth of 67 percent in 2011-12 that owing to the decline
of formation of SHG under SGSY and also for increasing awareness at the SHG
level about the benefits of using the savings for internal lendingloaning
During 2011-12 alone 1148 lakh SHGs availed loans amounting to ` 1653477
crore from Banks in India which records a total growth of 8685 percent from
2007-08 to 2011-12 and an average growth of 1737 percent pa during the period
of study But the growth rate of the same was almost nil in 2010-11 and it was
only 001 percent Again the position of outstanding loans with SHGs reveals that
in 2007-08 outstanding amount of loans was ` 1510478 crore against 3527 lakh
SHGs which increased to ` 36340 crore with 4353 lakh SHGs by the end of
March 2012
Thus total growth came to 10169 percent in outstanding amount of loans during
the period of study As a result the position of total loan (ie total of loan
disbursed and loan outstanding) during 2011-12 stands to the amount of `
5287477 crore with 5502 lakh SHGs which recorded the total growth of 12073
percent from 2007-08 to 2011-12 and an average growth rate of 2415 percent pa
during the study period So it is seen that the growth rate of SHG are
comparatively coming down and a sharp fall occurred in loan disbursed and loan
178
outstanding from 2008-09 it even records negative growth in 2010-11 and 2011-
12 as given in the table The trend position and performance of SHG-Bank linkage
programme under SHG Model-I and Model-II is presented with the help of
following diagram
Figure-33 Position of SHG Savings with Banks Loan Disbursed and Loan Outstanding in India 2007-08 to 2011-12 (Amount in Crore)
Source Status of Microfinance in India 2011-12 2009-10 amp 2008-09 of NABARD
Again the areas where the banking services or branches of banks are not sufficient
or banks being over work-loaded the microfinance service in those places are
provided through NGOs and MFIs and that has developed the concept of MFI-Bank
linkage model (SHG Model-III) where the funding agenciesbanks etc provide
bulk loan to those organizations for on lending to the beneficiaries and SHGs
These intermediaries take care of SHGs in the formation nurturing promotion
training etc to sustaining them towards income generation by providing
microfinance mainly through SHGs In recent years this model has grown rapidly
and their service volumes have also increased in India (Gadiapannivar) The
performance under this model in India is present in the following table
05000
10000150002000025000300003500040000
2007-08 2008-09 2009-10 2010-11 2011-12
Performence under SHG Model-I amp II in India
Amount of Savings Loan Disbursed Loan Outstanding
180
Thus the performance of total amount of loan disbursed under this model
registered a total growth of 16421 percent and an average growth of 3284 percent
pa in the disbursement of loans from 2007-08 to 2011-12 but it recorded a
negative growth of 213 and 3839 percent respectively in 2010-11 and 2011-12
Again in case amount of loan outstanding with MFIs the balance of that in 2007-
08 was only ` 274884 crore with 1109 MFIs in India and that had reached to the
amount of` 1145035 crore with 1960 MFIs by the end of March 2012 Further
and more importantly negative growth had been registered which stands at 3253
percent from 2009-10 to 2011-12 in the amount of total loans availed but prior to
that the growth rate was positive Again the growth rate of MFIs who were
disbursed loans for on lending the beneficiaries had also slightly come-down to
negative in the last two financial years of the study by 395 and 13 in 2010-11
and 2011-12 respectively In all the performances under model-III are shrinking
gradually in India and that can also be seen from the following figure where the
highest performance was recorded only in the year 2009-10 and afterwards the
same passages downwards
Figure-34 Position of Total Loan Loan Disbursed and Loan Outstanding under MFI-Bank linkage (SHG Model-III) in India 2007-08 to 2011-12 (Amount `in Crore)
Source Status of Microfinance in India 2011-12 2009-10 amp 2008-09 of NABARD
0
5000
10000
15000
20000
25000
2007-08 2008-09 2009-10 2010-11 2011-12
Performance under SHG Model-III in India
Total Amount of Loan Loan Disbursed Loan Outstanding
181
37a SHG Model-wise Comparative Performance of Microfinance in India
The SHG model-wise performance can be seen from the following table where it
has been depicted that SHG-Bank linkage model (comprises model-I amp II) where
banks directly lends to SHG together provided more amount of loans than the
MFI-Bank linkage (ie under model-III) during the period of study Interestingly
if we consider the model-wise loan performance ratio as calculated in the following
table it is found that the lending positions under model-III are gradually improved
from 2007-08 to 2011-12 as the ratio of lending comes from 5081 to 3171 by the
end of March 2012 with best performance ratio in the year 2009-10 which was
1721
of Total loans
184
38 Position in Assam
The performance under the SHG Models of microfinance in Assam is impressive in
comparison to the other states of NER but among the other regions of the country
its performance and position is relatively poor and from last a decade its relative
position in terms of geographical coverage reaching rural populations formation of
SHG loan disbursed loan outstanding savings with banks participation of
NGOsMFIs and people etc in microfinance have improved a lot and are further
expanding The number of SHGs having savings with banks in Assam is 276565
which is only 347 percent of the total SHGs of India and amount of savings stands
to ` 984598 crore which is only 150 percent of total savings with the banks in
India by March 2012 Assam is occupying the leading position in microfinance in
the NER as of the total SHGs having savings in banks 7542 percent (ie of the
total 366718 SHGs) SHGs only belong to Assam and of the total amount of savings
of NER ie ` 1525175 crore 6456 percent only belong to SHGs of Assam
During the period of study the SHGs formed under its models along with savings
positions loans disbursed and loans outstanding in total and that to exclusively all-
women SHGs are presented in the following table
186
In Assam the total SHGs linked to Banks up to March 2012 is 276565 lakh
which was only 149719 SHGs by the end of March 2008 thus the total growth
recorded in linking of SHGs to banks is 8472 percent and an average growth of
1694 percent pa during the period of study The accumulated amount of Savings
of SHGs in different Banks with 276565 lakh SHGs is `984598 lakh by March
2012 and that was only ` 580006 lakh by the end of March 2008 which
accumulated the total growth in Savings as 6976 percent and an average growth of
1395 percent pa during the study period and the growth rate of same was highest
in 2011-12 which stands as 2012 percent An analysis about the growth of SHGs
with savings and with saving amount of SHGs during the period of study are
presented in the following diagram and its reveals that during 2007-08 and 2008-
09 the growth of SHGs with savings and amount of savings of the total SHGs and
all-women SHGs were steady and in increasing trend but in the later part in the
period of study ie 2009-10 to 2011-12 the growth rates and position have
fluctuated considerably and decreased which can be observed from the following
diagram
Growth Rate ()
188
Again the amount of loans disbursed during 2011-12 alone was `1874698 lakh to
the 28012 SHGs in Assam and the same was only `886910 lakh to the 20318
SHGs at the beginning of the period of the study Thus it recorded a total growth of
11137 percent in the amount of loan disbursed and 3787 percent in SHGs in five
years period of study and an average growth rate of 2227 percent pa in amount of
loans disbursed and at 757 percent pa in SHGs The growth of the same was
highest in the year 2008-09 to 7698 percent in the amount of loans disbursed The
loans disbursed to all-women SHGs are also considerable during the period of
study which is found in an average of 8293 percent in Assam during the period
of study and an increasing trend has been replicated in the formation of all-women
SHGs as shown in the table-35 A Comparative analysis of SHGs in loan disbursed
and with amount of loan disbursed is presented with the help of following diagram
to show the performance during the period of study
Growth Rate ()
190
The relative growth positions was highest in 2008-09 during the period of study
and surprisingly the growth rate of all other factors as shown in the above diagram
come down to negative level in 2011-12 thus a huge fluctuation has been noticed
during the period Another important fact came-out of the diagram is that from
2009-10 onwards the growth rates are considerably declining and stands to negative
growth by the end of the period of the study
As regards balance of loans outstanding with SHGs it reveals that in 2007-08 the
amount of loans outstanding was only ` 2422437 lakh as against 75405 SHGs
and with an average growth of 2676 percent pa in the amount of loans
outstanding and 1124 percent pa in SHGs with loans outstanding the amount of
loans outstanding reached to ` 6302164 lakh as against 117809 SHGs by March
2012 There is no negative growth that has recorded in any year during the period
of study thus recognising the expansion of microfinance service year after year
The growth rates of SHGs in loans outstanding and amount of loan outstanding
with all-women SHGs are also impressive and records the growth more than 80
percent in both the respect A diagrammatic presentation has been made as under to
analyse the relative position of the factors with loans outstanding in Assam during
the period of study
Growth Rate ()
192
Thus total amount of loan provided (ie loan disbursed and loans outstanding) up
to March 2012 to 145821 SHGs in Assam reached to ` 8176862 lakh which
recorded a total growth of 14708 percent and an average growth of 2942 percent
pa during the period of study The amount of total loans availed to all-women
SHG in 2007-08 was ` 2416816 lakh to the 76090 SHGs and by an average
annual growth of 3708 percent pa in amount of loans outstanding and 1185
percent in SHGs the same reached to the balance of ` 6897173 lakh against
121177 SHG by March 2012 Which is the highest growth recorded in
microfinance service in the NER and Assam is holding the leading position in
microfinance service
38a Analysing Performance of Microfinance under SHG Models in Assam
The performance of microfinance under each of the SHG-bank linkage models (ie
SHG model-I amp II) and MFI-bank linkage model (ie SHG model-III) is presented
in table-36 and it is found that maximum amount of loans have been given to the
beneficiaries together under model-I amp II which was in average 7404 percent pa
of the grand total amount of loans and the same under model-III was only 2596
percent pa during the same period under study in Assam Again the total growth
made in five years in the total amount of loans is 12493 percent together under
model-I and II and that under model-III records a total growth of 25952 percent in
five years under study Thus in terms of amount of total loans SHG-bank linkage
models records more expansion and flow of micro-credit than MFI-bank linkage
model but in terms of growth the MFI-bank linkage model (ie model-III) records
better growth so microfinance service under model-III is considerably increasing
and spreading in Assam Again the total amount of loans provided together under
model-I and II in 2007-08 was 8354 percent which came down to 7605 percent by
March 2012 and the same under model-III was only 1646 percent in 2007-08 and
193
has increased to 2395 percent by March 2012 of the grand total amount of loans
given jointly under all the SHG models in Assam
Table-36 SHG Model-wise Performance of Microfinance in Assam from 2007-08 to 2011-12 (Amount ` in Lakh)
Particulars
Under SHG Model-I amp II Under SHG Model-III Grand Total of Loans under SHG
Models- I II amp III
Loan Disbursed
Loan Outstanding
Total Amount of Loan
(X)
Loan Disbursed
Loan Outstanding
Total Amount of Loan (Y)
2007-08 1021264 (1836)
1743364 (2198)
2764628 (2013)
227352 (3568)
317366 (4621)
544719 (6873) 3309347
2008-09 1362358 (3340)
2521286 (4462)
3883644 (4048)
415116 (8259)
556887 (7547)
971518 (7835) 4855162
2009-10 1478359 (851)
2867412 (1373)
4345083 (1188)
1097091 (16429)
1426836 (15622)
2524614 (15986) 6869698
2010-11 1588320 (744)
3408841 (1888)
4997161 (1501)
922130 (-1595)
1499297 (508)
2421427 (-409) 7418588
2011-12 1944458 (2242)
4273228 (2536)
6218504 (2444)
612447 (-3358)
1346729 (-1018)
1958358 (-1912) 8176862
Source Status of Microfinance in India NABARD amp Table-3 amp 4 above Note The model-wise allocation of microfinance in Assam as shown in table- 36 have been obtained by calculation with the help of all India average ratepercentage of flow of microfinance under each of the models as shown in table-34 above Because NABARD do not published such information in its reports state or region wise rather as a whole for the country Figures in the parenthesis are the growth rates
A diagrammatic presentation has also been made to analyse and to show the
relative performance of microfinance in Assam under each of the SHG models
From the diagram it can be seen that all the factors ie loans disbursed loans
outstanding and total amount of loans under the SHG models are in regular
increasing trend only with the little exception of decreasing trends in 2011-12
under model-III
Amount in Lakh
195
So SHG-bank linkage models remain dominant in providing microfinance service
to the people of Assam because the performance in all the factors as mentioned
above are higher than MFI-bank linkage model in absolute figures The amount of
loans disbursed together under model-I and II in 2007-08 was ` 1021264 lakh
which records a total growth of 9040 percent in five years with an average growth
of 1808 percent pa and reached to `1944458 lakh by March 2012 and the same
under model-III was ` 227352 lakh in 2007-08 which recorded a total growth of
16938 percent in five years period with an average growth of 3388 percent pa
and reached to `612447 lakh by March 2012 Again in case of balance of loans
outstanding with SHGs the amount of loans outstanding under model-I and II
together was amounted to `1743364 lakh and recorded total growth of 14511
percent in five years from 2007-08 to 2011-12 with an annual growth of 1902
percent pa and reached to ` 4273228 lakh by March 2012 The same under
model-III was `317366 lakh in 2007-08 and recorded a total growth of 32434
percent with an annual growth of 6487 percent in the period of study and reached
to ` 1346729 lakh by March 2012 Thus the progress and growth trend under
model-III are relatively better than together under model-I and II during the period
of study in Assam The details progress and growth pattern under each of the SHG
models are presented in following diagram to access the performance more clearly
196
Figure-310 Growth Trend of Microfinance under SHG Model- I ampII in Assam from 2007-08 to 2011-12
Source Table-36 So the growth trend as depicted in the above diagram was to the maximum level in
2008-09 and after that there was a sharp fall in growth of all the factors ie loan
disbursed loans outstanding and in total amount of loans in 2009-10 Again slow
progress is recorded which can be seen in the diagram from 2010-11 onwards
interestingly during the period of five years none of the factors have recorded any
negative growth together under SHG model- I amp II
Again to know the same under SHG model-III another diagrammatic presentation
has been made in figure-311 to access the progress and performance in terms of
growth rates of loans disbursed outstanding and total loans more clearly and it is
found that with steady increasing growth from 2007-08 in all the loans factor it
reached the highest level of growth in the year 2009-10 and after that there was a
sharp down-fall in the growth in all the factors of loans in 2010-11 and thereafter
further down-fall was recorded which can be observed from the diagram and
recorded negative growth in all the factors of loans from 2010 to 2012 leaving the
factor outstanding loans in 2010-11 which was slightly positive among the other
loan factors Thus huge fluctuations have been found in microfinance service under
0
10
20
30
40
50
2007-08 2008-09 2009-10 2010-11 2011-12
Growth Trend of Microfinance together under SHG Model-I amp II in Assam
Loan Disbursed Loan Outstanding Total Amount of Loan
197
model-III in Assam The incident which occurred in Andhra Pradesh in 2010 the
change of microfinance programme from SGSY to NRLM etc are some of the
reasons for such huge fluctuation under model-III in our country including Assam
decreasing interest of funding institutions and banks to MFIs for huge NPAs is also
another reason behind such fluctuations
39 Microfinance in Barpeta District of Assam
As informal source of finance the practice of microfinance was in Barpeta District
from ancient time in various forms and not exactly in the form what we called
-
credit
Growth Rate ()
199
Poor people used to borrow from the money lenders or from local capitalist mostly
by mortgaging their valuables like jewellery lands cattle etc as security for the
loan credit Most of them basically borrowed consumption type loans or loans in
case of acute needs of the family with very high rate of interest which even stood
more than the principal sum of money they borrowed (IIBF 2010) (Yunus 2007)
So history of microfinance in Barpeta District of Assam had no exceptions from
the rest of the country The cooperative system was an initiation in the field of
financial service for the poor in Assam and as well in Barpeta District and the role
of rural credit cooperative have some impact in the life of rural people though is
unable to bring such revolution among the rural people in the villages and of remote
areas
If we concentrate on the movement or start-up of microfinance services in the
district then it is after the introduction of SGSY programme the major poverty
alleviation programme of GOI in the 2000 but as reported by the district official
from 2004-05 the programme start progressing by forming SHGs in voluminous
manner and prior to that the progress was not impressive Considering the fact the
researcher considers the period of study from 2007-08 to 2011-12 ie for five
years and the progress and performance under the SHG models of microfinance of
the said period only have been shown in this study Again under the SHG models
three SHG-credit linkage models exist but in Barpeta district no such SHG were
found during the field survey who are directly formed and nurtured by the banks in
the district which comes under SHG model-I Limited bank branches works
overload limited banks staffs lack of interest of banks etc are some of the general
reasons for non-operational of model-I in the district As such the present study is
confine to the rest of the two models ie SHG Model-II and SHG Model-III in
Barpeta District of Assam The detailed information and data of microfinance
relating to the study about Barpeta District are presented in the following table
201
39a Magnitude and Progress of SHG in Barpeta District
Total SHGs linked to Banks and MFIs of the District up to the end of March 2012
has grown to 15 477 which was 11346 SHGs during 2007-08 thus the same
recorded a total growth of 3641 percent and an average growth of 728 percent pa
during the period of study in linking SHG together under SHG model-II and III
The least growth rate recorded during the period was 555 percent in the year 2011-
12 The position of all-women SHGs in Barpeta District is impressive and having
reached beyond the national average of 80 percent (NABARD 2012) Women
members occupied the lion share in microfinance in the district as all-women
SHGs in the District have increased to 15261 of the total SHGs up to March 2012
which is 9860 percent of total SHGs of the district The position of all-women
SHG in the district in 2007-08 was comparatively a bit poor as there was 10952
SHGs and that stood to 9653 percent of the total SHG of that year Thus total
growth of all- women SHGs in the district comes to 3934 percent in the five years
with an average growth of 787 percent pa A diagrammatic presentation has been
made with the help of total SHGs all-women SHGs and active SHGs in figure-
312 to show the magnitude and progress of SHGs in Barpeta District and it is
found that during the period of study SHGs in the district records slow progress
year after year almost at the same rate of growth in all the factors of SHG Of the
total SHG only 8392 SHGs are reported as Active30 SHG in the district and that is
only 5422 percent of the total SHG Thus near to half of the total SHGs in the
district are found defunct and those SHGs are no longer in existence or not
interested in SHG activities As reported by the intermediaries of microfinance in
the district most of those defunct SHGs were formed with the intention to take the
benefits of subsidy and while they found no more subsidies they stopped working
and their SHGs became inactive
30Active amp defunct SHGs here recorded as per the records and information of SHGs intermediaries of Barpeta District
202
A diagrammatic presentation has been made with help of total SHGs comparing
with all-women SHGs and active SHGs in the district during the period of study as
follows
Figure-312 Total All-Women and Active SHGs Positions in Barpeta District of Assam from 2007-08 to 2011-12
Source Table-37
So it can be observed from the above diagram that a steady incremental trend and
progress have been recorded during the period of study in the district in all the
factors of SHG and most importantly no abnormal fluctuation has been recorded
during the period of study
39b Growth Trend of SHG in Barpeta District
While SHGs growth position is considered the growth trend of the same have
gradually come down from 2007-08 to 2011-12 which can be viewed from the
following in figure-313 which is prepared taking the growth rates of the total all-
women and active SHGs of Barpeta District
0
20004000
6000
8000
1000012000
14000
16000
2007-08 2008-09 2009-10 2010-11 2011-12
SHGs of Barpeta District of Assam
Total Nos of SHG All Women SHG Total Active SHG
Growth Rate ()
204
It is clearly depicted in the above diagram that the SHG growth rate and position
have come down from 2009-10 onwards and those growth rates come even below
10 percent in the district the growth rates was maximum in 2008-09 as viewed in
the above diagram The position of active SHGs in terms of growth during the
period of study recorded a total growth of 3610 and an average growth of 722
percent pa in the study period But the growth rate of the same was very poor as
376 percent during 2011-12 Thus growth rate of active SHGs come down during
2011-12 even below the average rate This indicates the slow progress in the
formation and leaves question marks to the sustainability of SHGs in the district
owing to the poor management limited credit flow subsidy provision under SGSY
rural people participation in NREGA etc in the district has weaken the
performance
39c Magnitude of Loans Provided under SHG Models in Barpeta District
The total amount of loans availed to the beneficiaries or SHG members in Barpeta
District occupy only 936 percent of the total amount of loans availed in Assam
comprising of loans disbursed and loans outstanding during 2011-12 The share of
district in the state were same with little difference in the whole period of study as
it was 1362 percent in 2007-08 the highest score in period under study 952
percent in 2008-09 900 percent in 2009-10 and 929 percent in 2010-11 and those
with an average share of 1016 percent pa during the five years period under
study31 The amounts of loans disbursed to the SHGs in the district were `161569
lakh in 2007-08 which with an average incremental growth of 3039 percent pa
reached to `284031 lakh by March 2012 with the exception of negative growth
of 144 percent during 2011-12 during the period of study As regards amount of
loans outstanding with SHGs in the district the records reveal that it was ` 289089
31The share total amount of loans availed during the period under study are calculated taking the figures of total loans of Assam and of Barpeta District year after year from Table-36 amp 37 as mentioned above
205
lakh in 2007-08 and the amount of loans outstanding balance rose to `481183 lakh
which seems near to double by the end of March 2012 thus recognising
considerable growth in financing during the period of study All-women SHGs
constitute the lion share in the district and of the total amount of loans given to all-
women SHGs 8174 percent pa are provided only to those SHGs in the district
with little variation during the period of study A diagrammatic presentation has
been made with the help of amount of total loans loans to all-women SHG loans
disbursed and loans outstanding to have a clear picture about the magnitude of
microfinance in the district during the period of study which is as follows
Amount in lakh
207
It can be observed from the diagram that the position of loan factors is gradually
increasing maintaining the same sequence and rate year after year during the
period of study thus the loan factors are normally growing which is a healthy sign
of development of microfinance position and services in the district
39d Analyzing the Growth Trend of Loans under SHG Models in Barpeta
District
To know the actual picture of performance and progress of microfinance more
precisely in the district through its lending to the SHGs under the SHG models
effort were made to find out the growth pattern of loans availed to SHGs during the
period under study with the help of diagram as given in figure-315 It is depicted in
the same that considerable ups and downs have been recorded in the growth rates
among the loan factors during the period of study in the district and in some cases
negative rates of growth have also occurred
Growth Rate ()
209
The amount of loan disbursed to the SHGs during year 2011-12 was `284031
lakh and that recorded a total growth in disbursing loans to SHGs from 2007-08 to
2011-12 of 13364 percent with an average growth of 2673 percent pa during the
period of study But during 2011-12 the rate of growth of the same was negative to
144 percent in the district Again the amount of loan outstanding with the SHGs in
the district up to March 2012 was `481183 lakh which recorded a total growth
of 6645 percent and an average growth of 1329 percent pa during the period of
study The growth of loans outstanding was negative in 2008-09 and highest in
2009-10 to 4630 percent again fell in 2010-11 and increased a little in 2011-12
As all-women SHGs have occupied the lion share in the district and up to March
2012 the total amount of loans disbursed to those SHGs were ` 658773 lakh and
that recorded a total growth of 9109 percent with an average growth of 1822
percent pa during the period of study Of the total amount of loans maximum
amount of loans are availed to the all-women SHG in the district which in average
was 8174 percent pa during the period of study Further of the total amount of
loans availed (ie loans disbursed and loans outstanding) against the SHGs in the
district recorded a total growth of 8634 percent in five years with an average
growth of 1727 percent pa during the period of study
39e Analyzing SHG Model-wise performance of SHGs in Barpeta District
As among the three SHG-credit linkage models SHG Model-II and Model-III are
functional in the district and no such SHGs were found which are directly formed
under Model-I as such analysis of this part are confine to the models which are
operating and functional in the Barperta District Again details as regards SHG
models have already been mentioned in chapter-1 but for the sake of convenience a
brief outline of two functional models in the district are given below
210
SHG Model-II Under this model SHGs are formed and nurtured by the
intermediaries which includes GOs and NGOs and after a certain period and on
satisfactory performance in group management and group funds handling (ie
savings of members) they are being linked to banks for loans In Barpeta District
the task of formation nurturing linking etc of SHGs under SHG Model-II are
performed under the blocks by the Blocks official at the block and village level and
after their satisfaction and scrutiny about the performance of the group they send it
to the DRDA office for the approval and sanction of loans While assessing the
performance of SHGs (the Blocks official and sometimes persons from banks also
join in the process) for grading the SHGs on their performance on the basis of
some parameters where they mainly consider the following five points of SHG and
(ie five point formula) for grading
and promotion of SHG and includes
1 Weekly Meeting
2 Weekly Savings
3 Internal Credit
4 Recovery of Internal Credit
5 Records keeping
On satisfactory performance evaluation the list of SHGs are sent to DRDA for the
sanction of loan and DRDA may call some groups for talking if they feel the need
and after their needful verification they send the list of SHGs to the banks and a
copy to the respective blocks for record keeping and the groups are availed loans
through banks thus the groups are being linked with bank branches
SHG Model-III Under this model some NGOs and MFIs as intermediaries avail
bulk amount of loan from various funding institutionsbanks for on lending to the
groups The intermediaries take care of the groups in all respect and directly finance
the groups The groups in return have to follow the instruction of those
211
intermediaries and have to repay the loan as per the time and size of installment
fixed by them In Barpeta District ASOMI Bandhan RGVN are the leading MFIs
dealing with SHGs to provide micro-credit under this model The selection
procedure promotion criteria etc of SHG depends upon the intermediary which
slightly varies among the service providing intermediaries but the basic objectives
remain same
A detailed SHG model-wise break-up of SHGs in the district are given in the
following table
213
If we consider the model-wise SHG formation performance in the district more
numbers of SHG are being formed under model-II than model-III and that in terms
of ratio which was 1010 1 in 2007-08 and that has improved a little towards
model-III and in 2011-12 the ratio of SHG formation stands at 8761 under
model-II to III An analytical diagrammatic presentation has been made to show the
performance in the formation of SHGs under each of the models as follow
215
From the above it can be easily understood that more SHGs were formed under
SHG model-II in comparison to the model-III but in both the models the trend of
formation of SHGs are common during the period The quantum of all-women
SHG formed under each model is high and different but their trends of progress
under each of the model are alike But in the quality assessment of SHG under
each model the half of SHGs formed under model-II have gone defunct as per their
records and those SHGs are not in touch with the intermediaries and the same in
case of model-III is very efficient and only a meagre percentage of SHGs is
reported as defunct in the district Thus SHGs formed under model-III is well
managed by those intermediaries and more sustainable in comparison to model-II
under study To have precise outcome on the issue of quality and sustainability of
SHGs under each of models a diagrammatic presentation has been made as
follows
216
Figure-317 SHG Model-wise Quality and Sustainability Position of SHGs in terms of Active and Defunct SHGs in Barpeta District
Source Table-38
In year-wise comparison of the active SHGs under each of the SHG models it is
clear that SHGs formed and managed under model-III are more active and
sustainable and that in an average is 9126 percent pa SHGs under this model are
found more active during the period of study in the district and that in case of
model-II is only 5164 percent pa in average during the same period of study in the
district Thus an average gap of 3962 percent pa or SHG model-II is lagging
behind by the same percentage from model-III in the sustainability of SHG during
the period of study
39f Growth Trend of SHGs under SHG Model-II in Barpeta District
The growth trend and position of the SHGs formed under model-II in the district
taking the growth factors of total SHGs formed total all-women SHGs and total
active SHGs the following diagrammatic presentation has been made in figure-
318
2007-08 2008-09 2009-10 2010-11 2011-12
5296 5318 5128 509 4987
8767 8994 9181 9455 9231
Comperative Quality amp Sustainability Position of SHGs in Barpeta District
Active SHGs under Model-II Active SHGs under Model-III
Growth Rate ()
218
The diagram clearly indicates that the growth trend in all the factors are gradually
coming down from 2007-08 to 2011-12 and more importantly the trend line of
active SHG is under all the trend lines presented in the diagram which is very
important to be considered and more important line among all the trend lines
presented in the diagram Thus positions of SHG under model-II are gradually
deteriorating and very poor during 2011-12 in the district and during the period of
study
39g Growth Trend of SHGs under SHG Model-III in Barpeta District
The growth pattern of SHGs in the district under model-III is shown in the figure-
319 and it is clearly understood from the same that the growth was highest during
2008-09 in the periods of study and after that there was sharp fall in the growth
rates in all the factors of SHGs growth rates under consideration but from 2010-11
to 2011-12 a slow progressive growth has been noticed in the diagram which is a
good sign
Growth Rate ()
220
Again the growth rate and trend of active SHG is above all the growth lines in the
figure which is found just reverse under model-II as mentioned earlier Thus from
the two diagrammatic presentations it is clear that by the end of the period under
study all the growth lines under model-II records downwards movement and the
same under model-III records upward movement or in progressive trend
39h Analysing SHG Model-wise Magnitude and Trend of Microfinance in
Barpeta District
The details of microfinance performance under each of the SHG models in the
district are presented in table-39 and it is found from the same that model-III has
performed well in terms of providing more amount of loans to the beneficiaries in
comparison to model-II if we consider the model-wise loaning performance ratio
as given in the table more amount of loans or microfinance has been availed under
model-III in all through the period of study and the average ratio of lending under
these two models comes to 0731 pa during the period of study The amount of
loan disbursed under model-II in 2007-08 was only ` 38685 lakh which at an
average annual growth of 2197 percent reached to `81181 lakh during 2011-12
and in case of loan outstanding with SHG in the district it was an amount of `
157351 lakh in 2007-08 which rose to the balance of loans outstanding to
`256484 lakh thus registered a total growth of 63 percent in period of study But
position of loans disbursed under model-III was ` 122884 lakh in 2007-08 which
with an average annual growth of 1301 percent reached to ` 202850 lakh by
March 2012 in the district including a negative growth of 176 percent in 2011-12
Again about the amount of loans outstanding with SHG in the district it was only
` 131773 lakh in 2007-08 which rose to ` 224699 lakh by March 2012 thus
registered a total growth of 7052 percent during the period of study
222
The all-women SHGs constitute the major share in the district thus an effort was
made to know the amount of loans provided to them and the total amount of loans
provided to those SHG under model-II was ` 144987 lakh in 2007-08 which by
registering an average growth of 2033 percent pa reached to ` 271696 lakh by
March 2012 The same under model-III was ` 199793 lakh in 2007-08 rose with
an average growth of 1818 percent pa and reached to ` 298333 lakh by March
2012 Further the women SHGs are given in an average 7579 percent of the total
amount loans under model-II during the whole period of study and the same under
model-III was in an average of 8589 percent during same period of study in the
district Thus under model-III 1010 percent more amount of loans had been
extended to the all-women SHGs in the district in all through the period of study
Again total amount of loans provided under model-II in the district was ` 196036
lakh in 2007-08 which increased with an average growth rate of 1524 percent pa
and reached to ` 252362 lakh in 2011-12 and the same under model-III was `
254657 lakh in 2007-08 which rose to ` 259989 lakh by recording an average
growth of 1306 percent pa during the entire period of study Surprisingly despite
having such huge volume of SHG under model-II (ie 9099 of the total SHG in
the district) in the district only 4350 percent of the grand total amounts of loans
were provided to SHGs in 2007-08 and that under model-III was 5650 percent to
only 901 percent of the total SHGs of the said period This huge disparity signifies
that the SHGs under model-III were availed more amount of loans and SHGs under
model-II were under-served or extended poor amounts of loan Again if we
consider the same for the year 2011-12 an amount of ` 252362 lakh which is
4227 percent of the grand total amount of loans were extended to the beneficiaries
under model-II in the district and under model-III the same was ` 259989 lakh
which is 5773 percent of the grand total amount of loans provided in the same
period of study The magnitude and trend of microfinance in the district is also
presented with a diagram in figure-320 to understand the scenario more clearly
Amount in Lakh
224
Simply it can be understand from the diagram that in all the factors of loans to the
SHGs performance under model-III is more lucrative and provided more amounts
year after year thus model-III holds better position in the magnitude of loans in
Barpeta district of Assam
39i Analyzing the Comparative Growth Trend of Microfinance under SHG
Model-II and III in Barpeta District
The growth trend of microfinance under each of the SHG models under study
behave and move in reverse way as under model-II the growth trends fluctuate
considerably during the period of study in the district but the growth trends under
model-III slowly progressed from 2007-08 to 2009-10 and thereafter gradually fell
up to the end of the period under study But progress under model-III was almost
steady in comparison to model-II in the same period of study The Comparative
growth position can better be understood from the following diagram which is
prepared taking all the growth rates of loans in Barpeta District in the following
diagram
Growth Rate ()
226
So the growth trends under model-II were negative except in loan disbursed in
2008-09 which reached to the top level in 2009-10 and again fell down in 2010-10
and in 2011-12 consecutively But those under model-III experienced almost a flat
and steady growth during the period of study The growth of loans disbursed under
model-II was 1920 percent in 2007-08 which maintained an average incremental
growth of 2118 percent all through the period but registered a negative growth of
064 percent in 2011-12 The same under model-III was 1833 percent in 2007-08
and recorded an average incremental growth of 1467 percent pa during the period
of study but that stands to 176 percent negative growth in 2011-12 In the case of
growth rate of loans outstanding with the SHGs in the district it was only 1295
percent in 2007-08 which reached to 2270 percent in 2011-12 registering two
negative growths of 2141 and 250 percent respectively in 2008-09 and 2010-11
But under model-III the same was only 432 percent in 2007-08 which reached to
1715 percent in 2011-12 by registering an average growth of 1241 percent pa all
through the period of study and no negative growth had been registered in the
period The growth pattern of loans to all-women SHG is a strong factor in the
district because more than 80 percent SHGs fall under this category and in 2007-
08 it registered a growth of 1555 percent and that also maintained an average
growth of 2033 percent pa all through the period under study and stands at 1507
percent in 2011-12 overcoming a negative growth of 2027 percent in 2008-09
under model-II and the same under model-III was 1840 percent in 2007-08 and
registered an average growth of 1818 percent pa during the period of study and
reached to 1150 percent in 2001-12
Further Intermediaries-wise SHGs Position and Trend with their loans position
during the period of study in Barpeta District under Model-II and III are presented
with the help of following two diagrams
Nos of SHG
Amount in Lakh
229
The outcomes of the above diagrams is very clear as maximum SHGs are formed
under model-II by block intermediaries as shown in figure-322 but availed less
amount of loans to those few percentage of SHGs On the contrary very few
percentage of SHGs are formed under Model-III by NGOsMFIs in the district but
maximum amount of loans are availed towards those SHGs those groups are
getting more loans or frequent loans in comparison to the SHGs formed under
model-II in the district during the period of study that are shown in figure-323
310 Analyzing Comparative Growth Position of SHGs in India Assam and in
Barpeta District under the SHG Models
After going through the positions of microfinance in India Assam and in Barpeta
district as mentioned above where mixed responses are found and to show the
relative position more precisely efforts were made to have comparative study with
the core factor of performance in terms of growth trends of SHGs right from
national level to the district level and that will depict the picture more clearly As
such their performances have been presented with the help of following two
diagrams as follows in figure-324 and figure-325
Growth Rate ()
Growth Rate ()
232
In both the figures given above it is clearly depicted that there is a sharp fall in the
performance of SHGs and loans extended to them from 2009-10 onwards in all
sector of microfinance ie in India Assam and as well in Barpeta District of
Assam The position was favourable from 2007-08 to the 2009-10 as highest
growth rates were recorded during that period as shown in the figures Such drastic
down-fall in both in the growth of SHGs and in microfinance (ie in extending
total amount of loans) during the period had weakened the service of microfinance
spreads and base in the country The incidents that had occurred in Andhra Pradesh
where 30 farmers had committed suicide within a span of 45 days in 2010 after a
few MFIs used coercive recovery tactics (Patra 2011) is a strong reason for such
adverse scenario as after such incidents many financing banks and institutions
stopped financing to MFIs The subsidy provision under SGSY programme also
weakened the base of a group of SHGs which were formed only to take the
benefits of subsidy and not SHGs as a means of self-employment provisions is also
added to the reason of such downfall in the performance of microfinance sector in
our country Again the change of programme from SGSY now to newly introduced
NRLM also concentrate a lot in the change of the functional structures power and
management and also weakens the rapid growth and speeds of microfinance sector
in the country during the period under study
311 Conclusion
During the period under study the performance under microfinance service has
been moved in two way dimensions as in the first half of the period ie from
2007-08 to 2009-10 the performance was in progressive trend in India Assam and
as well in Barpeta district of Assam but in the later part of the period of study the
performance and progress experienced downfall While we consider the magnitude
of microfinance services in Assam in terms of SHG with saving in banks it is
found that only 347 percent SHGs belong to Assam and same is 1879 percent
233
highest in the country in case of Andhra Pradesh by the end of March 2012 The
relative position of Assam in NER is good as Assam occupied 7542 percent of the
total SHGs of the region and that with the amount of savings of `984598 lakh
which stands at 6456 percent of the total amount of savings of NER Thus Assam
is in leading position in the region followed by Tripura and then Meghalaya
(NABARD 2012) In case of amount of loans disbursed to SHGs in 2011-12
Assam is having only 113 percent of the total amount of loans disbursed in India
and among NER it is 4154 percent followed by Tripura and Manipur
On SHG model-wise analysis it is found that SHG-bank linkage models (together
SHG Model-I amp II) remain in dominant position in terms of volume of SHGs and
absolute amount of loans availed to SHGs in the country than MFI-bank linkage
model (ie SHG Model-III) during the period of study But in Barpeta District of
Assam some variation in the model-wise performance has been found during the
period of study as model-II is found popular and covered more number of members
and is able to form more numbers of SHGs in comparison to that of under model-
III As of the total SHGs in the district 8975 percent are formed under model-II
and only1025 percent SHGs are under model-III in 2011-12 Again total amount
of loans given to SHGs under model-II in the same period was ` 337665 lakh
which was 4413 percent of the grand total amount of loans under both the models
and the rest 5587 percent were given to only 1025 percent of the total SHGs in
the district Thus SHGs under model-III are given more amount of loans or
frequent loans in comparison to the SHG under model-II in the district during the
period of study In terms of growth factors under each of these two models growth
trends under model-II both in case of SHG and in amount of loans to them more
fluctuations or ups and downs were recorded during the period of study and by the
end of the period particularly in 2010-11 and 2011-12 the growth trends were
down-falling in the district But the same under model-III were almost steady
during the period of study with a bit high in 2009-10 and a bit low in latter part of
the period of study particularly in 2010-11 to 2011-12 in the district Again in
234
terms of sustainability of SHGs formed under each of the SHG models also varies
a lot The SHGs formed managed and financed under model-II are half in an
average of the total are defunct SHGs and only 50 percent of them survive or are
functional in the district but the same under model-III is found more than 91
percent as active and functional during the period of study in the district Thus
over-all performance of SHGs under SHG model-III in the district during the period
of study is better than SHGs under model-II in respect of service quantum of
loans growth trends and sustainability etc
References
(2006) Statistical Hand Book of Assam Guwahati Directorate of Economics and
Statistics Government of Assam
Asif M (2011 November) Role of NGOs in India YOJANA 55 pp 8-10
Bandhan (nd) Bandhan Hope for the Poor Product Information Broucher of Bandhan
West Bengal India Bandhan
Baruah P B (2012) Impact of Microfinance on Poverty A Study of Twenty Self-Help
Groups in Nalbari District Assam Journal of Rural Development 31(2) 223-234
Bharali S (2010 July 18) An Institute Promotion of Secure Sustainable Livelihood
ASOMI Barta 6(6)
Borbora S amp Sarma G K (nd) Microfinance Institutions Sustainability and Outreach
Retrieved May 2 2014 from httpwwwwbiconprocom314-borborapdf
CGAP (nd) Consultative Group to Assist the Poor Retrieved from wwwcgaporg
Chatterjee N amp Dar M A (2011 November) Role of NGOs in Rural Development
YOJANA 55 pp 17-20
Chief Ministers Micro Finance Scheme-Assam Financial Corporation (CMMFS) Khudra
Reen (nd) Retrieved May 1 2014 from httpwwwafconlinegovin
documentbroucherpdf
Chief Ministers Micro Finance Schemes- Assam Financial Corporation (nd) Retrieved
May 1 2014 from httpwwwafconlinegovinpdfmfnbbrochure Englishpdf
Das D (nd) Informal Microfinance in Assam Empirical Evidence from Nalbari and
Baksa Districts Retrieved November 2013 from IFMR Centre for Microfinance
235
Research httpwwwifmrleadorgcmfwp-contentuploadsattachmentscsy1685
informal20MF20in20Assampdf
Das K (2012 January- March) Financial Inclusion-A Gateway to Sustainable
Development for the Impoverished Journal of Rural Development NIRD 31(1)
115-128
Das R L Dutta D N Kakoti P amp Deka S N (2011) Rural and Microfinance
Guwahati BLJ Publication
Deb B (2012) Microfinance and Poverty Alleviation A Case Study on Rgvn-Csp Indian
Journal of Applied Research 71-74
Desai V (2005) NGOs Gender Mainstreaming and Urban Communities in Mumbai
Gender and Development 13(2) 90-98
Devi M (2012 January 20) Rural Industrialisation for Development The Assam Tribune
Guwahati p 6
Dhar P K (2009) The Economy of Assam Including Economy of Narth East India New
Delhi Kalyani Publishers
Dutta J amp Upadhaya M (2013 August 23) Green Microfinance for Eco-friendly
Development The Assam Tribune (English Daily News Paper) p 6
Economic Survey Assam 2011-12 (nd) Retrieved April 30 2014 from
httpwwwecostatassamnicinads_economic20survey-2011-12pdf
Executive Summary Part-I An Overview of State Focus Paper 2006-07 (nd) Retrieved
April 30 2014 from httpwwwnabardorgpdfAssam20EXECUTIVE
20SUMMARYpdf
Gadiapannivar R D (nd) IFMR Centre for Microfinance Retrieved November 2013
from wwwifmracincmf httpwwwifmrleadorgcmf
Ghosh M (2012 July-Sept) Microfinance and Rural Poverty in India SHG-Bank Linkage
Programme Journal of Rural Development 31(3) 347-363
Gogoi P (2013) Economic Empowerment of Rural Women Through Income Generating
Activities In B M Doley (Ed) Women in Rural Development (Seminar Volume)
(pp 36-45) Guwahati Publication Board Silapathar College Dhemaji Assam
IIBF (2010) Rural Banking New Delhi Indian Institute of Banking amp Finance by
Macmillion
Khanka S S (2010) Microfinance in India From Evolution to Revolution In J U
Ahmed D Bhagat amp G Singaiah (Eds) Microfinance in India Issues and
Challenges (pp 3-14) Guwahati DVs Publications
236
Lalitha N (2011 February) Sustainable Management of Local Resources YOJANA 55
pp 32-35
Mathaw J amp Verghese J (2011 November) Non Governmental Organisation in India
YOJANA 55 pp 12-14
NABARD (2012) Status of Microfinance in India 2011-12 Mumbai NABARD
NRLM (nd) NRLM Procurement Manual- Ministry of Rural Development Retrieved
May 1 2014 from httpruralnicinsitesdownloadslatestNRLM
20Procurement20Manualpdf
Patra D R (2011 December) Death of Microfinance in India BFM Banking Finance
Markets A Planman Financial-IIPM Think Tank Publication 1(10) pp 28-33
RBI (nd) Quarterly Statistics on Deposits and Credit of Schedule Commercial Banks
March 2007 to March 2011 Mumbai Reserve Bank of India
Roy A (nd) Microfinance and Rural Development in the North East India Retrieved
December 2013 from httpwwwpbrcoinBrochure0006pdf
Sarmah V (2010) Microfinance Vission 2015 Northeast Region India Retrieved July
2013 from httpwwwaccessdevorgdownloadsmicrofinance_vision_2015pdf
SGSY (2010) Swarnjayanti Gram Swarozgar Yojana (SGSY) Retrieved May 1 2014
from httpwwwcsjpgoaorgwp-contentuploads201010sjgsypdf
Sharma A K (2011 December) Micro Finance in the North East YOJANA pp 8-10
Shodhganga (nd) Chapter-3 Microfinance Trends Problems and Prospects Retrieved
June 2013 from httpshodhgangainflibnetacinbitstream10603303111
n_chapter203pdf
Srinivasan N (2009) Microfinance India State of the Sector Report 2009 Delhi
ACCESS Sage
Sundaram I S (2007) Microfinance in India Delhi BR Publishing Corporation
Tribune A (2007 May 7) Self-help Groups and Rural Development The Assam Tribune
Guwahati p 6
Vikash (2008 March) About the Issue Microfinance Focus II(IV) 3
Yunus M amp Jolis A (2007) Banker To The Poor The Story of the Grameen Bank New
Delhi Penguin Books
----0----

Growth Rate ()
188
Again the amount of loans disbursed during 2011-12 alone was `1874698 lakh to
the 28012 SHGs in Assam and the same was only `886910 lakh to the 20318
SHGs at the beginning of the period of the study Thus it recorded a total growth of
11137 percent in the amount of loan disbursed and 3787 percent in SHGs in five
years period of study and an average growth rate of 2227 percent pa in amount of
loans disbursed and at 757 percent pa in SHGs The growth of the same was
highest in the year 2008-09 to 7698 percent in the amount of loans disbursed The
loans disbursed to all-women SHGs are also considerable during the period of
study which is found in an average of 8293 percent in Assam during the period
of study and an increasing trend has been replicated in the formation of all-women
SHGs as shown in the table-35 A Comparative analysis of SHGs in loan disbursed
and with amount of loan disbursed is presented with the help of following diagram
to show the performance during the period of study
Growth Rate ()
190
The relative growth positions was highest in 2008-09 during the period of study
and surprisingly the growth rate of all other factors as shown in the above diagram
come down to negative level in 2011-12 thus a huge fluctuation has been noticed
during the period Another important fact came-out of the diagram is that from
2009-10 onwards the growth rates are considerably declining and stands to negative
growth by the end of the period of the study
As regards balance of loans outstanding with SHGs it reveals that in 2007-08 the
amount of loans outstanding was only ` 2422437 lakh as against 75405 SHGs
and with an average growth of 2676 percent pa in the amount of loans
outstanding and 1124 percent pa in SHGs with loans outstanding the amount of
loans outstanding reached to ` 6302164 lakh as against 117809 SHGs by March
2012 There is no negative growth that has recorded in any year during the period
of study thus recognising the expansion of microfinance service year after year
The growth rates of SHGs in loans outstanding and amount of loan outstanding
with all-women SHGs are also impressive and records the growth more than 80
percent in both the respect A diagrammatic presentation has been made as under to
analyse the relative position of the factors with loans outstanding in Assam during
the period of study
Growth Rate ()
192
Thus total amount of loan provided (ie loan disbursed and loans outstanding) up
to March 2012 to 145821 SHGs in Assam reached to ` 8176862 lakh which
recorded a total growth of 14708 percent and an average growth of 2942 percent
pa during the period of study The amount of total loans availed to all-women
SHG in 2007-08 was ` 2416816 lakh to the 76090 SHGs and by an average
annual growth of 3708 percent pa in amount of loans outstanding and 1185
percent in SHGs the same reached to the balance of ` 6897173 lakh against
121177 SHG by March 2012 Which is the highest growth recorded in
microfinance service in the NER and Assam is holding the leading position in
microfinance service
38a Analysing Performance of Microfinance under SHG Models in Assam
The performance of microfinance under each of the SHG-bank linkage models (ie
SHG model-I amp II) and MFI-bank linkage model (ie SHG model-III) is presented
in table-36 and it is found that maximum amount of loans have been given to the
beneficiaries together under model-I amp II which was in average 7404 percent pa
of the grand total amount of loans and the same under model-III was only 2596
percent pa during the same period under study in Assam Again the total growth
made in five years in the total amount of loans is 12493 percent together under
model-I and II and that under model-III records a total growth of 25952 percent in
five years under study Thus in terms of amount of total loans SHG-bank linkage
models records more expansion and flow of micro-credit than MFI-bank linkage
model but in terms of growth the MFI-bank linkage model (ie model-III) records
better growth so microfinance service under model-III is considerably increasing
and spreading in Assam Again the total amount of loans provided together under
model-I and II in 2007-08 was 8354 percent which came down to 7605 percent by
March 2012 and the same under model-III was only 1646 percent in 2007-08 and
193
has increased to 2395 percent by March 2012 of the grand total amount of loans
given jointly under all the SHG models in Assam
Table-36 SHG Model-wise Performance of Microfinance in Assam from 2007-08 to 2011-12 (Amount ` in Lakh)
Particulars
Under SHG Model-I amp II Under SHG Model-III Grand Total of Loans under SHG
Models- I II amp III
Loan Disbursed
Loan Outstanding
Total Amount of Loan
(X)
Loan Disbursed
Loan Outstanding
Total Amount of Loan (Y)
2007-08 1021264 (1836)
1743364 (2198)
2764628 (2013)
227352 (3568)
317366 (4621)
544719 (6873) 3309347
2008-09 1362358 (3340)
2521286 (4462)
3883644 (4048)
415116 (8259)
556887 (7547)
971518 (7835) 4855162
2009-10 1478359 (851)
2867412 (1373)
4345083 (1188)
1097091 (16429)
1426836 (15622)
2524614 (15986) 6869698
2010-11 1588320 (744)
3408841 (1888)
4997161 (1501)
922130 (-1595)
1499297 (508)
2421427 (-409) 7418588
2011-12 1944458 (2242)
4273228 (2536)
6218504 (2444)
612447 (-3358)
1346729 (-1018)
1958358 (-1912) 8176862
Source Status of Microfinance in India NABARD amp Table-3 amp 4 above Note The model-wise allocation of microfinance in Assam as shown in table- 36 have been obtained by calculation with the help of all India average ratepercentage of flow of microfinance under each of the models as shown in table-34 above Because NABARD do not published such information in its reports state or region wise rather as a whole for the country Figures in the parenthesis are the growth rates
A diagrammatic presentation has also been made to analyse and to show the
relative performance of microfinance in Assam under each of the SHG models
From the diagram it can be seen that all the factors ie loans disbursed loans
outstanding and total amount of loans under the SHG models are in regular
increasing trend only with the little exception of decreasing trends in 2011-12
under model-III
Amount in Lakh
195
So SHG-bank linkage models remain dominant in providing microfinance service
to the people of Assam because the performance in all the factors as mentioned
above are higher than MFI-bank linkage model in absolute figures The amount of
loans disbursed together under model-I and II in 2007-08 was ` 1021264 lakh
which records a total growth of 9040 percent in five years with an average growth
of 1808 percent pa and reached to `1944458 lakh by March 2012 and the same
under model-III was ` 227352 lakh in 2007-08 which recorded a total growth of
16938 percent in five years period with an average growth of 3388 percent pa
and reached to `612447 lakh by March 2012 Again in case of balance of loans
outstanding with SHGs the amount of loans outstanding under model-I and II
together was amounted to `1743364 lakh and recorded total growth of 14511
percent in five years from 2007-08 to 2011-12 with an annual growth of 1902
percent pa and reached to ` 4273228 lakh by March 2012 The same under
model-III was `317366 lakh in 2007-08 and recorded a total growth of 32434
percent with an annual growth of 6487 percent in the period of study and reached
to ` 1346729 lakh by March 2012 Thus the progress and growth trend under
model-III are relatively better than together under model-I and II during the period
of study in Assam The details progress and growth pattern under each of the SHG
models are presented in following diagram to access the performance more clearly
196
Figure-310 Growth Trend of Microfinance under SHG Model- I ampII in Assam from 2007-08 to 2011-12
Source Table-36 So the growth trend as depicted in the above diagram was to the maximum level in
2008-09 and after that there was a sharp fall in growth of all the factors ie loan
disbursed loans outstanding and in total amount of loans in 2009-10 Again slow
progress is recorded which can be seen in the diagram from 2010-11 onwards
interestingly during the period of five years none of the factors have recorded any
negative growth together under SHG model- I amp II
Again to know the same under SHG model-III another diagrammatic presentation
has been made in figure-311 to access the progress and performance in terms of
growth rates of loans disbursed outstanding and total loans more clearly and it is
found that with steady increasing growth from 2007-08 in all the loans factor it
reached the highest level of growth in the year 2009-10 and after that there was a
sharp down-fall in the growth in all the factors of loans in 2010-11 and thereafter
further down-fall was recorded which can be observed from the diagram and
recorded negative growth in all the factors of loans from 2010 to 2012 leaving the
factor outstanding loans in 2010-11 which was slightly positive among the other
loan factors Thus huge fluctuations have been found in microfinance service under
0
10
20
30
40
50
2007-08 2008-09 2009-10 2010-11 2011-12
Growth Trend of Microfinance together under SHG Model-I amp II in Assam
Loan Disbursed Loan Outstanding Total Amount of Loan
197
model-III in Assam The incident which occurred in Andhra Pradesh in 2010 the
change of microfinance programme from SGSY to NRLM etc are some of the
reasons for such huge fluctuation under model-III in our country including Assam
decreasing interest of funding institutions and banks to MFIs for huge NPAs is also
another reason behind such fluctuations
39 Microfinance in Barpeta District of Assam
As informal source of finance the practice of microfinance was in Barpeta District
from ancient time in various forms and not exactly in the form what we called
-
credit
Growth Rate ()
199
Poor people used to borrow from the money lenders or from local capitalist mostly
by mortgaging their valuables like jewellery lands cattle etc as security for the
loan credit Most of them basically borrowed consumption type loans or loans in
case of acute needs of the family with very high rate of interest which even stood
more than the principal sum of money they borrowed (IIBF 2010) (Yunus 2007)
So history of microfinance in Barpeta District of Assam had no exceptions from
the rest of the country The cooperative system was an initiation in the field of
financial service for the poor in Assam and as well in Barpeta District and the role
of rural credit cooperative have some impact in the life of rural people though is
unable to bring such revolution among the rural people in the villages and of remote
areas
If we concentrate on the movement or start-up of microfinance services in the
district then it is after the introduction of SGSY programme the major poverty
alleviation programme of GOI in the 2000 but as reported by the district official
from 2004-05 the programme start progressing by forming SHGs in voluminous
manner and prior to that the progress was not impressive Considering the fact the
researcher considers the period of study from 2007-08 to 2011-12 ie for five
years and the progress and performance under the SHG models of microfinance of
the said period only have been shown in this study Again under the SHG models
three SHG-credit linkage models exist but in Barpeta district no such SHG were
found during the field survey who are directly formed and nurtured by the banks in
the district which comes under SHG model-I Limited bank branches works
overload limited banks staffs lack of interest of banks etc are some of the general
reasons for non-operational of model-I in the district As such the present study is
confine to the rest of the two models ie SHG Model-II and SHG Model-III in
Barpeta District of Assam The detailed information and data of microfinance
relating to the study about Barpeta District are presented in the following table
201
39a Magnitude and Progress of SHG in Barpeta District
Total SHGs linked to Banks and MFIs of the District up to the end of March 2012
has grown to 15 477 which was 11346 SHGs during 2007-08 thus the same
recorded a total growth of 3641 percent and an average growth of 728 percent pa
during the period of study in linking SHG together under SHG model-II and III
The least growth rate recorded during the period was 555 percent in the year 2011-
12 The position of all-women SHGs in Barpeta District is impressive and having
reached beyond the national average of 80 percent (NABARD 2012) Women
members occupied the lion share in microfinance in the district as all-women
SHGs in the District have increased to 15261 of the total SHGs up to March 2012
which is 9860 percent of total SHGs of the district The position of all-women
SHG in the district in 2007-08 was comparatively a bit poor as there was 10952
SHGs and that stood to 9653 percent of the total SHG of that year Thus total
growth of all- women SHGs in the district comes to 3934 percent in the five years
with an average growth of 787 percent pa A diagrammatic presentation has been
made with the help of total SHGs all-women SHGs and active SHGs in figure-
312 to show the magnitude and progress of SHGs in Barpeta District and it is
found that during the period of study SHGs in the district records slow progress
year after year almost at the same rate of growth in all the factors of SHG Of the
total SHG only 8392 SHGs are reported as Active30 SHG in the district and that is
only 5422 percent of the total SHG Thus near to half of the total SHGs in the
district are found defunct and those SHGs are no longer in existence or not
interested in SHG activities As reported by the intermediaries of microfinance in
the district most of those defunct SHGs were formed with the intention to take the
benefits of subsidy and while they found no more subsidies they stopped working
and their SHGs became inactive
30Active amp defunct SHGs here recorded as per the records and information of SHGs intermediaries of Barpeta District
202
A diagrammatic presentation has been made with help of total SHGs comparing
with all-women SHGs and active SHGs in the district during the period of study as
follows
Figure-312 Total All-Women and Active SHGs Positions in Barpeta District of Assam from 2007-08 to 2011-12
Source Table-37
So it can be observed from the above diagram that a steady incremental trend and
progress have been recorded during the period of study in the district in all the
factors of SHG and most importantly no abnormal fluctuation has been recorded
during the period of study
39b Growth Trend of SHG in Barpeta District
While SHGs growth position is considered the growth trend of the same have
gradually come down from 2007-08 to 2011-12 which can be viewed from the
following in figure-313 which is prepared taking the growth rates of the total all-
women and active SHGs of Barpeta District
0
20004000
6000
8000
1000012000
14000
16000
2007-08 2008-09 2009-10 2010-11 2011-12
SHGs of Barpeta District of Assam
Total Nos of SHG All Women SHG Total Active SHG
Growth Rate ()
204
It is clearly depicted in the above diagram that the SHG growth rate and position
have come down from 2009-10 onwards and those growth rates come even below
10 percent in the district the growth rates was maximum in 2008-09 as viewed in
the above diagram The position of active SHGs in terms of growth during the
period of study recorded a total growth of 3610 and an average growth of 722
percent pa in the study period But the growth rate of the same was very poor as
376 percent during 2011-12 Thus growth rate of active SHGs come down during
2011-12 even below the average rate This indicates the slow progress in the
formation and leaves question marks to the sustainability of SHGs in the district
owing to the poor management limited credit flow subsidy provision under SGSY
rural people participation in NREGA etc in the district has weaken the
performance
39c Magnitude of Loans Provided under SHG Models in Barpeta District
The total amount of loans availed to the beneficiaries or SHG members in Barpeta
District occupy only 936 percent of the total amount of loans availed in Assam
comprising of loans disbursed and loans outstanding during 2011-12 The share of
district in the state were same with little difference in the whole period of study as
it was 1362 percent in 2007-08 the highest score in period under study 952
percent in 2008-09 900 percent in 2009-10 and 929 percent in 2010-11 and those
with an average share of 1016 percent pa during the five years period under
study31 The amounts of loans disbursed to the SHGs in the district were `161569
lakh in 2007-08 which with an average incremental growth of 3039 percent pa
reached to `284031 lakh by March 2012 with the exception of negative growth
of 144 percent during 2011-12 during the period of study As regards amount of
loans outstanding with SHGs in the district the records reveal that it was ` 289089
31The share total amount of loans availed during the period under study are calculated taking the figures of total loans of Assam and of Barpeta District year after year from Table-36 amp 37 as mentioned above
205
lakh in 2007-08 and the amount of loans outstanding balance rose to `481183 lakh
which seems near to double by the end of March 2012 thus recognising
considerable growth in financing during the period of study All-women SHGs
constitute the lion share in the district and of the total amount of loans given to all-
women SHGs 8174 percent pa are provided only to those SHGs in the district
with little variation during the period of study A diagrammatic presentation has
been made with the help of amount of total loans loans to all-women SHG loans
disbursed and loans outstanding to have a clear picture about the magnitude of
microfinance in the district during the period of study which is as follows
Amount in lakh
207
It can be observed from the diagram that the position of loan factors is gradually
increasing maintaining the same sequence and rate year after year during the
period of study thus the loan factors are normally growing which is a healthy sign
of development of microfinance position and services in the district
39d Analyzing the Growth Trend of Loans under SHG Models in Barpeta
District
To know the actual picture of performance and progress of microfinance more
precisely in the district through its lending to the SHGs under the SHG models
effort were made to find out the growth pattern of loans availed to SHGs during the
period under study with the help of diagram as given in figure-315 It is depicted in
the same that considerable ups and downs have been recorded in the growth rates
among the loan factors during the period of study in the district and in some cases
negative rates of growth have also occurred
Growth Rate ()
209
The amount of loan disbursed to the SHGs during year 2011-12 was `284031
lakh and that recorded a total growth in disbursing loans to SHGs from 2007-08 to
2011-12 of 13364 percent with an average growth of 2673 percent pa during the
period of study But during 2011-12 the rate of growth of the same was negative to
144 percent in the district Again the amount of loan outstanding with the SHGs in
the district up to March 2012 was `481183 lakh which recorded a total growth
of 6645 percent and an average growth of 1329 percent pa during the period of
study The growth of loans outstanding was negative in 2008-09 and highest in
2009-10 to 4630 percent again fell in 2010-11 and increased a little in 2011-12
As all-women SHGs have occupied the lion share in the district and up to March
2012 the total amount of loans disbursed to those SHGs were ` 658773 lakh and
that recorded a total growth of 9109 percent with an average growth of 1822
percent pa during the period of study Of the total amount of loans maximum
amount of loans are availed to the all-women SHG in the district which in average
was 8174 percent pa during the period of study Further of the total amount of
loans availed (ie loans disbursed and loans outstanding) against the SHGs in the
district recorded a total growth of 8634 percent in five years with an average
growth of 1727 percent pa during the period of study
39e Analyzing SHG Model-wise performance of SHGs in Barpeta District
As among the three SHG-credit linkage models SHG Model-II and Model-III are
functional in the district and no such SHGs were found which are directly formed
under Model-I as such analysis of this part are confine to the models which are
operating and functional in the Barperta District Again details as regards SHG
models have already been mentioned in chapter-1 but for the sake of convenience a
brief outline of two functional models in the district are given below
210
SHG Model-II Under this model SHGs are formed and nurtured by the
intermediaries which includes GOs and NGOs and after a certain period and on
satisfactory performance in group management and group funds handling (ie
savings of members) they are being linked to banks for loans In Barpeta District
the task of formation nurturing linking etc of SHGs under SHG Model-II are
performed under the blocks by the Blocks official at the block and village level and
after their satisfaction and scrutiny about the performance of the group they send it
to the DRDA office for the approval and sanction of loans While assessing the
performance of SHGs (the Blocks official and sometimes persons from banks also
join in the process) for grading the SHGs on their performance on the basis of
some parameters where they mainly consider the following five points of SHG and
(ie five point formula) for grading
and promotion of SHG and includes
1 Weekly Meeting
2 Weekly Savings
3 Internal Credit
4 Recovery of Internal Credit
5 Records keeping
On satisfactory performance evaluation the list of SHGs are sent to DRDA for the
sanction of loan and DRDA may call some groups for talking if they feel the need
and after their needful verification they send the list of SHGs to the banks and a
copy to the respective blocks for record keeping and the groups are availed loans
through banks thus the groups are being linked with bank branches
SHG Model-III Under this model some NGOs and MFIs as intermediaries avail
bulk amount of loan from various funding institutionsbanks for on lending to the
groups The intermediaries take care of the groups in all respect and directly finance
the groups The groups in return have to follow the instruction of those
211
intermediaries and have to repay the loan as per the time and size of installment
fixed by them In Barpeta District ASOMI Bandhan RGVN are the leading MFIs
dealing with SHGs to provide micro-credit under this model The selection
procedure promotion criteria etc of SHG depends upon the intermediary which
slightly varies among the service providing intermediaries but the basic objectives
remain same
A detailed SHG model-wise break-up of SHGs in the district are given in the
following table
213
If we consider the model-wise SHG formation performance in the district more
numbers of SHG are being formed under model-II than model-III and that in terms
of ratio which was 1010 1 in 2007-08 and that has improved a little towards
model-III and in 2011-12 the ratio of SHG formation stands at 8761 under
model-II to III An analytical diagrammatic presentation has been made to show the
performance in the formation of SHGs under each of the models as follow
215
From the above it can be easily understood that more SHGs were formed under
SHG model-II in comparison to the model-III but in both the models the trend of
formation of SHGs are common during the period The quantum of all-women
SHG formed under each model is high and different but their trends of progress
under each of the model are alike But in the quality assessment of SHG under
each model the half of SHGs formed under model-II have gone defunct as per their
records and those SHGs are not in touch with the intermediaries and the same in
case of model-III is very efficient and only a meagre percentage of SHGs is
reported as defunct in the district Thus SHGs formed under model-III is well
managed by those intermediaries and more sustainable in comparison to model-II
under study To have precise outcome on the issue of quality and sustainability of
SHGs under each of models a diagrammatic presentation has been made as
follows
216
Figure-317 SHG Model-wise Quality and Sustainability Position of SHGs in terms of Active and Defunct SHGs in Barpeta District
Source Table-38
In year-wise comparison of the active SHGs under each of the SHG models it is
clear that SHGs formed and managed under model-III are more active and
sustainable and that in an average is 9126 percent pa SHGs under this model are
found more active during the period of study in the district and that in case of
model-II is only 5164 percent pa in average during the same period of study in the
district Thus an average gap of 3962 percent pa or SHG model-II is lagging
behind by the same percentage from model-III in the sustainability of SHG during
the period of study
39f Growth Trend of SHGs under SHG Model-II in Barpeta District
The growth trend and position of the SHGs formed under model-II in the district
taking the growth factors of total SHGs formed total all-women SHGs and total
active SHGs the following diagrammatic presentation has been made in figure-
318
2007-08 2008-09 2009-10 2010-11 2011-12
5296 5318 5128 509 4987
8767 8994 9181 9455 9231
Comperative Quality amp Sustainability Position of SHGs in Barpeta District
Active SHGs under Model-II Active SHGs under Model-III
Growth Rate ()
218
The diagram clearly indicates that the growth trend in all the factors are gradually
coming down from 2007-08 to 2011-12 and more importantly the trend line of
active SHG is under all the trend lines presented in the diagram which is very
important to be considered and more important line among all the trend lines
presented in the diagram Thus positions of SHG under model-II are gradually
deteriorating and very poor during 2011-12 in the district and during the period of
study
39g Growth Trend of SHGs under SHG Model-III in Barpeta District
The growth pattern of SHGs in the district under model-III is shown in the figure-
319 and it is clearly understood from the same that the growth was highest during
2008-09 in the periods of study and after that there was sharp fall in the growth
rates in all the factors of SHGs growth rates under consideration but from 2010-11
to 2011-12 a slow progressive growth has been noticed in the diagram which is a
good sign
Growth Rate ()
220
Again the growth rate and trend of active SHG is above all the growth lines in the
figure which is found just reverse under model-II as mentioned earlier Thus from
the two diagrammatic presentations it is clear that by the end of the period under
study all the growth lines under model-II records downwards movement and the
same under model-III records upward movement or in progressive trend
39h Analysing SHG Model-wise Magnitude and Trend of Microfinance in
Barpeta District
The details of microfinance performance under each of the SHG models in the
district are presented in table-39 and it is found from the same that model-III has
performed well in terms of providing more amount of loans to the beneficiaries in
comparison to model-II if we consider the model-wise loaning performance ratio
as given in the table more amount of loans or microfinance has been availed under
model-III in all through the period of study and the average ratio of lending under
these two models comes to 0731 pa during the period of study The amount of
loan disbursed under model-II in 2007-08 was only ` 38685 lakh which at an
average annual growth of 2197 percent reached to `81181 lakh during 2011-12
and in case of loan outstanding with SHG in the district it was an amount of `
157351 lakh in 2007-08 which rose to the balance of loans outstanding to
`256484 lakh thus registered a total growth of 63 percent in period of study But
position of loans disbursed under model-III was ` 122884 lakh in 2007-08 which
with an average annual growth of 1301 percent reached to ` 202850 lakh by
March 2012 in the district including a negative growth of 176 percent in 2011-12
Again about the amount of loans outstanding with SHG in the district it was only
` 131773 lakh in 2007-08 which rose to ` 224699 lakh by March 2012 thus
registered a total growth of 7052 percent during the period of study
222
The all-women SHGs constitute the major share in the district thus an effort was
made to know the amount of loans provided to them and the total amount of loans
provided to those SHG under model-II was ` 144987 lakh in 2007-08 which by
registering an average growth of 2033 percent pa reached to ` 271696 lakh by
March 2012 The same under model-III was ` 199793 lakh in 2007-08 rose with
an average growth of 1818 percent pa and reached to ` 298333 lakh by March
2012 Further the women SHGs are given in an average 7579 percent of the total
amount loans under model-II during the whole period of study and the same under
model-III was in an average of 8589 percent during same period of study in the
district Thus under model-III 1010 percent more amount of loans had been
extended to the all-women SHGs in the district in all through the period of study
Again total amount of loans provided under model-II in the district was ` 196036
lakh in 2007-08 which increased with an average growth rate of 1524 percent pa
and reached to ` 252362 lakh in 2011-12 and the same under model-III was `
254657 lakh in 2007-08 which rose to ` 259989 lakh by recording an average
growth of 1306 percent pa during the entire period of study Surprisingly despite
having such huge volume of SHG under model-II (ie 9099 of the total SHG in
the district) in the district only 4350 percent of the grand total amounts of loans
were provided to SHGs in 2007-08 and that under model-III was 5650 percent to
only 901 percent of the total SHGs of the said period This huge disparity signifies
that the SHGs under model-III were availed more amount of loans and SHGs under
model-II were under-served or extended poor amounts of loan Again if we
consider the same for the year 2011-12 an amount of ` 252362 lakh which is
4227 percent of the grand total amount of loans were extended to the beneficiaries
under model-II in the district and under model-III the same was ` 259989 lakh
which is 5773 percent of the grand total amount of loans provided in the same
period of study The magnitude and trend of microfinance in the district is also
presented with a diagram in figure-320 to understand the scenario more clearly
Amount in Lakh
224
Simply it can be understand from the diagram that in all the factors of loans to the
SHGs performance under model-III is more lucrative and provided more amounts
year after year thus model-III holds better position in the magnitude of loans in
Barpeta district of Assam
39i Analyzing the Comparative Growth Trend of Microfinance under SHG
Model-II and III in Barpeta District
The growth trend of microfinance under each of the SHG models under study
behave and move in reverse way as under model-II the growth trends fluctuate
considerably during the period of study in the district but the growth trends under
model-III slowly progressed from 2007-08 to 2009-10 and thereafter gradually fell
up to the end of the period under study But progress under model-III was almost
steady in comparison to model-II in the same period of study The Comparative
growth position can better be understood from the following diagram which is
prepared taking all the growth rates of loans in Barpeta District in the following
diagram
Growth Rate ()
226
So the growth trends under model-II were negative except in loan disbursed in
2008-09 which reached to the top level in 2009-10 and again fell down in 2010-10
and in 2011-12 consecutively But those under model-III experienced almost a flat
and steady growth during the period of study The growth of loans disbursed under
model-II was 1920 percent in 2007-08 which maintained an average incremental
growth of 2118 percent all through the period but registered a negative growth of
064 percent in 2011-12 The same under model-III was 1833 percent in 2007-08
and recorded an average incremental growth of 1467 percent pa during the period
of study but that stands to 176 percent negative growth in 2011-12 In the case of
growth rate of loans outstanding with the SHGs in the district it was only 1295
percent in 2007-08 which reached to 2270 percent in 2011-12 registering two
negative growths of 2141 and 250 percent respectively in 2008-09 and 2010-11
But under model-III the same was only 432 percent in 2007-08 which reached to
1715 percent in 2011-12 by registering an average growth of 1241 percent pa all
through the period of study and no negative growth had been registered in the
period The growth pattern of loans to all-women SHG is a strong factor in the
district because more than 80 percent SHGs fall under this category and in 2007-
08 it registered a growth of 1555 percent and that also maintained an average
growth of 2033 percent pa all through the period under study and stands at 1507
percent in 2011-12 overcoming a negative growth of 2027 percent in 2008-09
under model-II and the same under model-III was 1840 percent in 2007-08 and
registered an average growth of 1818 percent pa during the period of study and
reached to 1150 percent in 2001-12
Further Intermediaries-wise SHGs Position and Trend with their loans position
during the period of study in Barpeta District under Model-II and III are presented
with the help of following two diagrams
Nos of SHG
Amount in Lakh
229
The outcomes of the above diagrams is very clear as maximum SHGs are formed
under model-II by block intermediaries as shown in figure-322 but availed less
amount of loans to those few percentage of SHGs On the contrary very few
percentage of SHGs are formed under Model-III by NGOsMFIs in the district but
maximum amount of loans are availed towards those SHGs those groups are
getting more loans or frequent loans in comparison to the SHGs formed under
model-II in the district during the period of study that are shown in figure-323
310 Analyzing Comparative Growth Position of SHGs in India Assam and in
Barpeta District under the SHG Models
After going through the positions of microfinance in India Assam and in Barpeta
district as mentioned above where mixed responses are found and to show the
relative position more precisely efforts were made to have comparative study with
the core factor of performance in terms of growth trends of SHGs right from
national level to the district level and that will depict the picture more clearly As
such their performances have been presented with the help of following two
diagrams as follows in figure-324 and figure-325
Growth Rate ()
Growth Rate ()
232
In both the figures given above it is clearly depicted that there is a sharp fall in the
performance of SHGs and loans extended to them from 2009-10 onwards in all
sector of microfinance ie in India Assam and as well in Barpeta District of
Assam The position was favourable from 2007-08 to the 2009-10 as highest
growth rates were recorded during that period as shown in the figures Such drastic
down-fall in both in the growth of SHGs and in microfinance (ie in extending
total amount of loans) during the period had weakened the service of microfinance
spreads and base in the country The incidents that had occurred in Andhra Pradesh
where 30 farmers had committed suicide within a span of 45 days in 2010 after a
few MFIs used coercive recovery tactics (Patra 2011) is a strong reason for such
adverse scenario as after such incidents many financing banks and institutions
stopped financing to MFIs The subsidy provision under SGSY programme also
weakened the base of a group of SHGs which were formed only to take the
benefits of subsidy and not SHGs as a means of self-employment provisions is also
added to the reason of such downfall in the performance of microfinance sector in
our country Again the change of programme from SGSY now to newly introduced
NRLM also concentrate a lot in the change of the functional structures power and
management and also weakens the rapid growth and speeds of microfinance sector
in the country during the period under study
311 Conclusion
During the period under study the performance under microfinance service has
been moved in two way dimensions as in the first half of the period ie from
2007-08 to 2009-10 the performance was in progressive trend in India Assam and
as well in Barpeta district of Assam but in the later part of the period of study the
performance and progress experienced downfall While we consider the magnitude
of microfinance services in Assam in terms of SHG with saving in banks it is
found that only 347 percent SHGs belong to Assam and same is 1879 percent
233
highest in the country in case of Andhra Pradesh by the end of March 2012 The
relative position of Assam in NER is good as Assam occupied 7542 percent of the
total SHGs of the region and that with the amount of savings of `984598 lakh
which stands at 6456 percent of the total amount of savings of NER Thus Assam
is in leading position in the region followed by Tripura and then Meghalaya
(NABARD 2012) In case of amount of loans disbursed to SHGs in 2011-12
Assam is having only 113 percent of the total amount of loans disbursed in India
and among NER it is 4154 percent followed by Tripura and Manipur
On SHG model-wise analysis it is found that SHG-bank linkage models (together
SHG Model-I amp II) remain in dominant position in terms of volume of SHGs and
absolute amount of loans availed to SHGs in the country than MFI-bank linkage
model (ie SHG Model-III) during the period of study But in Barpeta District of
Assam some variation in the model-wise performance has been found during the
period of study as model-II is found popular and covered more number of members
and is able to form more numbers of SHGs in comparison to that of under model-
III As of the total SHGs in the district 8975 percent are formed under model-II
and only1025 percent SHGs are under model-III in 2011-12 Again total amount
of loans given to SHGs under model-II in the same period was ` 337665 lakh
which was 4413 percent of the grand total amount of loans under both the models
and the rest 5587 percent were given to only 1025 percent of the total SHGs in
the district Thus SHGs under model-III are given more amount of loans or
frequent loans in comparison to the SHG under model-II in the district during the
period of study In terms of growth factors under each of these two models growth
trends under model-II both in case of SHG and in amount of loans to them more
fluctuations or ups and downs were recorded during the period of study and by the
end of the period particularly in 2010-11 and 2011-12 the growth trends were
down-falling in the district But the same under model-III were almost steady
during the period of study with a bit high in 2009-10 and a bit low in latter part of
the period of study particularly in 2010-11 to 2011-12 in the district Again in
234
terms of sustainability of SHGs formed under each of the SHG models also varies
a lot The SHGs formed managed and financed under model-II are half in an
average of the total are defunct SHGs and only 50 percent of them survive or are
functional in the district but the same under model-III is found more than 91
percent as active and functional during the period of study in the district Thus
over-all performance of SHGs under SHG model-III in the district during the period
of study is better than SHGs under model-II in respect of service quantum of
loans growth trends and sustainability etc
References
(2006) Statistical Hand Book of Assam Guwahati Directorate of Economics and
Statistics Government of Assam
Asif M (2011 November) Role of NGOs in India YOJANA 55 pp 8-10
Bandhan (nd) Bandhan Hope for the Poor Product Information Broucher of Bandhan
West Bengal India Bandhan
Baruah P B (2012) Impact of Microfinance on Poverty A Study of Twenty Self-Help
Groups in Nalbari District Assam Journal of Rural Development 31(2) 223-234
Bharali S (2010 July 18) An Institute Promotion of Secure Sustainable Livelihood
ASOMI Barta 6(6)
Borbora S amp Sarma G K (nd) Microfinance Institutions Sustainability and Outreach
Retrieved May 2 2014 from httpwwwwbiconprocom314-borborapdf
CGAP (nd) Consultative Group to Assist the Poor Retrieved from wwwcgaporg
Chatterjee N amp Dar M A (2011 November) Role of NGOs in Rural Development
YOJANA 55 pp 17-20
Chief Ministers Micro Finance Scheme-Assam Financial Corporation (CMMFS) Khudra
Reen (nd) Retrieved May 1 2014 from httpwwwafconlinegovin
documentbroucherpdf
Chief Ministers Micro Finance Schemes- Assam Financial Corporation (nd) Retrieved
May 1 2014 from httpwwwafconlinegovinpdfmfnbbrochure Englishpdf
Das D (nd) Informal Microfinance in Assam Empirical Evidence from Nalbari and
Baksa Districts Retrieved November 2013 from IFMR Centre for Microfinance
235
Research httpwwwifmrleadorgcmfwp-contentuploadsattachmentscsy1685
informal20MF20in20Assampdf
Das K (2012 January- March) Financial Inclusion-A Gateway to Sustainable
Development for the Impoverished Journal of Rural Development NIRD 31(1)
115-128
Das R L Dutta D N Kakoti P amp Deka S N (2011) Rural and Microfinance
Guwahati BLJ Publication
Deb B (2012) Microfinance and Poverty Alleviation A Case Study on Rgvn-Csp Indian
Journal of Applied Research 71-74
Desai V (2005) NGOs Gender Mainstreaming and Urban Communities in Mumbai
Gender and Development 13(2) 90-98
Devi M (2012 January 20) Rural Industrialisation for Development The Assam Tribune
Guwahati p 6
Dhar P K (2009) The Economy of Assam Including Economy of Narth East India New
Delhi Kalyani Publishers
Dutta J amp Upadhaya M (2013 August 23) Green Microfinance for Eco-friendly
Development The Assam Tribune (English Daily News Paper) p 6
Economic Survey Assam 2011-12 (nd) Retrieved April 30 2014 from
httpwwwecostatassamnicinads_economic20survey-2011-12pdf
Executive Summary Part-I An Overview of State Focus Paper 2006-07 (nd) Retrieved
April 30 2014 from httpwwwnabardorgpdfAssam20EXECUTIVE
20SUMMARYpdf
Gadiapannivar R D (nd) IFMR Centre for Microfinance Retrieved November 2013
from wwwifmracincmf httpwwwifmrleadorgcmf
Ghosh M (2012 July-Sept) Microfinance and Rural Poverty in India SHG-Bank Linkage
Programme Journal of Rural Development 31(3) 347-363
Gogoi P (2013) Economic Empowerment of Rural Women Through Income Generating
Activities In B M Doley (Ed) Women in Rural Development (Seminar Volume)
(pp 36-45) Guwahati Publication Board Silapathar College Dhemaji Assam
IIBF (2010) Rural Banking New Delhi Indian Institute of Banking amp Finance by
Macmillion
Khanka S S (2010) Microfinance in India From Evolution to Revolution In J U
Ahmed D Bhagat amp G Singaiah (Eds) Microfinance in India Issues and
Challenges (pp 3-14) Guwahati DVs Publications
236
Lalitha N (2011 February) Sustainable Management of Local Resources YOJANA 55
pp 32-35
Mathaw J amp Verghese J (2011 November) Non Governmental Organisation in India
YOJANA 55 pp 12-14
NABARD (2012) Status of Microfinance in India 2011-12 Mumbai NABARD
NRLM (nd) NRLM Procurement Manual- Ministry of Rural Development Retrieved
May 1 2014 from httpruralnicinsitesdownloadslatestNRLM
20Procurement20Manualpdf
Patra D R (2011 December) Death of Microfinance in India BFM Banking Finance
Markets A Planman Financial-IIPM Think Tank Publication 1(10) pp 28-33
RBI (nd) Quarterly Statistics on Deposits and Credit of Schedule Commercial Banks
March 2007 to March 2011 Mumbai Reserve Bank of India
Roy A (nd) Microfinance and Rural Development in the North East India Retrieved
December 2013 from httpwwwpbrcoinBrochure0006pdf
Sarmah V (2010) Microfinance Vission 2015 Northeast Region India Retrieved July
2013 from httpwwwaccessdevorgdownloadsmicrofinance_vision_2015pdf
SGSY (2010) Swarnjayanti Gram Swarozgar Yojana (SGSY) Retrieved May 1 2014
from httpwwwcsjpgoaorgwp-contentuploads201010sjgsypdf
Sharma A K (2011 December) Micro Finance in the North East YOJANA pp 8-10
Shodhganga (nd) Chapter-3 Microfinance Trends Problems and Prospects Retrieved
June 2013 from httpshodhgangainflibnetacinbitstream10603303111
n_chapter203pdf
Srinivasan N (2009) Microfinance India State of the Sector Report 2009 Delhi
ACCESS Sage
Sundaram I S (2007) Microfinance in India Delhi BR Publishing Corporation
Tribune A (2007 May 7) Self-help Groups and Rural Development The Assam Tribune
Guwahati p 6
Vikash (2008 March) About the Issue Microfinance Focus II(IV) 3
Yunus M amp Jolis A (2007) Banker To The Poor The Story of the Grameen Bank New
Delhi Penguin Books
----0----

Growth Rate ()
190
The relative growth positions was highest in 2008-09 during the period of study
and surprisingly the growth rate of all other factors as shown in the above diagram
come down to negative level in 2011-12 thus a huge fluctuation has been noticed
during the period Another important fact came-out of the diagram is that from
2009-10 onwards the growth rates are considerably declining and stands to negative
growth by the end of the period of the study
As regards balance of loans outstanding with SHGs it reveals that in 2007-08 the
amount of loans outstanding was only ` 2422437 lakh as against 75405 SHGs
and with an average growth of 2676 percent pa in the amount of loans
outstanding and 1124 percent pa in SHGs with loans outstanding the amount of
loans outstanding reached to ` 6302164 lakh as against 117809 SHGs by March
2012 There is no negative growth that has recorded in any year during the period
of study thus recognising the expansion of microfinance service year after year
The growth rates of SHGs in loans outstanding and amount of loan outstanding
with all-women SHGs are also impressive and records the growth more than 80
percent in both the respect A diagrammatic presentation has been made as under to
analyse the relative position of the factors with loans outstanding in Assam during
the period of study
Growth Rate ()
192
Thus total amount of loan provided (ie loan disbursed and loans outstanding) up
to March 2012 to 145821 SHGs in Assam reached to ` 8176862 lakh which
recorded a total growth of 14708 percent and an average growth of 2942 percent
pa during the period of study The amount of total loans availed to all-women
SHG in 2007-08 was ` 2416816 lakh to the 76090 SHGs and by an average
annual growth of 3708 percent pa in amount of loans outstanding and 1185
percent in SHGs the same reached to the balance of ` 6897173 lakh against
121177 SHG by March 2012 Which is the highest growth recorded in
microfinance service in the NER and Assam is holding the leading position in
microfinance service
38a Analysing Performance of Microfinance under SHG Models in Assam
The performance of microfinance under each of the SHG-bank linkage models (ie
SHG model-I amp II) and MFI-bank linkage model (ie SHG model-III) is presented
in table-36 and it is found that maximum amount of loans have been given to the
beneficiaries together under model-I amp II which was in average 7404 percent pa
of the grand total amount of loans and the same under model-III was only 2596
percent pa during the same period under study in Assam Again the total growth
made in five years in the total amount of loans is 12493 percent together under
model-I and II and that under model-III records a total growth of 25952 percent in
five years under study Thus in terms of amount of total loans SHG-bank linkage
models records more expansion and flow of micro-credit than MFI-bank linkage
model but in terms of growth the MFI-bank linkage model (ie model-III) records
better growth so microfinance service under model-III is considerably increasing
and spreading in Assam Again the total amount of loans provided together under
model-I and II in 2007-08 was 8354 percent which came down to 7605 percent by
March 2012 and the same under model-III was only 1646 percent in 2007-08 and
193
has increased to 2395 percent by March 2012 of the grand total amount of loans
given jointly under all the SHG models in Assam
Table-36 SHG Model-wise Performance of Microfinance in Assam from 2007-08 to 2011-12 (Amount ` in Lakh)
Particulars
Under SHG Model-I amp II Under SHG Model-III Grand Total of Loans under SHG
Models- I II amp III
Loan Disbursed
Loan Outstanding
Total Amount of Loan
(X)
Loan Disbursed
Loan Outstanding
Total Amount of Loan (Y)
2007-08 1021264 (1836)
1743364 (2198)
2764628 (2013)
227352 (3568)
317366 (4621)
544719 (6873) 3309347
2008-09 1362358 (3340)
2521286 (4462)
3883644 (4048)
415116 (8259)
556887 (7547)
971518 (7835) 4855162
2009-10 1478359 (851)
2867412 (1373)
4345083 (1188)
1097091 (16429)
1426836 (15622)
2524614 (15986) 6869698
2010-11 1588320 (744)
3408841 (1888)
4997161 (1501)
922130 (-1595)
1499297 (508)
2421427 (-409) 7418588
2011-12 1944458 (2242)
4273228 (2536)
6218504 (2444)
612447 (-3358)
1346729 (-1018)
1958358 (-1912) 8176862
Source Status of Microfinance in India NABARD amp Table-3 amp 4 above Note The model-wise allocation of microfinance in Assam as shown in table- 36 have been obtained by calculation with the help of all India average ratepercentage of flow of microfinance under each of the models as shown in table-34 above Because NABARD do not published such information in its reports state or region wise rather as a whole for the country Figures in the parenthesis are the growth rates
A diagrammatic presentation has also been made to analyse and to show the
relative performance of microfinance in Assam under each of the SHG models
From the diagram it can be seen that all the factors ie loans disbursed loans
outstanding and total amount of loans under the SHG models are in regular
increasing trend only with the little exception of decreasing trends in 2011-12
under model-III
Amount in Lakh
195
So SHG-bank linkage models remain dominant in providing microfinance service
to the people of Assam because the performance in all the factors as mentioned
above are higher than MFI-bank linkage model in absolute figures The amount of
loans disbursed together under model-I and II in 2007-08 was ` 1021264 lakh
which records a total growth of 9040 percent in five years with an average growth
of 1808 percent pa and reached to `1944458 lakh by March 2012 and the same
under model-III was ` 227352 lakh in 2007-08 which recorded a total growth of
16938 percent in five years period with an average growth of 3388 percent pa
and reached to `612447 lakh by March 2012 Again in case of balance of loans
outstanding with SHGs the amount of loans outstanding under model-I and II
together was amounted to `1743364 lakh and recorded total growth of 14511
percent in five years from 2007-08 to 2011-12 with an annual growth of 1902
percent pa and reached to ` 4273228 lakh by March 2012 The same under
model-III was `317366 lakh in 2007-08 and recorded a total growth of 32434
percent with an annual growth of 6487 percent in the period of study and reached
to ` 1346729 lakh by March 2012 Thus the progress and growth trend under
model-III are relatively better than together under model-I and II during the period
of study in Assam The details progress and growth pattern under each of the SHG
models are presented in following diagram to access the performance more clearly
196
Figure-310 Growth Trend of Microfinance under SHG Model- I ampII in Assam from 2007-08 to 2011-12
Source Table-36 So the growth trend as depicted in the above diagram was to the maximum level in
2008-09 and after that there was a sharp fall in growth of all the factors ie loan
disbursed loans outstanding and in total amount of loans in 2009-10 Again slow
progress is recorded which can be seen in the diagram from 2010-11 onwards
interestingly during the period of five years none of the factors have recorded any
negative growth together under SHG model- I amp II
Again to know the same under SHG model-III another diagrammatic presentation
has been made in figure-311 to access the progress and performance in terms of
growth rates of loans disbursed outstanding and total loans more clearly and it is
found that with steady increasing growth from 2007-08 in all the loans factor it
reached the highest level of growth in the year 2009-10 and after that there was a
sharp down-fall in the growth in all the factors of loans in 2010-11 and thereafter
further down-fall was recorded which can be observed from the diagram and
recorded negative growth in all the factors of loans from 2010 to 2012 leaving the
factor outstanding loans in 2010-11 which was slightly positive among the other
loan factors Thus huge fluctuations have been found in microfinance service under
0
10
20
30
40
50
2007-08 2008-09 2009-10 2010-11 2011-12
Growth Trend of Microfinance together under SHG Model-I amp II in Assam
Loan Disbursed Loan Outstanding Total Amount of Loan
197
model-III in Assam The incident which occurred in Andhra Pradesh in 2010 the
change of microfinance programme from SGSY to NRLM etc are some of the
reasons for such huge fluctuation under model-III in our country including Assam
decreasing interest of funding institutions and banks to MFIs for huge NPAs is also
another reason behind such fluctuations
39 Microfinance in Barpeta District of Assam
As informal source of finance the practice of microfinance was in Barpeta District
from ancient time in various forms and not exactly in the form what we called
-
credit
Growth Rate ()
199
Poor people used to borrow from the money lenders or from local capitalist mostly
by mortgaging their valuables like jewellery lands cattle etc as security for the
loan credit Most of them basically borrowed consumption type loans or loans in
case of acute needs of the family with very high rate of interest which even stood
more than the principal sum of money they borrowed (IIBF 2010) (Yunus 2007)
So history of microfinance in Barpeta District of Assam had no exceptions from
the rest of the country The cooperative system was an initiation in the field of
financial service for the poor in Assam and as well in Barpeta District and the role
of rural credit cooperative have some impact in the life of rural people though is
unable to bring such revolution among the rural people in the villages and of remote
areas
If we concentrate on the movement or start-up of microfinance services in the
district then it is after the introduction of SGSY programme the major poverty
alleviation programme of GOI in the 2000 but as reported by the district official
from 2004-05 the programme start progressing by forming SHGs in voluminous
manner and prior to that the progress was not impressive Considering the fact the
researcher considers the period of study from 2007-08 to 2011-12 ie for five
years and the progress and performance under the SHG models of microfinance of
the said period only have been shown in this study Again under the SHG models
three SHG-credit linkage models exist but in Barpeta district no such SHG were
found during the field survey who are directly formed and nurtured by the banks in
the district which comes under SHG model-I Limited bank branches works
overload limited banks staffs lack of interest of banks etc are some of the general
reasons for non-operational of model-I in the district As such the present study is
confine to the rest of the two models ie SHG Model-II and SHG Model-III in
Barpeta District of Assam The detailed information and data of microfinance
relating to the study about Barpeta District are presented in the following table
201
39a Magnitude and Progress of SHG in Barpeta District
Total SHGs linked to Banks and MFIs of the District up to the end of March 2012
has grown to 15 477 which was 11346 SHGs during 2007-08 thus the same
recorded a total growth of 3641 percent and an average growth of 728 percent pa
during the period of study in linking SHG together under SHG model-II and III
The least growth rate recorded during the period was 555 percent in the year 2011-
12 The position of all-women SHGs in Barpeta District is impressive and having
reached beyond the national average of 80 percent (NABARD 2012) Women
members occupied the lion share in microfinance in the district as all-women
SHGs in the District have increased to 15261 of the total SHGs up to March 2012
which is 9860 percent of total SHGs of the district The position of all-women
SHG in the district in 2007-08 was comparatively a bit poor as there was 10952
SHGs and that stood to 9653 percent of the total SHG of that year Thus total
growth of all- women SHGs in the district comes to 3934 percent in the five years
with an average growth of 787 percent pa A diagrammatic presentation has been
made with the help of total SHGs all-women SHGs and active SHGs in figure-
312 to show the magnitude and progress of SHGs in Barpeta District and it is
found that during the period of study SHGs in the district records slow progress
year after year almost at the same rate of growth in all the factors of SHG Of the
total SHG only 8392 SHGs are reported as Active30 SHG in the district and that is
only 5422 percent of the total SHG Thus near to half of the total SHGs in the
district are found defunct and those SHGs are no longer in existence or not
interested in SHG activities As reported by the intermediaries of microfinance in
the district most of those defunct SHGs were formed with the intention to take the
benefits of subsidy and while they found no more subsidies they stopped working
and their SHGs became inactive
30Active amp defunct SHGs here recorded as per the records and information of SHGs intermediaries of Barpeta District
202
A diagrammatic presentation has been made with help of total SHGs comparing
with all-women SHGs and active SHGs in the district during the period of study as
follows
Figure-312 Total All-Women and Active SHGs Positions in Barpeta District of Assam from 2007-08 to 2011-12
Source Table-37
So it can be observed from the above diagram that a steady incremental trend and
progress have been recorded during the period of study in the district in all the
factors of SHG and most importantly no abnormal fluctuation has been recorded
during the period of study
39b Growth Trend of SHG in Barpeta District
While SHGs growth position is considered the growth trend of the same have
gradually come down from 2007-08 to 2011-12 which can be viewed from the
following in figure-313 which is prepared taking the growth rates of the total all-
women and active SHGs of Barpeta District
0
20004000
6000
8000
1000012000
14000
16000
2007-08 2008-09 2009-10 2010-11 2011-12
SHGs of Barpeta District of Assam
Total Nos of SHG All Women SHG Total Active SHG
Growth Rate ()
204
It is clearly depicted in the above diagram that the SHG growth rate and position
have come down from 2009-10 onwards and those growth rates come even below
10 percent in the district the growth rates was maximum in 2008-09 as viewed in
the above diagram The position of active SHGs in terms of growth during the
period of study recorded a total growth of 3610 and an average growth of 722
percent pa in the study period But the growth rate of the same was very poor as
376 percent during 2011-12 Thus growth rate of active SHGs come down during
2011-12 even below the average rate This indicates the slow progress in the
formation and leaves question marks to the sustainability of SHGs in the district
owing to the poor management limited credit flow subsidy provision under SGSY
rural people participation in NREGA etc in the district has weaken the
performance
39c Magnitude of Loans Provided under SHG Models in Barpeta District
The total amount of loans availed to the beneficiaries or SHG members in Barpeta
District occupy only 936 percent of the total amount of loans availed in Assam
comprising of loans disbursed and loans outstanding during 2011-12 The share of
district in the state were same with little difference in the whole period of study as
it was 1362 percent in 2007-08 the highest score in period under study 952
percent in 2008-09 900 percent in 2009-10 and 929 percent in 2010-11 and those
with an average share of 1016 percent pa during the five years period under
study31 The amounts of loans disbursed to the SHGs in the district were `161569
lakh in 2007-08 which with an average incremental growth of 3039 percent pa
reached to `284031 lakh by March 2012 with the exception of negative growth
of 144 percent during 2011-12 during the period of study As regards amount of
loans outstanding with SHGs in the district the records reveal that it was ` 289089
31The share total amount of loans availed during the period under study are calculated taking the figures of total loans of Assam and of Barpeta District year after year from Table-36 amp 37 as mentioned above
205
lakh in 2007-08 and the amount of loans outstanding balance rose to `481183 lakh
which seems near to double by the end of March 2012 thus recognising
considerable growth in financing during the period of study All-women SHGs
constitute the lion share in the district and of the total amount of loans given to all-
women SHGs 8174 percent pa are provided only to those SHGs in the district
with little variation during the period of study A diagrammatic presentation has
been made with the help of amount of total loans loans to all-women SHG loans
disbursed and loans outstanding to have a clear picture about the magnitude of
microfinance in the district during the period of study which is as follows
Amount in lakh
207
It can be observed from the diagram that the position of loan factors is gradually
increasing maintaining the same sequence and rate year after year during the
period of study thus the loan factors are normally growing which is a healthy sign
of development of microfinance position and services in the district
39d Analyzing the Growth Trend of Loans under SHG Models in Barpeta
District
To know the actual picture of performance and progress of microfinance more
precisely in the district through its lending to the SHGs under the SHG models
effort were made to find out the growth pattern of loans availed to SHGs during the
period under study with the help of diagram as given in figure-315 It is depicted in
the same that considerable ups and downs have been recorded in the growth rates
among the loan factors during the period of study in the district and in some cases
negative rates of growth have also occurred
Growth Rate ()
209
The amount of loan disbursed to the SHGs during year 2011-12 was `284031
lakh and that recorded a total growth in disbursing loans to SHGs from 2007-08 to
2011-12 of 13364 percent with an average growth of 2673 percent pa during the
period of study But during 2011-12 the rate of growth of the same was negative to
144 percent in the district Again the amount of loan outstanding with the SHGs in
the district up to March 2012 was `481183 lakh which recorded a total growth
of 6645 percent and an average growth of 1329 percent pa during the period of
study The growth of loans outstanding was negative in 2008-09 and highest in
2009-10 to 4630 percent again fell in 2010-11 and increased a little in 2011-12
As all-women SHGs have occupied the lion share in the district and up to March
2012 the total amount of loans disbursed to those SHGs were ` 658773 lakh and
that recorded a total growth of 9109 percent with an average growth of 1822
percent pa during the period of study Of the total amount of loans maximum
amount of loans are availed to the all-women SHG in the district which in average
was 8174 percent pa during the period of study Further of the total amount of
loans availed (ie loans disbursed and loans outstanding) against the SHGs in the
district recorded a total growth of 8634 percent in five years with an average
growth of 1727 percent pa during the period of study
39e Analyzing SHG Model-wise performance of SHGs in Barpeta District
As among the three SHG-credit linkage models SHG Model-II and Model-III are
functional in the district and no such SHGs were found which are directly formed
under Model-I as such analysis of this part are confine to the models which are
operating and functional in the Barperta District Again details as regards SHG
models have already been mentioned in chapter-1 but for the sake of convenience a
brief outline of two functional models in the district are given below
210
SHG Model-II Under this model SHGs are formed and nurtured by the
intermediaries which includes GOs and NGOs and after a certain period and on
satisfactory performance in group management and group funds handling (ie
savings of members) they are being linked to banks for loans In Barpeta District
the task of formation nurturing linking etc of SHGs under SHG Model-II are
performed under the blocks by the Blocks official at the block and village level and
after their satisfaction and scrutiny about the performance of the group they send it
to the DRDA office for the approval and sanction of loans While assessing the
performance of SHGs (the Blocks official and sometimes persons from banks also
join in the process) for grading the SHGs on their performance on the basis of
some parameters where they mainly consider the following five points of SHG and
(ie five point formula) for grading
and promotion of SHG and includes
1 Weekly Meeting
2 Weekly Savings
3 Internal Credit
4 Recovery of Internal Credit
5 Records keeping
On satisfactory performance evaluation the list of SHGs are sent to DRDA for the
sanction of loan and DRDA may call some groups for talking if they feel the need
and after their needful verification they send the list of SHGs to the banks and a
copy to the respective blocks for record keeping and the groups are availed loans
through banks thus the groups are being linked with bank branches
SHG Model-III Under this model some NGOs and MFIs as intermediaries avail
bulk amount of loan from various funding institutionsbanks for on lending to the
groups The intermediaries take care of the groups in all respect and directly finance
the groups The groups in return have to follow the instruction of those
211
intermediaries and have to repay the loan as per the time and size of installment
fixed by them In Barpeta District ASOMI Bandhan RGVN are the leading MFIs
dealing with SHGs to provide micro-credit under this model The selection
procedure promotion criteria etc of SHG depends upon the intermediary which
slightly varies among the service providing intermediaries but the basic objectives
remain same
A detailed SHG model-wise break-up of SHGs in the district are given in the
following table
213
If we consider the model-wise SHG formation performance in the district more
numbers of SHG are being formed under model-II than model-III and that in terms
of ratio which was 1010 1 in 2007-08 and that has improved a little towards
model-III and in 2011-12 the ratio of SHG formation stands at 8761 under
model-II to III An analytical diagrammatic presentation has been made to show the
performance in the formation of SHGs under each of the models as follow
215
From the above it can be easily understood that more SHGs were formed under
SHG model-II in comparison to the model-III but in both the models the trend of
formation of SHGs are common during the period The quantum of all-women
SHG formed under each model is high and different but their trends of progress
under each of the model are alike But in the quality assessment of SHG under
each model the half of SHGs formed under model-II have gone defunct as per their
records and those SHGs are not in touch with the intermediaries and the same in
case of model-III is very efficient and only a meagre percentage of SHGs is
reported as defunct in the district Thus SHGs formed under model-III is well
managed by those intermediaries and more sustainable in comparison to model-II
under study To have precise outcome on the issue of quality and sustainability of
SHGs under each of models a diagrammatic presentation has been made as
follows
216
Figure-317 SHG Model-wise Quality and Sustainability Position of SHGs in terms of Active and Defunct SHGs in Barpeta District
Source Table-38
In year-wise comparison of the active SHGs under each of the SHG models it is
clear that SHGs formed and managed under model-III are more active and
sustainable and that in an average is 9126 percent pa SHGs under this model are
found more active during the period of study in the district and that in case of
model-II is only 5164 percent pa in average during the same period of study in the
district Thus an average gap of 3962 percent pa or SHG model-II is lagging
behind by the same percentage from model-III in the sustainability of SHG during
the period of study
39f Growth Trend of SHGs under SHG Model-II in Barpeta District
The growth trend and position of the SHGs formed under model-II in the district
taking the growth factors of total SHGs formed total all-women SHGs and total
active SHGs the following diagrammatic presentation has been made in figure-
318
2007-08 2008-09 2009-10 2010-11 2011-12
5296 5318 5128 509 4987
8767 8994 9181 9455 9231
Comperative Quality amp Sustainability Position of SHGs in Barpeta District
Active SHGs under Model-II Active SHGs under Model-III
Growth Rate ()
218
The diagram clearly indicates that the growth trend in all the factors are gradually
coming down from 2007-08 to 2011-12 and more importantly the trend line of
active SHG is under all the trend lines presented in the diagram which is very
important to be considered and more important line among all the trend lines
presented in the diagram Thus positions of SHG under model-II are gradually
deteriorating and very poor during 2011-12 in the district and during the period of
study
39g Growth Trend of SHGs under SHG Model-III in Barpeta District
The growth pattern of SHGs in the district under model-III is shown in the figure-
319 and it is clearly understood from the same that the growth was highest during
2008-09 in the periods of study and after that there was sharp fall in the growth
rates in all the factors of SHGs growth rates under consideration but from 2010-11
to 2011-12 a slow progressive growth has been noticed in the diagram which is a
good sign
Growth Rate ()
220
Again the growth rate and trend of active SHG is above all the growth lines in the
figure which is found just reverse under model-II as mentioned earlier Thus from
the two diagrammatic presentations it is clear that by the end of the period under
study all the growth lines under model-II records downwards movement and the
same under model-III records upward movement or in progressive trend
39h Analysing SHG Model-wise Magnitude and Trend of Microfinance in
Barpeta District
The details of microfinance performance under each of the SHG models in the
district are presented in table-39 and it is found from the same that model-III has
performed well in terms of providing more amount of loans to the beneficiaries in
comparison to model-II if we consider the model-wise loaning performance ratio
as given in the table more amount of loans or microfinance has been availed under
model-III in all through the period of study and the average ratio of lending under
these two models comes to 0731 pa during the period of study The amount of
loan disbursed under model-II in 2007-08 was only ` 38685 lakh which at an
average annual growth of 2197 percent reached to `81181 lakh during 2011-12
and in case of loan outstanding with SHG in the district it was an amount of `
157351 lakh in 2007-08 which rose to the balance of loans outstanding to
`256484 lakh thus registered a total growth of 63 percent in period of study But
position of loans disbursed under model-III was ` 122884 lakh in 2007-08 which
with an average annual growth of 1301 percent reached to ` 202850 lakh by
March 2012 in the district including a negative growth of 176 percent in 2011-12
Again about the amount of loans outstanding with SHG in the district it was only
` 131773 lakh in 2007-08 which rose to ` 224699 lakh by March 2012 thus
registered a total growth of 7052 percent during the period of study
222
The all-women SHGs constitute the major share in the district thus an effort was
made to know the amount of loans provided to them and the total amount of loans
provided to those SHG under model-II was ` 144987 lakh in 2007-08 which by
registering an average growth of 2033 percent pa reached to ` 271696 lakh by
March 2012 The same under model-III was ` 199793 lakh in 2007-08 rose with
an average growth of 1818 percent pa and reached to ` 298333 lakh by March
2012 Further the women SHGs are given in an average 7579 percent of the total
amount loans under model-II during the whole period of study and the same under
model-III was in an average of 8589 percent during same period of study in the
district Thus under model-III 1010 percent more amount of loans had been
extended to the all-women SHGs in the district in all through the period of study
Again total amount of loans provided under model-II in the district was ` 196036
lakh in 2007-08 which increased with an average growth rate of 1524 percent pa
and reached to ` 252362 lakh in 2011-12 and the same under model-III was `
254657 lakh in 2007-08 which rose to ` 259989 lakh by recording an average
growth of 1306 percent pa during the entire period of study Surprisingly despite
having such huge volume of SHG under model-II (ie 9099 of the total SHG in
the district) in the district only 4350 percent of the grand total amounts of loans
were provided to SHGs in 2007-08 and that under model-III was 5650 percent to
only 901 percent of the total SHGs of the said period This huge disparity signifies
that the SHGs under model-III were availed more amount of loans and SHGs under
model-II were under-served or extended poor amounts of loan Again if we
consider the same for the year 2011-12 an amount of ` 252362 lakh which is
4227 percent of the grand total amount of loans were extended to the beneficiaries
under model-II in the district and under model-III the same was ` 259989 lakh
which is 5773 percent of the grand total amount of loans provided in the same
period of study The magnitude and trend of microfinance in the district is also
presented with a diagram in figure-320 to understand the scenario more clearly
Amount in Lakh
224
Simply it can be understand from the diagram that in all the factors of loans to the
SHGs performance under model-III is more lucrative and provided more amounts
year after year thus model-III holds better position in the magnitude of loans in
Barpeta district of Assam
39i Analyzing the Comparative Growth Trend of Microfinance under SHG
Model-II and III in Barpeta District
The growth trend of microfinance under each of the SHG models under study
behave and move in reverse way as under model-II the growth trends fluctuate
considerably during the period of study in the district but the growth trends under
model-III slowly progressed from 2007-08 to 2009-10 and thereafter gradually fell
up to the end of the period under study But progress under model-III was almost
steady in comparison to model-II in the same period of study The Comparative
growth position can better be understood from the following diagram which is
prepared taking all the growth rates of loans in Barpeta District in the following
diagram
Growth Rate ()
226
So the growth trends under model-II were negative except in loan disbursed in
2008-09 which reached to the top level in 2009-10 and again fell down in 2010-10
and in 2011-12 consecutively But those under model-III experienced almost a flat
and steady growth during the period of study The growth of loans disbursed under
model-II was 1920 percent in 2007-08 which maintained an average incremental
growth of 2118 percent all through the period but registered a negative growth of
064 percent in 2011-12 The same under model-III was 1833 percent in 2007-08
and recorded an average incremental growth of 1467 percent pa during the period
of study but that stands to 176 percent negative growth in 2011-12 In the case of
growth rate of loans outstanding with the SHGs in the district it was only 1295
percent in 2007-08 which reached to 2270 percent in 2011-12 registering two
negative growths of 2141 and 250 percent respectively in 2008-09 and 2010-11
But under model-III the same was only 432 percent in 2007-08 which reached to
1715 percent in 2011-12 by registering an average growth of 1241 percent pa all
through the period of study and no negative growth had been registered in the
period The growth pattern of loans to all-women SHG is a strong factor in the
district because more than 80 percent SHGs fall under this category and in 2007-
08 it registered a growth of 1555 percent and that also maintained an average
growth of 2033 percent pa all through the period under study and stands at 1507
percent in 2011-12 overcoming a negative growth of 2027 percent in 2008-09
under model-II and the same under model-III was 1840 percent in 2007-08 and
registered an average growth of 1818 percent pa during the period of study and
reached to 1150 percent in 2001-12
Further Intermediaries-wise SHGs Position and Trend with their loans position
during the period of study in Barpeta District under Model-II and III are presented
with the help of following two diagrams
Nos of SHG
Amount in Lakh
229
The outcomes of the above diagrams is very clear as maximum SHGs are formed
under model-II by block intermediaries as shown in figure-322 but availed less
amount of loans to those few percentage of SHGs On the contrary very few
percentage of SHGs are formed under Model-III by NGOsMFIs in the district but
maximum amount of loans are availed towards those SHGs those groups are
getting more loans or frequent loans in comparison to the SHGs formed under
model-II in the district during the period of study that are shown in figure-323
310 Analyzing Comparative Growth Position of SHGs in India Assam and in
Barpeta District under the SHG Models
After going through the positions of microfinance in India Assam and in Barpeta
district as mentioned above where mixed responses are found and to show the
relative position more precisely efforts were made to have comparative study with
the core factor of performance in terms of growth trends of SHGs right from
national level to the district level and that will depict the picture more clearly As
such their performances have been presented with the help of following two
diagrams as follows in figure-324 and figure-325
Growth Rate ()
Growth Rate ()
232
In both the figures given above it is clearly depicted that there is a sharp fall in the
performance of SHGs and loans extended to them from 2009-10 onwards in all
sector of microfinance ie in India Assam and as well in Barpeta District of
Assam The position was favourable from 2007-08 to the 2009-10 as highest
growth rates were recorded during that period as shown in the figures Such drastic
down-fall in both in the growth of SHGs and in microfinance (ie in extending
total amount of loans) during the period had weakened the service of microfinance
spreads and base in the country The incidents that had occurred in Andhra Pradesh
where 30 farmers had committed suicide within a span of 45 days in 2010 after a
few MFIs used coercive recovery tactics (Patra 2011) is a strong reason for such
adverse scenario as after such incidents many financing banks and institutions
stopped financing to MFIs The subsidy provision under SGSY programme also
weakened the base of a group of SHGs which were formed only to take the
benefits of subsidy and not SHGs as a means of self-employment provisions is also
added to the reason of such downfall in the performance of microfinance sector in
our country Again the change of programme from SGSY now to newly introduced
NRLM also concentrate a lot in the change of the functional structures power and
management and also weakens the rapid growth and speeds of microfinance sector
in the country during the period under study
311 Conclusion
During the period under study the performance under microfinance service has
been moved in two way dimensions as in the first half of the period ie from
2007-08 to 2009-10 the performance was in progressive trend in India Assam and
as well in Barpeta district of Assam but in the later part of the period of study the
performance and progress experienced downfall While we consider the magnitude
of microfinance services in Assam in terms of SHG with saving in banks it is
found that only 347 percent SHGs belong to Assam and same is 1879 percent
233
highest in the country in case of Andhra Pradesh by the end of March 2012 The
relative position of Assam in NER is good as Assam occupied 7542 percent of the
total SHGs of the region and that with the amount of savings of `984598 lakh
which stands at 6456 percent of the total amount of savings of NER Thus Assam
is in leading position in the region followed by Tripura and then Meghalaya
(NABARD 2012) In case of amount of loans disbursed to SHGs in 2011-12
Assam is having only 113 percent of the total amount of loans disbursed in India
and among NER it is 4154 percent followed by Tripura and Manipur
On SHG model-wise analysis it is found that SHG-bank linkage models (together
SHG Model-I amp II) remain in dominant position in terms of volume of SHGs and
absolute amount of loans availed to SHGs in the country than MFI-bank linkage
model (ie SHG Model-III) during the period of study But in Barpeta District of
Assam some variation in the model-wise performance has been found during the
period of study as model-II is found popular and covered more number of members
and is able to form more numbers of SHGs in comparison to that of under model-
III As of the total SHGs in the district 8975 percent are formed under model-II
and only1025 percent SHGs are under model-III in 2011-12 Again total amount
of loans given to SHGs under model-II in the same period was ` 337665 lakh
which was 4413 percent of the grand total amount of loans under both the models
and the rest 5587 percent were given to only 1025 percent of the total SHGs in
the district Thus SHGs under model-III are given more amount of loans or
frequent loans in comparison to the SHG under model-II in the district during the
period of study In terms of growth factors under each of these two models growth
trends under model-II both in case of SHG and in amount of loans to them more
fluctuations or ups and downs were recorded during the period of study and by the
end of the period particularly in 2010-11 and 2011-12 the growth trends were
down-falling in the district But the same under model-III were almost steady
during the period of study with a bit high in 2009-10 and a bit low in latter part of
the period of study particularly in 2010-11 to 2011-12 in the district Again in
234
terms of sustainability of SHGs formed under each of the SHG models also varies
a lot The SHGs formed managed and financed under model-II are half in an
average of the total are defunct SHGs and only 50 percent of them survive or are
functional in the district but the same under model-III is found more than 91
percent as active and functional during the period of study in the district Thus
over-all performance of SHGs under SHG model-III in the district during the period
of study is better than SHGs under model-II in respect of service quantum of
loans growth trends and sustainability etc
References
(2006) Statistical Hand Book of Assam Guwahati Directorate of Economics and
Statistics Government of Assam
Asif M (2011 November) Role of NGOs in India YOJANA 55 pp 8-10
Bandhan (nd) Bandhan Hope for the Poor Product Information Broucher of Bandhan
West Bengal India Bandhan
Baruah P B (2012) Impact of Microfinance on Poverty A Study of Twenty Self-Help
Groups in Nalbari District Assam Journal of Rural Development 31(2) 223-234
Bharali S (2010 July 18) An Institute Promotion of Secure Sustainable Livelihood
ASOMI Barta 6(6)
Borbora S amp Sarma G K (nd) Microfinance Institutions Sustainability and Outreach
Retrieved May 2 2014 from httpwwwwbiconprocom314-borborapdf
CGAP (nd) Consultative Group to Assist the Poor Retrieved from wwwcgaporg
Chatterjee N amp Dar M A (2011 November) Role of NGOs in Rural Development
YOJANA 55 pp 17-20
Chief Ministers Micro Finance Scheme-Assam Financial Corporation (CMMFS) Khudra
Reen (nd) Retrieved May 1 2014 from httpwwwafconlinegovin
documentbroucherpdf
Chief Ministers Micro Finance Schemes- Assam Financial Corporation (nd) Retrieved
May 1 2014 from httpwwwafconlinegovinpdfmfnbbrochure Englishpdf
Das D (nd) Informal Microfinance in Assam Empirical Evidence from Nalbari and
Baksa Districts Retrieved November 2013 from IFMR Centre for Microfinance
235
Research httpwwwifmrleadorgcmfwp-contentuploadsattachmentscsy1685
informal20MF20in20Assampdf
Das K (2012 January- March) Financial Inclusion-A Gateway to Sustainable
Development for the Impoverished Journal of Rural Development NIRD 31(1)
115-128
Das R L Dutta D N Kakoti P amp Deka S N (2011) Rural and Microfinance
Guwahati BLJ Publication
Deb B (2012) Microfinance and Poverty Alleviation A Case Study on Rgvn-Csp Indian
Journal of Applied Research 71-74
Desai V (2005) NGOs Gender Mainstreaming and Urban Communities in Mumbai
Gender and Development 13(2) 90-98
Devi M (2012 January 20) Rural Industrialisation for Development The Assam Tribune
Guwahati p 6
Dhar P K (2009) The Economy of Assam Including Economy of Narth East India New
Delhi Kalyani Publishers
Dutta J amp Upadhaya M (2013 August 23) Green Microfinance for Eco-friendly
Development The Assam Tribune (English Daily News Paper) p 6
Economic Survey Assam 2011-12 (nd) Retrieved April 30 2014 from
httpwwwecostatassamnicinads_economic20survey-2011-12pdf
Executive Summary Part-I An Overview of State Focus Paper 2006-07 (nd) Retrieved
April 30 2014 from httpwwwnabardorgpdfAssam20EXECUTIVE
20SUMMARYpdf
Gadiapannivar R D (nd) IFMR Centre for Microfinance Retrieved November 2013
from wwwifmracincmf httpwwwifmrleadorgcmf
Ghosh M (2012 July-Sept) Microfinance and Rural Poverty in India SHG-Bank Linkage
Programme Journal of Rural Development 31(3) 347-363
Gogoi P (2013) Economic Empowerment of Rural Women Through Income Generating
Activities In B M Doley (Ed) Women in Rural Development (Seminar Volume)
(pp 36-45) Guwahati Publication Board Silapathar College Dhemaji Assam
IIBF (2010) Rural Banking New Delhi Indian Institute of Banking amp Finance by
Macmillion
Khanka S S (2010) Microfinance in India From Evolution to Revolution In J U
Ahmed D Bhagat amp G Singaiah (Eds) Microfinance in India Issues and
Challenges (pp 3-14) Guwahati DVs Publications
236
Lalitha N (2011 February) Sustainable Management of Local Resources YOJANA 55
pp 32-35
Mathaw J amp Verghese J (2011 November) Non Governmental Organisation in India
YOJANA 55 pp 12-14
NABARD (2012) Status of Microfinance in India 2011-12 Mumbai NABARD
NRLM (nd) NRLM Procurement Manual- Ministry of Rural Development Retrieved
May 1 2014 from httpruralnicinsitesdownloadslatestNRLM
20Procurement20Manualpdf
Patra D R (2011 December) Death of Microfinance in India BFM Banking Finance
Markets A Planman Financial-IIPM Think Tank Publication 1(10) pp 28-33
RBI (nd) Quarterly Statistics on Deposits and Credit of Schedule Commercial Banks
March 2007 to March 2011 Mumbai Reserve Bank of India
Roy A (nd) Microfinance and Rural Development in the North East India Retrieved
December 2013 from httpwwwpbrcoinBrochure0006pdf
Sarmah V (2010) Microfinance Vission 2015 Northeast Region India Retrieved July
2013 from httpwwwaccessdevorgdownloadsmicrofinance_vision_2015pdf
SGSY (2010) Swarnjayanti Gram Swarozgar Yojana (SGSY) Retrieved May 1 2014
from httpwwwcsjpgoaorgwp-contentuploads201010sjgsypdf
Sharma A K (2011 December) Micro Finance in the North East YOJANA pp 8-10
Shodhganga (nd) Chapter-3 Microfinance Trends Problems and Prospects Retrieved
June 2013 from httpshodhgangainflibnetacinbitstream10603303111
n_chapter203pdf
Srinivasan N (2009) Microfinance India State of the Sector Report 2009 Delhi
ACCESS Sage
Sundaram I S (2007) Microfinance in India Delhi BR Publishing Corporation
Tribune A (2007 May 7) Self-help Groups and Rural Development The Assam Tribune
Guwahati p 6
Vikash (2008 March) About the Issue Microfinance Focus II(IV) 3
Yunus M amp Jolis A (2007) Banker To The Poor The Story of the Grameen Bank New
Delhi Penguin Books
----0----

Growth Rate ()
192
Thus total amount of loan provided (ie loan disbursed and loans outstanding) up
to March 2012 to 145821 SHGs in Assam reached to ` 8176862 lakh which
recorded a total growth of 14708 percent and an average growth of 2942 percent
pa during the period of study The amount of total loans availed to all-women
SHG in 2007-08 was ` 2416816 lakh to the 76090 SHGs and by an average
annual growth of 3708 percent pa in amount of loans outstanding and 1185
percent in SHGs the same reached to the balance of ` 6897173 lakh against
121177 SHG by March 2012 Which is the highest growth recorded in
microfinance service in the NER and Assam is holding the leading position in
microfinance service
38a Analysing Performance of Microfinance under SHG Models in Assam
The performance of microfinance under each of the SHG-bank linkage models (ie
SHG model-I amp II) and MFI-bank linkage model (ie SHG model-III) is presented
in table-36 and it is found that maximum amount of loans have been given to the
beneficiaries together under model-I amp II which was in average 7404 percent pa
of the grand total amount of loans and the same under model-III was only 2596
percent pa during the same period under study in Assam Again the total growth
made in five years in the total amount of loans is 12493 percent together under
model-I and II and that under model-III records a total growth of 25952 percent in
five years under study Thus in terms of amount of total loans SHG-bank linkage
models records more expansion and flow of micro-credit than MFI-bank linkage
model but in terms of growth the MFI-bank linkage model (ie model-III) records
better growth so microfinance service under model-III is considerably increasing
and spreading in Assam Again the total amount of loans provided together under
model-I and II in 2007-08 was 8354 percent which came down to 7605 percent by
March 2012 and the same under model-III was only 1646 percent in 2007-08 and
193
has increased to 2395 percent by March 2012 of the grand total amount of loans
given jointly under all the SHG models in Assam
Table-36 SHG Model-wise Performance of Microfinance in Assam from 2007-08 to 2011-12 (Amount ` in Lakh)
Particulars
Under SHG Model-I amp II Under SHG Model-III Grand Total of Loans under SHG
Models- I II amp III
Loan Disbursed
Loan Outstanding
Total Amount of Loan
(X)
Loan Disbursed
Loan Outstanding
Total Amount of Loan (Y)
2007-08 1021264 (1836)
1743364 (2198)
2764628 (2013)
227352 (3568)
317366 (4621)
544719 (6873) 3309347
2008-09 1362358 (3340)
2521286 (4462)
3883644 (4048)
415116 (8259)
556887 (7547)
971518 (7835) 4855162
2009-10 1478359 (851)
2867412 (1373)
4345083 (1188)
1097091 (16429)
1426836 (15622)
2524614 (15986) 6869698
2010-11 1588320 (744)
3408841 (1888)
4997161 (1501)
922130 (-1595)
1499297 (508)
2421427 (-409) 7418588
2011-12 1944458 (2242)
4273228 (2536)
6218504 (2444)
612447 (-3358)
1346729 (-1018)
1958358 (-1912) 8176862
Source Status of Microfinance in India NABARD amp Table-3 amp 4 above Note The model-wise allocation of microfinance in Assam as shown in table- 36 have been obtained by calculation with the help of all India average ratepercentage of flow of microfinance under each of the models as shown in table-34 above Because NABARD do not published such information in its reports state or region wise rather as a whole for the country Figures in the parenthesis are the growth rates
A diagrammatic presentation has also been made to analyse and to show the
relative performance of microfinance in Assam under each of the SHG models
From the diagram it can be seen that all the factors ie loans disbursed loans
outstanding and total amount of loans under the SHG models are in regular
increasing trend only with the little exception of decreasing trends in 2011-12
under model-III
Amount in Lakh
195
So SHG-bank linkage models remain dominant in providing microfinance service
to the people of Assam because the performance in all the factors as mentioned
above are higher than MFI-bank linkage model in absolute figures The amount of
loans disbursed together under model-I and II in 2007-08 was ` 1021264 lakh
which records a total growth of 9040 percent in five years with an average growth
of 1808 percent pa and reached to `1944458 lakh by March 2012 and the same
under model-III was ` 227352 lakh in 2007-08 which recorded a total growth of
16938 percent in five years period with an average growth of 3388 percent pa
and reached to `612447 lakh by March 2012 Again in case of balance of loans
outstanding with SHGs the amount of loans outstanding under model-I and II
together was amounted to `1743364 lakh and recorded total growth of 14511
percent in five years from 2007-08 to 2011-12 with an annual growth of 1902
percent pa and reached to ` 4273228 lakh by March 2012 The same under
model-III was `317366 lakh in 2007-08 and recorded a total growth of 32434
percent with an annual growth of 6487 percent in the period of study and reached
to ` 1346729 lakh by March 2012 Thus the progress and growth trend under
model-III are relatively better than together under model-I and II during the period
of study in Assam The details progress and growth pattern under each of the SHG
models are presented in following diagram to access the performance more clearly
196
Figure-310 Growth Trend of Microfinance under SHG Model- I ampII in Assam from 2007-08 to 2011-12
Source Table-36 So the growth trend as depicted in the above diagram was to the maximum level in
2008-09 and after that there was a sharp fall in growth of all the factors ie loan
disbursed loans outstanding and in total amount of loans in 2009-10 Again slow
progress is recorded which can be seen in the diagram from 2010-11 onwards
interestingly during the period of five years none of the factors have recorded any
negative growth together under SHG model- I amp II
Again to know the same under SHG model-III another diagrammatic presentation
has been made in figure-311 to access the progress and performance in terms of
growth rates of loans disbursed outstanding and total loans more clearly and it is
found that with steady increasing growth from 2007-08 in all the loans factor it
reached the highest level of growth in the year 2009-10 and after that there was a
sharp down-fall in the growth in all the factors of loans in 2010-11 and thereafter
further down-fall was recorded which can be observed from the diagram and
recorded negative growth in all the factors of loans from 2010 to 2012 leaving the
factor outstanding loans in 2010-11 which was slightly positive among the other
loan factors Thus huge fluctuations have been found in microfinance service under
0
10
20
30
40
50
2007-08 2008-09 2009-10 2010-11 2011-12
Growth Trend of Microfinance together under SHG Model-I amp II in Assam
Loan Disbursed Loan Outstanding Total Amount of Loan
197
model-III in Assam The incident which occurred in Andhra Pradesh in 2010 the
change of microfinance programme from SGSY to NRLM etc are some of the
reasons for such huge fluctuation under model-III in our country including Assam
decreasing interest of funding institutions and banks to MFIs for huge NPAs is also
another reason behind such fluctuations
39 Microfinance in Barpeta District of Assam
As informal source of finance the practice of microfinance was in Barpeta District
from ancient time in various forms and not exactly in the form what we called
-
credit
Growth Rate ()
199
Poor people used to borrow from the money lenders or from local capitalist mostly
by mortgaging their valuables like jewellery lands cattle etc as security for the
loan credit Most of them basically borrowed consumption type loans or loans in
case of acute needs of the family with very high rate of interest which even stood
more than the principal sum of money they borrowed (IIBF 2010) (Yunus 2007)
So history of microfinance in Barpeta District of Assam had no exceptions from
the rest of the country The cooperative system was an initiation in the field of
financial service for the poor in Assam and as well in Barpeta District and the role
of rural credit cooperative have some impact in the life of rural people though is
unable to bring such revolution among the rural people in the villages and of remote
areas
If we concentrate on the movement or start-up of microfinance services in the
district then it is after the introduction of SGSY programme the major poverty
alleviation programme of GOI in the 2000 but as reported by the district official
from 2004-05 the programme start progressing by forming SHGs in voluminous
manner and prior to that the progress was not impressive Considering the fact the
researcher considers the period of study from 2007-08 to 2011-12 ie for five
years and the progress and performance under the SHG models of microfinance of
the said period only have been shown in this study Again under the SHG models
three SHG-credit linkage models exist but in Barpeta district no such SHG were
found during the field survey who are directly formed and nurtured by the banks in
the district which comes under SHG model-I Limited bank branches works
overload limited banks staffs lack of interest of banks etc are some of the general
reasons for non-operational of model-I in the district As such the present study is
confine to the rest of the two models ie SHG Model-II and SHG Model-III in
Barpeta District of Assam The detailed information and data of microfinance
relating to the study about Barpeta District are presented in the following table
201
39a Magnitude and Progress of SHG in Barpeta District
Total SHGs linked to Banks and MFIs of the District up to the end of March 2012
has grown to 15 477 which was 11346 SHGs during 2007-08 thus the same
recorded a total growth of 3641 percent and an average growth of 728 percent pa
during the period of study in linking SHG together under SHG model-II and III
The least growth rate recorded during the period was 555 percent in the year 2011-
12 The position of all-women SHGs in Barpeta District is impressive and having
reached beyond the national average of 80 percent (NABARD 2012) Women
members occupied the lion share in microfinance in the district as all-women
SHGs in the District have increased to 15261 of the total SHGs up to March 2012
which is 9860 percent of total SHGs of the district The position of all-women
SHG in the district in 2007-08 was comparatively a bit poor as there was 10952
SHGs and that stood to 9653 percent of the total SHG of that year Thus total
growth of all- women SHGs in the district comes to 3934 percent in the five years
with an average growth of 787 percent pa A diagrammatic presentation has been
made with the help of total SHGs all-women SHGs and active SHGs in figure-
312 to show the magnitude and progress of SHGs in Barpeta District and it is
found that during the period of study SHGs in the district records slow progress
year after year almost at the same rate of growth in all the factors of SHG Of the
total SHG only 8392 SHGs are reported as Active30 SHG in the district and that is
only 5422 percent of the total SHG Thus near to half of the total SHGs in the
district are found defunct and those SHGs are no longer in existence or not
interested in SHG activities As reported by the intermediaries of microfinance in
the district most of those defunct SHGs were formed with the intention to take the
benefits of subsidy and while they found no more subsidies they stopped working
and their SHGs became inactive
30Active amp defunct SHGs here recorded as per the records and information of SHGs intermediaries of Barpeta District
202
A diagrammatic presentation has been made with help of total SHGs comparing
with all-women SHGs and active SHGs in the district during the period of study as
follows
Figure-312 Total All-Women and Active SHGs Positions in Barpeta District of Assam from 2007-08 to 2011-12
Source Table-37
So it can be observed from the above diagram that a steady incremental trend and
progress have been recorded during the period of study in the district in all the
factors of SHG and most importantly no abnormal fluctuation has been recorded
during the period of study
39b Growth Trend of SHG in Barpeta District
While SHGs growth position is considered the growth trend of the same have
gradually come down from 2007-08 to 2011-12 which can be viewed from the
following in figure-313 which is prepared taking the growth rates of the total all-
women and active SHGs of Barpeta District
0
20004000
6000
8000
1000012000
14000
16000
2007-08 2008-09 2009-10 2010-11 2011-12
SHGs of Barpeta District of Assam
Total Nos of SHG All Women SHG Total Active SHG
Growth Rate ()
204
It is clearly depicted in the above diagram that the SHG growth rate and position
have come down from 2009-10 onwards and those growth rates come even below
10 percent in the district the growth rates was maximum in 2008-09 as viewed in
the above diagram The position of active SHGs in terms of growth during the
period of study recorded a total growth of 3610 and an average growth of 722
percent pa in the study period But the growth rate of the same was very poor as
376 percent during 2011-12 Thus growth rate of active SHGs come down during
2011-12 even below the average rate This indicates the slow progress in the
formation and leaves question marks to the sustainability of SHGs in the district
owing to the poor management limited credit flow subsidy provision under SGSY
rural people participation in NREGA etc in the district has weaken the
performance
39c Magnitude of Loans Provided under SHG Models in Barpeta District
The total amount of loans availed to the beneficiaries or SHG members in Barpeta
District occupy only 936 percent of the total amount of loans availed in Assam
comprising of loans disbursed and loans outstanding during 2011-12 The share of
district in the state were same with little difference in the whole period of study as
it was 1362 percent in 2007-08 the highest score in period under study 952
percent in 2008-09 900 percent in 2009-10 and 929 percent in 2010-11 and those
with an average share of 1016 percent pa during the five years period under
study31 The amounts of loans disbursed to the SHGs in the district were `161569
lakh in 2007-08 which with an average incremental growth of 3039 percent pa
reached to `284031 lakh by March 2012 with the exception of negative growth
of 144 percent during 2011-12 during the period of study As regards amount of
loans outstanding with SHGs in the district the records reveal that it was ` 289089
31The share total amount of loans availed during the period under study are calculated taking the figures of total loans of Assam and of Barpeta District year after year from Table-36 amp 37 as mentioned above
205
lakh in 2007-08 and the amount of loans outstanding balance rose to `481183 lakh
which seems near to double by the end of March 2012 thus recognising
considerable growth in financing during the period of study All-women SHGs
constitute the lion share in the district and of the total amount of loans given to all-
women SHGs 8174 percent pa are provided only to those SHGs in the district
with little variation during the period of study A diagrammatic presentation has
been made with the help of amount of total loans loans to all-women SHG loans
disbursed and loans outstanding to have a clear picture about the magnitude of
microfinance in the district during the period of study which is as follows
Amount in lakh
207
It can be observed from the diagram that the position of loan factors is gradually
increasing maintaining the same sequence and rate year after year during the
period of study thus the loan factors are normally growing which is a healthy sign
of development of microfinance position and services in the district
39d Analyzing the Growth Trend of Loans under SHG Models in Barpeta
District
To know the actual picture of performance and progress of microfinance more
precisely in the district through its lending to the SHGs under the SHG models
effort were made to find out the growth pattern of loans availed to SHGs during the
period under study with the help of diagram as given in figure-315 It is depicted in
the same that considerable ups and downs have been recorded in the growth rates
among the loan factors during the period of study in the district and in some cases
negative rates of growth have also occurred
Growth Rate ()
209
The amount of loan disbursed to the SHGs during year 2011-12 was `284031
lakh and that recorded a total growth in disbursing loans to SHGs from 2007-08 to
2011-12 of 13364 percent with an average growth of 2673 percent pa during the
period of study But during 2011-12 the rate of growth of the same was negative to
144 percent in the district Again the amount of loan outstanding with the SHGs in
the district up to March 2012 was `481183 lakh which recorded a total growth
of 6645 percent and an average growth of 1329 percent pa during the period of
study The growth of loans outstanding was negative in 2008-09 and highest in
2009-10 to 4630 percent again fell in 2010-11 and increased a little in 2011-12
As all-women SHGs have occupied the lion share in the district and up to March
2012 the total amount of loans disbursed to those SHGs were ` 658773 lakh and
that recorded a total growth of 9109 percent with an average growth of 1822
percent pa during the period of study Of the total amount of loans maximum
amount of loans are availed to the all-women SHG in the district which in average
was 8174 percent pa during the period of study Further of the total amount of
loans availed (ie loans disbursed and loans outstanding) against the SHGs in the
district recorded a total growth of 8634 percent in five years with an average
growth of 1727 percent pa during the period of study
39e Analyzing SHG Model-wise performance of SHGs in Barpeta District
As among the three SHG-credit linkage models SHG Model-II and Model-III are
functional in the district and no such SHGs were found which are directly formed
under Model-I as such analysis of this part are confine to the models which are
operating and functional in the Barperta District Again details as regards SHG
models have already been mentioned in chapter-1 but for the sake of convenience a
brief outline of two functional models in the district are given below
210
SHG Model-II Under this model SHGs are formed and nurtured by the
intermediaries which includes GOs and NGOs and after a certain period and on
satisfactory performance in group management and group funds handling (ie
savings of members) they are being linked to banks for loans In Barpeta District
the task of formation nurturing linking etc of SHGs under SHG Model-II are
performed under the blocks by the Blocks official at the block and village level and
after their satisfaction and scrutiny about the performance of the group they send it
to the DRDA office for the approval and sanction of loans While assessing the
performance of SHGs (the Blocks official and sometimes persons from banks also
join in the process) for grading the SHGs on their performance on the basis of
some parameters where they mainly consider the following five points of SHG and
(ie five point formula) for grading
and promotion of SHG and includes
1 Weekly Meeting
2 Weekly Savings
3 Internal Credit
4 Recovery of Internal Credit
5 Records keeping
On satisfactory performance evaluation the list of SHGs are sent to DRDA for the
sanction of loan and DRDA may call some groups for talking if they feel the need
and after their needful verification they send the list of SHGs to the banks and a
copy to the respective blocks for record keeping and the groups are availed loans
through banks thus the groups are being linked with bank branches
SHG Model-III Under this model some NGOs and MFIs as intermediaries avail
bulk amount of loan from various funding institutionsbanks for on lending to the
groups The intermediaries take care of the groups in all respect and directly finance
the groups The groups in return have to follow the instruction of those
211
intermediaries and have to repay the loan as per the time and size of installment
fixed by them In Barpeta District ASOMI Bandhan RGVN are the leading MFIs
dealing with SHGs to provide micro-credit under this model The selection
procedure promotion criteria etc of SHG depends upon the intermediary which
slightly varies among the service providing intermediaries but the basic objectives
remain same
A detailed SHG model-wise break-up of SHGs in the district are given in the
following table
213
If we consider the model-wise SHG formation performance in the district more
numbers of SHG are being formed under model-II than model-III and that in terms
of ratio which was 1010 1 in 2007-08 and that has improved a little towards
model-III and in 2011-12 the ratio of SHG formation stands at 8761 under
model-II to III An analytical diagrammatic presentation has been made to show the
performance in the formation of SHGs under each of the models as follow
215
From the above it can be easily understood that more SHGs were formed under
SHG model-II in comparison to the model-III but in both the models the trend of
formation of SHGs are common during the period The quantum of all-women
SHG formed under each model is high and different but their trends of progress
under each of the model are alike But in the quality assessment of SHG under
each model the half of SHGs formed under model-II have gone defunct as per their
records and those SHGs are not in touch with the intermediaries and the same in
case of model-III is very efficient and only a meagre percentage of SHGs is
reported as defunct in the district Thus SHGs formed under model-III is well
managed by those intermediaries and more sustainable in comparison to model-II
under study To have precise outcome on the issue of quality and sustainability of
SHGs under each of models a diagrammatic presentation has been made as
follows
216
Figure-317 SHG Model-wise Quality and Sustainability Position of SHGs in terms of Active and Defunct SHGs in Barpeta District
Source Table-38
In year-wise comparison of the active SHGs under each of the SHG models it is
clear that SHGs formed and managed under model-III are more active and
sustainable and that in an average is 9126 percent pa SHGs under this model are
found more active during the period of study in the district and that in case of
model-II is only 5164 percent pa in average during the same period of study in the
district Thus an average gap of 3962 percent pa or SHG model-II is lagging
behind by the same percentage from model-III in the sustainability of SHG during
the period of study
39f Growth Trend of SHGs under SHG Model-II in Barpeta District
The growth trend and position of the SHGs formed under model-II in the district
taking the growth factors of total SHGs formed total all-women SHGs and total
active SHGs the following diagrammatic presentation has been made in figure-
318
2007-08 2008-09 2009-10 2010-11 2011-12
5296 5318 5128 509 4987
8767 8994 9181 9455 9231
Comperative Quality amp Sustainability Position of SHGs in Barpeta District
Active SHGs under Model-II Active SHGs under Model-III
Growth Rate ()
218
The diagram clearly indicates that the growth trend in all the factors are gradually
coming down from 2007-08 to 2011-12 and more importantly the trend line of
active SHG is under all the trend lines presented in the diagram which is very
important to be considered and more important line among all the trend lines
presented in the diagram Thus positions of SHG under model-II are gradually
deteriorating and very poor during 2011-12 in the district and during the period of
study
39g Growth Trend of SHGs under SHG Model-III in Barpeta District
The growth pattern of SHGs in the district under model-III is shown in the figure-
319 and it is clearly understood from the same that the growth was highest during
2008-09 in the periods of study and after that there was sharp fall in the growth
rates in all the factors of SHGs growth rates under consideration but from 2010-11
to 2011-12 a slow progressive growth has been noticed in the diagram which is a
good sign
Growth Rate ()
220
Again the growth rate and trend of active SHG is above all the growth lines in the
figure which is found just reverse under model-II as mentioned earlier Thus from
the two diagrammatic presentations it is clear that by the end of the period under
study all the growth lines under model-II records downwards movement and the
same under model-III records upward movement or in progressive trend
39h Analysing SHG Model-wise Magnitude and Trend of Microfinance in
Barpeta District
The details of microfinance performance under each of the SHG models in the
district are presented in table-39 and it is found from the same that model-III has
performed well in terms of providing more amount of loans to the beneficiaries in
comparison to model-II if we consider the model-wise loaning performance ratio
as given in the table more amount of loans or microfinance has been availed under
model-III in all through the period of study and the average ratio of lending under
these two models comes to 0731 pa during the period of study The amount of
loan disbursed under model-II in 2007-08 was only ` 38685 lakh which at an
average annual growth of 2197 percent reached to `81181 lakh during 2011-12
and in case of loan outstanding with SHG in the district it was an amount of `
157351 lakh in 2007-08 which rose to the balance of loans outstanding to
`256484 lakh thus registered a total growth of 63 percent in period of study But
position of loans disbursed under model-III was ` 122884 lakh in 2007-08 which
with an average annual growth of 1301 percent reached to ` 202850 lakh by
March 2012 in the district including a negative growth of 176 percent in 2011-12
Again about the amount of loans outstanding with SHG in the district it was only
` 131773 lakh in 2007-08 which rose to ` 224699 lakh by March 2012 thus
registered a total growth of 7052 percent during the period of study
222
The all-women SHGs constitute the major share in the district thus an effort was
made to know the amount of loans provided to them and the total amount of loans
provided to those SHG under model-II was ` 144987 lakh in 2007-08 which by
registering an average growth of 2033 percent pa reached to ` 271696 lakh by
March 2012 The same under model-III was ` 199793 lakh in 2007-08 rose with
an average growth of 1818 percent pa and reached to ` 298333 lakh by March
2012 Further the women SHGs are given in an average 7579 percent of the total
amount loans under model-II during the whole period of study and the same under
model-III was in an average of 8589 percent during same period of study in the
district Thus under model-III 1010 percent more amount of loans had been
extended to the all-women SHGs in the district in all through the period of study
Again total amount of loans provided under model-II in the district was ` 196036
lakh in 2007-08 which increased with an average growth rate of 1524 percent pa
and reached to ` 252362 lakh in 2011-12 and the same under model-III was `
254657 lakh in 2007-08 which rose to ` 259989 lakh by recording an average
growth of 1306 percent pa during the entire period of study Surprisingly despite
having such huge volume of SHG under model-II (ie 9099 of the total SHG in
the district) in the district only 4350 percent of the grand total amounts of loans
were provided to SHGs in 2007-08 and that under model-III was 5650 percent to
only 901 percent of the total SHGs of the said period This huge disparity signifies
that the SHGs under model-III were availed more amount of loans and SHGs under
model-II were under-served or extended poor amounts of loan Again if we
consider the same for the year 2011-12 an amount of ` 252362 lakh which is
4227 percent of the grand total amount of loans were extended to the beneficiaries
under model-II in the district and under model-III the same was ` 259989 lakh
which is 5773 percent of the grand total amount of loans provided in the same
period of study The magnitude and trend of microfinance in the district is also
presented with a diagram in figure-320 to understand the scenario more clearly
Amount in Lakh
224
Simply it can be understand from the diagram that in all the factors of loans to the
SHGs performance under model-III is more lucrative and provided more amounts
year after year thus model-III holds better position in the magnitude of loans in
Barpeta district of Assam
39i Analyzing the Comparative Growth Trend of Microfinance under SHG
Model-II and III in Barpeta District
The growth trend of microfinance under each of the SHG models under study
behave and move in reverse way as under model-II the growth trends fluctuate
considerably during the period of study in the district but the growth trends under
model-III slowly progressed from 2007-08 to 2009-10 and thereafter gradually fell
up to the end of the period under study But progress under model-III was almost
steady in comparison to model-II in the same period of study The Comparative
growth position can better be understood from the following diagram which is
prepared taking all the growth rates of loans in Barpeta District in the following
diagram
Growth Rate ()
226
So the growth trends under model-II were negative except in loan disbursed in
2008-09 which reached to the top level in 2009-10 and again fell down in 2010-10
and in 2011-12 consecutively But those under model-III experienced almost a flat
and steady growth during the period of study The growth of loans disbursed under
model-II was 1920 percent in 2007-08 which maintained an average incremental
growth of 2118 percent all through the period but registered a negative growth of
064 percent in 2011-12 The same under model-III was 1833 percent in 2007-08
and recorded an average incremental growth of 1467 percent pa during the period
of study but that stands to 176 percent negative growth in 2011-12 In the case of
growth rate of loans outstanding with the SHGs in the district it was only 1295
percent in 2007-08 which reached to 2270 percent in 2011-12 registering two
negative growths of 2141 and 250 percent respectively in 2008-09 and 2010-11
But under model-III the same was only 432 percent in 2007-08 which reached to
1715 percent in 2011-12 by registering an average growth of 1241 percent pa all
through the period of study and no negative growth had been registered in the
period The growth pattern of loans to all-women SHG is a strong factor in the
district because more than 80 percent SHGs fall under this category and in 2007-
08 it registered a growth of 1555 percent and that also maintained an average
growth of 2033 percent pa all through the period under study and stands at 1507
percent in 2011-12 overcoming a negative growth of 2027 percent in 2008-09
under model-II and the same under model-III was 1840 percent in 2007-08 and
registered an average growth of 1818 percent pa during the period of study and
reached to 1150 percent in 2001-12
Further Intermediaries-wise SHGs Position and Trend with their loans position
during the period of study in Barpeta District under Model-II and III are presented
with the help of following two diagrams
Nos of SHG
Amount in Lakh
229
The outcomes of the above diagrams is very clear as maximum SHGs are formed
under model-II by block intermediaries as shown in figure-322 but availed less
amount of loans to those few percentage of SHGs On the contrary very few
percentage of SHGs are formed under Model-III by NGOsMFIs in the district but
maximum amount of loans are availed towards those SHGs those groups are
getting more loans or frequent loans in comparison to the SHGs formed under
model-II in the district during the period of study that are shown in figure-323
310 Analyzing Comparative Growth Position of SHGs in India Assam and in
Barpeta District under the SHG Models
After going through the positions of microfinance in India Assam and in Barpeta
district as mentioned above where mixed responses are found and to show the
relative position more precisely efforts were made to have comparative study with
the core factor of performance in terms of growth trends of SHGs right from
national level to the district level and that will depict the picture more clearly As
such their performances have been presented with the help of following two
diagrams as follows in figure-324 and figure-325
Growth Rate ()
Growth Rate ()
232
In both the figures given above it is clearly depicted that there is a sharp fall in the
performance of SHGs and loans extended to them from 2009-10 onwards in all
sector of microfinance ie in India Assam and as well in Barpeta District of
Assam The position was favourable from 2007-08 to the 2009-10 as highest
growth rates were recorded during that period as shown in the figures Such drastic
down-fall in both in the growth of SHGs and in microfinance (ie in extending
total amount of loans) during the period had weakened the service of microfinance
spreads and base in the country The incidents that had occurred in Andhra Pradesh
where 30 farmers had committed suicide within a span of 45 days in 2010 after a
few MFIs used coercive recovery tactics (Patra 2011) is a strong reason for such
adverse scenario as after such incidents many financing banks and institutions
stopped financing to MFIs The subsidy provision under SGSY programme also
weakened the base of a group of SHGs which were formed only to take the
benefits of subsidy and not SHGs as a means of self-employment provisions is also
added to the reason of such downfall in the performance of microfinance sector in
our country Again the change of programme from SGSY now to newly introduced
NRLM also concentrate a lot in the change of the functional structures power and
management and also weakens the rapid growth and speeds of microfinance sector
in the country during the period under study
311 Conclusion
During the period under study the performance under microfinance service has
been moved in two way dimensions as in the first half of the period ie from
2007-08 to 2009-10 the performance was in progressive trend in India Assam and
as well in Barpeta district of Assam but in the later part of the period of study the
performance and progress experienced downfall While we consider the magnitude
of microfinance services in Assam in terms of SHG with saving in banks it is
found that only 347 percent SHGs belong to Assam and same is 1879 percent
233
highest in the country in case of Andhra Pradesh by the end of March 2012 The
relative position of Assam in NER is good as Assam occupied 7542 percent of the
total SHGs of the region and that with the amount of savings of `984598 lakh
which stands at 6456 percent of the total amount of savings of NER Thus Assam
is in leading position in the region followed by Tripura and then Meghalaya
(NABARD 2012) In case of amount of loans disbursed to SHGs in 2011-12
Assam is having only 113 percent of the total amount of loans disbursed in India
and among NER it is 4154 percent followed by Tripura and Manipur
On SHG model-wise analysis it is found that SHG-bank linkage models (together
SHG Model-I amp II) remain in dominant position in terms of volume of SHGs and
absolute amount of loans availed to SHGs in the country than MFI-bank linkage
model (ie SHG Model-III) during the period of study But in Barpeta District of
Assam some variation in the model-wise performance has been found during the
period of study as model-II is found popular and covered more number of members
and is able to form more numbers of SHGs in comparison to that of under model-
III As of the total SHGs in the district 8975 percent are formed under model-II
and only1025 percent SHGs are under model-III in 2011-12 Again total amount
of loans given to SHGs under model-II in the same period was ` 337665 lakh
which was 4413 percent of the grand total amount of loans under both the models
and the rest 5587 percent were given to only 1025 percent of the total SHGs in
the district Thus SHGs under model-III are given more amount of loans or
frequent loans in comparison to the SHG under model-II in the district during the
period of study In terms of growth factors under each of these two models growth
trends under model-II both in case of SHG and in amount of loans to them more
fluctuations or ups and downs were recorded during the period of study and by the
end of the period particularly in 2010-11 and 2011-12 the growth trends were
down-falling in the district But the same under model-III were almost steady
during the period of study with a bit high in 2009-10 and a bit low in latter part of
the period of study particularly in 2010-11 to 2011-12 in the district Again in
234
terms of sustainability of SHGs formed under each of the SHG models also varies
a lot The SHGs formed managed and financed under model-II are half in an
average of the total are defunct SHGs and only 50 percent of them survive or are
functional in the district but the same under model-III is found more than 91
percent as active and functional during the period of study in the district Thus
over-all performance of SHGs under SHG model-III in the district during the period
of study is better than SHGs under model-II in respect of service quantum of
loans growth trends and sustainability etc
References
(2006) Statistical Hand Book of Assam Guwahati Directorate of Economics and
Statistics Government of Assam
Asif M (2011 November) Role of NGOs in India YOJANA 55 pp 8-10
Bandhan (nd) Bandhan Hope for the Poor Product Information Broucher of Bandhan
West Bengal India Bandhan
Baruah P B (2012) Impact of Microfinance on Poverty A Study of Twenty Self-Help
Groups in Nalbari District Assam Journal of Rural Development 31(2) 223-234
Bharali S (2010 July 18) An Institute Promotion of Secure Sustainable Livelihood
ASOMI Barta 6(6)
Borbora S amp Sarma G K (nd) Microfinance Institutions Sustainability and Outreach
Retrieved May 2 2014 from httpwwwwbiconprocom314-borborapdf
CGAP (nd) Consultative Group to Assist the Poor Retrieved from wwwcgaporg
Chatterjee N amp Dar M A (2011 November) Role of NGOs in Rural Development
YOJANA 55 pp 17-20
Chief Ministers Micro Finance Scheme-Assam Financial Corporation (CMMFS) Khudra
Reen (nd) Retrieved May 1 2014 from httpwwwafconlinegovin
documentbroucherpdf
Chief Ministers Micro Finance Schemes- Assam Financial Corporation (nd) Retrieved
May 1 2014 from httpwwwafconlinegovinpdfmfnbbrochure Englishpdf
Das D (nd) Informal Microfinance in Assam Empirical Evidence from Nalbari and
Baksa Districts Retrieved November 2013 from IFMR Centre for Microfinance
235
Research httpwwwifmrleadorgcmfwp-contentuploadsattachmentscsy1685
informal20MF20in20Assampdf
Das K (2012 January- March) Financial Inclusion-A Gateway to Sustainable
Development for the Impoverished Journal of Rural Development NIRD 31(1)
115-128
Das R L Dutta D N Kakoti P amp Deka S N (2011) Rural and Microfinance
Guwahati BLJ Publication
Deb B (2012) Microfinance and Poverty Alleviation A Case Study on Rgvn-Csp Indian
Journal of Applied Research 71-74
Desai V (2005) NGOs Gender Mainstreaming and Urban Communities in Mumbai
Gender and Development 13(2) 90-98
Devi M (2012 January 20) Rural Industrialisation for Development The Assam Tribune
Guwahati p 6
Dhar P K (2009) The Economy of Assam Including Economy of Narth East India New
Delhi Kalyani Publishers
Dutta J amp Upadhaya M (2013 August 23) Green Microfinance for Eco-friendly
Development The Assam Tribune (English Daily News Paper) p 6
Economic Survey Assam 2011-12 (nd) Retrieved April 30 2014 from
httpwwwecostatassamnicinads_economic20survey-2011-12pdf
Executive Summary Part-I An Overview of State Focus Paper 2006-07 (nd) Retrieved
April 30 2014 from httpwwwnabardorgpdfAssam20EXECUTIVE
20SUMMARYpdf
Gadiapannivar R D (nd) IFMR Centre for Microfinance Retrieved November 2013
from wwwifmracincmf httpwwwifmrleadorgcmf
Ghosh M (2012 July-Sept) Microfinance and Rural Poverty in India SHG-Bank Linkage
Programme Journal of Rural Development 31(3) 347-363
Gogoi P (2013) Economic Empowerment of Rural Women Through Income Generating
Activities In B M Doley (Ed) Women in Rural Development (Seminar Volume)
(pp 36-45) Guwahati Publication Board Silapathar College Dhemaji Assam
IIBF (2010) Rural Banking New Delhi Indian Institute of Banking amp Finance by
Macmillion
Khanka S S (2010) Microfinance in India From Evolution to Revolution In J U
Ahmed D Bhagat amp G Singaiah (Eds) Microfinance in India Issues and
Challenges (pp 3-14) Guwahati DVs Publications
236
Lalitha N (2011 February) Sustainable Management of Local Resources YOJANA 55
pp 32-35
Mathaw J amp Verghese J (2011 November) Non Governmental Organisation in India
YOJANA 55 pp 12-14
NABARD (2012) Status of Microfinance in India 2011-12 Mumbai NABARD
NRLM (nd) NRLM Procurement Manual- Ministry of Rural Development Retrieved
May 1 2014 from httpruralnicinsitesdownloadslatestNRLM
20Procurement20Manualpdf
Patra D R (2011 December) Death of Microfinance in India BFM Banking Finance
Markets A Planman Financial-IIPM Think Tank Publication 1(10) pp 28-33
RBI (nd) Quarterly Statistics on Deposits and Credit of Schedule Commercial Banks
March 2007 to March 2011 Mumbai Reserve Bank of India
Roy A (nd) Microfinance and Rural Development in the North East India Retrieved
December 2013 from httpwwwpbrcoinBrochure0006pdf
Sarmah V (2010) Microfinance Vission 2015 Northeast Region India Retrieved July
2013 from httpwwwaccessdevorgdownloadsmicrofinance_vision_2015pdf
SGSY (2010) Swarnjayanti Gram Swarozgar Yojana (SGSY) Retrieved May 1 2014
from httpwwwcsjpgoaorgwp-contentuploads201010sjgsypdf
Sharma A K (2011 December) Micro Finance in the North East YOJANA pp 8-10
Shodhganga (nd) Chapter-3 Microfinance Trends Problems and Prospects Retrieved
June 2013 from httpshodhgangainflibnetacinbitstream10603303111
n_chapter203pdf
Srinivasan N (2009) Microfinance India State of the Sector Report 2009 Delhi
ACCESS Sage
Sundaram I S (2007) Microfinance in India Delhi BR Publishing Corporation
Tribune A (2007 May 7) Self-help Groups and Rural Development The Assam Tribune
Guwahati p 6
Vikash (2008 March) About the Issue Microfinance Focus II(IV) 3
Yunus M amp Jolis A (2007) Banker To The Poor The Story of the Grameen Bank New
Delhi Penguin Books
----0----

Amount in Lakh
195
So SHG-bank linkage models remain dominant in providing microfinance service
to the people of Assam because the performance in all the factors as mentioned
above are higher than MFI-bank linkage model in absolute figures The amount of
loans disbursed together under model-I and II in 2007-08 was ` 1021264 lakh
which records a total growth of 9040 percent in five years with an average growth
of 1808 percent pa and reached to `1944458 lakh by March 2012 and the same
under model-III was ` 227352 lakh in 2007-08 which recorded a total growth of
16938 percent in five years period with an average growth of 3388 percent pa
and reached to `612447 lakh by March 2012 Again in case of balance of loans
outstanding with SHGs the amount of loans outstanding under model-I and II
together was amounted to `1743364 lakh and recorded total growth of 14511
percent in five years from 2007-08 to 2011-12 with an annual growth of 1902
percent pa and reached to ` 4273228 lakh by March 2012 The same under
model-III was `317366 lakh in 2007-08 and recorded a total growth of 32434
percent with an annual growth of 6487 percent in the period of study and reached
to ` 1346729 lakh by March 2012 Thus the progress and growth trend under
model-III are relatively better than together under model-I and II during the period
of study in Assam The details progress and growth pattern under each of the SHG
models are presented in following diagram to access the performance more clearly
196
Figure-310 Growth Trend of Microfinance under SHG Model- I ampII in Assam from 2007-08 to 2011-12
Source Table-36 So the growth trend as depicted in the above diagram was to the maximum level in
2008-09 and after that there was a sharp fall in growth of all the factors ie loan
disbursed loans outstanding and in total amount of loans in 2009-10 Again slow
progress is recorded which can be seen in the diagram from 2010-11 onwards
interestingly during the period of five years none of the factors have recorded any
negative growth together under SHG model- I amp II
Again to know the same under SHG model-III another diagrammatic presentation
has been made in figure-311 to access the progress and performance in terms of
growth rates of loans disbursed outstanding and total loans more clearly and it is
found that with steady increasing growth from 2007-08 in all the loans factor it
reached the highest level of growth in the year 2009-10 and after that there was a
sharp down-fall in the growth in all the factors of loans in 2010-11 and thereafter
further down-fall was recorded which can be observed from the diagram and
recorded negative growth in all the factors of loans from 2010 to 2012 leaving the
factor outstanding loans in 2010-11 which was slightly positive among the other
loan factors Thus huge fluctuations have been found in microfinance service under
0
10
20
30
40
50
2007-08 2008-09 2009-10 2010-11 2011-12
Growth Trend of Microfinance together under SHG Model-I amp II in Assam
Loan Disbursed Loan Outstanding Total Amount of Loan
197
model-III in Assam The incident which occurred in Andhra Pradesh in 2010 the
change of microfinance programme from SGSY to NRLM etc are some of the
reasons for such huge fluctuation under model-III in our country including Assam
decreasing interest of funding institutions and banks to MFIs for huge NPAs is also
another reason behind such fluctuations
39 Microfinance in Barpeta District of Assam
As informal source of finance the practice of microfinance was in Barpeta District
from ancient time in various forms and not exactly in the form what we called
-
credit
Growth Rate ()
199
Poor people used to borrow from the money lenders or from local capitalist mostly
by mortgaging their valuables like jewellery lands cattle etc as security for the
loan credit Most of them basically borrowed consumption type loans or loans in
case of acute needs of the family with very high rate of interest which even stood
more than the principal sum of money they borrowed (IIBF 2010) (Yunus 2007)
So history of microfinance in Barpeta District of Assam had no exceptions from
the rest of the country The cooperative system was an initiation in the field of
financial service for the poor in Assam and as well in Barpeta District and the role
of rural credit cooperative have some impact in the life of rural people though is
unable to bring such revolution among the rural people in the villages and of remote
areas
If we concentrate on the movement or start-up of microfinance services in the
district then it is after the introduction of SGSY programme the major poverty
alleviation programme of GOI in the 2000 but as reported by the district official
from 2004-05 the programme start progressing by forming SHGs in voluminous
manner and prior to that the progress was not impressive Considering the fact the
researcher considers the period of study from 2007-08 to 2011-12 ie for five
years and the progress and performance under the SHG models of microfinance of
the said period only have been shown in this study Again under the SHG models
three SHG-credit linkage models exist but in Barpeta district no such SHG were
found during the field survey who are directly formed and nurtured by the banks in
the district which comes under SHG model-I Limited bank branches works
overload limited banks staffs lack of interest of banks etc are some of the general
reasons for non-operational of model-I in the district As such the present study is
confine to the rest of the two models ie SHG Model-II and SHG Model-III in
Barpeta District of Assam The detailed information and data of microfinance
relating to the study about Barpeta District are presented in the following table
201
39a Magnitude and Progress of SHG in Barpeta District
Total SHGs linked to Banks and MFIs of the District up to the end of March 2012
has grown to 15 477 which was 11346 SHGs during 2007-08 thus the same
recorded a total growth of 3641 percent and an average growth of 728 percent pa
during the period of study in linking SHG together under SHG model-II and III
The least growth rate recorded during the period was 555 percent in the year 2011-
12 The position of all-women SHGs in Barpeta District is impressive and having
reached beyond the national average of 80 percent (NABARD 2012) Women
members occupied the lion share in microfinance in the district as all-women
SHGs in the District have increased to 15261 of the total SHGs up to March 2012
which is 9860 percent of total SHGs of the district The position of all-women
SHG in the district in 2007-08 was comparatively a bit poor as there was 10952
SHGs and that stood to 9653 percent of the total SHG of that year Thus total
growth of all- women SHGs in the district comes to 3934 percent in the five years
with an average growth of 787 percent pa A diagrammatic presentation has been
made with the help of total SHGs all-women SHGs and active SHGs in figure-
312 to show the magnitude and progress of SHGs in Barpeta District and it is
found that during the period of study SHGs in the district records slow progress
year after year almost at the same rate of growth in all the factors of SHG Of the
total SHG only 8392 SHGs are reported as Active30 SHG in the district and that is
only 5422 percent of the total SHG Thus near to half of the total SHGs in the
district are found defunct and those SHGs are no longer in existence or not
interested in SHG activities As reported by the intermediaries of microfinance in
the district most of those defunct SHGs were formed with the intention to take the
benefits of subsidy and while they found no more subsidies they stopped working
and their SHGs became inactive
30Active amp defunct SHGs here recorded as per the records and information of SHGs intermediaries of Barpeta District
202
A diagrammatic presentation has been made with help of total SHGs comparing
with all-women SHGs and active SHGs in the district during the period of study as
follows
Figure-312 Total All-Women and Active SHGs Positions in Barpeta District of Assam from 2007-08 to 2011-12
Source Table-37
So it can be observed from the above diagram that a steady incremental trend and
progress have been recorded during the period of study in the district in all the
factors of SHG and most importantly no abnormal fluctuation has been recorded
during the period of study
39b Growth Trend of SHG in Barpeta District
While SHGs growth position is considered the growth trend of the same have
gradually come down from 2007-08 to 2011-12 which can be viewed from the
following in figure-313 which is prepared taking the growth rates of the total all-
women and active SHGs of Barpeta District
0
20004000
6000
8000
1000012000
14000
16000
2007-08 2008-09 2009-10 2010-11 2011-12
SHGs of Barpeta District of Assam
Total Nos of SHG All Women SHG Total Active SHG
Growth Rate ()
204
It is clearly depicted in the above diagram that the SHG growth rate and position
have come down from 2009-10 onwards and those growth rates come even below
10 percent in the district the growth rates was maximum in 2008-09 as viewed in
the above diagram The position of active SHGs in terms of growth during the
period of study recorded a total growth of 3610 and an average growth of 722
percent pa in the study period But the growth rate of the same was very poor as
376 percent during 2011-12 Thus growth rate of active SHGs come down during
2011-12 even below the average rate This indicates the slow progress in the
formation and leaves question marks to the sustainability of SHGs in the district
owing to the poor management limited credit flow subsidy provision under SGSY
rural people participation in NREGA etc in the district has weaken the
performance
39c Magnitude of Loans Provided under SHG Models in Barpeta District
The total amount of loans availed to the beneficiaries or SHG members in Barpeta
District occupy only 936 percent of the total amount of loans availed in Assam
comprising of loans disbursed and loans outstanding during 2011-12 The share of
district in the state were same with little difference in the whole period of study as
it was 1362 percent in 2007-08 the highest score in period under study 952
percent in 2008-09 900 percent in 2009-10 and 929 percent in 2010-11 and those
with an average share of 1016 percent pa during the five years period under
study31 The amounts of loans disbursed to the SHGs in the district were `161569
lakh in 2007-08 which with an average incremental growth of 3039 percent pa
reached to `284031 lakh by March 2012 with the exception of negative growth
of 144 percent during 2011-12 during the period of study As regards amount of
loans outstanding with SHGs in the district the records reveal that it was ` 289089
31The share total amount of loans availed during the period under study are calculated taking the figures of total loans of Assam and of Barpeta District year after year from Table-36 amp 37 as mentioned above
205
lakh in 2007-08 and the amount of loans outstanding balance rose to `481183 lakh
which seems near to double by the end of March 2012 thus recognising
considerable growth in financing during the period of study All-women SHGs
constitute the lion share in the district and of the total amount of loans given to all-
women SHGs 8174 percent pa are provided only to those SHGs in the district
with little variation during the period of study A diagrammatic presentation has
been made with the help of amount of total loans loans to all-women SHG loans
disbursed and loans outstanding to have a clear picture about the magnitude of
microfinance in the district during the period of study which is as follows
Amount in lakh
207
It can be observed from the diagram that the position of loan factors is gradually
increasing maintaining the same sequence and rate year after year during the
period of study thus the loan factors are normally growing which is a healthy sign
of development of microfinance position and services in the district
39d Analyzing the Growth Trend of Loans under SHG Models in Barpeta
District
To know the actual picture of performance and progress of microfinance more
precisely in the district through its lending to the SHGs under the SHG models
effort were made to find out the growth pattern of loans availed to SHGs during the
period under study with the help of diagram as given in figure-315 It is depicted in
the same that considerable ups and downs have been recorded in the growth rates
among the loan factors during the period of study in the district and in some cases
negative rates of growth have also occurred
Growth Rate ()
209
The amount of loan disbursed to the SHGs during year 2011-12 was `284031
lakh and that recorded a total growth in disbursing loans to SHGs from 2007-08 to
2011-12 of 13364 percent with an average growth of 2673 percent pa during the
period of study But during 2011-12 the rate of growth of the same was negative to
144 percent in the district Again the amount of loan outstanding with the SHGs in
the district up to March 2012 was `481183 lakh which recorded a total growth
of 6645 percent and an average growth of 1329 percent pa during the period of
study The growth of loans outstanding was negative in 2008-09 and highest in
2009-10 to 4630 percent again fell in 2010-11 and increased a little in 2011-12
As all-women SHGs have occupied the lion share in the district and up to March
2012 the total amount of loans disbursed to those SHGs were ` 658773 lakh and
that recorded a total growth of 9109 percent with an average growth of 1822
percent pa during the period of study Of the total amount of loans maximum
amount of loans are availed to the all-women SHG in the district which in average
was 8174 percent pa during the period of study Further of the total amount of
loans availed (ie loans disbursed and loans outstanding) against the SHGs in the
district recorded a total growth of 8634 percent in five years with an average
growth of 1727 percent pa during the period of study
39e Analyzing SHG Model-wise performance of SHGs in Barpeta District
As among the three SHG-credit linkage models SHG Model-II and Model-III are
functional in the district and no such SHGs were found which are directly formed
under Model-I as such analysis of this part are confine to the models which are
operating and functional in the Barperta District Again details as regards SHG
models have already been mentioned in chapter-1 but for the sake of convenience a
brief outline of two functional models in the district are given below
210
SHG Model-II Under this model SHGs are formed and nurtured by the
intermediaries which includes GOs and NGOs and after a certain period and on
satisfactory performance in group management and group funds handling (ie
savings of members) they are being linked to banks for loans In Barpeta District
the task of formation nurturing linking etc of SHGs under SHG Model-II are
performed under the blocks by the Blocks official at the block and village level and
after their satisfaction and scrutiny about the performance of the group they send it
to the DRDA office for the approval and sanction of loans While assessing the
performance of SHGs (the Blocks official and sometimes persons from banks also
join in the process) for grading the SHGs on their performance on the basis of
some parameters where they mainly consider the following five points of SHG and
(ie five point formula) for grading
and promotion of SHG and includes
1 Weekly Meeting
2 Weekly Savings
3 Internal Credit
4 Recovery of Internal Credit
5 Records keeping
On satisfactory performance evaluation the list of SHGs are sent to DRDA for the
sanction of loan and DRDA may call some groups for talking if they feel the need
and after their needful verification they send the list of SHGs to the banks and a
copy to the respective blocks for record keeping and the groups are availed loans
through banks thus the groups are being linked with bank branches
SHG Model-III Under this model some NGOs and MFIs as intermediaries avail
bulk amount of loan from various funding institutionsbanks for on lending to the
groups The intermediaries take care of the groups in all respect and directly finance
the groups The groups in return have to follow the instruction of those
211
intermediaries and have to repay the loan as per the time and size of installment
fixed by them In Barpeta District ASOMI Bandhan RGVN are the leading MFIs
dealing with SHGs to provide micro-credit under this model The selection
procedure promotion criteria etc of SHG depends upon the intermediary which
slightly varies among the service providing intermediaries but the basic objectives
remain same
A detailed SHG model-wise break-up of SHGs in the district are given in the
following table
213
If we consider the model-wise SHG formation performance in the district more
numbers of SHG are being formed under model-II than model-III and that in terms
of ratio which was 1010 1 in 2007-08 and that has improved a little towards
model-III and in 2011-12 the ratio of SHG formation stands at 8761 under
model-II to III An analytical diagrammatic presentation has been made to show the
performance in the formation of SHGs under each of the models as follow
215
From the above it can be easily understood that more SHGs were formed under
SHG model-II in comparison to the model-III but in both the models the trend of
formation of SHGs are common during the period The quantum of all-women
SHG formed under each model is high and different but their trends of progress
under each of the model are alike But in the quality assessment of SHG under
each model the half of SHGs formed under model-II have gone defunct as per their
records and those SHGs are not in touch with the intermediaries and the same in
case of model-III is very efficient and only a meagre percentage of SHGs is
reported as defunct in the district Thus SHGs formed under model-III is well
managed by those intermediaries and more sustainable in comparison to model-II
under study To have precise outcome on the issue of quality and sustainability of
SHGs under each of models a diagrammatic presentation has been made as
follows
216
Figure-317 SHG Model-wise Quality and Sustainability Position of SHGs in terms of Active and Defunct SHGs in Barpeta District
Source Table-38
In year-wise comparison of the active SHGs under each of the SHG models it is
clear that SHGs formed and managed under model-III are more active and
sustainable and that in an average is 9126 percent pa SHGs under this model are
found more active during the period of study in the district and that in case of
model-II is only 5164 percent pa in average during the same period of study in the
district Thus an average gap of 3962 percent pa or SHG model-II is lagging
behind by the same percentage from model-III in the sustainability of SHG during
the period of study
39f Growth Trend of SHGs under SHG Model-II in Barpeta District
The growth trend and position of the SHGs formed under model-II in the district
taking the growth factors of total SHGs formed total all-women SHGs and total
active SHGs the following diagrammatic presentation has been made in figure-
318
2007-08 2008-09 2009-10 2010-11 2011-12
5296 5318 5128 509 4987
8767 8994 9181 9455 9231
Comperative Quality amp Sustainability Position of SHGs in Barpeta District
Active SHGs under Model-II Active SHGs under Model-III
Growth Rate ()
218
The diagram clearly indicates that the growth trend in all the factors are gradually
coming down from 2007-08 to 2011-12 and more importantly the trend line of
active SHG is under all the trend lines presented in the diagram which is very
important to be considered and more important line among all the trend lines
presented in the diagram Thus positions of SHG under model-II are gradually
deteriorating and very poor during 2011-12 in the district and during the period of
study
39g Growth Trend of SHGs under SHG Model-III in Barpeta District
The growth pattern of SHGs in the district under model-III is shown in the figure-
319 and it is clearly understood from the same that the growth was highest during
2008-09 in the periods of study and after that there was sharp fall in the growth
rates in all the factors of SHGs growth rates under consideration but from 2010-11
to 2011-12 a slow progressive growth has been noticed in the diagram which is a
good sign
Growth Rate ()
220
Again the growth rate and trend of active SHG is above all the growth lines in the
figure which is found just reverse under model-II as mentioned earlier Thus from
the two diagrammatic presentations it is clear that by the end of the period under
study all the growth lines under model-II records downwards movement and the
same under model-III records upward movement or in progressive trend
39h Analysing SHG Model-wise Magnitude and Trend of Microfinance in
Barpeta District
The details of microfinance performance under each of the SHG models in the
district are presented in table-39 and it is found from the same that model-III has
performed well in terms of providing more amount of loans to the beneficiaries in
comparison to model-II if we consider the model-wise loaning performance ratio
as given in the table more amount of loans or microfinance has been availed under
model-III in all through the period of study and the average ratio of lending under
these two models comes to 0731 pa during the period of study The amount of
loan disbursed under model-II in 2007-08 was only ` 38685 lakh which at an
average annual growth of 2197 percent reached to `81181 lakh during 2011-12
and in case of loan outstanding with SHG in the district it was an amount of `
157351 lakh in 2007-08 which rose to the balance of loans outstanding to
`256484 lakh thus registered a total growth of 63 percent in period of study But
position of loans disbursed under model-III was ` 122884 lakh in 2007-08 which
with an average annual growth of 1301 percent reached to ` 202850 lakh by
March 2012 in the district including a negative growth of 176 percent in 2011-12
Again about the amount of loans outstanding with SHG in the district it was only
` 131773 lakh in 2007-08 which rose to ` 224699 lakh by March 2012 thus
registered a total growth of 7052 percent during the period of study
222
The all-women SHGs constitute the major share in the district thus an effort was
made to know the amount of loans provided to them and the total amount of loans
provided to those SHG under model-II was ` 144987 lakh in 2007-08 which by
registering an average growth of 2033 percent pa reached to ` 271696 lakh by
March 2012 The same under model-III was ` 199793 lakh in 2007-08 rose with
an average growth of 1818 percent pa and reached to ` 298333 lakh by March
2012 Further the women SHGs are given in an average 7579 percent of the total
amount loans under model-II during the whole period of study and the same under
model-III was in an average of 8589 percent during same period of study in the
district Thus under model-III 1010 percent more amount of loans had been
extended to the all-women SHGs in the district in all through the period of study
Again total amount of loans provided under model-II in the district was ` 196036
lakh in 2007-08 which increased with an average growth rate of 1524 percent pa
and reached to ` 252362 lakh in 2011-12 and the same under model-III was `
254657 lakh in 2007-08 which rose to ` 259989 lakh by recording an average
growth of 1306 percent pa during the entire period of study Surprisingly despite
having such huge volume of SHG under model-II (ie 9099 of the total SHG in
the district) in the district only 4350 percent of the grand total amounts of loans
were provided to SHGs in 2007-08 and that under model-III was 5650 percent to
only 901 percent of the total SHGs of the said period This huge disparity signifies
that the SHGs under model-III were availed more amount of loans and SHGs under
model-II were under-served or extended poor amounts of loan Again if we
consider the same for the year 2011-12 an amount of ` 252362 lakh which is
4227 percent of the grand total amount of loans were extended to the beneficiaries
under model-II in the district and under model-III the same was ` 259989 lakh
which is 5773 percent of the grand total amount of loans provided in the same
period of study The magnitude and trend of microfinance in the district is also
presented with a diagram in figure-320 to understand the scenario more clearly
Amount in Lakh
224
Simply it can be understand from the diagram that in all the factors of loans to the
SHGs performance under model-III is more lucrative and provided more amounts
year after year thus model-III holds better position in the magnitude of loans in
Barpeta district of Assam
39i Analyzing the Comparative Growth Trend of Microfinance under SHG
Model-II and III in Barpeta District
The growth trend of microfinance under each of the SHG models under study
behave and move in reverse way as under model-II the growth trends fluctuate
considerably during the period of study in the district but the growth trends under
model-III slowly progressed from 2007-08 to 2009-10 and thereafter gradually fell
up to the end of the period under study But progress under model-III was almost
steady in comparison to model-II in the same period of study The Comparative
growth position can better be understood from the following diagram which is
prepared taking all the growth rates of loans in Barpeta District in the following
diagram
Growth Rate ()
226
So the growth trends under model-II were negative except in loan disbursed in
2008-09 which reached to the top level in 2009-10 and again fell down in 2010-10
and in 2011-12 consecutively But those under model-III experienced almost a flat
and steady growth during the period of study The growth of loans disbursed under
model-II was 1920 percent in 2007-08 which maintained an average incremental
growth of 2118 percent all through the period but registered a negative growth of
064 percent in 2011-12 The same under model-III was 1833 percent in 2007-08
and recorded an average incremental growth of 1467 percent pa during the period
of study but that stands to 176 percent negative growth in 2011-12 In the case of
growth rate of loans outstanding with the SHGs in the district it was only 1295
percent in 2007-08 which reached to 2270 percent in 2011-12 registering two
negative growths of 2141 and 250 percent respectively in 2008-09 and 2010-11
But under model-III the same was only 432 percent in 2007-08 which reached to
1715 percent in 2011-12 by registering an average growth of 1241 percent pa all
through the period of study and no negative growth had been registered in the
period The growth pattern of loans to all-women SHG is a strong factor in the
district because more than 80 percent SHGs fall under this category and in 2007-
08 it registered a growth of 1555 percent and that also maintained an average
growth of 2033 percent pa all through the period under study and stands at 1507
percent in 2011-12 overcoming a negative growth of 2027 percent in 2008-09
under model-II and the same under model-III was 1840 percent in 2007-08 and
registered an average growth of 1818 percent pa during the period of study and
reached to 1150 percent in 2001-12
Further Intermediaries-wise SHGs Position and Trend with their loans position
during the period of study in Barpeta District under Model-II and III are presented
with the help of following two diagrams
Nos of SHG
Amount in Lakh
229
The outcomes of the above diagrams is very clear as maximum SHGs are formed
under model-II by block intermediaries as shown in figure-322 but availed less
amount of loans to those few percentage of SHGs On the contrary very few
percentage of SHGs are formed under Model-III by NGOsMFIs in the district but
maximum amount of loans are availed towards those SHGs those groups are
getting more loans or frequent loans in comparison to the SHGs formed under
model-II in the district during the period of study that are shown in figure-323
310 Analyzing Comparative Growth Position of SHGs in India Assam and in
Barpeta District under the SHG Models
After going through the positions of microfinance in India Assam and in Barpeta
district as mentioned above where mixed responses are found and to show the
relative position more precisely efforts were made to have comparative study with
the core factor of performance in terms of growth trends of SHGs right from
national level to the district level and that will depict the picture more clearly As
such their performances have been presented with the help of following two
diagrams as follows in figure-324 and figure-325
Growth Rate ()
Growth Rate ()
232
In both the figures given above it is clearly depicted that there is a sharp fall in the
performance of SHGs and loans extended to them from 2009-10 onwards in all
sector of microfinance ie in India Assam and as well in Barpeta District of
Assam The position was favourable from 2007-08 to the 2009-10 as highest
growth rates were recorded during that period as shown in the figures Such drastic
down-fall in both in the growth of SHGs and in microfinance (ie in extending
total amount of loans) during the period had weakened the service of microfinance
spreads and base in the country The incidents that had occurred in Andhra Pradesh
where 30 farmers had committed suicide within a span of 45 days in 2010 after a
few MFIs used coercive recovery tactics (Patra 2011) is a strong reason for such
adverse scenario as after such incidents many financing banks and institutions
stopped financing to MFIs The subsidy provision under SGSY programme also
weakened the base of a group of SHGs which were formed only to take the
benefits of subsidy and not SHGs as a means of self-employment provisions is also
added to the reason of such downfall in the performance of microfinance sector in
our country Again the change of programme from SGSY now to newly introduced
NRLM also concentrate a lot in the change of the functional structures power and
management and also weakens the rapid growth and speeds of microfinance sector
in the country during the period under study
311 Conclusion
During the period under study the performance under microfinance service has
been moved in two way dimensions as in the first half of the period ie from
2007-08 to 2009-10 the performance was in progressive trend in India Assam and
as well in Barpeta district of Assam but in the later part of the period of study the
performance and progress experienced downfall While we consider the magnitude
of microfinance services in Assam in terms of SHG with saving in banks it is
found that only 347 percent SHGs belong to Assam and same is 1879 percent
233
highest in the country in case of Andhra Pradesh by the end of March 2012 The
relative position of Assam in NER is good as Assam occupied 7542 percent of the
total SHGs of the region and that with the amount of savings of `984598 lakh
which stands at 6456 percent of the total amount of savings of NER Thus Assam
is in leading position in the region followed by Tripura and then Meghalaya
(NABARD 2012) In case of amount of loans disbursed to SHGs in 2011-12
Assam is having only 113 percent of the total amount of loans disbursed in India
and among NER it is 4154 percent followed by Tripura and Manipur
On SHG model-wise analysis it is found that SHG-bank linkage models (together
SHG Model-I amp II) remain in dominant position in terms of volume of SHGs and
absolute amount of loans availed to SHGs in the country than MFI-bank linkage
model (ie SHG Model-III) during the period of study But in Barpeta District of
Assam some variation in the model-wise performance has been found during the
period of study as model-II is found popular and covered more number of members
and is able to form more numbers of SHGs in comparison to that of under model-
III As of the total SHGs in the district 8975 percent are formed under model-II
and only1025 percent SHGs are under model-III in 2011-12 Again total amount
of loans given to SHGs under model-II in the same period was ` 337665 lakh
which was 4413 percent of the grand total amount of loans under both the models
and the rest 5587 percent were given to only 1025 percent of the total SHGs in
the district Thus SHGs under model-III are given more amount of loans or
frequent loans in comparison to the SHG under model-II in the district during the
period of study In terms of growth factors under each of these two models growth
trends under model-II both in case of SHG and in amount of loans to them more
fluctuations or ups and downs were recorded during the period of study and by the
end of the period particularly in 2010-11 and 2011-12 the growth trends were
down-falling in the district But the same under model-III were almost steady
during the period of study with a bit high in 2009-10 and a bit low in latter part of
the period of study particularly in 2010-11 to 2011-12 in the district Again in
234
terms of sustainability of SHGs formed under each of the SHG models also varies
a lot The SHGs formed managed and financed under model-II are half in an
average of the total are defunct SHGs and only 50 percent of them survive or are
functional in the district but the same under model-III is found more than 91
percent as active and functional during the period of study in the district Thus
over-all performance of SHGs under SHG model-III in the district during the period
of study is better than SHGs under model-II in respect of service quantum of
loans growth trends and sustainability etc
References
(2006) Statistical Hand Book of Assam Guwahati Directorate of Economics and
Statistics Government of Assam
Asif M (2011 November) Role of NGOs in India YOJANA 55 pp 8-10
Bandhan (nd) Bandhan Hope for the Poor Product Information Broucher of Bandhan
West Bengal India Bandhan
Baruah P B (2012) Impact of Microfinance on Poverty A Study of Twenty Self-Help
Groups in Nalbari District Assam Journal of Rural Development 31(2) 223-234
Bharali S (2010 July 18) An Institute Promotion of Secure Sustainable Livelihood
ASOMI Barta 6(6)
Borbora S amp Sarma G K (nd) Microfinance Institutions Sustainability and Outreach
Retrieved May 2 2014 from httpwwwwbiconprocom314-borborapdf
CGAP (nd) Consultative Group to Assist the Poor Retrieved from wwwcgaporg
Chatterjee N amp Dar M A (2011 November) Role of NGOs in Rural Development
YOJANA 55 pp 17-20
Chief Ministers Micro Finance Scheme-Assam Financial Corporation (CMMFS) Khudra
Reen (nd) Retrieved May 1 2014 from httpwwwafconlinegovin
documentbroucherpdf
Chief Ministers Micro Finance Schemes- Assam Financial Corporation (nd) Retrieved
May 1 2014 from httpwwwafconlinegovinpdfmfnbbrochure Englishpdf
Das D (nd) Informal Microfinance in Assam Empirical Evidence from Nalbari and
Baksa Districts Retrieved November 2013 from IFMR Centre for Microfinance
235
Research httpwwwifmrleadorgcmfwp-contentuploadsattachmentscsy1685
informal20MF20in20Assampdf
Das K (2012 January- March) Financial Inclusion-A Gateway to Sustainable
Development for the Impoverished Journal of Rural Development NIRD 31(1)
115-128
Das R L Dutta D N Kakoti P amp Deka S N (2011) Rural and Microfinance
Guwahati BLJ Publication
Deb B (2012) Microfinance and Poverty Alleviation A Case Study on Rgvn-Csp Indian
Journal of Applied Research 71-74
Desai V (2005) NGOs Gender Mainstreaming and Urban Communities in Mumbai
Gender and Development 13(2) 90-98
Devi M (2012 January 20) Rural Industrialisation for Development The Assam Tribune
Guwahati p 6
Dhar P K (2009) The Economy of Assam Including Economy of Narth East India New
Delhi Kalyani Publishers
Dutta J amp Upadhaya M (2013 August 23) Green Microfinance for Eco-friendly
Development The Assam Tribune (English Daily News Paper) p 6
Economic Survey Assam 2011-12 (nd) Retrieved April 30 2014 from
httpwwwecostatassamnicinads_economic20survey-2011-12pdf
Executive Summary Part-I An Overview of State Focus Paper 2006-07 (nd) Retrieved
April 30 2014 from httpwwwnabardorgpdfAssam20EXECUTIVE
20SUMMARYpdf
Gadiapannivar R D (nd) IFMR Centre for Microfinance Retrieved November 2013
from wwwifmracincmf httpwwwifmrleadorgcmf
Ghosh M (2012 July-Sept) Microfinance and Rural Poverty in India SHG-Bank Linkage
Programme Journal of Rural Development 31(3) 347-363
Gogoi P (2013) Economic Empowerment of Rural Women Through Income Generating
Activities In B M Doley (Ed) Women in Rural Development (Seminar Volume)
(pp 36-45) Guwahati Publication Board Silapathar College Dhemaji Assam
IIBF (2010) Rural Banking New Delhi Indian Institute of Banking amp Finance by
Macmillion
Khanka S S (2010) Microfinance in India From Evolution to Revolution In J U
Ahmed D Bhagat amp G Singaiah (Eds) Microfinance in India Issues and
Challenges (pp 3-14) Guwahati DVs Publications
236
Lalitha N (2011 February) Sustainable Management of Local Resources YOJANA 55
pp 32-35
Mathaw J amp Verghese J (2011 November) Non Governmental Organisation in India
YOJANA 55 pp 12-14
NABARD (2012) Status of Microfinance in India 2011-12 Mumbai NABARD
NRLM (nd) NRLM Procurement Manual- Ministry of Rural Development Retrieved
May 1 2014 from httpruralnicinsitesdownloadslatestNRLM
20Procurement20Manualpdf
Patra D R (2011 December) Death of Microfinance in India BFM Banking Finance
Markets A Planman Financial-IIPM Think Tank Publication 1(10) pp 28-33
RBI (nd) Quarterly Statistics on Deposits and Credit of Schedule Commercial Banks
March 2007 to March 2011 Mumbai Reserve Bank of India
Roy A (nd) Microfinance and Rural Development in the North East India Retrieved
December 2013 from httpwwwpbrcoinBrochure0006pdf
Sarmah V (2010) Microfinance Vission 2015 Northeast Region India Retrieved July
2013 from httpwwwaccessdevorgdownloadsmicrofinance_vision_2015pdf
SGSY (2010) Swarnjayanti Gram Swarozgar Yojana (SGSY) Retrieved May 1 2014
from httpwwwcsjpgoaorgwp-contentuploads201010sjgsypdf
Sharma A K (2011 December) Micro Finance in the North East YOJANA pp 8-10
Shodhganga (nd) Chapter-3 Microfinance Trends Problems and Prospects Retrieved
June 2013 from httpshodhgangainflibnetacinbitstream10603303111
n_chapter203pdf
Srinivasan N (2009) Microfinance India State of the Sector Report 2009 Delhi
ACCESS Sage
Sundaram I S (2007) Microfinance in India Delhi BR Publishing Corporation
Tribune A (2007 May 7) Self-help Groups and Rural Development The Assam Tribune
Guwahati p 6
Vikash (2008 March) About the Issue Microfinance Focus II(IV) 3
Yunus M amp Jolis A (2007) Banker To The Poor The Story of the Grameen Bank New
Delhi Penguin Books
----0----

Growth Rate ()
199
Poor people used to borrow from the money lenders or from local capitalist mostly
by mortgaging their valuables like jewellery lands cattle etc as security for the
loan credit Most of them basically borrowed consumption type loans or loans in
case of acute needs of the family with very high rate of interest which even stood
more than the principal sum of money they borrowed (IIBF 2010) (Yunus 2007)
So history of microfinance in Barpeta District of Assam had no exceptions from
the rest of the country The cooperative system was an initiation in the field of
financial service for the poor in Assam and as well in Barpeta District and the role
of rural credit cooperative have some impact in the life of rural people though is
unable to bring such revolution among the rural people in the villages and of remote
areas
If we concentrate on the movement or start-up of microfinance services in the
district then it is after the introduction of SGSY programme the major poverty
alleviation programme of GOI in the 2000 but as reported by the district official
from 2004-05 the programme start progressing by forming SHGs in voluminous
manner and prior to that the progress was not impressive Considering the fact the
researcher considers the period of study from 2007-08 to 2011-12 ie for five
years and the progress and performance under the SHG models of microfinance of
the said period only have been shown in this study Again under the SHG models
three SHG-credit linkage models exist but in Barpeta district no such SHG were
found during the field survey who are directly formed and nurtured by the banks in
the district which comes under SHG model-I Limited bank branches works
overload limited banks staffs lack of interest of banks etc are some of the general
reasons for non-operational of model-I in the district As such the present study is
confine to the rest of the two models ie SHG Model-II and SHG Model-III in
Barpeta District of Assam The detailed information and data of microfinance
relating to the study about Barpeta District are presented in the following table
201
39a Magnitude and Progress of SHG in Barpeta District
Total SHGs linked to Banks and MFIs of the District up to the end of March 2012
has grown to 15 477 which was 11346 SHGs during 2007-08 thus the same
recorded a total growth of 3641 percent and an average growth of 728 percent pa
during the period of study in linking SHG together under SHG model-II and III
The least growth rate recorded during the period was 555 percent in the year 2011-
12 The position of all-women SHGs in Barpeta District is impressive and having
reached beyond the national average of 80 percent (NABARD 2012) Women
members occupied the lion share in microfinance in the district as all-women
SHGs in the District have increased to 15261 of the total SHGs up to March 2012
which is 9860 percent of total SHGs of the district The position of all-women
SHG in the district in 2007-08 was comparatively a bit poor as there was 10952
SHGs and that stood to 9653 percent of the total SHG of that year Thus total
growth of all- women SHGs in the district comes to 3934 percent in the five years
with an average growth of 787 percent pa A diagrammatic presentation has been
made with the help of total SHGs all-women SHGs and active SHGs in figure-
312 to show the magnitude and progress of SHGs in Barpeta District and it is
found that during the period of study SHGs in the district records slow progress
year after year almost at the same rate of growth in all the factors of SHG Of the
total SHG only 8392 SHGs are reported as Active30 SHG in the district and that is
only 5422 percent of the total SHG Thus near to half of the total SHGs in the
district are found defunct and those SHGs are no longer in existence or not
interested in SHG activities As reported by the intermediaries of microfinance in
the district most of those defunct SHGs were formed with the intention to take the
benefits of subsidy and while they found no more subsidies they stopped working
and their SHGs became inactive
30Active amp defunct SHGs here recorded as per the records and information of SHGs intermediaries of Barpeta District
202
A diagrammatic presentation has been made with help of total SHGs comparing
with all-women SHGs and active SHGs in the district during the period of study as
follows
Figure-312 Total All-Women and Active SHGs Positions in Barpeta District of Assam from 2007-08 to 2011-12
Source Table-37
So it can be observed from the above diagram that a steady incremental trend and
progress have been recorded during the period of study in the district in all the
factors of SHG and most importantly no abnormal fluctuation has been recorded
during the period of study
39b Growth Trend of SHG in Barpeta District
While SHGs growth position is considered the growth trend of the same have
gradually come down from 2007-08 to 2011-12 which can be viewed from the
following in figure-313 which is prepared taking the growth rates of the total all-
women and active SHGs of Barpeta District
0
20004000
6000
8000
1000012000
14000
16000
2007-08 2008-09 2009-10 2010-11 2011-12
SHGs of Barpeta District of Assam
Total Nos of SHG All Women SHG Total Active SHG
Growth Rate ()
204
It is clearly depicted in the above diagram that the SHG growth rate and position
have come down from 2009-10 onwards and those growth rates come even below
10 percent in the district the growth rates was maximum in 2008-09 as viewed in
the above diagram The position of active SHGs in terms of growth during the
period of study recorded a total growth of 3610 and an average growth of 722
percent pa in the study period But the growth rate of the same was very poor as
376 percent during 2011-12 Thus growth rate of active SHGs come down during
2011-12 even below the average rate This indicates the slow progress in the
formation and leaves question marks to the sustainability of SHGs in the district
owing to the poor management limited credit flow subsidy provision under SGSY
rural people participation in NREGA etc in the district has weaken the
performance
39c Magnitude of Loans Provided under SHG Models in Barpeta District
The total amount of loans availed to the beneficiaries or SHG members in Barpeta
District occupy only 936 percent of the total amount of loans availed in Assam
comprising of loans disbursed and loans outstanding during 2011-12 The share of
district in the state were same with little difference in the whole period of study as
it was 1362 percent in 2007-08 the highest score in period under study 952
percent in 2008-09 900 percent in 2009-10 and 929 percent in 2010-11 and those
with an average share of 1016 percent pa during the five years period under
study31 The amounts of loans disbursed to the SHGs in the district were `161569
lakh in 2007-08 which with an average incremental growth of 3039 percent pa
reached to `284031 lakh by March 2012 with the exception of negative growth
of 144 percent during 2011-12 during the period of study As regards amount of
loans outstanding with SHGs in the district the records reveal that it was ` 289089
31The share total amount of loans availed during the period under study are calculated taking the figures of total loans of Assam and of Barpeta District year after year from Table-36 amp 37 as mentioned above
205
lakh in 2007-08 and the amount of loans outstanding balance rose to `481183 lakh
which seems near to double by the end of March 2012 thus recognising
considerable growth in financing during the period of study All-women SHGs
constitute the lion share in the district and of the total amount of loans given to all-
women SHGs 8174 percent pa are provided only to those SHGs in the district
with little variation during the period of study A diagrammatic presentation has
been made with the help of amount of total loans loans to all-women SHG loans
disbursed and loans outstanding to have a clear picture about the magnitude of
microfinance in the district during the period of study which is as follows
Amount in lakh
207
It can be observed from the diagram that the position of loan factors is gradually
increasing maintaining the same sequence and rate year after year during the
period of study thus the loan factors are normally growing which is a healthy sign
of development of microfinance position and services in the district
39d Analyzing the Growth Trend of Loans under SHG Models in Barpeta
District
To know the actual picture of performance and progress of microfinance more
precisely in the district through its lending to the SHGs under the SHG models
effort were made to find out the growth pattern of loans availed to SHGs during the
period under study with the help of diagram as given in figure-315 It is depicted in
the same that considerable ups and downs have been recorded in the growth rates
among the loan factors during the period of study in the district and in some cases
negative rates of growth have also occurred
Growth Rate ()
209
The amount of loan disbursed to the SHGs during year 2011-12 was `284031
lakh and that recorded a total growth in disbursing loans to SHGs from 2007-08 to
2011-12 of 13364 percent with an average growth of 2673 percent pa during the
period of study But during 2011-12 the rate of growth of the same was negative to
144 percent in the district Again the amount of loan outstanding with the SHGs in
the district up to March 2012 was `481183 lakh which recorded a total growth
of 6645 percent and an average growth of 1329 percent pa during the period of
study The growth of loans outstanding was negative in 2008-09 and highest in
2009-10 to 4630 percent again fell in 2010-11 and increased a little in 2011-12
As all-women SHGs have occupied the lion share in the district and up to March
2012 the total amount of loans disbursed to those SHGs were ` 658773 lakh and
that recorded a total growth of 9109 percent with an average growth of 1822
percent pa during the period of study Of the total amount of loans maximum
amount of loans are availed to the all-women SHG in the district which in average
was 8174 percent pa during the period of study Further of the total amount of
loans availed (ie loans disbursed and loans outstanding) against the SHGs in the
district recorded a total growth of 8634 percent in five years with an average
growth of 1727 percent pa during the period of study
39e Analyzing SHG Model-wise performance of SHGs in Barpeta District
As among the three SHG-credit linkage models SHG Model-II and Model-III are
functional in the district and no such SHGs were found which are directly formed
under Model-I as such analysis of this part are confine to the models which are
operating and functional in the Barperta District Again details as regards SHG
models have already been mentioned in chapter-1 but for the sake of convenience a
brief outline of two functional models in the district are given below
210
SHG Model-II Under this model SHGs are formed and nurtured by the
intermediaries which includes GOs and NGOs and after a certain period and on
satisfactory performance in group management and group funds handling (ie
savings of members) they are being linked to banks for loans In Barpeta District
the task of formation nurturing linking etc of SHGs under SHG Model-II are
performed under the blocks by the Blocks official at the block and village level and
after their satisfaction and scrutiny about the performance of the group they send it
to the DRDA office for the approval and sanction of loans While assessing the
performance of SHGs (the Blocks official and sometimes persons from banks also
join in the process) for grading the SHGs on their performance on the basis of
some parameters where they mainly consider the following five points of SHG and
(ie five point formula) for grading
and promotion of SHG and includes
1 Weekly Meeting
2 Weekly Savings
3 Internal Credit
4 Recovery of Internal Credit
5 Records keeping
On satisfactory performance evaluation the list of SHGs are sent to DRDA for the
sanction of loan and DRDA may call some groups for talking if they feel the need
and after their needful verification they send the list of SHGs to the banks and a
copy to the respective blocks for record keeping and the groups are availed loans
through banks thus the groups are being linked with bank branches
SHG Model-III Under this model some NGOs and MFIs as intermediaries avail
bulk amount of loan from various funding institutionsbanks for on lending to the
groups The intermediaries take care of the groups in all respect and directly finance
the groups The groups in return have to follow the instruction of those
211
intermediaries and have to repay the loan as per the time and size of installment
fixed by them In Barpeta District ASOMI Bandhan RGVN are the leading MFIs
dealing with SHGs to provide micro-credit under this model The selection
procedure promotion criteria etc of SHG depends upon the intermediary which
slightly varies among the service providing intermediaries but the basic objectives
remain same
A detailed SHG model-wise break-up of SHGs in the district are given in the
following table
213
If we consider the model-wise SHG formation performance in the district more
numbers of SHG are being formed under model-II than model-III and that in terms
of ratio which was 1010 1 in 2007-08 and that has improved a little towards
model-III and in 2011-12 the ratio of SHG formation stands at 8761 under
model-II to III An analytical diagrammatic presentation has been made to show the
performance in the formation of SHGs under each of the models as follow
215
From the above it can be easily understood that more SHGs were formed under
SHG model-II in comparison to the model-III but in both the models the trend of
formation of SHGs are common during the period The quantum of all-women
SHG formed under each model is high and different but their trends of progress
under each of the model are alike But in the quality assessment of SHG under
each model the half of SHGs formed under model-II have gone defunct as per their
records and those SHGs are not in touch with the intermediaries and the same in
case of model-III is very efficient and only a meagre percentage of SHGs is
reported as defunct in the district Thus SHGs formed under model-III is well
managed by those intermediaries and more sustainable in comparison to model-II
under study To have precise outcome on the issue of quality and sustainability of
SHGs under each of models a diagrammatic presentation has been made as
follows
216
Figure-317 SHG Model-wise Quality and Sustainability Position of SHGs in terms of Active and Defunct SHGs in Barpeta District
Source Table-38
In year-wise comparison of the active SHGs under each of the SHG models it is
clear that SHGs formed and managed under model-III are more active and
sustainable and that in an average is 9126 percent pa SHGs under this model are
found more active during the period of study in the district and that in case of
model-II is only 5164 percent pa in average during the same period of study in the
district Thus an average gap of 3962 percent pa or SHG model-II is lagging
behind by the same percentage from model-III in the sustainability of SHG during
the period of study
39f Growth Trend of SHGs under SHG Model-II in Barpeta District
The growth trend and position of the SHGs formed under model-II in the district
taking the growth factors of total SHGs formed total all-women SHGs and total
active SHGs the following diagrammatic presentation has been made in figure-
318
2007-08 2008-09 2009-10 2010-11 2011-12
5296 5318 5128 509 4987
8767 8994 9181 9455 9231
Comperative Quality amp Sustainability Position of SHGs in Barpeta District
Active SHGs under Model-II Active SHGs under Model-III
Growth Rate ()
218
The diagram clearly indicates that the growth trend in all the factors are gradually
coming down from 2007-08 to 2011-12 and more importantly the trend line of
active SHG is under all the trend lines presented in the diagram which is very
important to be considered and more important line among all the trend lines
presented in the diagram Thus positions of SHG under model-II are gradually
deteriorating and very poor during 2011-12 in the district and during the period of
study
39g Growth Trend of SHGs under SHG Model-III in Barpeta District
The growth pattern of SHGs in the district under model-III is shown in the figure-
319 and it is clearly understood from the same that the growth was highest during
2008-09 in the periods of study and after that there was sharp fall in the growth
rates in all the factors of SHGs growth rates under consideration but from 2010-11
to 2011-12 a slow progressive growth has been noticed in the diagram which is a
good sign
Growth Rate ()
220
Again the growth rate and trend of active SHG is above all the growth lines in the
figure which is found just reverse under model-II as mentioned earlier Thus from
the two diagrammatic presentations it is clear that by the end of the period under
study all the growth lines under model-II records downwards movement and the
same under model-III records upward movement or in progressive trend
39h Analysing SHG Model-wise Magnitude and Trend of Microfinance in
Barpeta District
The details of microfinance performance under each of the SHG models in the
district are presented in table-39 and it is found from the same that model-III has
performed well in terms of providing more amount of loans to the beneficiaries in
comparison to model-II if we consider the model-wise loaning performance ratio
as given in the table more amount of loans or microfinance has been availed under
model-III in all through the period of study and the average ratio of lending under
these two models comes to 0731 pa during the period of study The amount of
loan disbursed under model-II in 2007-08 was only ` 38685 lakh which at an
average annual growth of 2197 percent reached to `81181 lakh during 2011-12
and in case of loan outstanding with SHG in the district it was an amount of `
157351 lakh in 2007-08 which rose to the balance of loans outstanding to
`256484 lakh thus registered a total growth of 63 percent in period of study But
position of loans disbursed under model-III was ` 122884 lakh in 2007-08 which
with an average annual growth of 1301 percent reached to ` 202850 lakh by
March 2012 in the district including a negative growth of 176 percent in 2011-12
Again about the amount of loans outstanding with SHG in the district it was only
` 131773 lakh in 2007-08 which rose to ` 224699 lakh by March 2012 thus
registered a total growth of 7052 percent during the period of study
222
The all-women SHGs constitute the major share in the district thus an effort was
made to know the amount of loans provided to them and the total amount of loans
provided to those SHG under model-II was ` 144987 lakh in 2007-08 which by
registering an average growth of 2033 percent pa reached to ` 271696 lakh by
March 2012 The same under model-III was ` 199793 lakh in 2007-08 rose with
an average growth of 1818 percent pa and reached to ` 298333 lakh by March
2012 Further the women SHGs are given in an average 7579 percent of the total
amount loans under model-II during the whole period of study and the same under
model-III was in an average of 8589 percent during same period of study in the
district Thus under model-III 1010 percent more amount of loans had been
extended to the all-women SHGs in the district in all through the period of study
Again total amount of loans provided under model-II in the district was ` 196036
lakh in 2007-08 which increased with an average growth rate of 1524 percent pa
and reached to ` 252362 lakh in 2011-12 and the same under model-III was `
254657 lakh in 2007-08 which rose to ` 259989 lakh by recording an average
growth of 1306 percent pa during the entire period of study Surprisingly despite
having such huge volume of SHG under model-II (ie 9099 of the total SHG in
the district) in the district only 4350 percent of the grand total amounts of loans
were provided to SHGs in 2007-08 and that under model-III was 5650 percent to
only 901 percent of the total SHGs of the said period This huge disparity signifies
that the SHGs under model-III were availed more amount of loans and SHGs under
model-II were under-served or extended poor amounts of loan Again if we
consider the same for the year 2011-12 an amount of ` 252362 lakh which is
4227 percent of the grand total amount of loans were extended to the beneficiaries
under model-II in the district and under model-III the same was ` 259989 lakh
which is 5773 percent of the grand total amount of loans provided in the same
period of study The magnitude and trend of microfinance in the district is also
presented with a diagram in figure-320 to understand the scenario more clearly
Amount in Lakh
224
Simply it can be understand from the diagram that in all the factors of loans to the
SHGs performance under model-III is more lucrative and provided more amounts
year after year thus model-III holds better position in the magnitude of loans in
Barpeta district of Assam
39i Analyzing the Comparative Growth Trend of Microfinance under SHG
Model-II and III in Barpeta District
The growth trend of microfinance under each of the SHG models under study
behave and move in reverse way as under model-II the growth trends fluctuate
considerably during the period of study in the district but the growth trends under
model-III slowly progressed from 2007-08 to 2009-10 and thereafter gradually fell
up to the end of the period under study But progress under model-III was almost
steady in comparison to model-II in the same period of study The Comparative
growth position can better be understood from the following diagram which is
prepared taking all the growth rates of loans in Barpeta District in the following
diagram
Growth Rate ()
226
So the growth trends under model-II were negative except in loan disbursed in
2008-09 which reached to the top level in 2009-10 and again fell down in 2010-10
and in 2011-12 consecutively But those under model-III experienced almost a flat
and steady growth during the period of study The growth of loans disbursed under
model-II was 1920 percent in 2007-08 which maintained an average incremental
growth of 2118 percent all through the period but registered a negative growth of
064 percent in 2011-12 The same under model-III was 1833 percent in 2007-08
and recorded an average incremental growth of 1467 percent pa during the period
of study but that stands to 176 percent negative growth in 2011-12 In the case of
growth rate of loans outstanding with the SHGs in the district it was only 1295
percent in 2007-08 which reached to 2270 percent in 2011-12 registering two
negative growths of 2141 and 250 percent respectively in 2008-09 and 2010-11
But under model-III the same was only 432 percent in 2007-08 which reached to
1715 percent in 2011-12 by registering an average growth of 1241 percent pa all
through the period of study and no negative growth had been registered in the
period The growth pattern of loans to all-women SHG is a strong factor in the
district because more than 80 percent SHGs fall under this category and in 2007-
08 it registered a growth of 1555 percent and that also maintained an average
growth of 2033 percent pa all through the period under study and stands at 1507
percent in 2011-12 overcoming a negative growth of 2027 percent in 2008-09
under model-II and the same under model-III was 1840 percent in 2007-08 and
registered an average growth of 1818 percent pa during the period of study and
reached to 1150 percent in 2001-12
Further Intermediaries-wise SHGs Position and Trend with their loans position
during the period of study in Barpeta District under Model-II and III are presented
with the help of following two diagrams
Nos of SHG
Amount in Lakh
229
The outcomes of the above diagrams is very clear as maximum SHGs are formed
under model-II by block intermediaries as shown in figure-322 but availed less
amount of loans to those few percentage of SHGs On the contrary very few
percentage of SHGs are formed under Model-III by NGOsMFIs in the district but
maximum amount of loans are availed towards those SHGs those groups are
getting more loans or frequent loans in comparison to the SHGs formed under
model-II in the district during the period of study that are shown in figure-323
310 Analyzing Comparative Growth Position of SHGs in India Assam and in
Barpeta District under the SHG Models
After going through the positions of microfinance in India Assam and in Barpeta
district as mentioned above where mixed responses are found and to show the
relative position more precisely efforts were made to have comparative study with
the core factor of performance in terms of growth trends of SHGs right from
national level to the district level and that will depict the picture more clearly As
such their performances have been presented with the help of following two
diagrams as follows in figure-324 and figure-325
Growth Rate ()
Growth Rate ()
232
In both the figures given above it is clearly depicted that there is a sharp fall in the
performance of SHGs and loans extended to them from 2009-10 onwards in all
sector of microfinance ie in India Assam and as well in Barpeta District of
Assam The position was favourable from 2007-08 to the 2009-10 as highest
growth rates were recorded during that period as shown in the figures Such drastic
down-fall in both in the growth of SHGs and in microfinance (ie in extending
total amount of loans) during the period had weakened the service of microfinance
spreads and base in the country The incidents that had occurred in Andhra Pradesh
where 30 farmers had committed suicide within a span of 45 days in 2010 after a
few MFIs used coercive recovery tactics (Patra 2011) is a strong reason for such
adverse scenario as after such incidents many financing banks and institutions
stopped financing to MFIs The subsidy provision under SGSY programme also
weakened the base of a group of SHGs which were formed only to take the
benefits of subsidy and not SHGs as a means of self-employment provisions is also
added to the reason of such downfall in the performance of microfinance sector in
our country Again the change of programme from SGSY now to newly introduced
NRLM also concentrate a lot in the change of the functional structures power and
management and also weakens the rapid growth and speeds of microfinance sector
in the country during the period under study
311 Conclusion
During the period under study the performance under microfinance service has
been moved in two way dimensions as in the first half of the period ie from
2007-08 to 2009-10 the performance was in progressive trend in India Assam and
as well in Barpeta district of Assam but in the later part of the period of study the
performance and progress experienced downfall While we consider the magnitude
of microfinance services in Assam in terms of SHG with saving in banks it is
found that only 347 percent SHGs belong to Assam and same is 1879 percent
233
highest in the country in case of Andhra Pradesh by the end of March 2012 The
relative position of Assam in NER is good as Assam occupied 7542 percent of the
total SHGs of the region and that with the amount of savings of `984598 lakh
which stands at 6456 percent of the total amount of savings of NER Thus Assam
is in leading position in the region followed by Tripura and then Meghalaya
(NABARD 2012) In case of amount of loans disbursed to SHGs in 2011-12
Assam is having only 113 percent of the total amount of loans disbursed in India
and among NER it is 4154 percent followed by Tripura and Manipur
On SHG model-wise analysis it is found that SHG-bank linkage models (together
SHG Model-I amp II) remain in dominant position in terms of volume of SHGs and
absolute amount of loans availed to SHGs in the country than MFI-bank linkage
model (ie SHG Model-III) during the period of study But in Barpeta District of
Assam some variation in the model-wise performance has been found during the
period of study as model-II is found popular and covered more number of members
and is able to form more numbers of SHGs in comparison to that of under model-
III As of the total SHGs in the district 8975 percent are formed under model-II
and only1025 percent SHGs are under model-III in 2011-12 Again total amount
of loans given to SHGs under model-II in the same period was ` 337665 lakh
which was 4413 percent of the grand total amount of loans under both the models
and the rest 5587 percent were given to only 1025 percent of the total SHGs in
the district Thus SHGs under model-III are given more amount of loans or
frequent loans in comparison to the SHG under model-II in the district during the
period of study In terms of growth factors under each of these two models growth
trends under model-II both in case of SHG and in amount of loans to them more
fluctuations or ups and downs were recorded during the period of study and by the
end of the period particularly in 2010-11 and 2011-12 the growth trends were
down-falling in the district But the same under model-III were almost steady
during the period of study with a bit high in 2009-10 and a bit low in latter part of
the period of study particularly in 2010-11 to 2011-12 in the district Again in
234
terms of sustainability of SHGs formed under each of the SHG models also varies
a lot The SHGs formed managed and financed under model-II are half in an
average of the total are defunct SHGs and only 50 percent of them survive or are
functional in the district but the same under model-III is found more than 91
percent as active and functional during the period of study in the district Thus
over-all performance of SHGs under SHG model-III in the district during the period
of study is better than SHGs under model-II in respect of service quantum of
loans growth trends and sustainability etc
References
(2006) Statistical Hand Book of Assam Guwahati Directorate of Economics and
Statistics Government of Assam
Asif M (2011 November) Role of NGOs in India YOJANA 55 pp 8-10
Bandhan (nd) Bandhan Hope for the Poor Product Information Broucher of Bandhan
West Bengal India Bandhan
Baruah P B (2012) Impact of Microfinance on Poverty A Study of Twenty Self-Help
Groups in Nalbari District Assam Journal of Rural Development 31(2) 223-234
Bharali S (2010 July 18) An Institute Promotion of Secure Sustainable Livelihood
ASOMI Barta 6(6)
Borbora S amp Sarma G K (nd) Microfinance Institutions Sustainability and Outreach
Retrieved May 2 2014 from httpwwwwbiconprocom314-borborapdf
CGAP (nd) Consultative Group to Assist the Poor Retrieved from wwwcgaporg
Chatterjee N amp Dar M A (2011 November) Role of NGOs in Rural Development
YOJANA 55 pp 17-20
Chief Ministers Micro Finance Scheme-Assam Financial Corporation (CMMFS) Khudra
Reen (nd) Retrieved May 1 2014 from httpwwwafconlinegovin
documentbroucherpdf
Chief Ministers Micro Finance Schemes- Assam Financial Corporation (nd) Retrieved
May 1 2014 from httpwwwafconlinegovinpdfmfnbbrochure Englishpdf
Das D (nd) Informal Microfinance in Assam Empirical Evidence from Nalbari and
Baksa Districts Retrieved November 2013 from IFMR Centre for Microfinance
235
Research httpwwwifmrleadorgcmfwp-contentuploadsattachmentscsy1685
informal20MF20in20Assampdf
Das K (2012 January- March) Financial Inclusion-A Gateway to Sustainable
Development for the Impoverished Journal of Rural Development NIRD 31(1)
115-128
Das R L Dutta D N Kakoti P amp Deka S N (2011) Rural and Microfinance
Guwahati BLJ Publication
Deb B (2012) Microfinance and Poverty Alleviation A Case Study on Rgvn-Csp Indian
Journal of Applied Research 71-74
Desai V (2005) NGOs Gender Mainstreaming and Urban Communities in Mumbai
Gender and Development 13(2) 90-98
Devi M (2012 January 20) Rural Industrialisation for Development The Assam Tribune
Guwahati p 6
Dhar P K (2009) The Economy of Assam Including Economy of Narth East India New
Delhi Kalyani Publishers
Dutta J amp Upadhaya M (2013 August 23) Green Microfinance for Eco-friendly
Development The Assam Tribune (English Daily News Paper) p 6
Economic Survey Assam 2011-12 (nd) Retrieved April 30 2014 from
httpwwwecostatassamnicinads_economic20survey-2011-12pdf
Executive Summary Part-I An Overview of State Focus Paper 2006-07 (nd) Retrieved
April 30 2014 from httpwwwnabardorgpdfAssam20EXECUTIVE
20SUMMARYpdf
Gadiapannivar R D (nd) IFMR Centre for Microfinance Retrieved November 2013
from wwwifmracincmf httpwwwifmrleadorgcmf
Ghosh M (2012 July-Sept) Microfinance and Rural Poverty in India SHG-Bank Linkage
Programme Journal of Rural Development 31(3) 347-363
Gogoi P (2013) Economic Empowerment of Rural Women Through Income Generating
Activities In B M Doley (Ed) Women in Rural Development (Seminar Volume)
(pp 36-45) Guwahati Publication Board Silapathar College Dhemaji Assam
IIBF (2010) Rural Banking New Delhi Indian Institute of Banking amp Finance by
Macmillion
Khanka S S (2010) Microfinance in India From Evolution to Revolution In J U
Ahmed D Bhagat amp G Singaiah (Eds) Microfinance in India Issues and
Challenges (pp 3-14) Guwahati DVs Publications
236
Lalitha N (2011 February) Sustainable Management of Local Resources YOJANA 55
pp 32-35
Mathaw J amp Verghese J (2011 November) Non Governmental Organisation in India
YOJANA 55 pp 12-14
NABARD (2012) Status of Microfinance in India 2011-12 Mumbai NABARD
NRLM (nd) NRLM Procurement Manual- Ministry of Rural Development Retrieved
May 1 2014 from httpruralnicinsitesdownloadslatestNRLM
20Procurement20Manualpdf
Patra D R (2011 December) Death of Microfinance in India BFM Banking Finance
Markets A Planman Financial-IIPM Think Tank Publication 1(10) pp 28-33
RBI (nd) Quarterly Statistics on Deposits and Credit of Schedule Commercial Banks
March 2007 to March 2011 Mumbai Reserve Bank of India
Roy A (nd) Microfinance and Rural Development in the North East India Retrieved
December 2013 from httpwwwpbrcoinBrochure0006pdf
Sarmah V (2010) Microfinance Vission 2015 Northeast Region India Retrieved July
2013 from httpwwwaccessdevorgdownloadsmicrofinance_vision_2015pdf
SGSY (2010) Swarnjayanti Gram Swarozgar Yojana (SGSY) Retrieved May 1 2014
from httpwwwcsjpgoaorgwp-contentuploads201010sjgsypdf
Sharma A K (2011 December) Micro Finance in the North East YOJANA pp 8-10
Shodhganga (nd) Chapter-3 Microfinance Trends Problems and Prospects Retrieved
June 2013 from httpshodhgangainflibnetacinbitstream10603303111
n_chapter203pdf
Srinivasan N (2009) Microfinance India State of the Sector Report 2009 Delhi
ACCESS Sage
Sundaram I S (2007) Microfinance in India Delhi BR Publishing Corporation
Tribune A (2007 May 7) Self-help Groups and Rural Development The Assam Tribune
Guwahati p 6
Vikash (2008 March) About the Issue Microfinance Focus II(IV) 3
Yunus M amp Jolis A (2007) Banker To The Poor The Story of the Grameen Bank New
Delhi Penguin Books
----0----

Growth Rate ()
204
It is clearly depicted in the above diagram that the SHG growth rate and position
have come down from 2009-10 onwards and those growth rates come even below
10 percent in the district the growth rates was maximum in 2008-09 as viewed in
the above diagram The position of active SHGs in terms of growth during the
period of study recorded a total growth of 3610 and an average growth of 722
percent pa in the study period But the growth rate of the same was very poor as
376 percent during 2011-12 Thus growth rate of active SHGs come down during
2011-12 even below the average rate This indicates the slow progress in the
formation and leaves question marks to the sustainability of SHGs in the district
owing to the poor management limited credit flow subsidy provision under SGSY
rural people participation in NREGA etc in the district has weaken the
performance
39c Magnitude of Loans Provided under SHG Models in Barpeta District
The total amount of loans availed to the beneficiaries or SHG members in Barpeta
District occupy only 936 percent of the total amount of loans availed in Assam
comprising of loans disbursed and loans outstanding during 2011-12 The share of
district in the state were same with little difference in the whole period of study as
it was 1362 percent in 2007-08 the highest score in period under study 952
percent in 2008-09 900 percent in 2009-10 and 929 percent in 2010-11 and those
with an average share of 1016 percent pa during the five years period under
study31 The amounts of loans disbursed to the SHGs in the district were `161569
lakh in 2007-08 which with an average incremental growth of 3039 percent pa
reached to `284031 lakh by March 2012 with the exception of negative growth
of 144 percent during 2011-12 during the period of study As regards amount of
loans outstanding with SHGs in the district the records reveal that it was ` 289089
31The share total amount of loans availed during the period under study are calculated taking the figures of total loans of Assam and of Barpeta District year after year from Table-36 amp 37 as mentioned above
205
lakh in 2007-08 and the amount of loans outstanding balance rose to `481183 lakh
which seems near to double by the end of March 2012 thus recognising
considerable growth in financing during the period of study All-women SHGs
constitute the lion share in the district and of the total amount of loans given to all-
women SHGs 8174 percent pa are provided only to those SHGs in the district
with little variation during the period of study A diagrammatic presentation has
been made with the help of amount of total loans loans to all-women SHG loans
disbursed and loans outstanding to have a clear picture about the magnitude of
microfinance in the district during the period of study which is as follows
Amount in lakh
207
It can be observed from the diagram that the position of loan factors is gradually
increasing maintaining the same sequence and rate year after year during the
period of study thus the loan factors are normally growing which is a healthy sign
of development of microfinance position and services in the district
39d Analyzing the Growth Trend of Loans under SHG Models in Barpeta
District
To know the actual picture of performance and progress of microfinance more
precisely in the district through its lending to the SHGs under the SHG models
effort were made to find out the growth pattern of loans availed to SHGs during the
period under study with the help of diagram as given in figure-315 It is depicted in
the same that considerable ups and downs have been recorded in the growth rates
among the loan factors during the period of study in the district and in some cases
negative rates of growth have also occurred
Growth Rate ()
209
The amount of loan disbursed to the SHGs during year 2011-12 was `284031
lakh and that recorded a total growth in disbursing loans to SHGs from 2007-08 to
2011-12 of 13364 percent with an average growth of 2673 percent pa during the
period of study But during 2011-12 the rate of growth of the same was negative to
144 percent in the district Again the amount of loan outstanding with the SHGs in
the district up to March 2012 was `481183 lakh which recorded a total growth
of 6645 percent and an average growth of 1329 percent pa during the period of
study The growth of loans outstanding was negative in 2008-09 and highest in
2009-10 to 4630 percent again fell in 2010-11 and increased a little in 2011-12
As all-women SHGs have occupied the lion share in the district and up to March
2012 the total amount of loans disbursed to those SHGs were ` 658773 lakh and
that recorded a total growth of 9109 percent with an average growth of 1822
percent pa during the period of study Of the total amount of loans maximum
amount of loans are availed to the all-women SHG in the district which in average
was 8174 percent pa during the period of study Further of the total amount of
loans availed (ie loans disbursed and loans outstanding) against the SHGs in the
district recorded a total growth of 8634 percent in five years with an average
growth of 1727 percent pa during the period of study
39e Analyzing SHG Model-wise performance of SHGs in Barpeta District
As among the three SHG-credit linkage models SHG Model-II and Model-III are
functional in the district and no such SHGs were found which are directly formed
under Model-I as such analysis of this part are confine to the models which are
operating and functional in the Barperta District Again details as regards SHG
models have already been mentioned in chapter-1 but for the sake of convenience a
brief outline of two functional models in the district are given below
210
SHG Model-II Under this model SHGs are formed and nurtured by the
intermediaries which includes GOs and NGOs and after a certain period and on
satisfactory performance in group management and group funds handling (ie
savings of members) they are being linked to banks for loans In Barpeta District
the task of formation nurturing linking etc of SHGs under SHG Model-II are
performed under the blocks by the Blocks official at the block and village level and
after their satisfaction and scrutiny about the performance of the group they send it
to the DRDA office for the approval and sanction of loans While assessing the
performance of SHGs (the Blocks official and sometimes persons from banks also
join in the process) for grading the SHGs on their performance on the basis of
some parameters where they mainly consider the following five points of SHG and
(ie five point formula) for grading
and promotion of SHG and includes
1 Weekly Meeting
2 Weekly Savings
3 Internal Credit
4 Recovery of Internal Credit
5 Records keeping
On satisfactory performance evaluation the list of SHGs are sent to DRDA for the
sanction of loan and DRDA may call some groups for talking if they feel the need
and after their needful verification they send the list of SHGs to the banks and a
copy to the respective blocks for record keeping and the groups are availed loans
through banks thus the groups are being linked with bank branches
SHG Model-III Under this model some NGOs and MFIs as intermediaries avail
bulk amount of loan from various funding institutionsbanks for on lending to the
groups The intermediaries take care of the groups in all respect and directly finance
the groups The groups in return have to follow the instruction of those
211
intermediaries and have to repay the loan as per the time and size of installment
fixed by them In Barpeta District ASOMI Bandhan RGVN are the leading MFIs
dealing with SHGs to provide micro-credit under this model The selection
procedure promotion criteria etc of SHG depends upon the intermediary which
slightly varies among the service providing intermediaries but the basic objectives
remain same
A detailed SHG model-wise break-up of SHGs in the district are given in the
following table
213
If we consider the model-wise SHG formation performance in the district more
numbers of SHG are being formed under model-II than model-III and that in terms
of ratio which was 1010 1 in 2007-08 and that has improved a little towards
model-III and in 2011-12 the ratio of SHG formation stands at 8761 under
model-II to III An analytical diagrammatic presentation has been made to show the
performance in the formation of SHGs under each of the models as follow
215
From the above it can be easily understood that more SHGs were formed under
SHG model-II in comparison to the model-III but in both the models the trend of
formation of SHGs are common during the period The quantum of all-women
SHG formed under each model is high and different but their trends of progress
under each of the model are alike But in the quality assessment of SHG under
each model the half of SHGs formed under model-II have gone defunct as per their
records and those SHGs are not in touch with the intermediaries and the same in
case of model-III is very efficient and only a meagre percentage of SHGs is
reported as defunct in the district Thus SHGs formed under model-III is well
managed by those intermediaries and more sustainable in comparison to model-II
under study To have precise outcome on the issue of quality and sustainability of
SHGs under each of models a diagrammatic presentation has been made as
follows
216
Figure-317 SHG Model-wise Quality and Sustainability Position of SHGs in terms of Active and Defunct SHGs in Barpeta District
Source Table-38
In year-wise comparison of the active SHGs under each of the SHG models it is
clear that SHGs formed and managed under model-III are more active and
sustainable and that in an average is 9126 percent pa SHGs under this model are
found more active during the period of study in the district and that in case of
model-II is only 5164 percent pa in average during the same period of study in the
district Thus an average gap of 3962 percent pa or SHG model-II is lagging
behind by the same percentage from model-III in the sustainability of SHG during
the period of study
39f Growth Trend of SHGs under SHG Model-II in Barpeta District
The growth trend and position of the SHGs formed under model-II in the district
taking the growth factors of total SHGs formed total all-women SHGs and total
active SHGs the following diagrammatic presentation has been made in figure-
318
2007-08 2008-09 2009-10 2010-11 2011-12
5296 5318 5128 509 4987
8767 8994 9181 9455 9231
Comperative Quality amp Sustainability Position of SHGs in Barpeta District
Active SHGs under Model-II Active SHGs under Model-III
Growth Rate ()
218
The diagram clearly indicates that the growth trend in all the factors are gradually
coming down from 2007-08 to 2011-12 and more importantly the trend line of
active SHG is under all the trend lines presented in the diagram which is very
important to be considered and more important line among all the trend lines
presented in the diagram Thus positions of SHG under model-II are gradually
deteriorating and very poor during 2011-12 in the district and during the period of
study
39g Growth Trend of SHGs under SHG Model-III in Barpeta District
The growth pattern of SHGs in the district under model-III is shown in the figure-
319 and it is clearly understood from the same that the growth was highest during
2008-09 in the periods of study and after that there was sharp fall in the growth
rates in all the factors of SHGs growth rates under consideration but from 2010-11
to 2011-12 a slow progressive growth has been noticed in the diagram which is a
good sign
Growth Rate ()
220
Again the growth rate and trend of active SHG is above all the growth lines in the
figure which is found just reverse under model-II as mentioned earlier Thus from
the two diagrammatic presentations it is clear that by the end of the period under
study all the growth lines under model-II records downwards movement and the
same under model-III records upward movement or in progressive trend
39h Analysing SHG Model-wise Magnitude and Trend of Microfinance in
Barpeta District
The details of microfinance performance under each of the SHG models in the
district are presented in table-39 and it is found from the same that model-III has
performed well in terms of providing more amount of loans to the beneficiaries in
comparison to model-II if we consider the model-wise loaning performance ratio
as given in the table more amount of loans or microfinance has been availed under
model-III in all through the period of study and the average ratio of lending under
these two models comes to 0731 pa during the period of study The amount of
loan disbursed under model-II in 2007-08 was only ` 38685 lakh which at an
average annual growth of 2197 percent reached to `81181 lakh during 2011-12
and in case of loan outstanding with SHG in the district it was an amount of `
157351 lakh in 2007-08 which rose to the balance of loans outstanding to
`256484 lakh thus registered a total growth of 63 percent in period of study But
position of loans disbursed under model-III was ` 122884 lakh in 2007-08 which
with an average annual growth of 1301 percent reached to ` 202850 lakh by
March 2012 in the district including a negative growth of 176 percent in 2011-12
Again about the amount of loans outstanding with SHG in the district it was only
` 131773 lakh in 2007-08 which rose to ` 224699 lakh by March 2012 thus
registered a total growth of 7052 percent during the period of study
222
The all-women SHGs constitute the major share in the district thus an effort was
made to know the amount of loans provided to them and the total amount of loans
provided to those SHG under model-II was ` 144987 lakh in 2007-08 which by
registering an average growth of 2033 percent pa reached to ` 271696 lakh by
March 2012 The same under model-III was ` 199793 lakh in 2007-08 rose with
an average growth of 1818 percent pa and reached to ` 298333 lakh by March
2012 Further the women SHGs are given in an average 7579 percent of the total
amount loans under model-II during the whole period of study and the same under
model-III was in an average of 8589 percent during same period of study in the
district Thus under model-III 1010 percent more amount of loans had been
extended to the all-women SHGs in the district in all through the period of study
Again total amount of loans provided under model-II in the district was ` 196036
lakh in 2007-08 which increased with an average growth rate of 1524 percent pa
and reached to ` 252362 lakh in 2011-12 and the same under model-III was `
254657 lakh in 2007-08 which rose to ` 259989 lakh by recording an average
growth of 1306 percent pa during the entire period of study Surprisingly despite
having such huge volume of SHG under model-II (ie 9099 of the total SHG in
the district) in the district only 4350 percent of the grand total amounts of loans
were provided to SHGs in 2007-08 and that under model-III was 5650 percent to
only 901 percent of the total SHGs of the said period This huge disparity signifies
that the SHGs under model-III were availed more amount of loans and SHGs under
model-II were under-served or extended poor amounts of loan Again if we
consider the same for the year 2011-12 an amount of ` 252362 lakh which is
4227 percent of the grand total amount of loans were extended to the beneficiaries
under model-II in the district and under model-III the same was ` 259989 lakh
which is 5773 percent of the grand total amount of loans provided in the same
period of study The magnitude and trend of microfinance in the district is also
presented with a diagram in figure-320 to understand the scenario more clearly
Amount in Lakh
224
Simply it can be understand from the diagram that in all the factors of loans to the
SHGs performance under model-III is more lucrative and provided more amounts
year after year thus model-III holds better position in the magnitude of loans in
Barpeta district of Assam
39i Analyzing the Comparative Growth Trend of Microfinance under SHG
Model-II and III in Barpeta District
The growth trend of microfinance under each of the SHG models under study
behave and move in reverse way as under model-II the growth trends fluctuate
considerably during the period of study in the district but the growth trends under
model-III slowly progressed from 2007-08 to 2009-10 and thereafter gradually fell
up to the end of the period under study But progress under model-III was almost
steady in comparison to model-II in the same period of study The Comparative
growth position can better be understood from the following diagram which is
prepared taking all the growth rates of loans in Barpeta District in the following
diagram
Growth Rate ()
226
So the growth trends under model-II were negative except in loan disbursed in
2008-09 which reached to the top level in 2009-10 and again fell down in 2010-10
and in 2011-12 consecutively But those under model-III experienced almost a flat
and steady growth during the period of study The growth of loans disbursed under
model-II was 1920 percent in 2007-08 which maintained an average incremental
growth of 2118 percent all through the period but registered a negative growth of
064 percent in 2011-12 The same under model-III was 1833 percent in 2007-08
and recorded an average incremental growth of 1467 percent pa during the period
of study but that stands to 176 percent negative growth in 2011-12 In the case of
growth rate of loans outstanding with the SHGs in the district it was only 1295
percent in 2007-08 which reached to 2270 percent in 2011-12 registering two
negative growths of 2141 and 250 percent respectively in 2008-09 and 2010-11
But under model-III the same was only 432 percent in 2007-08 which reached to
1715 percent in 2011-12 by registering an average growth of 1241 percent pa all
through the period of study and no negative growth had been registered in the
period The growth pattern of loans to all-women SHG is a strong factor in the
district because more than 80 percent SHGs fall under this category and in 2007-
08 it registered a growth of 1555 percent and that also maintained an average
growth of 2033 percent pa all through the period under study and stands at 1507
percent in 2011-12 overcoming a negative growth of 2027 percent in 2008-09
under model-II and the same under model-III was 1840 percent in 2007-08 and
registered an average growth of 1818 percent pa during the period of study and
reached to 1150 percent in 2001-12
Further Intermediaries-wise SHGs Position and Trend with their loans position
during the period of study in Barpeta District under Model-II and III are presented
with the help of following two diagrams
Nos of SHG
Amount in Lakh
229
The outcomes of the above diagrams is very clear as maximum SHGs are formed
under model-II by block intermediaries as shown in figure-322 but availed less
amount of loans to those few percentage of SHGs On the contrary very few
percentage of SHGs are formed under Model-III by NGOsMFIs in the district but
maximum amount of loans are availed towards those SHGs those groups are
getting more loans or frequent loans in comparison to the SHGs formed under
model-II in the district during the period of study that are shown in figure-323
310 Analyzing Comparative Growth Position of SHGs in India Assam and in
Barpeta District under the SHG Models
After going through the positions of microfinance in India Assam and in Barpeta
district as mentioned above where mixed responses are found and to show the
relative position more precisely efforts were made to have comparative study with
the core factor of performance in terms of growth trends of SHGs right from
national level to the district level and that will depict the picture more clearly As
such their performances have been presented with the help of following two
diagrams as follows in figure-324 and figure-325
Growth Rate ()
Growth Rate ()
232
In both the figures given above it is clearly depicted that there is a sharp fall in the
performance of SHGs and loans extended to them from 2009-10 onwards in all
sector of microfinance ie in India Assam and as well in Barpeta District of
Assam The position was favourable from 2007-08 to the 2009-10 as highest
growth rates were recorded during that period as shown in the figures Such drastic
down-fall in both in the growth of SHGs and in microfinance (ie in extending
total amount of loans) during the period had weakened the service of microfinance
spreads and base in the country The incidents that had occurred in Andhra Pradesh
where 30 farmers had committed suicide within a span of 45 days in 2010 after a
few MFIs used coercive recovery tactics (Patra 2011) is a strong reason for such
adverse scenario as after such incidents many financing banks and institutions
stopped financing to MFIs The subsidy provision under SGSY programme also
weakened the base of a group of SHGs which were formed only to take the
benefits of subsidy and not SHGs as a means of self-employment provisions is also
added to the reason of such downfall in the performance of microfinance sector in
our country Again the change of programme from SGSY now to newly introduced
NRLM also concentrate a lot in the change of the functional structures power and
management and also weakens the rapid growth and speeds of microfinance sector
in the country during the period under study
311 Conclusion
During the period under study the performance under microfinance service has
been moved in two way dimensions as in the first half of the period ie from
2007-08 to 2009-10 the performance was in progressive trend in India Assam and
as well in Barpeta district of Assam but in the later part of the period of study the
performance and progress experienced downfall While we consider the magnitude
of microfinance services in Assam in terms of SHG with saving in banks it is
found that only 347 percent SHGs belong to Assam and same is 1879 percent
233
highest in the country in case of Andhra Pradesh by the end of March 2012 The
relative position of Assam in NER is good as Assam occupied 7542 percent of the
total SHGs of the region and that with the amount of savings of `984598 lakh
which stands at 6456 percent of the total amount of savings of NER Thus Assam
is in leading position in the region followed by Tripura and then Meghalaya
(NABARD 2012) In case of amount of loans disbursed to SHGs in 2011-12
Assam is having only 113 percent of the total amount of loans disbursed in India
and among NER it is 4154 percent followed by Tripura and Manipur
On SHG model-wise analysis it is found that SHG-bank linkage models (together
SHG Model-I amp II) remain in dominant position in terms of volume of SHGs and
absolute amount of loans availed to SHGs in the country than MFI-bank linkage
model (ie SHG Model-III) during the period of study But in Barpeta District of
Assam some variation in the model-wise performance has been found during the
period of study as model-II is found popular and covered more number of members
and is able to form more numbers of SHGs in comparison to that of under model-
III As of the total SHGs in the district 8975 percent are formed under model-II
and only1025 percent SHGs are under model-III in 2011-12 Again total amount
of loans given to SHGs under model-II in the same period was ` 337665 lakh
which was 4413 percent of the grand total amount of loans under both the models
and the rest 5587 percent were given to only 1025 percent of the total SHGs in
the district Thus SHGs under model-III are given more amount of loans or
frequent loans in comparison to the SHG under model-II in the district during the
period of study In terms of growth factors under each of these two models growth
trends under model-II both in case of SHG and in amount of loans to them more
fluctuations or ups and downs were recorded during the period of study and by the
end of the period particularly in 2010-11 and 2011-12 the growth trends were
down-falling in the district But the same under model-III were almost steady
during the period of study with a bit high in 2009-10 and a bit low in latter part of
the period of study particularly in 2010-11 to 2011-12 in the district Again in
234
terms of sustainability of SHGs formed under each of the SHG models also varies
a lot The SHGs formed managed and financed under model-II are half in an
average of the total are defunct SHGs and only 50 percent of them survive or are
functional in the district but the same under model-III is found more than 91
percent as active and functional during the period of study in the district Thus
over-all performance of SHGs under SHG model-III in the district during the period
of study is better than SHGs under model-II in respect of service quantum of
loans growth trends and sustainability etc
References
(2006) Statistical Hand Book of Assam Guwahati Directorate of Economics and
Statistics Government of Assam
Asif M (2011 November) Role of NGOs in India YOJANA 55 pp 8-10
Bandhan (nd) Bandhan Hope for the Poor Product Information Broucher of Bandhan
West Bengal India Bandhan
Baruah P B (2012) Impact of Microfinance on Poverty A Study of Twenty Self-Help
Groups in Nalbari District Assam Journal of Rural Development 31(2) 223-234
Bharali S (2010 July 18) An Institute Promotion of Secure Sustainable Livelihood
ASOMI Barta 6(6)
Borbora S amp Sarma G K (nd) Microfinance Institutions Sustainability and Outreach
Retrieved May 2 2014 from httpwwwwbiconprocom314-borborapdf
CGAP (nd) Consultative Group to Assist the Poor Retrieved from wwwcgaporg
Chatterjee N amp Dar M A (2011 November) Role of NGOs in Rural Development
YOJANA 55 pp 17-20
Chief Ministers Micro Finance Scheme-Assam Financial Corporation (CMMFS) Khudra
Reen (nd) Retrieved May 1 2014 from httpwwwafconlinegovin
documentbroucherpdf
Chief Ministers Micro Finance Schemes- Assam Financial Corporation (nd) Retrieved
May 1 2014 from httpwwwafconlinegovinpdfmfnbbrochure Englishpdf
Das D (nd) Informal Microfinance in Assam Empirical Evidence from Nalbari and
Baksa Districts Retrieved November 2013 from IFMR Centre for Microfinance
235
Research httpwwwifmrleadorgcmfwp-contentuploadsattachmentscsy1685
informal20MF20in20Assampdf
Das K (2012 January- March) Financial Inclusion-A Gateway to Sustainable
Development for the Impoverished Journal of Rural Development NIRD 31(1)
115-128
Das R L Dutta D N Kakoti P amp Deka S N (2011) Rural and Microfinance
Guwahati BLJ Publication
Deb B (2012) Microfinance and Poverty Alleviation A Case Study on Rgvn-Csp Indian
Journal of Applied Research 71-74
Desai V (2005) NGOs Gender Mainstreaming and Urban Communities in Mumbai
Gender and Development 13(2) 90-98
Devi M (2012 January 20) Rural Industrialisation for Development The Assam Tribune
Guwahati p 6
Dhar P K (2009) The Economy of Assam Including Economy of Narth East India New
Delhi Kalyani Publishers
Dutta J amp Upadhaya M (2013 August 23) Green Microfinance for Eco-friendly
Development The Assam Tribune (English Daily News Paper) p 6
Economic Survey Assam 2011-12 (nd) Retrieved April 30 2014 from
httpwwwecostatassamnicinads_economic20survey-2011-12pdf
Executive Summary Part-I An Overview of State Focus Paper 2006-07 (nd) Retrieved
April 30 2014 from httpwwwnabardorgpdfAssam20EXECUTIVE
20SUMMARYpdf
Gadiapannivar R D (nd) IFMR Centre for Microfinance Retrieved November 2013
from wwwifmracincmf httpwwwifmrleadorgcmf
Ghosh M (2012 July-Sept) Microfinance and Rural Poverty in India SHG-Bank Linkage
Programme Journal of Rural Development 31(3) 347-363
Gogoi P (2013) Economic Empowerment of Rural Women Through Income Generating
Activities In B M Doley (Ed) Women in Rural Development (Seminar Volume)
(pp 36-45) Guwahati Publication Board Silapathar College Dhemaji Assam
IIBF (2010) Rural Banking New Delhi Indian Institute of Banking amp Finance by
Macmillion
Khanka S S (2010) Microfinance in India From Evolution to Revolution In J U
Ahmed D Bhagat amp G Singaiah (Eds) Microfinance in India Issues and
Challenges (pp 3-14) Guwahati DVs Publications
236
Lalitha N (2011 February) Sustainable Management of Local Resources YOJANA 55
pp 32-35
Mathaw J amp Verghese J (2011 November) Non Governmental Organisation in India
YOJANA 55 pp 12-14
NABARD (2012) Status of Microfinance in India 2011-12 Mumbai NABARD
NRLM (nd) NRLM Procurement Manual- Ministry of Rural Development Retrieved
May 1 2014 from httpruralnicinsitesdownloadslatestNRLM
20Procurement20Manualpdf
Patra D R (2011 December) Death of Microfinance in India BFM Banking Finance
Markets A Planman Financial-IIPM Think Tank Publication 1(10) pp 28-33
RBI (nd) Quarterly Statistics on Deposits and Credit of Schedule Commercial Banks
March 2007 to March 2011 Mumbai Reserve Bank of India
Roy A (nd) Microfinance and Rural Development in the North East India Retrieved
December 2013 from httpwwwpbrcoinBrochure0006pdf
Sarmah V (2010) Microfinance Vission 2015 Northeast Region India Retrieved July
2013 from httpwwwaccessdevorgdownloadsmicrofinance_vision_2015pdf
SGSY (2010) Swarnjayanti Gram Swarozgar Yojana (SGSY) Retrieved May 1 2014
from httpwwwcsjpgoaorgwp-contentuploads201010sjgsypdf
Sharma A K (2011 December) Micro Finance in the North East YOJANA pp 8-10
Shodhganga (nd) Chapter-3 Microfinance Trends Problems and Prospects Retrieved
June 2013 from httpshodhgangainflibnetacinbitstream10603303111
n_chapter203pdf
Srinivasan N (2009) Microfinance India State of the Sector Report 2009 Delhi
ACCESS Sage
Sundaram I S (2007) Microfinance in India Delhi BR Publishing Corporation
Tribune A (2007 May 7) Self-help Groups and Rural Development The Assam Tribune
Guwahati p 6
Vikash (2008 March) About the Issue Microfinance Focus II(IV) 3
Yunus M amp Jolis A (2007) Banker To The Poor The Story of the Grameen Bank New
Delhi Penguin Books
----0----
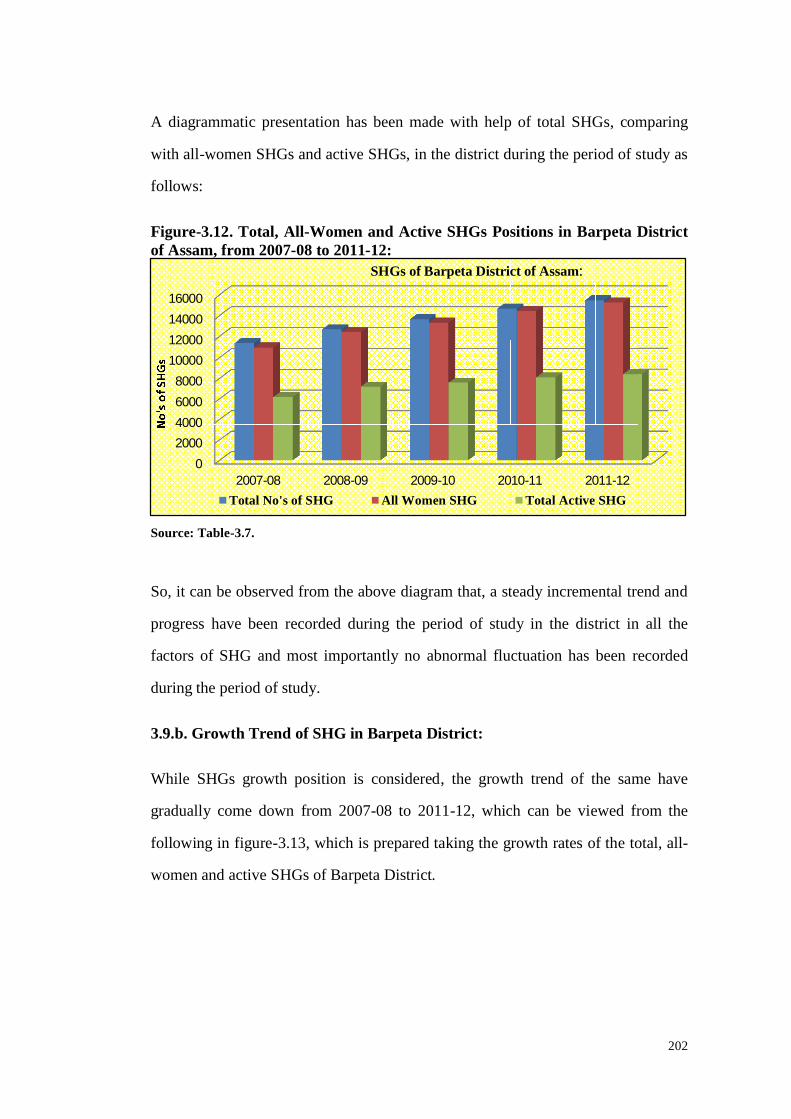

Growth Rate ()
209
The amount of loan disbursed to the SHGs during year 2011-12 was `284031
lakh and that recorded a total growth in disbursing loans to SHGs from 2007-08 to
2011-12 of 13364 percent with an average growth of 2673 percent pa during the
period of study But during 2011-12 the rate of growth of the same was negative to
144 percent in the district Again the amount of loan outstanding with the SHGs in
the district up to March 2012 was `481183 lakh which recorded a total growth
of 6645 percent and an average growth of 1329 percent pa during the period of
study The growth of loans outstanding was negative in 2008-09 and highest in
2009-10 to 4630 percent again fell in 2010-11 and increased a little in 2011-12
As all-women SHGs have occupied the lion share in the district and up to March
2012 the total amount of loans disbursed to those SHGs were ` 658773 lakh and
that recorded a total growth of 9109 percent with an average growth of 1822
percent pa during the period of study Of the total amount of loans maximum
amount of loans are availed to the all-women SHG in the district which in average
was 8174 percent pa during the period of study Further of the total amount of
loans availed (ie loans disbursed and loans outstanding) against the SHGs in the
district recorded a total growth of 8634 percent in five years with an average
growth of 1727 percent pa during the period of study
39e Analyzing SHG Model-wise performance of SHGs in Barpeta District
As among the three SHG-credit linkage models SHG Model-II and Model-III are
functional in the district and no such SHGs were found which are directly formed
under Model-I as such analysis of this part are confine to the models which are
operating and functional in the Barperta District Again details as regards SHG
models have already been mentioned in chapter-1 but for the sake of convenience a
brief outline of two functional models in the district are given below
210
SHG Model-II Under this model SHGs are formed and nurtured by the
intermediaries which includes GOs and NGOs and after a certain period and on
satisfactory performance in group management and group funds handling (ie
savings of members) they are being linked to banks for loans In Barpeta District
the task of formation nurturing linking etc of SHGs under SHG Model-II are
performed under the blocks by the Blocks official at the block and village level and
after their satisfaction and scrutiny about the performance of the group they send it
to the DRDA office for the approval and sanction of loans While assessing the
performance of SHGs (the Blocks official and sometimes persons from banks also
join in the process) for grading the SHGs on their performance on the basis of
some parameters where they mainly consider the following five points of SHG and
(ie five point formula) for grading
and promotion of SHG and includes
1 Weekly Meeting
2 Weekly Savings
3 Internal Credit
4 Recovery of Internal Credit
5 Records keeping
On satisfactory performance evaluation the list of SHGs are sent to DRDA for the
sanction of loan and DRDA may call some groups for talking if they feel the need
and after their needful verification they send the list of SHGs to the banks and a
copy to the respective blocks for record keeping and the groups are availed loans
through banks thus the groups are being linked with bank branches
SHG Model-III Under this model some NGOs and MFIs as intermediaries avail
bulk amount of loan from various funding institutionsbanks for on lending to the
groups The intermediaries take care of the groups in all respect and directly finance
the groups The groups in return have to follow the instruction of those
211
intermediaries and have to repay the loan as per the time and size of installment
fixed by them In Barpeta District ASOMI Bandhan RGVN are the leading MFIs
dealing with SHGs to provide micro-credit under this model The selection
procedure promotion criteria etc of SHG depends upon the intermediary which
slightly varies among the service providing intermediaries but the basic objectives
remain same
A detailed SHG model-wise break-up of SHGs in the district are given in the
following table
213
If we consider the model-wise SHG formation performance in the district more
numbers of SHG are being formed under model-II than model-III and that in terms
of ratio which was 1010 1 in 2007-08 and that has improved a little towards
model-III and in 2011-12 the ratio of SHG formation stands at 8761 under
model-II to III An analytical diagrammatic presentation has been made to show the
performance in the formation of SHGs under each of the models as follow
215
From the above it can be easily understood that more SHGs were formed under
SHG model-II in comparison to the model-III but in both the models the trend of
formation of SHGs are common during the period The quantum of all-women
SHG formed under each model is high and different but their trends of progress
under each of the model are alike But in the quality assessment of SHG under
each model the half of SHGs formed under model-II have gone defunct as per their
records and those SHGs are not in touch with the intermediaries and the same in
case of model-III is very efficient and only a meagre percentage of SHGs is
reported as defunct in the district Thus SHGs formed under model-III is well
managed by those intermediaries and more sustainable in comparison to model-II
under study To have precise outcome on the issue of quality and sustainability of
SHGs under each of models a diagrammatic presentation has been made as
follows
216
Figure-317 SHG Model-wise Quality and Sustainability Position of SHGs in terms of Active and Defunct SHGs in Barpeta District
Source Table-38
In year-wise comparison of the active SHGs under each of the SHG models it is
clear that SHGs formed and managed under model-III are more active and
sustainable and that in an average is 9126 percent pa SHGs under this model are
found more active during the period of study in the district and that in case of
model-II is only 5164 percent pa in average during the same period of study in the
district Thus an average gap of 3962 percent pa or SHG model-II is lagging
behind by the same percentage from model-III in the sustainability of SHG during
the period of study
39f Growth Trend of SHGs under SHG Model-II in Barpeta District
The growth trend and position of the SHGs formed under model-II in the district
taking the growth factors of total SHGs formed total all-women SHGs and total
active SHGs the following diagrammatic presentation has been made in figure-
318
2007-08 2008-09 2009-10 2010-11 2011-12
5296 5318 5128 509 4987
8767 8994 9181 9455 9231
Comperative Quality amp Sustainability Position of SHGs in Barpeta District
Active SHGs under Model-II Active SHGs under Model-III
Growth Rate ()
218
The diagram clearly indicates that the growth trend in all the factors are gradually
coming down from 2007-08 to 2011-12 and more importantly the trend line of
active SHG is under all the trend lines presented in the diagram which is very
important to be considered and more important line among all the trend lines
presented in the diagram Thus positions of SHG under model-II are gradually
deteriorating and very poor during 2011-12 in the district and during the period of
study
39g Growth Trend of SHGs under SHG Model-III in Barpeta District
The growth pattern of SHGs in the district under model-III is shown in the figure-
319 and it is clearly understood from the same that the growth was highest during
2008-09 in the periods of study and after that there was sharp fall in the growth
rates in all the factors of SHGs growth rates under consideration but from 2010-11
to 2011-12 a slow progressive growth has been noticed in the diagram which is a
good sign
Growth Rate ()
220
Again the growth rate and trend of active SHG is above all the growth lines in the
figure which is found just reverse under model-II as mentioned earlier Thus from
the two diagrammatic presentations it is clear that by the end of the period under
study all the growth lines under model-II records downwards movement and the
same under model-III records upward movement or in progressive trend
39h Analysing SHG Model-wise Magnitude and Trend of Microfinance in
Barpeta District
The details of microfinance performance under each of the SHG models in the
district are presented in table-39 and it is found from the same that model-III has
performed well in terms of providing more amount of loans to the beneficiaries in
comparison to model-II if we consider the model-wise loaning performance ratio
as given in the table more amount of loans or microfinance has been availed under
model-III in all through the period of study and the average ratio of lending under
these two models comes to 0731 pa during the period of study The amount of
loan disbursed under model-II in 2007-08 was only ` 38685 lakh which at an
average annual growth of 2197 percent reached to `81181 lakh during 2011-12
and in case of loan outstanding with SHG in the district it was an amount of `
157351 lakh in 2007-08 which rose to the balance of loans outstanding to
`256484 lakh thus registered a total growth of 63 percent in period of study But
position of loans disbursed under model-III was ` 122884 lakh in 2007-08 which
with an average annual growth of 1301 percent reached to ` 202850 lakh by
March 2012 in the district including a negative growth of 176 percent in 2011-12
Again about the amount of loans outstanding with SHG in the district it was only
` 131773 lakh in 2007-08 which rose to ` 224699 lakh by March 2012 thus
registered a total growth of 7052 percent during the period of study
222
The all-women SHGs constitute the major share in the district thus an effort was
made to know the amount of loans provided to them and the total amount of loans
provided to those SHG under model-II was ` 144987 lakh in 2007-08 which by
registering an average growth of 2033 percent pa reached to ` 271696 lakh by
March 2012 The same under model-III was ` 199793 lakh in 2007-08 rose with
an average growth of 1818 percent pa and reached to ` 298333 lakh by March
2012 Further the women SHGs are given in an average 7579 percent of the total
amount loans under model-II during the whole period of study and the same under
model-III was in an average of 8589 percent during same period of study in the
district Thus under model-III 1010 percent more amount of loans had been
extended to the all-women SHGs in the district in all through the period of study
Again total amount of loans provided under model-II in the district was ` 196036
lakh in 2007-08 which increased with an average growth rate of 1524 percent pa
and reached to ` 252362 lakh in 2011-12 and the same under model-III was `
254657 lakh in 2007-08 which rose to ` 259989 lakh by recording an average
growth of 1306 percent pa during the entire period of study Surprisingly despite
having such huge volume of SHG under model-II (ie 9099 of the total SHG in
the district) in the district only 4350 percent of the grand total amounts of loans
were provided to SHGs in 2007-08 and that under model-III was 5650 percent to
only 901 percent of the total SHGs of the said period This huge disparity signifies
that the SHGs under model-III were availed more amount of loans and SHGs under
model-II were under-served or extended poor amounts of loan Again if we
consider the same for the year 2011-12 an amount of ` 252362 lakh which is
4227 percent of the grand total amount of loans were extended to the beneficiaries
under model-II in the district and under model-III the same was ` 259989 lakh
which is 5773 percent of the grand total amount of loans provided in the same
period of study The magnitude and trend of microfinance in the district is also
presented with a diagram in figure-320 to understand the scenario more clearly
Amount in Lakh
224
Simply it can be understand from the diagram that in all the factors of loans to the
SHGs performance under model-III is more lucrative and provided more amounts
year after year thus model-III holds better position in the magnitude of loans in
Barpeta district of Assam
39i Analyzing the Comparative Growth Trend of Microfinance under SHG
Model-II and III in Barpeta District
The growth trend of microfinance under each of the SHG models under study
behave and move in reverse way as under model-II the growth trends fluctuate
considerably during the period of study in the district but the growth trends under
model-III slowly progressed from 2007-08 to 2009-10 and thereafter gradually fell
up to the end of the period under study But progress under model-III was almost
steady in comparison to model-II in the same period of study The Comparative
growth position can better be understood from the following diagram which is
prepared taking all the growth rates of loans in Barpeta District in the following
diagram
Growth Rate ()
226
So the growth trends under model-II were negative except in loan disbursed in
2008-09 which reached to the top level in 2009-10 and again fell down in 2010-10
and in 2011-12 consecutively But those under model-III experienced almost a flat
and steady growth during the period of study The growth of loans disbursed under
model-II was 1920 percent in 2007-08 which maintained an average incremental
growth of 2118 percent all through the period but registered a negative growth of
064 percent in 2011-12 The same under model-III was 1833 percent in 2007-08
and recorded an average incremental growth of 1467 percent pa during the period
of study but that stands to 176 percent negative growth in 2011-12 In the case of
growth rate of loans outstanding with the SHGs in the district it was only 1295
percent in 2007-08 which reached to 2270 percent in 2011-12 registering two
negative growths of 2141 and 250 percent respectively in 2008-09 and 2010-11
But under model-III the same was only 432 percent in 2007-08 which reached to
1715 percent in 2011-12 by registering an average growth of 1241 percent pa all
through the period of study and no negative growth had been registered in the
period The growth pattern of loans to all-women SHG is a strong factor in the
district because more than 80 percent SHGs fall under this category and in 2007-
08 it registered a growth of 1555 percent and that also maintained an average
growth of 2033 percent pa all through the period under study and stands at 1507
percent in 2011-12 overcoming a negative growth of 2027 percent in 2008-09
under model-II and the same under model-III was 1840 percent in 2007-08 and
registered an average growth of 1818 percent pa during the period of study and
reached to 1150 percent in 2001-12
Further Intermediaries-wise SHGs Position and Trend with their loans position
during the period of study in Barpeta District under Model-II and III are presented
with the help of following two diagrams
Nos of SHG
Amount in Lakh
229
The outcomes of the above diagrams is very clear as maximum SHGs are formed
under model-II by block intermediaries as shown in figure-322 but availed less
amount of loans to those few percentage of SHGs On the contrary very few
percentage of SHGs are formed under Model-III by NGOsMFIs in the district but
maximum amount of loans are availed towards those SHGs those groups are
getting more loans or frequent loans in comparison to the SHGs formed under
model-II in the district during the period of study that are shown in figure-323
310 Analyzing Comparative Growth Position of SHGs in India Assam and in
Barpeta District under the SHG Models
After going through the positions of microfinance in India Assam and in Barpeta
district as mentioned above where mixed responses are found and to show the
relative position more precisely efforts were made to have comparative study with
the core factor of performance in terms of growth trends of SHGs right from
national level to the district level and that will depict the picture more clearly As
such their performances have been presented with the help of following two
diagrams as follows in figure-324 and figure-325
Growth Rate ()
Growth Rate ()
232
In both the figures given above it is clearly depicted that there is a sharp fall in the
performance of SHGs and loans extended to them from 2009-10 onwards in all
sector of microfinance ie in India Assam and as well in Barpeta District of
Assam The position was favourable from 2007-08 to the 2009-10 as highest
growth rates were recorded during that period as shown in the figures Such drastic
down-fall in both in the growth of SHGs and in microfinance (ie in extending
total amount of loans) during the period had weakened the service of microfinance
spreads and base in the country The incidents that had occurred in Andhra Pradesh
where 30 farmers had committed suicide within a span of 45 days in 2010 after a
few MFIs used coercive recovery tactics (Patra 2011) is a strong reason for such
adverse scenario as after such incidents many financing banks and institutions
stopped financing to MFIs The subsidy provision under SGSY programme also
weakened the base of a group of SHGs which were formed only to take the
benefits of subsidy and not SHGs as a means of self-employment provisions is also
added to the reason of such downfall in the performance of microfinance sector in
our country Again the change of programme from SGSY now to newly introduced
NRLM also concentrate a lot in the change of the functional structures power and
management and also weakens the rapid growth and speeds of microfinance sector
in the country during the period under study
311 Conclusion
During the period under study the performance under microfinance service has
been moved in two way dimensions as in the first half of the period ie from
2007-08 to 2009-10 the performance was in progressive trend in India Assam and
as well in Barpeta district of Assam but in the later part of the period of study the
performance and progress experienced downfall While we consider the magnitude
of microfinance services in Assam in terms of SHG with saving in banks it is
found that only 347 percent SHGs belong to Assam and same is 1879 percent
233
highest in the country in case of Andhra Pradesh by the end of March 2012 The
relative position of Assam in NER is good as Assam occupied 7542 percent of the
total SHGs of the region and that with the amount of savings of `984598 lakh
which stands at 6456 percent of the total amount of savings of NER Thus Assam
is in leading position in the region followed by Tripura and then Meghalaya
(NABARD 2012) In case of amount of loans disbursed to SHGs in 2011-12
Assam is having only 113 percent of the total amount of loans disbursed in India
and among NER it is 4154 percent followed by Tripura and Manipur
On SHG model-wise analysis it is found that SHG-bank linkage models (together
SHG Model-I amp II) remain in dominant position in terms of volume of SHGs and
absolute amount of loans availed to SHGs in the country than MFI-bank linkage
model (ie SHG Model-III) during the period of study But in Barpeta District of
Assam some variation in the model-wise performance has been found during the
period of study as model-II is found popular and covered more number of members
and is able to form more numbers of SHGs in comparison to that of under model-
III As of the total SHGs in the district 8975 percent are formed under model-II
and only1025 percent SHGs are under model-III in 2011-12 Again total amount
of loans given to SHGs under model-II in the same period was ` 337665 lakh
which was 4413 percent of the grand total amount of loans under both the models
and the rest 5587 percent were given to only 1025 percent of the total SHGs in
the district Thus SHGs under model-III are given more amount of loans or
frequent loans in comparison to the SHG under model-II in the district during the
period of study In terms of growth factors under each of these two models growth
trends under model-II both in case of SHG and in amount of loans to them more
fluctuations or ups and downs were recorded during the period of study and by the
end of the period particularly in 2010-11 and 2011-12 the growth trends were
down-falling in the district But the same under model-III were almost steady
during the period of study with a bit high in 2009-10 and a bit low in latter part of
the period of study particularly in 2010-11 to 2011-12 in the district Again in
234
terms of sustainability of SHGs formed under each of the SHG models also varies
a lot The SHGs formed managed and financed under model-II are half in an
average of the total are defunct SHGs and only 50 percent of them survive or are
functional in the district but the same under model-III is found more than 91
percent as active and functional during the period of study in the district Thus
over-all performance of SHGs under SHG model-III in the district during the period
of study is better than SHGs under model-II in respect of service quantum of
loans growth trends and sustainability etc
References
(2006) Statistical Hand Book of Assam Guwahati Directorate of Economics and
Statistics Government of Assam
Asif M (2011 November) Role of NGOs in India YOJANA 55 pp 8-10
Bandhan (nd) Bandhan Hope for the Poor Product Information Broucher of Bandhan
West Bengal India Bandhan
Baruah P B (2012) Impact of Microfinance on Poverty A Study of Twenty Self-Help
Groups in Nalbari District Assam Journal of Rural Development 31(2) 223-234
Bharali S (2010 July 18) An Institute Promotion of Secure Sustainable Livelihood
ASOMI Barta 6(6)
Borbora S amp Sarma G K (nd) Microfinance Institutions Sustainability and Outreach
Retrieved May 2 2014 from httpwwwwbiconprocom314-borborapdf
CGAP (nd) Consultative Group to Assist the Poor Retrieved from wwwcgaporg
Chatterjee N amp Dar M A (2011 November) Role of NGOs in Rural Development
YOJANA 55 pp 17-20
Chief Ministers Micro Finance Scheme-Assam Financial Corporation (CMMFS) Khudra
Reen (nd) Retrieved May 1 2014 from httpwwwafconlinegovin
documentbroucherpdf
Chief Ministers Micro Finance Schemes- Assam Financial Corporation (nd) Retrieved
May 1 2014 from httpwwwafconlinegovinpdfmfnbbrochure Englishpdf
Das D (nd) Informal Microfinance in Assam Empirical Evidence from Nalbari and
Baksa Districts Retrieved November 2013 from IFMR Centre for Microfinance
235
Research httpwwwifmrleadorgcmfwp-contentuploadsattachmentscsy1685
informal20MF20in20Assampdf
Das K (2012 January- March) Financial Inclusion-A Gateway to Sustainable
Development for the Impoverished Journal of Rural Development NIRD 31(1)
115-128
Das R L Dutta D N Kakoti P amp Deka S N (2011) Rural and Microfinance
Guwahati BLJ Publication
Deb B (2012) Microfinance and Poverty Alleviation A Case Study on Rgvn-Csp Indian
Journal of Applied Research 71-74
Desai V (2005) NGOs Gender Mainstreaming and Urban Communities in Mumbai
Gender and Development 13(2) 90-98
Devi M (2012 January 20) Rural Industrialisation for Development The Assam Tribune
Guwahati p 6
Dhar P K (2009) The Economy of Assam Including Economy of Narth East India New
Delhi Kalyani Publishers
Dutta J amp Upadhaya M (2013 August 23) Green Microfinance for Eco-friendly
Development The Assam Tribune (English Daily News Paper) p 6
Economic Survey Assam 2011-12 (nd) Retrieved April 30 2014 from
httpwwwecostatassamnicinads_economic20survey-2011-12pdf
Executive Summary Part-I An Overview of State Focus Paper 2006-07 (nd) Retrieved
April 30 2014 from httpwwwnabardorgpdfAssam20EXECUTIVE
20SUMMARYpdf
Gadiapannivar R D (nd) IFMR Centre for Microfinance Retrieved November 2013
from wwwifmracincmf httpwwwifmrleadorgcmf
Ghosh M (2012 July-Sept) Microfinance and Rural Poverty in India SHG-Bank Linkage
Programme Journal of Rural Development 31(3) 347-363
Gogoi P (2013) Economic Empowerment of Rural Women Through Income Generating
Activities In B M Doley (Ed) Women in Rural Development (Seminar Volume)
(pp 36-45) Guwahati Publication Board Silapathar College Dhemaji Assam
IIBF (2010) Rural Banking New Delhi Indian Institute of Banking amp Finance by
Macmillion
Khanka S S (2010) Microfinance in India From Evolution to Revolution In J U
Ahmed D Bhagat amp G Singaiah (Eds) Microfinance in India Issues and
Challenges (pp 3-14) Guwahati DVs Publications
236
Lalitha N (2011 February) Sustainable Management of Local Resources YOJANA 55
pp 32-35
Mathaw J amp Verghese J (2011 November) Non Governmental Organisation in India
YOJANA 55 pp 12-14
NABARD (2012) Status of Microfinance in India 2011-12 Mumbai NABARD
NRLM (nd) NRLM Procurement Manual- Ministry of Rural Development Retrieved
May 1 2014 from httpruralnicinsitesdownloadslatestNRLM
20Procurement20Manualpdf
Patra D R (2011 December) Death of Microfinance in India BFM Banking Finance
Markets A Planman Financial-IIPM Think Tank Publication 1(10) pp 28-33
RBI (nd) Quarterly Statistics on Deposits and Credit of Schedule Commercial Banks
March 2007 to March 2011 Mumbai Reserve Bank of India
Roy A (nd) Microfinance and Rural Development in the North East India Retrieved
December 2013 from httpwwwpbrcoinBrochure0006pdf
Sarmah V (2010) Microfinance Vission 2015 Northeast Region India Retrieved July
2013 from httpwwwaccessdevorgdownloadsmicrofinance_vision_2015pdf
SGSY (2010) Swarnjayanti Gram Swarozgar Yojana (SGSY) Retrieved May 1 2014
from httpwwwcsjpgoaorgwp-contentuploads201010sjgsypdf
Sharma A K (2011 December) Micro Finance in the North East YOJANA pp 8-10
Shodhganga (nd) Chapter-3 Microfinance Trends Problems and Prospects Retrieved
June 2013 from httpshodhgangainflibnetacinbitstream10603303111
n_chapter203pdf
Srinivasan N (2009) Microfinance India State of the Sector Report 2009 Delhi
ACCESS Sage
Sundaram I S (2007) Microfinance in India Delhi BR Publishing Corporation
Tribune A (2007 May 7) Self-help Groups and Rural Development The Assam Tribune
Guwahati p 6
Vikash (2008 March) About the Issue Microfinance Focus II(IV) 3
Yunus M amp Jolis A (2007) Banker To The Poor The Story of the Grameen Bank New
Delhi Penguin Books
----0----
Growth Rate ()
218
The diagram clearly indicates that the growth trend in all the factors are gradually
coming down from 2007-08 to 2011-12 and more importantly the trend line of
active SHG is under all the trend lines presented in the diagram which is very
important to be considered and more important line among all the trend lines
presented in the diagram Thus positions of SHG under model-II are gradually
deteriorating and very poor during 2011-12 in the district and during the period of
study
39g Growth Trend of SHGs under SHG Model-III in Barpeta District
The growth pattern of SHGs in the district under model-III is shown in the figure-
319 and it is clearly understood from the same that the growth was highest during
2008-09 in the periods of study and after that there was sharp fall in the growth
rates in all the factors of SHGs growth rates under consideration but from 2010-11
to 2011-12 a slow progressive growth has been noticed in the diagram which is a
good sign
Growth Rate ()
220
Again the growth rate and trend of active SHG is above all the growth lines in the
figure which is found just reverse under model-II as mentioned earlier Thus from
the two diagrammatic presentations it is clear that by the end of the period under
study all the growth lines under model-II records downwards movement and the
same under model-III records upward movement or in progressive trend
39h Analysing SHG Model-wise Magnitude and Trend of Microfinance in
Barpeta District
The details of microfinance performance under each of the SHG models in the
district are presented in table-39 and it is found from the same that model-III has
performed well in terms of providing more amount of loans to the beneficiaries in
comparison to model-II if we consider the model-wise loaning performance ratio
as given in the table more amount of loans or microfinance has been availed under
model-III in all through the period of study and the average ratio of lending under
these two models comes to 0731 pa during the period of study The amount of
loan disbursed under model-II in 2007-08 was only ` 38685 lakh which at an
average annual growth of 2197 percent reached to `81181 lakh during 2011-12
and in case of loan outstanding with SHG in the district it was an amount of `
157351 lakh in 2007-08 which rose to the balance of loans outstanding to
`256484 lakh thus registered a total growth of 63 percent in period of study But
position of loans disbursed under model-III was ` 122884 lakh in 2007-08 which
with an average annual growth of 1301 percent reached to ` 202850 lakh by
March 2012 in the district including a negative growth of 176 percent in 2011-12
Again about the amount of loans outstanding with SHG in the district it was only
` 131773 lakh in 2007-08 which rose to ` 224699 lakh by March 2012 thus
registered a total growth of 7052 percent during the period of study
222
The all-women SHGs constitute the major share in the district thus an effort was
made to know the amount of loans provided to them and the total amount of loans
provided to those SHG under model-II was ` 144987 lakh in 2007-08 which by
registering an average growth of 2033 percent pa reached to ` 271696 lakh by
March 2012 The same under model-III was ` 199793 lakh in 2007-08 rose with
an average growth of 1818 percent pa and reached to ` 298333 lakh by March
2012 Further the women SHGs are given in an average 7579 percent of the total
amount loans under model-II during the whole period of study and the same under
model-III was in an average of 8589 percent during same period of study in the
district Thus under model-III 1010 percent more amount of loans had been
extended to the all-women SHGs in the district in all through the period of study
Again total amount of loans provided under model-II in the district was ` 196036
lakh in 2007-08 which increased with an average growth rate of 1524 percent pa
and reached to ` 252362 lakh in 2011-12 and the same under model-III was `
254657 lakh in 2007-08 which rose to ` 259989 lakh by recording an average
growth of 1306 percent pa during the entire period of study Surprisingly despite
having such huge volume of SHG under model-II (ie 9099 of the total SHG in
the district) in the district only 4350 percent of the grand total amounts of loans
were provided to SHGs in 2007-08 and that under model-III was 5650 percent to
only 901 percent of the total SHGs of the said period This huge disparity signifies
that the SHGs under model-III were availed more amount of loans and SHGs under
model-II were under-served or extended poor amounts of loan Again if we
consider the same for the year 2011-12 an amount of ` 252362 lakh which is
4227 percent of the grand total amount of loans were extended to the beneficiaries
under model-II in the district and under model-III the same was ` 259989 lakh
which is 5773 percent of the grand total amount of loans provided in the same
period of study The magnitude and trend of microfinance in the district is also
presented with a diagram in figure-320 to understand the scenario more clearly
Amount in Lakh
224
Simply it can be understand from the diagram that in all the factors of loans to the
SHGs performance under model-III is more lucrative and provided more amounts
year after year thus model-III holds better position in the magnitude of loans in
Barpeta district of Assam
39i Analyzing the Comparative Growth Trend of Microfinance under SHG
Model-II and III in Barpeta District
The growth trend of microfinance under each of the SHG models under study
behave and move in reverse way as under model-II the growth trends fluctuate
considerably during the period of study in the district but the growth trends under
model-III slowly progressed from 2007-08 to 2009-10 and thereafter gradually fell
up to the end of the period under study But progress under model-III was almost
steady in comparison to model-II in the same period of study The Comparative
growth position can better be understood from the following diagram which is
prepared taking all the growth rates of loans in Barpeta District in the following
diagram
Growth Rate ()
226
So the growth trends under model-II were negative except in loan disbursed in
2008-09 which reached to the top level in 2009-10 and again fell down in 2010-10
and in 2011-12 consecutively But those under model-III experienced almost a flat
and steady growth during the period of study The growth of loans disbursed under
model-II was 1920 percent in 2007-08 which maintained an average incremental
growth of 2118 percent all through the period but registered a negative growth of
064 percent in 2011-12 The same under model-III was 1833 percent in 2007-08
and recorded an average incremental growth of 1467 percent pa during the period
of study but that stands to 176 percent negative growth in 2011-12 In the case of
growth rate of loans outstanding with the SHGs in the district it was only 1295
percent in 2007-08 which reached to 2270 percent in 2011-12 registering two
negative growths of 2141 and 250 percent respectively in 2008-09 and 2010-11
But under model-III the same was only 432 percent in 2007-08 which reached to
1715 percent in 2011-12 by registering an average growth of 1241 percent pa all
through the period of study and no negative growth had been registered in the
period The growth pattern of loans to all-women SHG is a strong factor in the
district because more than 80 percent SHGs fall under this category and in 2007-
08 it registered a growth of 1555 percent and that also maintained an average
growth of 2033 percent pa all through the period under study and stands at 1507
percent in 2011-12 overcoming a negative growth of 2027 percent in 2008-09
under model-II and the same under model-III was 1840 percent in 2007-08 and
registered an average growth of 1818 percent pa during the period of study and
reached to 1150 percent in 2001-12
Further Intermediaries-wise SHGs Position and Trend with their loans position
during the period of study in Barpeta District under Model-II and III are presented
with the help of following two diagrams
Nos of SHG
Amount in Lakh
229
The outcomes of the above diagrams is very clear as maximum SHGs are formed
under model-II by block intermediaries as shown in figure-322 but availed less
amount of loans to those few percentage of SHGs On the contrary very few
percentage of SHGs are formed under Model-III by NGOsMFIs in the district but
maximum amount of loans are availed towards those SHGs those groups are
getting more loans or frequent loans in comparison to the SHGs formed under
model-II in the district during the period of study that are shown in figure-323
310 Analyzing Comparative Growth Position of SHGs in India Assam and in
Barpeta District under the SHG Models
After going through the positions of microfinance in India Assam and in Barpeta
district as mentioned above where mixed responses are found and to show the
relative position more precisely efforts were made to have comparative study with
the core factor of performance in terms of growth trends of SHGs right from
national level to the district level and that will depict the picture more clearly As
such their performances have been presented with the help of following two
diagrams as follows in figure-324 and figure-325
Growth Rate ()
Growth Rate ()
232
In both the figures given above it is clearly depicted that there is a sharp fall in the
performance of SHGs and loans extended to them from 2009-10 onwards in all
sector of microfinance ie in India Assam and as well in Barpeta District of
Assam The position was favourable from 2007-08 to the 2009-10 as highest
growth rates were recorded during that period as shown in the figures Such drastic
down-fall in both in the growth of SHGs and in microfinance (ie in extending
total amount of loans) during the period had weakened the service of microfinance
spreads and base in the country The incidents that had occurred in Andhra Pradesh
where 30 farmers had committed suicide within a span of 45 days in 2010 after a
few MFIs used coercive recovery tactics (Patra 2011) is a strong reason for such
adverse scenario as after such incidents many financing banks and institutions
stopped financing to MFIs The subsidy provision under SGSY programme also
weakened the base of a group of SHGs which were formed only to take the
benefits of subsidy and not SHGs as a means of self-employment provisions is also
added to the reason of such downfall in the performance of microfinance sector in
our country Again the change of programme from SGSY now to newly introduced
NRLM also concentrate a lot in the change of the functional structures power and
management and also weakens the rapid growth and speeds of microfinance sector
in the country during the period under study
311 Conclusion
During the period under study the performance under microfinance service has
been moved in two way dimensions as in the first half of the period ie from
2007-08 to 2009-10 the performance was in progressive trend in India Assam and
as well in Barpeta district of Assam but in the later part of the period of study the
performance and progress experienced downfall While we consider the magnitude
of microfinance services in Assam in terms of SHG with saving in banks it is
found that only 347 percent SHGs belong to Assam and same is 1879 percent
233
highest in the country in case of Andhra Pradesh by the end of March 2012 The
relative position of Assam in NER is good as Assam occupied 7542 percent of the
total SHGs of the region and that with the amount of savings of `984598 lakh
which stands at 6456 percent of the total amount of savings of NER Thus Assam
is in leading position in the region followed by Tripura and then Meghalaya
(NABARD 2012) In case of amount of loans disbursed to SHGs in 2011-12
Assam is having only 113 percent of the total amount of loans disbursed in India
and among NER it is 4154 percent followed by Tripura and Manipur
On SHG model-wise analysis it is found that SHG-bank linkage models (together
SHG Model-I amp II) remain in dominant position in terms of volume of SHGs and
absolute amount of loans availed to SHGs in the country than MFI-bank linkage
model (ie SHG Model-III) during the period of study But in Barpeta District of
Assam some variation in the model-wise performance has been found during the
period of study as model-II is found popular and covered more number of members
and is able to form more numbers of SHGs in comparison to that of under model-
III As of the total SHGs in the district 8975 percent are formed under model-II
and only1025 percent SHGs are under model-III in 2011-12 Again total amount
of loans given to SHGs under model-II in the same period was ` 337665 lakh
which was 4413 percent of the grand total amount of loans under both the models
and the rest 5587 percent were given to only 1025 percent of the total SHGs in
the district Thus SHGs under model-III are given more amount of loans or
frequent loans in comparison to the SHG under model-II in the district during the
period of study In terms of growth factors under each of these two models growth
trends under model-II both in case of SHG and in amount of loans to them more
fluctuations or ups and downs were recorded during the period of study and by the
end of the period particularly in 2010-11 and 2011-12 the growth trends were
down-falling in the district But the same under model-III were almost steady
during the period of study with a bit high in 2009-10 and a bit low in latter part of
the period of study particularly in 2010-11 to 2011-12 in the district Again in
234
terms of sustainability of SHGs formed under each of the SHG models also varies
a lot The SHGs formed managed and financed under model-II are half in an
average of the total are defunct SHGs and only 50 percent of them survive or are
functional in the district but the same under model-III is found more than 91
percent as active and functional during the period of study in the district Thus
over-all performance of SHGs under SHG model-III in the district during the period
of study is better than SHGs under model-II in respect of service quantum of
loans growth trends and sustainability etc
References
(2006) Statistical Hand Book of Assam Guwahati Directorate of Economics and
Statistics Government of Assam
Asif M (2011 November) Role of NGOs in India YOJANA 55 pp 8-10
Bandhan (nd) Bandhan Hope for the Poor Product Information Broucher of Bandhan
West Bengal India Bandhan
Baruah P B (2012) Impact of Microfinance on Poverty A Study of Twenty Self-Help
Groups in Nalbari District Assam Journal of Rural Development 31(2) 223-234
Bharali S (2010 July 18) An Institute Promotion of Secure Sustainable Livelihood
ASOMI Barta 6(6)
Borbora S amp Sarma G K (nd) Microfinance Institutions Sustainability and Outreach
Retrieved May 2 2014 from httpwwwwbiconprocom314-borborapdf
CGAP (nd) Consultative Group to Assist the Poor Retrieved from wwwcgaporg
Chatterjee N amp Dar M A (2011 November) Role of NGOs in Rural Development
YOJANA 55 pp 17-20
Chief Ministers Micro Finance Scheme-Assam Financial Corporation (CMMFS) Khudra
Reen (nd) Retrieved May 1 2014 from httpwwwafconlinegovin
documentbroucherpdf
Chief Ministers Micro Finance Schemes- Assam Financial Corporation (nd) Retrieved
May 1 2014 from httpwwwafconlinegovinpdfmfnbbrochure Englishpdf
Das D (nd) Informal Microfinance in Assam Empirical Evidence from Nalbari and
Baksa Districts Retrieved November 2013 from IFMR Centre for Microfinance
235
Research httpwwwifmrleadorgcmfwp-contentuploadsattachmentscsy1685
informal20MF20in20Assampdf
Das K (2012 January- March) Financial Inclusion-A Gateway to Sustainable
Development for the Impoverished Journal of Rural Development NIRD 31(1)
115-128
Das R L Dutta D N Kakoti P amp Deka S N (2011) Rural and Microfinance
Guwahati BLJ Publication
Deb B (2012) Microfinance and Poverty Alleviation A Case Study on Rgvn-Csp Indian
Journal of Applied Research 71-74
Desai V (2005) NGOs Gender Mainstreaming and Urban Communities in Mumbai
Gender and Development 13(2) 90-98
Devi M (2012 January 20) Rural Industrialisation for Development The Assam Tribune
Guwahati p 6
Dhar P K (2009) The Economy of Assam Including Economy of Narth East India New
Delhi Kalyani Publishers
Dutta J amp Upadhaya M (2013 August 23) Green Microfinance for Eco-friendly
Development The Assam Tribune (English Daily News Paper) p 6
Economic Survey Assam 2011-12 (nd) Retrieved April 30 2014 from
httpwwwecostatassamnicinads_economic20survey-2011-12pdf
Executive Summary Part-I An Overview of State Focus Paper 2006-07 (nd) Retrieved
April 30 2014 from httpwwwnabardorgpdfAssam20EXECUTIVE
20SUMMARYpdf
Gadiapannivar R D (nd) IFMR Centre for Microfinance Retrieved November 2013
from wwwifmracincmf httpwwwifmrleadorgcmf
Ghosh M (2012 July-Sept) Microfinance and Rural Poverty in India SHG-Bank Linkage
Programme Journal of Rural Development 31(3) 347-363
Gogoi P (2013) Economic Empowerment of Rural Women Through Income Generating
Activities In B M Doley (Ed) Women in Rural Development (Seminar Volume)
(pp 36-45) Guwahati Publication Board Silapathar College Dhemaji Assam
IIBF (2010) Rural Banking New Delhi Indian Institute of Banking amp Finance by
Macmillion
Khanka S S (2010) Microfinance in India From Evolution to Revolution In J U
Ahmed D Bhagat amp G Singaiah (Eds) Microfinance in India Issues and
Challenges (pp 3-14) Guwahati DVs Publications
236
Lalitha N (2011 February) Sustainable Management of Local Resources YOJANA 55
pp 32-35
Mathaw J amp Verghese J (2011 November) Non Governmental Organisation in India
YOJANA 55 pp 12-14
NABARD (2012) Status of Microfinance in India 2011-12 Mumbai NABARD
NRLM (nd) NRLM Procurement Manual- Ministry of Rural Development Retrieved
May 1 2014 from httpruralnicinsitesdownloadslatestNRLM
20Procurement20Manualpdf
Patra D R (2011 December) Death of Microfinance in India BFM Banking Finance
Markets A Planman Financial-IIPM Think Tank Publication 1(10) pp 28-33
RBI (nd) Quarterly Statistics on Deposits and Credit of Schedule Commercial Banks
March 2007 to March 2011 Mumbai Reserve Bank of India
Roy A (nd) Microfinance and Rural Development in the North East India Retrieved
December 2013 from httpwwwpbrcoinBrochure0006pdf
Sarmah V (2010) Microfinance Vission 2015 Northeast Region India Retrieved July
2013 from httpwwwaccessdevorgdownloadsmicrofinance_vision_2015pdf
SGSY (2010) Swarnjayanti Gram Swarozgar Yojana (SGSY) Retrieved May 1 2014
from httpwwwcsjpgoaorgwp-contentuploads201010sjgsypdf
Sharma A K (2011 December) Micro Finance in the North East YOJANA pp 8-10
Shodhganga (nd) Chapter-3 Microfinance Trends Problems and Prospects Retrieved
June 2013 from httpshodhgangainflibnetacinbitstream10603303111
n_chapter203pdf
Srinivasan N (2009) Microfinance India State of the Sector Report 2009 Delhi
ACCESS Sage
Sundaram I S (2007) Microfinance in India Delhi BR Publishing Corporation
Tribune A (2007 May 7) Self-help Groups and Rural Development The Assam Tribune
Guwahati p 6
Vikash (2008 March) About the Issue Microfinance Focus II(IV) 3
Yunus M amp Jolis A (2007) Banker To The Poor The Story of the Grameen Bank New
Delhi Penguin Books
----0----

Growth Rate ()
220
Again the growth rate and trend of active SHG is above all the growth lines in the
figure which is found just reverse under model-II as mentioned earlier Thus from
the two diagrammatic presentations it is clear that by the end of the period under
study all the growth lines under model-II records downwards movement and the
same under model-III records upward movement or in progressive trend
39h Analysing SHG Model-wise Magnitude and Trend of Microfinance in
Barpeta District
The details of microfinance performance under each of the SHG models in the
district are presented in table-39 and it is found from the same that model-III has
performed well in terms of providing more amount of loans to the beneficiaries in
comparison to model-II if we consider the model-wise loaning performance ratio
as given in the table more amount of loans or microfinance has been availed under
model-III in all through the period of study and the average ratio of lending under
these two models comes to 0731 pa during the period of study The amount of
loan disbursed under model-II in 2007-08 was only ` 38685 lakh which at an
average annual growth of 2197 percent reached to `81181 lakh during 2011-12
and in case of loan outstanding with SHG in the district it was an amount of `
157351 lakh in 2007-08 which rose to the balance of loans outstanding to
`256484 lakh thus registered a total growth of 63 percent in period of study But
position of loans disbursed under model-III was ` 122884 lakh in 2007-08 which
with an average annual growth of 1301 percent reached to ` 202850 lakh by
March 2012 in the district including a negative growth of 176 percent in 2011-12
Again about the amount of loans outstanding with SHG in the district it was only
` 131773 lakh in 2007-08 which rose to ` 224699 lakh by March 2012 thus
registered a total growth of 7052 percent during the period of study
222
The all-women SHGs constitute the major share in the district thus an effort was
made to know the amount of loans provided to them and the total amount of loans
provided to those SHG under model-II was ` 144987 lakh in 2007-08 which by
registering an average growth of 2033 percent pa reached to ` 271696 lakh by
March 2012 The same under model-III was ` 199793 lakh in 2007-08 rose with
an average growth of 1818 percent pa and reached to ` 298333 lakh by March
2012 Further the women SHGs are given in an average 7579 percent of the total
amount loans under model-II during the whole period of study and the same under
model-III was in an average of 8589 percent during same period of study in the
district Thus under model-III 1010 percent more amount of loans had been
extended to the all-women SHGs in the district in all through the period of study
Again total amount of loans provided under model-II in the district was ` 196036
lakh in 2007-08 which increased with an average growth rate of 1524 percent pa
and reached to ` 252362 lakh in 2011-12 and the same under model-III was `
254657 lakh in 2007-08 which rose to ` 259989 lakh by recording an average
growth of 1306 percent pa during the entire period of study Surprisingly despite
having such huge volume of SHG under model-II (ie 9099 of the total SHG in
the district) in the district only 4350 percent of the grand total amounts of loans
were provided to SHGs in 2007-08 and that under model-III was 5650 percent to
only 901 percent of the total SHGs of the said period This huge disparity signifies
that the SHGs under model-III were availed more amount of loans and SHGs under
model-II were under-served or extended poor amounts of loan Again if we
consider the same for the year 2011-12 an amount of ` 252362 lakh which is
4227 percent of the grand total amount of loans were extended to the beneficiaries
under model-II in the district and under model-III the same was ` 259989 lakh
which is 5773 percent of the grand total amount of loans provided in the same
period of study The magnitude and trend of microfinance in the district is also
presented with a diagram in figure-320 to understand the scenario more clearly
Amount in Lakh
224
Simply it can be understand from the diagram that in all the factors of loans to the
SHGs performance under model-III is more lucrative and provided more amounts
year after year thus model-III holds better position in the magnitude of loans in
Barpeta district of Assam
39i Analyzing the Comparative Growth Trend of Microfinance under SHG
Model-II and III in Barpeta District
The growth trend of microfinance under each of the SHG models under study
behave and move in reverse way as under model-II the growth trends fluctuate
considerably during the period of study in the district but the growth trends under
model-III slowly progressed from 2007-08 to 2009-10 and thereafter gradually fell
up to the end of the period under study But progress under model-III was almost
steady in comparison to model-II in the same period of study The Comparative
growth position can better be understood from the following diagram which is
prepared taking all the growth rates of loans in Barpeta District in the following
diagram
Growth Rate ()
226
So the growth trends under model-II were negative except in loan disbursed in
2008-09 which reached to the top level in 2009-10 and again fell down in 2010-10
and in 2011-12 consecutively But those under model-III experienced almost a flat
and steady growth during the period of study The growth of loans disbursed under
model-II was 1920 percent in 2007-08 which maintained an average incremental
growth of 2118 percent all through the period but registered a negative growth of
064 percent in 2011-12 The same under model-III was 1833 percent in 2007-08
and recorded an average incremental growth of 1467 percent pa during the period
of study but that stands to 176 percent negative growth in 2011-12 In the case of
growth rate of loans outstanding with the SHGs in the district it was only 1295
percent in 2007-08 which reached to 2270 percent in 2011-12 registering two
negative growths of 2141 and 250 percent respectively in 2008-09 and 2010-11
But under model-III the same was only 432 percent in 2007-08 which reached to
1715 percent in 2011-12 by registering an average growth of 1241 percent pa all
through the period of study and no negative growth had been registered in the
period The growth pattern of loans to all-women SHG is a strong factor in the
district because more than 80 percent SHGs fall under this category and in 2007-
08 it registered a growth of 1555 percent and that also maintained an average
growth of 2033 percent pa all through the period under study and stands at 1507
percent in 2011-12 overcoming a negative growth of 2027 percent in 2008-09
under model-II and the same under model-III was 1840 percent in 2007-08 and
registered an average growth of 1818 percent pa during the period of study and
reached to 1150 percent in 2001-12
Further Intermediaries-wise SHGs Position and Trend with their loans position
during the period of study in Barpeta District under Model-II and III are presented
with the help of following two diagrams
Nos of SHG
Amount in Lakh
229
The outcomes of the above diagrams is very clear as maximum SHGs are formed
under model-II by block intermediaries as shown in figure-322 but availed less
amount of loans to those few percentage of SHGs On the contrary very few
percentage of SHGs are formed under Model-III by NGOsMFIs in the district but
maximum amount of loans are availed towards those SHGs those groups are
getting more loans or frequent loans in comparison to the SHGs formed under
model-II in the district during the period of study that are shown in figure-323
310 Analyzing Comparative Growth Position of SHGs in India Assam and in
Barpeta District under the SHG Models
After going through the positions of microfinance in India Assam and in Barpeta
district as mentioned above where mixed responses are found and to show the
relative position more precisely efforts were made to have comparative study with
the core factor of performance in terms of growth trends of SHGs right from
national level to the district level and that will depict the picture more clearly As
such their performances have been presented with the help of following two
diagrams as follows in figure-324 and figure-325
Growth Rate ()
Growth Rate ()
232
In both the figures given above it is clearly depicted that there is a sharp fall in the
performance of SHGs and loans extended to them from 2009-10 onwards in all
sector of microfinance ie in India Assam and as well in Barpeta District of
Assam The position was favourable from 2007-08 to the 2009-10 as highest
growth rates were recorded during that period as shown in the figures Such drastic
down-fall in both in the growth of SHGs and in microfinance (ie in extending
total amount of loans) during the period had weakened the service of microfinance
spreads and base in the country The incidents that had occurred in Andhra Pradesh
where 30 farmers had committed suicide within a span of 45 days in 2010 after a
few MFIs used coercive recovery tactics (Patra 2011) is a strong reason for such
adverse scenario as after such incidents many financing banks and institutions
stopped financing to MFIs The subsidy provision under SGSY programme also
weakened the base of a group of SHGs which were formed only to take the
benefits of subsidy and not SHGs as a means of self-employment provisions is also
added to the reason of such downfall in the performance of microfinance sector in
our country Again the change of programme from SGSY now to newly introduced
NRLM also concentrate a lot in the change of the functional structures power and
management and also weakens the rapid growth and speeds of microfinance sector
in the country during the period under study
311 Conclusion
During the period under study the performance under microfinance service has
been moved in two way dimensions as in the first half of the period ie from
2007-08 to 2009-10 the performance was in progressive trend in India Assam and
as well in Barpeta district of Assam but in the later part of the period of study the
performance and progress experienced downfall While we consider the magnitude
of microfinance services in Assam in terms of SHG with saving in banks it is
found that only 347 percent SHGs belong to Assam and same is 1879 percent
233
highest in the country in case of Andhra Pradesh by the end of March 2012 The
relative position of Assam in NER is good as Assam occupied 7542 percent of the
total SHGs of the region and that with the amount of savings of `984598 lakh
which stands at 6456 percent of the total amount of savings of NER Thus Assam
is in leading position in the region followed by Tripura and then Meghalaya
(NABARD 2012) In case of amount of loans disbursed to SHGs in 2011-12
Assam is having only 113 percent of the total amount of loans disbursed in India
and among NER it is 4154 percent followed by Tripura and Manipur
On SHG model-wise analysis it is found that SHG-bank linkage models (together
SHG Model-I amp II) remain in dominant position in terms of volume of SHGs and
absolute amount of loans availed to SHGs in the country than MFI-bank linkage
model (ie SHG Model-III) during the period of study But in Barpeta District of
Assam some variation in the model-wise performance has been found during the
period of study as model-II is found popular and covered more number of members
and is able to form more numbers of SHGs in comparison to that of under model-
III As of the total SHGs in the district 8975 percent are formed under model-II
and only1025 percent SHGs are under model-III in 2011-12 Again total amount
of loans given to SHGs under model-II in the same period was ` 337665 lakh
which was 4413 percent of the grand total amount of loans under both the models
and the rest 5587 percent were given to only 1025 percent of the total SHGs in
the district Thus SHGs under model-III are given more amount of loans or
frequent loans in comparison to the SHG under model-II in the district during the
period of study In terms of growth factors under each of these two models growth
trends under model-II both in case of SHG and in amount of loans to them more
fluctuations or ups and downs were recorded during the period of study and by the
end of the period particularly in 2010-11 and 2011-12 the growth trends were
down-falling in the district But the same under model-III were almost steady
during the period of study with a bit high in 2009-10 and a bit low in latter part of
the period of study particularly in 2010-11 to 2011-12 in the district Again in
234
terms of sustainability of SHGs formed under each of the SHG models also varies
a lot The SHGs formed managed and financed under model-II are half in an
average of the total are defunct SHGs and only 50 percent of them survive or are
functional in the district but the same under model-III is found more than 91
percent as active and functional during the period of study in the district Thus
over-all performance of SHGs under SHG model-III in the district during the period
of study is better than SHGs under model-II in respect of service quantum of
loans growth trends and sustainability etc
References
(2006) Statistical Hand Book of Assam Guwahati Directorate of Economics and
Statistics Government of Assam
Asif M (2011 November) Role of NGOs in India YOJANA 55 pp 8-10
Bandhan (nd) Bandhan Hope for the Poor Product Information Broucher of Bandhan
West Bengal India Bandhan
Baruah P B (2012) Impact of Microfinance on Poverty A Study of Twenty Self-Help
Groups in Nalbari District Assam Journal of Rural Development 31(2) 223-234
Bharali S (2010 July 18) An Institute Promotion of Secure Sustainable Livelihood
ASOMI Barta 6(6)
Borbora S amp Sarma G K (nd) Microfinance Institutions Sustainability and Outreach
Retrieved May 2 2014 from httpwwwwbiconprocom314-borborapdf
CGAP (nd) Consultative Group to Assist the Poor Retrieved from wwwcgaporg
Chatterjee N amp Dar M A (2011 November) Role of NGOs in Rural Development
YOJANA 55 pp 17-20
Chief Ministers Micro Finance Scheme-Assam Financial Corporation (CMMFS) Khudra
Reen (nd) Retrieved May 1 2014 from httpwwwafconlinegovin
documentbroucherpdf
Chief Ministers Micro Finance Schemes- Assam Financial Corporation (nd) Retrieved
May 1 2014 from httpwwwafconlinegovinpdfmfnbbrochure Englishpdf
Das D (nd) Informal Microfinance in Assam Empirical Evidence from Nalbari and
Baksa Districts Retrieved November 2013 from IFMR Centre for Microfinance
235
Research httpwwwifmrleadorgcmfwp-contentuploadsattachmentscsy1685
informal20MF20in20Assampdf
Das K (2012 January- March) Financial Inclusion-A Gateway to Sustainable
Development for the Impoverished Journal of Rural Development NIRD 31(1)
115-128
Das R L Dutta D N Kakoti P amp Deka S N (2011) Rural and Microfinance
Guwahati BLJ Publication
Deb B (2012) Microfinance and Poverty Alleviation A Case Study on Rgvn-Csp Indian
Journal of Applied Research 71-74
Desai V (2005) NGOs Gender Mainstreaming and Urban Communities in Mumbai
Gender and Development 13(2) 90-98
Devi M (2012 January 20) Rural Industrialisation for Development The Assam Tribune
Guwahati p 6
Dhar P K (2009) The Economy of Assam Including Economy of Narth East India New
Delhi Kalyani Publishers
Dutta J amp Upadhaya M (2013 August 23) Green Microfinance for Eco-friendly
Development The Assam Tribune (English Daily News Paper) p 6
Economic Survey Assam 2011-12 (nd) Retrieved April 30 2014 from
httpwwwecostatassamnicinads_economic20survey-2011-12pdf
Executive Summary Part-I An Overview of State Focus Paper 2006-07 (nd) Retrieved
April 30 2014 from httpwwwnabardorgpdfAssam20EXECUTIVE
20SUMMARYpdf
Gadiapannivar R D (nd) IFMR Centre for Microfinance Retrieved November 2013
from wwwifmracincmf httpwwwifmrleadorgcmf
Ghosh M (2012 July-Sept) Microfinance and Rural Poverty in India SHG-Bank Linkage
Programme Journal of Rural Development 31(3) 347-363
Gogoi P (2013) Economic Empowerment of Rural Women Through Income Generating
Activities In B M Doley (Ed) Women in Rural Development (Seminar Volume)
(pp 36-45) Guwahati Publication Board Silapathar College Dhemaji Assam
IIBF (2010) Rural Banking New Delhi Indian Institute of Banking amp Finance by
Macmillion
Khanka S S (2010) Microfinance in India From Evolution to Revolution In J U
Ahmed D Bhagat amp G Singaiah (Eds) Microfinance in India Issues and
Challenges (pp 3-14) Guwahati DVs Publications
236
Lalitha N (2011 February) Sustainable Management of Local Resources YOJANA 55
pp 32-35
Mathaw J amp Verghese J (2011 November) Non Governmental Organisation in India
YOJANA 55 pp 12-14
NABARD (2012) Status of Microfinance in India 2011-12 Mumbai NABARD
NRLM (nd) NRLM Procurement Manual- Ministry of Rural Development Retrieved
May 1 2014 from httpruralnicinsitesdownloadslatestNRLM
20Procurement20Manualpdf
Patra D R (2011 December) Death of Microfinance in India BFM Banking Finance
Markets A Planman Financial-IIPM Think Tank Publication 1(10) pp 28-33
RBI (nd) Quarterly Statistics on Deposits and Credit of Schedule Commercial Banks
March 2007 to March 2011 Mumbai Reserve Bank of India
Roy A (nd) Microfinance and Rural Development in the North East India Retrieved
December 2013 from httpwwwpbrcoinBrochure0006pdf
Sarmah V (2010) Microfinance Vission 2015 Northeast Region India Retrieved July
2013 from httpwwwaccessdevorgdownloadsmicrofinance_vision_2015pdf
SGSY (2010) Swarnjayanti Gram Swarozgar Yojana (SGSY) Retrieved May 1 2014
from httpwwwcsjpgoaorgwp-contentuploads201010sjgsypdf
Sharma A K (2011 December) Micro Finance in the North East YOJANA pp 8-10
Shodhganga (nd) Chapter-3 Microfinance Trends Problems and Prospects Retrieved
June 2013 from httpshodhgangainflibnetacinbitstream10603303111
n_chapter203pdf
Srinivasan N (2009) Microfinance India State of the Sector Report 2009 Delhi
ACCESS Sage
Sundaram I S (2007) Microfinance in India Delhi BR Publishing Corporation
Tribune A (2007 May 7) Self-help Groups and Rural Development The Assam Tribune
Guwahati p 6
Vikash (2008 March) About the Issue Microfinance Focus II(IV) 3
Yunus M amp Jolis A (2007) Banker To The Poor The Story of the Grameen Bank New
Delhi Penguin Books
----0----

Amount in Lakh
224
Simply it can be understand from the diagram that in all the factors of loans to the
SHGs performance under model-III is more lucrative and provided more amounts
year after year thus model-III holds better position in the magnitude of loans in
Barpeta district of Assam
39i Analyzing the Comparative Growth Trend of Microfinance under SHG
Model-II and III in Barpeta District
The growth trend of microfinance under each of the SHG models under study
behave and move in reverse way as under model-II the growth trends fluctuate
considerably during the period of study in the district but the growth trends under
model-III slowly progressed from 2007-08 to 2009-10 and thereafter gradually fell
up to the end of the period under study But progress under model-III was almost
steady in comparison to model-II in the same period of study The Comparative
growth position can better be understood from the following diagram which is
prepared taking all the growth rates of loans in Barpeta District in the following
diagram
Growth Rate ()
226
So the growth trends under model-II were negative except in loan disbursed in
2008-09 which reached to the top level in 2009-10 and again fell down in 2010-10
and in 2011-12 consecutively But those under model-III experienced almost a flat
and steady growth during the period of study The growth of loans disbursed under
model-II was 1920 percent in 2007-08 which maintained an average incremental
growth of 2118 percent all through the period but registered a negative growth of
064 percent in 2011-12 The same under model-III was 1833 percent in 2007-08
and recorded an average incremental growth of 1467 percent pa during the period
of study but that stands to 176 percent negative growth in 2011-12 In the case of
growth rate of loans outstanding with the SHGs in the district it was only 1295
percent in 2007-08 which reached to 2270 percent in 2011-12 registering two
negative growths of 2141 and 250 percent respectively in 2008-09 and 2010-11
But under model-III the same was only 432 percent in 2007-08 which reached to
1715 percent in 2011-12 by registering an average growth of 1241 percent pa all
through the period of study and no negative growth had been registered in the
period The growth pattern of loans to all-women SHG is a strong factor in the
district because more than 80 percent SHGs fall under this category and in 2007-
08 it registered a growth of 1555 percent and that also maintained an average
growth of 2033 percent pa all through the period under study and stands at 1507
percent in 2011-12 overcoming a negative growth of 2027 percent in 2008-09
under model-II and the same under model-III was 1840 percent in 2007-08 and
registered an average growth of 1818 percent pa during the period of study and
reached to 1150 percent in 2001-12
Further Intermediaries-wise SHGs Position and Trend with their loans position
during the period of study in Barpeta District under Model-II and III are presented
with the help of following two diagrams
Nos of SHG
Amount in Lakh
229
The outcomes of the above diagrams is very clear as maximum SHGs are formed
under model-II by block intermediaries as shown in figure-322 but availed less
amount of loans to those few percentage of SHGs On the contrary very few
percentage of SHGs are formed under Model-III by NGOsMFIs in the district but
maximum amount of loans are availed towards those SHGs those groups are
getting more loans or frequent loans in comparison to the SHGs formed under
model-II in the district during the period of study that are shown in figure-323
310 Analyzing Comparative Growth Position of SHGs in India Assam and in
Barpeta District under the SHG Models
After going through the positions of microfinance in India Assam and in Barpeta
district as mentioned above where mixed responses are found and to show the
relative position more precisely efforts were made to have comparative study with
the core factor of performance in terms of growth trends of SHGs right from
national level to the district level and that will depict the picture more clearly As
such their performances have been presented with the help of following two
diagrams as follows in figure-324 and figure-325
Growth Rate ()
Growth Rate ()
232
In both the figures given above it is clearly depicted that there is a sharp fall in the
performance of SHGs and loans extended to them from 2009-10 onwards in all
sector of microfinance ie in India Assam and as well in Barpeta District of
Assam The position was favourable from 2007-08 to the 2009-10 as highest
growth rates were recorded during that period as shown in the figures Such drastic
down-fall in both in the growth of SHGs and in microfinance (ie in extending
total amount of loans) during the period had weakened the service of microfinance
spreads and base in the country The incidents that had occurred in Andhra Pradesh
where 30 farmers had committed suicide within a span of 45 days in 2010 after a
few MFIs used coercive recovery tactics (Patra 2011) is a strong reason for such
adverse scenario as after such incidents many financing banks and institutions
stopped financing to MFIs The subsidy provision under SGSY programme also
weakened the base of a group of SHGs which were formed only to take the
benefits of subsidy and not SHGs as a means of self-employment provisions is also
added to the reason of such downfall in the performance of microfinance sector in
our country Again the change of programme from SGSY now to newly introduced
NRLM also concentrate a lot in the change of the functional structures power and
management and also weakens the rapid growth and speeds of microfinance sector
in the country during the period under study
311 Conclusion
During the period under study the performance under microfinance service has
been moved in two way dimensions as in the first half of the period ie from
2007-08 to 2009-10 the performance was in progressive trend in India Assam and
as well in Barpeta district of Assam but in the later part of the period of study the
performance and progress experienced downfall While we consider the magnitude
of microfinance services in Assam in terms of SHG with saving in banks it is
found that only 347 percent SHGs belong to Assam and same is 1879 percent
233
highest in the country in case of Andhra Pradesh by the end of March 2012 The
relative position of Assam in NER is good as Assam occupied 7542 percent of the
total SHGs of the region and that with the amount of savings of `984598 lakh
which stands at 6456 percent of the total amount of savings of NER Thus Assam
is in leading position in the region followed by Tripura and then Meghalaya
(NABARD 2012) In case of amount of loans disbursed to SHGs in 2011-12
Assam is having only 113 percent of the total amount of loans disbursed in India
and among NER it is 4154 percent followed by Tripura and Manipur
On SHG model-wise analysis it is found that SHG-bank linkage models (together
SHG Model-I amp II) remain in dominant position in terms of volume of SHGs and
absolute amount of loans availed to SHGs in the country than MFI-bank linkage
model (ie SHG Model-III) during the period of study But in Barpeta District of
Assam some variation in the model-wise performance has been found during the
period of study as model-II is found popular and covered more number of members
and is able to form more numbers of SHGs in comparison to that of under model-
III As of the total SHGs in the district 8975 percent are formed under model-II
and only1025 percent SHGs are under model-III in 2011-12 Again total amount
of loans given to SHGs under model-II in the same period was ` 337665 lakh
which was 4413 percent of the grand total amount of loans under both the models
and the rest 5587 percent were given to only 1025 percent of the total SHGs in
the district Thus SHGs under model-III are given more amount of loans or
frequent loans in comparison to the SHG under model-II in the district during the
period of study In terms of growth factors under each of these two models growth
trends under model-II both in case of SHG and in amount of loans to them more
fluctuations or ups and downs were recorded during the period of study and by the
end of the period particularly in 2010-11 and 2011-12 the growth trends were
down-falling in the district But the same under model-III were almost steady
during the period of study with a bit high in 2009-10 and a bit low in latter part of
the period of study particularly in 2010-11 to 2011-12 in the district Again in
234
terms of sustainability of SHGs formed under each of the SHG models also varies
a lot The SHGs formed managed and financed under model-II are half in an
average of the total are defunct SHGs and only 50 percent of them survive or are
functional in the district but the same under model-III is found more than 91
percent as active and functional during the period of study in the district Thus
over-all performance of SHGs under SHG model-III in the district during the period
of study is better than SHGs under model-II in respect of service quantum of
loans growth trends and sustainability etc
References
(2006) Statistical Hand Book of Assam Guwahati Directorate of Economics and
Statistics Government of Assam
Asif M (2011 November) Role of NGOs in India YOJANA 55 pp 8-10
Bandhan (nd) Bandhan Hope for the Poor Product Information Broucher of Bandhan
West Bengal India Bandhan
Baruah P B (2012) Impact of Microfinance on Poverty A Study of Twenty Self-Help
Groups in Nalbari District Assam Journal of Rural Development 31(2) 223-234
Bharali S (2010 July 18) An Institute Promotion of Secure Sustainable Livelihood
ASOMI Barta 6(6)
Borbora S amp Sarma G K (nd) Microfinance Institutions Sustainability and Outreach
Retrieved May 2 2014 from httpwwwwbiconprocom314-borborapdf
CGAP (nd) Consultative Group to Assist the Poor Retrieved from wwwcgaporg
Chatterjee N amp Dar M A (2011 November) Role of NGOs in Rural Development
YOJANA 55 pp 17-20
Chief Ministers Micro Finance Scheme-Assam Financial Corporation (CMMFS) Khudra
Reen (nd) Retrieved May 1 2014 from httpwwwafconlinegovin
documentbroucherpdf
Chief Ministers Micro Finance Schemes- Assam Financial Corporation (nd) Retrieved
May 1 2014 from httpwwwafconlinegovinpdfmfnbbrochure Englishpdf
Das D (nd) Informal Microfinance in Assam Empirical Evidence from Nalbari and
Baksa Districts Retrieved November 2013 from IFMR Centre for Microfinance
235
Research httpwwwifmrleadorgcmfwp-contentuploadsattachmentscsy1685
informal20MF20in20Assampdf
Das K (2012 January- March) Financial Inclusion-A Gateway to Sustainable
Development for the Impoverished Journal of Rural Development NIRD 31(1)
115-128
Das R L Dutta D N Kakoti P amp Deka S N (2011) Rural and Microfinance
Guwahati BLJ Publication
Deb B (2012) Microfinance and Poverty Alleviation A Case Study on Rgvn-Csp Indian
Journal of Applied Research 71-74
Desai V (2005) NGOs Gender Mainstreaming and Urban Communities in Mumbai
Gender and Development 13(2) 90-98
Devi M (2012 January 20) Rural Industrialisation for Development The Assam Tribune
Guwahati p 6
Dhar P K (2009) The Economy of Assam Including Economy of Narth East India New
Delhi Kalyani Publishers
Dutta J amp Upadhaya M (2013 August 23) Green Microfinance for Eco-friendly
Development The Assam Tribune (English Daily News Paper) p 6
Economic Survey Assam 2011-12 (nd) Retrieved April 30 2014 from
httpwwwecostatassamnicinads_economic20survey-2011-12pdf
Executive Summary Part-I An Overview of State Focus Paper 2006-07 (nd) Retrieved
April 30 2014 from httpwwwnabardorgpdfAssam20EXECUTIVE
20SUMMARYpdf
Gadiapannivar R D (nd) IFMR Centre for Microfinance Retrieved November 2013
from wwwifmracincmf httpwwwifmrleadorgcmf
Ghosh M (2012 July-Sept) Microfinance and Rural Poverty in India SHG-Bank Linkage
Programme Journal of Rural Development 31(3) 347-363
Gogoi P (2013) Economic Empowerment of Rural Women Through Income Generating
Activities In B M Doley (Ed) Women in Rural Development (Seminar Volume)
(pp 36-45) Guwahati Publication Board Silapathar College Dhemaji Assam
IIBF (2010) Rural Banking New Delhi Indian Institute of Banking amp Finance by
Macmillion
Khanka S S (2010) Microfinance in India From Evolution to Revolution In J U
Ahmed D Bhagat amp G Singaiah (Eds) Microfinance in India Issues and
Challenges (pp 3-14) Guwahati DVs Publications
236
Lalitha N (2011 February) Sustainable Management of Local Resources YOJANA 55
pp 32-35
Mathaw J amp Verghese J (2011 November) Non Governmental Organisation in India
YOJANA 55 pp 12-14
NABARD (2012) Status of Microfinance in India 2011-12 Mumbai NABARD
NRLM (nd) NRLM Procurement Manual- Ministry of Rural Development Retrieved
May 1 2014 from httpruralnicinsitesdownloadslatestNRLM
20Procurement20Manualpdf
Patra D R (2011 December) Death of Microfinance in India BFM Banking Finance
Markets A Planman Financial-IIPM Think Tank Publication 1(10) pp 28-33
RBI (nd) Quarterly Statistics on Deposits and Credit of Schedule Commercial Banks
March 2007 to March 2011 Mumbai Reserve Bank of India
Roy A (nd) Microfinance and Rural Development in the North East India Retrieved
December 2013 from httpwwwpbrcoinBrochure0006pdf
Sarmah V (2010) Microfinance Vission 2015 Northeast Region India Retrieved July
2013 from httpwwwaccessdevorgdownloadsmicrofinance_vision_2015pdf
SGSY (2010) Swarnjayanti Gram Swarozgar Yojana (SGSY) Retrieved May 1 2014
from httpwwwcsjpgoaorgwp-contentuploads201010sjgsypdf
Sharma A K (2011 December) Micro Finance in the North East YOJANA pp 8-10
Shodhganga (nd) Chapter-3 Microfinance Trends Problems and Prospects Retrieved
June 2013 from httpshodhgangainflibnetacinbitstream10603303111
n_chapter203pdf
Srinivasan N (2009) Microfinance India State of the Sector Report 2009 Delhi
ACCESS Sage
Sundaram I S (2007) Microfinance in India Delhi BR Publishing Corporation
Tribune A (2007 May 7) Self-help Groups and Rural Development The Assam Tribune
Guwahati p 6
Vikash (2008 March) About the Issue Microfinance Focus II(IV) 3
Yunus M amp Jolis A (2007) Banker To The Poor The Story of the Grameen Bank New
Delhi Penguin Books
----0----

Growth Rate ()
226
So the growth trends under model-II were negative except in loan disbursed in
2008-09 which reached to the top level in 2009-10 and again fell down in 2010-10
and in 2011-12 consecutively But those under model-III experienced almost a flat
and steady growth during the period of study The growth of loans disbursed under
model-II was 1920 percent in 2007-08 which maintained an average incremental
growth of 2118 percent all through the period but registered a negative growth of
064 percent in 2011-12 The same under model-III was 1833 percent in 2007-08
and recorded an average incremental growth of 1467 percent pa during the period
of study but that stands to 176 percent negative growth in 2011-12 In the case of
growth rate of loans outstanding with the SHGs in the district it was only 1295
percent in 2007-08 which reached to 2270 percent in 2011-12 registering two
negative growths of 2141 and 250 percent respectively in 2008-09 and 2010-11
But under model-III the same was only 432 percent in 2007-08 which reached to
1715 percent in 2011-12 by registering an average growth of 1241 percent pa all
through the period of study and no negative growth had been registered in the
period The growth pattern of loans to all-women SHG is a strong factor in the
district because more than 80 percent SHGs fall under this category and in 2007-
08 it registered a growth of 1555 percent and that also maintained an average
growth of 2033 percent pa all through the period under study and stands at 1507
percent in 2011-12 overcoming a negative growth of 2027 percent in 2008-09
under model-II and the same under model-III was 1840 percent in 2007-08 and
registered an average growth of 1818 percent pa during the period of study and
reached to 1150 percent in 2001-12
Further Intermediaries-wise SHGs Position and Trend with their loans position
during the period of study in Barpeta District under Model-II and III are presented
with the help of following two diagrams
Nos of SHG
Amount in Lakh
229
The outcomes of the above diagrams is very clear as maximum SHGs are formed
under model-II by block intermediaries as shown in figure-322 but availed less
amount of loans to those few percentage of SHGs On the contrary very few
percentage of SHGs are formed under Model-III by NGOsMFIs in the district but
maximum amount of loans are availed towards those SHGs those groups are
getting more loans or frequent loans in comparison to the SHGs formed under
model-II in the district during the period of study that are shown in figure-323
310 Analyzing Comparative Growth Position of SHGs in India Assam and in
Barpeta District under the SHG Models
After going through the positions of microfinance in India Assam and in Barpeta
district as mentioned above where mixed responses are found and to show the
relative position more precisely efforts were made to have comparative study with
the core factor of performance in terms of growth trends of SHGs right from
national level to the district level and that will depict the picture more clearly As
such their performances have been presented with the help of following two
diagrams as follows in figure-324 and figure-325
Growth Rate ()
Growth Rate ()
232
In both the figures given above it is clearly depicted that there is a sharp fall in the
performance of SHGs and loans extended to them from 2009-10 onwards in all
sector of microfinance ie in India Assam and as well in Barpeta District of
Assam The position was favourable from 2007-08 to the 2009-10 as highest
growth rates were recorded during that period as shown in the figures Such drastic
down-fall in both in the growth of SHGs and in microfinance (ie in extending
total amount of loans) during the period had weakened the service of microfinance
spreads and base in the country The incidents that had occurred in Andhra Pradesh
where 30 farmers had committed suicide within a span of 45 days in 2010 after a
few MFIs used coercive recovery tactics (Patra 2011) is a strong reason for such
adverse scenario as after such incidents many financing banks and institutions
stopped financing to MFIs The subsidy provision under SGSY programme also
weakened the base of a group of SHGs which were formed only to take the
benefits of subsidy and not SHGs as a means of self-employment provisions is also
added to the reason of such downfall in the performance of microfinance sector in
our country Again the change of programme from SGSY now to newly introduced
NRLM also concentrate a lot in the change of the functional structures power and
management and also weakens the rapid growth and speeds of microfinance sector
in the country during the period under study
311 Conclusion
During the period under study the performance under microfinance service has
been moved in two way dimensions as in the first half of the period ie from
2007-08 to 2009-10 the performance was in progressive trend in India Assam and
as well in Barpeta district of Assam but in the later part of the period of study the
performance and progress experienced downfall While we consider the magnitude
of microfinance services in Assam in terms of SHG with saving in banks it is
found that only 347 percent SHGs belong to Assam and same is 1879 percent
233
highest in the country in case of Andhra Pradesh by the end of March 2012 The
relative position of Assam in NER is good as Assam occupied 7542 percent of the
total SHGs of the region and that with the amount of savings of `984598 lakh
which stands at 6456 percent of the total amount of savings of NER Thus Assam
is in leading position in the region followed by Tripura and then Meghalaya
(NABARD 2012) In case of amount of loans disbursed to SHGs in 2011-12
Assam is having only 113 percent of the total amount of loans disbursed in India
and among NER it is 4154 percent followed by Tripura and Manipur
On SHG model-wise analysis it is found that SHG-bank linkage models (together
SHG Model-I amp II) remain in dominant position in terms of volume of SHGs and
absolute amount of loans availed to SHGs in the country than MFI-bank linkage
model (ie SHG Model-III) during the period of study But in Barpeta District of
Assam some variation in the model-wise performance has been found during the
period of study as model-II is found popular and covered more number of members
and is able to form more numbers of SHGs in comparison to that of under model-
III As of the total SHGs in the district 8975 percent are formed under model-II
and only1025 percent SHGs are under model-III in 2011-12 Again total amount
of loans given to SHGs under model-II in the same period was ` 337665 lakh
which was 4413 percent of the grand total amount of loans under both the models
and the rest 5587 percent were given to only 1025 percent of the total SHGs in
the district Thus SHGs under model-III are given more amount of loans or
frequent loans in comparison to the SHG under model-II in the district during the
period of study In terms of growth factors under each of these two models growth
trends under model-II both in case of SHG and in amount of loans to them more
fluctuations or ups and downs were recorded during the period of study and by the
end of the period particularly in 2010-11 and 2011-12 the growth trends were
down-falling in the district But the same under model-III were almost steady
during the period of study with a bit high in 2009-10 and a bit low in latter part of
the period of study particularly in 2010-11 to 2011-12 in the district Again in
234
terms of sustainability of SHGs formed under each of the SHG models also varies
a lot The SHGs formed managed and financed under model-II are half in an
average of the total are defunct SHGs and only 50 percent of them survive or are
functional in the district but the same under model-III is found more than 91
percent as active and functional during the period of study in the district Thus
over-all performance of SHGs under SHG model-III in the district during the period
of study is better than SHGs under model-II in respect of service quantum of
loans growth trends and sustainability etc
References
(2006) Statistical Hand Book of Assam Guwahati Directorate of Economics and
Statistics Government of Assam
Asif M (2011 November) Role of NGOs in India YOJANA 55 pp 8-10
Bandhan (nd) Bandhan Hope for the Poor Product Information Broucher of Bandhan
West Bengal India Bandhan
Baruah P B (2012) Impact of Microfinance on Poverty A Study of Twenty Self-Help
Groups in Nalbari District Assam Journal of Rural Development 31(2) 223-234
Bharali S (2010 July 18) An Institute Promotion of Secure Sustainable Livelihood
ASOMI Barta 6(6)
Borbora S amp Sarma G K (nd) Microfinance Institutions Sustainability and Outreach
Retrieved May 2 2014 from httpwwwwbiconprocom314-borborapdf
CGAP (nd) Consultative Group to Assist the Poor Retrieved from wwwcgaporg
Chatterjee N amp Dar M A (2011 November) Role of NGOs in Rural Development
YOJANA 55 pp 17-20
Chief Ministers Micro Finance Scheme-Assam Financial Corporation (CMMFS) Khudra
Reen (nd) Retrieved May 1 2014 from httpwwwafconlinegovin
documentbroucherpdf
Chief Ministers Micro Finance Schemes- Assam Financial Corporation (nd) Retrieved
May 1 2014 from httpwwwafconlinegovinpdfmfnbbrochure Englishpdf
Das D (nd) Informal Microfinance in Assam Empirical Evidence from Nalbari and
Baksa Districts Retrieved November 2013 from IFMR Centre for Microfinance
235
Research httpwwwifmrleadorgcmfwp-contentuploadsattachmentscsy1685
informal20MF20in20Assampdf
Das K (2012 January- March) Financial Inclusion-A Gateway to Sustainable
Development for the Impoverished Journal of Rural Development NIRD 31(1)
115-128
Das R L Dutta D N Kakoti P amp Deka S N (2011) Rural and Microfinance
Guwahati BLJ Publication
Deb B (2012) Microfinance and Poverty Alleviation A Case Study on Rgvn-Csp Indian
Journal of Applied Research 71-74
Desai V (2005) NGOs Gender Mainstreaming and Urban Communities in Mumbai
Gender and Development 13(2) 90-98
Devi M (2012 January 20) Rural Industrialisation for Development The Assam Tribune
Guwahati p 6
Dhar P K (2009) The Economy of Assam Including Economy of Narth East India New
Delhi Kalyani Publishers
Dutta J amp Upadhaya M (2013 August 23) Green Microfinance for Eco-friendly
Development The Assam Tribune (English Daily News Paper) p 6
Economic Survey Assam 2011-12 (nd) Retrieved April 30 2014 from
httpwwwecostatassamnicinads_economic20survey-2011-12pdf
Executive Summary Part-I An Overview of State Focus Paper 2006-07 (nd) Retrieved
April 30 2014 from httpwwwnabardorgpdfAssam20EXECUTIVE
20SUMMARYpdf
Gadiapannivar R D (nd) IFMR Centre for Microfinance Retrieved November 2013
from wwwifmracincmf httpwwwifmrleadorgcmf
Ghosh M (2012 July-Sept) Microfinance and Rural Poverty in India SHG-Bank Linkage
Programme Journal of Rural Development 31(3) 347-363
Gogoi P (2013) Economic Empowerment of Rural Women Through Income Generating
Activities In B M Doley (Ed) Women in Rural Development (Seminar Volume)
(pp 36-45) Guwahati Publication Board Silapathar College Dhemaji Assam
IIBF (2010) Rural Banking New Delhi Indian Institute of Banking amp Finance by
Macmillion
Khanka S S (2010) Microfinance in India From Evolution to Revolution In J U
Ahmed D Bhagat amp G Singaiah (Eds) Microfinance in India Issues and
Challenges (pp 3-14) Guwahati DVs Publications
236
Lalitha N (2011 February) Sustainable Management of Local Resources YOJANA 55
pp 32-35
Mathaw J amp Verghese J (2011 November) Non Governmental Organisation in India
YOJANA 55 pp 12-14
NABARD (2012) Status of Microfinance in India 2011-12 Mumbai NABARD
NRLM (nd) NRLM Procurement Manual- Ministry of Rural Development Retrieved
May 1 2014 from httpruralnicinsitesdownloadslatestNRLM
20Procurement20Manualpdf
Patra D R (2011 December) Death of Microfinance in India BFM Banking Finance
Markets A Planman Financial-IIPM Think Tank Publication 1(10) pp 28-33
RBI (nd) Quarterly Statistics on Deposits and Credit of Schedule Commercial Banks
March 2007 to March 2011 Mumbai Reserve Bank of India
Roy A (nd) Microfinance and Rural Development in the North East India Retrieved
December 2013 from httpwwwpbrcoinBrochure0006pdf
Sarmah V (2010) Microfinance Vission 2015 Northeast Region India Retrieved July
2013 from httpwwwaccessdevorgdownloadsmicrofinance_vision_2015pdf
SGSY (2010) Swarnjayanti Gram Swarozgar Yojana (SGSY) Retrieved May 1 2014
from httpwwwcsjpgoaorgwp-contentuploads201010sjgsypdf
Sharma A K (2011 December) Micro Finance in the North East YOJANA pp 8-10
Shodhganga (nd) Chapter-3 Microfinance Trends Problems and Prospects Retrieved
June 2013 from httpshodhgangainflibnetacinbitstream10603303111
n_chapter203pdf
Srinivasan N (2009) Microfinance India State of the Sector Report 2009 Delhi
ACCESS Sage
Sundaram I S (2007) Microfinance in India Delhi BR Publishing Corporation
Tribune A (2007 May 7) Self-help Groups and Rural Development The Assam Tribune
Guwahati p 6
Vikash (2008 March) About the Issue Microfinance Focus II(IV) 3
Yunus M amp Jolis A (2007) Banker To The Poor The Story of the Grameen Bank New
Delhi Penguin Books
----0----

Growth Rate ()
Growth Rate ()
232
In both the figures given above it is clearly depicted that there is a sharp fall in the
performance of SHGs and loans extended to them from 2009-10 onwards in all
sector of microfinance ie in India Assam and as well in Barpeta District of
Assam The position was favourable from 2007-08 to the 2009-10 as highest
growth rates were recorded during that period as shown in the figures Such drastic
down-fall in both in the growth of SHGs and in microfinance (ie in extending
total amount of loans) during the period had weakened the service of microfinance
spreads and base in the country The incidents that had occurred in Andhra Pradesh
where 30 farmers had committed suicide within a span of 45 days in 2010 after a
few MFIs used coercive recovery tactics (Patra 2011) is a strong reason for such
adverse scenario as after such incidents many financing banks and institutions
stopped financing to MFIs The subsidy provision under SGSY programme also
weakened the base of a group of SHGs which were formed only to take the
benefits of subsidy and not SHGs as a means of self-employment provisions is also
added to the reason of such downfall in the performance of microfinance sector in
our country Again the change of programme from SGSY now to newly introduced
NRLM also concentrate a lot in the change of the functional structures power and
management and also weakens the rapid growth and speeds of microfinance sector
in the country during the period under study
311 Conclusion
During the period under study the performance under microfinance service has
been moved in two way dimensions as in the first half of the period ie from
2007-08 to 2009-10 the performance was in progressive trend in India Assam and
as well in Barpeta district of Assam but in the later part of the period of study the
performance and progress experienced downfall While we consider the magnitude
of microfinance services in Assam in terms of SHG with saving in banks it is
found that only 347 percent SHGs belong to Assam and same is 1879 percent
233
highest in the country in case of Andhra Pradesh by the end of March 2012 The
relative position of Assam in NER is good as Assam occupied 7542 percent of the
total SHGs of the region and that with the amount of savings of `984598 lakh
which stands at 6456 percent of the total amount of savings of NER Thus Assam
is in leading position in the region followed by Tripura and then Meghalaya
(NABARD 2012) In case of amount of loans disbursed to SHGs in 2011-12
Assam is having only 113 percent of the total amount of loans disbursed in India
and among NER it is 4154 percent followed by Tripura and Manipur
On SHG model-wise analysis it is found that SHG-bank linkage models (together
SHG Model-I amp II) remain in dominant position in terms of volume of SHGs and
absolute amount of loans availed to SHGs in the country than MFI-bank linkage
model (ie SHG Model-III) during the period of study But in Barpeta District of
Assam some variation in the model-wise performance has been found during the
period of study as model-II is found popular and covered more number of members
and is able to form more numbers of SHGs in comparison to that of under model-
III As of the total SHGs in the district 8975 percent are formed under model-II
and only1025 percent SHGs are under model-III in 2011-12 Again total amount
of loans given to SHGs under model-II in the same period was ` 337665 lakh
which was 4413 percent of the grand total amount of loans under both the models
and the rest 5587 percent were given to only 1025 percent of the total SHGs in
the district Thus SHGs under model-III are given more amount of loans or
frequent loans in comparison to the SHG under model-II in the district during the
period of study In terms of growth factors under each of these two models growth
trends under model-II both in case of SHG and in amount of loans to them more
fluctuations or ups and downs were recorded during the period of study and by the
end of the period particularly in 2010-11 and 2011-12 the growth trends were
down-falling in the district But the same under model-III were almost steady
during the period of study with a bit high in 2009-10 and a bit low in latter part of
the period of study particularly in 2010-11 to 2011-12 in the district Again in
234
terms of sustainability of SHGs formed under each of the SHG models also varies
a lot The SHGs formed managed and financed under model-II are half in an
average of the total are defunct SHGs and only 50 percent of them survive or are
functional in the district but the same under model-III is found more than 91
percent as active and functional during the period of study in the district Thus
over-all performance of SHGs under SHG model-III in the district during the period
of study is better than SHGs under model-II in respect of service quantum of
loans growth trends and sustainability etc
References
(2006) Statistical Hand Book of Assam Guwahati Directorate of Economics and
Statistics Government of Assam
Asif M (2011 November) Role of NGOs in India YOJANA 55 pp 8-10
Bandhan (nd) Bandhan Hope for the Poor Product Information Broucher of Bandhan
West Bengal India Bandhan
Baruah P B (2012) Impact of Microfinance on Poverty A Study of Twenty Self-Help
Groups in Nalbari District Assam Journal of Rural Development 31(2) 223-234
Bharali S (2010 July 18) An Institute Promotion of Secure Sustainable Livelihood
ASOMI Barta 6(6)
Borbora S amp Sarma G K (nd) Microfinance Institutions Sustainability and Outreach
Retrieved May 2 2014 from httpwwwwbiconprocom314-borborapdf
CGAP (nd) Consultative Group to Assist the Poor Retrieved from wwwcgaporg
Chatterjee N amp Dar M A (2011 November) Role of NGOs in Rural Development
YOJANA 55 pp 17-20
Chief Ministers Micro Finance Scheme-Assam Financial Corporation (CMMFS) Khudra
Reen (nd) Retrieved May 1 2014 from httpwwwafconlinegovin
documentbroucherpdf
Chief Ministers Micro Finance Schemes- Assam Financial Corporation (nd) Retrieved
May 1 2014 from httpwwwafconlinegovinpdfmfnbbrochure Englishpdf
Das D (nd) Informal Microfinance in Assam Empirical Evidence from Nalbari and
Baksa Districts Retrieved November 2013 from IFMR Centre for Microfinance
235
Research httpwwwifmrleadorgcmfwp-contentuploadsattachmentscsy1685
informal20MF20in20Assampdf
Das K (2012 January- March) Financial Inclusion-A Gateway to Sustainable
Development for the Impoverished Journal of Rural Development NIRD 31(1)
115-128
Das R L Dutta D N Kakoti P amp Deka S N (2011) Rural and Microfinance
Guwahati BLJ Publication
Deb B (2012) Microfinance and Poverty Alleviation A Case Study on Rgvn-Csp Indian
Journal of Applied Research 71-74
Desai V (2005) NGOs Gender Mainstreaming and Urban Communities in Mumbai
Gender and Development 13(2) 90-98
Devi M (2012 January 20) Rural Industrialisation for Development The Assam Tribune
Guwahati p 6
Dhar P K (2009) The Economy of Assam Including Economy of Narth East India New
Delhi Kalyani Publishers
Dutta J amp Upadhaya M (2013 August 23) Green Microfinance for Eco-friendly
Development The Assam Tribune (English Daily News Paper) p 6
Economic Survey Assam 2011-12 (nd) Retrieved April 30 2014 from
httpwwwecostatassamnicinads_economic20survey-2011-12pdf
Executive Summary Part-I An Overview of State Focus Paper 2006-07 (nd) Retrieved
April 30 2014 from httpwwwnabardorgpdfAssam20EXECUTIVE
20SUMMARYpdf
Gadiapannivar R D (nd) IFMR Centre for Microfinance Retrieved November 2013
from wwwifmracincmf httpwwwifmrleadorgcmf
Ghosh M (2012 July-Sept) Microfinance and Rural Poverty in India SHG-Bank Linkage
Programme Journal of Rural Development 31(3) 347-363
Gogoi P (2013) Economic Empowerment of Rural Women Through Income Generating
Activities In B M Doley (Ed) Women in Rural Development (Seminar Volume)
(pp 36-45) Guwahati Publication Board Silapathar College Dhemaji Assam
IIBF (2010) Rural Banking New Delhi Indian Institute of Banking amp Finance by
Macmillion
Khanka S S (2010) Microfinance in India From Evolution to Revolution In J U
Ahmed D Bhagat amp G Singaiah (Eds) Microfinance in India Issues and
Challenges (pp 3-14) Guwahati DVs Publications
236
Lalitha N (2011 February) Sustainable Management of Local Resources YOJANA 55
pp 32-35
Mathaw J amp Verghese J (2011 November) Non Governmental Organisation in India
YOJANA 55 pp 12-14
NABARD (2012) Status of Microfinance in India 2011-12 Mumbai NABARD
NRLM (nd) NRLM Procurement Manual- Ministry of Rural Development Retrieved
May 1 2014 from httpruralnicinsitesdownloadslatestNRLM
20Procurement20Manualpdf
Patra D R (2011 December) Death of Microfinance in India BFM Banking Finance
Markets A Planman Financial-IIPM Think Tank Publication 1(10) pp 28-33
RBI (nd) Quarterly Statistics on Deposits and Credit of Schedule Commercial Banks
March 2007 to March 2011 Mumbai Reserve Bank of India
Roy A (nd) Microfinance and Rural Development in the North East India Retrieved
December 2013 from httpwwwpbrcoinBrochure0006pdf
Sarmah V (2010) Microfinance Vission 2015 Northeast Region India Retrieved July
2013 from httpwwwaccessdevorgdownloadsmicrofinance_vision_2015pdf
SGSY (2010) Swarnjayanti Gram Swarozgar Yojana (SGSY) Retrieved May 1 2014
from httpwwwcsjpgoaorgwp-contentuploads201010sjgsypdf
Sharma A K (2011 December) Micro Finance in the North East YOJANA pp 8-10
Shodhganga (nd) Chapter-3 Microfinance Trends Problems and Prospects Retrieved
June 2013 from httpshodhgangainflibnetacinbitstream10603303111
n_chapter203pdf
Srinivasan N (2009) Microfinance India State of the Sector Report 2009 Delhi
ACCESS Sage
Sundaram I S (2007) Microfinance in India Delhi BR Publishing Corporation
Tribune A (2007 May 7) Self-help Groups and Rural Development The Assam Tribune
Guwahati p 6
Vikash (2008 March) About the Issue Microfinance Focus II(IV) 3
Yunus M amp Jolis A (2007) Banker To The Poor The Story of the Grameen Bank New
Delhi Penguin Books
----0----

Growth Rate ()
232
In both the figures given above it is clearly depicted that there is a sharp fall in the
performance of SHGs and loans extended to them from 2009-10 onwards in all
sector of microfinance ie in India Assam and as well in Barpeta District of
Assam The position was favourable from 2007-08 to the 2009-10 as highest
growth rates were recorded during that period as shown in the figures Such drastic
down-fall in both in the growth of SHGs and in microfinance (ie in extending
total amount of loans) during the period had weakened the service of microfinance
spreads and base in the country The incidents that had occurred in Andhra Pradesh
where 30 farmers had committed suicide within a span of 45 days in 2010 after a
few MFIs used coercive recovery tactics (Patra 2011) is a strong reason for such
adverse scenario as after such incidents many financing banks and institutions
stopped financing to MFIs The subsidy provision under SGSY programme also
weakened the base of a group of SHGs which were formed only to take the
benefits of subsidy and not SHGs as a means of self-employment provisions is also
added to the reason of such downfall in the performance of microfinance sector in
our country Again the change of programme from SGSY now to newly introduced
NRLM also concentrate a lot in the change of the functional structures power and
management and also weakens the rapid growth and speeds of microfinance sector
in the country during the period under study
311 Conclusion
During the period under study the performance under microfinance service has
been moved in two way dimensions as in the first half of the period ie from
2007-08 to 2009-10 the performance was in progressive trend in India Assam and
as well in Barpeta district of Assam but in the later part of the period of study the
performance and progress experienced downfall While we consider the magnitude
of microfinance services in Assam in terms of SHG with saving in banks it is
found that only 347 percent SHGs belong to Assam and same is 1879 percent
233
highest in the country in case of Andhra Pradesh by the end of March 2012 The
relative position of Assam in NER is good as Assam occupied 7542 percent of the
total SHGs of the region and that with the amount of savings of `984598 lakh
which stands at 6456 percent of the total amount of savings of NER Thus Assam
is in leading position in the region followed by Tripura and then Meghalaya
(NABARD 2012) In case of amount of loans disbursed to SHGs in 2011-12
Assam is having only 113 percent of the total amount of loans disbursed in India
and among NER it is 4154 percent followed by Tripura and Manipur
On SHG model-wise analysis it is found that SHG-bank linkage models (together
SHG Model-I amp II) remain in dominant position in terms of volume of SHGs and
absolute amount of loans availed to SHGs in the country than MFI-bank linkage
model (ie SHG Model-III) during the period of study But in Barpeta District of
Assam some variation in the model-wise performance has been found during the
period of study as model-II is found popular and covered more number of members
and is able to form more numbers of SHGs in comparison to that of under model-
III As of the total SHGs in the district 8975 percent are formed under model-II
and only1025 percent SHGs are under model-III in 2011-12 Again total amount
of loans given to SHGs under model-II in the same period was ` 337665 lakh
which was 4413 percent of the grand total amount of loans under both the models
and the rest 5587 percent were given to only 1025 percent of the total SHGs in
the district Thus SHGs under model-III are given more amount of loans or
frequent loans in comparison to the SHG under model-II in the district during the
period of study In terms of growth factors under each of these two models growth
trends under model-II both in case of SHG and in amount of loans to them more
fluctuations or ups and downs were recorded during the period of study and by the
end of the period particularly in 2010-11 and 2011-12 the growth trends were
down-falling in the district But the same under model-III were almost steady
during the period of study with a bit high in 2009-10 and a bit low in latter part of
the period of study particularly in 2010-11 to 2011-12 in the district Again in
234
terms of sustainability of SHGs formed under each of the SHG models also varies
a lot The SHGs formed managed and financed under model-II are half in an
average of the total are defunct SHGs and only 50 percent of them survive or are
functional in the district but the same under model-III is found more than 91
percent as active and functional during the period of study in the district Thus
over-all performance of SHGs under SHG model-III in the district during the period
of study is better than SHGs under model-II in respect of service quantum of
loans growth trends and sustainability etc
References
(2006) Statistical Hand Book of Assam Guwahati Directorate of Economics and
Statistics Government of Assam
Asif M (2011 November) Role of NGOs in India YOJANA 55 pp 8-10
Bandhan (nd) Bandhan Hope for the Poor Product Information Broucher of Bandhan
West Bengal India Bandhan
Baruah P B (2012) Impact of Microfinance on Poverty A Study of Twenty Self-Help
Groups in Nalbari District Assam Journal of Rural Development 31(2) 223-234
Bharali S (2010 July 18) An Institute Promotion of Secure Sustainable Livelihood
ASOMI Barta 6(6)
Borbora S amp Sarma G K (nd) Microfinance Institutions Sustainability and Outreach
Retrieved May 2 2014 from httpwwwwbiconprocom314-borborapdf
CGAP (nd) Consultative Group to Assist the Poor Retrieved from wwwcgaporg
Chatterjee N amp Dar M A (2011 November) Role of NGOs in Rural Development
YOJANA 55 pp 17-20
Chief Ministers Micro Finance Scheme-Assam Financial Corporation (CMMFS) Khudra
Reen (nd) Retrieved May 1 2014 from httpwwwafconlinegovin
documentbroucherpdf
Chief Ministers Micro Finance Schemes- Assam Financial Corporation (nd) Retrieved
May 1 2014 from httpwwwafconlinegovinpdfmfnbbrochure Englishpdf
Das D (nd) Informal Microfinance in Assam Empirical Evidence from Nalbari and
Baksa Districts Retrieved November 2013 from IFMR Centre for Microfinance
235
Research httpwwwifmrleadorgcmfwp-contentuploadsattachmentscsy1685
informal20MF20in20Assampdf
Das K (2012 January- March) Financial Inclusion-A Gateway to Sustainable
Development for the Impoverished Journal of Rural Development NIRD 31(1)
115-128
Das R L Dutta D N Kakoti P amp Deka S N (2011) Rural and Microfinance
Guwahati BLJ Publication
Deb B (2012) Microfinance and Poverty Alleviation A Case Study on Rgvn-Csp Indian
Journal of Applied Research 71-74
Desai V (2005) NGOs Gender Mainstreaming and Urban Communities in Mumbai
Gender and Development 13(2) 90-98
Devi M (2012 January 20) Rural Industrialisation for Development The Assam Tribune
Guwahati p 6
Dhar P K (2009) The Economy of Assam Including Economy of Narth East India New
Delhi Kalyani Publishers
Dutta J amp Upadhaya M (2013 August 23) Green Microfinance for Eco-friendly
Development The Assam Tribune (English Daily News Paper) p 6
Economic Survey Assam 2011-12 (nd) Retrieved April 30 2014 from
httpwwwecostatassamnicinads_economic20survey-2011-12pdf
Executive Summary Part-I An Overview of State Focus Paper 2006-07 (nd) Retrieved
April 30 2014 from httpwwwnabardorgpdfAssam20EXECUTIVE
20SUMMARYpdf
Gadiapannivar R D (nd) IFMR Centre for Microfinance Retrieved November 2013
from wwwifmracincmf httpwwwifmrleadorgcmf
Ghosh M (2012 July-Sept) Microfinance and Rural Poverty in India SHG-Bank Linkage
Programme Journal of Rural Development 31(3) 347-363
Gogoi P (2013) Economic Empowerment of Rural Women Through Income Generating
Activities In B M Doley (Ed) Women in Rural Development (Seminar Volume)
(pp 36-45) Guwahati Publication Board Silapathar College Dhemaji Assam
IIBF (2010) Rural Banking New Delhi Indian Institute of Banking amp Finance by
Macmillion
Khanka S S (2010) Microfinance in India From Evolution to Revolution In J U
Ahmed D Bhagat amp G Singaiah (Eds) Microfinance in India Issues and
Challenges (pp 3-14) Guwahati DVs Publications
236
Lalitha N (2011 February) Sustainable Management of Local Resources YOJANA 55
pp 32-35
Mathaw J amp Verghese J (2011 November) Non Governmental Organisation in India
YOJANA 55 pp 12-14
NABARD (2012) Status of Microfinance in India 2011-12 Mumbai NABARD
NRLM (nd) NRLM Procurement Manual- Ministry of Rural Development Retrieved
May 1 2014 from httpruralnicinsitesdownloadslatestNRLM
20Procurement20Manualpdf
Patra D R (2011 December) Death of Microfinance in India BFM Banking Finance
Markets A Planman Financial-IIPM Think Tank Publication 1(10) pp 28-33
RBI (nd) Quarterly Statistics on Deposits and Credit of Schedule Commercial Banks
March 2007 to March 2011 Mumbai Reserve Bank of India
Roy A (nd) Microfinance and Rural Development in the North East India Retrieved
December 2013 from httpwwwpbrcoinBrochure0006pdf
Sarmah V (2010) Microfinance Vission 2015 Northeast Region India Retrieved July
2013 from httpwwwaccessdevorgdownloadsmicrofinance_vision_2015pdf
SGSY (2010) Swarnjayanti Gram Swarozgar Yojana (SGSY) Retrieved May 1 2014
from httpwwwcsjpgoaorgwp-contentuploads201010sjgsypdf
Sharma A K (2011 December) Micro Finance in the North East YOJANA pp 8-10
Shodhganga (nd) Chapter-3 Microfinance Trends Problems and Prospects Retrieved
June 2013 from httpshodhgangainflibnetacinbitstream10603303111
n_chapter203pdf
Srinivasan N (2009) Microfinance India State of the Sector Report 2009 Delhi
ACCESS Sage
Sundaram I S (2007) Microfinance in India Delhi BR Publishing Corporation
Tribune A (2007 May 7) Self-help Groups and Rural Development The Assam Tribune
Guwahati p 6
Vikash (2008 March) About the Issue Microfinance Focus II(IV) 3
Yunus M amp Jolis A (2007) Banker To The Poor The Story of the Grameen Bank New
Delhi Penguin Books
----0----