flowing wells unified school district - azauditor.gov · senator olivia cajero bedford ......
TRANSCRIPT

Performance Audit
Flowing Wells Unified School District
Division of School Audits
Debra K. DavenportAuditor General
February • 2012Report No. 12-01
A REPORTTO THE
ARIZONA LEGISLATURE

The Auditor General is appointed by the Joint Legislative Audit Committee, a bipartisan committee composed of five senators and five representatives. Her mission is to provide independent and impartial information and specific recommendations to improve the operations of state and local government entities. To this end, she provides financial audits and accounting services to the State and political subdivisions, investigates possible misuse of public monies, and conducts performance audits of school districts, state agencies, and the programs they administer.
The Joint Legislative Audit Committee
Audit Staff
Ross Ehrick, DirectorVicki Hanson, Manager and Contact Person
Briton Baxter, Team Leader Samantha Goldstein Christine Medrano
Copies of the Auditor General’s reports are free.You may request them by contacting us at:
Office of the Auditor General2910 N. 44th Street, Suite 410 • Phoenix, AZ 85018 • (602) 553-0333
Additionally, many of our reports can be found in electronic format at:
www.azauditor.gov
Representative Carl Seel, Chair
Representative Tom ChabinRepresentative Justin OlsonRepresentative David StevensRepresentative Anna TovarRepresentative Andy Tobin (ex officio)
Senator Rick Murphy, Vice Chair
Senator Andy BiggsSenator Olivia Cajero BedfordSenator Rich CrandallSenator David LujanSenator Steve Pierce (ex officio)

2910 NORTH 44th STREET • SUITE 410 • PHOENIX, ARIZONA 85018 • (602) 553-0333 • FAX (602) 553-0051
MELANIE M. CHESNEY DEPUTY AUDITOR GENERAL
DEBRA K. DAVENPORT, CPA AUDITOR GENERAL
STATE OF ARIZONA OFFICE OF THE
AUDITOR GENERAL
February 27, 2012 Members of the Arizona Legislature The Honorable Janice K. Brewer, Governor Governing Board Flowing Wells Unified School District Dr. Nicholas Clement, Superintendent Flowing Wells Unified School District Transmitted herewith is a report of the Auditor General, A Performance Audit of the Flowing Wells Unified School District, conducted pursuant to A.R.S. §41-1279.03. I am also transmitting within this report a copy of the Report Highlights for this audit to provide a quick summary for your convenience. As outlined in its response, the District agrees with all of the findings and recommendations. My staff and I will be pleased to discuss or clarify items in the report. This report will be released to the public on February 28, 2012. Sincerely, Debbie Davenport Auditor General

Less funding available in fiscal year 2010, but cuts came entirely from the classroom—Between fiscal years 2009 and 2010, Flowing Wells USD’s total per-pupil spending decreased by 8 percent, or $606 per pupil. During that same time, classroom spending declined by an even greater amount—$714 per pupil—while
nonclassroom spending actually rose.
District reduced classroom spending and shifted monies to other functional areas
REPORT HIGHLIGHTSPERFORMANCE AUDIT
Student achievement significantly higher than peer districts’—In fiscal year 2010, Flowing Wells USD’s student AIMS scores were significantly higher than peer districts’ averages. Although research suggests that students’ achievement outcomes are influenced by their poverty level, Flowing Wells USD achieved AIMS passing rates that were similar to averages for the State and for districts with much lower poverty rates. According to district officials, it was able to achieve these passing rates in large part because of its extensive teacher-training program. However, despite its high passing rates on AIMS, three of the District’s nine schools failed to meet “Adequate Yearly Progress” for the federal No Child Left Behind Act.
District’s operational efficiency mixed—In fiscal year 2010, Flowing Wells USD spent a similar amount per pupil in the classroom as peer districts. However, the percentage of resources directed to the classroom has been declining in recent years. The District’s administration operated efficiently with slightly lower costs than peer districts’ primarily because it employed fewer staff. Additionally, the District’s food service and student transportation programs operated reasonably well considering its large number of meals served and low number of miles driven. However, the District’s plant operations costs were significantly higher than peer districts averaged because it employed more plant staff, paid higher salaries due to employee longevity, and used more electricity.
Significantly higher student achievement and mixed operational efficiency
Our Conclusion
In fiscal year 2010, Flowing Wells Unified School District’s student achievement was significantly higher than peer districts’, and its operational efficiency was mixed. The District’s administration operated efficiently and with lower staffing levels than peer districts’, and its food service and student transportation programs operated reasonably well. However, the District’s plant operations costs were significantly higher than peer districts averaged because it employed more plant staff, paid higher salaries due to employee longevity, and used more electricity. Although the District operated in a reasonably efficient manner in most areas, it reduced classroom spending significantly in fiscal year 2010, shifting monies to nonclassroom areas—a trend dating back to fiscal year 2005.
2012February • Report No. 12-01
Flowing Wells Unified School District
Per Pupil
Flowing Wells USD
Peer Group
Average Administration $ 696 $748 Plant operations 1,060 874 Food service 418 322 Transportation 240 396
Expenditures by Function Fiscal Year 2010
Percentage of Students Who Met or Exceeded State Standards (AIMS) Fiscal Year 2010
0%10%20%30%40%50%60%70%80%90%
Math Reading WritingFlowing Wells USD Peer Group State-wide
Total Classroom Nonclassroom 2010 $7,347 $3,933 $3,414 2009 7,953 4,647 3,306 Difference $ (606) $ (714) $ 108
Comparison of Per-Pupil Expenditures Fiscal Years 2009 and 2010
In fiscal year 2010, Flowing Wells USD’s $7.51-per-square-foot plant operations costs were 32 percent higher than peer districts averaged. These higher costs occurred because the District employed more plant staff, paid higher salaries that reflected higher experience levels, and used more electricity.
Additional and more experienced employees increased salaries and benefit costs—Flowing Wells USD employed 73 plant operations staff compared to an average of 49 plant operations staff at an audited subset of the peer districts. Further, the District’s plant operations employees averaged 9 years of service compared to the 6 years, on average, for the audited peer districts’ plant operations employees.
District operates older and less energy-efficient buildings—The District also spent 42 percent more per square foot on electricity, in part because it operated older and less energy-efficient buildings, but also because it lacked a comprehensive energy conservation plan.
Recommendations—The District should:
• Review staffing levels to determine if it can reduce plant operations costs. • Develop and implement an energy conservation plan to help reduce electricity costs.
Higher plant costs related to higher staffing levels, more experienced staff, and high energy usage
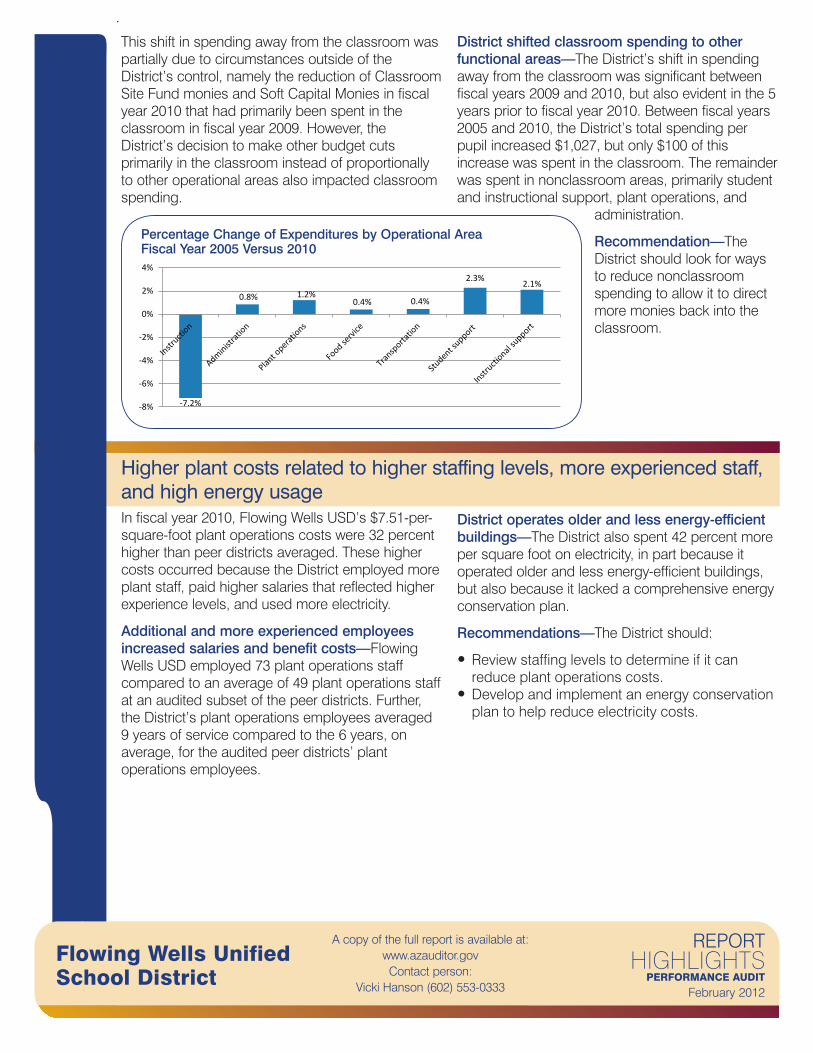
District shifted classroom spending to other functional areas—The District’s shift in spending away from the classroom was significant between fiscal years 2009 and 2010, but also evident in the 5 years prior to fiscal year 2010. Between fiscal years 2005 and 2010, the District’s total spending per pupil increased $1,027, but only $100 of this increase was spent in the classroom. The remainder was spent in nonclassroom areas, primarily student and instructional support, plant operations, and
administration.
Recommendation—The District should look for ways to reduce nonclassroom spending to allow it to direct more monies back into the classroom.
This shift in spending away from the classroom was partially due to circumstances outside of the District’s control, namely the reduction of Classroom Site Fund monies and Soft Capital Monies in fiscal year 2010 that had primarily been spent in the classroom in fiscal year 2009. However, the District’s decision to make other budget cuts primarily in the classroom instead of proportionally to other operational areas also impacted classroom spending.
Flowing Wells Unified School District
REPORT HIGHLIGHTS
PERFORMANCE AUDIT
February 2012
A copy of the full report is available at:www.azauditor.govContact person:
Vicki Hanson (602) 553-0333
Percentage Change of Expenditures by Operational Area Fiscal Year 2005 Versus 2010
-7.2%
0.8% 1.2%0.4% 0.4%
2.3% 2.1%
-8%
-6%
-4%
-2%
0%
2%
4%

TABLE OF CONTENTS
continued
page i
Office of the Auditor General
District Overview 1Student achievement significantly higher than peer districts’ 1
District’s operational efficiency mixed 2
Finding 1: District reduced classroom spending and shifted monies to other functional areas 3
Less funding available in fiscal year 2010, but spending cuts came entirely from the classroom 3
District shifted classroom spending to other functional areas 5
Recommendations 6
Finding 2: Higher plant costs related to higher staffing levels, more experienced staff, and high energy usage 7
District plant costs higher than peer districts’ 7
Recommendations 9
AppendixObjectives, Scope, and Methodology a-1
District Response

TABLE OF CONTENTS
concluded
page iiState of Arizona
Tables1 Comparison of Per-Pupil Expenditures by Function
Fiscal Year 2010 (Unaudited) 2
2 Comparison of Per-Pupil Expenditures Fiscal Years 2009 and 2010 (Unaudited) 3
3 Comparison of Cost Per Square Foot Fiscal Year 2010 (Unaudited) 7
Figures1 Percentage of Students Who Met or Exceeded State Standards (AIMS)
Fiscal Year 2010 (Unaudited) 1
2 Percentage Change of Expenditures by Operational Area Fiscal Year 2005 Versus 2010 (Unaudited) 5

DISTRICT OVERVIEW
page 1
Office of the Auditor General
Flowing Wells Unified School District is a geographically compact district covering 12 square miles in northwest Tucson. In fiscal year 2010, the District served 5,392 students at its nine schools: six kindergarten -through-6th-grade elementary schools, one 7th-through-8th-grade junior high school, one 9th-through-12th-grade high school, and one 9th-through-12th-grade alternative high school.
In fiscal year 2010, Flowing Wells USD compared favorably to peer districts in student achievement with AIMS scores that were much higher than the peer districts’ average and similar to the state-wide average.1 However, the District’s cost-efficiency in noninstructional areas was mixed. Specifically, the District’s administrative costs were slightly lower than peer districts’, and its food service and student transportation programs operated in a reasonably efficient manner. However, the District’s plant operations were less efficient, costing much more than peer districts’, on average.
Student achievement significantly higher than peer districts’
In fiscal year 2010, 63 percent of the District’s students met or exceeded state standards in math, 74 percent in reading, and 73 percent in writing. As shown in Figure 1, these scores were significantly higher than the peer districts’ averages and similar to state averages. Further, the District’s 86-percent graduation rate was higher than both the peer group’s 80-percent average and the State’s 76-percent average. Despite its high passing rates on Arizona’s Instrument to Measure Standards (AIMS), three of the District’s nine schools failed to meet “Adequate Yearly Progress” objectives for the federal No Child Left Behind Act (NCLB). The high school failed because some students did not demonstrate sufficient academic progress and because not enough students were tested. Additionally, the junior high school did not test enough students, and the alternative high school did not meet the graduation rate objective.
Although research suggests that students’ achievement outcomes are influenced by their poverty level, Flowing Wells USD achieved AIMS passing rates that were similar to districts with much lower poverty rates. According to district officials, it was able to achieve these passing rates in large part because of its extensive teacher-training program. The District’s teacher-training and teacher-mentoring programs are tailored to each teacher’s level of experience and expertise. Teachers new to the District receive mentoring from experienced, district-determined expert teachers for 3 to 6 years.
1 Auditors developed two peer groups for comparative purposes. See page a-1 of this report’s Appendix for further explanation of the peer groups.
Figure 1: Percentage of Students Who Met or Exceeded State Standards (AIMS) Fiscal Year 2010 (Unaudited)
Source: Auditor General staff analysis of fiscal year 2010 test results on Arizona’s Instrument to Measure Standards (AIMS).
0%10%20%30%40%50%60%70%80%90%
Math Reading Writing
Flowing WellsUSD
Peer Group
State-wide
page 2State of Arizona
District’s operational efficiency mixed
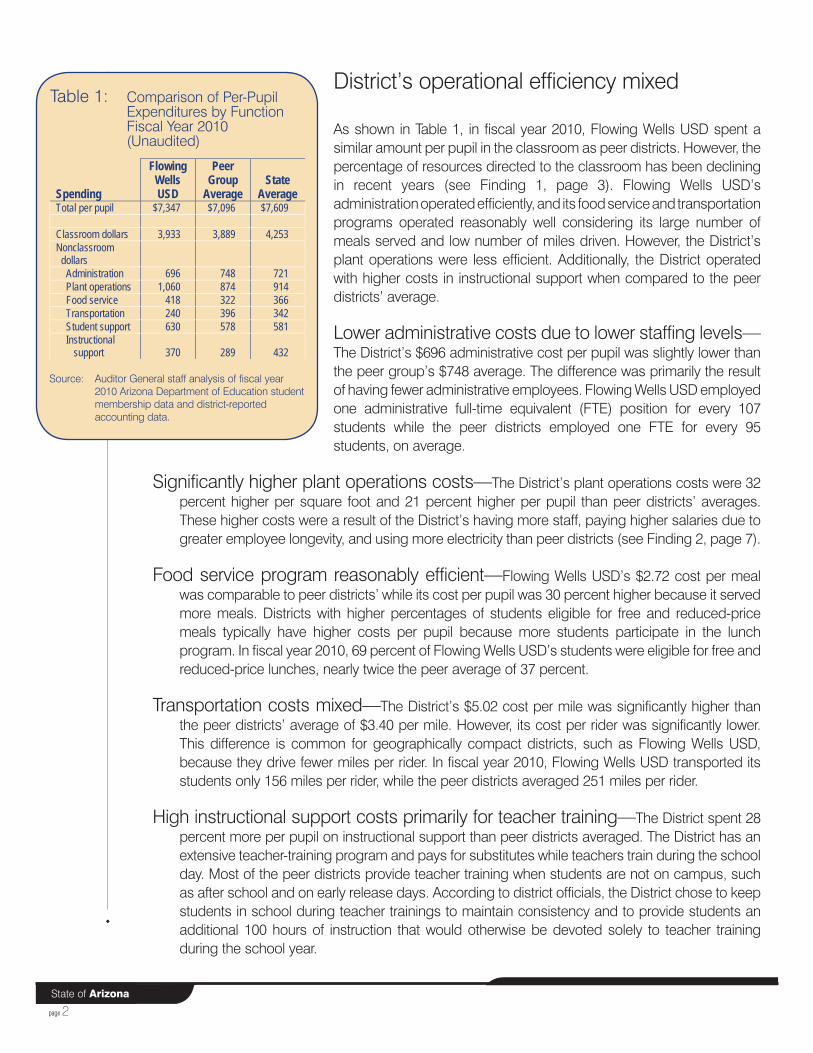
As shown in Table 1, in fiscal year 2010, Flowing Wells USD spent a similar amount per pupil in the classroom as peer districts. However, the percentage of resources directed to the classroom has been declining in recent years (see Finding 1, page 3). Flowing Wells USD’s administration operated efficiently, and its food service and transportation programs operated reasonably well considering its large number of meals served and low number of miles driven. However, the District’s plant operations were less efficient. Additionally, the District operated with higher costs in instructional support when compared to the peer districts’ average.
Lower administrative costs due to lower staffing levels—The District’s $696 administrative cost per pupil was slightly lower than the peer group’s $748 average. The difference was primarily the result of having fewer administrative employees. Flowing Wells USD employed one administrative full-time equivalent (FTE) position for every 107 students while the peer districts employed one FTE for every 95 students, on average.
Significantly higher plant operations costs—The District’s plant operations costs were 32 percent higher per square foot and 21 percent higher per pupil than peer districts’ averages. These higher costs were a result of the District’s having more staff, paying higher salaries due to greater employee longevity, and using more electricity than peer districts (see Finding 2, page 7).
Food service program reasonably efficient—Flowing Wells USD’s $2.72 cost per meal was comparable to peer districts’ while its cost per pupil was 30 percent higher because it served more meals. Districts with higher percentages of students eligible for free and reduced-price meals typically have higher costs per pupil because more students participate in the lunch program. In fiscal year 2010, 69 percent of Flowing Wells USD’s students were eligible for free and reduced-price lunches, nearly twice the peer average of 37 percent.
Transportation costs mixed—The District’s $5.02 cost per mile was significantly higher than the peer districts’ average of $3.40 per mile. However, its cost per rider was significantly lower. This difference is common for geographically compact districts, such as Flowing Wells USD, because they drive fewer miles per rider. In fiscal year 2010, Flowing Wells USD transported its students only 156 miles per rider, while the peer districts averaged 251 miles per rider.
High instructional support costs primarily for teacher training—The District spent 28 percent more per pupil on instructional support than peer districts averaged. The District has an extensive teacher-training program and pays for substitutes while teachers train during the school day. Most of the peer districts provide teacher training when students are not on campus, such as after school and on early release days. According to district officials, the District chose to keep students in school during teacher trainings to maintain consistency and to provide students an additional 100 hours of instruction that would otherwise be devoted solely to teacher training during the school year.
Spending
Flowing Wells USD
Peer Group
Average State
Average Total per pupil $7,347 $7,096 $7,609
Classroom dollars 3,933 3,889 4,253 Nonclassroom dollars Administration 696 748 721 Plant operations 1,060 874 914 Food service 418 322 366 Transportation 240 396 342 Student support 630 578 581 Instructional support 370 289 432
Table 1: Comparison of Per-Pupil Expenditures by Function Fiscal Year 2010 (Unaudited)
Source: Auditor General staff analysis of fiscal year 2010 Arizona Department of Education student membership data and district-reported accounting data.

page 3
Office of the Auditor General
FINDING 1
District reduced classroom spending and shifted monies to other functional areas
Between fiscal years 2009 and 2010, Flowing Wells USD’s total per pupil spending decreased by 8 percent, or $606 per pupil. During that same time, classroom spending declined by an even greater amount—$714 per pupil—while nonclassroom spending actually rose. As a result, the District’s percentage of resources directed into the classroom dropped from 58.4 percent in fiscal year 2009 to 53.5 percent in fiscal year 2010. This shift away from classroom spending was partially due to circumstances outside of the District’s control, namely the reduction of Classroom Site Fund (CSF) sales tax monies and Soft Capital monies in fiscal year 2010 that had been primarily spent in the classroom in fiscal year 2009.1 However, the District’s decision to make other budget cuts primarily in the classroom instead of proportionally to other operational areas also impacted its classroom spending. Further, this shift in spending away from the classroom has been evident for 5 years as the District increased spending primarily on support services, plant operations, and administration between fiscal years 2005 and 2010.
Less funding available in fiscal year 2010, but spending cuts came entirely from the classroom
As shown in Table 2, between fiscal years 2009 and 2010, the District reduced total spending by 8 percent, or $606 per pupil. In the same period, the District reduced classroom spending by $714 per pupil, from $4,647 to $3,933. Therefore, Flowing Wells USD reduced classroom spending by more than the amount of the reduction in total spending.
The reduction in classroom spending occurred, in part, because of the fiscal year 2010 state-wide reduction in available CSF and Soft Capital monies that the District had directed primarily into the classroom in fiscal year 2009. However, the reduction also occurred because the District reduced its number of teachers and had misclassified some of its expenditures. Specifically:
1 In November 2000, voters passed Proposition 301, which increased the state-wide sales tax to provide additional resources for education programs. Under statute, these monies, also known as Classroom Site Fund monies, may be spent only for specific purposes, primarily increasing teacher pay. Soft Capital monies are state monies that have historically been restricted for the purchase of short-term capital items such as technology, textbooks, library resources, instructional aids, furniture, and equipment. For fiscal years 2009 through 2011, statutes allowed districts to use these monies for any operating or capital expenditure.
Total Classroom Nonclassroom 2010 $7,347 $3,933 $3,414 2009 7,953 4,647 3,306 Difference $ (606) $ (714) $ 108
Table 2: Comparison of Per-Pupil Expenditures Fiscal Years 2009 and 2010 (Unaudited)
Source: Auditor General staff analysis of Arizona Department of Education student membership data and district-reported accounting data for fiscal years 2009 and 2010.

page 4State of Arizona
• Reduction in CSF monies available—Compared to the prior year, Flowing Wells USD received significantly less CSF monies in fiscal year 2010. As a result, the District spent about 48 percent, or $1.4 million, less in CSF monies in fiscal year 2010. Because CSF monies are required to be spent primarily in the classroom, a reduction in available CSF monies logically explains a portion of the drop in Flowing Wells USD’s classroom spending. Specifically, this reduction in CSF spending accounts for $243 of the $714-per-pupil drop in the District’s fiscal year 2010 classroom spending.
• Reduction in Soft Capital monies available—Similar to CSF monies, Flowing Wells USD received significantly less Soft Capital monies in fiscal year 2010 compared to the prior year. As a result, the District spent about 65 percent, or $652,000, less in Soft Capital monies in fiscal year 2010. Districts can choose to spend Soft Capital monies in the classroom, and in both fiscal years 2009 and 2010, Flowing Wells USD spent the majority of its Soft Capital monies in the classroom. Therefore, the reduction in available Soft Capital monies also logically explains a portion of the drop in Flowing Wells USD’s classroom spending. Specifically, this reduction accounts for $88 of the $714-per-pupil drop in the District’s fiscal year 2010 classroom spending.
• Reduction in number of teachers—District officials stated that they were conservative with budget projections when offering contracts to teachers for fiscal year 2010 because budget reductions had not been finalized. Additionally, the District had a loss of 139 students between fiscal years 2008 and 2009 that impacted its initial 2010 budget. Therefore, Flowing Wells USD reduced its number of classroom teachers by 20 in fiscal year 2010. Since there were fewer teachers, the District spent significantly less on teacher salaries and benefits. However, the District did not make corresponding cuts to other operational areas. Further, in fiscal year 2010, the District reduced its certified salary schedule by $500 for each incoming teacher to be fair to returning teachers since the District had frozen the salary schedule. These reductions resulted in a $208-per-pupil decrease in classroom spending in fiscal year 2010.
• Expenditure classification errors—Flowing Wells USD did not always classify its fiscal year 2010 expenditures in accordance with the Uniform Chart of Accounts for school districts. Auditors identified errors totaling approximately $700,000 of the District’s total $39.6 million in current spending. The District’s primary coding error occurred in its coding of counselors. The District coded counselors to instruction because they felt that the counselors were instructing students on character and coping skills that positively impact the overall education of the students. However, counselors should be coded to student support services. When corrected, these changes decreased the District’s reported instructional expenditures by almost $480,000, or $89 per pupil. The dollar amounts shown in the tables in this report reflect the necessary adjustments.

page 5
Office of the Auditor General
District shifted classroom spending to other functional areas
The District’s shift in spending away from the classroom was significant between fiscal years 2009 and 2010, but was also evident in the 5 years prior to fiscal year 2010. In fiscal year 2005, the District spent $3,833 per pupil in the classroom, or 60.7 percent of its available operating dollars.1 However, in fiscal year 2010, despite a 5-year net increase in total expenditures per pupil of $1,027, or 16 percent, the District spent only $100 more in the classroom. As a result, in fiscal year 2010, the District spent only 53.5 percent of its resources in the classroom. As shown in Figure 2 below, at the same time the District’s percentage spent on instruction decreased by 7.2 percentage points, the percentages spent on all nonclassroom areas increased.
Increases in nonclassroom spending areas resulted from changes in the student population, inefficiencies in plant operations, and increased teacher training. Specifically, between fiscal years 2005 and 2010:
• Changes in student population may have contributed to increased spending on student support services—Between fiscal years 2005 and 2010, the District increased the percentage spent on student support services from 6.3 to 8.6 percent. As previously noted, these support services, such as counseling, attendance, and therapy services, typically target economically disadvantaged and special needs students. In this 5-year period, the District’s poverty rate also increased from 20.9 percent to 24.8 percent, and its special needs population increased from 11.7 percent to 14.2 percent. These changes in student population may have contributed to the District’s 58 percent increase in spending on student support services, from $399 to $630 per pupil.
• High plant operations costs related to inefficiencies—Between fiscal years 2005 and 2010, the District increased the percentage spent on plant operations from 13.2 to 14.4 percent. Inefficiencies in this spending area, including high energy usage and high staffing levels due to district decisions related to facility maintenance, are discussed further in Finding 2, page 7.
1 Available operating dollars are those used to make current expenditures as defined in footnote 1 on page a-1. Classroom spending includes salaries and benefits of teachers and instructional aides, textbooks, and other classroom supplies.
Figure 2: Percentage Change of Expenditures by Operational Area Fiscal Year 2005 Versus 2010 (Unaudited)
Source: Auditor General staff analysis of district-reported accounting data for fiscal years 2005 and 2010.
-7.2%
0.8% 1.2%0.4% 0.4%
2.3% 2.1%
-8%
-6%
-4%
-2%
0%
2%
4%

page 6State of Arizona
• Instructional support services per pupil increased significantly, due in part to teacher-training program—Between fiscal years 2005 and 2010, the District more than doubled its spending on instructional support services, increasing from $174 to $370 per pupil.1 As a result, the instructional support percentage increased from 2.9 to 5 percent in the 5-year period. As noted in the Overview on page 2, the District has a very extensive teacher-training program, and, according to district officials, enhancements to the training program and the use of substitute teachers during teacher-training sessions contributed to this increase.
Rather than reducing only classroom spending, the District should have considered reductions across all areas, especially areas, such as plant operations, that are consistently higher than peer averages.
Recommendations
1. The District should classify all transactions in accordance with the Uniform Chart of Accounts for school districts.
2. The District should look for ways to reduce nonclassroom spending, especially in plant operations, to allow it to direct more of its monies back into the classroom.
1 Effective July 1, 2007, the Uniform Chart of Accounts for school districts provided clarification in how some expenditures should be coded. These clarifications account for some of the increase in instructional support services.
page 7
Office of the Auditor General
Higher plant costs related to higher staffing levels, more experienced staff, and high energy usage
In fiscal year 2010, Flowing Wells USD’s plant operations cost per square foot was 32 percent higher than peer districts’. The higher cost was primarily due to the District’s employing additional staff and paying higher salaries that reflected higher experience levels. The District also spent more on energy, in part because it operated older and less energy-efficient buildings, but also because it lacked a comprehensive energy conservation plan.
District plant costs higher than peer districts’
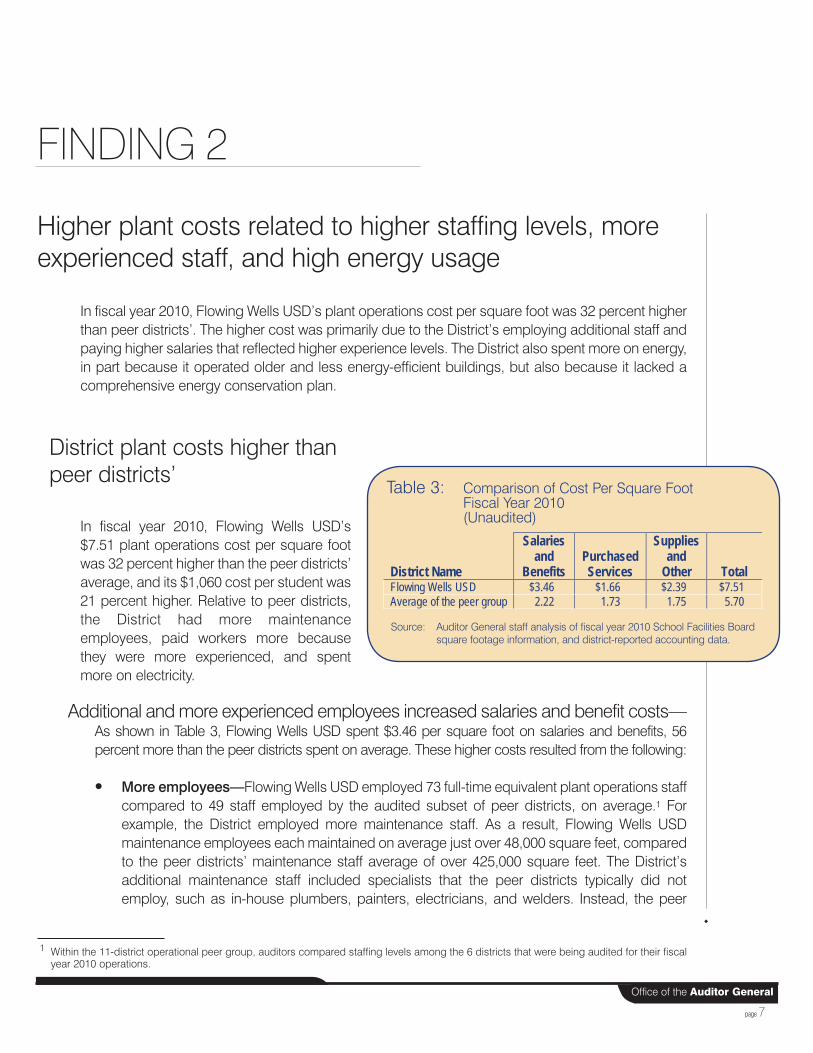
In fiscal year 2010, Flowing Wells USD’s $7.51 plant operations cost per square foot was 32 percent higher than the peer districts’ average, and its $1,060 cost per student was 21 percent higher. Relative to peer districts, the District had more maintenance employees, paid workers more because they were more experienced, and spent more on electricity.
Additional and more experienced employees increased salaries and benefit costs—As shown in Table 3, Flowing Wells USD spent $3.46 per square foot on salaries and benefits, 56 percent more than the peer districts spent on average. These higher costs resulted from the following:
• More employees—Flowing Wells USD employed 73 full-time equivalent plant operations staff compared to 49 staff employed by the audited subset of peer districts, on average.1 For example, the District employed more maintenance staff. As a result, Flowing Wells USD maintenance employees each maintained on average just over 48,000 square feet, compared to the peer districts’ maintenance staff average of over 425,000 square feet. The District’s additional maintenance staff included specialists that the peer districts typically did not employ, such as in-house plumbers, painters, electricians, and welders. Instead, the peer
1 Within the 11-district operational peer group, auditors compared staffing levels among the 6 districts that were being audited for their fiscal year 2010 operations.
FINDING 2
District Name
Salaries and
Benefits Purchased Services
Supplies and
Other Total Flowing Wells USD $3.46 $1.66 $2.39 $7.51 Average of the peer group 2.22 1.73 1.75 5.70
Table 3: Comparison of Cost Per Square Foot Fiscal Year 2010 (Unaudited)
Source: Auditor General staff analysis of fiscal year 2010 School Facilities Board square footage information, and district-reported accounting data.

page 8State of Arizona
districts contracted for these services. According to district officials, the onsite specialists ensure that repairs meet the District’s quality standards and are completed in a timely manner. However, as shown in Table 3 on page 7, Flowing Wells USD’s specialists did not appear to significantly reduce the District’s spending on purchased services compared to the peer districts’. In addition to the specialists, Flowing Wells USD employed an assistant director of plant operations. None of the peer districts employed such a position. The District should review its staffing levels to determine if any cost savings can be achieved without significantly affecting the quality and timeliness of maintenance work.
• More experienced staff—The District’s plant operations employees averaged 9 years of service compared to the 6 years, on average, for the audited peer districts’ plant operations employees. It is logical that the longer a person stays with a district, the higher he or she will advance on the pay scale, thus earning more per hour. At Flowing Wells USD, 40 percent of the District’s plant operations employees have been employed for more than a decade, compared to only 19 percent of plant operations employees at audited peer districts. At Flowing Wells USD, experienced staff included the plant director and assistant director, half of the maintenance staff, and 33 percent of the custodians. This longevity at the District’s highest level plant positions and for a large portion of plant staff provides the District with valuable experience, but at a significant cost in salaries and benefits. Further, more experienced employees are typically able to perform repairs and maintenance that a less experienced employee may not be able to do. Therefore, the District should see savings in purchased services. However, Flowing Wells USD did not see corresponding savings in purchased services.
Energy conservation plan needed to address high costs of operating older buildings—Flowing Wells USD also spent $0.54, or 42 percent, more per square foot on electricity than peer districts because it used more electricity. When compared with three other audited peer districts for which auditors had detailed electricity usage information, Flowing Wells USD used 39 percent more electricity per square foot, on average, over a 2-month sample period. The District’s high energy consumption stems from two main factors:
• Older, less energy-efficient buildings—The District has many older, poorly insulated buildings that likely increase its electricity needs. The District’s buildings are 32 years old, on average, which is almost 60 percent older than the peer group districts’ average of about 20 years.
• Lack of a comprehensive energy conservation plan to help reduce costs—The District uses an energy management system to control the temperatures at four of its newer schools, but district officials stated that it is more difficult to control temperatures at the older schools. The District does not have an energy conservation plan for these schools, but instead informs employees of the recommended temperature settings at the beginning of each school year. A more comprehensive energy conservation plan could help the District to reduce its high energy costs and provide additional resources for its instructional programs. At a minimum, to better enforce its own temperature policy, the District could consider installing locked, programmable thermostats in its older buildings. A more comprehensive energy conservation plan could also include ways to make energy-related upgrades to older facilities.

page 9
Office of the Auditor General
Recommendations
1. The District should review its staffing levels to determine if it can reduce plant operations costs.
2. To help reduce electricity costs, the District should develop and implement an energy conservation plan that may include improvements to facilities.

page 10State of Arizona

APPENDIX
page a-1
Office of the Auditor General
Objectives, Scope, and Methodology
The Office of the Auditor General has conducted a performance audit of the Flowing Wells Unified School District pursuant to A.R.S. §41-1279.03(A)(9). Based in part on their effect on classroom dollars, as previously reported in the Auditor General’s annual report, Arizona School District Spending (Classroom Dollars report), this audit focused on the District’s efficiency and effectiveness in four operational areas: administration, plant operations and maintenance, food service, and student transportation. To evaluate costs in each of these areas, only current expenditures, primarily for fiscal year 2010, were considered.1 Further, because of the underlying law initiating these performance audits, auditors also reviewed the District’s use of Proposition 301 sales tax monies and how it accounted for dollars spent in the classroom.
In conducting this audit, auditors used a variety of methods, including examining various records, such as available fiscal year 2010 summary accounting data for all districts and Flowing Wells USD’s fiscal year 2010 detailed accounting data, contracts, and other district documents; reviewing district policies, procedures, and related internal controls; reviewing applicable statutes; and interviewing district administrators and staff.
To analyze Flowing Wells USD’s operational efficiency, auditors selected a group of peer districts based on their similarities in district size, type, and location. This operational peer group includes Flowing Wells USD and the other 10 high school and unified school districts that also served between 2,000 and 7,999 students and were located in cities and suburbs. Within this operational peer group, auditors also developed a subset of 6 districts that were being audited for their fiscal year 2010 operations. Auditors compared the more detailed accounting and staffing level data that was available for these districts. To compare districts’ academic indicators, auditors developed a separate student achievement peer group using poverty as the primary factor because poverty has been shown to be strongly related to student achievement. Auditors also used secondary factors such as district type, size, and location to further refine these groups. Flowing Wells USD’s student achievement peer group includes Flowing Wells USD and the 17 other unified districts that also served student populations with poverty rates between 23 and 32 percent. Additionally:
• To assess the District’s financial accounting data, auditors evaluated the District’s internal controls related to expenditure processing and reviewed transactions for proper account classification and reasonableness. Auditors also evaluated other internal controls that were considered significant to the audit objectives. After adjusting transactions for proper account classification, auditors reviewed fiscal year 2010 spending and prior years’ spending trends across functional spending areas.
1 Current expenditures are those incurred for the District’s day-to-day operations. They exclude costs associated with repaying debt, capital outlay (such as purchasing land, buildings, and equipment), and programs such as adult education and community service that are outside the scope of preschool through grade-12 education.

page a-2State of Arizona
• To assess whether the District’s plant operations and maintenance function was managed appropriately and functioned efficiently, auditors reviewed and evaluated fiscal year 2010 plant operations and maintenance costs and district building space, and compared these costs and capacities to peer districts’.
• To assess the District’s student achievement, auditors reviewed the Arizona’s Instrument to Measure Standards (AIMS) passing rates, “Adequate Yearly Progress” for the federal No Child Left Behind Act, and high school graduation rates. AIMS passing rates were compared to the state-wide average and the average of the student achievement peer districts.
• To assess whether the District’s administration effectively and efficiently managed district operations, auditors evaluated administrative procedures and controls at the district and school level, including reviewing personnel files and other pertinent documents, and interviewing district and school administrators about their duties. Auditors also reviewed and evaluated fiscal year 2010 administration costs and compared these to peer districts’.
• To assess whether the District’s food service program was managed appropriately and functioned efficiently, auditors reviewed fiscal year 2010 food service revenues and expenditures, including labor and food costs, and compared costs to peer districts’, reviewed the Arizona Department of Education’s food service monitoring reports, and observed food service operations.
• To assess whether the District’s transportation program was managed appropriately and functioned efficiently, auditors reviewed and evaluated required transportation reports, driver files, bus maintenance and safety records, and bus capacity usage. Auditors also reviewed fiscal year 2010 transportation costs and compared them to peer districts’.
• To assess whether the District was in compliance with Proposition 301’s Classroom Site Fund requirements, auditors reviewed fiscal year 2010 expenditures to determine whether they were appropriate, properly accounted for, and remained within statutory limits. Auditors also reviewed the District’s performance pay plan and analyzed how performance pay was being distributed. No issues of noncompliance were identified.
• To assess the District’s computer information systems and network, auditors evaluated certain controls over its logical and physical security, including user access to sensitive data and critical systems, and the security of servers that house the data and systems. Auditors also evaluated certain district policies over the system such as data sensitivity, backup, and recovery. No issues were identified.
We conducted this performance audit in accordance with generally accepted government auditing standards. Those standards require that we plan and perform the audit to obtain sufficient, appropriate evidence to provide a reasonable basis for our findings and conclusions based on our audit objectives. We believe that the evidence obtained provides a reasonable basis for our findings and conclusions based on our audit objectives.
The Auditor General and her staff express their appreciation to the Flowing Wells Unified School District’s board members, superintendent, and staff for their cooperation and assistance throughout the audit.

DIS
TRIC
T RE
SP
ON
SE
DISTRICT RESPONSE


Flowing Wells Unified School District #8 Performance Audit Responses
Finding 1: District reduced classroom spending and shifted monies to other functional areas
The District agrees with this finding and will implement the recommendations.
Recommendation 1: The District should classify all transactions in accordance with the Uniform Chart of Accounts for school districts.
The District strives to consistently classify expenditures in accordance with the Uniform Chart of Accounts. The District annually reviews the account coding for all expenditures. A point relevant to this report is that the USFR chart of accounts is not always specific and is subject to some interpretation. The District will continue to contact the Auditor General’s office to obtain clarification on specific situations.
Recommendation 2: The District should look for ways to reduce nonclassroom spending, especially in plant operations, to allow it to direct more of its monies back into the classroom.
The District will continue an effort to designate a higher percentage of the budget into the classroom.
In FY 2010, the District faced a reduction in student count of 139, loss of excess utilities funding, reduction in soft capital funding, and a reduction in revenue control base support per pupil funding. The total reduction in the maintenance and operations budget was over $1.2 million. Since the legislature was late in finalizing the budget that year, the district was conservative while preparing teacher contracts in April‐May 2009. The budget reductions and the timing of finalization of the state budget did impact our classroom dollars that year. While the district cut 20 teachers due to reduction in student counts, the district also cut approximately 22 FTE in other support functions. Additional reductions in classroom expenditures included the removal of three classroom teachers funded through Title II when the Arizona Department of Education prohibited classroom size reduction financial allocations. The district was required to reallocate this funding to other, non‐classroom level activities, and focused on professional development.
The District strongly believes that in addition to classroom dollars, student support services and extensive teacher training programs are important elements to increase and maintain student performance, as is evident by our student achievement scores.
The District is also committed to a 24/7 school house concept and offers a wide range of after school programs which have positively impacted our student achievement, as reported on page 1 of the Performance Audit. Currently, the district operates seven 21st Century Community Learning Center Sites along with five Full Service Community Learning Centers. None of the comparable peer districts have operated these state and federal extended school day and school year programs since 2009. These programs extend our school plant hours on average of three hours per day along with providing educational services at our school sites for six weeks during the summer. All additional district maintenance and utility costs are provided as in‐kind funding matches as required by the grants.

Flowing Wells Unified School District ‐ Performance Audit Responses – Page 2
Finding 2: Higher plant costs related to higher staffing levels, more experienced staff, and high energy usage
The District agrees with this finding and will implement the recommendations.
Recommendation 1: The District should review its staffing levels to determine if it can reduce plant operation costs.
The District reviews staffing levels annually and has significantly reduced positions in an effort to reduce costs. Specifically, since 2009, the Flowing Wells Unified School District has eliminated the following staff positions related directly to plant operations. We reduced 2 FTE grounds and 2 FTE custodians for a savings of about $100,000 in FY 2010.
Recommendation 2: To help reduce electricity costs, the District should develop and implement an energy conservation plan that may include improvements to facilities.
The District will continue to annually review energy costs and revise the capital improvement plan to reduce energy costs.
The District has taken aggressive measures to significantly modify obsolete and inefficient systems, utilizing our capital along with a B‐bond program. As a result of these efforts, the District currently has four campuses that operate through an energy management‐based system. Over one third of the District’s square footage is designed with current state‐of‐the‐art energy management system technology which provides the capability to program all levels of control. The remaining two thirds of the District’s HVAC design is comprised of either package units that are heat pumps or gas packs. 90% of these units meet the federal guidelines of a seer rating of 11 or higher.
Based on the Performance Audit report, along with data gathered through other external and internal energy audits, the District will continue utilizing state funding to retrofit inefficient lighting and mechanical systems with the goal of improving efficiency rates.
