floyd county, georgia december 31, 2014. this presentation provides an overview of floyd county’s...
TRANSCRIPT

FINANCIAL HIGHLIGHTS
Floyd County, GeorgiaDecember 31, 2014
AGENDA
This presentation provides an overview of Floyd County’s financial performance for the 2014 fiscal year.
All information obtained from the audited Comprehensive Annual Financial Report for the year ended December 31, 2014.
We audited the County’s financial statements in accordance with auditing standards generally accepted in the United States of America and Government Auditing Standards issued by the Comptroller General of the United States.
The financial statements of the County are considered to present fairly the financial position and results of operations as of, and for the year ended December 31, 2014.
Prepared by Mauldin & Jenkins, LLC

Real Property Tax; 23453820; 50%
Personal Property Tax; 3111860; 7%
LOST, $7,806,634 , 17%
Other Taxes; 1009268; 2%
Licenses and Permits; 206428; 0%
Intergovernmental; 3284754; 7%
Charges for Services; 3807963; 8%
Fines and Forfeitures; 1104081; 2%
Investment Income; 15394; 0%Misc Rev; 1156318; 2% Transfers; 1586621; 3%
Sale of Cap Assets; 22118; 0%
Chart Title
Total Revenues$46,565,259
GENERAL FUND REVENUES
Prepared by Mauldin & Jenkins, LLC

LOCAL OPTION SALES TAX REVENUES 2005 - 2014
2005
2007
2009
2011
2013
-
2,000,000
4,000,000
6,000,000
8,000,000
10,000,000
LOST Revenues
LOST Revenues
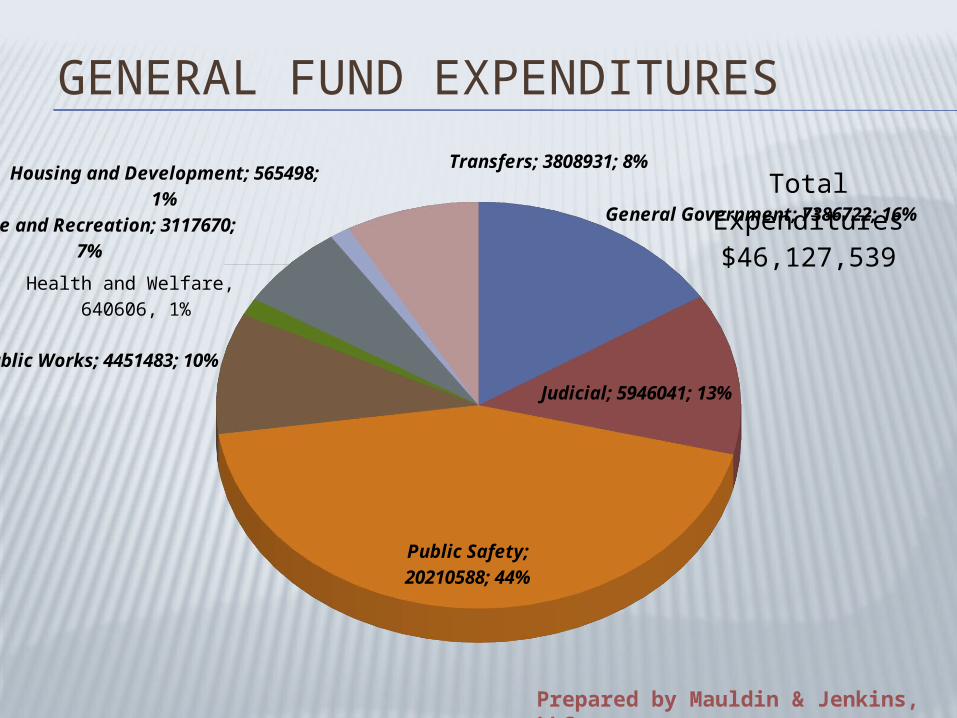
General Government; 7386722; 16%
Judicial; 5946041; 13%
Public Safety; 20210588; 44%
Public Works; 4451483; 10%
Health and Welfare, 640606, 1%
Culture and Recreation; 3117670; 7%
Housing and Development; 565498; 1%
Transfers; 3808931; 8%
Chart Title
Total Expendi-tures
$46,127,539
GENERAL FUND EXPENDITURES
Prepared by Mauldin & Jenkins, LLC

GENERAL FUND REVENUES AND EXPENDITURES 2005 - 2014
2005
2007
2009
2011
2013
$36,000,000
$38,000,000
$40,000,000
$42,000,000
$44,000,000
$46,000,000
$48,000,000
$50,000,000
RevenuesExpenditures
2005 2006 2007 2008 2009 2010 2011 2012 2013 2014$0
$2,000,000
$4,000,000
$6,000,000
$8,000,000
$10,000,000
$12,000,000
$14,000,000
$16,000,000
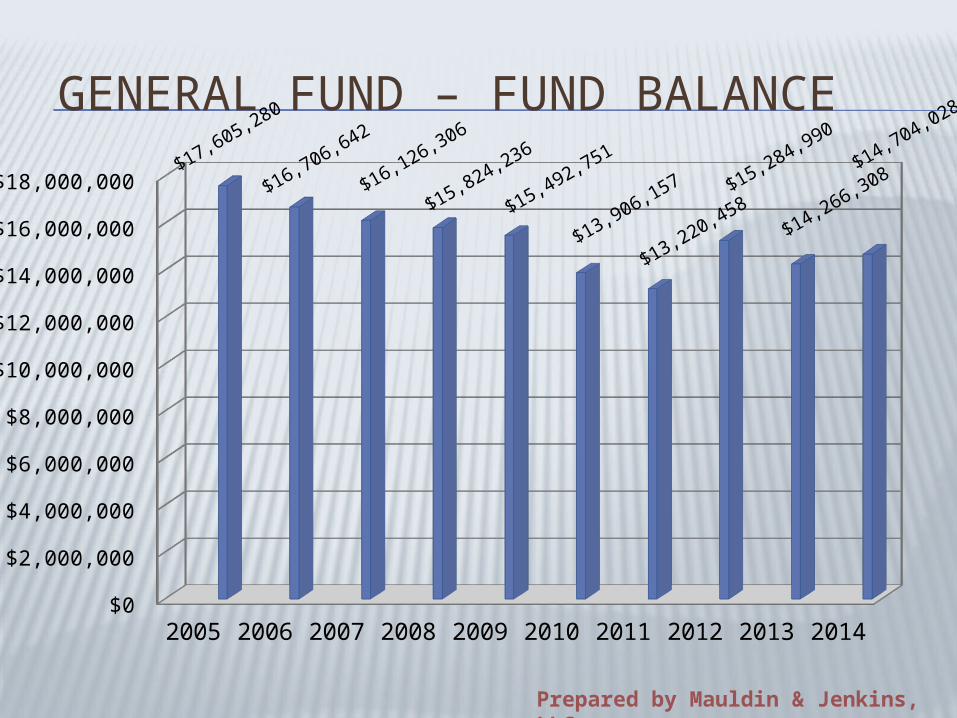
$18,000,000 $17,605,280
$16,706,642
$16,126,306
$15,824,236
$15,492,751
$13,906,157
$13,220,458 $15,284,990
$14,266,308 $14,704,028 GENERAL FUND – FUND BALANCE
Prepared by Mauldin & Jenkins, LLC

Taxes Lic. & Per. Intgov't Ch. for Srvcs
Fines & Forft.
Interest Misc.$0
$5,000,000
$10,000,000
$15,000,000
$20,000,000
$25,000,000
$30,000,000
$35,000,000
$40,000,000
Budget Actual
GENERAL FUND REVENUESBUDGET VS ACTUAL
Prepared by Mauldin & Jenkins, LLC

Prepared by Mauldin & Jenkins, LLC
Gen. Gov't
Judicial Public Safety
Public Works
Health & Welfare
Housing & Dev.
Cul & Rec$0
$5,000,000
$10,000,000
$15,000,000
$20,000,000
$25,000,000
Budget Actual
GENERAL FUND EXPENDITURESBUDGET VS ACTUAL

Prepared by Mauldin & Jenkins, LLC
2005 2006 2007 2008 2009 2010 2011 2012 2013 20140.0
2.0
4.0
6.0
8.0
10.0
12.0
7.968 7.9688.100
8.767
8.767
8.767
8.767
8.767
8.767
8.767
1.887 1.8261.669 1.669 1.669 1.669 1.669 1.669 1.669 1.668
0.66 0.639 0.664 0.664 0.664 0.664 0.664 0.664 0.664 0.664
10.515 10.433 10.43311.1 11.1 11.1 11.1 11.1 11.1 11.099
M & O Fire Solid Waste Total Millage
PROPERTY TAX RATES FOR THE YEARS ENDED DECEMBER 31, 2005 - 2014
Prepared by Mauldin & Jenkins, LLC
2005200620072008200920102011201220132014$0
$1,000,000
$2,000,000
$3,000,000
$4,000,000
$5,000,000
$6,000,000
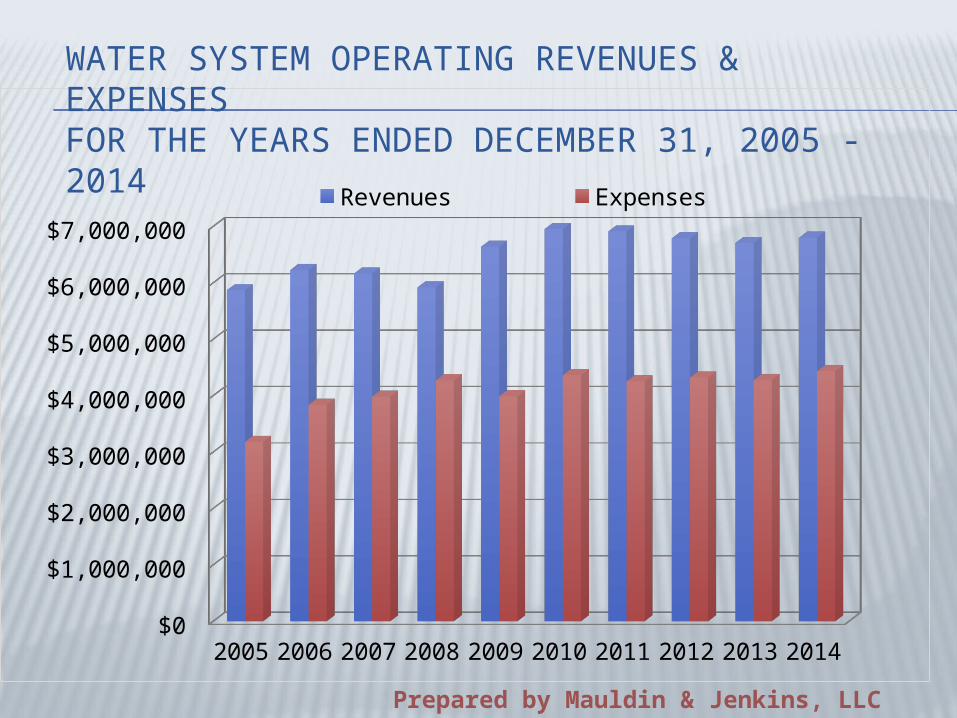
$7,000,000 Revenues Expenses
WATER SYSTEM OPERATING REVENUES & EXPENSESFOR THE YEARS ENDED DECEMBER 31, 2005 - 2014

Prepared by Mauldin & Jenkins, LLC
2005 2006 2007 2008 2009 2010 2011 2012 2013 20140.0
1.0
2.0
3.0
4.0
5.0
6.0
2.02 1.79 1.651.24
2.00 1.88 1.93 1.81 1.77
4.83
DS Required (1.1) DS Coverage
WATER & SEWER SYSTEM - REVENUE BOND COVERAGEFOR THE YEARS ENDED DECEMBER 31, 2005 - 2014

Prepared by Mauldin & Jenkins, LLC
2005 2006 2007 2008 2009 2010 2011 2012 2013 2014$0
$5,000,000
$10,000,000
$15,000,000
$20,000,000
$25,000,000
$30,000,000
$35,000,000
$40,000,000
WATER & SEWER SYSTEM RETAINED EARNINGS/NETPOSITION FOR THE YEARS ENDED DECEMBER 31, 2005-2014