fluid catalytic cracking (fcc) catalyst optimization to … · fluid catalytic cracking (fcc)...
TRANSCRIPT
Fluid Catalytic Cracking (FCC)Catalyst Optimization to Cope with High Rare Earth Oxide Price Environment
2
The use of rare earths (RE) in FCC catalysts was driven by the need for more active and hydrothermally stable products with better yield performance. RE oxides (REO) achieved these goals by enhancing catalytic activity and preventing loss of acid sites during normal unit operation.
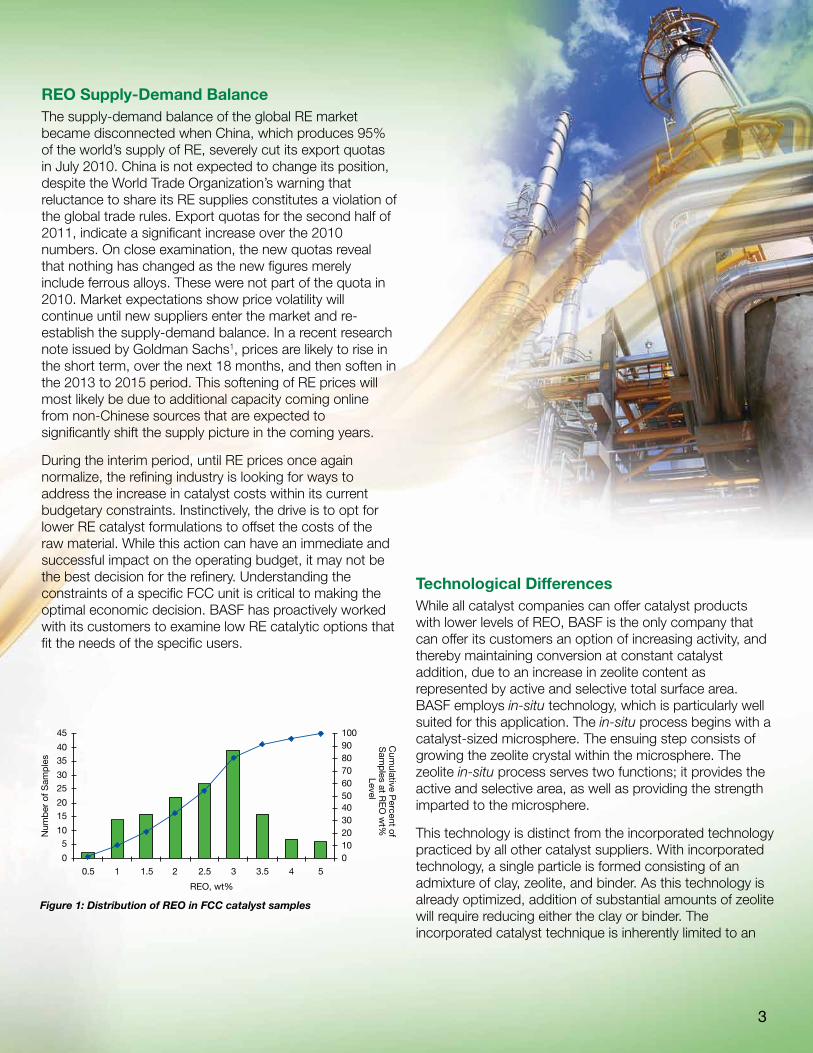
To address the specific needs of each FCC unit, catalyst manufacturers formulate catalysts with various RE levels that allow for optimal unit performance. The level of REO in a specific catalyst formulation is determined by operational severity and product objectives. As the need for increased amounts of gasoline grew over time, refiners tended to increase the level of RE in their catalyst formulation to meet their profitability targets. RE gradually increased over the years and, at the end of 2010, the average was 3%, with several refineries running in excess of the average.
Figure 1 shows 2010 historical data for equilibrium catalyst (E-cat) samples analyzed by BASF for REO. These reflect all the samples that were received by BASF in the fourth quarter of 2010 before the REO price spike occurred. Sample count refers to the number of E-cat samples analyzed by the BASF laboratory. The blue trend line shows the cumulative percentage of samples at or below
a specific REO content. Although operational demands have not changed in the industry, current RE market conditions have put pressure on catalyst manufacturers as well as refiners to reassess the role of RE in the FCC industry. When looking at catalytic options, it is critical to look at the overall value and not just the cost of RE. BASF has actively helped its customers analyze their operations and determine when a drop in RE levels is beneficial. Approximately 60% of BASF customers that have evaluated a low REO option have switched. BASF’s products deliver the highest activity in the market and therefore are well suited for low REO operation. As will be discussed here, the cost benefits and possible performance deficits of this option need to be clearly understood before making a change.
3
0
510
1520
2530
3540
45
0.5 1 1.5 2 2.5 3 3.5 4 5
Num
ber
of S
amp
les
0102030405060708090100
Cum
ulative Percent of
Sam
ples at R
EO
wt%
Level
REO, wt%
REO Supply-Demand BalanceThe supply-demand balance of the global RE market became disconnected when China, which produces 95% of the world’s supply of RE, severely cut its export quotas in July 2010. China is not expected to change its position, despite the World Trade Organization’s warning that reluctance to share its RE supplies constitutes a violation of the global trade rules. Export quotas for the second half of 2011, indicate a significant increase over the 2010 numbers. On close examination, the new quotas reveal that nothing has changed as the new figures merely include ferrous alloys. These were not part of the quota in 2010. Market expectations show price volatility will continue until new suppliers enter the market and re-establish the supply-demand balance. In a recent research note issued by Goldman Sachs1, prices are likely to rise in the short term, over the next 18 months, and then soften in the 2013 to 2015 period. This softening of RE prices will most likely be due to additional capacity coming online from non-Chinese sources that are expected to significantly shift the supply picture in the coming years.
During the interim period, until RE prices once again normalize, the refining industry is looking for ways to address the increase in catalyst costs within its current budgetary constraints. Instinctively, the drive is to opt for lower RE catalyst formulations to offset the costs of the raw material. While this action can have an immediate and successful impact on the operating budget, it may not be the best decision for the refinery. Understanding the constraints of a specific FCC unit is critical to making the optimal economic decision. BASF has proactively worked with its customers to examine low RE catalytic options that fit the needs of the specific users.
Technological DifferencesWhile all catalyst companies can offer catalyst products with lower levels of REO, BASF is the only company that can offer its customers an option of increasing activity, and thereby maintaining conversion at constant catalyst addition, due to an increase in zeolite content as represented by active and selective total surface area. BASF employs in-situ technology, which is particularly well suited for this application. The in-situ process begins with a catalyst-sized microsphere. The ensuing step consists of growing the zeolite crystal within the microsphere. The zeolite in-situ process serves two functions; it provides the active and selective area, as well as providing the strength imparted to the microsphere.
This technology is distinct from the incorporated technology practiced by all other catalyst suppliers. With incorporated technology, a single particle is formed consisting of an admixture of clay, zeolite, and binder. As this technology is already optimized, addition of substantial amounts of zeolite will require reducing either the clay or binder. The incorporated catalyst technique is inherently limited to an
Figure 1: Distribution of REO in FCC catalyst samples
4
upper level of zeolite content and cannot increase surface area without seriously compromising the strength to withstand breakage in the FCC unit.
The decision to change catalyst or reformulate catalyst is not a trivial one. Simply reducing RE levels of the catalyst without a comprehensive study can result in severe yield penalties and possibly force the refinery to cut feed rates to the unit. All such consequences are economically prohibitive. Helping customers evaluate the effect of RE levels on key catalytic variables reduces the uncertainty of the change and facilitates the decision to move to a reformulation of their FCC catalyst, when appropriate. The specifics of this change in formulation and the impact of REO level on conversion, as well as the effect of fresh catalyst surface area and addition rate, will be examined here.
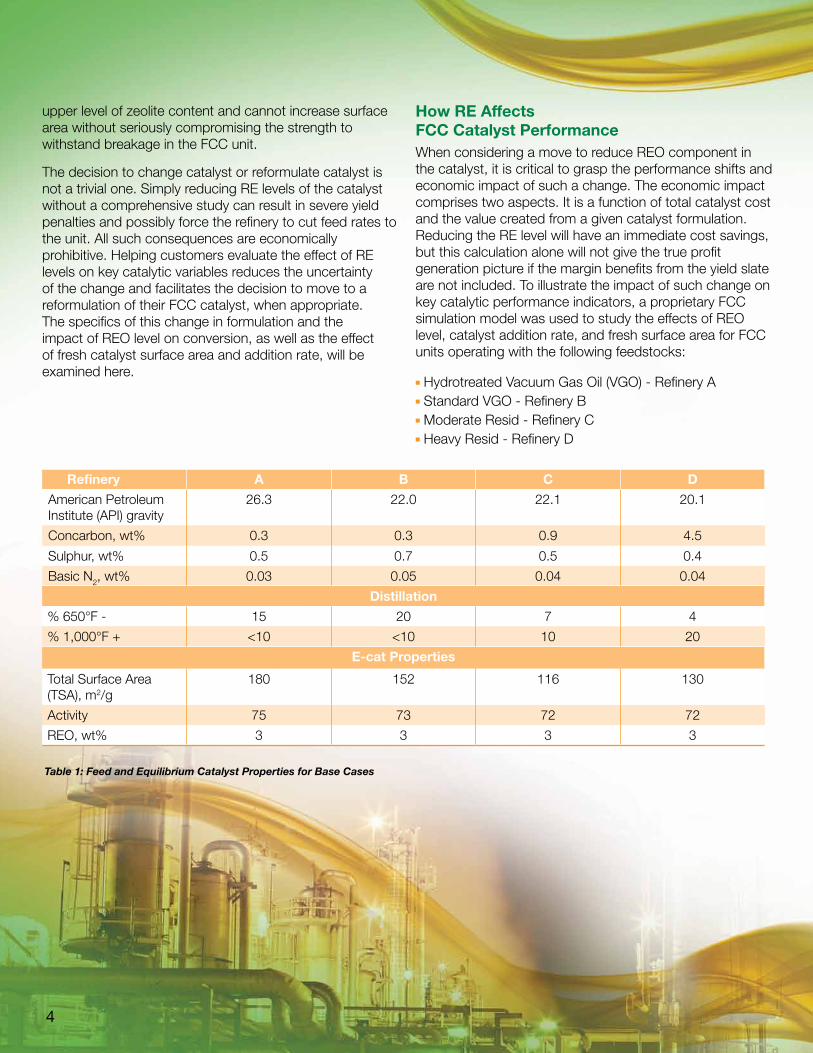
How RE Affects FCC Catalyst PerformanceWhen considering a move to reduce REO component in the catalyst, it is critical to grasp the performance shifts and economic impact of such a change. The economic impact comprises two aspects. It is a function of total catalyst cost and the value created from a given catalyst formulation. Reducing the RE level will have an immediate cost savings, but this calculation alone will not give the true profit generation picture if the margin benefits from the yield slate are not included. To illustrate the impact of such change on key catalytic performance indicators, a proprietary FCC simulation model was used to study the effects of REO level, catalyst addition rate, and fresh surface area for FCC units operating with the following feedstocks:
n Hydrotreated Vacuum Gas Oil (VGO) - Refinery An Standard VGO - Refinery Bn Moderate Resid - Refinery C n Heavy Resid - Refinery D
Refinery A B C D
American Petroleum Institute (API) gravity
26.3 22.0 22.1 20.1
Concarbon, wt% 0.3 0.3 0.9 4.5
Sulphur, wt% 0.5 0.7 0.5 0.4
Basic N2, wt% 0.03 0.05 0.04 0.04
Distillation
% 650°F - 15 20 7 4
% 1,000°F + <10 <10 10 20
E-cat Properties
Total Surface Area (TSA), m2/g
180 152 116 130
Activity 75 73 72 72
REO, wt% 3 3 3 3
Table 1: Feed and Equilibrium Catalyst Properties for Base Cases
5
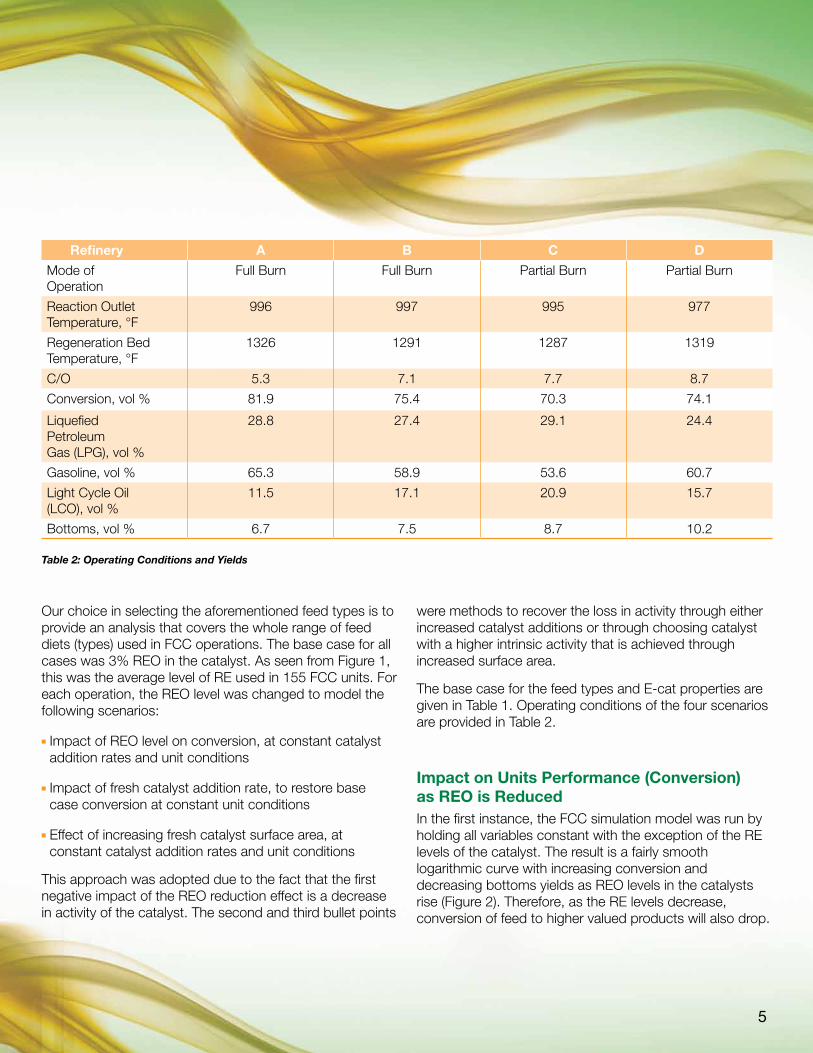
Our choice in selecting the aforementioned feed types is to provide an analysis that covers the whole range of feed diets (types) used in FCC operations. The base case for all cases was 3% REO in the catalyst. As seen from Figure 1, this was the average level of RE used in 155 FCC units. For each operation, the REO level was changed to model the following scenarios:
n Impact of REO level on conversion, at constant catalyst addition rates and unit conditions
n Impact of fresh catalyst addition rate, to restore base case conversion at constant unit conditions
n Effect of increasing fresh catalyst surface area, at constant catalyst addition rates and unit conditions
This approach was adopted due to the fact that the first negative impact of the REO reduction effect is a decrease in activity of the catalyst. The second and third bullet points
Refinery A B C D
Mode of Operation
Full Burn Full Burn Partial Burn Partial Burn
Reaction Outlet Temperature, °F
996 997 995 977
Regeneration Bed Temperature, °F
1326 1291 1287 1319
C/O 5.3 7.1 7.7 8.7
Conversion, vol % 81.9 75.4 70.3 74.1
Liquefied Petroleum Gas (LPG), vol %
28.8 27.4 29.1 24.4
Gasoline, vol % 65.3 58.9 53.6 60.7
Light Cycle Oil (LCO), vol %
11.5 17.1 20.9 15.7
Bottoms, vol % 6.7 7.5 8.7 10.2
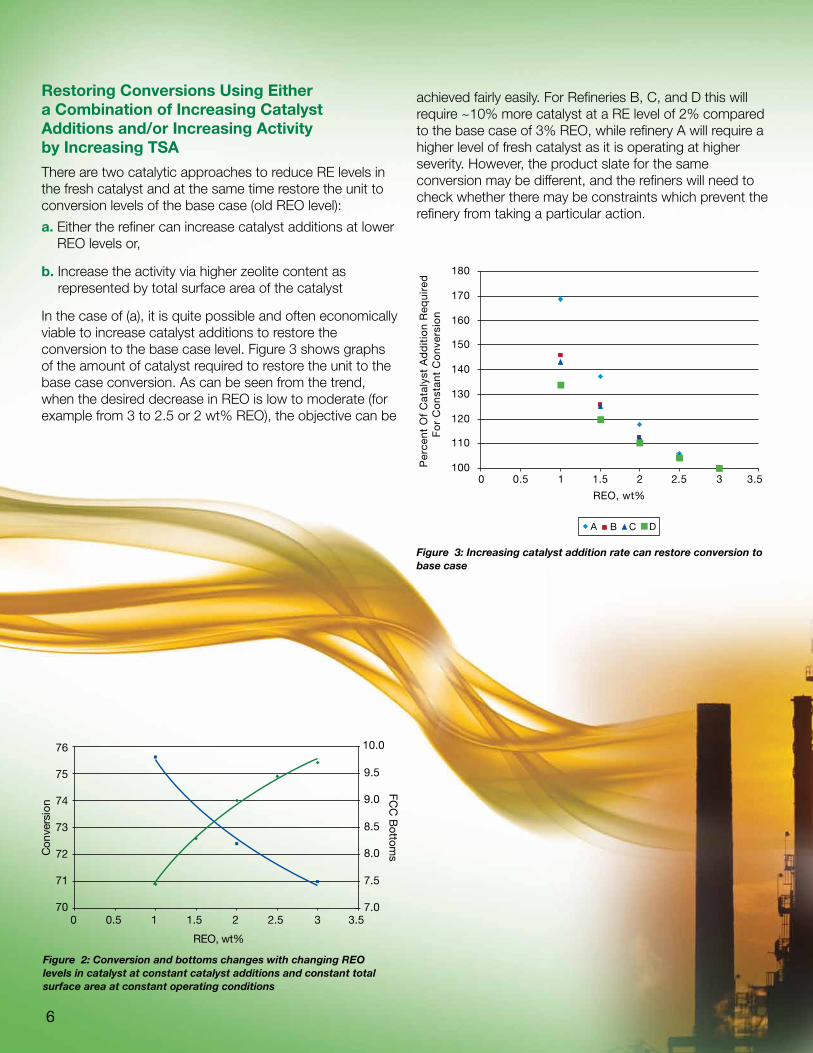
Impact on Units Performance (Conversion) as REO is ReducedIn the first instance, the FCC simulation model was run by holding all variables constant with the exception of the RE levels of the catalyst. The result is a fairly smooth logarithmic curve with increasing conversion and decreasing bottoms yields as REO levels in the catalysts rise (Figure 2). Therefore, as the RE levels decrease, conversion of feed to higher valued products will also drop.
were methods to recover the loss in activity through either increased catalyst additions or through choosing catalyst with a higher intrinsic activity that is achieved through increased surface area.
The base case for the feed types and E-cat properties are given in Table 1. Operating conditions of the four scenarios are provided in Table 2.
Table 2: Operating Conditions and Yields
6
100
110
120
130
140
150
160
170
180
0 0.5 1 1.5 2 2.5 3 3.5
REO, wt%
Per
cen
t O
f C
atal
yst
Ad
dit
ion
Req
uir
ed
Fo
r C
on
stan
t C
on
vers
ion
A B C D
Figure 3: Increasing catalyst addition rate can restore conversion to base case
Figure 2: Conversion and bottoms changes with changing REO levels in catalyst at constant catalyst additions and constant total surface area at constant operating conditions
Restoring Conversions Using Either a Combination of Increasing Catalyst Additions and/or Increasing Activity by Increasing TSA
There are two catalytic approaches to reduce RE levels in the fresh catalyst and at the same time restore the unit to conversion levels of the base case (old REO level):
a. Either the refiner can increase catalyst additions at lower REO levels or,
b. Increase the activity via higher zeolite content as represented by total surface area of the catalyst
In the case of (a), it is quite possible and often economically viable to increase catalyst additions to restore the conversion to the base case level. Figure 3 shows graphs of the amount of catalyst required to restore the unit to the base case conversion. As can be seen from the trend, when the desired decrease in REO is low to moderate (for example from 3 to 2.5 or 2 wt% REO), the objective can be
76
75
74
73
72
71
700 0.5 1 1.5 2 2.5 3 3.5
7.0
7.5
8.0
8.5
9.0
9.5
10.0
Con
vers
ion
FCC
Bottom
s
REO, wt%
achieved fairly easily. For Refineries B, C, and D this will require ~10% more catalyst at a RE level of 2% compared to the base case of 3% REO, while refinery A will require a higher level of fresh catalyst as it is operating at higher severity. However, the product slate for the same conversion may be different, and the refiners will need to check whether there may be constraints which prevent the refinery from taking a particular action.
7
a. Increase catalyst additions containing lower REO (exchanged on the zeolite). If we look at Figure 3, the quantity of catalyst for this simulation is 20% higher. Therefore, the refinery can maintain conversion by increasing catalyst usage from 2 to 2.4 tpd but at REO level which is 50% lower than the base case.
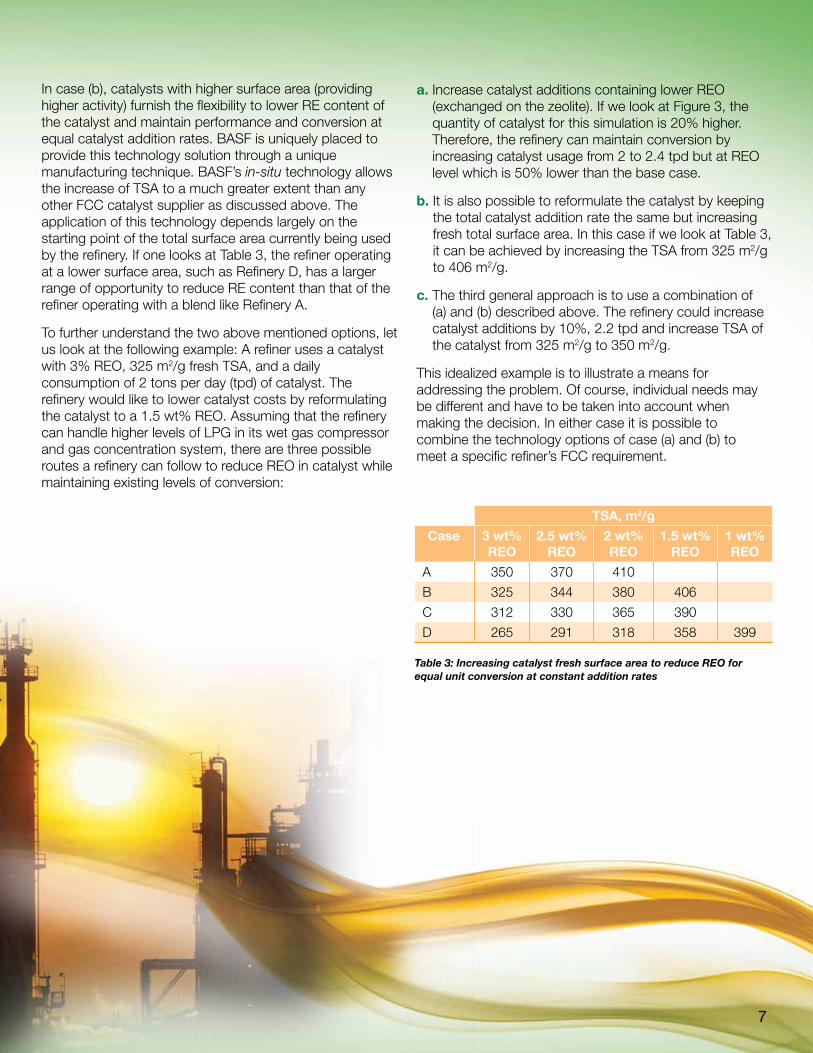
b. It is also possible to reformulate the catalyst by keeping the total catalyst addition rate the same but increasing fresh total surface area. In this case if we look at Table 3, it can be achieved by increasing the TSA from 325 m2/g to 406 m2/g.
c. The third general approach is to use a combination of (a) and (b) described above. The refinery could increase catalyst additions by 10%, 2.2 tpd and increase TSA of the catalyst from 325 m2/g to 350 m2/g.
This idealized example is to illustrate a means for addressing the problem. Of course, individual needs may be different and have to be taken into account when making the decision. In either case it is possible to combine the technology options of case (a) and (b) to meet a specific refiner’s FCC requirement.
In case (b), catalysts with higher surface area (providing higher activity) furnish the flexibility to lower RE content of the catalyst and maintain performance and conversion at equal catalyst addition rates. BASF is uniquely placed to provide this technology solution through a unique manufacturing technique. BASF’s in-situ technology allows the increase of TSA to a much greater extent than any other FCC catalyst supplier as discussed above. The application of this technology depends largely on the starting point of the total surface area currently being used by the refinery. If one looks at Table 3, the refiner operating at a lower surface area, such as Refinery D, has a larger range of opportunity to reduce RE content than that of the refiner operating with a blend like Refinery A.
To further understand the two above mentioned options, let us look at the following example: A refiner uses a catalyst with 3% REO, 325 m2/g fresh TSA, and a daily consumption of 2 tons per day (tpd) of catalyst. The refinery would like to lower catalyst costs by reformulating the catalyst to a 1.5 wt% REO. Assuming that the refinery can handle higher levels of LPG in its wet gas compressor and gas concentration system, there are three possible routes a refinery can follow to reduce REO in catalyst while maintaining existing levels of conversion:
TSA, m2/g
Case 3 wt% REO
2.5 wt% REO
2 wt% REO
1.5 wt% REO
1 wt% REO
A 350 370 410
B 325 344 380 406
C 312 330 365 390
D 265 291 318 358 399
Table 3: Increasing catalyst fresh surface area to reduce REO for equal unit conversion at constant addition rates
8
Constraints
As was discussed previously, this paper addresses generic options and it is important to talk to your supplier to achieve a quality decision based on intimate knowledge of your operational needs and timing.
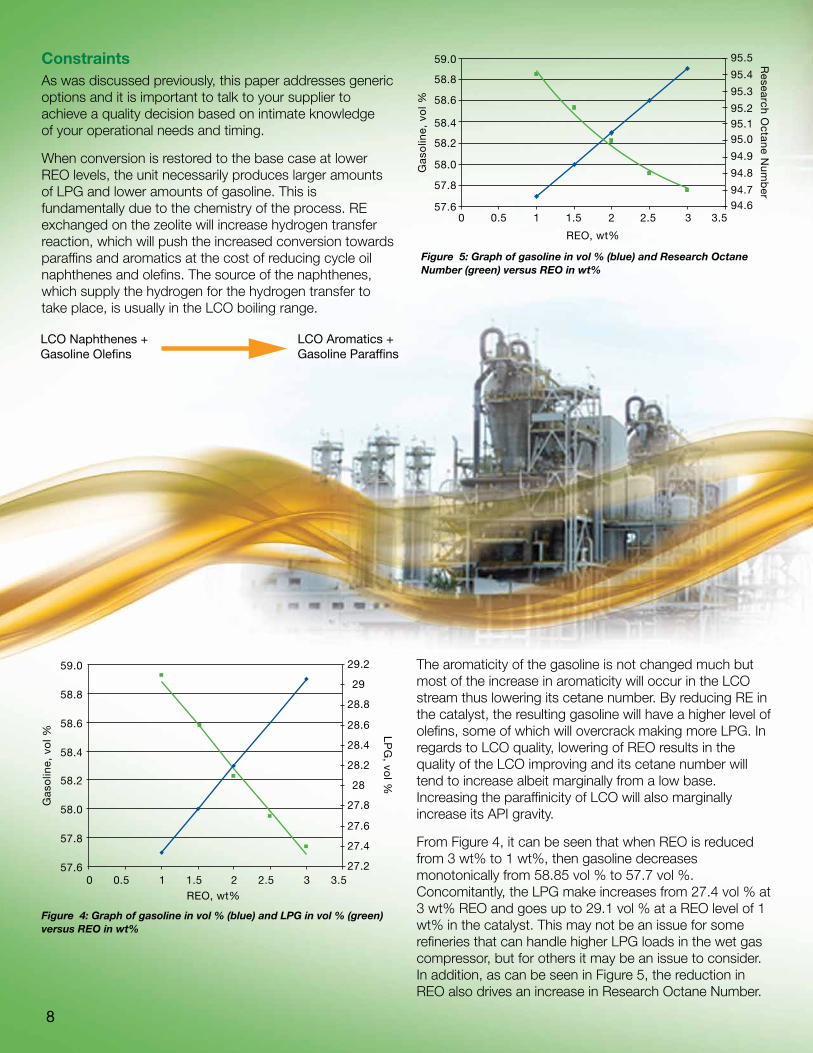
When conversion is restored to the base case at lower REO levels, the unit necessarily produces larger amounts of LPG and lower amounts of gasoline. This is fundamentally due to the chemistry of the process. RE exchanged on the zeolite will increase hydrogen transfer reaction, which will push the increased conversion towards paraffins and aromatics at the cost of reducing cycle oil naphthenes and olefins. The source of the naphthenes, which supply the hydrogen for the hydrogen transfer to take place, is usually in the LCO boiling range.
LCO Naphthenes + Gasoline Ole�ns
LCO Aromatics + Gasoline Paraf�ns
Figure 5: Graph of gasoline in vol % (blue) and Research Octane Number (green) versus REO in wt%
57.6
57.8
58.0
58.2
58.4
58.6
58.8
59.0
0 0.5 1 1.5 2 2.5 3 3.527.2
27.4
27.6
27.8
28
28.2
28.4
28.6
28.8
29
29.2
Gas
olin
e, v
ol % L
PG
, vol %
REO, wt%
57.6
57.8
58.0
58.2
58.4
58.6
58.8
59.0
0 0.5 1 1.5 2 2.5 3 3.594.694.7
94.8
94.9
95.095.195.2
95.3
95.4
95.5 Research
Octan
e Nu
mb
er
Gas
olin
e, v
ol %
REO, wt%
The aromaticity of the gasoline is not changed much but most of the increase in aromaticity will occur in the LCO stream thus lowering its cetane number. By reducing RE in the catalyst, the resulting gasoline will have a higher level of olefins, some of which will overcrack making more LPG. In regards to LCO quality, lowering of REO results in the quality of the LCO improving and its cetane number will tend to increase albeit marginally from a low base. Increasing the paraffinicity of LCO will also marginally increase its API gravity.
From Figure 4, it can be seen that when REO is reduced from 3 wt% to 1 wt%, then gasoline decreases monotonically from 58.85 vol % to 57.7 vol %. Concomitantly, the LPG make increases from 27.4 vol % at 3 wt% REO and goes up to 29.1 vol % at a REO level of 1 wt% in the catalyst. This may not be an issue for some refineries that can handle higher LPG loads in the wet gas compressor, but for others it may be an issue to consider. In addition, as can be seen in Figure 5, the reduction in REO also drives an increase in Research Octane Number.
Figure 4: Graph of gasoline in vol % (blue) and LPG in vol % (green) versus REO in wt%
9
Stream Olefin Maximization
Mode
Gasoline Maximization
Mode
C2+ltr, $/BFOE 28.19 28.19
C3=, $/bbl 94.90 62.09
C3, $/bbl 55.68 55.68
C4=, $/bbl 102.49 82.78
iC4, $/bbl 73.42 73.42
nC4, $/bbl 62.09 62.09
Gasoline, $/bbl 92.64 101.69
LCO, $/bbl 107.32 107.32
Heavy Cycle Oil (HCO), $/bbl
82.00 82.00
Feed Cost, $/bbl
98.55 98.55
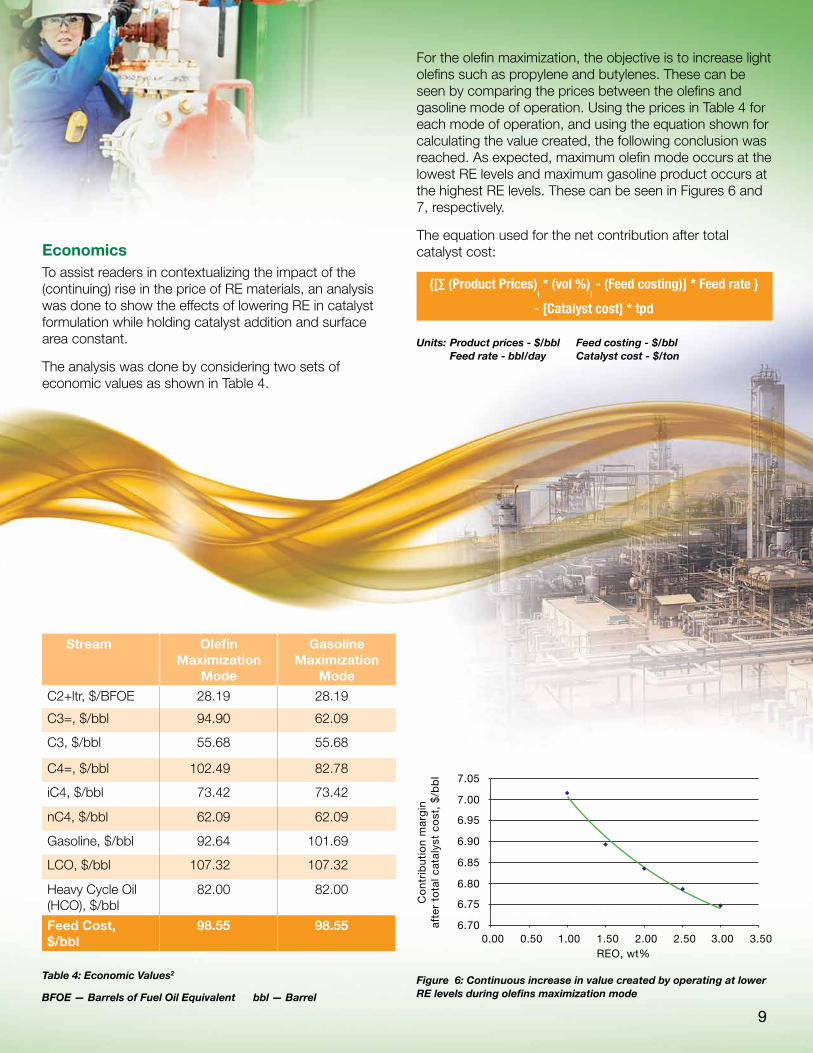
For the olefin maximization, the objective is to increase light olefins such as propylene and butylenes. These can be seen by comparing the prices between the olefins and gasoline mode of operation. Using the prices in Table 4 for each mode of operation, and using the equation shown for calculating the value created, the following conclusion was reached. As expected, maximum olefin mode occurs at the lowest RE levels and maximum gasoline product occurs at the highest RE levels. These can be seen in Figures 6 and 7, respectively.
The equation used for the net contribution after total catalyst cost:
6.70
6.75
6.80
6.85
6.90
6.95
7.00
7.05
0.00 0.50 1.00 1.50 2.00 2.50 3.00 3.50
Co
ntr
ibu
tio
n m
arg
inaf
ter
tota
l cat
alys
t co
st,
$/b
bl
REO, wt%
Figure 6: Continuous increase in value created by operating at lower RE levels during olefins maximization modeBFOE — Barrels of Fuel Oil Equivalent bbl — Barrel
Economics
To assist readers in contextualizing the impact of the (continuing) rise in the price of RE materials, an analysis was done to show the effects of lowering RE in catalyst formulation while holding catalyst addition and surface area constant.
The analysis was done by considering two sets of economic values as shown in Table 4.
Table 4: Economic Values2
Units:Productprices-$/bbl Feedcosting-$/bbl Feedrate-bbl/day Catalystcost-$/ton
{[∑ (Product Prices)i * (vol %)
i - (Feed costing)] * Feed rate }
- [Catalyst cost] * tpd
10
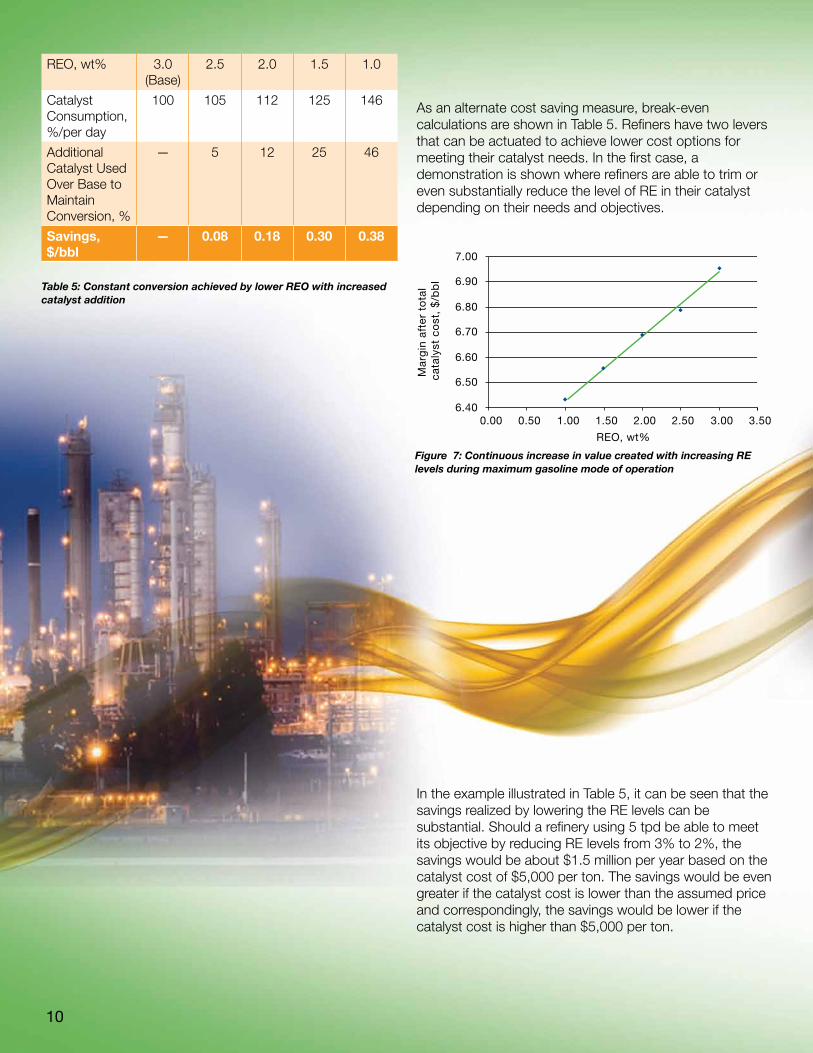
REO, wt% 3.0 (Base)
2.5 2.0 1.5 1.0
Catalyst Consumption, %/per day
100 105 112 125 146
Additional Catalyst Used Over Base to Maintain Conversion, %
— 5 12 25 46
Savings, $/bbl
— 0.08 0.18 0.30 0.38
6.40
6.50
6.60
6.70
6.80
6.90
7.00
0.00 0.50 1.00 1.50 2.00 2.50 3.00 3.50M
arg
in a
fter
to
tal
cata
lyst
co
st,
$/b
bl
REO, wt%
Figure7:ContinuousincreaseinvaluecreatedwithincreasingRElevelsduringmaximumgasolinemodeofoperation
In the example illustrated in Table 5, it can be seen that the savings realized by lowering the RE levels can be substantial. Should a refinery using 5 tpd be able to meet its objective by reducing RE levels from 3% to 2%, the savings would be about $1.5 million per year based on the catalyst cost of $5,000 per ton. The savings would be even greater if the catalyst cost is lower than the assumed price and correspondingly, the savings would be lower if the catalyst cost is higher than $5,000 per ton.
As an alternate cost saving measure, break-even calculations are shown in Table 5. Refiners have two levers that can be actuated to achieve lower cost options for meeting their catalyst needs. In the first case, a demonstration is shown where refiners are able to trim or even substantially reduce the level of RE in their catalyst depending on their needs and objectives.
Table 5: Constant conversion achieved by lower REO with increased catalyst addition
11
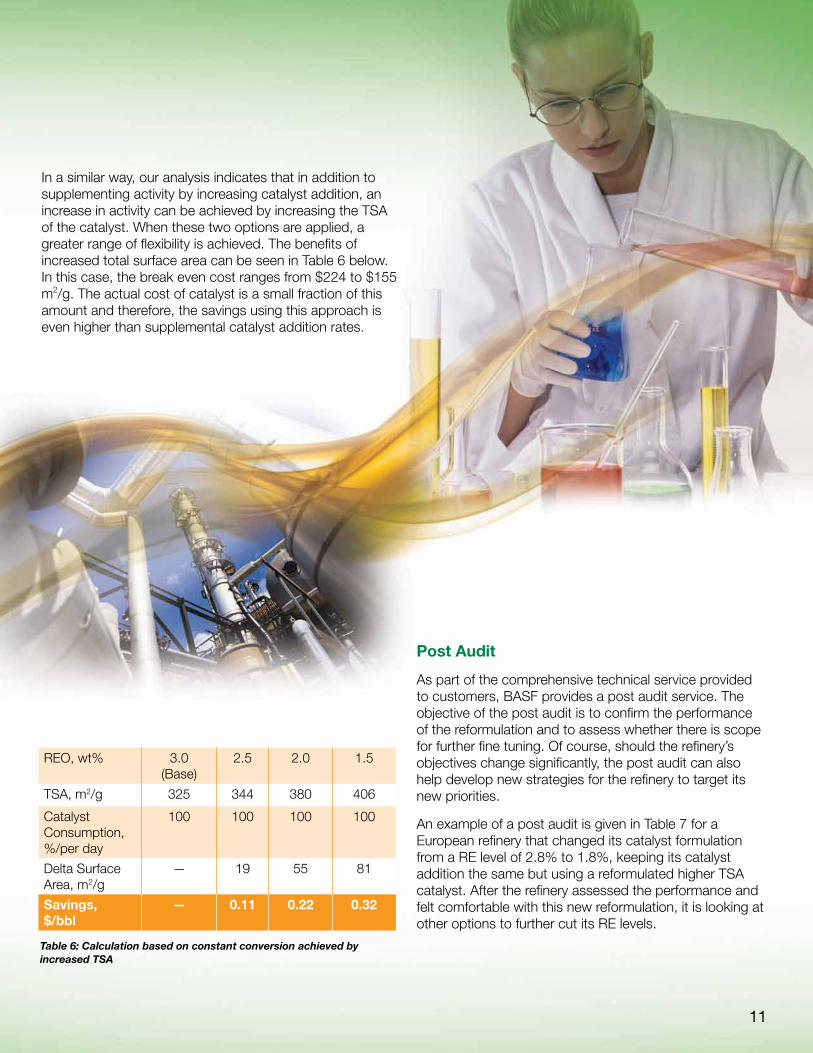
REO, wt% 3.0 (Base)
2.5 2.0 1.5
TSA, m2/g 325 344 380 406
Catalyst Consumption, %/per day
100 100 100 100
Delta Surface Area, m2/g
— 19 55 81
Savings, $/bbl
— 0.11 0.22 0.32
In a similar way, our analysis indicates that in addition to supplementing activity by increasing catalyst addition, an increase in activity can be achieved by increasing the TSA of the catalyst. When these two options are applied, a greater range of flexibility is achieved. The benefits of increased total surface area can be seen in Table 6 below. In this case, the break even cost ranges from $224 to $155 m2/g. The actual cost of catalyst is a small fraction of this amount and therefore, the savings using this approach is even higher than supplemental catalyst addition rates.
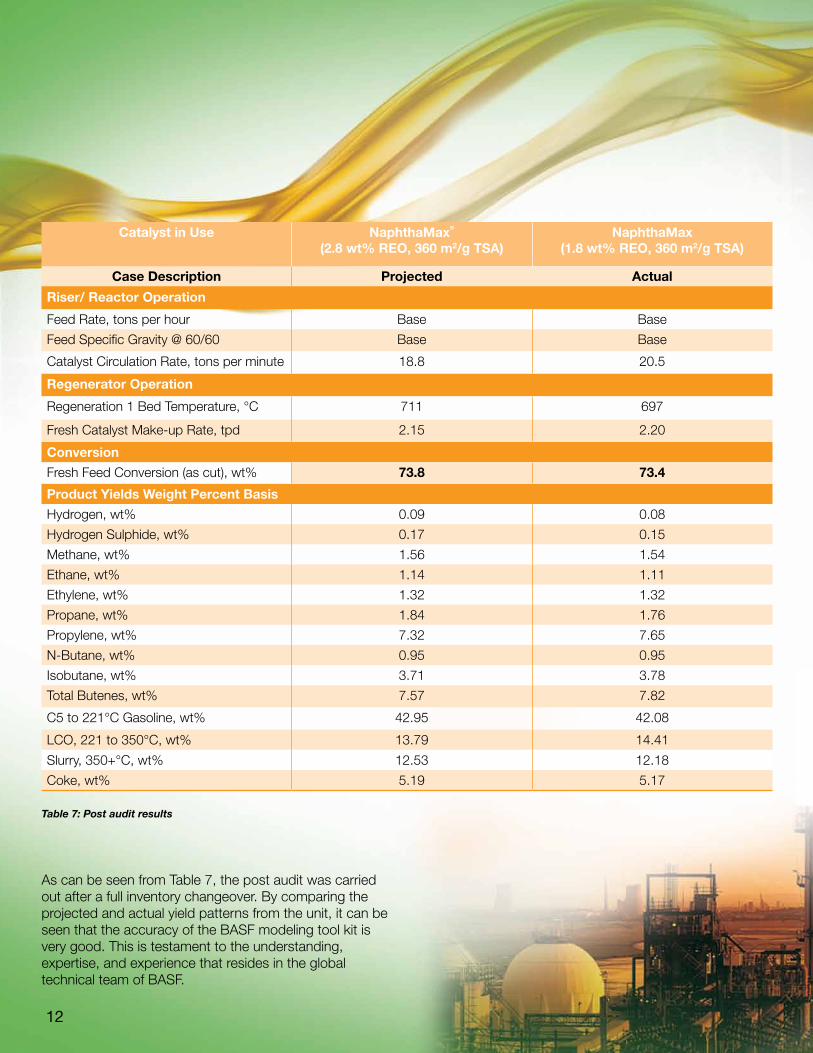
Post Audit
As part of the comprehensive technical service provided to customers, BASF provides a post audit service. The objective of the post audit is to confirm the performance of the reformulation and to assess whether there is scope for further fine tuning. Of course, should the refinery’s objectives change significantly, the post audit can also help develop new strategies for the refinery to target its new priorities.
An example of a post audit is given in Table 7 for a European refinery that changed its catalyst formulation from a RE level of 2.8% to 1.8%, keeping its catalyst addition the same but using a reformulated higher TSA catalyst. After the refinery assessed the performance and felt comfortable with this new reformulation, it is looking at other options to further cut its RE levels.
Table 6: Calculation based on constant conversion achieved by increased TSA
12
Riser/ Reactor Operation
Feed Rate, tons per hour Base Base
Feed Specific Gravity @ 60/60 Base Base
Catalyst Circulation Rate, tons per minute 18.8 20.5
Regenerator Operation
Regeneration 1 Bed Temperature, °C 711 697
Fresh Catalyst Make-up Rate, tpd 2.15 2.20
Conversion
Fresh Feed Conversion (as cut), wt% 73.8 73.4
Product Yields Weight Percent Basis
Hydrogen, wt% 0.09 0.08
Hydrogen Sulphide, wt% 0.17 0.15
Methane, wt% 1.56 1.54
Ethane, wt% 1.14 1.11
Ethylene, wt% 1.32 1.32
Propane, wt% 1.84 1.76
Propylene, wt% 7.32 7.65
N-Butane, wt% 0.95 0.95
Isobutane, wt% 3.71 3.78
Total Butenes, wt% 7.57 7.82
C5 to 221°C Gasoline, wt% 42.95 42.08
LCO, 221 to 350°C, wt% 13.79 14.41
Slurry, 350+°C, wt% 12.53 12.18
Coke, wt% 5.19 5.17
Catalyst in Use NaphthaMax®
(2.8 wt% REO, 360 m2/g TSA)NaphthaMax
(1.8 wt% REO, 360 m2/g TSA)
Case Description Projected Actual
As can be seen from Table 7, the post audit was carried out after a full inventory changeover. By comparing the projected and actual yield patterns from the unit, it can be seen that the accuracy of the BASF modeling tool kit is very good. This is testament to the understanding, expertise, and experience that resides in the global technical team of BASF.
Table 7: Post audit results
13
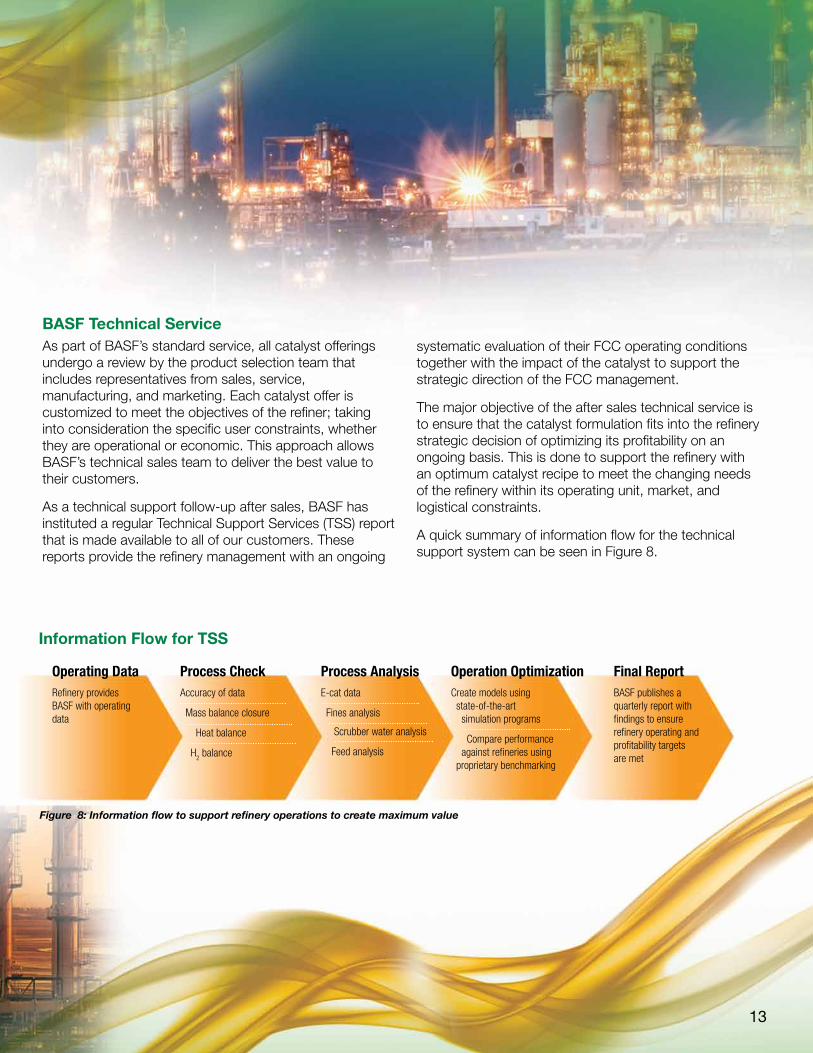
BASF Technical Service As part of BASF’s standard service, all catalyst offerings undergo a review by the product selection team that includes representatives from sales, service, manufacturing, and marketing. Each catalyst offer is customized to meet the objectives of the refiner; taking into consideration the specific user constraints, whether they are operational or economic. This approach allows BASF’s technical sales team to deliver the best value to their customers.
As a technical support follow-up after sales, BASF has instituted a regular Technical Support Services (TSS) report that is made available to all of our customers. These reports provide the refinery management with an ongoing
Information Flow for TSS
Operating DataRefinery provides BASF with operating data
Process CheckAccuracy of data
Mass balance closure
Heat balance
H2 balance
Process AnalysisE-cat data
Fines analysis
Scrubber water analysis
Feed analysis
Operation OptimizationCreate models using state-of-the-art simulation programs
Compare performance against refineries using proprietary benchmarking
Final ReportBASF publishes a quarterly report with findings to ensure refinery operating and profitability targets are met
Figure8:Informationflowtosupportrefineryoperationstocreatemaximumvalue
systematic evaluation of their FCC operating conditions together with the impact of the catalyst to support the strategic direction of the FCC management.
The major objective of the after sales technical service is to ensure that the catalyst formulation fits into the refinery strategic decision of optimizing its profitability on an ongoing basis. This is done to support the refinery with an optimum catalyst recipe to meet the changing needs of the refinery within its operating unit, market, and logistical constraints.
A quick summary of information flow for the technical support system can be seen in Figure 8.
14
ConclusionIn the context of the high RE price environment, BASF makes available critical competencies that refiners can apply to reduce operating costs associated with fresh catalyst purchase and minimize the risk of a catalyst reformulation. The process of extracting maximum benefit comes into being by the interplay of information between the customer and BASF through communication, understanding, tools, and products.
BASF has managed this process at the front end with heavy investments in R&D, production process, and equipment to bring about best-in-class products. The process begins with the account manager fully understanding the needs of the customer to reduce operating costs, as well as being fully versed regarding the operating objectives and constraints of the unit. This information is presented to the product selection team, comprised of members with global experience, to select one or more products for a given set of operating conditions. Once the catalyst is selected, the product is evaluated in a proprietary FCC simulations model against the customers’ operating capabilities and constraints. The information gathered from simulation programs is then compared against a benchmark database to ensure practical potential reality of the selection, which the account manager then fully discloses to the customer.
Once a decision is made by the customer, the execution of the process moves into the next phase. A heightened level of technical support is initiated where real operational data from the refinery is analyzed for consistency and accuracy. Regular and timely meetings are held with the customer accompanied by detailed reports to keep the refiner fully apprised of the unit operation, economic impacts, and constraint positions. This is to minimize surprises for the FCC management.
After the total inventory has been turned over, a post audit is carried out to assess and confirm the projections. The post audit also gives the refinery the opportunity to decide if there is still further scope for improvement. Through state-of-the-art technology and a partnering approach, BASF is able to combine the benefits of selecting the optimal product, expertise, and global experience to ensure continued value creation for its customers. For the customers, this approach helps them make highly informed, high quality decisions to support the refinery’s plan by minimizing risk and surprises and increasing profitability.
15
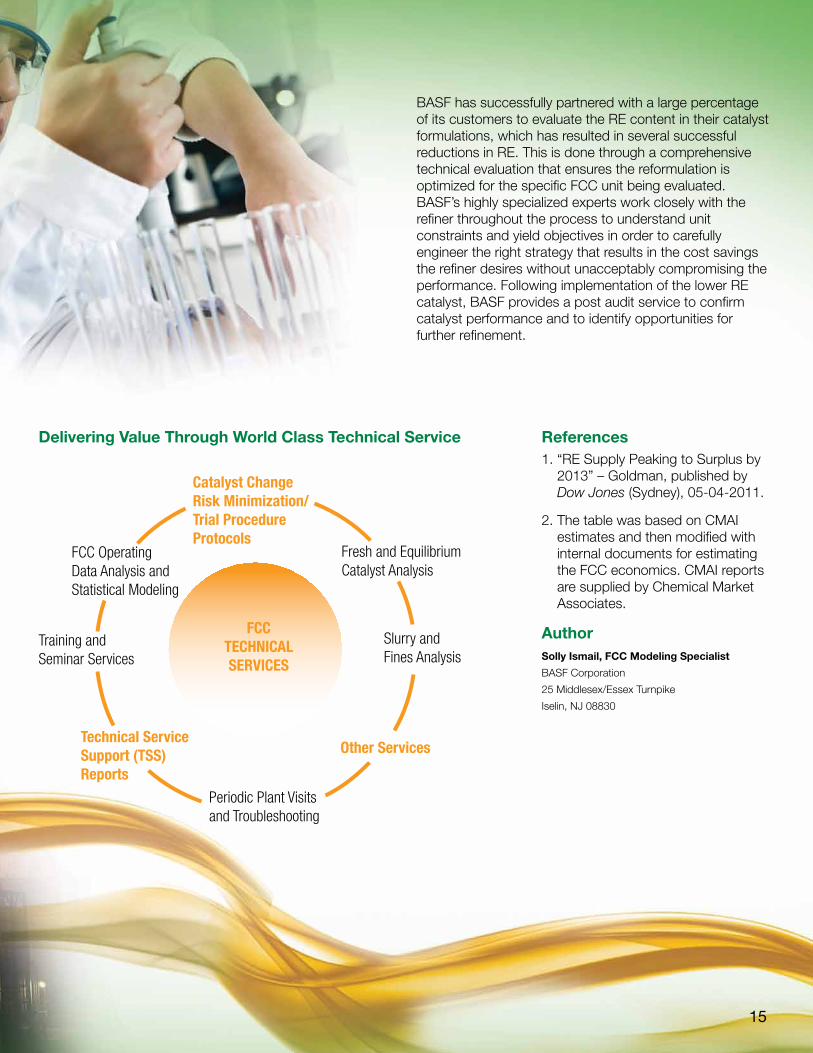
BASF has successfully partnered with a large percentage of its customers to evaluate the RE content in their catalyst formulations, which has resulted in several successful reductions in RE. This is done through a comprehensive technical evaluation that ensures the reformulation is optimized for the specific FCC unit being evaluated. BASF’s highly specialized experts work closely with the refiner throughout the process to understand unit constraints and yield objectives in order to carefully engineer the right strategy that results in the cost savings the refiner desires without unacceptably compromising the performance. Following implementation of the lower RE catalyst, BASF provides a post audit service to confirm catalyst performance and to identify opportunities for further refinement.
References1. “RE Supply Peaking to Surplus by
2013” – Goldman, published by Dow Jones (Sydney), 05-04-2011.
2. The table was based on CMAI estimates and then modified with internal documents for estimating the FCC economics. CMAI reports are supplied by Chemical Market Associates.
AuthorSolly Ismail, FCC Modeling Specialist
BASF Corporation
25 Middlesex/Essex Turnpike
Iselin, NJ 08830
Catalyst Change Risk Minimization/Trial Procedure Protocols
Fresh and Equilibrium Catalyst Analysis
Slurry and Fines Analysis
Technical Service Support (TSS) Reports
Periodic Plant Visits and Troubleshooting
Other Services
Training andSeminar Services
FCC Operating Data Analysis and Statistical Modeling
FCCTECHNICALSERVICES
Delivering Value Through World Class Technical Service
About Us
BASF’s Catalysts division is the world’s leading supplier of environmental and process catalysts. The group offers exceptional expertise in the development of technologies that protect the air we breathe, produce the fuels that power our world and ensure efficient production of a wide variety of chemicals, plastics and other products. By leveraging our industry-leading R&D platforms, passion for innovation and deep knowledge of precious and base metals, BASF’s Catalysts division develops unique, proprietary catalyst and adsorbent solutions that drive customer success.
Within BASF Catalysts, BASF’s Refining Catalyst Division is a global leader in FCC Catalysts, Co-Catalysts, and Additives. Our innovative products produce higher yields and increased efficiencies. In addition, BASF’s Technical Experts partner closely with each of its refinery clients to understand the refinery’s objectives and challenges. Through this partnership, BASF continually evaluates and calibrates the refinery’s FCC catalyst solution to ensure optimal performance and value. When the right reaction matters, trust BASF to deliver innovation, value, and performance to your refinery.
BASF - The Chemical Company
Americas Sales Office BASF Corporation 1111 Bagby Street Houston, TX 77002 Tel: +1-732-205-7188 Fax: +1-732-205-7725 Email: [email protected]
Asia Sales Office BASF South East Asia Pte Ltd. 7 Temasek Boulevard #35-01 Suntec Tower One Singapore 038987 Tel: +65-6337-0330 Fax: +65-6398-5104 Email: [email protected]
Europe, Middle East, Africa Sales Office BASF plc Earl Road, Cheadle Hulme P.O. Box 4 Cheadle, CHESHIRE, SK8 6QG, UK Tel: +44-(0)-161-488-5156 Fax: +44-(0)-161-485-5487 Email: [email protected]
NaphthaMax is a trademark of BASF.
Although all statements and information in this publication are believed to be accurate and reliable, they are presented gratis and for guidance only, and risks and liability for results obtained by use of the products or application of the suggestions described are assumed by the user. NO WARRANTIES OF ANY KIND, EITHER EXPRESSED OR IMPLIED, INCLUDING WARRANTIES OF MERCHANTABILITY OR FITNESS FOR A PARTICULAR PURPOSE, ARE MADE REGARDING PRODUCTS DESCRIBED OR DESIGNS, DATA OR INFORMATION SET FORTH. Statements or suggestions concerning possible use of the products are made without representation or warranty that any such use is free of patent infringement and are not recommendations to infringe any patent. The user should not assume that toxicity data and safety measures are indicated or that other measures may not be required. © 2012 BASF
BF-9626 USL 01/12www.catalysts.basf.com/refining