fluid phase equilibriabouillot/publications/maghsoodloo2018c.pdf · thermodynamics phase equilibria...
TRANSCRIPT

lable at ScienceDirect
Fluid Phase Equilibria 472 (2018) 22e38
Contents lists avai
Fluid Phase Equilibria
journal homepage: www.elsevier .com/locate/fluid
A review on hydrate composition and capability of thermodynamicmodeling to predict hydrate pressure and composition
Saheb Maghsoodloo Babakhani*, Baptiste Bouillot, Son Ho-Van, J�erome Douzet,Jean-Michel HerriEcole des Mines de Saint-Etienne, SPIN, CNRS 5307, LGF, F-42023, Saint-Etienne, France
a r t i c l e i n f o
Article history:Received 17 January 2018Received in revised form30 April 2018Accepted 3 May 2018Available online 7 May 2018
Keywords:Gas hydratesHydrate compositionThermodynamicsPhase equilibriaModeling
* Corresponding author.E-mail address: [email protected] (S. Maghsoodloo
https://doi.org/10.1016/j.fluid.2018.05.0070378-3812/© 2018 Elsevier B.V. All rights reserved.
a b s t r a c t
Gas hydrates are widely considered to be a crucial topic in oil and gas industries and attracting significantresearch due to potential applications such as gas storage, separation as well as water desalination. Whilethe guest composition of hydrate phase is vital, due to the experimental difficulties in measuring hydratecomposition, very little applicable information is available in the literature. Paradoxically, this is true, inspite of that; completing an experimental database on hydrate composition could have a significantimpact on the processes design and modeling. Moreover, this should provide fundamental knowledge ofkinetic effects as well as clarifying thermodynamic equilibrium. Hence, this paper was planned with theintent to fill in the gaps, classify and offer an overview of experimentally derived data on hydratecomposition for literature. In addition, a thermodynamic model based on the van der Waals and Plat-teeuw approach and Kihara potential was utilized to simulate the hydrate composition along withequilibrium pressure.
Previous experimental data shows that guest distribution in hydrate phase depends noticeably on theguest composition in vapor phase. In addition, composition of larger molecules, such as propane orbutane, in the hydrate phase, is notably higher than in vapor phase. Our simulation results demonstratedthat the hydrate composition data from direct measurement (microscopic tools) have been well evalu-ated by the thermodynamic model. Nevertheless, when structural transition can occur in a system, thethermodynamic model is no longer accurate. In the case of indirect measurements, the thermodynamicmodel usually predicts well the hydrate composition. Nonetheless, its capability does vary with differinghydrate composition and equilibrium pressure, to the extent that in some cases, it completely fails topredict hydrate composition. This could be due to kinetic effects on the enclathration of guest moleculesduring the crystallization, errors in experimental techniques to measure the hydrate composition or themodel parameters like Kihara potential are not properly applied. Finally, these observations show thatmore reliable experimental database is needed to study the evolution of guest distribution in hydratephase and some enhancements are required for the standard thermodynamic model.
© 2018 Elsevier B.V. All rights reserved.
1. Introduction
One of the main concerns in flow assurance during oil and gasproduction is avoiding gas hydrate formation due to the presence ofwater and light hydrocarbons at high pressure and low tempera-ture conditions, especially true for deep sea drilling or articexploration and pipelines. Therefore, the safety and economic costsof removing gas hydrates have been of great interest [1e8]. Plus, the
Babakhani).
enormous amount of natural gas in the form of oceanic andpermafrost gas hydrates are a promising future energy resource[9e12]. Recently, gas hydrates have attracted widespread attentiondue to diverse applications such as gas separation [13e21], CO2capture [22e30], water desalination [31e38], natural gas storageand transportation [39e44] and even planetary science [45e48].For all above mentioned applications of clathrate hydrates, it isessential to increase our knowledge of thermodynamics, kineticsand the crystallization mechanisms of clathrate hydrates.
Numerous studies have investigated phase equilibria of clath-rate hydrates [12,33,49e54]. Nonetheless, there has been littleconsideration for hydrate composition. Indeed, quantifying hydrate
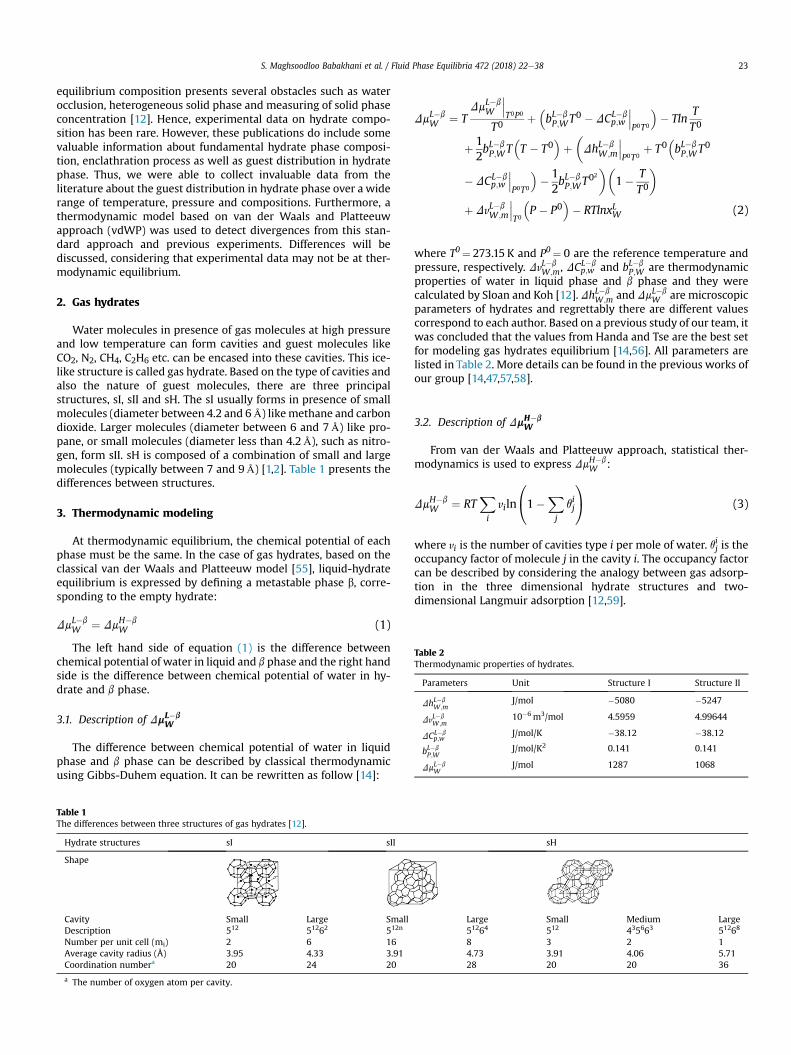
Table 2Thermodynamic properties of hydrates.
Parameters Unit Structure I Structure II
DhL�bW ;m
J/mol �5080 �5247
DvL�bW ;m
10�6m3/mol 4.5959 4.99644
DCL�bp;w
J/mol/K �38.12 �38.12
bL�bP;W
J/mol/K2 0.141 0.141
DmL�bW
J/mol 1287 1068
S. Maghsoodloo Babakhani et al. / Fluid Phase Equilibria 472 (2018) 22e38 23
equilibrium composition presents several obstacles such as waterocclusion, heterogeneous solid phase and measuring of solid phaseconcentration [12]. Hence, experimental data on hydrate compo-sition has been rare. However, these publications do include somevaluable information about fundamental hydrate phase composi-tion, enclathration process as well as guest distribution in hydratephase. Thus, we were able to collect invaluable data from theliterature about the guest distribution in hydrate phase over a widerange of temperature, pressure and compositions. Furthermore, athermodynamic model based on van der Waals and Platteeuwapproach (vdWP) was used to detect divergences from this stan-dard approach and previous experiments. Differences will bediscussed, considering that experimental data may not be at ther-modynamic equilibrium.
2. Gas hydrates
Water molecules in presence of gas molecules at high pressureand low temperature can form cavities and guest molecules likeCO2, N2, CH4, C2H6 etc. can be encased into these cavities. This ice-like structure is called gas hydrate. Based on the type of cavities andalso the nature of guest molecules, there are three principalstructures, sI, sII and sH. The sI usually forms in presence of smallmolecules (diameter between 4.2 and 6Å) likemethane and carbondioxide. Larger molecules (diameter between 6 and 7Å) like pro-pane, or small molecules (diameter less than 4.2Å), such as nitro-gen, form sII. sH is composed of a combination of small and largemolecules (typically between 7 and 9Å) [1,2]. Table 1 presents thedifferences between structures.
3. Thermodynamic modeling
At thermodynamic equilibrium, the chemical potential of eachphase must be the same. In the case of gas hydrates, based on theclassical van der Waals and Platteeuw model [55], liquid-hydrateequilibrium is expressed by defining a metastable phase b, corre-sponding to the empty hydrate:
DmL�bW ¼ DmH�b
W (1)
The left hand side of equation (1) is the difference betweenchemical potential of water in liquid and b phase and the right handside is the difference between chemical potential of water in hy-drate and b phase.
3.1. Description of DmL�bW
The difference between chemical potential of water in liquidphase and b phase can be described by classical thermodynamicusing Gibbs-Duhem equation. It can be rewritten as follow [14]:
Table 1The differences between three structures of gas hydrates [12].
Hydrate structures sI sII
Shape
Cavity Small Large SmallDescription 512 51262 512n
Number per unit cell (mi) 2 6 16Average cavity radius (Å) 3.95 4.33 3.91Coordination numbera 20 24 20
a The number of oxygen atom per cavity.
DmL�bW ¼ T
DmL�bW
���T0P0
T0þ�bL�bP;WT0 � DCL�b
p;w
���P0T0
�� Tln
TT0
þ 12bL�bP;WT
�T � T0
�þ�DhL�b
W;m
���P0T0
þ T0�bL�bP;WT0
� DCL�bp;w
���P0T0
�� 12bL�bP;WT0
2��
1� TT0
�
þ DvL�bW ;m
���T0
�P � P0
�� RTlnxLW (2)
where T0¼ 273.15 K and P0¼ 0 are the reference temperature andpressure, respectively. DvL�b
W ;m, DCL�bp;w and bL�b
P;W are thermodynamicproperties of water in liquid phase and b phase and they werecalculated by Sloan and Koh [12]. DhL�b
W;m and DmL�bW are microscopic
parameters of hydrates and regrettably there are different valuescorrespond to each author. Based on a previous study of our team, itwas concluded that the values from Handa and Tse are the best setfor modeling gas hydrates equilibrium [14,56]. All parameters arelisted in Table 2. More details can be found in the previous works ofour group [14,47,57,58].
3.2. Description of DmH�bW
From van der Waals and Platteeuw approach, statistical ther-modynamics is used to express DmH�b
W :
DmH�bW ¼ RT
Xi
viln
0@1�
Xj
qij
1A (3)
where vi is the number of cavities type i per mole of water. qij is theoccupancy factor of molecule j in the cavity i. The occupancy factorcan be described by considering the analogy between gas adsorp-tion in the three dimensional hydrate structures and two-dimensional Langmuir adsorption [12,59].
sH
Large Small Medium Large51264 512 435663 51268
8 3 2 14.73 3.91 4.06 5.7128 20 20 36
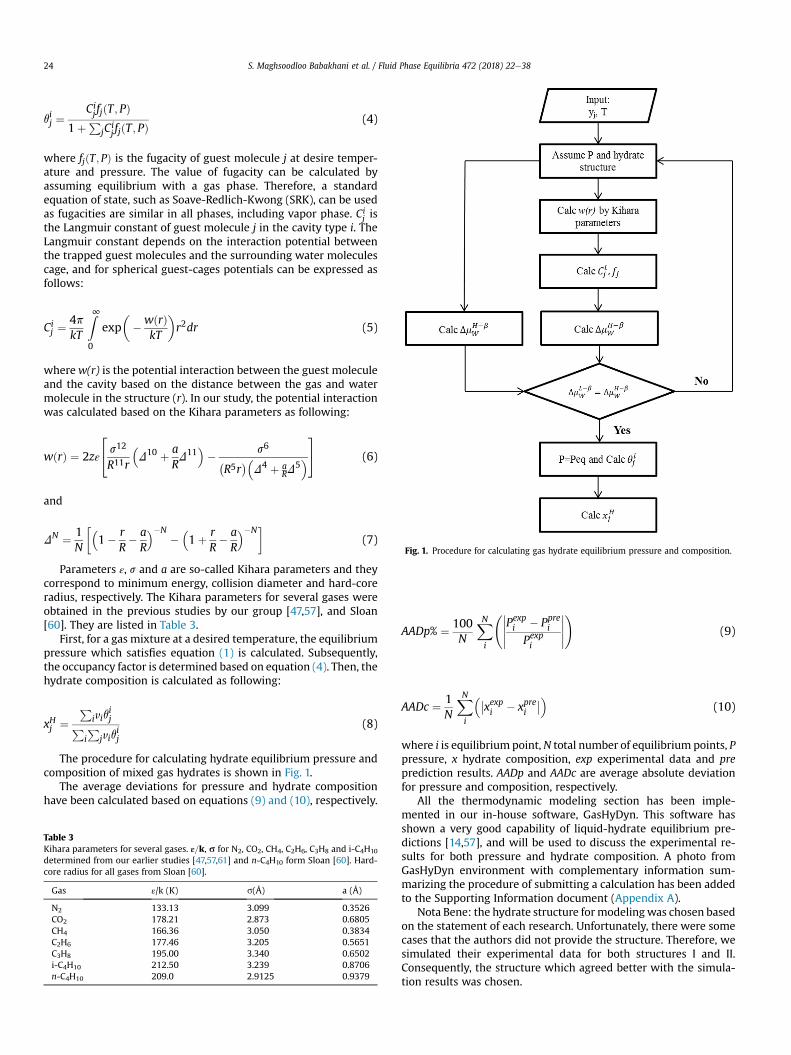
Fig. 1. Procedure for calculating gas hydrate equilibrium pressure and composition.
S. Maghsoodloo Babakhani et al. / Fluid Phase Equilibria 472 (2018) 22e3824
qij ¼Cij fjðT ; PÞ
1þPjCij fjðT ; PÞ
(4)
where fjðT ; PÞ is the fugacity of guest molecule j at desire temper-ature and pressure. The value of fugacity can be calculated byassuming equilibrium with a gas phase. Therefore, a standardequation of state, such as Soave-Redlich-Kwong (SRK), can be usedas fugacities are similar in all phases, including vapor phase. Ci
j isthe Langmuir constant of guest molecule j in the cavity type i. TheLangmuir constant depends on the interaction potential betweenthe trapped guest molecules and the surrounding water moleculescage, and for spherical guest-cages potentials can be expressed asfollows:
Cij ¼
4pkT
Z∞0
exp��wðrÞ
kT
�r2dr (5)
wherew(r) is the potential interaction between the guest moleculeand the cavity based on the distance between the gas and watermolecule in the structure (r). In our study, the potential interactionwas calculated based on the Kihara parameters as following:
wðrÞ ¼ 2zε
24 s12
R11r
�D10 þ a
RD11
�� s6�
R5r��
D4 þ aRD
5�35 (6)
and
DN ¼ 1N
�1� r
R� aR
��N��1þ r
R� aR
��N
(7)
Parameters ε, s and a are so-called Kihara parameters and theycorrespond to minimum energy, collision diameter and hard-coreradius, respectively. The Kihara parameters for several gases wereobtained in the previous studies by our group [47,57], and Sloan[60]. They are listed in Table 3.
First, for a gas mixture at a desired temperature, the equilibriumpressure which satisfies equation (1) is calculated. Subsequently,the occupancy factor is determined based on equation (4). Then, thehydrate composition is calculated as following:
xHj ¼P
iviqijP
iP
jviqij
(8)
The procedure for calculating hydrate equilibrium pressure andcomposition of mixed gas hydrates is shown in Fig. 1.
The average deviations for pressure and hydrate compositionhave been calculated based on equations (9) and (10), respectively.
Table 3Kihara parameters for several gases. ε=k, s for N2, CO2, CH4, C2H6, C3H8 and i-C4H10
determined from our earlier studies [47,57,61] and n-C4H10 form Sloan [60]. Hard-core radius for all gases from Sloan [60].
Gas ε/k (K) s(Å) a (Å)
N2 133.13 3.099 0.3526CO2 178.21 2.873 0.6805CH4 166.36 3.050 0.3834C2H6 177.46 3.205 0.5651C3H8 195.00 3.340 0.6502i-C4H10 212.50 3.239 0.8706n-C4H10 209.0 2.9125 0.9379
AADp% ¼ 100N
XNi
�����Pexpi � Pprei
Pexpi
�����!
(9)
AADc ¼ 1N
XNi
���xexpi � xprei
��� (10)
where i is equilibrium point,N total number of equilibrium points, Ppressure, x hydrate composition, exp experimental data and preprediction results. AADp and AADc are average absolute deviationfor pressure and composition, respectively.
All the thermodynamic modeling section has been imple-mented in our in-house software, GasHyDyn. This software hasshown a very good capability of liquid-hydrate equilibrium pre-dictions [14,57], and will be used to discuss the experimental re-sults for both pressure and hydrate composition. A photo fromGasHyDyn environment with complementary information sum-marizing the procedure of submitting a calculation has been addedto the Supporting Information document (Appendix A).
Nota Bene: the hydrate structure formodelingwas chosen basedon the statement of each research. Unfortunately, there were somecases that the authors did not provide the structure. Therefore, wesimulated their experimental data for both structures I and II.Consequently, the structure which agreed better with the simula-tion results was chosen.
S. Maghsoodloo Babakhani et al. / Fluid Phase Equilibria 472 (2018) 22e38 25
4. Hydrate composition in literature and model comparison
Despite countless works on equilibrium pressure and temper-ature of mixed gas hydrates, to the best of our knowledge, there arestill few studies on the hydrate composition which depends on thepressure, temperature and gas phase composition. Thanks to gaschromatography, the composition of the gas phase can be easilymeasured, but solid phase analysis is still challenging, often leadingto experimental errors. In addition, some researchers studied thehydrate composition of gas mixtures by different methods makingthem exceedingly difficult to compare. Hence, in the present work,studies providing hydrate composition in open literature werecollected and presented. Moreover, the capability of a thermody-namic model to predict hydrate pressure and composition wasevaluated. This should be noted that there were some studies onthe hydrate composition of gas mixtures that do not furnish exactvalues of hydrate composition. Sometimes, only figures wereshown and quantitative data were not available. In this section, thecollected data from open literature is categorized based on theirmethods of hydrate composition measurements.
4.1. Dissociation of whole hydrate phase
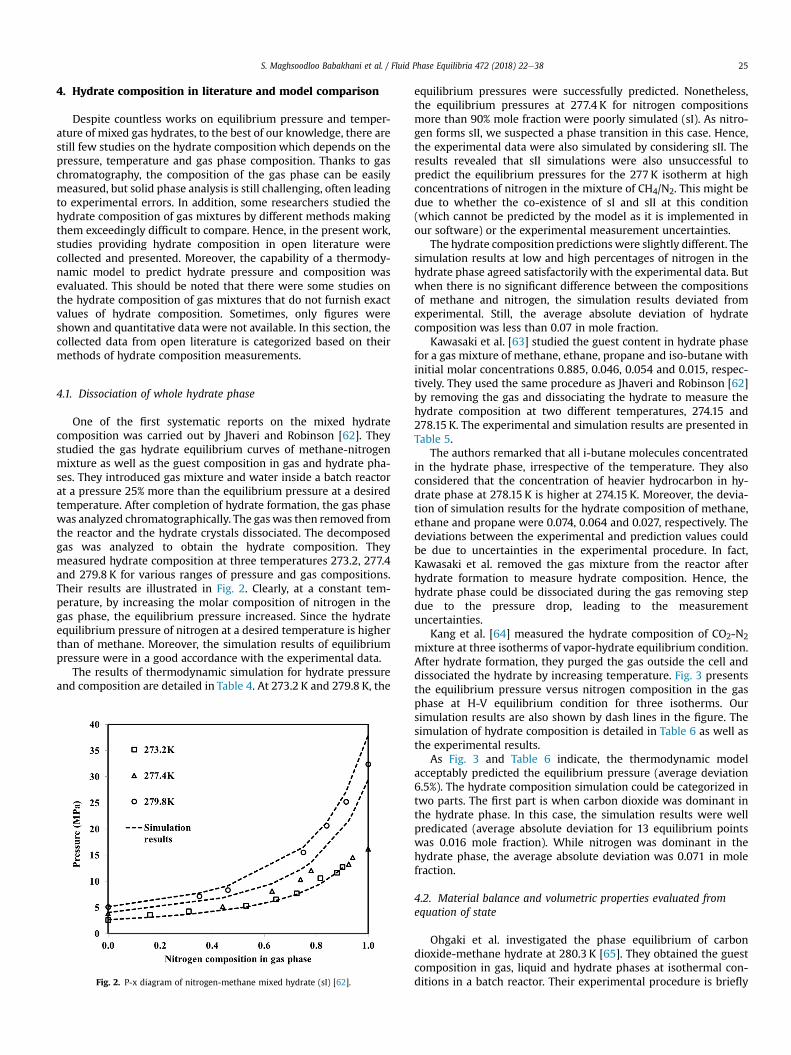
One of the first systematic reports on the mixed hydratecomposition was carried out by Jhaveri and Robinson [62]. Theystudied the gas hydrate equilibrium curves of methane-nitrogenmixture as well as the guest composition in gas and hydrate pha-ses. They introduced gas mixture and water inside a batch reactorat a pressure 25% more than the equilibrium pressure at a desiredtemperature. After completion of hydrate formation, the gas phasewas analyzed chromatographically. The gas was then removed fromthe reactor and the hydrate crystals dissociated. The decomposedgas was analyzed to obtain the hydrate composition. Theymeasured hydrate composition at three temperatures 273.2, 277.4and 279.8 K for various ranges of pressure and gas compositions.Their results are illustrated in Fig. 2. Clearly, at a constant tem-perature, by increasing the molar composition of nitrogen in thegas phase, the equilibrium pressure increased. Since the hydrateequilibrium pressure of nitrogen at a desired temperature is higherthan of methane. Moreover, the simulation results of equilibriumpressure were in a good accordance with the experimental data.
The results of thermodynamic simulation for hydrate pressureand composition are detailed in Table 4. At 273.2 K and 279.8 K, the
Fig. 2. P-x diagram of nitrogen-methane mixed hydrate (sI) [62].
equilibrium pressures were successfully predicted. Nonetheless,the equilibrium pressures at 277.4 K for nitrogen compositionsmore than 90% mole fraction were poorly simulated (sI). As nitro-gen forms sII, we suspected a phase transition in this case. Hence,the experimental data were also simulated by considering sII. Theresults revealed that sII simulations were also unsuccessful topredict the equilibrium pressures for the 277 K isotherm at highconcentrations of nitrogen in the mixture of CH4/N2. This might bedue to whether the co-existence of sI and sII at this condition(which cannot be predicted by the model as it is implemented inour software) or the experimental measurement uncertainties.
The hydrate composition predictions were slightly different. Thesimulation results at low and high percentages of nitrogen in thehydrate phase agreed satisfactorily with the experimental data. Butwhen there is no significant difference between the compositionsof methane and nitrogen, the simulation results deviated fromexperimental. Still, the average absolute deviation of hydratecomposition was less than 0.07 in mole fraction.
Kawasaki et al. [63] studied the guest content in hydrate phasefor a gas mixture of methane, ethane, propane and iso-butane withinitial molar concentrations 0.885, 0.046, 0.054 and 0.015, respec-tively. They used the same procedure as Jhaveri and Robinson [62]by removing the gas and dissociating the hydrate to measure thehydrate composition at two different temperatures, 274.15 and278.15 K. The experimental and simulation results are presented inTable 5.
The authors remarked that all i-butane molecules concentratedin the hydrate phase, irrespective of the temperature. They alsoconsidered that the concentration of heavier hydrocarbon in hy-drate phase at 278.15 K is higher at 274.15 K. Moreover, the devia-tion of simulation results for the hydrate composition of methane,ethane and propane were 0.074, 0.064 and 0.027, respectively. Thedeviations between the experimental and prediction values couldbe due to uncertainties in the experimental procedure. In fact,Kawasaki et al. removed the gas mixture from the reactor afterhydrate formation to measure hydrate composition. Hence, thehydrate phase could be dissociated during the gas removing stepdue to the pressure drop, leading to the measurementuncertainties.
Kang et al. [64] measured the hydrate composition of CO2-N2mixture at three isotherms of vapor-hydrate equilibrium condition.After hydrate formation, they purged the gas outside the cell anddissociated the hydrate by increasing temperature. Fig. 3 presentsthe equilibrium pressure versus nitrogen composition in the gasphase at H-V equilibrium condition for three isotherms. Oursimulation results are also shown by dash lines in the figure. Thesimulation of hydrate composition is detailed in Table 6 as well asthe experimental results.
As Fig. 3 and Table 6 indicate, the thermodynamic modelacceptably predicted the equilibrium pressure (average deviation6.5%). The hydrate composition simulation could be categorized intwo parts. The first part is when carbon dioxide was dominant inthe hydrate phase. In this case, the simulation results were wellpredicated (average absolute deviation for 13 equilibrium pointswas 0.016 mole fraction). While nitrogen was dominant in thehydrate phase, the average absolute deviation was 0.071 in molefraction.
4.2. Material balance and volumetric properties evaluated fromequation of state
Ohgaki et al. investigated the phase equilibrium of carbondioxide-methane hydrate at 280.3 K [65]. They obtained the guestcomposition in gas, liquid and hydrate phases at isothermal con-ditions in a batch reactor. Their experimental procedure is briefly
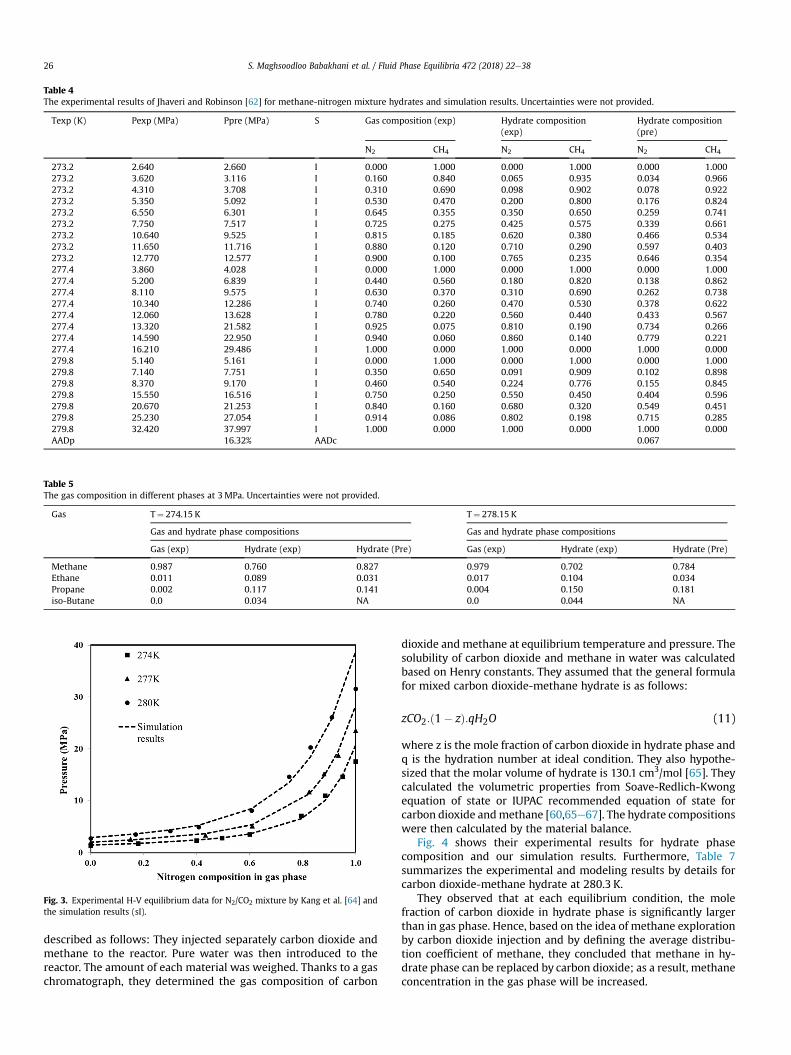
Table 4The experimental results of Jhaveri and Robinson [62] for methane-nitrogen mixture hydrates and simulation results. Uncertainties were not provided.
Texp (K) Pexp (MPa) Ppre (MPa) S Gas composition (exp) Hydrate composition(exp)
Hydrate composition(pre)
N2 CH4 N2 CH4 N2 CH4
273.2 2.640 2.660 I 0.000 1.000 0.000 1.000 0.000 1.000273.2 3.620 3.116 I 0.160 0.840 0.065 0.935 0.034 0.966273.2 4.310 3.708 I 0.310 0.690 0.098 0.902 0.078 0.922273.2 5.350 5.092 I 0.530 0.470 0.200 0.800 0.176 0.824273.2 6.550 6.301 I 0.645 0.355 0.350 0.650 0.259 0.741273.2 7.750 7.517 I 0.725 0.275 0.425 0.575 0.339 0.661273.2 10.640 9.525 I 0.815 0.185 0.620 0.380 0.466 0.534273.2 11.650 11.716 I 0.880 0.120 0.710 0.290 0.597 0.403273.2 12.770 12.577 I 0.900 0.100 0.765 0.235 0.646 0.354277.4 3.860 4.028 I 0.000 1.000 0.000 1.000 0.000 1.000277.4 5.200 6.839 I 0.440 0.560 0.180 0.820 0.138 0.862277.4 8.110 9.575 I 0.630 0.370 0.310 0.690 0.262 0.738277.4 10.340 12.286 I 0.740 0.260 0.470 0.530 0.378 0.622277.4 12.060 13.628 I 0.780 0.220 0.560 0.440 0.433 0.567277.4 13.320 21.582 I 0.925 0.075 0.810 0.190 0.734 0.266277.4 14.590 22.950 I 0.940 0.060 0.860 0.140 0.779 0.221277.4 16.210 29.486 I 1.000 0.000 1.000 0.000 1.000 0.000279.8 5.140 5.161 I 0.000 1.000 0.000 1.000 0.000 1.000279.8 7.140 7.751 I 0.350 0.650 0.091 0.909 0.102 0.898279.8 8.370 9.170 I 0.460 0.540 0.224 0.776 0.155 0.845279.8 15.550 16.516 I 0.750 0.250 0.550 0.450 0.404 0.596279.8 20.670 21.253 I 0.840 0.160 0.680 0.320 0.549 0.451279.8 25.230 27.054 I 0.914 0.086 0.802 0.198 0.715 0.285279.8 32.420 37.997 I 1.000 0.000 1.000 0.000 1.000 0.000AADp 16.32% AADc 0.067
Table 5The gas composition in different phases at 3MPa. Uncertainties were not provided.
Gas T¼ 274.15 K T¼ 278.15 K
Gas and hydrate phase compositions Gas and hydrate phase compositions
Gas (exp) Hydrate (exp) Hydrate (Pre) Gas (exp) Hydrate (exp) Hydrate (Pre)
Methane 0.987 0.760 0.827 0.979 0.702 0.784Ethane 0.011 0.089 0.031 0.017 0.104 0.034Propane 0.002 0.117 0.141 0.004 0.150 0.181iso-Butane 0.0 0.034 NA 0.0 0.044 NA
Fig. 3. Experimental H-V equilibrium data for N2/CO2 mixture by Kang et al. [64] andthe simulation results (sI).
S. Maghsoodloo Babakhani et al. / Fluid Phase Equilibria 472 (2018) 22e3826
described as follows: They injected separately carbon dioxide andmethane to the reactor. Pure water was then introduced to thereactor. The amount of each material was weighed. Thanks to a gaschromatograph, they determined the gas composition of carbon
dioxide andmethane at equilibrium temperature and pressure. Thesolubility of carbon dioxide and methane in water was calculatedbased on Henry constants. They assumed that the general formulafor mixed carbon dioxide-methane hydrate is as follows:
zCO2:ð1� zÞ:qH2O (11)
where z is the mole fraction of carbon dioxide in hydrate phase andq is the hydration number at ideal condition. They also hypothe-sized that the molar volume of hydrate is 130.1 cm3/mol [65]. Theycalculated the volumetric properties from Soave-Redlich-Kwongequation of state or IUPAC recommended equation of state forcarbon dioxide andmethane [60,65e67]. The hydrate compositionswere then calculated by the material balance.
Fig. 4 shows their experimental results for hydrate phasecomposition and our simulation results. Furthermore, Table 7summarizes the experimental and modeling results by details forcarbon dioxide-methane hydrate at 280.3 K.
They observed that at each equilibrium condition, the molefraction of carbon dioxide in hydrate phase is significantly largerthan in gas phase. Hence, based on the idea of methane explorationby carbon dioxide injection and by defining the average distribu-tion coefficient of methane, they concluded that methane in hy-drate phase can be replaced by carbon dioxide; as a result, methaneconcentration in the gas phase will be increased.
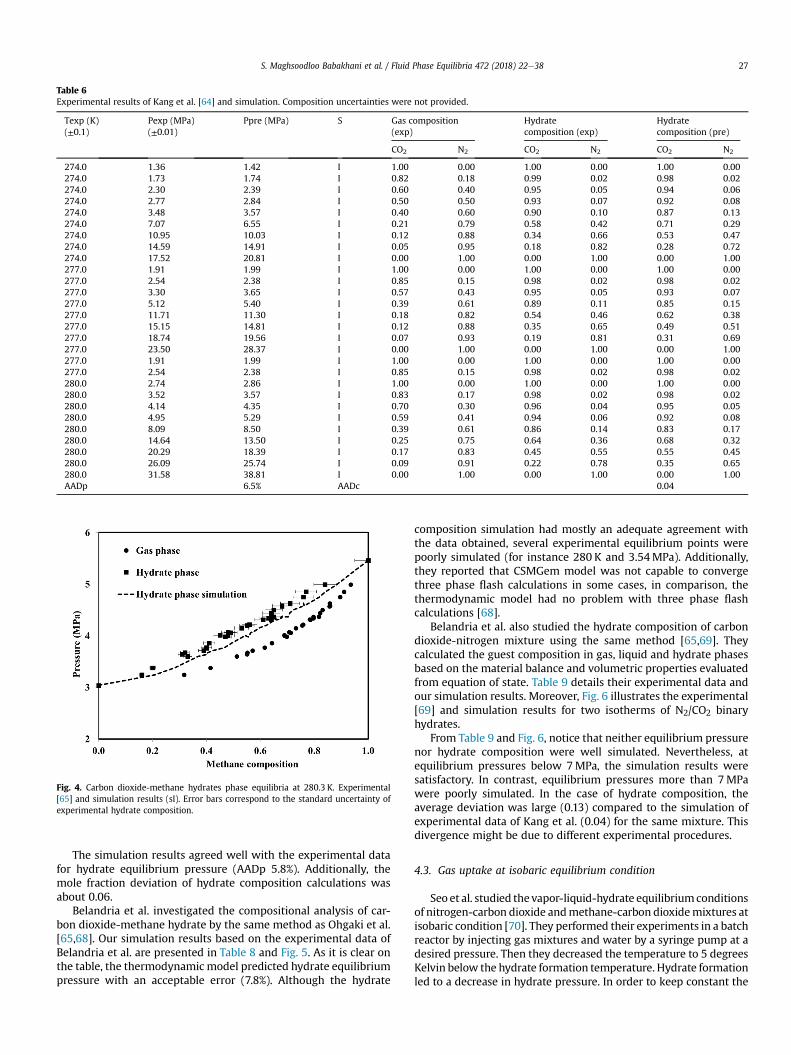
Table 6Experimental results of Kang et al. [64] and simulation. Composition uncertainties were not provided.
Texp (K)(±0.1)
Pexp (MPa)(±0.01)
Ppre (MPa) S Gas composition(exp)
Hydratecomposition (exp)
Hydratecomposition (pre)
CO2 N2 CO2 N2 CO2 N2
274.0 1.36 1.42 I 1.00 0.00 1.00 0.00 1.00 0.00274.0 1.73 1.74 I 0.82 0.18 0.99 0.02 0.98 0.02274.0 2.30 2.39 I 0.60 0.40 0.95 0.05 0.94 0.06274.0 2.77 2.84 I 0.50 0.50 0.93 0.07 0.92 0.08274.0 3.48 3.57 I 0.40 0.60 0.90 0.10 0.87 0.13274.0 7.07 6.55 I 0.21 0.79 0.58 0.42 0.71 0.29274.0 10.95 10.03 I 0.12 0.88 0.34 0.66 0.53 0.47274.0 14.59 14.91 I 0.05 0.95 0.18 0.82 0.28 0.72274.0 17.52 20.81 I 0.00 1.00 0.00 1.00 0.00 1.00277.0 1.91 1.99 I 1.00 0.00 1.00 0.00 1.00 0.00277.0 2.54 2.38 I 0.85 0.15 0.98 0.02 0.98 0.02277.0 3.30 3.65 I 0.57 0.43 0.95 0.05 0.93 0.07277.0 5.12 5.40 I 0.39 0.61 0.89 0.11 0.85 0.15277.0 11.71 11.30 I 0.18 0.82 0.54 0.46 0.62 0.38277.0 15.15 14.81 I 0.12 0.88 0.35 0.65 0.49 0.51277.0 18.74 19.56 I 0.07 0.93 0.19 0.81 0.31 0.69277.0 23.50 28.37 I 0.00 1.00 0.00 1.00 0.00 1.00277.0 1.91 1.99 I 1.00 0.00 1.00 0.00 1.00 0.00277.0 2.54 2.38 I 0.85 0.15 0.98 0.02 0.98 0.02280.0 2.74 2.86 I 1.00 0.00 1.00 0.00 1.00 0.00280.0 3.52 3.57 I 0.83 0.17 0.98 0.02 0.98 0.02280.0 4.14 4.35 I 0.70 0.30 0.96 0.04 0.95 0.05280.0 4.95 5.29 I 0.59 0.41 0.94 0.06 0.92 0.08280.0 8.09 8.50 I 0.39 0.61 0.86 0.14 0.83 0.17280.0 14.64 13.50 I 0.25 0.75 0.64 0.36 0.68 0.32280.0 20.29 18.39 I 0.17 0.83 0.45 0.55 0.55 0.45280.0 26.09 25.74 I 0.09 0.91 0.22 0.78 0.35 0.65280.0 31.58 38.81 I 0.00 1.00 0.00 1.00 0.00 1.00AADp 6.5% AADc 0.04
Fig. 4. Carbon dioxide-methane hydrates phase equilibria at 280.3 K. Experimental[65] and simulation results (sI). Error bars correspond to the standard uncertainty ofexperimental hydrate composition.
S. Maghsoodloo Babakhani et al. / Fluid Phase Equilibria 472 (2018) 22e38 27
The simulation results agreed well with the experimental datafor hydrate equilibrium pressure (AADp 5.8%). Additionally, themole fraction deviation of hydrate composition calculations wasabout 0.06.
Belandria et al. investigated the compositional analysis of car-bon dioxide-methane hydrate by the same method as Ohgaki et al.[65,68]. Our simulation results based on the experimental data ofBelandria et al. are presented in Table 8 and Fig. 5. As it is clear onthe table, the thermodynamic model predicted hydrate equilibriumpressure with an acceptable error (7.8%). Although the hydrate
composition simulation had mostly an adequate agreement withthe data obtained, several experimental equilibrium points werepoorly simulated (for instance 280 K and 3.54MPa). Additionally,they reported that CSMGem model was not capable to convergethree phase flash calculations in some cases, in comparison, thethermodynamic model had no problem with three phase flashcalculations [68].
Belandria et al. also studied the hydrate composition of carbondioxide-nitrogen mixture using the same method [65,69]. Theycalculated the guest composition in gas, liquid and hydrate phasesbased on the material balance and volumetric properties evaluatedfrom equation of state. Table 9 details their experimental data andour simulation results. Moreover, Fig. 6 illustrates the experimental[69] and simulation results for two isotherms of N2/CO2 binaryhydrates.
From Table 9 and Fig. 6, notice that neither equilibrium pressurenor hydrate composition were well simulated. Nevertheless, atequilibrium pressures below 7MPa, the simulation results weresatisfactory. In contrast, equilibrium pressures more than 7MPawere poorly simulated. In the case of hydrate composition, theaverage deviation was large (0.13) compared to the simulation ofexperimental data of Kang et al. (0.04) for the same mixture. Thisdivergence might be due to different experimental procedures.
4.3. Gas uptake at isobaric equilibrium condition
Seo et al. studied the vapor-liquid-hydrate equilibriumconditionsof nitrogen-carbon dioxide andmethane-carbon dioxidemixtures atisobaric condition [70]. They performed their experiments in a batchreactor by injecting gas mixtures and water by a syringe pump at adesired pressure. Then they decreased the temperature to 5 degreesKelvin below the hydrate formation temperature. Hydrate formationled to a decrease in hydrate pressure. In order to keep constant the

Table 7Experimental results of Ohgaki et al. [65] for methane-carbon dioxide mixture hydrates at 280.3 K and simulation results.
Pexp (MPa) (±0.005) Ppre (MPa) S Gas composition (exp) Hydrate composition(exp) (±5%)
Hydrate composition(pre)
CO2 CH4 CO2 CH4 CO2 CH4
3.04 2.98 I 1.00 0.00 1.00 0.00 1.00 0.003.24 3.46 I 0.68 0.32 0.84 0.16 0.79 0.213.38 3.55 I 0.59 0.42 0.80 0.20 0.72 0.283.60 3.85 I 0.49 0.51 0.67 0.33 0.63 0.373.64 3.93 I 0.45 0.55 0.69 0.31 0.60 0.403.67 3.93 I 0.45 0.55 0.68 0.32 0.60 0.403.71 3.98 I 0.43 0.57 0.61 0.39 0.58 0.423.77 4.09 I 0.38 0.62 0.60 0.40 0.53 0.473.86 4.16 I 0.36 0.64 0.59 0.41 0.50 0.504.22 4.49 I 0.24 0.76 0.44 0.56 0.37 0.634.31 4.57 I 0.22 0.79 0.39 0.61 0.34 0.664.32 4.57 I 0.22 0.78 0.36 0.64 0.34 0.664.34 4.61 I 0.20 0.80 0.37 0.63 0.32 0.684.37 4.61 I 0.20 0.80 0.35 0.65 0.32 0.684.37 4.68 I 0.18 0.82 0.36 0.64 0.30 0.704.44 4.70 I 0.18 0.82 0.36 0.64 0.29 0.714.50 4.73 I 0.17 0.83 0.35 0.65 0.28 0.724.57 4.82 I 0.14 0.86 0.32 0.68 0.24 0.763.98 4.31 I 0.30 0.70 0.53 0.47 0.44 0.564.00 4.29 I 0.31 0.69 0.52 0.48 0.45 0.554.01 4.28 I 0.31 0.69 0.55 0.45 0.45 0.554.06 4.35 I 0.29 0.71 0.51 0.49 0.43 0.574.07 4.33 I 0.29 0.71 0.52 0.48 0.43 0.574.15 4.41 I 0.27 0.73 0.47 0.53 0.41 0.594.20 4.48 I 0.25 0.76 0.45 0.55 0.38 0.624.58 4.83 I 0.14 0.86 0.32 0.68 0.24 0.764.63 4.83 I 0.14 0.86 0.29 0.71 0.24 0.764.75 4.96 I 0.10 0.90 0.24 0.76 0.18 0.824.85 5.03 I 0.09 0.91 0.23 0.77 0.16 0.844.99 5.14 I 0.07 0.94 0.16 0.84 0.12 0.885.46 5.44 I 0.00 1.00 0.00 1.00 0.00 1.00AADp 5.8% AADc 0.06
S. Maghsoodloo Babakhani et al. / Fluid Phase Equilibria 472 (2018) 22e3828
pressure, they recharged reactor by the gas mixtures. Then, theyincreased the temperature by the rate of 1e2 K per hour. The pres-sure increased due to hydrate dissociation. Then, the dissociatedgases were vented. When only a small amount of hydrate crystalsremained in the cell and the pressure was constant, this wasconsidered as the three phase equilibrium [70]. Both their experi-mental and our simulation results for nitrogen-carbon dioxidemixture are listed and presented inTable 10 and Fig. 7. Moreover, theresults ofmethane-carbon dioxidemixture are presented inTable 11.
As it is clear in Table 10, Table 11 and Fig. 7, the thermodynamicmodel predicts the equilibrium pressure with adequate deviations(average deviations for methane-carbon dioxide and nitrogen-carbon dioxide hydrate pressure were 3.3 and 5.7%, respectively).
As seen in Table 10, at low concentrations of nitrogen, the hy-drate phase compositions were acceptably simulated (sI). Never-theless, when nitrogen was the dominate component in hydratephase, the simulation results deviated from the experimental data.Hence, the hydrate phase compositions were again simulated bytaking into account both structures, sI and sII. Prediction results fortwo isotherms of N2/CO2 binary hydrate are presented in Fig. 8. Thisfigure shows that, at higher pressures, the hydrate preferentiallyencapsulates nitrogen from the N2/CO2 mixture. Consequently, thenitrogen composition in hydrate phase increases. As clear on thefigure, at high concentrations of nitrogen in hydrate phase, sIIsimulation results are in better agreement with experimental datacompared to sI results. This can be explained by the fact that purenitrogen forms sII hydrates. Thus, when nitrogen is the majorcomponent in the mixture, there might be a structural transitionfrom sI to sII.
For the methane-carbon dioxide mixture, although the equi-librium pressure were satisfactorily simulated (average absolute
deviation 3.3%), the thermodynamic model failed to evaluate thehydrate composition (average absolute deviation 0.29 molefraction).
4.4. Using a tracer
Using a tracer in gas or liquid phase could help to measure hy-drate composition. A tracer must not be able to form hydrates andonly a small amount should be utilized. This section presents ashort report of publications which have used a tracer in theirexperiment to measure hydrate composition. Of course, based onthe experimental results of these papers, the capability of thethermodynamic model to simulate hydrate composition isevaluated.
Ng determined the hydrate composition for six gas mixtureincluding methane, ethane, propane, iso-butane, n-butane andcarbon dioxide. He used n-pentane as a tracer in gas phase. Thanksto a gasometer and composition of n-pentane at the end of ex-periments, he successfully determined the amount of original gasmixture and overall gas dissociation [71]. Table 12 shows thedifferent gas mixtures in the study. Ng's experimental data and oursimulation results are presented in Table 13.
Obviously, in Table 13, there is a wide range of average absolutedeviation according to the number and type of components in thefeed gas, between 0.006 and 0.07. This variation could be explainedby the fact that for the ternary or quaternary mixtures, kineticconsiderations might affect experimental results. Note: the largestdeviation belongs to ethane in all the mixtures.
In the 21st century, researchers at Ecole National Superieur desMines de Saint-Etienne (Mines Saint-Etienne) developed a newmethod to determine the hydrate composition not only at

Table 8Experimental results of Belandria et al. [68] for methane-carbon dioxide hydrates and simulation results.
T (K) (±0.02) Pexp (MPa) (±0.002) Ppre (MPa) S Gas composition(exp)
Hydratecomposition (exp)(±1%)
Hydratecomposition (pre)
CO2 CH4 CO2 CH4 CO2 CH4
273.6 2.44 2.55 I 0.08 0.92 0.10 0.90 0.16 0.84273.6 1.84 2.03 I 0.35 0.66 0.55 0.45 0.52 0.48273.6 1.94 2.12 I 0.29 0.71 0.39 0.61 0.46 0.54273.6 2.05 2.24 I 0.22 0.78 0.29 0.71 0.37 0.63273.6 1.51 1.67 I 0.63 0.37 0.88 0.12 0.77 0.23273.6 1.61 1.77 I 0.55 0.46 0.80 0.20 0.71 0.29275.2 2.58 2.77 I 0.17 0.83 0.34 0.66 0.29 0.71275.2 2.77 2.98 I 0.09 0.91 0.18 0.82 0.16 0.84275.2 2.12 2.33 I 0.38 0.62 0.65 0.35 0.56 0.44275.2 2.22 2.48 I 0.30 0.70 0.59 0.41 0.47 0.53275.2 2.40 2.63 I 0.23 0.77 0.37 0.63 0.38 0.62275.2 1.79 1.96 I 0.66 0.34 0.83 0.17 0.79 0.21275.2 1.87 2.07 I 0.57 0.44 0.75 0.25 0.72 0.28276.1 2.81 3.00 I 0.18 0.82 0.26 0.74 0.31 0.69276.1 3.03 3.12 I 0.13 0.87 0.24 0.76 0.24 0.76276.1 3.03 3.23 I 0.10 0.90 0.24 0.76 0.18 0.82276.1 2.32 2.43 I 0.41 0.60 0.64 0.36 0.57 0.43276.1 2.50 2.70 I 0.32 0.69 0.40 0.60 0.48 0.52276.1 2.69 2.88 I 0.23 0.77 0.31 0.69 0.38 0.62276.1 1.99 2.14 I 0.67 0.33 0.88 0.12 0.80 0.20276.1 2.17 2.26 I 0.58 0.42 0.78 0.22 0.73 0.27278.1 3.42 3.64 I 0.20 0.80 0.23 0.77 0.33 0.67278.1 3.63 3.83 I 0.14 0.86 0.23 0.78 0.24 0.76278.1 3.80 3.95 I 0.10 0.90 0.15 0.85 0.19 0.81278.1 3.04 3.33 I 0.32 0.68 0.46 0.54 0.48 0.52278.1 3.32 3.55 I 0.23 0.77 0.27 0.73 0.37 0.63278.1 2.58 2.77 I 0.61 0.39 0.79 0.21 0.74 0.26279.2 3.57 4.09 I 0.20 0.80 0.27 0.73 0.33 0.67280.2 4.49 4.76 I 0.15 0.85 0.31 0.69 0.25 0.75280.2 4.66 4.90 I 0.11 0.89 0.25 0.76 0.19 0.81280.2 3.54 4.14 I 0.34 0.66 0.73 0.27 0.49 0.51280.2 4.11 4.46 I 0.24 0.77 0.34 0.66 0.37 0.63280.2 3.14 3.53 I 0.62 0.38 0.86 0.14 0.74 0.26280.2 3.48 3.75 I 0.49 0.51 0.79 0.21 0.64 0.36282.2 5.77 6.08 I 0.11 0.89 0.28 0.72 0.19 0.81284.2 7.19 7.65 I 0.12 0.89 0.11 0.89 0.18 0.82AADp 7.8% AADc 0.07
Fig. 5. Hydrate composition for methane-carbon dioxide hydrates. Experimental data[68] and simulation results (sI).
S. Maghsoodloo Babakhani et al. / Fluid Phase Equilibria 472 (2018) 22e38 29
equilibrium condition, but also during the crystallization undernon-equilibrium conditions. Their new procedure was based ontracing the concentration of lithium salt in liquid phase and ma-terial balance. The protocol is as follows: after gas injection insidethe reactor, water solution with 10 ppm concentration of lithium
salt was inserted in the reactor. By decreasing the temperature at adesire value, hydrate formation started. After several days, thesystem reached at equilibrium. At this point a gas and liquid samplewas taken. The gas sample was analyzed by gas chromatography todetermine the gas composition in vapor phase. The liquid samplewas analyzed by ion chromatograph to measure the concentrationof lithium salt in liquid phase. As lithium does not participate inhydrate formation, it is possible to calculate the amount of water atequilibrium according to the lithium concentration. Then, the sys-tem temperature increased stepwise and gas and liquid sampleswere taken [14,57]. A diagram of their experiments is shown inFig. 9.
Based on this procedure, Herri et al. [14] studied the equilibriumconditions of carbon dioxide-nitrogen and carbon dioxide-methanehydrates. Table 14 and Table 15 present their experimental resultsand our corresponding simulation results for carbon dioxide-nitrogen and carbon dioxide-methane mixtures, respectively.
In the case of carbon dioxide-nitrogen, the simulation results forhydrate equilibrium pressure are not very reliable. Nonetheless, theaverage absolute deviation for prediction of hydrate composition issmall (0.05). For carbon dioxide-methane mixture, the simulationresults are in respectable agreement with the experimental results.As it can be seen in Table 15, the average deviation of equilibriumpressure was about 2%. The thermodynamic model better predictsthe hydrate composition. The average deviation for carbon dioxideand methane compositions in hydrate phase was 0.004. Fig. 10

Table 9Experimental results of Belandria et al. [69] for nitrogen-carbon dioxide mixture hydrates and simulation results.
T (K) (±0.02) Pexp (MPa) (±0.002) Ppre (MPa) S Gas composition(exp)
Hydratecomposition (exp)(±1%)
Hydratecomposition (pre)
CO2 N2 CO2 N2 CO2 N2
273.6 2.03 2.22 I 0.62 0.38 0.97 0.03 0.95 0.05273.6 8.15 7.22 I 0.17 0.83 0.66 0.34 0.66 0.34273.6 11.94 6.94 I 0.18 0.82 0.37 0.63 0.67 0.33273.6 2.96 3.17 I 0.43 0.57 0.90 0.10 0.89 0.11274.6 2.54 2.10 I 0.73 0.27 0.74 0.26 0.97 0.03274.9 5.20 2.21 I 0.72 0.28 0.79 0.21 0.96 0.04275.2 2.29 2.51 I 0.66 0.34 0.90 0.10 0.95 0.05275.2 2.64 2.25 I 0.73 0.27 0.89 0.11 0.97 0.03275.2 3.26 3.69 I 0.45 0.55 0.88 0.12 0.89 0.11275.2 7.45 8.83 I 0.17 0.83 0.82 0.18 0.64 0.36275.2 8.25 8.74 I 0.18 0.82 0.80 0.20 0.65 0.35275.2 12.75 9.32 I 0.16 0.84 0.38 0.62 0.62 0.38275.6 2.71 2.36 I 0.73 0.27 0.76 0.24 0.97 0.03275.8 5.38 2.45 I 0.72 0.28 0.80 0.20 0.96 0.04276.1 2.50 2.69 I 0.68 0.32 0.98 0.02 0.96 0.04276.1 2.87 2.50 I 0.73 0.27 0.79 0.21 0.97 0.03276.1 3.70 3.80 I 0.49 0.51 0.70 0.30 0.90 0.10276.1 4.40 4.70 I 0.40 0.60 0.69 0.31 0.86 0.14276.1 8.58 9.07 I 0.20 0.80 0.57 0.43 0.67 0.33276.7 3.70 4.11 I 0.49 0.51 0.70 0.30 0.90 0.10277.1 2.71 2.94 I 0.71 0.30 0.84 0.16 0.96 0.04277.3 3.13 2.89 I 0.73 0.27 0.83 0.17 0.96 0.04277.8 6.16 3.01 I 0.75 0.25 0.86 0.14 0.97 0.03278.1 2.97 3.21 I 0.73 0.27 0.89 0.11 0.96 0.04278.1 3.41 3.19 I 0.73 0.27 0.75 0.25 0.96 0.04278.1 4.19 4.63 I 0.52 0.48 0.66 0.35 0.91 0.09278.1 9.15 10.69 I 0.23 0.77 0.54 0.46 0.69 0.31278.1 14.26 16.69 I 0.13 0.87 0.51 0.49 0.49 0.51279.7 4.82 5.42 I 0.56 0.44 0.70 0.30 0.91 0.09279.7 10.02 12.26 I 0.26 0.74 0.61 0.39 0.71 0.29279.7 15.82 19.25 I 0.15 0.85 0.55 0.45 0.50 0.50281.2 17.63 21.78 I 0.18 0.82 0.58 0.42 0.53 0.47281.7 6.33 5.22 I 0.75 0.25 0.81 0.19 0.96 0.04AADp 17.4% AADc 0.13
Fig. 6. Hydrate composition for nitrogen-carbon dioxide hydrates at two isotherms.Experimental data [69] and simulation results (sI).
S. Maghsoodloo Babakhani et al. / Fluid Phase Equilibria 472 (2018) 22e3830
presents clearly the excellent match between the experimental andsimulation results for carbon dioxide-methane hydrate mixture.
Le Quang et al. studied the equilibrium conditions of several gasmixtures from N2-CO2-CH4-C2H6-C3H8-nC4H10. They also deter-mined the guest composition in vapor and hydrate phases [57].They used the same method as Herri et al. [14] to analyze guestcomposition in different phases. In addition, they studied the in-fluence of crystallization rate on the final equilibrium pressure andcomposition during the crystallization of CO2-CH4-C2H6 mixed
hydrate. All the experimental data and our equivalent simulationresults are listed in Table 16, Table 17 and Table 18. They reportedthat, for the equilibrium points near total dissociation, hydratecomposition was suspected to have large errors. Thus, they werenot used for our purposes. As Table 16 shows, the thermodynamicmodel realistically predicts the equilibrium pressures of binarymixtures including carbon dioxide. The average deviation of theequilibrium pressure predictions for CO2-CH4 and CO2-N2 are about2 and 3%, respectively. For hydrate composition extrapolation, theaverage absolute deviations are 0.05 and 0.04 for CO2-CH4 and CO2-N2, respectively (see Fig. 11).
As aforementioned, Le Quang et al. investigated the effect ofcrystallization rate on hydrate equilibrium pressure and composi-tion of CO2-CH4-C2H6 ternary mixture. They reported that the hy-drate equilibrium pressure and composition at final state differedaccording to the rate of crystallization. They concluded that at quickcrystallization rate, mixed gas hydrate could not be at thermody-namic equilibrium [57]. Table 17 reveals that the results of ther-modynamic model is closer to the slow crystallization data. Theaverage deviations of equilibrium pressure prediction for slow andquick crystallization are about 2 and 8%, respectively. The averagedeviations for carbon dioxide in hydrate phase for slow and quickcrystallization are similar (0.01). This is not the case for methaneand ethane compositions in hydrate phase, where the deviation ofsimulation for slow crystallization are much better compared toquick rate (e.g. ethane, 0.009 for slow compared to 0.05 for quick).
As seen in Table 18, the average deviation of the equilibriumpressures calculated for the quaternary mixture of methane-

Table 10Experimental results of carbon dioxide-nitrogen hydrate equilibrium pressure and composition from Seo et al. [70] and our simulation results. Composition uncertainties werenot provided.
T (K) (±0.1) Pexp (MPa) (±0.01) Ppre (MPa) S Gas composition(exp)
Hydratecomposition (exp)
Hydratecomposition (pre)
CO2 N2 CO2 N2 CO2 N2
274 1.39 1.42 I 1.00 0.00 1.00 0.00 1.00 0.00274 1.77 1.74 I 0.82 0.18 0.99 0.02 0.98 0.02274 2.35 2.39 I 0.60 0.40 0.95 0.05 0.94 0.06274 2.84 2.84 I 0.50 0.50 0.93 0.07 0.92 0.08274 3.46 3.57 I 0.40 0.60 0.90 0.10 0.87 0.13274 7.24 6.55 I 0.21 0.79 0.58 0.42 0.71 0.29274 11.20 10.03 I 0.12 0.88 0.34 0.66 0.53 0.47274 14.93 14.91 I 0.05 0.95 0.18 0.82 0.28 0.72274 17.93 20.81 I 0.00 1.00 0.00 1.00 0.00 1.00277 1.95 1.99 I 1.00 0.00 1.00 0.00 1.00 0.00277 2.60 2.38 I 0.85 0.15 0.98 0.02 0.98 0.02277 3.38 3.52 I 0.59 0.41 0.95 0.05 0.93 0.07277 5.23 5.40 I 0.39 0.61 0.89 0.11 0.85 0.15277 11.98 11.30 I 0.18 0.82 0.54 0.46 0.62 0.38277 15.50 15.07 I 0.12 0.88 0.35 0.65 0.48 0.52277 19.17 19.56 I 0.07 0.93 0.19 0.81 0.31 0.69277 24.04 28.37 I 0.00 1.00 0.00 1.00 0.00 1.00280 2.80 2.86 I 1.00 0.00 1.00 0.00 1.00 0.00280 3.60 3.59 I 0.83 0.18 0.98 0.02 0.98 0.02280 4.23 4.35 I 0.70 0.30 0.96 0.04 0.95 0.05280 5.07 5.29 I 0.59 0.41 0.94 0.06 0.92 0.08280 8.28 8.50 I 0.39 0.61 0.86 0.14 0.83 0.17280 14.97 13.50 I 0.25 0.75 0.64 0.36 0.68 0.32280 20.75 18.39 I 0.17 0.83 0.45 0.55 0.55 0.45280 26.69 25.74 I 0.09 0.91 0.22 0.78 0.35 0.65280 32.31 38.81 I 0.00 1.00 0.00 1.00 0.00 1.00AADp 5.7% AADc 0.04
Fig. 7. Pressure-gas composition diagram for nitrogen-carbon dioxide at three iso-therms (sI). Experimental data from Seo et al. [70] and our prediction results.
S. Maghsoodloo Babakhani et al. / Fluid Phase Equilibria 472 (2018) 22e38 31
ethane-propane-butane is about 13% which is expected due tomore significant kinetic effects in quaternary mixtures.
Hydrate composition for the methane and butane is wellsimulated (AADc¼ 0.01), while for ethane and propane, the averagedeviation of hydrate composition are 0.06 and 0.07, respectively.
4.5. Microscopic measurements tools
In the previous sections, various indirect methods of deter-mining hydrate composition have been reviewed. All approacheswere based onmeasuring fluid and system properties like pressure,temperature, gas phase composition etc. and then calculating the
hydrate composition according to the material balance and hydrateproperties. Recently, innovative microscopic instruments helpedresearchers to measure directly the properties and molecular as-pects of clathrate hydrates such as hydrate structure, cage occu-pancy, hydrate composition and guest molecule position.
4.5.1. Experimental data and simulation resultsOne of the first studies using Raman spectroscopy was per-
formed by Sum et al. [72] to explore the properties of clathratehydrates for pure guest molecules such as CH4, CO2, C3H8 and bi-nary mixtures CH4-CO2, CD4-C3H8, CH4-N2, CH4-THFd8 and CH4-C7D14. As to hydrate composition, they only reported the guestcomposition in hydrate phase for CH4-CO2 binary mixture. Theirprocedure included several steps; preparation of hydrate sample incell and setting the cell into the sample chamber of the Raman.Then, the pressure was adjusted to a value which was within 5% ofthe predicted pressure at a desired temperature. They predictedhydrate equilibrium pressure by CSMHYD [60,72]. Spectra werethen collected at the equilibrium conditions for hydrate composi-tion analyses. Table 19 presents their experimental data andreciprocal simulation results by the thermodynamic model.
Table 19 illustrates that the thermodynamic model satisfactorilysimulated the hydrate composition. The average absolute deviationfor hydrate composition was 0.02.
Subramanian et al. studied the structural transition of methane-ethane hydratemixture based on Raman spectroscopy and 13C NMRmeasurements [73,74]. According to the Raman spectra, they re-ported that for methane-ethane hydrate mixture at 274.2 K, therewas a structural transition from structure I to II, when the methanecomposition in gas phase was between 72.2 and 75% mole fraction.Moreover, they observed that the structure changed from sII to sI,once the methane composition in vapor phase was between 99.2and 99.4 mole fraction. Furthermore, Raman spectra showedthat structural transition leads to a 20% variation in hydrate
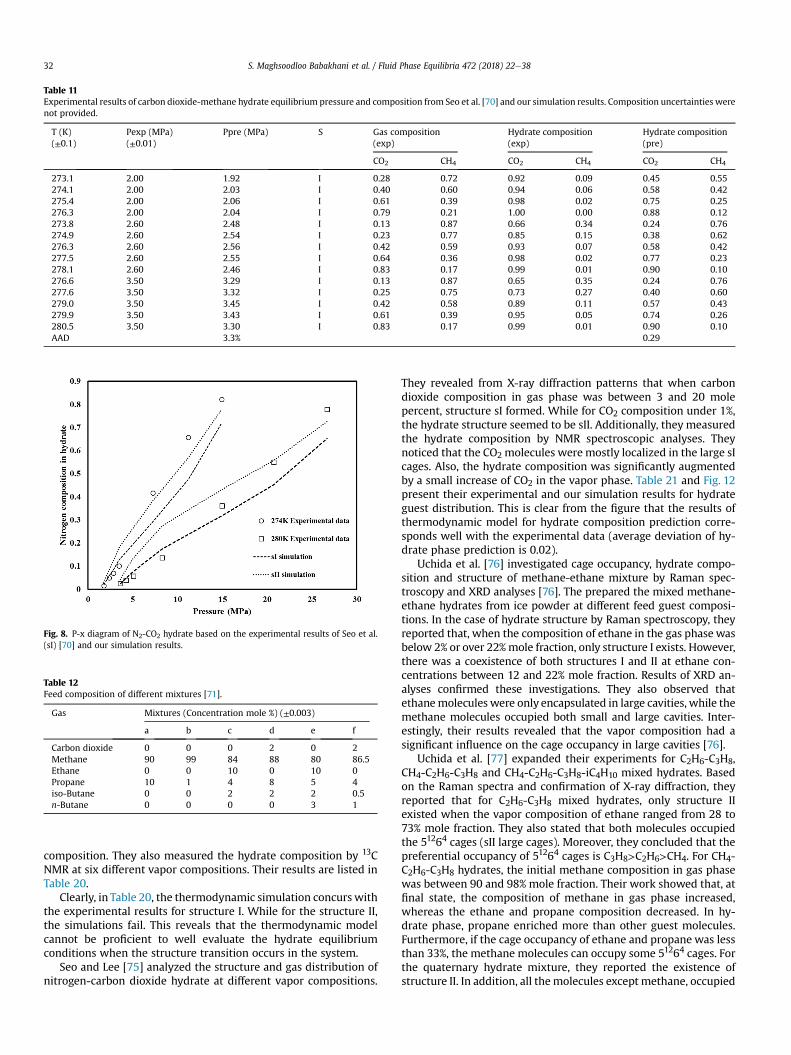
Table 11Experimental results of carbon dioxide-methane hydrate equilibrium pressure and composition from Seo et al. [70] and our simulation results. Composition uncertainties werenot provided.
T (K)(±0.1)
Pexp (MPa)(±0.01)
Ppre (MPa) S Gas composition(exp)
Hydrate composition(exp)
Hydrate composition(pre)
CO2 CH4 CO2 CH4 CO2 CH4
273.1 2.00 1.92 I 0.28 0.72 0.92 0.09 0.45 0.55274.1 2.00 2.03 I 0.40 0.60 0.94 0.06 0.58 0.42275.4 2.00 2.06 I 0.61 0.39 0.98 0.02 0.75 0.25276.3 2.00 2.04 I 0.79 0.21 1.00 0.00 0.88 0.12273.8 2.60 2.48 I 0.13 0.87 0.66 0.34 0.24 0.76274.9 2.60 2.54 I 0.23 0.77 0.85 0.15 0.38 0.62276.3 2.60 2.56 I 0.42 0.59 0.93 0.07 0.58 0.42277.5 2.60 2.55 I 0.64 0.36 0.98 0.02 0.77 0.23278.1 2.60 2.46 I 0.83 0.17 0.99 0.01 0.90 0.10276.6 3.50 3.29 I 0.13 0.87 0.65 0.35 0.24 0.76277.6 3.50 3.32 I 0.25 0.75 0.73 0.27 0.40 0.60279.0 3.50 3.45 I 0.42 0.58 0.89 0.11 0.57 0.43279.9 3.50 3.43 I 0.61 0.39 0.95 0.05 0.74 0.26280.5 3.50 3.30 I 0.83 0.17 0.99 0.01 0.90 0.10AAD 3.3% 0.29
Fig. 8. P-x diagram of N2-CO2 hydrate based on the experimental results of Seo et al.(sI) [70] and our simulation results.
Table 12Feed composition of different mixtures [71].
Gas Mixtures (Concentration mole %) (±0.003)
a b c d e f
Carbon dioxide 0 0 0 2 0 2Methane 90 99 84 88 80 86.5Ethane 0 0 10 0 10 0Propane 10 1 4 8 5 4iso-Butane 0 0 2 2 2 0.5n-Butane 0 0 0 0 3 1
S. Maghsoodloo Babakhani et al. / Fluid Phase Equilibria 472 (2018) 22e3832
composition. They also measured the hydrate composition by 13CNMR at six different vapor compositions. Their results are listed inTable 20.
Clearly, in Table 20, the thermodynamic simulation concurs withthe experimental results for structure I. While for the structure II,the simulations fail. This reveals that the thermodynamic modelcannot be proficient to well evaluate the hydrate equilibriumconditions when the structure transition occurs in the system.
Seo and Lee [75] analyzed the structure and gas distribution ofnitrogen-carbon dioxide hydrate at different vapor compositions.
They revealed from X-ray diffraction patterns that when carbondioxide composition in gas phase was between 3 and 20 molepercent, structure sI formed. While for CO2 composition under 1%,the hydrate structure seemed to be sII. Additionally, they measuredthe hydrate composition by NMR spectroscopic analyses. Theynoticed that the CO2 molecules were mostly localized in the large sIcages. Also, the hydrate composition was significantly augmentedby a small increase of CO2 in the vapor phase. Table 21 and Fig. 12present their experimental and our simulation results for hydrateguest distribution. This is clear from the figure that the results ofthermodynamic model for hydrate composition prediction corre-sponds well with the experimental data (average deviation of hy-drate phase prediction is 0.02).
Uchida et al. [76] investigated cage occupancy, hydrate compo-sition and structure of methane-ethane mixture by Raman spec-troscopy and XRD analyses [76]. The prepared the mixed methane-ethane hydrates from ice powder at different feed guest composi-tions. In the case of hydrate structure by Raman spectroscopy, theyreported that, when the composition of ethane in the gas phase wasbelow 2% or over 22%mole fraction, only structure I exists. However,there was a coexistence of both structures I and II at ethane con-centrations between 12 and 22% mole fraction. Results of XRD an-alyses confirmed these investigations. They also observed thatethanemolecules were only encapsulated in large cavities, while themethane molecules occupied both small and large cavities. Inter-estingly, their results revealed that the vapor composition had asignificant influence on the cage occupancy in large cavities [76].
Uchida et al. [77] expanded their experiments for C2H6-C3H8,CH4-C2H6-C3H8 and CH4-C2H6-C3H8-iC4H10 mixed hydrates. Basedon the Raman spectra and confirmation of X-ray diffraction, theyreported that for C2H6-C3H8 mixed hydrates, only structure IIexisted when the vapor composition of ethane ranged from 28 to73% mole fraction. They also stated that both molecules occupiedthe 51264 cages (sII large cages). Moreover, they concluded that thepreferential occupancy of 51264 cages is C3H8>C2H6>CH4. For CH4-C2H6-C3H8 hydrates, the initial methane composition in gas phasewas between 90 and 98% mole fraction. Their work showed that, atfinal state, the composition of methane in gas phase increased,whereas the ethane and propane composition decreased. In hy-drate phase, propane enriched more than other guest molecules.Furthermore, if the cage occupancy of ethane and propane was lessthan 33%, the methane molecules can occupy some 51264 cages. Forthe quaternary hydrate mixture, they reported the existence ofstructure II. In addition, all themolecules except methane, occupied
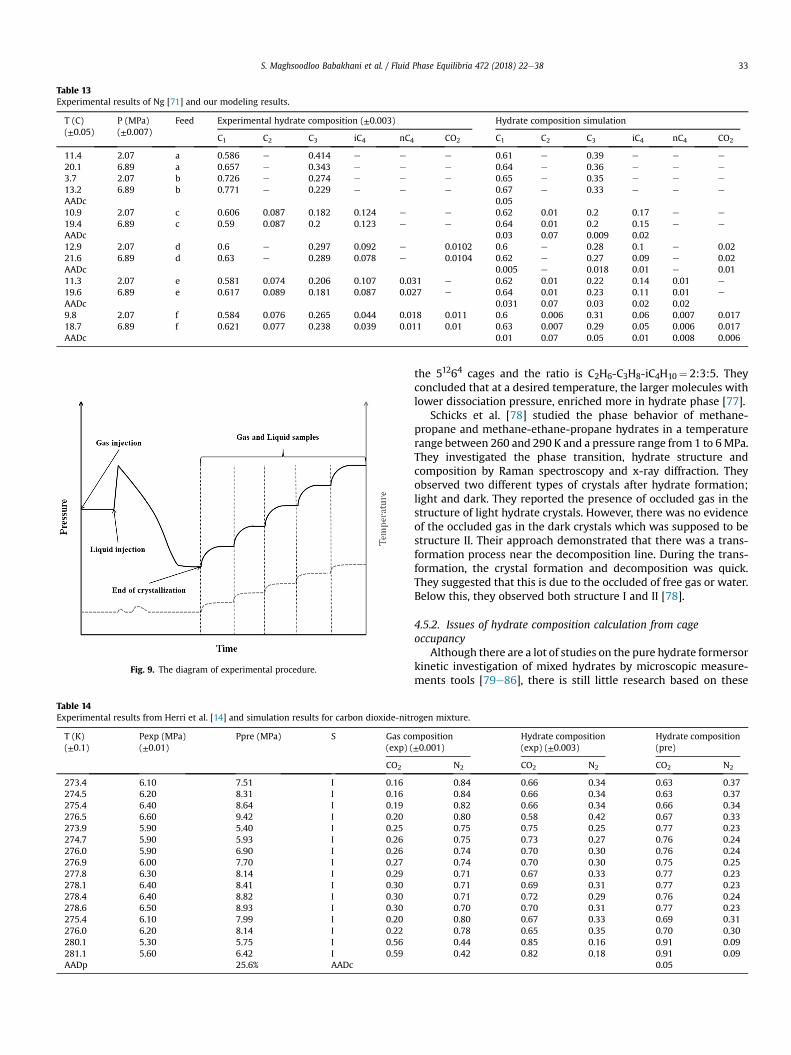
Table 13Experimental results of Ng [71] and our modeling results.
T (C)(±0.05)
P (MPa)(±0.007)
Feed Experimental hydrate composition (±0.003) Hydrate composition simulation
C1 C2 C3 iC4 nC4 CO2 C1 C2 C3 iC4 nC4 CO2
11.4 2.07 a 0.586 e 0.414 e e e 0.61 e 0.39 e e e
20.1 6.89 a 0.657 e 0.343 e e e 0.64 e 0.36 e e e
3.7 2.07 b 0.726 e 0.274 e e e 0.65 e 0.35 e e e
13.2 6.89 b 0.771 e 0.229 e e e 0.67 e 0.33 e e e
AADc 0.0510.9 2.07 c 0.606 0.087 0.182 0.124 e e 0.62 0.01 0.2 0.17 e e
19.4 6.89 c 0.59 0.087 0.2 0.123 e e 0.64 0.01 0.2 0.15 e e
AADc 0.03 0.07 0.009 0.0212.9 2.07 d 0.6 e 0.297 0.092 e 0.0102 0.6 e 0.28 0.1 e 0.0221.6 6.89 d 0.63 e 0.289 0.078 e 0.0104 0.62 e 0.27 0.09 e 0.02AADc 0.005 e 0.018 0.01 e 0.0111.3 2.07 e 0.581 0.074 0.206 0.107 0.031 e 0.62 0.01 0.22 0.14 0.01 e
19.6 6.89 e 0.617 0.089 0.181 0.087 0.027 e 0.64 0.01 0.23 0.11 0.01 e
AADc 0.031 0.07 0.03 0.02 0.029.8 2.07 f 0.584 0.076 0.265 0.044 0.018 0.011 0.6 0.006 0.31 0.06 0.007 0.01718.7 6.89 f 0.621 0.077 0.238 0.039 0.011 0.01 0.63 0.007 0.29 0.05 0.006 0.017AADc 0.01 0.07 0.05 0.01 0.008 0.006
Fig. 9. The diagram of experimental procedure.
Table 14Experimental results from Herri et al. [14] and simulation results for carbon dioxide-nitr
T (K)(±0.1)
Pexp (MPa)(±0.01)
Ppre (MPa) S Gas co(exp) (
CO2
273.4 6.10 7.51 I 0.16274.5 6.20 8.31 I 0.16275.4 6.40 8.64 I 0.19276.5 6.60 9.42 I 0.20273.9 5.90 5.40 I 0.25274.7 5.90 5.93 I 0.26276.0 5.90 6.90 I 0.26276.9 6.00 7.70 I 0.27277.8 6.30 8.14 I 0.29278.1 6.40 8.41 I 0.30278.4 6.40 8.82 I 0.30278.6 6.50 8.93 I 0.30275.4 6.10 7.99 I 0.20276.0 6.20 8.14 I 0.22280.1 5.30 5.75 I 0.56281.1 5.60 6.42 I 0.59AADp 25.6% AADc
S. Maghsoodloo Babakhani et al. / Fluid Phase Equilibria 472 (2018) 22e38 33
the 51264 cages and the ratio is C2H6-C3H8-iC4H10¼ 2:3:5. Theyconcluded that at a desired temperature, the larger molecules withlower dissociation pressure, enriched more in hydrate phase [77].
Schicks et al. [78] studied the phase behavior of methane-propane and methane-ethane-propane hydrates in a temperaturerange between 260 and 290 K and a pressure range from 1 to 6MPa.They investigated the phase transition, hydrate structure andcomposition by Raman spectroscopy and x-ray diffraction. Theyobserved two different types of crystals after hydrate formation;light and dark. They reported the presence of occluded gas in thestructure of light hydrate crystals. However, there was no evidenceof the occluded gas in the dark crystals which was supposed to bestructure II. Their approach demonstrated that there was a trans-formation process near the decomposition line. During the trans-formation, the crystal formation and decomposition was quick.They suggested that this is due to the occluded of free gas or water.Below this, they observed both structure I and II [78].
4.5.2. Issues of hydrate composition calculation from cageoccupancy
Although there are a lot of studies on the pure hydrate formersorkinetic investigation of mixed hydrates by microscopic measure-ments tools [79e86], there is still little research based on these
ogen mixture.
mposition±0.001)
Hydrate composition(exp) (±0.003)
Hydrate composition(pre)
N2 CO2 N2 CO2 N2
0.84 0.66 0.34 0.63 0.370.84 0.66 0.34 0.63 0.370.82 0.66 0.34 0.66 0.340.80 0.58 0.42 0.67 0.330.75 0.75 0.25 0.77 0.230.75 0.73 0.27 0.76 0.240.74 0.70 0.30 0.76 0.240.74 0.70 0.30 0.75 0.250.71 0.67 0.33 0.77 0.230.71 0.69 0.31 0.77 0.230.71 0.72 0.29 0.76 0.240.70 0.70 0.31 0.77 0.230.80 0.67 0.33 0.69 0.310.78 0.65 0.35 0.70 0.300.44 0.85 0.16 0.91 0.090.42 0.82 0.18 0.91 0.09
0.05
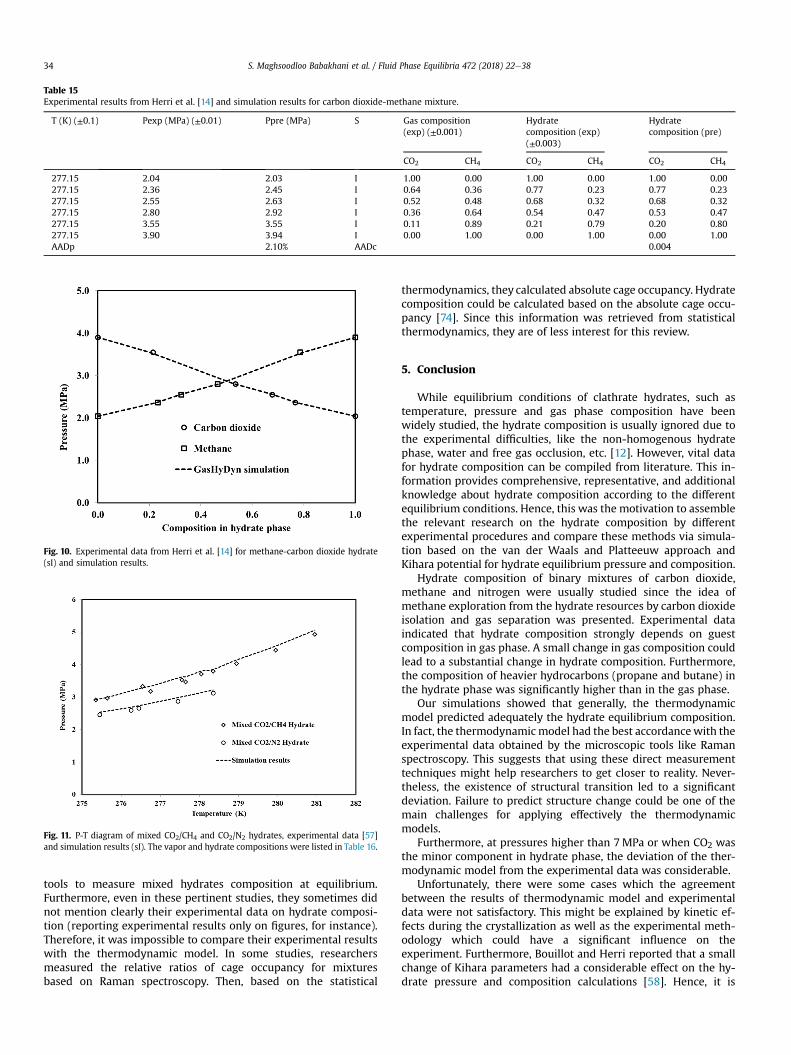
Table 15Experimental results from Herri et al. [14] and simulation results for carbon dioxide-methane mixture.
T (K) (±0.1) Pexp (MPa) (±0.01) Ppre (MPa) S Gas composition(exp) (±0.001)
Hydratecomposition (exp)(±0.003)
Hydratecomposition (pre)
CO2 CH4 CO2 CH4 CO2 CH4
277.15 2.04 2.03 I 1.00 0.00 1.00 0.00 1.00 0.00277.15 2.36 2.45 I 0.64 0.36 0.77 0.23 0.77 0.23277.15 2.55 2.63 I 0.52 0.48 0.68 0.32 0.68 0.32277.15 2.80 2.92 I 0.36 0.64 0.54 0.47 0.53 0.47277.15 3.55 3.55 I 0.11 0.89 0.21 0.79 0.20 0.80277.15 3.90 3.94 I 0.00 1.00 0.00 1.00 0.00 1.00AADp 2.10% AADc 0.004
Fig. 10. Experimental data from Herri et al. [14] for methane-carbon dioxide hydrate(sI) and simulation results.
Fig. 11. P-T diagram of mixed CO2/CH4 and CO2/N2 hydrates, experimental data [57]and simulation results (sI). The vapor and hydrate compositions were listed in Table 16.
S. Maghsoodloo Babakhani et al. / Fluid Phase Equilibria 472 (2018) 22e3834
tools to measure mixed hydrates composition at equilibrium.Furthermore, even in these pertinent studies, they sometimes didnot mention clearly their experimental data on hydrate composi-tion (reporting experimental results only on figures, for instance).Therefore, it was impossible to compare their experimental resultswith the thermodynamic model. In some studies, researchersmeasured the relative ratios of cage occupancy for mixturesbased on Raman spectroscopy. Then, based on the statistical
thermodynamics, they calculated absolute cage occupancy. Hydratecomposition could be calculated based on the absolute cage occu-pancy [74]. Since this information was retrieved from statisticalthermodynamics, they are of less interest for this review.
5. Conclusion
While equilibrium conditions of clathrate hydrates, such astemperature, pressure and gas phase composition have beenwidely studied, the hydrate composition is usually ignored due tothe experimental difficulties, like the non-homogenous hydratephase, water and free gas occlusion, etc. [12]. However, vital datafor hydrate composition can be compiled from literature. This in-formation provides comprehensive, representative, and additionalknowledge about hydrate composition according to the differentequilibrium conditions. Hence, this was the motivation to assemblethe relevant research on the hydrate composition by differentexperimental procedures and compare these methods via simula-tion based on the van der Waals and Platteeuw approach andKihara potential for hydrate equilibrium pressure and composition.
Hydrate composition of binary mixtures of carbon dioxide,methane and nitrogen were usually studied since the idea ofmethane exploration from the hydrate resources by carbon dioxideisolation and gas separation was presented. Experimental dataindicated that hydrate composition strongly depends on guestcomposition in gas phase. A small change in gas composition couldlead to a substantial change in hydrate composition. Furthermore,the composition of heavier hydrocarbons (propane and butane) inthe hydrate phase was significantly higher than in the gas phase.
Our simulations showed that generally, the thermodynamicmodel predicted adequately the hydrate equilibrium composition.In fact, the thermodynamicmodel had the best accordancewith theexperimental data obtained by the microscopic tools like Ramanspectroscopy. This suggests that using these direct measurementtechniques might help researchers to get closer to reality. Never-theless, the existence of structural transition led to a significantdeviation. Failure to predict structure change could be one of themain challenges for applying effectively the thermodynamicmodels.
Furthermore, at pressures higher than 7MPa or when CO2 wasthe minor component in hydrate phase, the deviation of the ther-modynamic model from the experimental data was considerable.
Unfortunately, there were some cases which the agreementbetween the results of thermodynamic model and experimentaldata were not satisfactory. This might be explained by kinetic ef-fects during the crystallization as well as the experimental meth-odology which could have a significant influence on theexperiment. Furthermore, Bouillot and Herri reported that a smallchange of Kihara parameters had a considerable effect on the hy-drate pressure and composition calculations [58]. Hence, it is

Table 16Carbon dioxide-methane and carbon dioxide-nitrogen hydrate mixtures, experimental data [57] and simulation results.
Gas Texp (�C) (±0.1) Pexp (MPa) (±0.01) Ppre (MPa) S Gas composition (exp)(±0.001)
Hydrate composition(exp) (±0.003)
Hydrate composition(Pre)
N2 CO2 CH4 N2 CO2 CH4 N2 CO2 CH4
CO2-CH4 3.4 3.33 3.29 I e 0.13 0.87 e 0.32 0.68 e 0.23 0.774.4 3.53 3.62 I e 0.13 0.87 e 0.32 0.68 e 0.24 0.764.9 3.71 3.80 I e 0.14 0.86 e 0.32 0.68 e 0.24 0.765.8 4.03 4.14 I e 0.15 0.85 e 0.32 0.68 e 0.26 0.746.8 4.45 4.57 I e 0.16 0.84 e 0.32 0.68 e 0.27 0.737.8 4.93 5.06 I e 0.18 0.83 e 0.30 0.70 e 0.28 0.722.2 2.91 2.93 I e 0.12 0.88 e 0.29 0.71 e 0.22 0.782.5 2.97 3.00 I e 0.13 0.87 e 0.28 0.72 e 0.23 0.773.6 3.18 3.33 I e 0.14 0.87 e 0.28 0.72 e 0.24 0.764.5 3.47 3.63 I e 0.15 0.85 e 0.27 0.73 e 0.25 0.755.2 3.80 3.85 I e 0.16 0.84 e 0.23 0.77 e 0.27 0.73AADp 2.4% AADc 0.05
CO2-N2 2.3 2.46 2.53 I 0.33 0.67 e 0.06 0.94 e 0.05 0.95 e
3.1 2.60 2.69 I 0.31 0.69 e 0.07 0.93 e 0.04 0.96 e
3.3 2.66 2.73 I 0.30 0.70 e 0.07 0.93 e 0.04 0.96 e
4.3 2.87 2.99 I 0.28 0.72 e 0.09 0.91 e 0.04 0.96 e
5.2 3.13 3.22 I 0.25 0.75 e 0.12 0.88 e 0.03 0.97 e
AADp 3.16% AADc 0.04
Table 17Experimental results of Carbon dioxide-methane-ethane hydrate from Le Quang et al. [57] and simulation results.
Gas Texp (�C) (±0.1) Pexp (MPa) (±0.01) Ppre (MPa) S Gas composition(exp) (±0.001)
Hydrate composition(exp) (±0.003)
Hydrate composition(Pre)
CO2 CH4 C2H6 CO2 CH4 C2H6 CO2 CH4 C2H6
CO2-CH4-C2H6 Quick crys. 2.75 3.54 3.11 I 0.03 0.96 0.01 0.07 0.89 0.04 0.05 0.87 0.083.65 3.81 3.35 I 0.03 0.96 0.01 0.07 0.89 0.04 0.05 0.86 0.095.15 4.23 3.79 I 0.03 0.95 0.02 0.07 0.89 0.04 0.05 0.83 0.116.55 4.56 4.33 I 0.03 0.95 0.02 0.07 0.89 0.04 0.06 0.83 0.127.80 5.12 4.76 I 0.04 0.94 0.02 0.07 0.89 0.04 0.06 0.81 0.139.25 5.99 5.67 I 0.04 0.94 0.02 0.04 0.90 0.07 0.07 0.82 0.12AADp 8.6% AADc 0.01 0.05 0.05
CO2-CH4-C2H6 Slow crys. 4.60 3.78 3.64 I 0.04 0.95 0.01 0.08 0.80 0.12 0.06 0.84 0.094.20 3.56 3.50 I 0.03 0.95 0.01 0.08 0.83 0.09 0.06 0.84 0.103.25 3.18 3.27 I 0.03 0.96 0.01 0.08 0.85 0.08 0.06 0.87 0.071.30 2.76 2.76 I 0.03 0.96 0.01 0.08 0.86 0.06 0.06 0.89 0.054.20 3.57 3.46 I 0.04 0.95 0.02 0.06 0.84 0.09 0.07 0.83 0.10AADp 2.2% AADc 0.01 0.02 0.01
Table 18Experimental data of methane-ethane-propane-butane hydrate from Le Quang et al. [57] and simulation results.
Texp (�C) (±0.1) Pexp (MPa) (±0.01) Ppre (MPa) S Gas composition (exp)(±0.001)
Hydrate composition (exp)(±0.003)
Hydrate composition (Pre)
C1 C2 C3 C4 C1 C2 C3 C4 C1 C2 C3 C4
2.40 2.28 1.70 II 0.97 0.02 0.00 0.01 0.73 0.11 0.11 0.05 0.75 0.03 0.16 0.063.45 2.31 1.82 II 0.97 0.02 0.01 0.01 0.73 0.11 0.11 0.05 0.74 0.03 0.18 0.067.60 2.75 2.50 II 0.94 0.04 0.01 0.02 0.71 0.10 0.14 0.05 0.72 0.04 0.18 0.079.15 2.97 2.70 II 0.93 0.04 0.01 0.02 0.68 0.10 0.17 0.05 0.70 0.03 0.20 0.069.90 3.05 2.78 II 0.92 0.04 0.02 0.02 0.68 0.10 0.17 0.05 0.70 0.03 0.22 0.0510.80 3.12 2.86 II 0.92 0.05 0.02 0.02 0.69 0.10 0.17 0.05 0.69 0.03 0.24 0.0411.70 3.22 2.94 II 0.91 0.05 0.03 0.02 0.69 0.10 0.16 0.05 0.68 0.02 0.25 0.0412.65 3.34 3.09 II 0.90 0.05 0.03 0.02 0.70 0.09 0.16 0.05 0.68 0.02 0.26 0.0413.65 3.46 3.32 II 0.89 0.05 0.04 0.02 0.70 0.09 0.16 0.05 0.68 0.02 0.27 0.0314.70 3.48 3.75 II 0.89 0.05 0.04 0.02 0.70 0.09 0.16 0.05 0.68 0.02 0.27 0.0315.65 3.52 4.20 II 0.89 0.05 0.04 0.02 0.70 0.09 0.16 0.05 0.68 0.02 0.27 0.0316.60 3.61 4.61 II 0.88 0.05 0.04 0.02 0.71 0.09 0.16 0.05 0.68 0.02 0.27 0.032.75 2.14 1.52 II 0.96 0.02 0.01 0.01 0.73 0.08 0.15 0.04 0.71 0.03 0.19 0.074.30 2.16 1.80 II 0.96 0.02 0.01 0.01 0.73 0.08 0.15 0.04 0.72 0.03 0.18 0.074.85 2.18 1.82 II 0.95 0.03 0.01 0.01 0.73 0.08 0.15 0.04 0.71 0.02 0.21 0.065.90 2.21 1.98 II 0.95 0.03 0.01 0.01 0.72 0.08 0.16 0.04 0.71 0.02 0.21 0.066.80 2.26 2.14 II 0.95 0.03 0.01 0.01 0.72 0.08 0.16 0.04 0.71 0.02 0.22 0.057.45 2.36 2.12 II 0.94 0.03 0.02 0.02 0.72 0.08 0.16 0.04 0.69 0.02 0.24 0.059.20 2.53 2.31 II 0.93 0.04 0.02 0.02 0.71 0.08 0.17 0.04 0.68 0.02 0.26 0.0411.05 2.82 2.55 II 0.91 0.04 0.03 0.02 0.71 0.07 0.18 0.04 0.67 0.02 0.27 0.04AADp 13% AADc 0.01 0.06 0.07 0.01
S. Maghsoodloo Babakhani et al. / Fluid Phase Equilibria 472 (2018) 22e38 35

Table 19Experimental data from Sum et al. [72] and simulation results.
T (K) Gas composition (exp) S Hydrate composition (exp)(±1%)
Hydrate composition (pre)
CO2 CH4 CO2 CH4 CO2 CH4
273.15 0.57 0.43 I 0.75 0.25 0.73 0.27274.15 0.57 0.43 I 0.73 0.27 0.73 0.27277.15 0.57 0.43 I 0.71 0.29 0.72 0.28278.15 0.57 0.43 I 0.71 0.29 0.72 0.28273.15 0.34 0.66 I 0.55 0.45 0.52 0.48274.15 0.34 0.66 I 0.55 0.45 0.51 0.49275.15 0.34 0.66 I 0.53 0.47 0.51 0.49278.15 0.34 0.66 I 0.52 0.48 0.50 0.50
AADc 0.02
Table 20Experimental data from Subramanian et al. [74] for methane-ethane mixture and simulation results.
T (K) Pexp (MPa) (±0.014) Ppre (MPa) S Gas composition(exp)
Hydratecomposition (exp)(±0.1%)
Hydratecomposition (Pre)
CH4 C2H6 CH4 C2H6 CH4 C2H6
274.2 0.88 0.82 I 0.63 0.37 0.28 0.72 0.30 0.70274.2 0.96 0.88 I 0.68 0.32 0.36 0.64 0.32 0.68274.2 0.97 0.96 I 0.72 0.28 0.37 0.63 0.35 0.65AADp 5.3% I AADc 0.02274.2 0.99 1.02 II 0.75 0.25 0.57 0.43 0.37 0.63274.2 1.17 1.34 II 0.85 0.15 0.65 0.35 0.47 0.53274.2 1.45 1.76 II 0.92 0.08 0.70 0.30 0.61 0.39AADp 41.6% II AADc 0.09
Table 21Experimental results from Seo and Lee [75] and our simulation results.
T (K) Pexp (MPa) Ppre (MPa) S Gas composition(exp)
Hydrate composition(exp) (±0.1%)
Hydrate composition(Pre)
CO2 N2 CO2 N2 CO2 N2
272.1 14.50 13.57 I 0.01 0.99 0.09 0.91 0.07 0.93272.1 13.00 12.11 I 0.03 0.97 0.15 0.85 0.17 0.83272.1 10.50 8.79 I 0.10 0.90 0.47 0.54 0.41 0.59272.1 7.70 6.24 I 0.18 0.82 0.59 0.41 0.61 0.39272.1 5.00 3.99 I 0.33 0.67 0.74 0.26 0.79 0.21272.1 4.10 2.80 I 0.50 0.50 0.86 0.14 0.88 0.12272.1 3.50 2.14 I 0.67 0.34 0.94 0.06 0.94 0.06272.1 3.20 1.69 I 0.85 0.15 0.97 0.04 0.98 0.02AADp 23.3% AADc 0.02
Fig. 12. CO2 composition in gas and hydrate phase versus pressure for CO2-N2 systemat 272.1 K (sI). Experimental [75] and our simulation results.
S. Maghsoodloo Babakhani et al. / Fluid Phase Equilibria 472 (2018) 22e3836
essential to extend the experimental database in order to welloptimize the Kihara parameters. Interestingly, there is still a lack ofdata concerning storage capacity of hydrates. This informationcould be used to re-design and develop chemical processes whichthe volume of gas stored in hydrate phase has been taken into ac-count. Finally, consistent, reliable and extensive experimental datais still needed to examine the ability of thermodynamic modelingto predict hydrate composition as well as its developments.
Acknowledgements
The authors would like to thank Professor Christopher Yukna forhis help in proofreading and his suggestions. Saheb MaghsoodlooBabakhani and Son Ho-Van are grateful to Ecole desMines de Saint-Etienne for providing them Ph.D. scholarships.
Appendix A. Supplementary data
Supplementary data related to this article can be found athttps://doi.org/10.1016/j.fluid.2018.05.007.

S. Maghsoodloo Babakhani et al. / Fluid Phase Equilibria 472 (2018) 22e38 37
References
[1] W.K. Burton, N. Cabrera, F.C. Frank, The growth of crystals and the equilibriumstructure of their surfaces, Philos. Trans. R. Soc. Math. Phys. Eng. Sci. 243(1951) 299e358, https://doi.org/10.1098/rsta.1951.0006.
[2] P.B. Dharmawardhana, W.R. Parrish, E.D. Sloan, Experimental thermodynamicparameters for the prediction of natural gas hydrate dissociation conditions,Ind. Eng. Chem. Fundam. 19 (1980) 410e414, https://doi.org/10.1021/i160076a015.
[3] P. Englezos, N. Kalogerakis, P.D. Dholabhai, P.R. Bishnoi, Kinetics of formationof methane and ethane gas hydrates, Chem. Eng. Sci. 42 (1987) 2647e2658,https://doi.org/10.1016/0009-2509(87)87015-X.
[4] J.-M. Herri, F. Gruy, J.-S. Pic, M. Cournil, B. Cingotti, A. Sinquin, Interest of insitu turbidimetry for the characterization of methane hydrate crystallization:application to the study of kinetic inhibitors, Chem. Eng. Sci. 54 (1999a)1849e1858.
[5] A.K.M. Jamaluddin, N. Kalogerakis, P.R. Bishnoi, Hydrate plugging problems inundersea natural gas pipelines under shutdown conditions, J. Petrol. Sci. Eng.5 (1991) 323e335, https://doi.org/10.1016/0920-4105(91)90051-N.
[6] T. Maekawa, Phase equilibria for hydrate formation from binary mixtures ofethane, propane and noble gases, Fluid Phase Equil. 243 (2006) 115e120,https://doi.org/10.1016/j.fluid.2006.02.015.
[7] H.-J. Ng, D.B. Robinson, A method for predicting the equilibrium gas phasewater content in gas-hydrate equilibrium, Ind. Eng. Chem. Fundam. 19 (1980)33e36, https://doi.org/10.1021/i160073a006.
[8] J. Nixdorf, L.R. Oellrich, Experimental determination of hydrate equilibriumconditions for pure gases, binary and ternary mixtures and natural gases, FluidPhase Equil. 139 (1997) 325e333, https://doi.org/10.1016/S0378-3812(97)00141-6.
[9] T. Collett, J.-J. Bahk, R. Baker, R. Boswell, D. Divins, M. Frye, D. Goldberg,J. Husebø, C. Koh, M. Malone, M. Morell, G. Myers, C. Shipp, M. Torres, Methanehydrates in naturedcurrent knowledge and challenges, J. Chem. Eng. Data 60(2015) 319e329, https://doi.org/10.1021/je500604h.
[10] A. Demirbas, Methane hydrates as potential energy resource: Part 2 e
methane production processes from gas hydrates, Energy Convers. Manag. 51(2010) 1562e1571, https://doi.org/10.1016/j.enconman.2010.02.014.
[11] Y.F. Makogon, Natural gas hydrates e a promising source of energy, J. Nat. GasSci. Eng. 2 (2010) 49e59, https://doi.org/10.1016/j.jngse.2009.12.004.
[12] E.D. Sloan, C.A. Koh, Clathrate Hydrates of Natural Gases, third ed., CRC Press,2007.
[13] N.H. Duc, F. Chauvy, J.-M. Herri, CO2 capture by hydrate crystallization e apotential solution for gas emission of steelmaking industry, Energy Convers.Manag. 48 (2007) 1313e1322, https://doi.org/10.1016/j.enconman.2006.09.024.
[14] J.-M. Herri, A. Bouchemoua, M. Kwaterski, A. Fezoua, Y. Ouabbas, A. Cameirao,Gas hydrate equilibria for CO2eN2 and CO2eCH4 gas mixtur-esdexperimental studies and thermodynamic modelling, Fluid Phase Equil.301 (2011) 171e190, https://doi.org/10.1016/j.fluid.2010.09.041.
[15] R. Kumar, H. Wu, P. Englezos, Incipient hydrate phase equilibrium for gasmixtures containing hydrogen, carbon dioxide and propane, Fluid Phase Equil.244 (2006) 167e171, https://doi.org/10.1016/j.fluid.2006.04.008.
[16] P. Linga, R. Kumar, P. Englezos, The clathrate hydrate process for post and pre-combustion capture of carbon dioxide, J. Hazard Mater. 149 (2007) 625e629,https://doi.org/10.1016/j.jhazmat.2007.06.086.
[17] J. Park, Y.-T. Seo, J. Lee, H. Lee, Spectroscopic analysis of carbon dioxide andnitrogen mixed gas hydrates in silica gel for CO2 separation, Catal. Today 115(2006) 279e282, https://doi.org/10.1016/j.cattod.2006.02.059.
[18] C.-Y. Sun, G.-J. Chen, L.-W. Zhang, Hydrate phase equilibrium and structure for(methane þ ethane þ tetrahydrofuran þ water) system, J. Chem. Thermodyn.42 (2010) 1173e1179, https://doi.org/10.1016/j.jct.2010.04.021.
[19] Q. Sun, X. Guo, A. Liu, B. Liu, Y. Huo, G. Chen, Experimental study on theseparation of CH4 and N2 via hydrate formation in TBAB solution, Ind. Eng.Chem. Res. 50 (2011) 2284e2288, https://doi.org/10.1021/ie101726f.
[20] H. Tajima, A. Yamasaki, F. Kiyono, Energy consumption estimation forgreenhouse gas separation processes by clathrate hydrate formation, Energy29 (2004) 1713e1729, https://doi.org/10.1016/j.energy.2004.03.003.
[21] V.M. Vorotyntsev, V.M. Malyshev, P.G. Taraburov, G.M. Mochalov, Separationof gas mixtures by continuous gas hydrate crystallization, Theor. Found.Chem. Eng. 35 (2001) 513e515, https://doi.org/10.1023/A:1012390423740.
[22] S.-P. Kang, J. Lee, Y. Seo, Pre-combustion capture of CO2 by gas hydrate for-mation in silica gel pore structure, Chem. Eng. J. 218 (2013) 126e132, https://doi.org/10.1016/j.cej.2012.11.131.
[23] Q.-L. Ma, G.-J. Chen, C.-Y. Sun, Vaporeliquideliquidehydrate phase equilib-rium calculation for multicomponent systems containing hydrogen, FluidPhase Equil. 338 (2013) 87e94, https://doi.org/10.1016/j.fluid.2012.11.002.
[24] S. Said, V. Govindaraj, J.-M. Herri, Y. Ouabbas, M. Khodja, M. Belloum,J.S. Sangwai, R. Nagarajan, A study on the influence of nanofluids on gas hy-drate formation kinetics and their potential: application to the CO2 captureprocess, J. Nat. Gas Sci. Eng. 32 (2016) 95e108, https://doi.org/10.1016/j.jngse.2016.04.003.
[25] M. Yang, W. Jing, J. Zhao, Z. Ling, Y. Song, Promotion of hydrate-based CO2capture from flue gas by additive mixtures (THF (tetrahydrofuran) þ TBAB(tetra-n-butyl ammonium bromide)), Energy 106 (2016) 546e553, https://doi.org/10.1016/j.energy.2016.03.092.
[26] M. Yang, Y. Song, L. Jiang, Y. Zhao, X. Ruan, Y. Zhang, S. Wang, Hydrate-basedtechnology for CO2 capture from fossil fuel power plants, Appl. Energy 116(2014) 26e40, https://doi.org/10.1016/j.apenergy.2013.11.031.
[27] T. Yu, T. Sato, T. Nakashima, M. Inui, H. Oyama, An integrated model for CO2hydrate formation in sand sediments for sub-seabed CO2 storage, Int. J.Greenh. Gas Control 52 (2016) 250e269, https://doi.org/10.1016/j.ijggc.2016.07.009.
[28] J. Zheng, P. Zhang, P. Linga, Semiclathrate hydrate process for pre-combustioncapture of CO2 at near ambient temperatures, Appl. Energy 194 (2017)267e278, https://doi.org/10.1016/j.apenergy.2016.10.118.
[29] J. Zheng, Y.K. Lee, P. Babu, P. Zhang, P. Linga, Impact of fixed bed reactororientation, liquid saturation, bed volume and temperature on the clathratehydrate process for pre-combustion carbon capture, J. Nat. Gas Sci. Eng. 35(Part B) (2016) 1499e1510, https://doi.org/10.1016/j.jngse.2016.03.100.
[30] D.-L. Zhong, J.-L. Wang, Y.-Y. Lu, Z. Li, J. Yan, Precombustion CO2 capture usinga hybrid process of adsorption and gas hydrate formation, Energy 102 (2016)621e629, https://doi.org/10.1016/j.energy.2016.02.135.
[31] P. Babu, R. Kumar, P. Linga, Unusual behavior of propane as a co-guest duringhydrate formation in silica sand: potential application to seawater desalina-tion and carbon dioxide capture, Chem. Eng. Sci. 117 (2014) 342e351, https://doi.org/10.1016/j.ces.2014.06.044.
[32] H. Fakharian, H. Ganji, A. Naderifar, Desalination of high salinity producedwater using natural gas hydrate, J. Taiwan Inst. Chem. Eng. 72 (2017)157e162, https://doi.org/10.1016/j.jtice.2017.01.025.
[33] S. Han, Y.-W. Rhee, S.-P. Kang, Investigation of salt removal using cyclo-pentane hydrate formation and washing treatment for seawater desalination,Desalination 404 (2017) 132e137, https://doi.org/10.1016/j.desal.2016.11.016.
[34] K.C. Kang, P. Linga, K. Park, S.-J. Choi, J.D. Lee, Seawater desalination by gashydrate process and removal characteristics of dissolved ions (Naþ, Kþ,Mg2 þ, Ca2 þ, B3 þ, Cl�, SO42 �), Desalination 353 (2014) 84e90, https://doi.org/10.1016/j.desal.2014.09.007.
[35] Y.-N. Lv, S.-S. Wang, C.-Y. Sun, J. Gong, G.-J. Chen, Desalination by forminghydrate from brine in cyclopentane dispersion system, Desalination 413(2017) 217e222, https://doi.org/10.1016/j.desal.2017.03.025.
[36] M. Yang, J. Zheng, W. Liu, Y. Liu, Y. Song, Effects of C3H8 on hydrate formationand dissociation for integrated CO2 capture and desalination technology,Energy 93 (Part 2) (2015) 1971e1979, https://doi.org/10.1016/j.energy.2015.10.076.
[37] J. Zheng, M. Yang, Y. Liu, D. Wang, Y. Song, Effects of cyclopentane on CO2hydrate formation and dissociation as a co-guest molecule for desalination,J. Chem. Thermodyn. 104 (2017) 9e15, https://doi.org/10.1016/j.jct.2016.09.006.
[38] S. Ho-Van, B. Bouillot, J. Douzet, S.M. Babakhani, J.M. Herri, Experimentalmeasurement and thermodynamic modeling of cyclopentane hydrates withNaCl, KCl, CaCl2, or NaCl-KCl present, AIChE J. 64 (2018) 2207e2218, https://doi.org/10.1002/aic.16067.
[39] A. Erfani, E. Fallah-Jokandan, F. Varaminian, Effects of non-ionic surfactants onformation kinetics of structure H hydrate regarding transportation and stor-age of natural gas, J. Nat. Gas Sci. Eng. 37 (2017) 397e408, https://doi.org/10.1016/j.jngse.2016.11.058.
[40] J. Javanmardi, K. Nasrifar, S.H. Najibi, M. Moshfeghian, Economic evaluation ofnatural gas hydrate as an alternative for natural gas transportation, Appl.Therm. Eng. 25 (2005) 1708e1723, https://doi.org/10.1016/j.applthermaleng.2004.10.009.
[41] J. Lim, E. Kim, Y. Seo, Dual inhibition effects of diamines on the formation ofmethane gas hydrate and their significance for natural gas production andtransportation, Energy Convers. Manag. 124 (2016) 578e586, https://doi.org/10.1016/j.enconman.2016.07.054.
[42] S. Maghsoodloo Babakhani, A. Alamdari, Effect of maize starch on methanehydrate formation/dissociation rates and stability, J. Nat. Gas Sci. Eng. 26(2015) 1e5, https://doi.org/10.1016/j.jngse.2015.05.026.
[43] H. Mimachi, S. Takeya, A. Yoneyama, K. Hyodo, T. Takeda, Y. Gotoh,T. Murayama, Natural gas storage and transportation within gas hydrate ofsmaller particle: size dependence of self-preservation phenomenon of naturalgas hydrate, Chem. Eng. Sci. 118 (2014) 208e213, https://doi.org/10.1016/j.ces.2014.07.050.
[44] Z. Taheri, M.R. Shabani, K. Nazari, A. Mehdizaheh, Natural gas transportationand storage by hydrate technology: Iran case study, J. Nat. Gas Sci. Eng. 21(2014) 846e849, https://doi.org/10.1016/j.jngse.2014.09.026.
[45] I. Chatti, A. Delahaye, L. Fournaison, J.-P. Petitet, Benefits and drawbacks ofclathrate hydrates: a review of their areas of interest, Energy Convers. Manag.46 (2005) 1333e1343, https://doi.org/10.1016/j.enconman.2004.06.032.
[46] J.-M. Herri, M. Cournil, E. Chassefiere, Thermodynamic Modelling of ClathrateHydrates in the Atmosphere of Mars, HAL, 2011. https://hal.archives-ouvertes.fr/hal-00617450.
[47] J.-M. Herri, E. Chassefi�ere, Carbon dioxide, argon, nitrogen and methaneclathrate hydrates: thermodynamic modelling, investigation of their stability inMartian atmospheric conditions and variability of methane trapping, Planet.Space Sci. 73 (2012) 376e386, https://doi.org/10.1016/j.pss.2012.07.028.
[48] S.L. Miller, W.D. Smythe, Carbon dioxide clathrate in the martian ice cap,Science 170 (1970) 531e533, https://doi.org/10.1126/science.170.3957.531.
[49] M.N. Khan, P. Warrier, C.J. Peters, C.A. Koh, Review of vapor-liquid equilibria ofgas hydrate formers and phase equilibria of hydrates, J. Nat. Gas Sci. Eng. 35(Part B) (2016) 1388e1404, https://doi.org/10.1016/j.jngse.2016.06.043.
S. Maghsoodloo Babakhani et al. / Fluid Phase Equilibria 472 (2018) 22e3838
[50] A.Y. Manakov, A.D. Duchkov, Laboratory modeling of hydrate formation inrock specimens (a review), Russ. Geol. Geophys. 58 (2017) 240e252, https://doi.org/10.1016/j.rgg.2016.01.023.
[51] S. Shahnazar, N. Hasan, Gas hydrate formation condition: review on experi-mental and modeling approaches, Fluid Phase Equil. 379 (2014) 72e85,https://doi.org/10.1016/j.fluid.2014.07.012.
[52] Y. Song, L. Yang, J. Zhao, W. Liu, M. Yang, Y. Li, Y. Liu, Q. Li, The status of naturalgas hydrate research in China: a review, Renew. Sustain. Energy Rev. 31(2014) 778e791, https://doi.org/10.1016/j.rser.2013.12.025.
[53] Q. Sun, Y.T. Kang, Review on CO2 hydrate formation/dissociation and its coldenergy application, Renew. Sustain. Energy Rev. 62 (2016) 478e494, https://doi.org/10.1016/j.rser.2016.04.062.
[54] Z. Yin, Z.R. Chong, H.K. Tan, P. Linga, Review of gas hydrate dissociation kineticmodels for energy recovery, J. Nat. Gas Sci. Eng. 35 (Part B) (2016) 1362e1387,https://doi.org/10.1016/j.jngse.2016.04.050.
[55] J.H. van der Waals, J.C. Platteeuw, Clathrate solutions, in: I. Prigogine (Ed.),Adv. Chem. Phys., John Wiley & Sons, Inc., Hoboken, NJ, USA, 1959, pp. 1e57.http://doi.wiley.com/10.1002/9780470143483.ch1. (Accessed 22 December2015).
[56] Y.P. Handa, J.S. Tse, Thermodynamic properties of empty lattices of structure Iand structure II clathrate hydrates, J. Phys. Chem. 90 (1986) 5917e5921,https://doi.org/10.1021/j100280a092.
[57] D. Le Quang, D. Le Quang, B. Bouillot, J.-M. Herri, P. Glenat, P. Duchet-Suchaux,Experimental procedure and results to measure the composition of gas hy-drate, during crystallization and at equilibrium, from N2eCO2eCH4eC2H6eC3H8eC4H10 gas mixtures, Fluid Phase Equil. (2015), https://doi.org/10.1016/j.fluid.2015.10.022.
[58] B. Bouillot, J.-M. Herri, Framework for clathrate hydrate flash calculations andimplications on the crystal structure and final equilibrium of mixed hydrates,Fluid Phase Equil. (2015), https://doi.org/10.1016/j.fluid.2015.10.023.
[59] V. McKoy, O. Sinano�glu, Theory of dissociation pressures of some gas hydrates,J. Chem. Phys. 38 (1963) 2946, https://doi.org/10.1063/1.1733625.
[60] J.E.D. Sloan, Clathrate Hydrates of Natural Gases, second ed., CRC Press, 1998.Revised and Expanded.
[61] S. Maghsoodloo Babakhani, B. Bouillot, J. Douzet, S. Ho-Van, J.M. Herri, A newapproach of studying mixed gas hydrates involving propane at non-equilibrium conditions and final state: an experimental study and modeling,Chem. Eng. Sci. (2018), https://doi.org/10.1016/j.ces.2018.01.017.
[62] J. Jhaveri, D.B. Robinson, Hydrates in the methane-nitrogen system, Can. J.Chem. Eng. 43 (1965) 75e78, https://doi.org/10.1002/cjce.5450430207.
[63] T. Kawasaki, K. Kikuchi, D. Terasaki, T. Okui, K. Myata, H. Hirayama, M. Ihara,Composition of Guests in Hydrates from Gas Mixture, 2002, pp. 424e427.Yokohama, Japan.
[64] S.-P. Kang, H. Lee, C.-S. Lee, W.-M. Sung, Hydrate phase equilibria of the guestmixtures containing CO2, N2 and tetrahydrofuran, Fluid Phase Equil. 185(2001) 101e109, https://doi.org/10.1016/S0378-3812(01)00460-5.
[65] K. Ohgaki, K. Takano, H. Sangawa, T. Matsubara, S. Nakano, Methane exploi-tation by carbon dioxide from gas hydrates. Phase equilibria for CO2-CH4mixed hydrate system, J. Chem. Eng. Jpn. 29 (1996) 478e483, https://doi.org/10.1252/jcej.29.478.
[66] S. Angus, J.B. Armstrong, K.M. de Reuck, R.D. McCarthy, R.T. Jacobsen,W. Wagner, International thermodynamic tables of the fluid state, Methane 5(1978).
[67] S. Angus, B. Armstrong, K.M. de Reuck, International Thermodynamic Tables ofthe Fluid State: Carbon Dioxide, Pergamon Press, Oxford; New York, 1976.
[68] V. Belandria, A. Eslamimanesh, A.H. Mohammadi, P. Th�eveneau, H. Legendre,D. Richon, Compositional analysis and hydrate dissociation conditions mea-surements for carbon dioxide þ methane þ water system, Ind. Eng. Chem.Res. 50 (2011) 5783e5794, https://doi.org/10.1021/ie101959t.
[69] V. Belandria, A. Eslamimanesh, A.H. Mohammadi, D. Richon, Gas hydrateformation in carbon dioxide þ nitrogen þ water system: compositionalanalysis of equilibrium phases, Ind. Eng. Chem. Res. 50 (2011) 4722e4730,https://doi.org/10.1021/ie101635k.
[70] Y.-T. Seo, S.-P. Kang, H. Lee, C.-S. Lee, W.-M. Sung, Hydrate phase equilibria forgas mixtures containing carbon dioxide: a proof-of-concept to carbon dioxiderecovery from multicomponent gas stream, Kor. J. Chem. Eng. 17 (2000)659e667.
[71] H.-J. Ng, Hydrate phase composition for multicomponent gas mixtures, Ann.N. Y. Acad. Sci. 912 (2000) 1034e1039, https://doi.org/10.1111/j.1749-6632.2000.tb06858.x.
[72] A.K. Sum, R.C. Burruss, E.D. Sloan, Measurement of clathrate hydrates viaRaman spectroscopy, J. Phys. Chem. B 101 (1997) 7371e7377, https://doi.org/10.1021/jp970768e.
[73] S. Subramanian, A. Ballard, R. Kini, S. Dec, E. Sloan, Structural transitions inmethaneþethane gas hydrates d Part I: upper transition point and applica-tions, Chem. Eng. Sci. 55 (2000) 5763e5771, https://doi.org/10.1016/S0009-2509(00)00162-7.
[74] S. Subramanian, R.A. Kini, S.F. Dec, E.D. Sloan, Evidence of structure II hydrateformation from methaneþethane mixtures, Chem. Eng. Sci. 55 (2000)1981e1999, https://doi.org/10.1016/S0009-2509(99)00389-9.
[75] Y.-T. Seo, H. Lee, Structure and guest distribution of the mixed carbon dioxideand nitrogen hydrates as revealed by x-ray diffraction and 13C NMR spec-troscopy, J. Phys. Chem. B 108 (2004) 530e534, https://doi.org/10.1021/jp0351371.
[76] T. Uchida, S. Takeya, Y. Kamata, I.Y. Ikeda, J. Nagao, T. Ebinuma, H. Narita,O. Zatsepina, B.A. Buffett, Spectroscopic observations and thermodynamiccalculations on clathrate hydrates of mixed gas containing methane andEthane: determination of structure, composition and cage occupancy, J. Phys.Chem. B 106 (2002) 12426e12431, https://doi.org/10.1021/jp025884i.
[77] T. Uchida, S. Takeya, Y. Kamata, R. Ohmura, H. Narita, Spectroscopic mea-surements on binary, ternary, and quaternary mixed-gas molecules in clath-rate structures, Ind. Eng. Chem. Res. 46 (2007) 5080e5087, https://doi.org/10.1021/ie070153w.
[78] J.M. Schicks, R. Naumann, J. Erzinger, K.C. Hester, C.A. Koh, E.D. Sloan, Phasetransitions in mixed gas hydrates: experimental observations versus calcu-lated data, J. Phys. Chem. B 110 (2006) 11468e11474, https://doi.org/10.1021/jp0612580.
[79] D.W. Davidson, S.K. Garg, S.R. Gough, R.E. Hawkins, J.A. Ripmeester, Charac-terization of natural gas hydrates by nuclear magnetic resonance anddielectric relaxation, Can. J. Chem. 55 (1977) 3641e3650, https://doi.org/10.1139/v77-512.
[80] J.A. Ripmeester, C.I. Ratcliffe, The diverse nature of dodecahedral cages inclathrate hydrates as revealed by 129 Xe and 13 C NMR spectroscopy: CO2 asa small-cage guest, Energy Fuels 12 (1998) 197e200, https://doi.org/10.1021/ef970171y.
[81] S. Nakano, M. Moritoki, K. Ohgaki, High-pressure phase equilibrium andRaman microprobe spectroscopic studies on the CO2 hydrate system, J. Chem.Eng. Data 43 (1998) 807e810, https://doi.org/10.1021/je9800555.
[82] I.L. Moudrakovski, G.E. McLaurin, C.I. Ratcliffe, J.A. Ripmeester, Methane andcarbon dioxide hydrate formation in water droplets: spatially resolved mea-surements from magnetic resonance microimaging, J. Phys. Chem. B 108(2004) 17591e17595, https://doi.org/10.1021/jp0473220.
[83] S. Subramanian, E.D. Sloan, Microscopic measurements and modeling of hy-drate formation kinetics, Ann. N. Y. Acad. Sci. 912 (2006) 583e592, https://doi.org/10.1111/j.1749-6632.2000.tb06813.x.
[84] S. Gao, W.G. Chapman, W. House, NMR and viscosity investigation of clathratehydrate formation and dissociation, Ind. Eng. Chem. Res. 44 (2005)7373e7379, https://doi.org/10.1021/ie050464b.
[85] K.C. Hester, T.A. Strobel, E.D. Sloan, C.A. Koh, A. Huq, A.J. Schultz, Molecularhydrogen occupancy in binary THF�H2 clathrate hydrates by high resolutionneutron diffraction, J. Phys. Chem. B 110 (2006) 14024e14027, https://doi.org/10.1021/jp063164w.
[86] R. Kumar, P. Englezos, I. Moudrakovski, J.A. Ripmeester, Structure andcomposition of CO2/H2 and CO2/H2/C3H8 hydrate in relation to simultaneousCO2 capture and H2 production, AIChE J. 55 (2009) 1584e1594, https://doi.org/10.1002/aic.11844.