fluidic oscillator as a continuous crystallizer
TRANSCRIPT
Fluidic Oscillator as a Continuous Crystallizer: Feasibility Evaluation
Pandit, A. V., & Ranade, V. V. (2020). Fluidic Oscillator as a Continuous Crystallizer: Feasibility Evaluation.Industrial and Engineering Chemistry Research, 59(9), 3996-4006. https://doi.org/10.1021/acs.iecr.9b04637
Published in:Industrial and Engineering Chemistry Research
Document Version:Peer reviewed version
Queen's University Belfast - Research Portal:Link to publication record in Queen's University Belfast Research Portal
Publisher rightsCopyright 2020 ACS. This work is made available online in accordance with the publisher’s policies. Please refer to any applicable terms ofuse of the publisher.
General rightsCopyright for the publications made accessible via the Queen's University Belfast Research Portal is retained by the author(s) and / or othercopyright owners and it is a condition of accessing these publications that users recognise and abide by the legal requirements associatedwith these rights.
Take down policyThe Research Portal is Queen's institutional repository that provides access to Queen's research output. Every effort has been made toensure that content in the Research Portal does not infringe any person's rights, or applicable UK laws. If you discover content in theResearch Portal that you believe breaches copyright or violates any law, please contact [email protected].
Download date:23. Feb. 2022

1
Fluidic Oscillator as a Continuous Crystallizer: Feasibility
Evaluation
Ajinkya V Pandit1 and Vivek V Ranade1,2* 1School of Chemistry and Chemical Engineering
Queen’s University Belfast, Belfast, BT7 1NN, UK 2Bernal Institute, University of Limerick,
Limerick, V94 T9PX, Ireland
*Email: [email protected]; [email protected]

2
Abstract
Crystallisation is an important separation unit operation accounting for nearly 90% of organic
molecules in the pharmaceutical and fine chemical industries. Recently, continuous
crystallisation was demonstrated to have several advantages over the conventional batch
crystallisation in terms of improved product consistency, reduced labor costs/economic footprint
and better process control. Continuous stirred tank crystallisers, however, are limited in mixing/
heat transfer capabilities and have issues like cyclical oscillations in product quality. Tubular
crystallisers can mitigate these issues, however, suffer from issues related to particle settling and
blockages. Fluidic oscillators with one or more feedback channels are gaining popularity in
recent years due to the advent of microfluidics. Jet oscillations in fluidic oscillators were shown
to consistently provide vigorous mixing and heat transfer above a critical Reynold’s number. In
the present study, the feasibility of the fluidic oscillator as a continuous crystalliser was
evaluated to mitigate challenges faced by previous continuous crystallisation technology. A
novel ‘loop setup’ was proposed for continuous crystallisation and was investigated using the
seeded anti-solvent crystallisation of paracetamol in a methanol-water system. The effect of key
operating conditions of residence time, supersaturation ratio, operational mode, fluidic device,
device orientation and seed size were investigated. Throughout the study it was observed that the
loop setup gave product particle size distributions consistent with enhanced mixing behavior.
Further, it was demonstrated that the proposed continuous crystalliser was better in terms of
scale up in comparison with batch crystallisers. The presented results and approach will be useful
to develop fluidic oscillators as a useful platform for continuous crystallization.
Keywords: Continuous Crystallization, Fluidic Oscillators, Anti-solvent Crystallisation, Mixing

3
1. Introduction
Crystallization is an important unit operation in the pharmaceutical and fine chemical industries
for the separation of high value solid products. Nearly 90% organic molecules in the
pharmaceutical and fine chemical sectors are produced via crystallization1,2. The quality of a
crystalline product quality may be assessed by looking for variations in crystal habits, crystal
polymorphs and particle size distribution (PSD). These product characteristics have a
considerable impact on downstream manufacturing processes (filtration, drying, formulation) as
well as on the product efficacy (bioavailability, dissolution, stability)3-5. The above-mentioned
characteristics of crystalline products are primarily dependent on:
Spatio-temporal variation of super-saturation: Can be controlled by mixing, heat
transfer, circulation time or residence time distributions and different ways of realizing
super-saturation (cooling, anti-solvent, evaporation and combinations thereof)
Nucleation (primary and secondary) and growth kinetics
Physico-chemical properties: Solubility, heat of crystallization, viscosity, density,
surface charges, agglomeration and breakage characteristics.
It is therefore essential, wherever possible, to control these parameters so that desired
characteristics of crystalline products may be obtained, with minimal variation in product
quality.
Typically, crystallization is carried out in batch mode in mechanically agitated stirred tanks2.
However, batch crystallisation techniques can suffer from problems such as poor utilization of
equipment, high maintenance costs and batch to batch variation in product quality1,2,4. Moreover,
batch processing generally offers poor control on the PSD requiring an additional energy
intensive milling operation to achieve target product size distributions. The expiration on patents
of an increasing number of chemicals is pushing industries to explore new avenues to make the
manufacturing processes more efficient and competitive1. Industries have therefore been driven
towards researching continuous crystallisation processes. Commonly used continuous
crystallizers include stirred tanks (singe or cascade) and tubular crystallisers with different types
of agitation (for example oscillatory baffle crystallizer)1.

4
Despite progress in recent years, the existing methods for continuous crystallisation suffer from
several limitations. For instance, continuous stirred crystallizers suffer from broad residence time
distribution implying spatial inhomogeneities in concentration resulting in broad PSDs6 as well
as limited heat transfer and mixing capabilities3. Large variations in shear stress and turbulent
intensity within large stirred tanks can often lead to severe issues on scale-up7. Further, there are
known issues of cyclical oscillations of the PSD in mixed suspension mixed product removal
(MSMPR) crystallisers2,8.
Tubular crystallizers can potentially mitigate these challenges3 and offer the possibility of
multiple anti-solvent addition points9 and lengthwise variation in temperature10 for improved
control of product quality. Tubular devices however, suffer from undesired blockages which
often occur because of sedimentation of particles6. Possible workarounds to address this problem
involve complicated moving machinery, for example, the oscillating baffle crystallizer11,
addition of a second immiscible phase which wets tube walls and encases the crystallising
phase3,10 or increasing flow rates (thereby reducing process yields). Thus, there is still a
sufficient need for the development of continuous crystallization technology which addresses
one or more of the challenges presented.
Fluidic oscillators were developed almost 50 years ago12. Previously, such oscillators were used
for flow measurement, as passive mixers for the mixing of miscible liquids and even for
radioactive spent fuel treatment. Fluidic oscillators exploit the Coanda effect which is the
tendency of a fluid jet to attach itself to an adjacent flat or curved surface. A schematic of the
working principle of a planar fluidic oscillator considered in the present study is shown in Figure
1. A jet of fluid entering a chamber through the inlet will attach itself to a wall adjacent to the
inlet increasing the flow through the feedback channel on the side of the attached wall. The
increased flow in the feedback channel is reintroduced at the inlet such that it pushes the main
inlet jet away from the first wall, to the other wall of the chamber which in turn activates the
flow through the other feedback channel. The symmetrical position of the inlet thus leads to
sustained oscillations of the jet due to the alternate activation of the feedback channels resulting
in intense mixing inside the mixing chamber12,13,14.

5
In recent years, with the advent of microfluidics, there has been a renewed interest in fluidic
oscillators as described above or some geometrical variations thereof. Khalde et. al. (2019)
presented results of a computational study of different configurations of fluidic oscillators for
effectiveness in terms of mixing intensity and heat transfer13. It was reported that the investigated
feedback oscillators showed a consistent good mixing and heat transfer behavior over a critical
value of Reynold’s number. Xu et. al. (2015) investigated an oscillating feedback micro mixer
for its application for the in situ passive mixing of two miscible fluids12. Wang et. al. (2014)
investigated a novel multi-stage extractor without moving parts comprising of multiple units of a
feedback fluidic oscillator with two feedback channels and was seen to provide a good extraction
efficiency for liquid-liquid extraction14.
Figure 1: Schematic representation of jet switching and mixing mechanisms in a fluidic device
based on the Coanda effect
The present work borrows from the work done previously on the feedback fluidic oscillators. It is
usually hypothesized that the mechanism of secondary nucleation is due to crystal-impeller,
crystal-crystal or crystal-wall collisions15,16. Hence, it was hypothesized that a crystalliser
without moving parts would go a long way towards suppressing secondary nucleation thereby
allowing more control on the product PSD. Continuous oscillations in fluidic oscillators would
serve to enhance mixing and heat transfer in the solution as well as avoid settling of particles
6
possibly mitigating problems associated with encrustation. Further, it was hypothesized that
smaller particles would preferentially be recycled through the feedback channels due to drag
forces spending more time growing in the crystallizer leading to narrower size distributions.
Potential benefits of fluidic oscillators as continuous crystallisers seem promising and could
translate to improved control of product quality (crystal shape, PSD) and enhanced crystalliser
operation (mixing/heat-transfer, blockage-free operation).
In this work, we have assessed the fluidic oscillator design studied by Khalde et al. (2019)13 for
its application as a continuous crystallizer. The investigation focused on the seeded anti-solvent
crystallisation of paracetamol using methanol-water solution as the solvent and water as the anti-
solvent. A novel ‘loop setup’ was proposed which allowed to harness the enhanced
characteristics of fluidic oscillators at high Reynold’s number at lab-scale throughputs. The
impact of several operating variables such as residence time, supersaturation ratio, fluidic device
and seed size on the product PSD were investigated experimentally. A comparison with the
conventional batch stirred tank crystallisers was also performed and common issues related to
scale-up of batch crystallisers were addressed. The results will be useful to identify potential of
fluidic oscillators as continuous crystallisers and provide a basis for further work in this area.
2. Experimental Section
2.1 Crystallisation System
In the present study, seeded anti-solvent crystallisation of paracetamol in a methanol-water
system was considered. Continuous unseeded anti-solvent crystallisation experiments were first
carried out with high (>2) super saturation ratios (SSRs). It was found in these experiments that
transfer lines and the crystalliser got clogged after around 20 minutes of continuous operation.
The clogging was attributed to the sedimentation of particles and successive encrustation and is a
typical nuisance in continuous crystallisation processes. When the SSR was reduced to 1.6, it
was found that onset of crystallisation was visually not observed to occur in the time scale of the
experiment (60 - 90 minutes) in the crystalliser. A suitable mitigation strategy needed to be
devised to ensure a stable and meaningful operation of the continuous crystalliser.

7
Previous studies proposed different strategies to mitigate the clogging/blockage in transfer lines
of MSMPRs and in plug flow crystallisers (PFCs). Mujumdar et. al. (2015), proposed a
mitigation strategy for the recovery of valuable API by addition of the pure solvent after
operation17. Brown et. al. (2015) observed that increasing the oscillation amplitude in the COBC
or increasing the anti-solvent flow rate - thus reducing mean residence time were seen to enable
extended blockage free operation18. Powell (2017) addressed the problem of blockages in
transfer lines of MSMPR crystallisers by periodically pulsing the solution through the transfer
lines at high flow rates19. Onyemelukwe (2019) argued that excessive primary and secondary
nucleation gave rise to the blockages in the crystalliser and mitigated the problem of blockage
using seeded crystallisation at lower supersaturation ratios (to suppress excessive nucleation)20.
Based on analysis of the published attempts, a strategy of reducing the SSR and introducing
seeding was applied in this work and a sustained operation of the crystalliser was verified for
over 90 minutes for the base case (RTD1 as described later ).
Table 1: Composition of Base Solution S and Mixture for different values of Supersaturation
Ratio (SSR) studied
RTD1 SS1 SS2
Solution S Mixture Solution S Mixture Solution S Mixture
Water (g) 1200 3300 1300 3400 1000 3000
Methanol (g) 711 711 632 632 790 790
Paracetamol (g) 210 210 169 169 275 275
Saturation Paracetamol
(g) 191.14 117.36 149.57 103.67 255.32 136.42
Excess Paracetamol (g) 18.86(see
d)
73.78
(+seed)
19.42
(seed)
45.91(+
seed)
19.68
(seed)
118.89
(+seed)
SSR - 1.63 - 1.44 - 1.87
A solution containing paracetamol (4-Acetamidophenol, 98%, Acros Organics), methanol
(99.8%, Fisher Chemicals) and distilled water was prepared to be used as the base solution.
Distilled water was used as an anti-solvent and was added in an equal volumetric flow rate as the
base solution. The total amount of paracetamol to be added (inclusive of seeds) was calculated
based on the SSR required and to ensure seeding equivalent to ~ 0.5% of the total mixture
weight. All calculations related to solubility were done considering the solubility profile reported

8
by Ó’Ciardhá et. al. (2011) 21 at 25°C. Experiments were performed by keeping the temperatures
of the base solution, anti-solvent and the mixture between 26 to 27°C. The compositions of the
base solution for different SSRs considered in the present study are shown in Table 1.
2.2 Crystallization Setup
Typical laboratory scale continuous crystallizers are operated at a low flow rate which usually
results in poor mixing. To get around this, the COBC superimposed an oscillating motion using a
piston on top of a low inlet flow rate11. Due to oscillations, locally the fluid velocity was high
enough to avoid particle settling, but overall the residence time was high enough to
accommodate crystallisation processes. In the fluidic oscillator considered in this work,
significantly high flow rates are needed to realize desired mixing. An inlet velocity of 0.75m/s
(~1L/min flow rate) was expected to give good mixing characteristics for the fluidic oscillator13.
Higher flow rates also help in avoiding encrustation and particle settling18,19. In the present study,
a novel ‘loop setup’ was used to reconcile between the high flow rate requirement of fluidic
oscillators and the high residence time requirement for crystallisation processes at lab-scale
throughputs. The schematic of the loop setup is shown in the Figure 2.
The exact dimensions of the fluidic device used in the present study are given in Section S1 of
the Supporting Information. In the loop setup, there is a loop wherein the fluid was circulated at
sufficiently high flow rates (~1L/min) using a VWR FASTLoad series auto-controlled peristaltic
pump. The direction of the flow in the loop was such that a ‘short-circuit’ of flow between the
inlet and outlet of the loop setup was avoided. There were two glass T-junctions in the loop to
connect it to the inlet and the outlet lines of the setup. The inlet feed was an equal volume
mixture of the base solution and the anti-solvent and was fed to the loop setup using a single
VWR FASTLoad series auto-controlled peristaltic pump with two pump heads. Fluids drawn
from the base solution and the anti-solvent were mixed using a glass T-junction and then fed into
the inlet T-junction of the loop setup.
The outlet flow rate was self-controlled in the loop setup due to the fixed volume of the loop
setup and the incompressible nature of the fluid. The outlet stream was collected in a 5L baffled
glass beaker. An overhead stirrer with a pitched blade downflow impeller was used at an

9
impeller speed of 500RPM to maintain the stirring conditions throughout the experiment. The
outlet flow rate was quantitatively verified for the first 10-15 minutes for most experiments using
a Fisherbrand Precision series mass balance (capacity of 2100g, sensitivity of 0.01g, response
time of 3s) to ensure a steady outlet flow and to obtain accurate values for residence time.
Figure 2: Schematic diagram of the anti-solvent continuous crystallization ‘loop’ setup
Though using a recycle is a known strategy to improve yield in continuous crystallization
processes, to the author’s knowledge, the proposed loop setup has not been used before for
crystallization. Fundamentally, the loop setup considered in the present study is equivalent to a
PFC with recycle albeit with very high (~ 50) recycle ratio (defined here as the flow rate ratio
between the recycle stream and the inlet stream). Previous studies dealing with recycle streams
did not consider such high recycle ratios. Wong et. al. (2012) found that a recycle system
(recycle ratios of 1.49 – 1.87 for cooling crystallisation, 14.31 for anti-solvent crystallisation)
used with a single stage MSMPR setup obtained higher yields, higher purity and more control on
the PSD as compared to multistage MSMPRs22. Using a recycle however leads to increased
impurities. Ferguson et al. (2014) used a continuous crystallization process with a recycle stream
fitted with an inline nanofiltration unit which simultaneously improved yield and reduced
impurities23. Cogoni et. al. (2015) found through a simulation study that the recycle ratio (values
Collection Tank

10
less than 1) and the extraction position were effective parameters in controlling the product PSD
and improving process yields24.
Li et. al. (2016) found that using a solids recycle stream (solids’ recycle ratio of 0.45 – 0.9)
increased the overall surface area in the crystalliser and hence improved the yield25. Another
advantage of the present fluidic device is that apart from the recycle in the loop setup, some part
of the fluid (~ 5 - 10%) was continuously recycled in the device itself due to the feedback
channels (Figure 1)13. Thus, it was expected that the smaller sized solids which could be carried
by fluid flow into the feedback channels would accumulate in the device increasing the overall
surface area and improving process yield as found out by Li et. al (2016)25. The solids feedback
in the device was also expected to increase the residence time of the smaller particles leading to
preferential growth of smaller particles and hence a narrower PSD.
To ensure a stable operation, the liquid phase refractive index was measured at the outlet of the
loop setup using an offline Mettler Toledo RM40 refractometer at a 35°C cell temperature using
an air-water system as a baseline. For a given solution solvent-anti-solvent composition (in this
case methanol-water), the refractive index is linearly proportional to the solute concentration. A
constant value of the refractive index at the outlet thus ensured the base solution and the anti-
solvent were dosed properly and there were no blockages/complications due to progressive
encrustation. No attempt was made to correlate the solute concentration to the refractive index
measurements. Liquid samples were drawn from the outlet stream using a 2mL syringe and
filtered into a sample vial using 0.22μm 28mm Sirius syringe filters.
After approximately 3 liters of the mixture was collected, the experiment was stopped. The time
for the collection of 3 liters of the solution varied depending upon different residence times
considered. The solution was then allowed to equilibrate in the 5L baffled glass beaker under
constant stirring conditions for 60 minutes after the completion of the experiment. The liquid
phase refractive index was measured after 60 minutes to ensure steady state. The solution was
then filtered using a Büchner funnel assembly connected to a vacuum line and the filtered cake
was dried for 48 hours at 50°C to obtain the final product in a powder form. The procedure to
measure the PSD of the final product is explained in the next section.
11
As the crystals were circulated using a peristaltic pump in the loop setup and collected in the
collection tank, it may be inferred that the two steps would affect the PSD. Crystal breakage
might occur in the peristaltic pump or during equilibration in the collection tank. In order to clear
this ambiguity, an additional experiment (RTD6 as described later) was performed. In this
experiment, after the first equilibration step, the mixture was kept under stirring conditions for
another hour while simultaneously setting up a simple loop using a peristaltic pump. The simple
loop was a tube which took the mixture from the collection tank and put it back into the
collection tank while passing through the peristaltic pump. The pump was operated at 220RPM
as for the rest of the experiments. The PSD was then measured and compared with other
experiments.
2.3. Measuring the PSD
The product PSD was the key product quality parameter considered in the present work. The
effect of key operating conditions on the product PSD was investigated. To obtain the product
PSD, particles from the dried product were taken on a glass slide and viewed under a trinocular
Brunel SP-400 microscope using 5X and 10X objectives. A Canon EOS2000D digital SLR
camera with a microscope to camera adaptor having an effective magnification of 10X was
mounted on the microscope which provided an effective magnification of 50X and 100X
respectively. At least 300 individual particles were approximated using an oval shape as shown
in the Figure 3A and 3B. The particle projected area was approximated to be equal to the area
enclosed by the oval used to encompass it. The individual particle size was estimated as the
diameter of a circle having the same area as the approximate projected area of the particle.
A Matlab function - HISTOGRAM (MATLAB R2018b), was used to distribute the measured
particle diameters into bins of a uniform width of 5μm ranging from 0 to 310μm to obtain the
number distribution function histogram as shown in Figure 3C. It was observed that the PSD
obtained from all the crystallisation experiments performed resembled the shape described by the
lognormal distribution function. A normalized lognormal distribution function (denoted by f(x)
where f(x)dx is the probability distribution between the sizes x and x+dx) as described by
Equation 1 was used for the regression of the normalized experimental product PSD26. The
normalized lognormal distribution functions enabled a convenient comparison across different
12
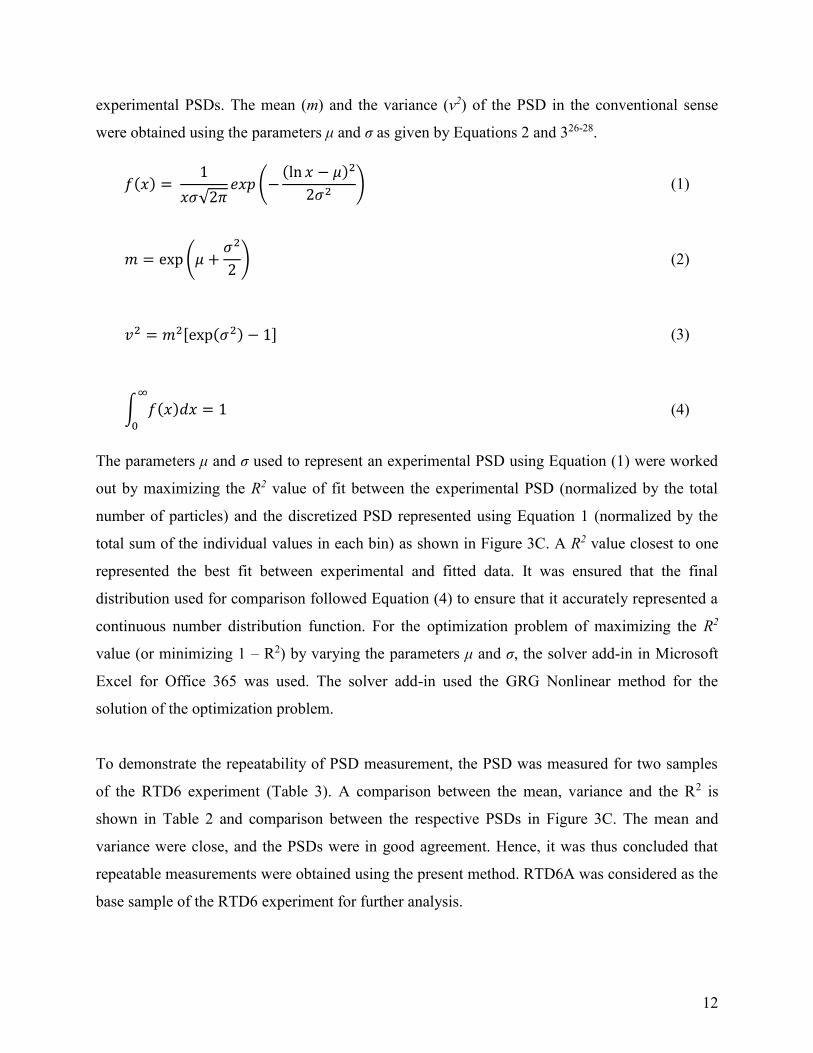
experimental PSDs. The mean (m) and the variance (v2) of the PSD in the conventional sense
were obtained using the parameters μ and σ as given by Equations 2 and 326-28.
𝑓(𝑥) = 1
𝑥𝜎√2𝜋𝑒𝑥𝑝 (−
(ln 𝑥 − 𝜇)2
2𝜎2) (1)
𝑚 = exp (𝜇 +𝜎2
2) (2)
𝑣2 = 𝑚2[exp(𝜎2) − 1] (3)
∫ 𝑓(𝑥)𝑑𝑥 = 1∞
0
(4)
The parameters μ and σ used to represent an experimental PSD using Equation (1) were worked
out by maximizing the R2 value of fit between the experimental PSD (normalized by the total
number of particles) and the discretized PSD represented using Equation 1 (normalized by the
total sum of the individual values in each bin) as shown in Figure 3C. A R2 value closest to one
represented the best fit between experimental and fitted data. It was ensured that the final
distribution used for comparison followed Equation (4) to ensure that it accurately represented a
continuous number distribution function. For the optimization problem of maximizing the R2
value (or minimizing 1 – R2) by varying the parameters μ and σ, the solver add-in in Microsoft
Excel for Office 365 was used. The solver add-in used the GRG Nonlinear method for the
solution of the optimization problem.
To demonstrate the repeatability of PSD measurement, the PSD was measured for two samples
of the RTD6 experiment (Table 3). A comparison between the mean, variance and the R2 is
shown in Table 2 and comparison between the respective PSDs in Figure 3C. The mean and
variance were close, and the PSDs were in good agreement. Hence, it was thus concluded that
repeatable measurements were obtained using the present method. RTD6A was considered as the
base sample of the RTD6 experiment for further analysis.

13
v m
Inspection area
(B)
(A)

14
Figure 3: (A) Typical microscopic image of dried paracetamol crystal sample for RTD1
experiment with inspection area (B) Crystals in the magnified inspection area approximated
using oval shape (outlines marked in red) for estimating individual particle projected area (C)
Comparison between normalized PSD obtained using image analysis and through regression for
RTD6A and RTD6B
Table 2: Comparison between the mean, variance and R2 values measured for RTD6A and
RTD6B samples
Name Mean Variance R2
RTD6A 62.90 46.43 0.95
RTD6B 65.38 45.47 0.93
0
0.02
0.04
0.06
0.08
0.1
0.12
2.5 52.5 102.5 152.5 202.5 252.5 302.5
No
rmal
ized
Par
ticl
e Si
ze D
isti
rbu
tio
n
Particle Size (μm)
Image Analysis (RTD6A)
Best Fit (RTD6A)
Best Fit (RTD6B)
(C)
15
3. Results and discussion
When two streams containing a paracetamol solution and anti-solvent are mixed with each other,
the local concentration gradients within the mixture will reduce via mass transfer (convection,
shearing – folding and molecular diffusion) 7. In such systems, the rate of generation of
supersaturation is controlled by the extent of mixing - a superior mixing behavior leading to a
higher rate generation of supersaturation. In general, a higher initial level of supersaturation
implies a higher initial nucleation rate leading to the supersaturated solute getting deposited onto
a larger number of particle surfaces. As the same quantity of supersaturated solute is deposited
onto a larger number of particles, the effective mean size for crystallisation under high
supersaturation conditions is lower. Additionally, as mixing is faster, all the supersaturated solute
is consumed within a brief time period after the onset of crystallisation. Thus, prolonged
nucleation is suppressed thereby avoiding broad PSDs.
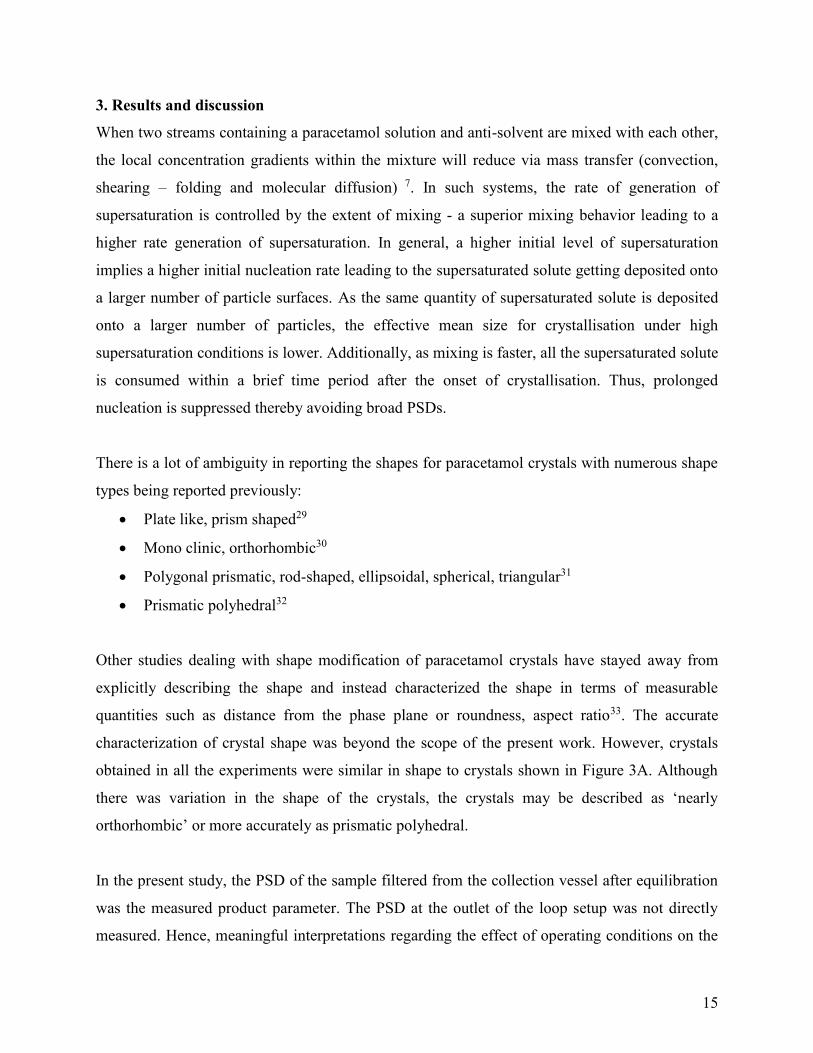
There is a lot of ambiguity in reporting the shapes for paracetamol crystals with numerous shape
types being reported previously:
Plate like, prism shaped29
Mono clinic, orthorhombic30
Polygonal prismatic, rod-shaped, ellipsoidal, spherical, triangular31
Prismatic polyhedral32
Other studies dealing with shape modification of paracetamol crystals have stayed away from
explicitly describing the shape and instead characterized the shape in terms of measurable
quantities such as distance from the phase plane or roundness, aspect ratio33. The accurate
characterization of crystal shape was beyond the scope of the present work. However, crystals
obtained in all the experiments were similar in shape to crystals shown in Figure 3A. Although
there was variation in the shape of the crystals, the crystals may be described as ‘nearly
orthorhombic’ or more accurately as prismatic polyhedral.
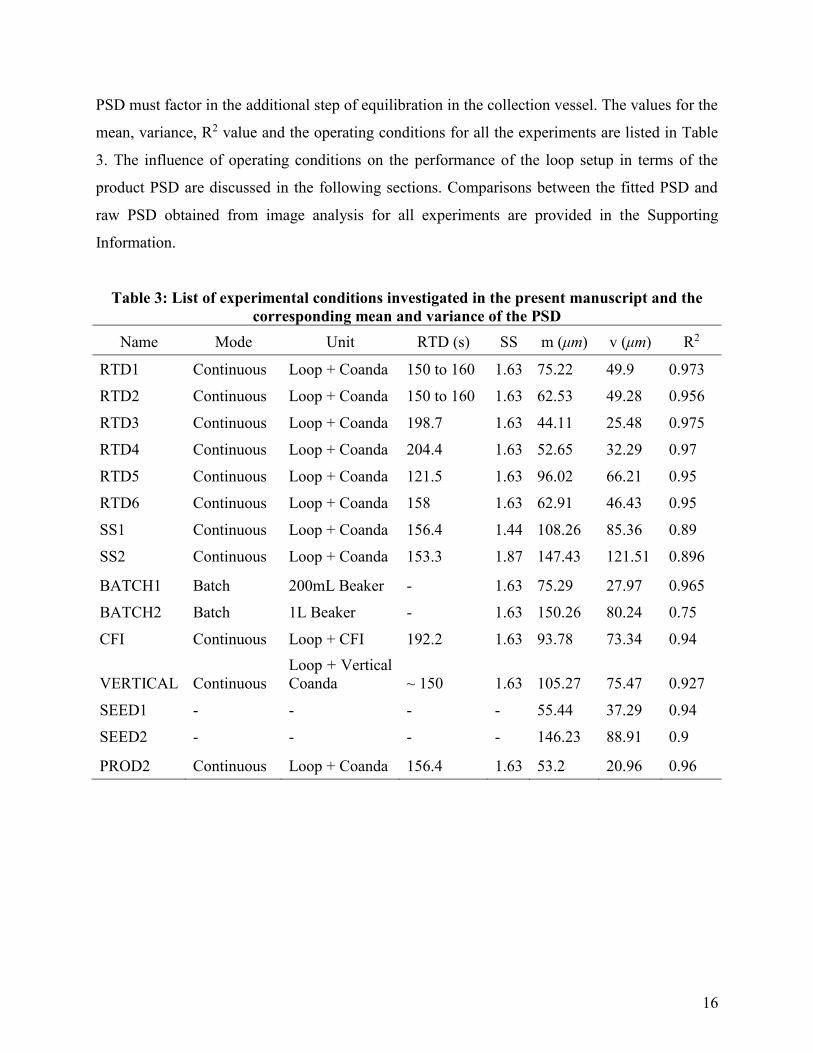
In the present study, the PSD of the sample filtered from the collection vessel after equilibration
was the measured product parameter. The PSD at the outlet of the loop setup was not directly
measured. Hence, meaningful interpretations regarding the effect of operating conditions on the
16
PSD must factor in the additional step of equilibration in the collection vessel. The values for the
mean, variance, R2 value and the operating conditions for all the experiments are listed in Table
3. The influence of operating conditions on the performance of the loop setup in terms of the
product PSD are discussed in the following sections. Comparisons between the fitted PSD and
raw PSD obtained from image analysis for all experiments are provided in the Supporting
Information.
Table 3: List of experimental conditions investigated in the present manuscript and the
corresponding mean and variance of the PSD
Name Mode Unit RTD (s) SS m (μm) v (μm) R2
RTD1 Continuous Loop + Coanda 150 to 160 1.63 75.22 49.9 0.973
RTD2 Continuous Loop + Coanda 150 to 160 1.63 62.53 49.28 0.956
RTD3 Continuous Loop + Coanda 198.7 1.63 44.11 25.48 0.975
RTD4 Continuous Loop + Coanda 204.4 1.63 52.65 32.29 0.97
RTD5 Continuous Loop + Coanda 121.5 1.63 96.02 66.21 0.95
RTD6 Continuous Loop + Coanda 158 1.63 62.91 46.43 0.95
SS1 Continuous Loop + Coanda 156.4 1.44 108.26 85.36 0.89
SS2 Continuous Loop + Coanda 153.3 1.87 147.43 121.51 0.896
BATCH1 Batch 200mL Beaker - 1.63 75.29 27.97 0.965
BATCH2 Batch 1L Beaker - 1.63 150.26 80.24 0.75
CFI Continuous Loop + CFI 192.2 1.63 93.78 73.34 0.94
VERTICAL Continuous
Loop + Vertical
Coanda ~ 150 1.63 105.27 75.47 0.927
SEED1 - - - - 55.44 37.29 0.94
SEED2 - - - - 146.23 88.91 0.9
PROD2 Continuous Loop + Coanda 156.4 1.63 53.2 20.96 0.96

17
3.1. Effect of Residence Time
The effect of residence time in the loop setup on the product PSD was investigated by varying
the combined inlet solution and anti-solvent flow rates (maintaining a 1:1 ratio). Experiments
were performed for loop residence times of 120 to 200s. It was seen that the experiments having
similar residence times (three experiments having RT = 150 to 160; two experiments with RT =
198.7s and 204.4s) had similar PSDs (Figure 4). Based on the results, it was said that the
experiments were repeatable with a reasonable error bar. Further, the RTD6 experiment was
performed to clear the ambiguity of whether crystal breakage was occurring during stirring or in
the peristaltic pump. It was observed that the PSDs for the two experiments having similar
operating conditions as RTD6 (RTD1, RTD2), matched the PSD for the RTD6 experiment
(Figure 4A). As the PSD was not affected, it was inferred that there was no effect of crystal
breakage due to the peristaltic pump or due to stirring.
0
0.002
0.004
0.006
0.008
0.01
0.012
0.014
0.016
0.018
0 50 100 150 200 250 300
No
rmal
ized
PSD
Particle Size (μm)
RTD1
RTD2
RTD6
(A)

18
Figure 4: Comparison between the (A) normalized PSDs for RTD1, RTD2 and RTD6 (B)
normalized PSDs for RTD1, RTD3, RTD4 and RTD5 and (C) mean, variance and R2 of fit for
the normalized particle size distribution profiles for effect of residence time experiments
0
0.005
0.01
0.015
0.02
0.025
0 50 100 150 200 250 300
No
rmal
ized
PSD
Particle Size (μm)
RTD1
RTD2
RTD3
RTD4
RTD5
(B)
0.9
0.91
0.92
0.93
0.94
0.95
0.96
0.97
0.98
0.99
1
0
10
20
30
40
50
60
70
80
90
100
RTD1 RTD2 RTD6 RTD3 RTD4 RTD5
R2
Part
icle
Siz
e (μm
)
Mean Variance R2
(C)

19
It was seen that for increasing residence times, the mean particle size decreased. Further, the
PSD was seen to be narrower (reduced variance). Supersaturation is the key driving force
governing product quality parameters like particle size and shape. In the present study, the outlet
of the loop setup was collected in a 5L batch crystalliser - used as a collection vessel after
passage through the loop setup. It was argued that for higher residence times, the mixture spent
more time in an enhanced mixing environment of the loop setup. Hence, for higher residence
times, the mixing between the solution and the anti-solvent had progressed further leading to a
higher overall initial supersaturation at the outlet of the loop setup. A higher initial
supersaturation lead to higher initial nucleation rates and hence a smaller mean particle size.
Additionally, an earlier onset of well mixed conditions would lead to a shortened nucleation and
growth period leading to narrower particle size distributions. Hence, improving the mixing
quality particularly for anti-solvent crystallization, would lead to smaller mean sizes and
narrower size distributions. Thus, from the experimental observations dealing with residence
time, it was inferred that the loop setup provided a superior (and tuneable) mixing performance
than a batch crystalliser. Further, it was observed that the R2 value for the regression was good
(>0.95) throughout all the data sets and was higher for increasing residence times. Thus, it was
inferred that the product PSD was increasingly better described by the lognormal distribution for
enhanced mixing conditions.
3.2. Effect of Supersaturation
Experiments were performed at supersaturation ratios of 1.44, 1.63 and 1.87 with the solution
and mixture compositions as described in Table 1. Flow rates corresponding to a residence time
of around 150s were considered for all the supersaturation experiments (exact values are
specified in Table 3). A comparison between the mean, variance, R2 value and the PSD for
different experiments is shown in Figure 5. It was observed that the mean particle size was seen
to be lowest for the intermediate supersaturation ratio of 1.63. The variance was also seen to be
the lowest for the intermediate supersaturation ratio. It was also observed that the R2 value of fit
for the lognormal distribution was close to one at this value of supersaturation ratio. The
observations of low mean size, narrow PSD and high value for R2 are consistent with each other
indicating better mixing/ crystallizer performance. Thus, it was observed that there was a definite
non-linear dependence of the mean PSD on the SSR. Results indicated an optimal SSR for the
20
anti-solvent crystallisation experiments although further elaborate experimentation would be
required to establish such a claim.
According to conventional rate laws for the quantitative prediction of secondary nucleation
(Mullin et. al., 2001), a higher supersaturation implied a higher nucleation rate. Consequently, as
the solute distributes onto a larger number of particles, the resulting mean particle size is lesser.
Hence, for increasing SSRs, it was expected that the mean particle size would reduce. However,
in the present work, instead of a monotonically decreasing trend in the mean particle size, a non-
linear dependence on the SSR was observed. One possible explanation to explain this counter-
intuitive trend would be to include the effect of mixing between solvent and anti-solvent. Even
though the theoretical supersaturation ratio was higher (1.87, Experiment SS2, Table 3), realizing
that SSR may be limited briefly during the initial nucleation period by mixing, resulting into a
higher mean particle size. However, further experimentation would be necessary to investigate
this claim of an optimal SSR.
3.3. Effect of Operational Mode and Scale-Up
Experiments were carried out at 200mL and 1L scales in a batch mode of operation for
comparison with the continuous mode of operation using the loop setup. For the 200mL case, a
simple 250mL beaker with a magnetic stirrer assembly was used (stirring speed of 400 RPM).
For the 1L case, a baffled 2.5L beaker with a corresponding magnetic stirrer assembly (stirring
speed of 400 RPM) was used. Adequate time was given to ensure the mixture had equilibrated
and the crystallization was completed. A comparison between the mean, variance, R2 value and
the PSD for the different experiments is shown in Figure 6.
It was observed that the 200mL batch scale resulted in a low mean particle size and the lowest
variance. This was expected as the mixing performance in low volume batch processes is very
good. However, as expected, the mixing performance worsened for increasing batch scale, with
the 1L scale batch process showing the worst mean and variance of the PSD. In the comparison,
the continuous mode of operation using the loop setup could process 3L of total mixture volume
with the mean particle size comparable to the 200mL batch process while the variance was
marginally higher. Further, it was observed that for conditions consistent with good mixing

21
performance (lower mean particle size, narrower PSD), a high R2 value of fit was obtained
(>0.95).
From the PSDs, it was inferred that during scale up, the mixing performance for stirred tanks
deteriorated due to increasing batch size and as a result the product quality also suffered. In
comparison, the loop setup with a single unit of the device provided three times the product
quantity as the 1L batch case in roughly the same amount of time and with a product quality
comparable to the 200mL batch case. Further, the continuous loop setup can be scaled up by
simply adding additional units of the device in series and increasing the inlet flow rates to
maintain the same residence time. Hence, it was concluded that the loop setup showed great
potential for scaled up continuous operation.
0
0.002
0.004
0.006
0.008
0.01
0.012
0.014
0 50 100 150 200 250 300
No
rmal
ized
PSD
Particle Size (μm)
RTD1
SS2
SS1
(A)
(B)

22
Figure 5: Comparison between the (A) normalized PSDs and (B) mean, variance and R2 of fit for
the normalized particle size distribution profiles for effect of supersaturation experiments
0.84
0.86
0.88
0.9
0.92
0.94
0.96
0.98
1
0
20
40
60
80
100
120
140
160
SS1 RTD1 SS2
R2
Par
ticl
e Si
ze (μm
)
Mean Variance R2
(B)
0
0.002
0.004
0.006
0.008
0.01
0.012
0.014
0.016
0.018
0.02
0 50 100 150 200 250 300
No
rmal
ized
PSD
Particle Size (μm)
Batch (1L Scale)
Batch (200mL Scale)
Seed Sample
RTD1
(A)

23
Figure 6: Comparison between the (A) normalized PSDs and (B) mean, variance and R2 of fit for
the normalized particle size distribution profiles for batch scale experiments and a continuous
experiment
3.4. Effect of Fluidic Device and Device Orientation
Experiments were performed by replacing the fluidic device in the loop setup using a coiled flow
inverter (CFI) and by positioning the present fluidic device in a vertical orientation. An image of
the CFI used in the present study and the corresponding dimensions are listed in Section S5 of
the Supporting Information. In a vertical orientation of the present device, one arm would be
above the inlet and the second, below the inlet. The vertical orientation was tested as it was
expected to have a different solid residence time distribution than the horizontal orientation (both
arms and inlet in the same horizontal plane) due to gravitational forces on individual particles.
The residence times considered for the experiments were around 150s for the vertical orientation
of the fluidic device and 192.2s for the CFI. A comparison between the mean, variance, R2 value
and the PSD for the different experiments is shown in Figure 7.
0.6
0.65
0.7
0.75
0.8
0.85
0.9
0.95
1
0
20
40
60
80
100
120
140
160
SEED BATCH1 BATCH2 RTD1
R2
Par
ticl
e Si
ze (μm
)
Mean Variance R2
(B)

24
Figure 7: Comparison between the (A) normalized PSDs and (B) mean, variance and R2 of fit for
the normalized particle size distribution profiles for effect of supersaturation experiments
0
0.002
0.004
0.006
0.008
0.01
0.012
0.014
0 50 100 150 200 250 300
No
rmal
ized
PSD
Particle Size (μm)
RTD1
Vertical
CFI
(A)
0.88
0.9
0.92
0.94
0.96
0.98
1
0
20
40
60
80
100
120
RTD1 CFI VERTICAL
R2
Part
icle
Siz
e (μm
)
Mean Variance R2
(B)

25
It was observed that the horizontal orientation (RTD1) of the present fluidic device gave the
lowest mean particle size and the narrowest PSD amongst the three scenarios considered. Further
the present device was seen to perform better than the CFI even for a lower residence time
indicating that the present device is more efficient in terms of mixing than the CFI. Also, it was
observed that for conditions consistent with improved mixing (lower mean size, narrower PSD),
the R2 value of fit was higher while maintaining a high R2 value throughout all experiments.
3.5. Effect of Seed Size
Experiments were carried out using two different seed PSDs in the loop setup while maintaining
the other operating conditions. A comparison between the mean, variance, R2 value and the PSD
for the different experiments is shown in Figure 8. It was observed that for a higher mean seed
size, a smaller mean particle size and a narrower PSD was obtained. The R2 values for both the
experimental conditions was observed to be high (>0.95).
As mentioned previously, the seeding strategy was used to hasten the onset of nucleation
typically at supersaturation ratios where homogeneous nucleation was insignificant. Also, lower
levels of supersaturation ratios were used to avoid problems related to encrustation/blockages.
Secondary nucleation was deemed as the primary source of new particles and occurred either due
to impact and particles chipping off from existing crystal surfaces15,16 or due to crystal
breeding16. In either case, particles formed due to secondary nucleation grow and later
themselves contribute as seeds. Due to this, the onset of nucleation is followed by an exponential
growth in the number of particles - or a period of ‘significant secondary nucleation’ in which
period most (on a weight basis) of the supersaturated solute is consumed.
A consequence of having seed particles with a higher mean particle size but the same seed
loading (0.5% of total weight of the mixture) was that the total number of seed particles was
lesser. Thus, it was possible that having a lesser number of particles to start with would a delay
in the period of ‘significant secondary nucleation’. In this delay time, it was possible that the
mixing progressed to a higher extent before significant nucleation initiated and as inferred
before, a higher extent of initial supersaturation lead to lower particle sizes and narrower PSDs.
Thus, even though the observation of lower mean particle size and narrower PSD for a larger

26
mean seed size with a broader PSD seemed counter-intuitive, it can be rationally explained
through the interplay of mixing and secondary nucleation.
0
0.005
0.01
0.015
0.02
0.025
0 50 100 150 200 250 300
No
rmal
ized
PSD
Particle Size (μm)
Seed Sample 1
RTD1
Seed Sample 2
Product 2
(A)
0.84
0.86
0.88
0.9
0.92
0.94
0.96
0.98
1
0
20
40
60
80
100
120
140
160
SEED1 RTD1 SEED2 PROD2
R2
Part
icle
Siz
e (μm
)
Mean Variance R2
(B)

27
Figure 8: Comparison between the (A) normalized PSDs and (B) mean, variance and R2 of fit for
the normalized particle size distribution profiles for effect of seed size experiments
3.6. Mixing, Secondary Nucleation and R2
To enable a convenient comparison across different experimental data sets, the experimental
PSD obtained through image analysis was fitted using a log normal distribution. The R2 value of
fit between the normalized experimental PSD and the corresponding lognormal distribution was
maximized (closest to 1) through optimization of two lognormal distribution parameters
(Equation 1). Throughout the present study, it was observed that the R2 value was consistently
high (>0.9) for conditions of enhanced mixing (inferred from the mean and variance of the PSD)
and low (~0.7 - 0.8) for conditions of relatively poor mixing.
It should be noted that the R2 value by itself cannot give an insight into the mean and the
variance of the PSD but the goodness of fit to a lognormal distribution can give an insight into
mechanisms prevailing at good mixing. It was clear from the present study that mixing was one
of the most important factors affecting the product quality especially for anti-solvent
crystallisation. As discussed in the effect of seed size section, understanding of crystallisation
processes is often complicated due to an inter-play of mixing (possibly micro-mixing) and
secondary nucleation. Both phenomena are not well-understood and need to be decoupled for
any meaningful interpretation. This is to say that for any meaningful interpretation of secondary
nucleation, one must first ensure that mixing is sufficiently rapid in comparison.
Theories for secondary nucleation suggest either an impact mechanism15,16, or more recently, a
crystal breeding mechanism16. In the crystal breeding mechanism, it was proposed that the new
‘daughter crystals’ form on the surfaces of the bigger ‘parent crystals’ through the mechanisms
of heterogeneous nucleation and growth. These ‘daughter crystals’ after sufficient growth detach
from the ‘parent crystals’ due to fluid shear. The freshly detached ‘daughter crystals’ would
themselves form the ‘parent crystals’ and eventually be breeding grounds for new ‘daughter
crystals’. In the impact mechanism for secondary nucleation, it was proposed that new nuclei are
formed due to crystal breakage resulting from particle-particle or particle-impeller collisions. In
the present study, it was observed that even without moving parts, secondary nucleation was still

28
the primary source of nucleation which suggested that the impact theory may not be the likely
mechanism.
Adequate description of the PSD with a lognormal distribution was consistent with similar
observations in biology or ecology to describe growth of organisms or the population of species,
for growth of users and websites on the Internet in computer science and in various other
disciplines26. In all these systems, a recurring theme was a ‘parent-daughter’ dynamic as
described in biological systems, where in the parent entity (crystals, organisms, internet users,
websites etc.) gave ‘birth’ to new daughter entities which grow and themselves became parent
entities. Thus, it can be argued that the findings of the present study seek to promote crystal
breeding type of a mechanism for secondary nucleation. However, the present study does not
definitively address the mechanism for secondary nucleation and further experimentation and
analysis would be necessary to bolster such a claim.
The work on detailed crystallization model integrated with the multiphase CFD model (using the
work of Khalde et al., 201913 as a starting point) was initiated and will be presented separately.
Such a study would be helpful to quantitatively capture the impact of mixing on crystallisation.
The results presented in this work provide adequate data to evaluate and validate such
computational models. The approach and the methodology will be useful to further develop
fluidic oscillators as a robust platform for continuous crystallization without any moving parts.
4. Conclusions
The present work dealt with the feasibility evaluation of a fluidic oscillator as a continuous
crystalliser. A novel loop setup was proposed which enabled the ‘flow activated’ operation of
high throughput fluidic devices at lab scale throughputs. The seeded anti-solvent crystallisation
of paracetamol using water as the anti-solvent and a water-methanol mixture as the solvent was
considered. The effects of residence time, supersaturation ratio, operational mode, scale-up,
fluidic device, device orientation and seed size on the product PSD were investigated.
It was found that the extent of mixing played a big role in determining product quality –
enhanced mixing leading to narrower PSDs and smaller mean particle sizes. Increasing the

29
residence time spent by the fluid in the loop setup was seen to reduce the mean sizes and lead to
narrower PSDs. It was observed that there was a definite non-linear dependence of the mean
PSD on the SSR. Results indicated a possible optimum SSR in terms of obtaining smaller mean
sizes and narrower PSDs, although elaborate experimentation would be necessary to prove such
a claim.
Increasing batch scale resulted in an increased mean size and broader PSDs. In contrast,
continuous processing allowed for 3 times the volume processed by the 1L batch scale in roughly
the same time while maintaining the mean particle size obtained in the 200mL batch scale. Thus,
the advantages of continuous processing in terms of reduction in process times, enhanced mixing
performance and improved scalability were successfully realized.
A higher mean seed size with a broader PSD was found to result in a product with a smaller
mean size and a narrower PSD. This appeared to be due to the interplay between the mixing and
the late onset of ‘significant secondary nucleation’ caused due by a lesser overall number of seed
particles resulting from an increased seed size.
It was found that the R2 value of fit between the PSD obtained through image analysis and the
log-normal distribution obtained through regression of the PSD increased for enhanced mixing
behavior. This description of the PSD was consistent with a ‘parent-daughter’ dynamic of cell
populations observed in biological systems. Further, in the present study, even though there were
no moving parts, secondary nucleation was the main source of nuclei and hence the impact
mechanism for the secondary nucleation was not deemed likely. The results indicated that crystal
breeding was a more likely mechanism for secondary nucleation although further
experimentation would be necessary to establish such a claim.
Acknowledgements
The present investigation is supported by a Proof of Concept project (R3021CCE) funded by the
InvestNI organization in Northern Ireland, UK. The authors would like to thank InvestNI for
providing the funding to enable the present research.

30
Supporting Information
S1. Dimensions of the Fluidic Oscillator, S2. Particle Size Distributions for Effect of Residence
Time Experiments, S3. Particle Size Distributions for Supersaturation Experiments, S4. Particle
Size Distributions for Effect of Operational Mode and Scale Up Experiments, S5. Dimensions of
Coiled Flow Inverter, S6. Particle Size Distributions for Effect of Fluidic Device and Orientation
Experiments, S7. Particle Size Distributions for Effect of Seed Size Experiments
References
1. Su, Q., Rielly, C. D., Powell, K. A., & Nagy, Z. K. (2017). Mathematical modelling and
experimental validation of a novel periodic flow crystallization using MSMPR
crystallizers. AIChE Journal, 63(4), 1313–1327. https://doi.org/10.1002/aic.15510
2. Wang, T., Lu, H., Wang, J., Xiao, Y., Zhou, Y., Bao, Y., & Hao, H. (2017). Recent
progress of continuous crystallization. Journal of Industrial and Engineering Chemistry,
54, 14–29. https://doi.org/10.1016/j.jiec.2017.06.009
3. Besenhard, M. O., Neugebauer, P., Ho, C. Da, & Khinast, J. G. (2015). Crystal size
control in a continuous tubular crystallizer. Crystal Growth and Design, 15(4), 1683–
1691. https://doi.org/10.1021/cg501637m
4. Zhao, Y., Kamaraju, V. K., Hou, G., Power, G., Donnellan, P., & Glennon, B. (2015).
Kinetic identification and experimental validation of continuous plug flow crystallisation.
Chemical Engineering Science, 133, 106–115. https://doi.org/10.1016/j.ces.2015.02.019
5. Gao, Z., Rohani, S., Gong, J., & Wang, J. (2017). Recent Developments in the
Crystallization Process: Toward the Pharmaceutical Industry. Engineering, 3(3), 343–
353. https://doi.org/10.1016/J.ENG.2017.03.022
6. Wiedmeyer, V., Anker, F., Bartsch, C., Voigt, A., John, V., & Sundmacher, K. (2017).
Continuous Crystallization in a Helically Coiled Flow Tube: Analysis of Flow Field,
Residence Time Behavior, and Crystal Growth. Industrial and Engineering Chemistry
Research, 56(13), 3699–3712. https://doi.org/10.1021/acs.iecr.6b04279
7. Ranade, V. V. (2001). Computational Flow Modeling for Chemical Reactor Engineering
(1st Edition). Academic Press, London.
8. Griffin, D. W., Mellichamp, D. A., & Doherty, M. F. (2010). Reducing the mean size of
API crystals by continuous manufacturing with product classification and recycle.
Chemical Engineering Science, 65(21), 5770–5780.
https://doi.org/10.1016/j.ces.2010.05.026
9. Ridder, B. J., Majumder, A., & Nagy, Z. K. (2014). Population balance model-based
multiobjective optimization of a multisegment multiaddition (MSMA) continuous plug-
flow antisolvent crystallizer. Industrial and Engineering Chemistry Research, 53(11),
4387–4397. https://doi.org/10.1021/ie402806n
10. Jiang, M., Zhu, Z., Jimenez, E., Papageorgiou, C. D., Waetzig, J., Hardy, A., Langston,
A., & Braatz, R. D. (2014). Continuous-flow tubular crystallization in slugs
spontaneously induced by hydrodynamics. Crystal Growth and Design, 14(2), 851–860.
https://doi.org/10.1021/cg401715e

31
11. Lawton, S., Steele, G., Shering, P., Zhao, L., Laird, I., & Ni, X. (2009). Continuous
Crystallization of Pharmaceuticals Using a Continuous Oscillatory Baffled Crystallizer.
Organic Process Research & Development, 13(6), 1357–1363.
12. Xu, C., & Chu, Y. (2015). Experimental study on oscillating feedback micromixer for
miscible liquids using the Coanda Effect. AIChE Journal, 61(3), 1054–1063.
https://doi.org/10.1002/aic.14702
13. Khalde, C. M., Pandit, A. V., Sangwai, J. S., & Ranade, V. V. (2019). Flow, mixing, and
heat transfer in fluidic oscillators. Canadian Journal of Chemical Engineering, 97(2).
https://doi.org/10.1002/cjce.23377
14. Wang, J., & Xu, C. (2014). Mini liquid-liquid extractor without moving parts based on
the coanda effect. Chemical Engineering and Technology, 37(3), 535–542.
https://doi.org/10.1002/ceat.201300706
15. Mullin, J. W. (2001). Crystallization (4th Edition). Butterworth-Heinemann, Oxford.
16. De Souza, B., Cogoni, G., Tyrrell, R., & Frawley, P. J. (2016). Evidence of Crystal
Nuclei Breeding in Laboratory Scale Seeded Batch Isothermal Crystallization
Experiments. Crystal Growth and Design, 16(6), 3443–3453.
https://doi.org/10.1021/acs.cgd.6b00407
17. Majumder, A., & Nagy, Z. K. (2015). Dynamic modeling of encrust formation and
mitigation strategy in a continuous plug flow crystallizer. Crystal Growth and Design,
15(3), 1129–1140. https://doi.org/10.1021/cg501431c
18. Brown, C. J., Adelakun, J. A., & Ni, X. wei. (2015). Characterization and modelling of
antisolvent crystallization of salicylic acid in a continuous oscillatory baffled crystallizer.
Chemical Engineering and Processing: Process Intensification, 97, 180–186.
https://doi.org/10.1016/j.cep.2015.04.012
19. Powell, K. A. (2017). Improving continuous crystallisation using process analytical
technologies: design of a novel periodic flow process. PhD Thesis. Loughborough
University.
20. Onyemelukwe, I. I. (2019). Investigating approaches to continuous crystallisation using
process-analytical technology: establishment of a steady-state cooling crystallisation
process. PhD Thesis. Loughborough University.
21. Ó’Ciardhá, C. T., Frawley, P. J., & Mitchell, N. A. (2011). Estimation of the nucleation
kinetics for the anti-solvent crystallisation of paracetamol in methanol/water solutions.
Journal of Crystal Growth, 328(1), 50–57. https://doi.org/10.1016/j.jcrysgro.2011.06.017
22. Wong, S. Y., Tatusko, A. P., Trout, B. L., & Myerson, A. S. (2012). Development of
continuous crystallization processes using a single-stage mixed-suspension, mixed-
product removal crystallizer with recycle. Crystal Growth and Design, 12(11), 5701–
5707. https://doi.org/10.1021/cg301221q
23. Ferguson, S., Ortner, F., Quon, J., Peeva, L., Livingston, A., Trout, B. L., & Myerson, A.
S. (2014). Use of continuous MSMPR crystallization with integrated nanofiltration
membrane recycle for enhanced yield and purity in API crystallization. Crystal Growth
and Design, 14(2), 617–627. https://doi.org/10.1021/cg401491y
24. Cogoni, G., de Souza, B. P., & Frawley, P. J. (2015). Particle Size Distribution and yield
control in continuous Plug Flow Crystallizers with recycle. Chemical Engineering
Science, 138, 592–599. https://doi.org/10.1016/j.ces.2015.08.041

32
25. Li, J., Trout, B. L., & Myerson, A. S. (2016). Multistage Continuous Mixed-Suspension,
Mixed-Product Removal (MSMPR) Crystallization with Solids Recycle. Organic Process
Research and Development, 20(2), 510–516. https://doi.org/10.1021/acs.oprd.5b00306
26. Mitzenmacher, M. (2004). A brief history of lognormal and power law distributions.
Internet Mathematics, 1(2), 226–251.
27. Mood, A. M., F. A. Graybill, and D. C. Boes. Introduction to the Theory of Statistics. 3rd
ed., New York: McGraw-Hill, 1974. pp. 540–541.
28. Evans, M., N. Hastings, and B. Peacock. Statistical Distributions. 2nd ed., Hoboken, NJ:
John Wiley & Sons, Inc., 1993.
29. Shekunov, B. Y., Aulton, M. E., Adama-Acquah, R. W., & Grant, D. J. W. (1996). Effect
of temperature on crystal growth and crystal properties of paracetamol. Journal of the
Chemical Society - Faraday Transactions, 92(3), 439–444.
30. Al-Zoubi, N., Nikolakakis, I., & Malamataris, S. (2002). Crystallization conditions and
formation of orthorhombic paracetamol from ethanolic solution. Journal of Pharmacy and
Pharmacology, 54(3), 325–333.
31. Mbang N. Femi-Oyewo, M.S. Spring, Studies on paracetamol crystals produced by
growth in aqueous solutions, International Journal of Pharmaceutics, Volume 112, Issue
1, 1994, Pages 17-28.
32. Garekani, H. A., Ford, J. L., Rubinstein, M. H., & Rajabi-Siahboomi, A. R. (1999).
Formation and compression characteristics of prismatic polyhedral and thin plate-like
crystals of paracetamol. International Journal of Pharmaceutics, 187(1), 77–89.
https://doi.org/10.1016/S0378-5173(99)00157-X
33. Lovette, M. A., Muratore, M., & Doherty, M. F. (2012). Crystal shape modification
through cycles of dissolution and growth: Attainable regions and experimental validation.
AIChE Journal, 58(5), 1465–1474. https://doi.org/10.1002/aic.12707
34. W. L. McCabe, J. C. Smith, O. Harriott, Unit Operations of Chemical Engineering,
Seventh Edition, McGraw Hill (2005), New York.
35. Poovelil, C. (2019). Design of a near Plug-Flow Crystalliser. Master’s Thesis. Queen’s
University.

33
TOC Graphic