fluidized bed solids management: how knowledge of fundamentals can help optimize plant operations
TRANSCRIPT
Fluidized Bed Solids Management: How Knowledge of Fundamentals can Help
Optimize Plant Operations
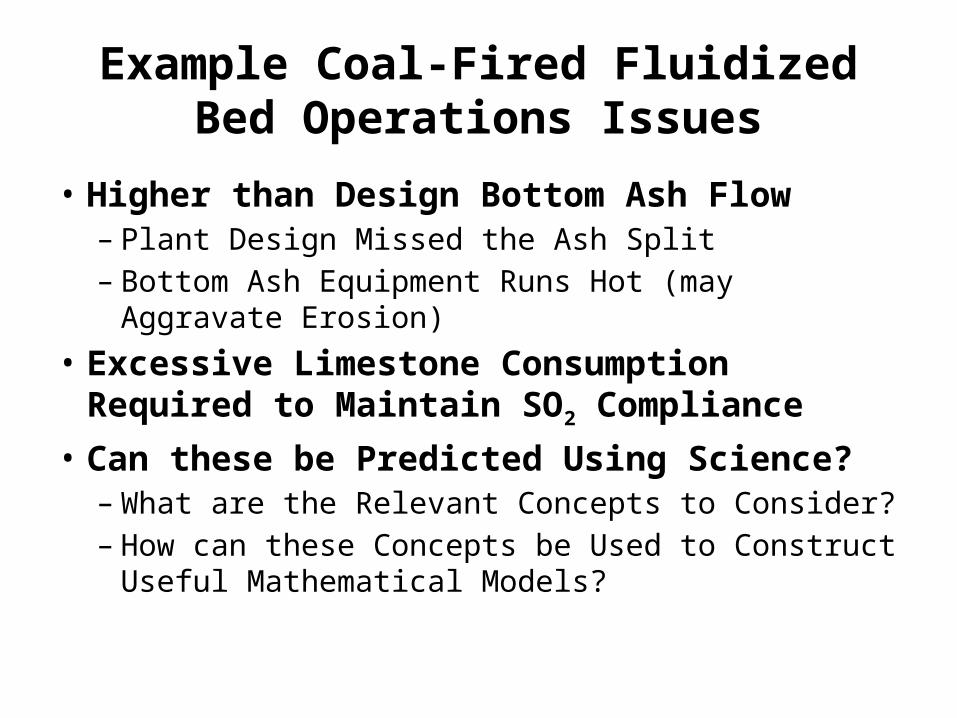
Example Coal-Fired Fluidized Bed Operations Issues
• Higher than Design Bottom Ash Flow– Plant Design Missed the Ash Split– Bottom Ash Equipment Runs Hot (may Aggravate
Erosion)
• Excessive Limestone Consumption Required to Maintain SO2 Compliance
• Can these be Predicted Using Science?– What are the Relevant Concepts to Consider?– How can these Concepts be Used to Construct Useful
Mathematical Models?
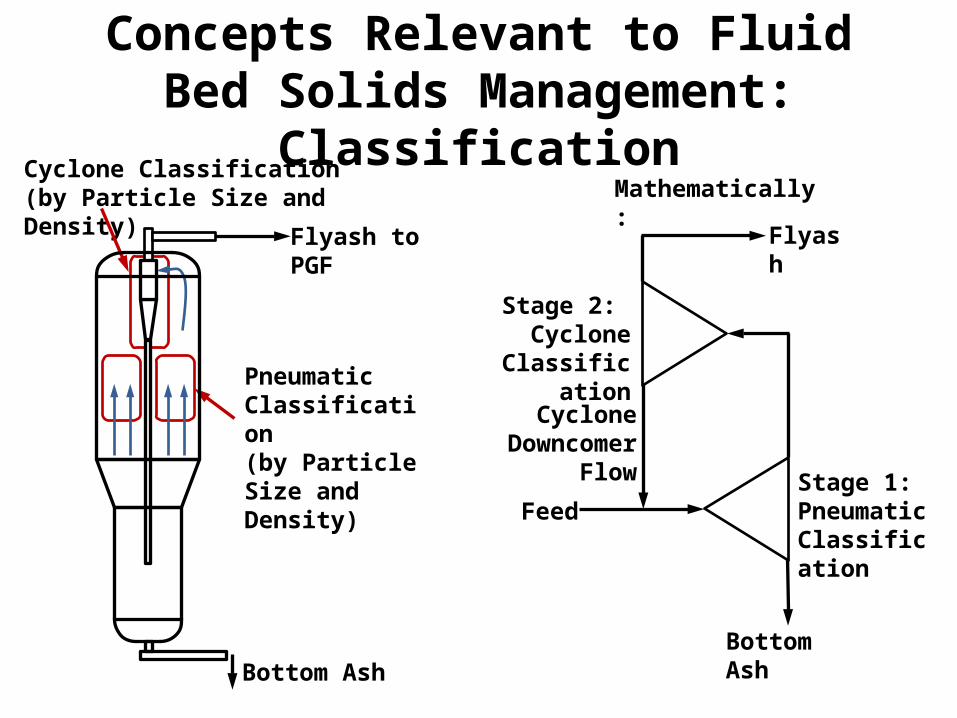
Concepts Relevant to Fluid Bed Solids Management: Classification
Flyash to PGF
Pneumatic Classification(by Particle Size and Density)
Cyclone Classification(by Particle Size and Density)
Bottom Ash
Cyclone Downcomer
Flow
FeedStage 1: PneumaticClassification
Stage 2: Cyclone
Classification
Flyash
Bottom Ash
Mathematically:
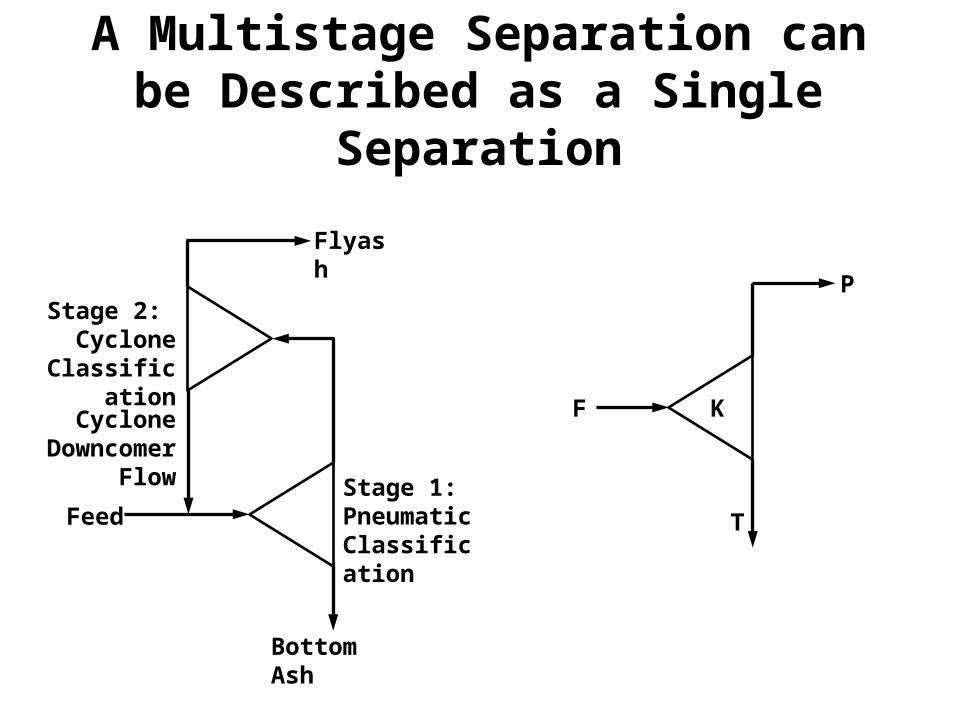
A Multistage Separation can be Described as a Single Separation
Cyclone Downcomer
Flow
FeedStage 1: PneumaticClassification
Stage 2: Cyclone
Classification
Flyash
Bottom Ash
F
P
T
K

Mathematical Description of Classification
F
P
T
KK(x)
Particle Size (x)
F(x): The Mass Fraction of Particles of Size x in FeedK(x): The Mass Fraction of Particles of Size x in Feed that Report to the P Stream
nx
xxFxKP
1)()(
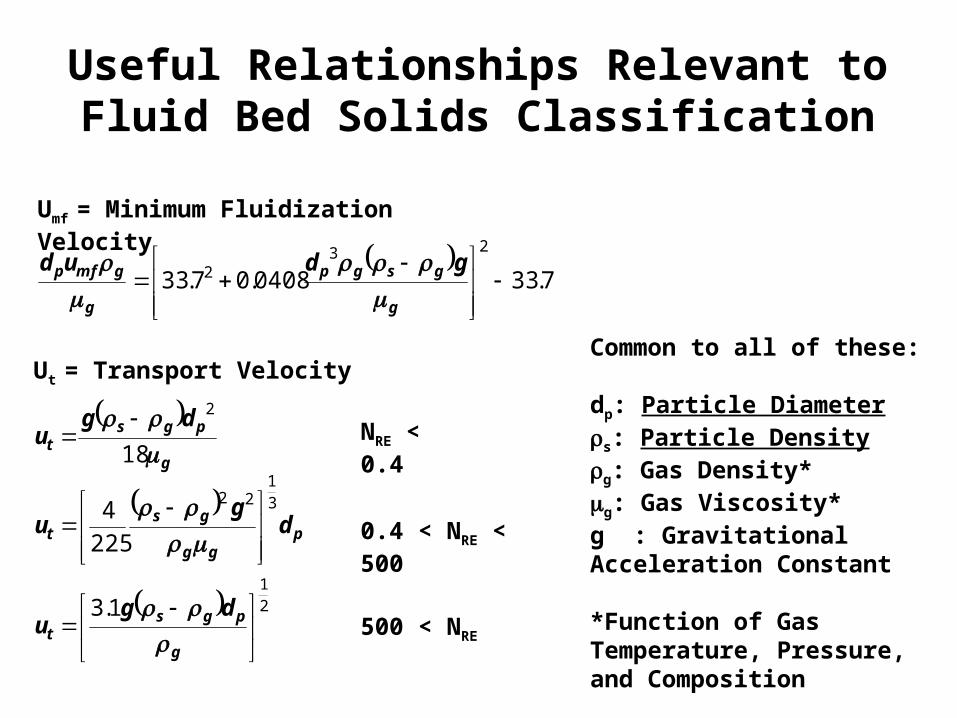
Useful Relationships Relevant to Fluid Bed Solids Classification
7.330408.07.33
232
g
gsgp
g
gmfp gdud
Umf = Minimum Fluidization Velocity
g
pgst
dgu
18
2
p
gg
gst d
gu
31
22
2254
21
1.3
g
pgst
dgu
Ut = Transport Velocity
NRE < 0.4
0.4 < NRE < 500
500 < NRE
Common to all of these:
dp: Particle Diameterrs: Particle Densityrg: Gas Density*mg: Gas Viscosity*g : Gravitational Acceleration Constant
*Function of Gas Temperature, Pressure, and Composition
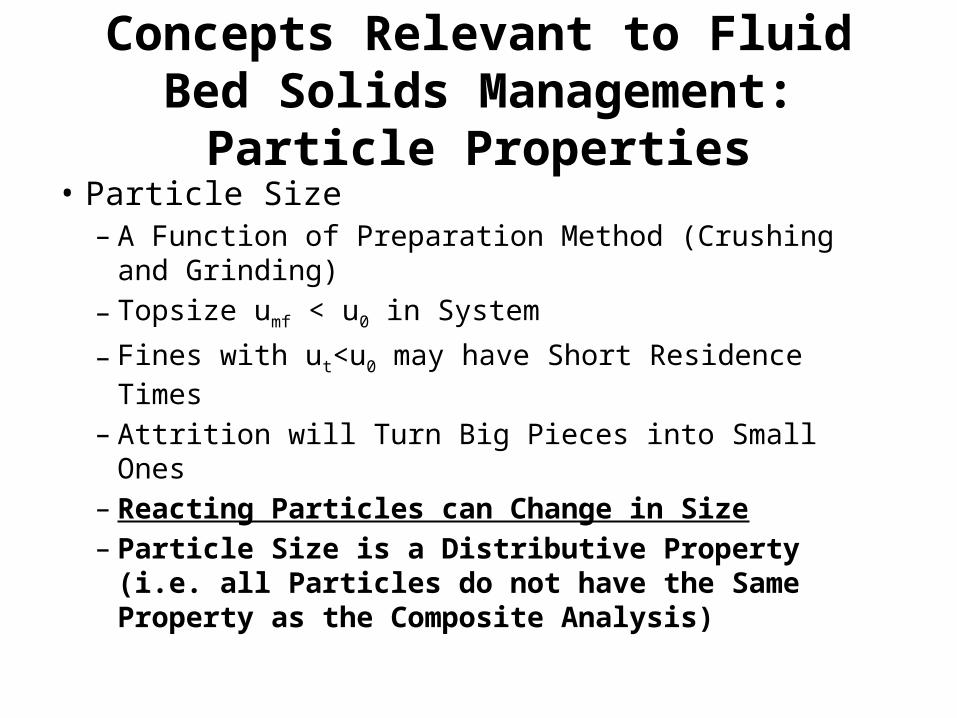
• Particle Size– A Function of Preparation Method (Crushing and
Grinding)
– Topsize umf < u0 in System
– Fines with ut<u0 may have Short Residence Times
– Attrition will Turn Big Pieces into Small Ones– Reacting Particles can Change in Size– Particle Size is a Distributive Property (i.e. all
Particles do not have the Same Property as the Composite Analysis)
Concepts Relevant to Fluid Bed Solids Management: Particle Properties
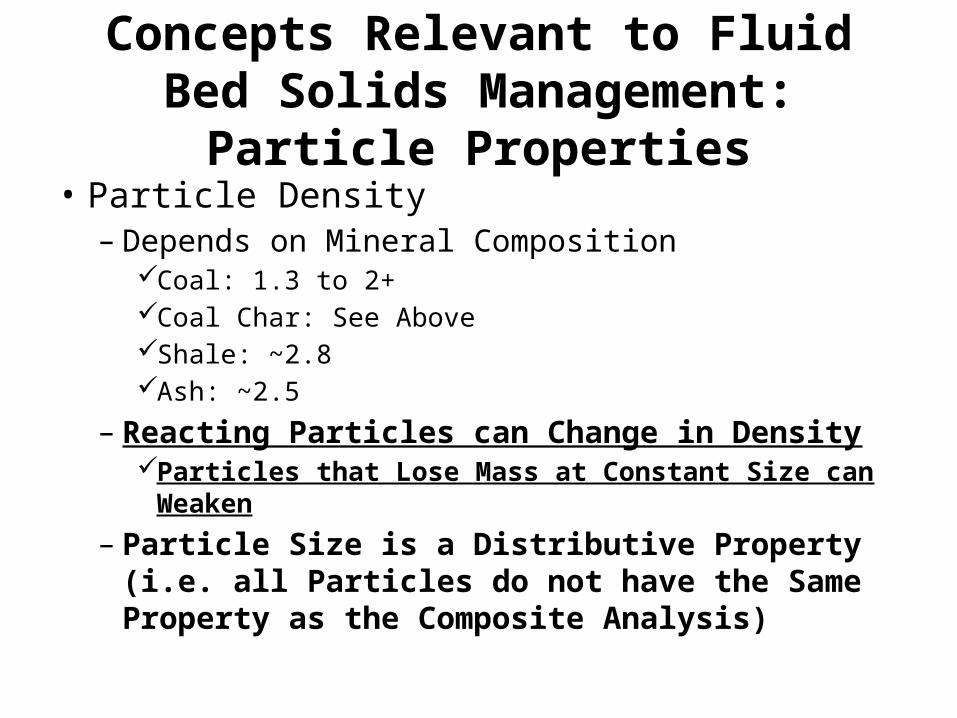
• Particle Density– Depends on Mineral Composition
Coal: 1.3 to 2+Coal Char: See AboveShale: ~2.8Ash: ~2.5
– Reacting Particles can Change in DensityParticles that Lose Mass at Constant Size can Weaken
– Particle Size is a Distributive Property (i.e. all Particles do not have the Same Property as the Composite Analysis)
Concepts Relevant to Fluid Bed Solids Management: Particle Properties
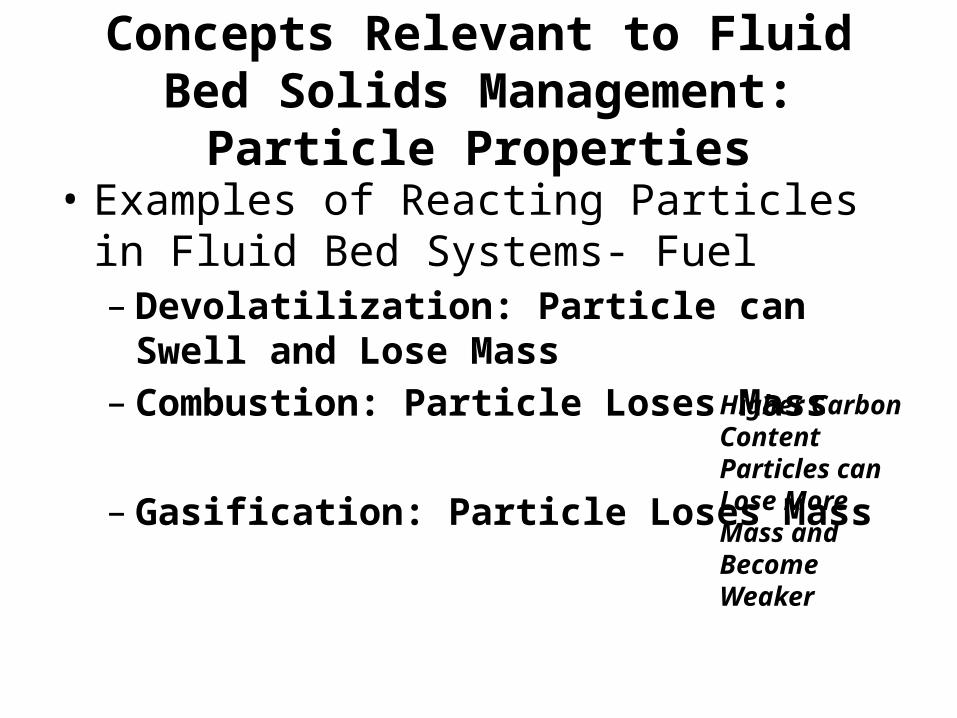
• Examples of Reacting Particles in Fluid Bed Systems- Fuel– Devolatilization: Particle can Swell and Lose
Mass– Combustion: Particle Loses Mass
– Gasification: Particle Loses Mass
Concepts Relevant to Fluid Bed Solids Management: Particle Properties
Higher Carbon Content Particles can Lose More Mass and Become Weaker

• Examples of Reacting Particles in Fluid Bed Systems- Limestone– Calcination: Particle Loses Mass
– Sulfation: Particle Gains Mass
Concepts Relevant to Fluid Bed Solids Management: Particle Properties
Calcination Weakens Particles
Bed Solids Reaction with Acid Gas Species: Analogous to Carbonation Reaction in the DMR
Concepts Relevant to Fluid Bed Solids Management: Attrition
• Attrition Turns Bigger Pieces into Smaller Pieces
• Function of:– Particle Strength– Kinetic Energy Associated with Particle Collisions
• Particle Strength–May not Change in Non-Reacting Particles–May Change in Reacting Particles

Concepts Relevant to Fluid Bed Solids Management: Attrition
Attrition Conventions (Non-Reacting Particles)
Collision
Collision
Abrasion: Very Fine Particles are Removed from “Mother Particle”
Fragmentation: Breakage Products Closer in Size to Original Particle

Concepts Relevant to Fluid Bed Solids Management: Attrition
Attrition Conventions (Reacting Particles)
Collision
Percolation: Particle Uniformly Loses Mass at Constant Size (Reaction under Kinetic Control)
Peripheral Percolation: Particle Loses Mass with a Shrinking Core (Reaction under Mixed Kinetic and Diffusion Control)
Collision
• A Fluid Bed System can Classify Particles into Output Streams
• Particle Properties Relevant to Classification:– Size– Density
• Particle Size Changes Due to Attrition• Reacting Particles Can Behave Differently
from Non-Reacting Particles
Concepts Relevant to Fluid Bed Solids Management: Recap So Far
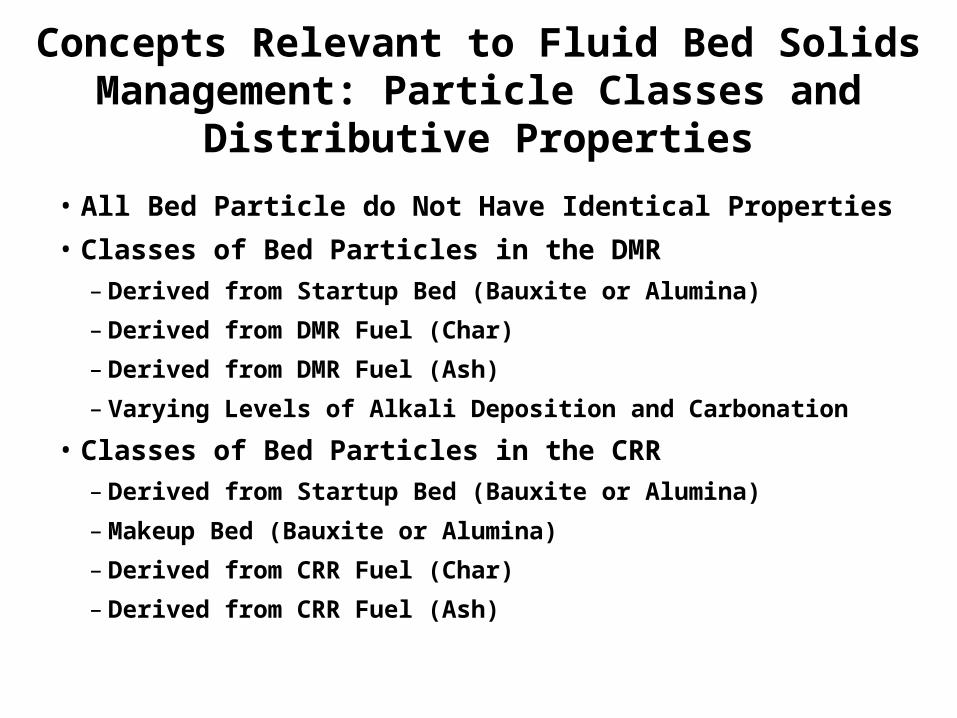
• All Bed Particle do Not Have Identical Properties
• Classes of Bed Particles in the DMR
– Derived from Startup Bed (Bauxite or Alumina)
– Derived from DMR Fuel (Char)
– Derived from DMR Fuel (Ash)
– Varying Levels of Alkali Deposition and Carbonation
• Classes of Bed Particles in the CRR
– Derived from Startup Bed (Bauxite or Alumina)
– Makeup Bed (Bauxite or Alumina)
– Derived from CRR Fuel (Char)
– Derived from CRR Fuel (Ash)
Concepts Relevant to Fluid Bed Solids Management: Particle Classes and Distributive Properties

All Particles are Not the Same as the Composite Analysis- Even within a Particle Class
This is What 8% Ash Coal Looks Like to a Fluidized Bed
Density Fractions
Size
Fra
ctio
ns

How the Density Distribution of Fuel Affects Attrition Behavior
Flyash Sized Pieces
Bottom Ash Sized Pieces

Ground Pittsburgh Bed Coal1.3 Float Fraction
47.8 % of the FuelAsh Analysis:
48.94% SiO2
2.6 wt% Ash26.76% Al2O3
10.71% Fe2O3
14.1 wt% of Ash in Composite Fuel3.56% CaO
0.95% MgO
51.2% of Combustibles in Fuel0.44% Na2O
1.49% K2O

Ground Pittsburgh Bed Coal1.6 by 2.6 Fraction
3.5 % of the FuelAsh Analysis:
54.65% SiO2
52.6 wt% Ash21.10% Al2O3
15.36% Fe2O3
20.1 wt% of Ash in Composite Fuel2.82% CaO
0.72% MgO
1.8% of Combustibles in Fuel0.34% Na2O
1.71% K2O
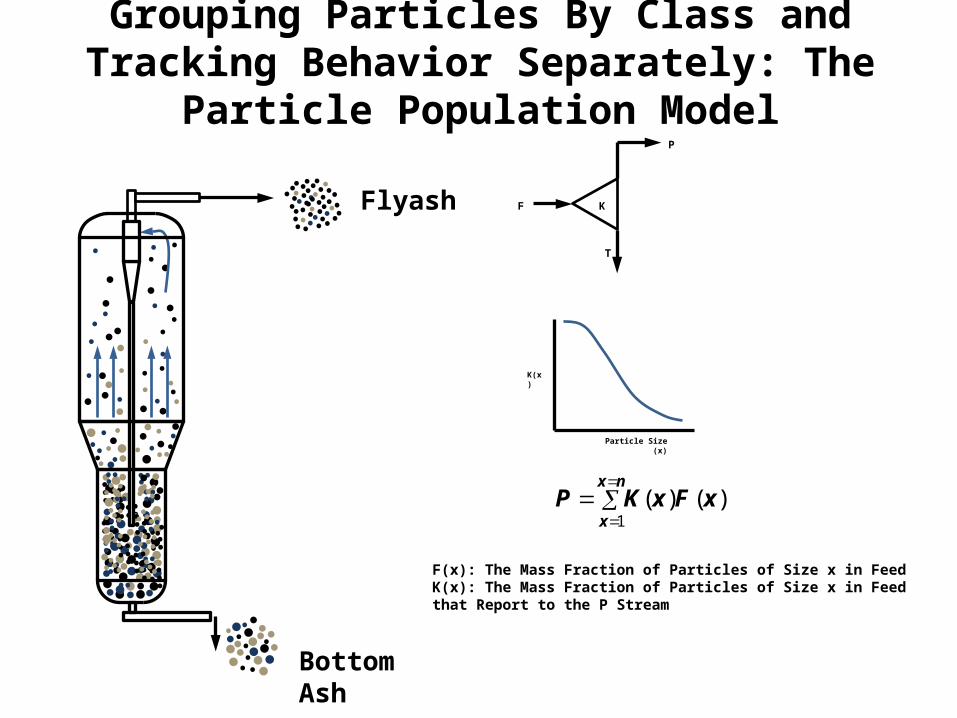
Grouping Particles By Class and Tracking Behavior Separately: The Particle Population Model
F
P
T
K
K(x)
Particle Size (x)
F(x): The Mass Fraction of Particles of Size x in FeedK(x): The Mass Fraction of Particles of Size x in Feed that Report to the P Stream
nx
xxFxKP
1)()(
Flyash
Bottom Ash

Grouping Particles By Class and Tracking Behavior Separately: The Particle Population Model
Q: This has sum notation, which is almost as bad as integrals. It must be complicated. We don’t have time to learn this.A: Here is the sum button in Excel
nx
xxFxKP
1)()(

The Particle Population Model: Development and Use
Examples from Commercial CFB Boilers (Larger and more Complicated than the IWTU)• Starting the Model:
Feed Solids
TransformationsComposite Ash Flow
Bottom Ash
Flyash
K(x)
• Solids Feed Rates Available from Data Historian
• Solids Chemical Analyses Available
• Solids Chemical Analyses Available
• Solids Chemical Analyses Available

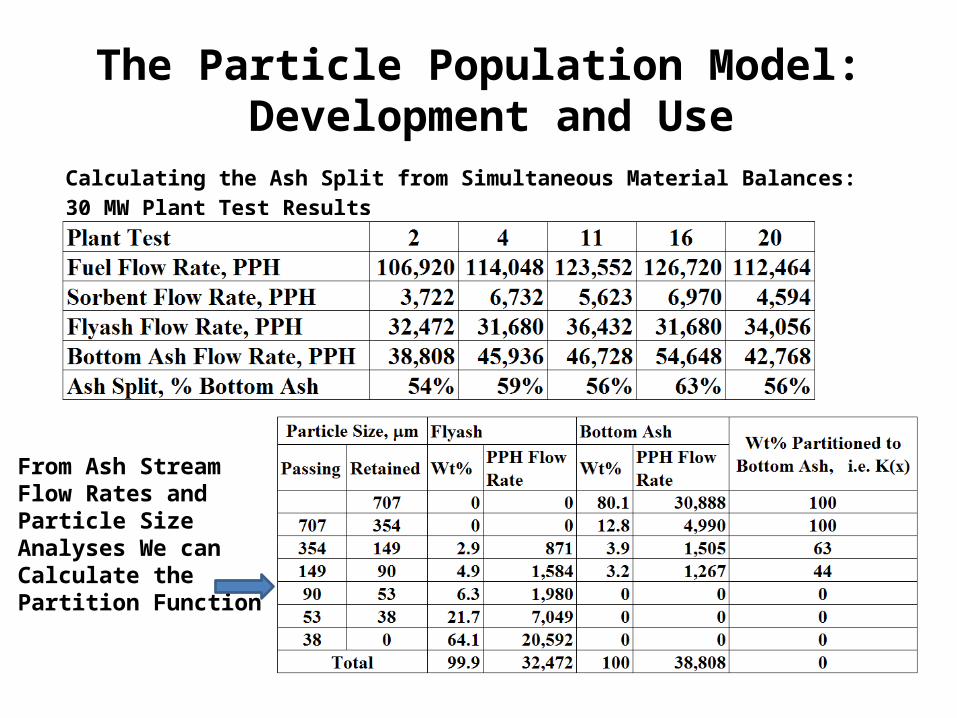
The Particle Population Model: Development and Use
Calculating the Ash Split from Simultaneous Material Balances:
F1A1+F2A2=FFAAFA+FBAABA
F1B1+F2B2=FFABFA+FBABBA
Known:F1: Feed Rate of Solids 1 from DCSF2: Feed Rate of Solids 2 from DCSA1: A Content of Solids 1 (Chemical Analysis)A2: A Content of Solids 2 (Chemical Analysis)AFA: A Content of Flyash (Chemical Analysis)ABA: A Content of Bottom Ash (Chemical Analysis)B1: B Content of Solids 1 (Chemical Analysis)B2: B Content of Solids 2 (Chemical Analysis)BFA: B Content of Flyash (Chemical Analysis)BBA: B Content of Bottom Ash (Chemical Analysis)
Unknown:FFA: Flyash Flow RateFBA: Bottom Ash Flow Rate
Two EquationsTwo Unknowns
For Best Results, A and B should Analyze as Oxides and Remain in the Solid Phase Throughout the Process (SiO2, etc.)

The Particle Population Model: Development and Use
Calculating the Ash Split from Simultaneous Material Balances: Plant Operations Must be Relatively Constant Prior to Ash Sampling
Bad Trend in CFB Power Plant Good Trend in CFB Power Plant
The Particle Population Model: Development and Use
Calculating the Ash Split from Simultaneous Material Balances:
30 MW Plant Test Results
From Ash Stream Flow Rates and Particle Size Analyses We can Calculate the Partition Function

The Particle Population Model: Development and Use for Two Commercial CFB
Power Plants

Recap: What Makes Flyash and Bottom Ash?
Plant Data
Flyash
Bottom Ash
Fines in the Feed + Attrition Products
Coarse Particles in the Feed that are Still Coarse after Exposure to the Bed
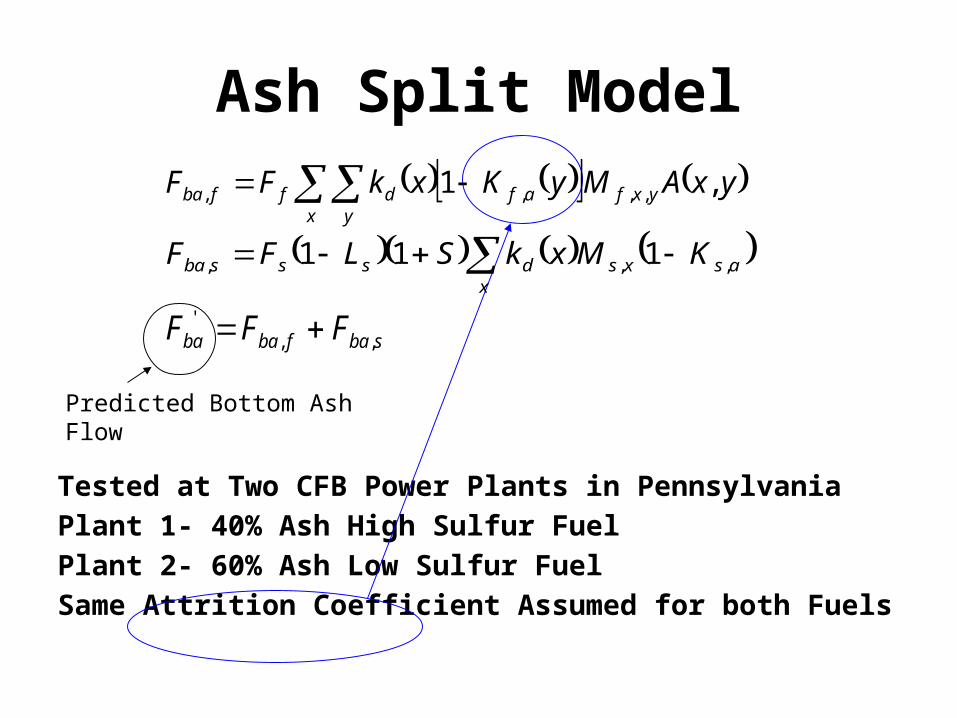
Ash Split Model
Tested at Two CFB Power Plants in Pennsylvania
Plant 1- 40% Ash High Sulfur Fuel
Plant 2- 60% Ash Low Sulfur Fuel
Same Attrition Coefficient Assumed for both Fuels
yxAMyKxkFF yxfafx y
dffba ,1 ,,,, asxs
xdsssba KMxkSLFF ,,, 111
sbafbaba FFF ,,'
Predicted Bottom Ash Flow
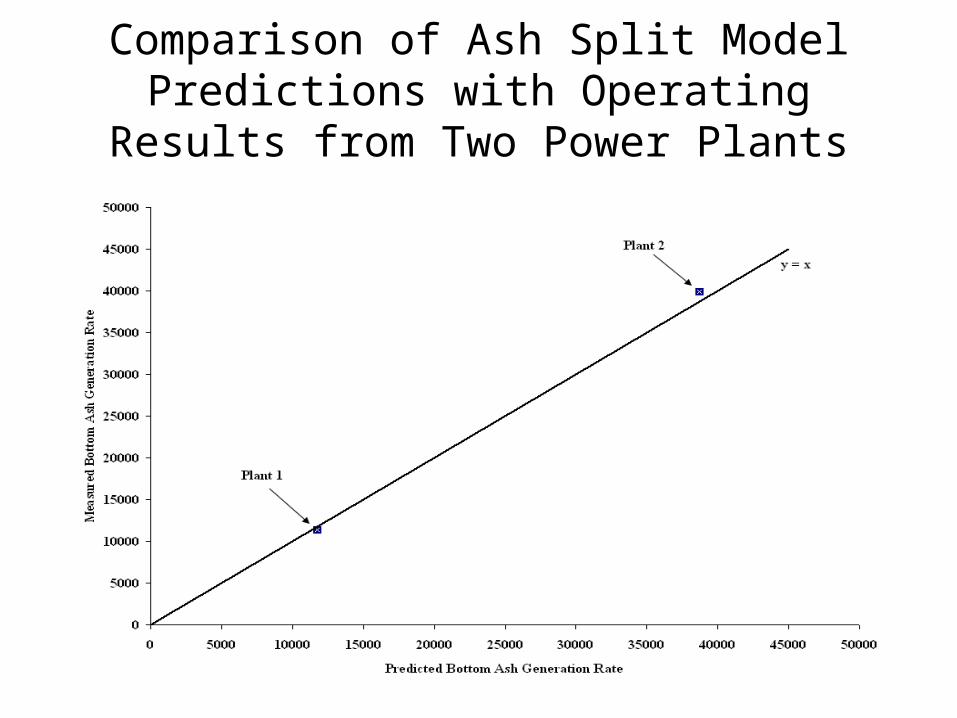
Comparison of Ash Split Model Predictions with Operating Results from Two Power Plants

Limestone Demand Model
Tested at a CFB Power Plant for a Range of Limestones
• 75-99 wt% CaCO3, 32-62 wt% Passing 200 Mesh
• Two Petrographic Classes (Micritic and Sparry)• All Ground in the Same Limestone Plant, Fired at Full Load in the
Boiler
xs
nx
1xdasba MxkI1 ,,
xs
nx
1xdasbafa MxkI111 ,,
ss
CaO
fa
fa
ba
ba
ffs Ca
1
MW
MW
RR
SFF
'
Predicted Boiler Limestone Demand
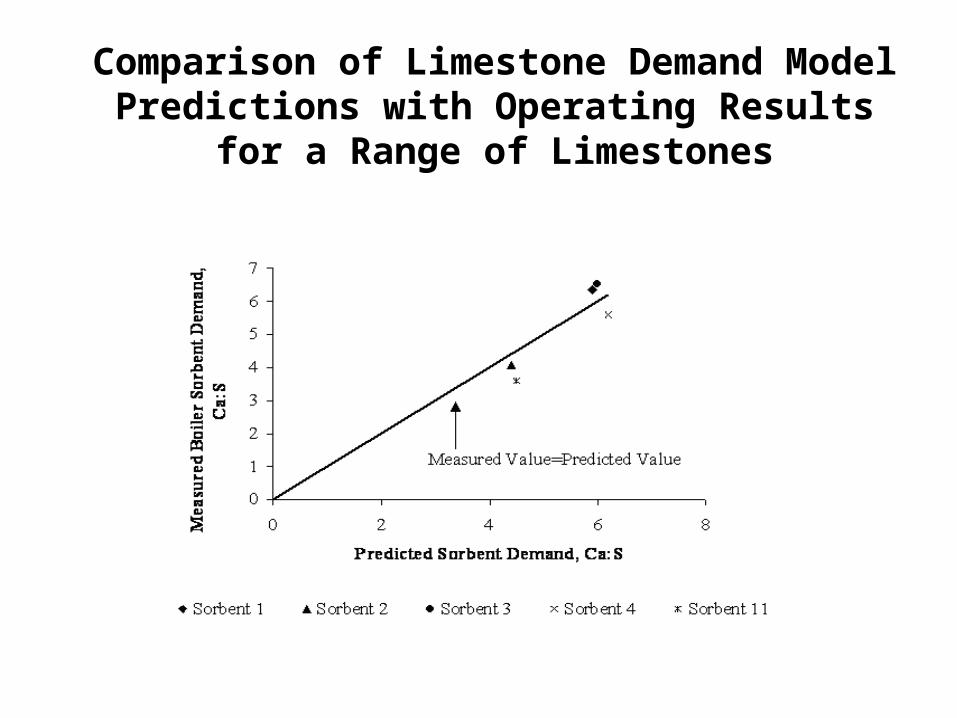
Comparison of Limestone Demand Model Predictions with Operating Results for a Range of
Limestones