fluorescent protein-based biosensors for sugar … · fluorescent protein-based biosensors for...
TRANSCRIPT
UNIVERSITÀ DEGLI STUDI DI NAPOLI
“FEDERICO II”
DOTTORATO IN SCIENZE BIOTECNOLOGICHE INDIRIZZO INDUSTRIALE
XX CICLO
FLUORESCENT PROTEIN-BASED BIOSENSORS FOR SUGAR
Relatore: Candidata:
CH.MO PROF. MOSÈ ROSSI VIVIANA SCOGNAMIGLIO
Correlatore:
DR. SABATO D’AURIA
ABBREVIATION
ABC transport system ATP binding cassette transport system
ATP adenosine 5' triphosphate
BSA bovine serum albumin
Da daltons
EDTA ethylene diamino tetra acetic acid
EGTA ethylene glycol tetra acetic acid
GGBP D-glucose/D-galactose binding
protein
LB Luria-Bertani
ORF open reading frame
PCR polymerase chain reaction
RET resonance energy transfer
PVDF polyvinylidene difluoride
SDS sodium dodecyl sulphate
TAE Tris-Acetate-EDTA
TBE Tris-Borate-EDTA
TEMED N,N,N',N'-tetramethylethylenediamine
ECL enhanced chemiluminescent
CD circular dichroism
GdnHCl guanidine hydrochloride
DMSO dimethyl sulfoxide
MW molecular weigth
DSC differential scanning calorimetry
WT wilde-type
Ca-free calcium free
Glc glucose
PDB protein data bank
DSSP secondary structure definition program
MD molecular dynamics
FI-TR Fourier transformed infrared
M182C methionine 182 to cysteine
INDEX
ITALIAN SUMMURY ENGLISH SUMMURY
1. INTRODUCTION 1.1 Objective of PhD project 1.2 Biosensors 1.3 ABC-transporters 1.4 D-glucose/D-galactose-binding protein (GGBP) 1.5 Glucose 1.6 Fluorescence Spectroscopy
2. MATERIALS AND METHODS 2.1 Construction of the wilde-type GGBP 2.2 Preparation of GGBP-WT Ca-free 2.3 Construction of the M182C Mutant of GGBP 2.3.1 PCR amplification of the mglB 2.3.2 Purification of the PCR product 2.3.3 Enzymatic digestion and ligation of the double stranded DNA sequence 2.3.4 Sequence analysis 2.3.5 Electrophoretic analysis of DNA
2.4 Over-production of GGBP-WT and GGBP-M182C 2.4.1 Expression of GGBP-WT and GGBP-M182C 2.4.2 Purification of GGBP-WT and GGBP-M182C 2.4.3 Electrophoresis protein analysis (SDS-PAGE) 2.4.4 Protein concentration assay 2.4.5 Western blot analysis 2.5 Molecular Dynamics 2.5.1 Computational Protocol 2.5.2 Elevated Temperature MD Simulations 2.6 Structural Characterization of GGBP-WT, GGBP-WT Ca-free and GGBP-M182C 2.6.1 Circular Dichroism Spectroscopy 2.6.2 Thermal denaturation 2.6.3 Chemical denaturation 2.6.4 Steady-State Fluorescence Spectroscopy 2.6.5 Thermal denaturation 2.6.6 Chemical denaturation 2.6.7 Fluorescence Quenching 2.6.7 Frequency-domain Fluorescence Spectroscopy 2.6.8 Fluorescence Anisotropy 2.6.9 Labelling of GGBP-M182C with Acrylodan 2.6.10 Labelling of GGBP-M182C with Dansyl Chloride 2.6.11 Labelling of GGBP-M182C with Acrylodan/Rhodamine 2.6.12 Determination of the degree of labelling 2.6.13 FT-IR Spectroscopy

3. RESULTS 3.1 GGBP-WT 3.1.1 Isolation of GGBP-WT 3.1.2 Structural characterization of GGBP-WT 3.2 GGBP-WT Ca-free 3.2.1 Structural characterization of GGBP-WT Ca-free 3.2.2 Fluorescence spectroscopy 3.2.3 Thermal stability fluorescence 3.2.4 Circular Dichroism 3.2.5 Molecular modelling 3.2.5.1 Ca2+-Binding Site 3.2.5.2 Sugar-Binding Site 3.2.6 Fourier Transform Spectroscopy 3.3 GGBP M182C 3.3.1 Molecular Modelling 3.3.2 Construction of GGBP-M182C 3.3.3 Isolation of GGBP-M182C 3.3.4 Presence of dymers 3.3.4.1 Anisotropy 3.3.4.2 Western Blot 3.3.5 Structural and functional characterization of GGBP-M182C 3.3.5.1 Circular Dichroism Spectroscopy 3.3.5.2 Circular Dichroism thermal denaturation 3.3.5.3 Circular Dichroism chemical denaturation
3.3.5.4 Fluorescence Spectroscopy 3.3.5.5 Fluorescence thermal denaturation 3.3.5.6 Fluorescence chemical denaturation 3.3.5.7 Fluorescence quenching 3.3.5.8 Fourier transform Spectroscopy 3.4 Local Investigation of GGBP 3.5 Glucose Sensing by GGBP
4. DISCUSSION 4.1 Production of GGBP-WT, GGBP-WT-Ca and GGBP-M182C 4.2 Structural and Functional Characterization of GGBP 4.3 Glucose Sensing
5. REFERENCES
6. PUBLICATIONS
ITALIAN SUMMURY
Biosensori Proteici a Fluorescenza per Zuccheri
Il progetto di ricerca è finalizzato allo studio funzionale e strutturale di proteine appartenenti ad una famiglia nota come “binding protein family”, per lo sviluppo di biosensori proteici a fluorescenza per la determinazione di zuccheri sia di interesse clinico, per la diagnostica medica ed il “follow-up” della patologia del diabete, sia di interesse industriale, nei processi fermentativi. I biosensori sono strumenti analitici di nuova generazione, che hanno trovato larga applicazione nella diagnostica clinica, nel rilevamento dell'inquinamento industriale, nel controllo delle fermentazioni. I biosensori possono essere considerati dei dispositivi altamente innovativi, in quanto coniugano la specificità del riconoscimento molecolare, una trasduzione del segnale estremamente efficiente e le più avanzate tecniche di rivelazione; inoltre l’ampio spettro di reazioni impiegate e l’elevata sensibilità e selettività rendono i biosensori idonei a molteplici settori di applicabilità. Le caratteristiche ideali di un biosensore sono prioritariamente di tipo analitico come l’accuratezza, la precisione, la specificità, la selettività, il limite di rilevabilità e la sensibilità adeguati alle normative, ma a un biosensore vengono richiesti anche altri requisiti come l’economicità, i tempi ridotti di analisi, l’utilizzabilità in campo. I biosensori sono strumenti che incorporano un elemento biologicamente attivo, una proteina, una cellula o un anticorpo, immobilizzato secondo particolari procedure ed accoppiato ad idonei trasduttori di segnale per la determinazione selettiva e reversibile della concentrazione o dell'attività di specie chimiche in un campione. Il meccanismo di funzionamento è relativamente semplice: il mediatore biologico immobilizzato sulla superficie del sensore prende parte ad uno o più processi che determinano la variazione di un parametro chimico o fisico che viene rivelato dal trasduttore che lo converte in un segnale elettrico. I biosensori vengono classificati sia in base alla natura del mediatore biologico che al tipo di trasduzione impiegata. In accordo con il primo criterio i biosensori possono essere biosensori enzimatici, chemorecettoriali o immunosensori; mentre in base al tipo di trasduttore di segnale si può operare una distinzione tra biosensori ottici, elettrochimici, calorimetrici ed acustici. Tra questi, i biosensori a fluorescenza presentano molti vantaggi. Essi si basano sulla variazione dell’emissione di fluorescenza intrinseca del mediatore biologico, una proteina o un enzima, dovuta ai suoi residui aminoacidici aromatici, o sulla variazione della fluorescenza estrinseca, dovuta a specifici marcatori fluorescenti che possono essere associati al componente biologico. La variazione della emissione di fluorescenza può essere rilevata mediante vari metodi, quali, ad esempio, la variazione dell’intensità di emissione di fluorescenza (fluorescenza statica), la variazione del rapporto tra l’intensità di emissione di fluorescenza di due diversi fluorofori (metodo raziometrico), la rotazione del piano di polarizzazione della radiazione emessa rispetto a quella incidente (anisotropia), la variazione del tempo di decadimento dell’emissione di fluorescenza (fluorescenza risolta nel tempo). La misura diretta dell’emissione di fluorescenza potrebbe presentare alcuni svantaggi per effetto di fenomeni quali lo smorzamento (quencing), la fotossidazione
(photobleaching), la tensione della lampada, l’errore dello sperimentatore e la diluizione del campione. Per tali motivi vengono utilizzati anche metodi raziometrici. Su questo principio si basa la tecnica “Forster Resonance Energy Transfer” (FRET), basata sul trasferimento di energia che avviene tra due fluorofori, un accettore e un donatore, che presentano spettri di emissione ed assorbimento sovrapposti e che si trovano ad una distanza che varia tra i 10 Å e gli 80 Å, definita come distanza di Forster. Di recente applicazione è l’analisi del decadimento nel tempo dell’emissione di fluorescenza in cui si valuta il tempo che il fluoroforo, intrinseco o estrinseco, impiega per passare dallo stato eccitato allo stato fondamentale. Un biosensore basato sull’utilizzo di proteine ed in particolare di proteine della famiglia delle “binding protein”, può trovare larga applicazione in vari campi. In campo medico un biosensore innovativo per la rilevazione di glucosio nel sangue in pazienti diabetici può trovare un’ampia applicazione nella diagnostica medica e nel “follow-up” della patologia del diabete. Tuttavia, l’attuale strumentazione per la misura della glicemia richiede che il paziente diabetico prelevi un campione di sangue più volte al giorno, il che risulta fastidioso e doloroso, in particolare in pazienti molto giovani o in età avanzata. Per questo motivo è importante realizzare, per esempio, un biosensore di piccole dimensioni e poco invasivo, da affiancare a microsistemi di pompaggio di insulina, basato sull’utilizzo proteine capaci di legare il glucosio senza trasformarlo (ad esempio basato sull’utilizzo di una “D-galactose-D-glucose binding protein”). In campo biotecnologico industriale, come ad esempio nei bioprocessi, lo sviluppo di un biosensore può rappresentare un sistema molto efficace per il controllo e la regolazione delle fermentazioni, nell’ambito delle quali è di cruciale importanza mantenere stabili le condizioni del processo. Condizioni, quali ad esempio la temperatura, il pH, l’agitazione, la concentrazione dei nutrienti, il livello dei gas, che sono in grado di influenzare la resa della crescita cellulare. In molti casi, un fattore limitante della crescita cellulare in continuo è rappresentato dalla concentrazione del glucosio. Al fine di mantenere stabile la concentrazione di questo nutriente, è importante avere a disposizione un sistema di controllo soprattutto in caso di colture cellulari ad alta densità. Di conseguenza, lo sviluppo di un biosensore ad esempio basato sull’utilizzo di una “D-galactose-D-glucose binding protein”, capace di riconoscere in maniera specifica il glucosio, può rappresentare un progetto di ultima generazione nel campo della biotecnologie delle fermentazioni. Le proteine della “binding protein family” sono macromolecole periplasmatiche coinvolte nel riconoscimento e nel trasporto di analiti in organismi mesofili ed estremofili. Tali proteine fanno parte di un sistema di trasporto noto come “ATP binding cassette (ABC) transport system”, un sistema che consente il trasporto unidirezionale di diversi tipi di substrati attraverso la membrana plasmatica, utilizzando ATP come fonte di energia. Un tipico sistema di trasporto ABC nei Gram-negativi, presenta cinque subunità, due delle quali sono idrofobiche ed attraversano più volte la membrana, due legano i nucleotidi e sono rivolte verso il citoplasma e l’ultima è una proteina solubile periplasmatica deputata al legame di molecole che devono essere trasportate contro gradiente di concentrazione (Diez J. et al., 2001). Quest’ultima proteina, per sopperire al fatto che la sua velocità di diffusione nel periplasma è di circa 103 volte più lenta rispetto a quella nell’acqua, è maggiormente espressa rispetto alle altre presenti in questo sistema ed inoltre il legame con il
substrato è ad alta affinità, garantendo così un elevata efficienza nel trasporto. I trasportatori ad alta affinità ABC (“ATP-binding cassette”) furono inizialmente studiati nei batteri Gram negativi, successivamente furono identificati anche nei Gram-positivi. Di recente binding-protein periplasmatiche sono state identificate anche in organismi estremofili ed eucarioti. La proteina che lega il D-galattosio/D-glucosio, la “D-galactose/D-glucose binding protein” (GGBP) da Escherichia coli, è stata la prima proteina appartenente al sistema di trasporto ABC degli organismi mesofili Gram-negativi ad essere caratterizzata. La GGBP è una proteina periplasmatica isolata da E. coli, deputata al riconoscimento del glucosio nelle prime fasi del trasporto attivo dello zucchero nella cellula batterica; riconosce il glucosio con alta affinità, come dimostrano i parametri cinetici della proteina: ha una costante di affinità di 0.8 µM, più alta di 100-1000 volte rispetto ad altri carboidrati (maltosio, trealosio, saccarosio). La GGBP, al pari delle “binding protein”, è un monomero la cui struttura terziaria è organizzata in due domini che delimitano il sito di legame del ligando. In seguito al legame con il ligando, subisce un cambiamento conformazionale tale che i due domini ruotano su stessi inglobando l’intera struttura del ligando all’interno del sito attivo. Tale cambiamento conformazionale si traduce in variazioni dei parametri chimico-fisici e strutturali, che possono essere utilizzati per lo sviluppo di sistemi di rilevazione. Durante lo svolgimento del progetto, la GGBP è stata purificata da E. coli, il gene clonato ed espresso in E. coli e la proteina ricombinante purificata all’omogeneità. La GGBP ricombinante è stata sottoposta ad uno studio strutturale mediante tecniche di dicroismo circolare, spettroscopia di fluorescenza, spettroscopia con trasformata di Fourier e modelling molecolare. I dati spettroscopici, corroborati dall’analisi in silico della GGBP, la cui struttura cristallizzata è disponibile in banca dati (2gbp PDB), hanno mostrato che la GGBP in seguito al legame con il glucosio subisce un cambiamento conformazionale tale che i due domini ruotano su se stessi e l’intera struttura diventa più rigida, al punto che in condizioni denaturanti (alta temperatura e presenza di detergenti) la proteina risulta più stabile. Inoltre, è stata studiata l’importanza degli ioni Calcio sulle proprietà funzionali e strutturali della GGBP. La determinazione del glucosio, utilizzando la GGBP, potrebbe essere influenzata dalla presenza nei liquidi biologici o industriali, di composti che chelano il calcio, quali ad esempio EGTA o EDTA; tali sostanze, legando gli ioni calcio, potrebbero interferire con il corretto ripiegamento della GGBP e di conseguenza con il corretto funzionamento della proteina o con la sua stabilità. La struttura cristallizzata della GGBP mostra la presenza di un sito di legame per il Calcio, ad una distanza di circa 30 Å dal sito di legame per il glucosio; il sito è costituito da un “loop” di aminoacidi situato nel dominio C-terminale della proteina. I risultati ottenuti hanno mostrato che la rimozione del Calcio determina un cambiamento conformazionale della GGBP che influenza la stabilità strutturale del dominio C-terminale della proteina tanto da determinare un abbassamento della temperatura di fusione della proteina di 10°C.
L’aggiunta del glucosio alla GGBP privata del Calcio determina un ripristino della struttura secondaria della proteina, tanto da determinare un aumento della temperatura di fusione della proteina di 10°C. Gli studi di spettroscopia effettuati sulla GGBP da E. coli hanno dato informazioni relative all’intera struttura della proteina ed in particolare al dominio C-terminale, dove sono situati 4 dei 5 triptofani della proteina che sono stati utilizzati come marcatori fluorescenti intrinseci. Lo scopo del progetto è quello di studiare le proprietà strutturali della GGBP da un punto di vista maggiormente dettagliato, al fine di indagare in maniera indipendente l’effetto del legame del glucosio sui singoli domini della molecola ed in particolar modo sul sito di legame del ligando. Nel caso specifico, è stato analizzato il dominio C-terminale, seguendo la fluorescenza triptofanilica, il dominio N-terminale, seguendo la fluorescenza di un marcatore fluorescente estrinseco covalentemente legato al residuo aminoacidico all’N-terminale, ed il sito di legame, seguendo la fluorescenza di un marcatore fluorescente estrinseco covalentemente legato ad una singola cisteina ottenuta mediante mutagenesi sito-diretta. Per questo motivo la GGBP è stata sottoposta ad uno studio di “modelling” molecolare al fine di individuare gli aminoacidi maggiormente coinvolti nel cambiamento conformazionale della proteina dopo il legame con il glucosio. Tra i vari aminoacidi considerati, è stata focalizzata l’attenzione sul residuo aminoacidico metionina in posizione 182, situato nelle vicinanze del sito di legame del glucosio, e mediante tecniche di mutagenesi sito-diretta tale metionina è stata sostituita con una cisteina. Al singolo residuo di cisteina 182, ottenuto mediante mutagenesi sito-diretta, è stato legato covalentemente un fluoroforo, l’acrylodan (6-acryloyl-2-dimethylaminonaphthalene), capace di trasdurre i cambiamenti conformazionali della proteina in seguito al legame con il ligando, incorporando in tal modo una funzione di trasduzione del segnale di fluorescenza nella GGBP a livello di un sito connesso al sito di legame del glucosio. La GGBP mutata ottenuta è stata sottoposta a studi di Spettroscopia al fine di studiare l’effetto della mutazione sulla struttura e sulla funzione della proteina. Mediante studi di dicroismo circolare, spettroscopia di fluorescenza, spettroscopia con trasformata di Fourier, è stato dimostrato che la GGBP mutata conserva le sue caratteristiche strutturali e che tale sostituzione aminoacidica non influenza la sua struttura e la sua stabilità. Quindi sono state studiate mediante spettroscopia di fluorescenza le caratteristiche strutturali dei singoli domini così ottenuti: il dominio N-terminale marcato in maniera covalente con un fluoroforo estrinseco, la rodamina, il dominio C-terminale, contenente cinque residui triptofanilici che fungono da fluorofori intrinseci, ed il sito di legame del glucosio, marcato covalente con un fluoroforo estrinseco, l’acrylodan. I risultati ottenuti hanno mostrato che il glucosio determina una stabilizzazione dell’intera struttura della proteina, ma in particolare a livello del dominio C-terminale. Infatti dai dati di fluorescenza si evince che la presenza del glucosio determina una marcata stabilizzazione del dominio C-terminale con un incremento della Tm di circa 7-8°C , un lieve effetto di stabilizzazione sul sito di legame, con un incremento della Tm di circa 3-4°C, e che non ha alcun effetto stabilizzante sul dominio N-terminale.
Dagli studi effettuati sulla GGBP da E. coli e da studi collaterali effettuati anche su altri membri della “binding protein family”, provenienti sia da organismi mesofili che da organismi estremofili, si evince che una delle caratteristiche fondamentali di tali proteine è la relazione tra la struttura conformazionale di tali macromolecole e la loro funzione di legare specifici analiti. Nel caso specifico, si è visto che queste proteine subiscono un marcato riarrangiamento della loro struttura in seguito al legame con il ligando; tale caratteristica rende tali proteine buoni canditati per lo sviluppo di biosensori fluorescenti. Al fine di utilizzare la GGBP da E. coli per lo sviluppo di un sistema di rilevazione per il glucosio, da utilizzare sia in campo medico che industriale, si propone di associare alla GGBP una funzione di trasduzione del segnale di fluorescenza mediante l’aggiunta di un fluoroforo in un sito strategico della proteina connesso alla funzione di legame del glucosio. Nel caso specifico, è stato marcato il singolo residuo di cisteina 182, situato a livello del sito di legame per il glucosio, con l’acrylodan. La GGBP-M182C/acrylodan è stata utilizzata per effettuare una titolazione con concentrazioni crescenti di glucosio. I risultati ottenuti hanno evidenziato che la proteina, in seguito al legame con il ligando, mostra un cambiamento spettrale di fluorescenza di circa il 10% con concentrazioni di glucosio nanomolari. Sono stati effettuati, inoltre, esperimenti di “Fluorescence Resonance Energy Transfer” (FRET) sulla GGBP mutata legando covalentemente alla proteina due fluorofori accoppiati, un donatore ed un accettore; il primo, l’acrylodan, al residuo di cisteina 182 ed il secondo, la rodamina (tertramethylrhodamine isothiocyanate), a livello dell’aminoacido in posizione 1 all’N-terminale. In tali siti, i due fluorofori accoppiati vengono a trovarsi ad una distanza di circa 40 Å, distanza compatibile con la distanza di Forster (10-80 Å) necessaria per il trasferimento di energia di fluorescenza. In seguito al legame con il glucosio i due domini della proteina si avvicinano ruotando su se stessi, riducendo in tal modo la distanza tra i due fluorofori; questo determina un incremento del trasferimento di energia di fluorescenza tra l’acrylodan e la rodamina, che si traduce in un aumento dell’intensità di fluorescenza della rodamina, di circa il 5-8%. Esperimenti di fluorescenza risolta nel tempo ottenuti per la GGBP-M182 marcata con l’acrylodan hanno mostrato un cambiamento spettrale di fluorescenza compatibile con i dati di spettroscopia di fluorescenza statica. In conclusione, l'obiettivo del progetto è stato quello di approfondire da un punto di vista biochimico-strutturale le conoscenze di base sulle proteine della famiglia delle “binding protein”, ed in particole sulla “D-galactose-D-glucose binding protein” da E. coli, al fine di sviluppare nuovi tipi di biosensori, che consentano, con tecnologie innovative, la determinazione di analiti di elevato interesse in vari comparti industriali quali quelli chimico-clinico, chimico-farmaceutico, ambientale ed agro-alimentare, in modo da poter consentire un'integrazione sinergica tra la ricerca sperimentale e la richiesta industriale. Le potenzialità di tali biosensori sono ampie, in quanto, la biodiversità garantisce una fonte inesauribile di biomolecole e sistemi cellulari con capacità di riconoscimento specifiche. Inoltre, il numero delle componenti biologiche da poter utilizzare cresce ulteriormente se si considerano le potenzialità della biologia molecolare, mediante la quale è possibile creare nuove molecole proteiche in cui la stabilità operazionale o l'interazione con l'analita possono essere ottimizzate. La molteplicità delle componenti biologiche utilizzabili e la possibilità di effettuare determinazioni delle

concentrazioni dell'analita con più metodologie mostrano la flessibilità dell'impiego dei biosensori e l'ampiezza del loro campo di utilizzazione. In particolare, le motivazioni della scelta fatta per un biosensore per il dosaggio del glucosio sono rappresentate dall’ampiezza del mercato di riferimento, dall'assenza di invasività, da una agevole applicazione in aree differenti come quelle industriali, mediche, agro-alimentari ed ambientali. Infatti, modificando la coppia proteina-ligando è possibile realizzare nuovi biosensori per i più svariati tipi di impieghi analitici.
SUMMURY
Fluorescent protein-based biosensors for sugar Protein recognition-based biosensors are projected to find many research, clinical, industrial, environmental and security applications in the near future. In medical and clinical field, protein-based biosensor is crucial for blood glucose monitoring for diabetic patients for the diagnosis and the follow-up of high social interest pathology. In industrial field, protein-based biosensor can be used for nutrient control and in particular to accurately and reliably measure glucose in yeast fermentation and E. coli fermentations in different scales. The objective of this project is to study periplasmic binding proteins from mesophilic and extremophilic organisms for develop a protein-biosensor based that is able to bind glucose. The D-glucose-D-galactose binding protein, the initial component of glucose transport of ABC transporter system in E. coli, upon glucose binding undergo a large conformational change in their global structure to accommodate the ligand inside the binding site. Based on this conformational change, sensing system for glucose can be developed. Knowledge of the details of structural properties as well as the conformational stability of GGBP is needed when developing biotechnological applications. For this reason, the project is focalized on the functional and structural characterization of GGBP and several sugar binding proteins from different organisms such as mesophilic and extremophilic organisms. Moreover, the effect of calcium ions was studied on the stability of GGBP. Calcium is involved in various biological and industrial processes. The refined crystallographic structures of GGBP revealed the presence of a Ca++-binding site, located about 30 Å far from the sugar binding site. In order to speed-up glucose determinations, measurements are performed on the whole blood in the presence of an anti-coagulant agent or in the cell colture in the presence of protease inhibitors such as EDTA or EGTA. The chelating properties of this compound towards divalent ions are well known. As a consequence, planning the future use of GGBP as a glucose biosensor, it is important to know how the calcium depletion from the protein caused by chelating agents could affect its structural properties. Furthermore, a mutant form of GGBP from E. coli was obtained to characterize the GGBP by both global point of view, taking advantage of tryptophane fluorescence, and local point of view, taking advantage of extrinsic probes exploring different portions of the protein, in particular binding site portion and N-terminal region. In particular, in order to perform local investigation on different portions of GGBP, looking for knowledge about glucose binding site, we have obtained a single point-mutation of the protein by substitution of methionine residue in position 182 with a cysteine. This unique residue of cysteine is located in the close proximity of the glucose binding site, thus to be considered to be closely associated with the binding of the ligand. In addition, the mutant form of the GGBP labeled with different probes give us the opportunity to develop a glucose sensor system able to work in complex media and in continuous.
1. INTRODUCTION Protein recognition-based biosensors are projected to find many research, clinical, industrial, environmental and security applications in the near future. Biosensors exploit the remarkable specificity of biomolecular recognition to provide analytical tools that can measure the presence of a single molecular species in a complex mixture. Several research labs are studying biotechnological applications of proteins as a probe for the development of biosensors. In medical and clinical field, protein-based biosensors are crucial for blood glucose monitoring for diabetic patients for the diagnosis and the follow-up of high social interest pathology. Diabetes is a metabolic disease in which the body does not produce or properly use insulin. Insulin is a hormone that is needed to convert sugar, starches and other food into energy needed for daily life. In 2006, according to the World Health Organization, at least 171 million people worldwide suffer from diabetes. Diabetes is in the top 10, and perhaps the top 5, of the most significant diseases in the developed world, and is gaining in significance there and elsewhere. The National Diabetes Information Clearinghouse estimates that diabetes costs $132 billion in the United States alone every year. For this reason it is very important to have a simple and efficient system for glucose monitoring. At present the only reliable method to measure blood glucose is by a finger stick and subsequent glucose measurement, typically by glucose oxidase. This procedure is painful and even the most compliant individuals, with good understanding and motivation for glucose control, are not willing to stick themselves more than several times per day. An alternative approach to glucose sensing is based on the development of a biosensor based on D-glucose/D-galactose binding protein (GGBP) from Escheriachia coli, which bind glucose. This protein is able to bind glucose without substrate consuming, in complex media and in real time. The potential applications of GGBP in industrial field can be also studied for nutrient control in yeast fermentation and E. coli fermentations in different scales. Monitoring and regulation of fermentations is of a paramount industrial and academic importance in order to keep conditions optimal during the entire process. Bioreactor's environmental conditions like temperature, pH, agitation, nutrients concentration, gas levels, directly affects the growth rate of the culture and allows to avoid overflow metabolism, and for these reasons it is crucial to be closely monitored and controlled. In most cases the growth-limiting nutrient is glucose, which is fed to the culture as a highly concentrated glucose syrup (600-850 g/l). In order to maintain a stable concentration of this substrate during the entire process, a computer controlled system is required to monitor or control the limiting index when a specific fed-batch strategy is applied to high cell density culture. In Ge et al. 2003 article, the GGBP was described as a protein used like a biosensor able to accurately and reliably measure glucose in fermentation and cell culture.
1.1 OBJECTIVE OF PhD PROJECT The objective of this project is to study periplasmic binding proteins from mesophilic and extremophilic organisms for develop a protein-biosensor based that is able to bind glucose. The D-glucose-D-galactose binding protein, the initial component of glucose transport of ABC transporter system in E. coli, upon glucose binding undergoes a large conformational change in its global structure to accommodate the ligand inside the binding site. Based on this conformational change, sensing system for glucose could be developed. Knowledge of the details of structural properties as well as the conformational stability of GGBP is needed when developing biotechnological applications. Besides information on the basic knowledge, the new insights on GGBP constitute important data for the development of those biotechnological applications requiring detailed information on the protein structural-functional properties as in the case of manipulation of the protein to use as probe for a biosensor for glucose monitoring in different fields and with different properties. For this reason, the project is focalized on the functional and structural characterization of GGBP and several sugar binding proteins from different organisms from mesophilic and extremophilic sources. In particular GGBP from E. coli was deeply studied for the understanding of its structural properties by Fluorescence Spectroscopy, Circular Dichroism, Fourier Spectroscopy and Differential Scanning Calorimetry. By these techniques, the effect of temperature, pressure, chemical denaturant and other chemico-physical perturbation on the structure and on the stability of the protein was investigated, in the absence and in the presence of glucose (D’Auria et al 2004, Piszczek et al 2004). The role of calcium ions in GGBP stability was also investigated. Calcium is involved in various biological and industrial processes, and one major role of Ca++ is to stabilize native folds of proteins. For this reason Ca++ is a constituent of many thermostable proteins [10]. The refined crystallographic structures of GGBP revealed the presence of a Ca++-binding site, located about 30 Å far from the sugar binding site. From the static crystallographic structure, no evidence is present for a role of Ca++ in stabilising of the secondary and tertiary structure of this class of protein. However, the study of the calcium role in the GGBP stability has a tremendous interest if biotechnological applications of this protein are planned. In actual fact, in order to speed-up glucose determinations, measurements are performed on the whole blood in the presence of an anti-coagulant agent or in the cell colture in the presence of protease inhibitors such as EDTA or EGTA. The chelating effects of this compound towards divalent ions are well known. As a consequence, planning the future use of GGBP as a glucose biosensor, it is important to know how the calcium depletion from the protein caused by chelating agents could affect its structural properties. In this context, it was investigated the effect of the depletion of calcium from GGBP on the structure and thermal stability of the protein in the absence and in the presence of glucose by means of Fluorescence Spectroscopy, Circular Dichroism, Fourier transform infrared (FT-IR) spectroscopy and by computational dynamics simulations (D’Auria et al 2006, Herman et al 2005).
Furthermore, a mutant form of GGBP from E. coli was obtained to characterize the GGBP by both global point of view, taking advantage of tryptophan fluorescence, and local point of view, taking advantage of extrinsic probes exploring different portions of the protein, in particular binding site portion and N-terminal region. In order to perform a local investigation also on other portion of GGBP matrix, looking for knowledge about N-terminal domain and glucose binding site, we obtained a single point-mutation of the protein by substitution of a methionine residue in position 182 with a cysteine. This unique residue of cysteine is located in the close proximity of the glucose binding site, thus to be considered to be closely associated with the binding of the ligand (Scognamiglio et al 2007a). In addition, the mutant form of the GGBP labelled with different probes give us the opportunity to develop a glucose sensor system able to work in complex media. Since the intrinsic fluorescence from proteins is usually not useful for sensing because of the need for complex or bulky light sources and the presence of numerous proteins in most biological samples, the use of labelled protein with fluorescence probes with longer excitation and emission wavelengths can be helpful in an attempt to obtain a glucose response with simple instruments and in continuous (Scognamiglio et al 2007b).
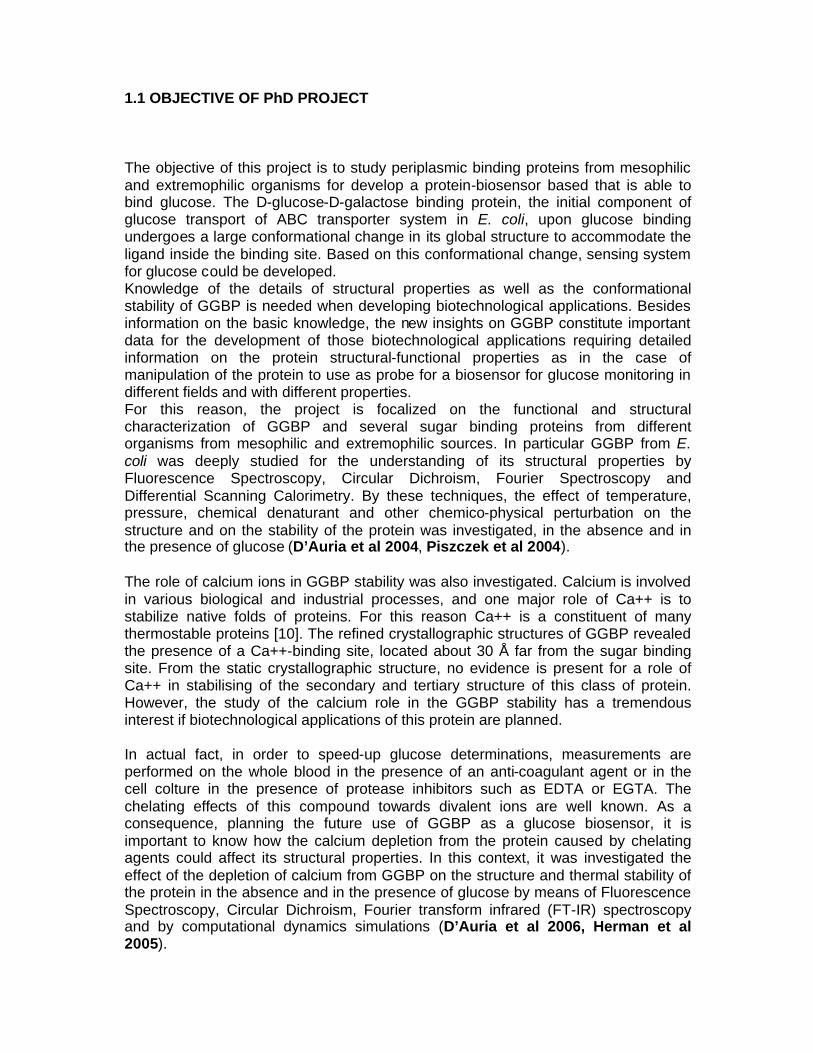
1.2 BIOSENSORS Biosensors are small devices capable of detecting a chemical or biochemical species in complex mixture, so that they are expected find numerous applications in medical research, clinical diagnosis, environmental testing, bioprocess monitoring and biotechnology in general; food quality control, pharmacology and brain research, and development of new pharmaceuticals. In the ideal case, a biosensor is contacted with the sample and the analytical result is displayed in short time. A biosensor in the traditional sense is defined as a bioanalytical device incorporating a biological material or a biomimic, such as tissue, microrganisms, organelles, cell receptors, enzymes, antibodies, nucleic acids, intimately associated with or integrated within a physicochemical transducer or transducing microsystem, which may be optical, electrochemical, thermometric, piezoelectric or magnetic. The usual aim of a biosensor is to produce either discrete or continuous digital electronic signals, which are proportional to a single analyte or a related group of analytes. Figure 1. Schematic view of a biosensor Among those, optical sensors form a major group and display features that can make them advantageous over other systems such as electrochemical, mass sensitive, thermal, acoustic, or other devices. Typical optical schemes are based on absorption spectroscopy (from the UV to the deep infrared), Raman and conventional fluorescence spectroscopy and imaging, and also on more sophisticated methods like surface plasmon resonance, evanescent wave and near-field spectroscopy, fiber
biological element
bioreceptor
trasductor
ampliphier
micro-electronics
analytes
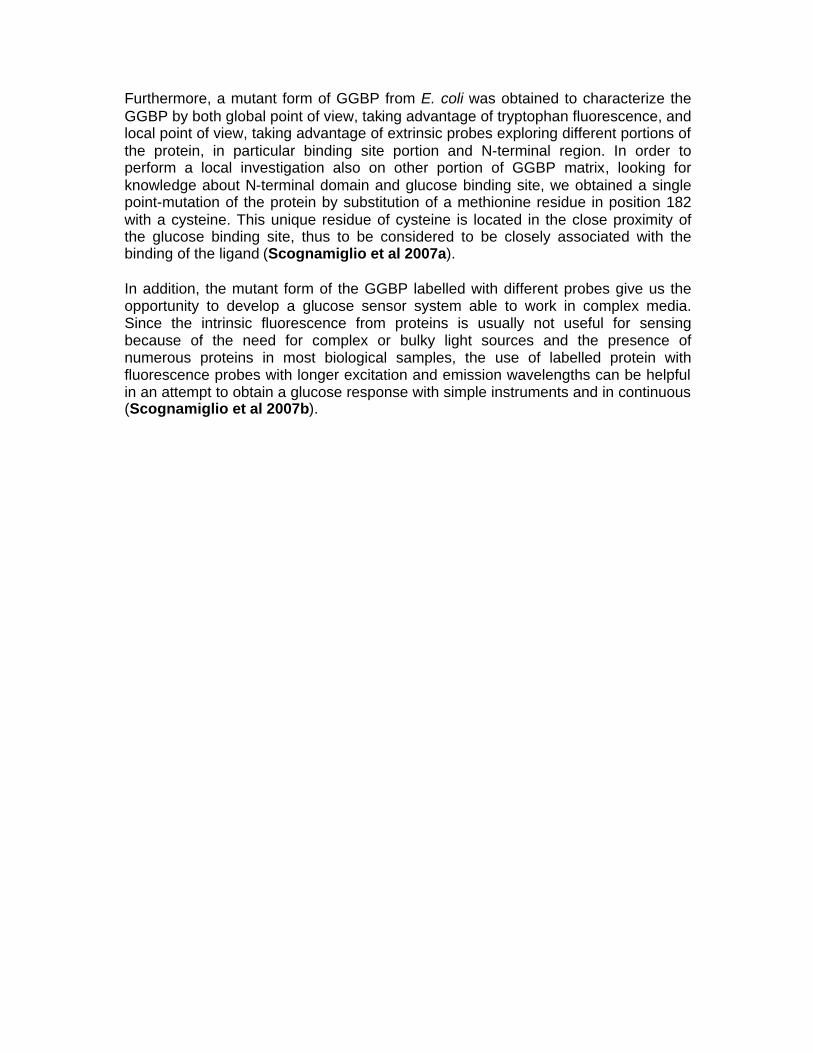
optic spectroscopy, correlation spectroscopy, luminescence lifetime, polarization and energy transfer. 1.3 ABC-transporters ABC-transporters are believed to date back more than 3 billion years in evolutionary time and are distributed in all three kingdoms of living organisms. These transport proteins play important physiological roles in the transport of different molecules through biological membrane structures. Although most eukaryotic ABC transporters export hydrophobic molecules from the cytoplasm, bacterial ABC transporters predominantly import essential nutrients that are delivered to them by specific binding proteins. A typical ABC transporter has five domains or subunits, two of which are hydrophobic and are predicted to span the membrane multiple times in an alpha-helical conformation and two of which bind nucleotide and are exposed to the cytoplasm. The fifth component is the periplasmic soluble binding protein and its rule is to interact with the substrate to be transported, acting as a high affinity receptor for the substrate in the periplasm. Interaction of the ligand-bound binding protein with the transporter stimulates the ATPase activity of the transporter and initiates transport. Figure 2. Glucose ATP Binding Cassette (ABC) transporter system in E. coli These periplasmic binding proteins have two globular domains attached by a flexible hinge, and in the ligand-bound structures, the ligand is buried deep within the cleft between the two domains. Conformational changes involving the hinge are thought to be necessary for sugars to get in and out of the protein binding site. Differences in
periplasm
citoplasm
ATP ADP + P
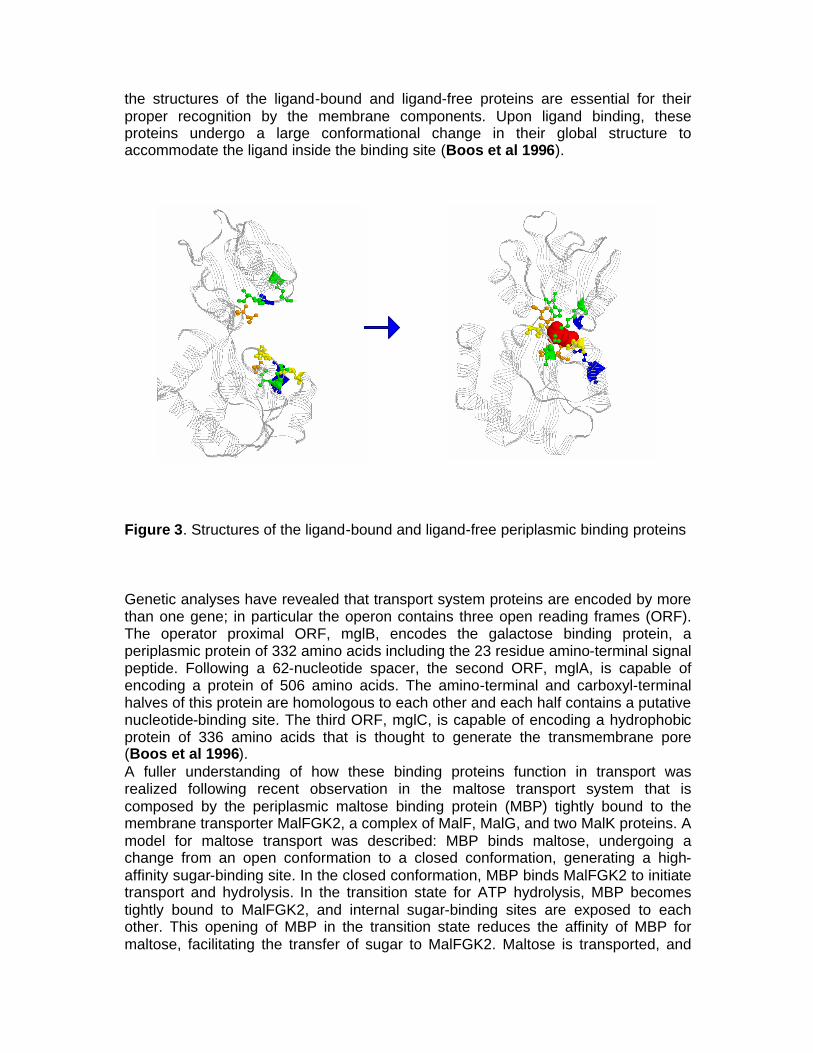
the structures of the ligand-bound and ligand-free proteins are essential for their proper recognition by the membrane components. Upon ligand binding, these proteins undergo a large conformational change in their global structure to accommodate the ligand inside the binding site (Boos et al 1996). Figure 3. Structures of the ligand-bound and ligand-free periplasmic binding proteins Genetic analyses have revealed that transport system proteins are encoded by more than one gene; in particular the operon contains three open reading frames (ORF). The operator proximal ORF, mglB, encodes the galactose binding protein, a periplasmic protein of 332 amino acids including the 23 residue amino-terminal signal peptide. Following a 62-nucleotide spacer, the second ORF, mglA, is capable of encoding a protein of 506 amino acids. The amino-terminal and carboxyl-terminal halves of this protein are homologous to each other and each half contains a putative nucleotide-binding site. The third ORF, mglC, is capable of encoding a hydrophobic protein of 336 amino acids that is thought to generate the transmembrane pore (Boos et al 1996). A fuller understanding of how these binding proteins function in transport was realized following recent observation in the maltose transport system that is composed by the periplasmic maltose binding protein (MBP) tightly bound to the membrane transporter MalFGK2, a complex of MalF, MalG, and two MalK proteins. A model for maltose transport was described: MBP binds maltose, undergoing a change from an open conformation to a closed conformation, generating a high-affinity sugar-binding site. In the closed conformation, MBP binds MalFGK2 to initiate transport and hydrolysis. In the transition state for ATP hydrolysis, MBP becomes tightly bound to MalFGK2, and internal sugar-binding sites are exposed to each other. This opening of MBP in the transition state reduces the affinity of MBP for maltose, facilitating the transfer of sugar to MalFGK2. Maltose is transported, and
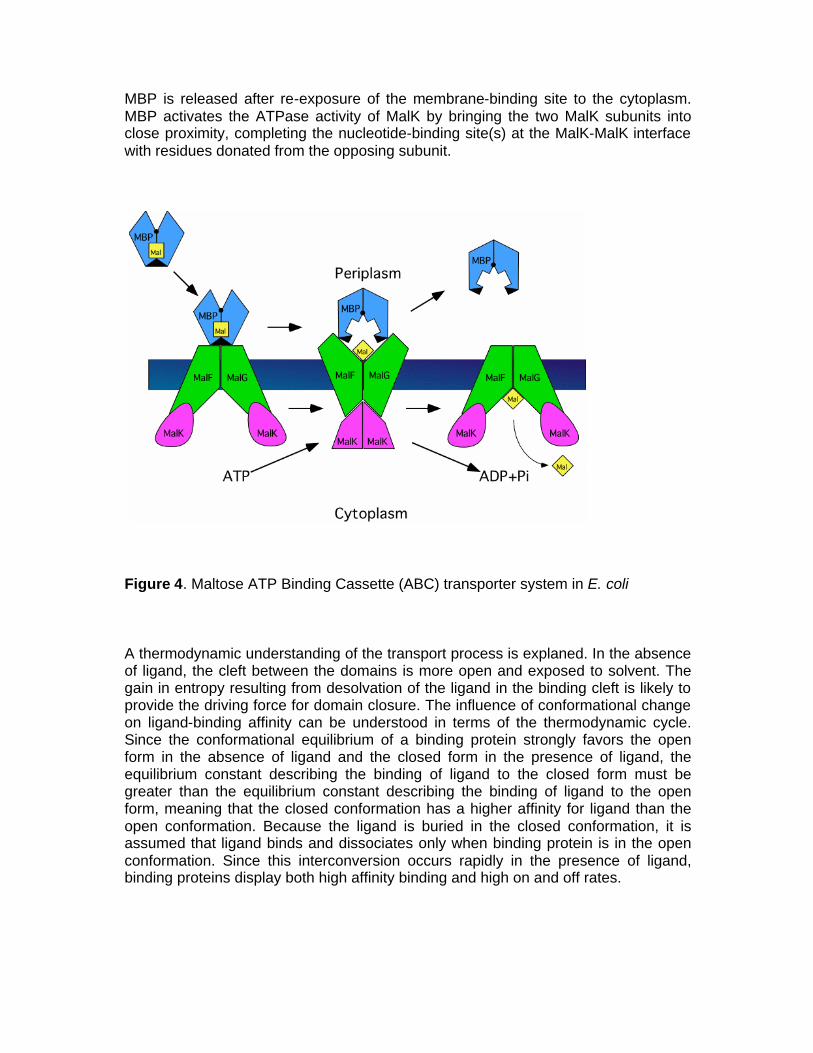
MBP is released after re-exposure of the membrane-binding site to the cytoplasm. MBP activates the ATPase activity of MalK by bringing the two MalK subunits into close proximity, completing the nucleotide-binding site(s) at the MalK-MalK interface with residues donated from the opposing subunit.
Figure 4. Maltose ATP Binding Cassette (ABC) transporter system in E. coli A thermodynamic understanding of the transport process is explaned. In the absence of ligand, the cleft between the domains is more open and exposed to solvent. The gain in entropy resulting from desolvation of the ligand in the binding cleft is likely to provide the driving force for domain closure. The influence of conformational change on ligand-binding affinity can be understood in terms of the thermodynamic cycle. Since the conformational equilibrium of a binding protein strongly favors the open form in the absence of ligand and the closed form in the presence of ligand, the equilibrium constant describing the binding of ligand to the closed form must be greater than the equilibrium constant describing the binding of ligand to the open form, meaning that the closed conformation has a higher affinity for ligand than the open conformation. Because the ligand is buried in the closed conformation, it is assumed that ligand binds and dissociates only when binding protein is in the open conformation. Since this interconversion occurs rapidly in the presence of ligand, binding proteins display both high affinity binding and high on and off rates.
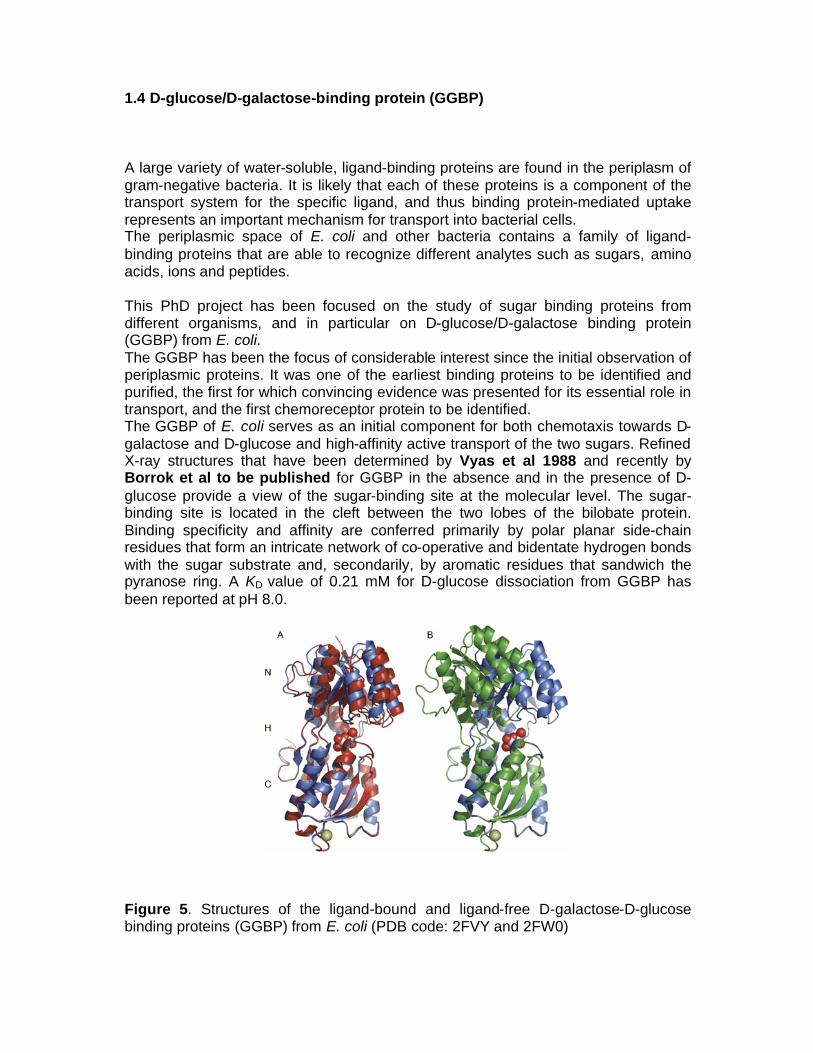
1.4 D-glucose/D-galactose-binding protein (GGBP) A large variety of water-soluble, ligand-binding proteins are found in the periplasm of gram-negative bacteria. It is likely that each of these proteins is a component of the transport system for the specific ligand, and thus binding protein-mediated uptake represents an important mechanism for transport into bacterial cells. The periplasmic space of E. coli and other bacteria contains a family of ligand-binding proteins that are able to recognize different analytes such as sugars, amino acids, ions and peptides. This PhD project has been focused on the study of sugar binding proteins from different organisms, and in particular on D-glucose/D-galactose binding protein (GGBP) from E. coli. The GGBP has been the focus of considerable interest since the initial observation of periplasmic proteins. It was one of the earliest binding proteins to be identified and purified, the first for which convincing evidence was presented for its essential role in transport, and the first chemoreceptor protein to be identified. The GGBP of E. coli serves as an initial component for both chemotaxis towards D-galactose and D-glucose and high-affinity active transport of the two sugars. Refined X-ray structures that have been determined by Vyas et al 1988 and recently by Borrok et al to be published for GGBP in the absence and in the presence of D-glucose provide a view of the sugar-binding site at the molecular level. The sugar-binding site is located in the cleft between the two lobes of the bilobate protein. Binding specificity and affinity are conferred primarily by polar planar side-chain residues that form an intricate network of co-operative and bidentate hydrogen bonds with the sugar substrate and, secondarily, by aromatic residues that sandwich the pyranose ring. A KD value of 0.21 mM for D-glucose dissociation from GGBP has been reported at pH 8.0. Figure 5. Structures of the ligand-bound and ligand-free D-galactose-D-glucose binding proteins (GGBP) from E. coli (PDB code: 2FVY and 2FW0)
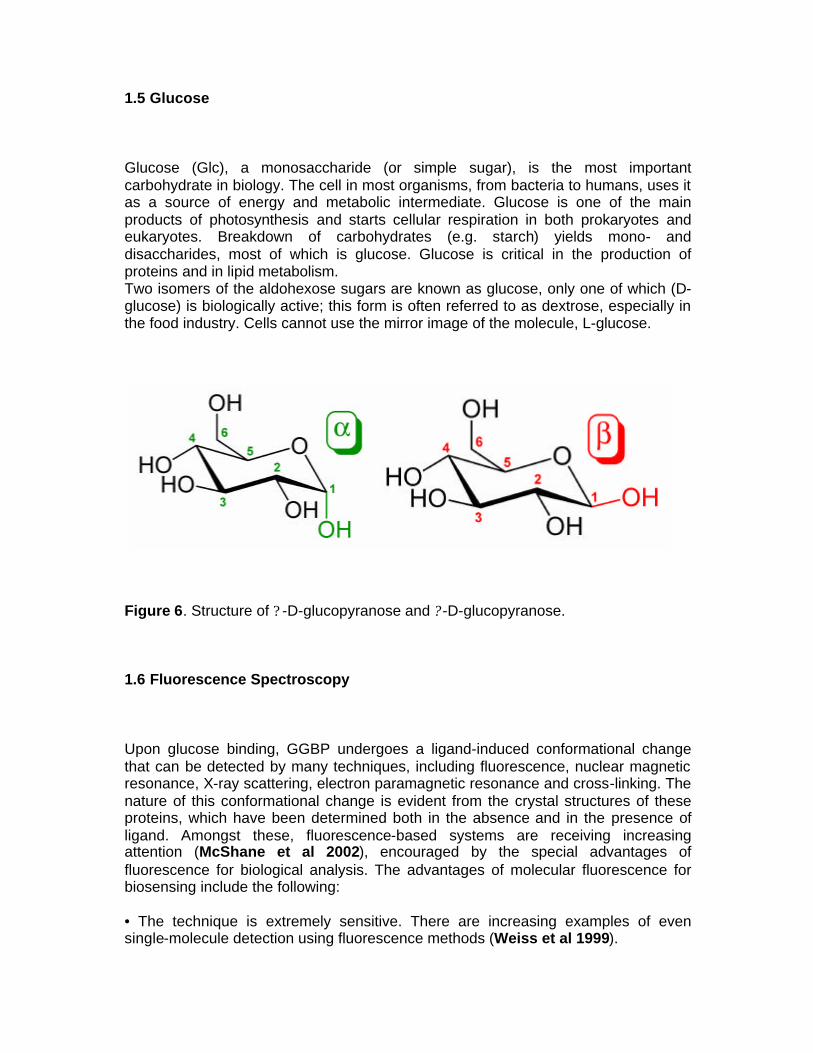
1.5 Glucose Glucose (Glc), a monosaccharide (or simple sugar), is the most important carbohydrate in biology. The cell in most organisms, from bacteria to humans, uses it as a source of energy and metabolic intermediate. Glucose is one of the main products of photosynthesis and starts cellular respiration in both prokaryotes and eukaryotes. Breakdown of carbohydrates (e.g. starch) yields mono- and disaccharides, most of which is glucose. Glucose is critical in the production of proteins and in lipid metabolism. Two isomers of the aldohexose sugars are known as glucose, only one of which (D-glucose) is biologically active; this form is often referred to as dextrose, especially in the food industry. Cells cannot use the mirror image of the molecule, L-glucose.
Figure 6. Structure of ? -D-glucopyranose and ? -D-glucopyranose. 1.6 Fluorescence Spectroscopy Upon glucose binding, GGBP undergoes a ligand-induced conformational change that can be detected by many techniques, including fluorescence, nuclear magnetic resonance, X-ray scattering, electron paramagnetic resonance and cross-linking. The nature of this conformational change is evident from the crystal structures of these proteins, which have been determined both in the absence and in the presence of ligand. Amongst these, fluorescence-based systems are receiving increasing attention (McShane et al 2002), encouraged by the special advantages of fluorescence for biological analysis. The advantages of molecular fluorescence for biosensing include the following: • The technique is extremely sensitive. There are increasing examples of even single-molecule detection using fluorescence methods (Weiss et al 1999).
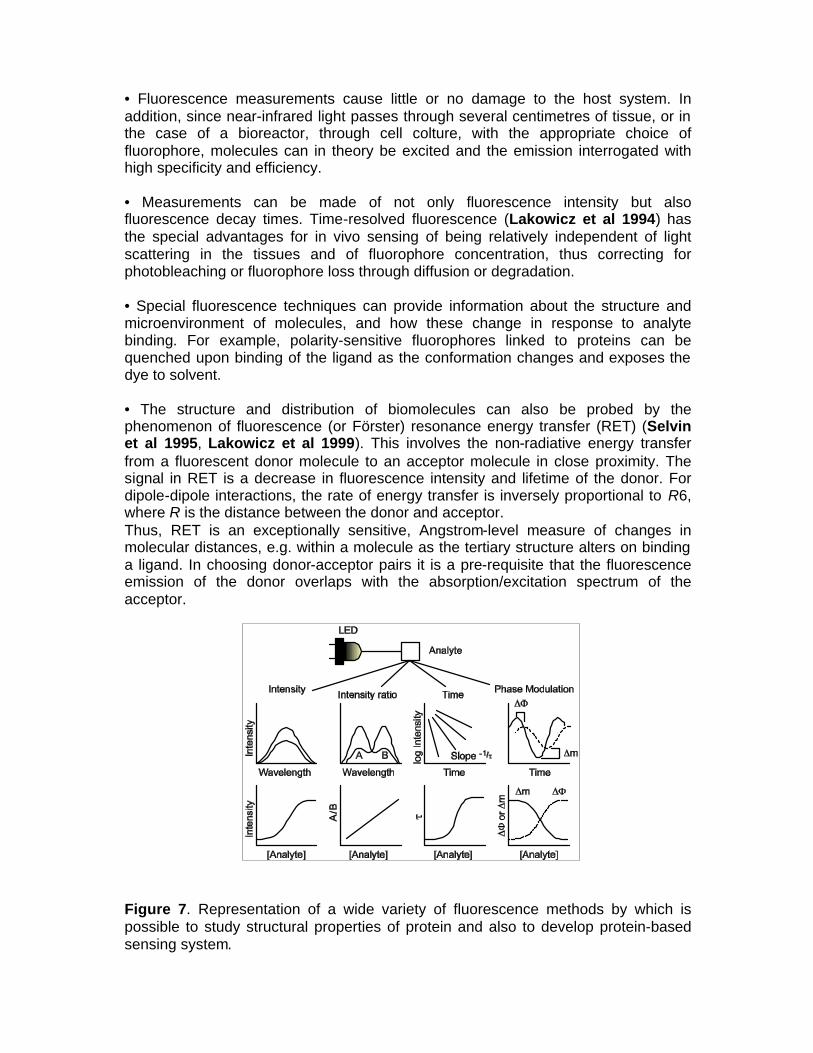
• Fluorescence measurements cause little or no damage to the host system. In addition, since near-infrared light passes through several centimetres of tissue, or in the case of a bioreactor, through cell colture, with the appropriate choice of fluorophore, molecules can in theory be excited and the emission interrogated with high specificity and efficiency. • Measurements can be made of not only fluorescence intensity but also fluorescence decay times. Time-resolved fluorescence (Lakowicz et al 1994) has the special advantages for in vivo sensing of being relatively independent of light scattering in the tissues and of fluorophore concentration, thus correcting for photobleaching or fluorophore loss through diffusion or degradation. • Special fluorescence techniques can provide information about the structure and microenvironment of molecules, and how these change in response to analyte binding. For example, polarity-sensitive fluorophores linked to proteins can be quenched upon binding of the ligand as the conformation changes and exposes the dye to solvent. • The structure and distribution of biomolecules can also be probed by the phenomenon of fluorescence (or Förster) resonance energy transfer (RET) (Selvin et al 1995, Lakowicz et al 1999). This involves the non-radiative energy transfer from a fluorescent donor molecule to an acceptor molecule in close proximity. The signal in RET is a decrease in fluorescence intensity and lifetime of the donor. For dipole-dipole interactions, the rate of energy transfer is inversely proportional to R6, where R is the distance between the donor and acceptor. Thus, RET is an exceptionally sensitive, Angstrom-level measure of changes in molecular distances, e.g. within a molecule as the tertiary structure alters on binding a ligand. In choosing donor-acceptor pairs it is a pre-requisite that the fluorescence emission of the donor overlaps with the absorption/excitation spectrum of the acceptor. Figure 7. Representation of a wide variety of fluorescence methods by which is possible to study structural properties of protein and also to develop protein-based sensing system.
2. MATERIALS AND METHODS 2.1 Construction of the wilde-type GGBP The mglb gene that encodes for GGBP and its natural promoter were isolated from the E. coli K-12 genome by Polymerase Chain Reaction (PCR). The gene-promoter DNA fragment was cloned into the SacI/PstI restriction sites of the plasmid pTZ18U. 2.2 Preparation of GGBP-WT Ca-free Calcium-depleted GGBP (GGBP-Ca) was obtained by extensive dialysis of GGBP against 10 mM Tris-HCl, 5.0 mM EDTA buffer pH 8.0 at 4°C. The content of calcium in the GGBP structure was checked by atomic absorption spectroscopy and it resulted to be negligible after treatment of GGBP with EDTA [12]. GGBP-Ca was stored at 4 °C in 5.0 mM Tris/HCl, 5.0 mM EDTA buffer, pH 8.0. 2.3 Construction of the M182C Mutant of GGBP 2.3.1 PCR amplification of the mglB Site-directed mutagenesis was accomplished using Overlap-Extention PCR. The recombinant plasmid pTZ18U-mglb was used as template for the construction of the GGBP-M182C mutant and the following oligo-nucleotide as primers: forward primer mglB-FW: 5’-AGGAATTCGAGCTCACTTCATTAACTCTAC-3’ including the natural promoter of GGBP and a SacI site (underlined); reverse primer mglB-RV: 5’-AACAGCTGTTATTTCTTGCTGAATTCAAGC-3’ covering the stop codon of GGBP, and including a PstI site (underlined); internal forward primer mglB-M182C-forward: 5’-TAGATACCGCATGTTGGGACACCGCTCAGGCA-3’
Internal reverse primer mglB-M182C-reverse: 5’-AGCGGTGTCCCAACATGCGGTATCTAACTGTAAC-3’ The PCR reactions were performed on an Eppendorf Mastercycler Personal. Mineral oil was added to the sample to prevent evaporation. Prior to the first cycle the PCR reaction mix was heated to a temperature of 95°C for 5 min, to ensure denaturation of DNA template and primers. After this step the master mix was added to perform the PCR using the following program:
? Denaturation 1 min at 95°C ? Annealing 1 min at 50°C ? Polymerisation 2 min at 72°C
The cycle was repeated 30 times and a final step at 72°C for 10 min was performed allowing a complete polymerisation. The amplified PCR product was analysed on a 1% agarose gel electrophoresis. 2.3.2 Purification of the PCR product The PCR product was purified using a QIAquick PCR Purification Kit Protocol to remove primers, nucleotides, polymerase and salts from the enzymatic reaction. The DNA was eluted with 100 µl 10 mM Tris HCl pH 8.0 and analyzed on a 1% agarose electrophoresis gel. 2.3.3 Enzymatic digestion and ligation of the double stranded DNA sequence The amplified 1100 bp DNA fragment was ligated into the SacI/PstI site of the high copy number plasmid pTZ18U. 500 ng of amplified mglB were digested with 2 units (U) of PstI and SacI restriction enzymes using the matching buffer. The final volume was 20 µl and the cleavage reaction was incubated at 37°C for 90 minutes. DNA was ethanol precipitated by adding 0.3 M sodium acetate pH 5.2 and 2.5 volumes cold ethanol 96% and incubating at -80°C for 20 min. The pellet was washed in 70% ethanol and resuspended in 20 µl deionised H2O.
2.3.4 Sequence analysis The DNA sequencing data (PRIMM-SeqCore, Naples-Italy) verified that no mutation occurred except for of the desired point mutation. 2.3.5 Electrophoretic analysis of DNA To detect the presence of amplified DNA loading buffer was added to the sample before loading into small wells of a 1% agarose gel containing TAE and 0.5 ?g/ml ethidium bromide.
1% TAE or TBE agarose gel ? 0.09 M Tris-boric acid / Tris-acetate ? 0.002 M EDTA ? 1% agarose
Loading buffer 6X ? 0.25% bromophenol blue ? 0.25% xylene cyanol
? 30% glycerol
Furthermore, 250 ng DNA marker III (from 564 to 21226 bp) or DNA marker VI (from 154 to 2176 bp) was loaded onto the gel to identify and/or quantify the PCR product. 2.4 Over-production of GGBP-WT and GGBP-M182C 2.4.1 Expression of GGBP-WT and GGBP-M182C Transformation and expression of the GGBP-WT gene and the resulting mutated GGBP-M182C gene was performed in E. coli strain NM303 (F1 mgl 503 lacZ lacY1
recA1), a mutant strain that does not produce GGBP. The cultures consisted of 0.5% inoculum, 50 µg/ml ampicillin in 2 L Luria-Bertani (LB) medium (10 g/liter bacto-tryptone, 5 g/liter bacto-yeast extract, 10 g/liter NaCl, pH 7.2) and 1.0 mM D-fucose incubated at 37°C for 16-18 hours. Cells were harvested and GGBP-M182C was extracted by osmotic shock as Neu and Heppel protocol. The crude extract was dialyzed against 10 mM Tris–HCl pH 7.5 at 4°C for 16-18 hours. 2.4.2 Purification of GGBP-WT and GGBP-M182C The GGBP-WT and the GGBP-M182C were purified using a DEAE anion-exchange column. The supernatant was loaded onto a DEAE Sepharose Fast Flow column (BioRad) connected to a FPLC system (AKTÄ Explorer), pre-equilibrated in 10 mM Tris-Hcl pH 7.5. The chromatography flow rate was 0.5 ml/min. After elution of the unbound proteins with 10 mM Tris-HCl pH 7.5, elution of the bound proteins was carried out with a linear gradient of ionic force (NaCl 0-0.5 M in 10 mM Tris-Hcl pH 7.5). Protein fractions were collected and analysed by sodium dodecyl sulphate polyacrylamide gel electrophoresis (SDS-PAGE, 15% polyacrylamide gel). The fractions containing GGBP were pooled and dialysed against 10 mM Tris-HCl pH 7.5. 2.4.3 Electrophoresis protein analysis (SDS-PAGE) To detect the purity and/or the presence of a specific biomolecule in a protein solution, a SDS-PAGE was performed. The proteins were separated according to their electrophoretic mobility, which is a function of length of polypeptide chain and their MW. SDS is an anionic detergent that denatures secondary and non-disulfide-linked tertiary structures of biomolecules. The interaction of SDS molecules with proteins confers a negative charge to each protein in proportion to protein mass. The SDS-PAGE was carried out according to the Laemmli’s protocol (Laemmli 1970). The protein sample was boiled at 100°C for 10 min in the presence of a loading buffer 1X containing 5.0% b-mercaptoethanol (as a reducing agent), 2.0% SDS, 0.001% bromophenol blue (as a colour marker) and 10% glycerol (to increase the solution density). The protein samples (5-10 µg) were subsequently applied to one end of a vertical layer of 15% polyacrylamide gel submerged in 0.025 M Tris-HCl, 0.2 M glycine pH 8.3 and 0.1% SDS. SigmaMarker low range was run in a separate lane in the gel containing the proteins; BSA (66 kDa), Ovalbumin (45 kDa), Glyceraldehyde-3-phosphate dehydrogenase (36 kDa), Carbonic anhydrase (29 kDa), Trypsinogen (24 kDa), Trypsin inhibitor (20.1 kDa), a-Lactalbumin (14.2 kDa) and Aprotonin (6.5 kDa). A constant electric current of 25 mA was applied for 2 hours, causing the negatively charged proteins to migrate across the gel. The gel was stained by a solution of 0.1% Coomassie Brilliant Blue R250, 25% isopropilic alcohol, 10% acidic acid for 30 min,
and subsequently de-stained by a solution of 30% ethanol, 10% acidic acid. The de-stained gel was finally stored in a solution containing 10% acetic acid. 2.4.4 Protein concentration assay To determine the amount of protein in a solution the Bradford method was used. This is a rapid and sensitive method for the quantification of protein in the microgram range and it utilises the principle of protein-dye binding (Bradford 1976). The Bradford assay is a colorimetric protein assay based on an absorbance shift in the Comassie dye when bound to arginine and hydrophobic amino acid residues present in proteins. The bound form of the dye has a blue colour and exhibits a maximum absorbance at 595 nm. The increase of absorbance at this wavelength is proportional to the amount of bound dye, and in consequence to the concentration of protein in the solution sample. A protein solution of known concentration of 1 mg/ml bovine serum albumin (BSA) was used as standard. The protein concentration was determined by a double beam Cary 1E spectrophotometer (Varian, Mulgrade, Victoria, Australia). 2.4.5 Western blot analysis Protein samples were separated using SDS-PAGE. In order to visualize the presence of GGBP-M182C dimer, two SDS-PAGE gels were prepared in which loading and running buffers were in the absence and in the presence of b-mercaptoethanol. After electrophoresis runs, the gels were equilibrated in the transfer buffer (25 mM Tris-HCl pH 8.0, 190 mM glycine, 10% methanol). In order to make the proteins accessible to antibody detection, they were transferred from the gels to a Polyvinylidene Fluoride (PVDF) Immobilon P membranes (Millipore) which were previously treated with a methanol solution for 10 seconds to remove or minimize the hydrophobic properties of the membrane, washed in water for 2 min and finally equilibrated in the transfer buffer for 5 min. The treated membranes were placed face-to-face with the gels, and a 48 mA current was applied to plates on either side over night at 4°C. The charged proteins moved from within the gel onto the membrane. As a result of this "blotting" process, the proteins were exposed on a thin surface layer for detection. Blocking of non-specific binding was achieved by placing the membrane in a dilute blocking solution of 5% non-fat dry milk in TBS 1X (20 mM tris-HCl pH 7.5, 140 mM NaCl, 0.1% Tween 20) under constant agitation at room temperature for 90 min. After blocking, mouse serum containing the primary antibody against GGBP (after a dilution 1:1000) was added, and the membranes were re-incubated under gentle agitation for 60 min. In order to rinse the membranes from unbound antibody, three 10 min washes in a TBS 1X solution were performed. Subsequently the membranes were incubated with a secondary antibody (anti-mouse diluted 1:3000) which is
directed to the species-specific portion (Fc) of the primary antibody. The secondary antibody was also linked to the reporter enzyme horseradish peroxidase. After incubation for 1.0 hour the membrane was washed 3 times with a TBS 1X solution for 15 min. To detect the peroxidase activity, the chemiluminescent substrate was added and the emission of the reaction product (produces luminescence) was measured using the kit "enhanced chemiluminescent" (ECL) plus detection method (GE Healthcare). The western blot image was analysed by densitometry, using Chemi-doc and the software Quantity One (Biorad). 2.5 Molecular Dynamics The model of the GGBP-WT/Glc complex was based on the X-ray structure deposited in the Protein Data Bank, entry 2GBP (Vyas et al 1987, Vyas et al 1988) Bad contacts were repaired by minimization of the conformation energy and the resulting coordinates were used as an input for the AMBER 5.0 software. Cornell et al 1995 force field was completed by GLYCAM force constants for the glucose. A periodic box of water atoms (TIP3P) was added and water molecules overlapping with the volume of the protein were removed. This leaded to simulated system consisting of 30.000 atoms with a periodic box size of 65 Å by 55 Å by 85 Å. 2.5.1 Computational Protocol Fully solvated trajectories were computed using the SANDER module of the AMBER 5.0 package. The Particle Mesh Ewald (PME) summation method of electrostatic interactions (Darden et al 1993) enabled unrestrained MD simulations of the solvated protein to be reached in a nanosecond regime. Standard computational procedures and equilibration protocol were used: all atoms were propagated according to Newton's equations using the leapfrog algorithm with a time step of 2 fsec, the SHAKE on hydrogens (tolerance = 5 × 10⁻⁴ Å), temperature of 300 K with the Berendsen temperature coupling and a time constant of 0.2 psec (with different scaling factors for atoms of the solute and for atoms of the solvent for avoiding the cold-solute hot-solvent problem), a 9 Å cutoff for the Lennard-Jones interactions, constant pressure with an isotropic molecule-based scaling (time constant of 0.2 psec), and the nonbonded list updated each 10th step. Equilibration of the structure started by 1000 minimization steps followed by a 25-psec dynamics with a 9 Å cut-off on all interactions and another 25 psec dynamics with the PME summation. The equilibration was followed by five rounds of 600-step minimizations with the solute restraints reduced by 5 kcal/mol per each round. A goal of this protocol was to equilibrate counter ions and water first and then to let the protein relax slowly away from the starting geometry. The procedure allowed reduction of bad contacts, poor bonds, angles, and dihedral deviations while helping the modelled structure to remain close to the initial geometry. Finally, the system was heated in 5 psec from 100 K to
300 K and the production runs were initiated (1.5-4 nsec). Dynamics of the structure were visualized by the VMD software package, time development of the distances, angles, torsion angle parameters, and hydrogen bonding were resolved by the CARNAL module of the AMBER 5.0 package. 2.5.2 Elevated Temperature MD Simulations Since only extremely large computational resources (hundreds of processors) would permit the extension of simulations to the microsecond regime we have used well established procedures of the simulation temperature heightening for acceleration of relaxation processes. A set of MD runs performed at different temperatures (300 K, 350 K, 400 K, 450 K) as a loading test of the GGBP-WT Ca-free stability. 2.6 Structural Characterisation of GGBP-WT, GGBP-WT Ca-free and GGBP-M182C 2.6.1 Circular Dichroism Spectroscopy Circular dichroism (CD) data were measured on samples of GBP-WT and GBP-M182C under a nitrogen flow on a J-810 Spectropolarimeter (Jasco, Tokyo, Japan) equipped with the Neslab RTE-110 temperature-controlled liquid system (Neslab Instruments, Portsmouth, NH). The instrument was calibrated with a standard solution of (+)-10-camphorsulfonic acid. Sealed cuvettes with a 0.1 cm path length (Helma, Jamaica, NJ) were used. During the measurement the photomultiplier voltage never exceed 600 V. All spectra were averaged five times and smoothed with the Spectropolarimeter System Software, Version 1.00 (Jasco, Japan). 2.6.2 Thermal denaturation Thermal denaturation was performed on samples of GGBP-WT and GGBP-M182C in 10 mM Tris-HCl pH 7.5 with the protein concentration of 0.2 mg/ml in the absence and in the presence of saturation amount of glucose (1.0 mM). The results are expressed in terms of the molar ellipticity. Before measurements, all samples were temperature equilibrated for 2 minutes. The molar ellipticity at 222 nm from each spectrum was plotted against temperature. Finally, the temperature of protein melting (Tm) was calculated as the temperature corresponding to 50% of the
variation in maximum and minimum molar ellipticity. To facilitate visualisation of the trend of the denaturation curve the experimental data were fitted with the Boltzmann sigmoid function. 2.6.3 Chemical denaturation GGBP chemical denaturation was performed by addition of variable amounts of 10 mM Tris-HCl pH 7.5 containing 8 M GdnHCl, to modulate the final concentration of GdnHCl in the 0.0 – 4.0 M range. Measurements were performed 24 h later, leaving the solutions at 4°C. By that time, all solutions were at equilibrium, as demonstrated by the absence of any further change of their spectroscopic properties. The molar ellipticity at 222 nm from each spectrum was plotted against GdnHCl concentration. Finally, the concentration of protein melting (C1/2) was calculated as the concentration corresponding to 50% of the variation in maximum and minimum molar ellipticity. To facilitate visualisation of the trend of the denaturation curve the experimental data were fitted with the Boltzmann sigmoid function. 2.6.4 Steady-State Fluorescence Spectroscopy Fluorescence data were measured on samples of GGBP-WT and GGBP-M182C in 10 mM Tris-HCl pH 7.5 with the protein concentration of 0.05 mg/ml in the absence and in the presence of saturation amount of glucose (1.0 mM). Steady state fluorescence measurements were performed on the K2 fluorometer (ISS, Champaign, IL, USA) equipped with the two-cell temperature controlled sample holder. Tryptophane fluorescence was excited at 295 nm with the slit width of 1 nm, in order to avoid tyrosine contribution. Extrinsic probes fluorescence was excited at maximum pick of absorbance and with stirring the cuvette before each measurement in order to compensate the photobleaching. 2.6.5 Thermal denaturation Fluorescence measurements were conducted with sample volumes of 1.0 ml in a quartz cuvette under continuous agitation. The emission spectra were obtained on a K2 spectrofluorometer with steady-state excitation (ISS, Champaign, IL, USA) equipped with a two-cell temperature controlled sample holder. Temperature was controlled by a water bath (Thermo Haake C10) and the sample temperature was measured directly in the cuvette. During the thermal denaturation experiments the temperature was raised from 20°C to 95.0°C in 2.5°C increments. Temperature of
samples was measured directly in the cuvette with an accuracy of ±0.2°C. Before measurements, all samples were temperature equilibrated for 2 minutes. The fluorescence emission intensities at the maximum peak from each spectrum were plotted against temperature. The corrected protein fluorescence intensity was obtained by correcting for quenching of tryptophane or probe fluorescence intensity by temperature alteration. Finally, the temperature of protein melting (Tm) was calculated as the temperature corresponding to 50% of the variation in maximum and minimum fluorescence emission intensity. To facilitate visualisation of the trend of the denaturation curve the experimental data were fitted with the Boltzmann sigmoid function. 2.6.6 Chemical denaturation GGBP chemical denaturation was performed by addition of variable amounts of 10 mM Tris-HCl pH 7.5 containing 8 M GdnHCl, to modulate the final concentration of GdnHCl in the 0.0 – 4.0 M range. Measurements were performed 24 h later, leaving the solutions at 4°C. By that time, all solutions were at equilibrium, as demonstrated by the absence of any further change of their spectroscopic properties. Fluorescence measurements were conducted with sample volumes of 1.0 ml in a quartz cuvette under continuous agitation. The emission spectra were obtained on a K2 spectrofluorometer with steady-state excitation (ISS, Champaign, IL, USA) equipped with a two-cell temperature controlled sample holder. Temperature was controlled by a water bath (Thermo Haake C10) and the sample temperature was measured directly in the cuvette. During the chemical denaturation experiments the temperature was 20°C. The fluorescence emission intensities at the maximum peak from each spectrum were plotted against GdnHCl concentration. Finally, the concentration of protein melting (C1/2) was calculated as the concentration corresponding to 50% of the variation in maximum and minimum fluorescence emission intensity. To facilitate visualisation of the trend of the denaturation curve the experimental data were fitted with the Boltzmann sigmoid function. 2.6.7 Fluorescence Quenching
Trp fluorescence was quenched by acrylamide and observed at the fluorescence maximum. Steady state quenching was analyzed by the Stern-Volmer equation:
I0/I = 1 + Ksv * [Q] = 1 + kq t0 * [Q] where I0 and I are the fluorescence intensities in the absence and in the presence of the quencher, respectively, [Q] is the concentration of the quencher, [bar ]0 is a mean radiative lifetime in the absence of quencher, and Ksv and kq are the Stern-
Volmer and the bimolecular quenching constants, respectively. The time resolved quenching experiments were analyzed by the formula: t 0/ t = 1 + Ksv * [Q] = 1 + kq t 0 * [Q] where [bar ]0 and [bar ] stand for the mean fluorescence lifetime in the absence and in the presence of acrylamide. For pure collisional quenching the ratio [bar ]0/[bar ] equals to I0/I. 2.6.7 Frequency-domain Fluorescence Spectroscopy Frequency domain measurements were performed on the K2 fluorometer (ISS, Champaign, IL, USA) equipped with 2-cell temperature controlled sample holder. The excitation source was lamp at 350 nm. The GGBP-M182C/Acrylodan emission was selected by a Schott 450 nm long pass filter. Fluorescence intensity decays were analyzed in terms of the multi-exponential model I (t) = S ai * exp (-t/ti) where ai are the pre-exponential factors, t i the decay times, and S?a i = 1.0. The fractional intensity fi of each decay component were calculated from the formula fi = a i ti / S ai ti and the mean lifetimes as tmean = S fi ti
2.6.8 Fluorescence Anisotropy Fluorescence anisotropy measurements were performed on the K2 fluorometer (ISS, Champaign, IL, USA) equipped with 2-cell temperature controlled sample holder. The anisotropic and polarization values were recorded in the time course of 2 minutes and the excitation source was lamp at 350 nm.
2.6.9 Labelling of GGBP-M182C with Acrylodan For cysteine 182 labelling, a threefold excess of Acrylodan in DMF was added drop-wise to a solution of 5.0 mg/ml of GGBP-M182C in 10 mM Tris-HCl pH 7.0, and then the solution was left to react for 2 hours at room temperature protected from light. The resulting labeled protein was separated from the free dye by Sephadex G-25 column. Measurements of absorption between 400 nm and 220 nm of each fraction were achieved to detect the conjugates. The eluted fractions, corresponding to the first fluorescent volume excluded, represented the labelled proteins. The fractions containing the conjugates were pooled and a final absorbance spectrum was performed to determine the degree of labelling. 2.6.10 Labelling of GGBP-M182C with Dansyl Chloride While for N-terminus labelling, a threefold excess of Dansyl Chloride in DMF was added drop-wise to a solution of 5.0 mg/ml of GGBP-M182C in 10 mM Tris-HCl pH 7.0, and then the solution was left to react for 2 hours at 37°C protected from light. The resulting labeled protein was separated from the free dye by Sephadex G-25 column. Measurements of absorption between 400 nm and 220 nm of each fraction were achieved to detect the conjugates. The eluted fractions, corresponding to the first fluorescent volume excluded, represented the labelled proteins. The fractions containing the conjugates were pooled and a final absorbance spectrum was performed to determine the degree of labelling. 2.6.11 Labelling of GGBP-M182C with Acrylodan/Rhodamine A solution of 5.0 mg/ml GGBP-M182C in 10 mM Tris-HCl pH 7.2 was reacted with a threefold excess of acrylodan in DMSO for 3 hours at room temperature. The resulting labeled protein was separated from the free dye by Sephadex G-25 column. Measurements of absorption between 400 nm and 220 nm of each fraction were achieved to detect the conjugates. The eluted fractions, corresponding to the first fluorescent volume excluded, represented the labelled proteins. The fractions containing the conjugates were pooled and a final absorbance spectrum was performed to determine the degree of labelling. The GBP-M182C-Acrylodan obtained was reacted with a threefold excess rhodamine (Tetrametylrhodamine Isothiocyanate) in DMSO for 30 minutes at 37°C. The resulting labeled protein was separated from the free dye by Sephadex G-25 column. Measurements of absorption between 400 nm and 220 nm of each fraction were achieved to detect the conjugates. The eluted fractions, corresponding to the first fluorescent volume excluded, represented the labelled proteins. The fractions
containing the conjugates were pooled and a final absorbance spectrum was performed to determine the degree of labelling. 2.6.12 Determination of the degree of labelling The relative efficiency of the labelling reaction was determined by measuring the absorbance of the protein at 280 nm and the absorbance of the dyes at its absorbance maximum. Using the Beer-Lambert law the approximate number of dye molecules per protein molecule was calculated. Initially the protein concentration was determined and corrected for the contribution of the dye to the absorbance at A280: Correction factor (CF) = A280 free dye / Amax free dye Aprotein = A280 – (A280 x CF) The protein concentration was calculated and the degree of labelling (DOL) was determined: DOL = Amax x MW / [protein] x Edye in which Amax is the maximum absorbance of dyes, MW was the molecular weight, Edye was the extinction coefficient of the dyes at their absorbance maximum and the protein concentration was in mg/ml. 2.6.13 FT-IR Spectroscopy GGBP-WT or GGBP-M182C mutant concentrated solutions were prepared in 2H2O or 1H2O medium, in the absence and in the presence of D-glucose. The buffers used for infrared analysis were 25 mM Hepes/NaO2H, p2H 7.0 or pH 7.0 (buffer A) and 25 mM Hepes/NaO2H, 10 mM D-glucose, p2H 7.0 or pH 7.0 (buffer B). The p2H corresponds to the pH meter reading + 0.4.11 About 1.5 mg of protein, dissolved in the buffer used for its purification, were concentrated to a volume of approximately 50 µl using a “10 K Centricon” micro concentrator (Amicon) at 3000 x g and 4 °C. Afterwards, 250 µl of buffer (A) (pH or p2H 7.0) or buffer (B) (pH or p2H 7.0) were added and the protein solution was concentrated again. This procedure was repeated several times, in order to replace completely the original buffer with buffer (A, pH or p2H 7.0) or buffer (B, pH or p2H 7.0). In the last washing, the protein solution was concentrated to a final volume of approximately 40 µl and used for FT-IR measurements. the concentrated protein samples were placed in a thermostated Graseby Specac 20500 cell (Graseby-Specac Ltd, Orpington, Kent, UK) fitted with CaF2 windows and
a 25 µm Teflon spacer. FT-IR spectra were recorded by means of a Perkin-Elmer 1760-x Fourier transform infrared spectrometer using a deuterated triglycine sulphate detector and a normal Beer-Norton apodization function. At least 24 hours before, and during data acquisition the spectrometer was continuously purged with dry air at dew point of 20 – 70 °C, obtained by using a Parker Balston 75-62 FT-IR air dryer (Balston AGS, Haverhill, MA). Spectra of buffers and samples were acquired at 2 cm-
1 resolution under the same scanning and temperature conditions. In the thermal denaturation experiments, the temperature was raised in 5°C steps from 20°C to 95°C using an external bath circulator (HAAKE F3). Temperature in the cell was controlled by a thermocouple placed directly onto the CaF2 windows. Before spectrum acquisition, samples were maintained at the desired temperature for the time necessary for the stabilization of temperature inside the cell (6 min). Spectra were collected and processed using the SPECTRUM software from Perkin-Elmer. Correct subtraction of H2O was judged to yield an approximately flat baseline at 1900-1400 cm-1, and subtraction of 2H2O was adjusted to the removal of the 2H2O bending absorption close to 1220 cm–1. The deconvoluted parameters were set with a gamma value of 2.5 and a smoothing length of 60. Second derivative spectra were calculated over a 9-data-point range (9 cm-1). The percentage of 1H/2H exchange was obtained by monitoring the intensity of the amide II band at 1550 cm-1. In the spectrum of the protein recorded in H2O the intensity at 1550 cm-1 was considered corresponding to 100% of amide hydrogens (1H). In the spectrum of the protein in 2H2O medium full 1H/2H exchange was considered to occur at 98°C, temperature at which the protein was completely unfolded. In this spectrum the intensity at 1550 cm-
1 was taken as a reference for 0% of amide hydrogens (1H).
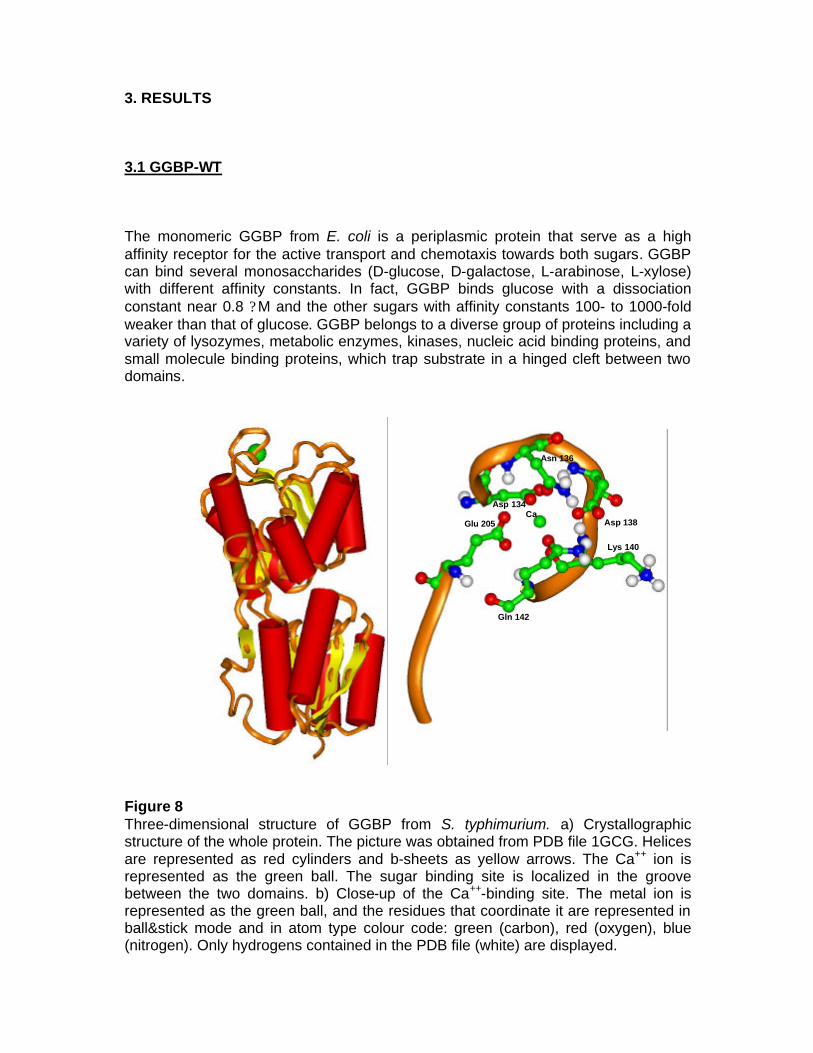
3. RESULTS 3.1 GGBP-WT The monomeric GGBP from E. coli is a periplasmic protein that serve as a high affinity receptor for the active transport and chemotaxis towards both sugars. GGBP can bind several monosaccharides (D-glucose, D-galactose, L-arabinose, L-xylose) with different affinity constants. In fact, GGBP binds glucose with a dissociation constant near 0.8 ?M and the other sugars with affinity constants 100- to 1000-fold weaker than that of glucose. GGBP belongs to a diverse group of proteins including a variety of lysozymes, metabolic enzymes, kinases, nucleic acid binding proteins, and small molecule binding proteins, which trap substrate in a hinged cleft between two domains. Figure 8 Three-dimensional structure of GGBP from S. typhimurium. a) Crystallographic structure of the whole protein. The picture was obtained from PDB file 1GCG. Helices are represented as red cylinders and b-sheets as yellow arrows. The Ca++ ion is represented as the green ball. The sugar binding site is localized in the groove between the two domains. b) Close-up of the Ca++-binding site. The metal ion is represented as the green ball, and the residues that coordinate it are represented in ball&stick mode and in atom type colour code: green (carbon), red (oxygen), blue (nitrogen). Only hydrogens contained in the PDB file (white) are displayed.
Glu 205
Gln 142
Lys 140
Asp 138
Asn 136
Asp 134Ca
Glu 205
Gln 142
Lys 140
Asp 138
Asn 136
Asp 134Ca
3.1.1 Isolation of GGBP-WT The mglb gene that encodes for wild-type GGBP and its natural promoter were isolated from the E. coli K-12 genome by Polymerase Chain Reaction (PCR). The gene-promoter DNA fragment was cloned into the SacI/PstI restriction sites of the plasmid pTZ18U. The GGBP-WT was overproduced in E. coli NM303 (F1 mgl 503 lacZ lacY1 recA1), a mutant strain that does not produce GGBP. The cultures consisted of 0.5% inoculum, 50 µg/ml ampicillin in 2 L Luria-Bertani (LB) medium (10 g/liter bacto-tryptone, 5 g/liter bacto-yeast extract, 10 g/liter NaCl, pH 7.2) and 1.0 mM D-fucose incubated at 37°C for 16-18 hours. Cells were harvested and GGBP-WT was extracted by osmotic shock as Neu and Heppel protocol (Neu et al 1965). The crude extract was dialyzed against 10 mM Tris–HCl pH 7.5 at 4°C for 16-18 hours. The GGBP-WT was purified using a DEAE anion-exchange column (Bio-Rad). GGBP-WT was eluted with a 10 mM Tris-HCl, pH 7.5, gradient from 0 to 0.5 M NaCl. Fractions were analyzed for the presence of GGBP-WT by SDS–PAGE, and fractions containing GGBP-WT were pooled and dialyzed against 10 mM Tris-HCl pH 7.5 at 4°C for 16-18 hours. 3.1.2 Structural characterization of GGBP-WT The GGBP has two globular domains attached by a flexible hinge and, in the ligand-bound structures, the glucose is buried deep within the cleft between the two domains. Conformational changes involving the hinge are thought to be necessary for sugars to get in and out of the protein binding site. Upon interaction with its saccharide ligands, GGBP undergoes a conformational change to facilitate the interaction of bound GGBP to the membrane-anchored chemoreceptor. Based on this conformational change, sensing system for glucose can be developed. Knowledge of the details of structural properties as well as the conformational stability of GGBP is needed when developing biotechnological applications. Besides information on the basic knowledge, the new insights on GGBP constitute important data for the development of those biotechnological applications requiring detailed information on the protein structural-functional properties as in the case of manipulation of the protein to use as probe for a biosensor for glucose monitoring in different fields and with different properties. The binding of D-glucose to the native folded GGBP-WT was investigated by Differential Scanning Calorimetry, Circular Dichroism and Fluorescence Spectroscopy. As previous experiments showed (D’Auria et al 2004, Piszczek et al 2004), all techniques revealed a substantial transition-temperature increase produced by D-glucose binding. DSC data showed two unfolding transitions and a change in the character of the folding/unfolding process in the absence and presence of D-glucose. Moreover, intrinsic tryptophan fluorescence changes were ascribed to the C-terminal unfolding, allowing for an identification of the protein structural thermal transitions. On the basis of these observations, a mechanism of thermal unfolding/folding of GGBP-
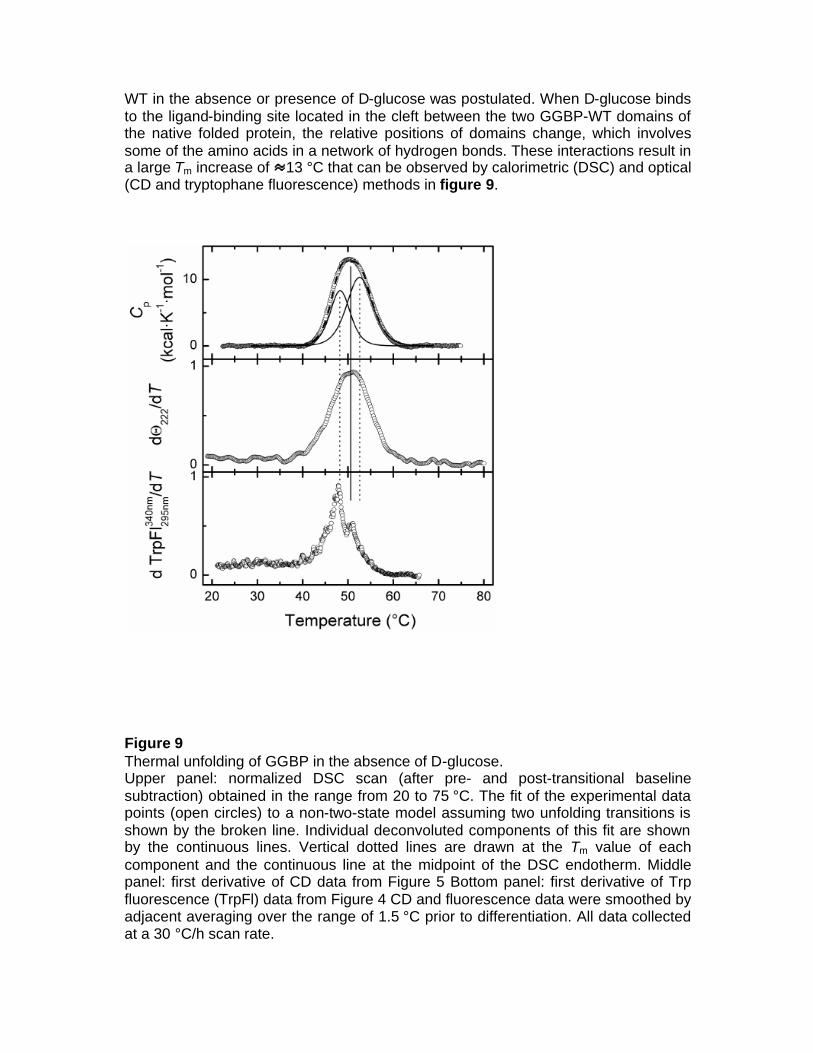
WT in the absence or presence of D-glucose was postulated. When D-glucose binds to the ligand-binding site located in the cleft between the two GGBP-WT domains of the native folded protein, the relative positions of domains change, which involves some of the amino acids in a network of hydrogen bonds. These interactions result in a large Tm increase of 13 °C that can be observed by calorimetric (DSC) and optical (CD and tryptophane fluorescence) methods in figure 9.
Figure 9 Thermal unfolding of GGBP in the absence of D-glucose. Upper panel: normalized DSC scan (after pre- and post-transitional baseline subtraction) obtained in the range from 20 to 75 °C. The fit of the experimental data points (open circles) to a non-two-state model assuming two unfolding transitions is shown by the broken line. Individual deconvoluted components of this fit are shown by the continuous lines. Vertical dotted lines are drawn at the Tm value of each component and the continuous line at the midpoint of the DSC endotherm. Middle panel: first derivative of CD data from Figure 5 Bottom panel: first derivative of Trp fluorescence (TrpFl) data from Figure 4 CD and fluorescence data were smoothed by adjacent averaging over the range of 1.5 °C prior to differentiation. All data collected at a 30 °C/h scan rate.
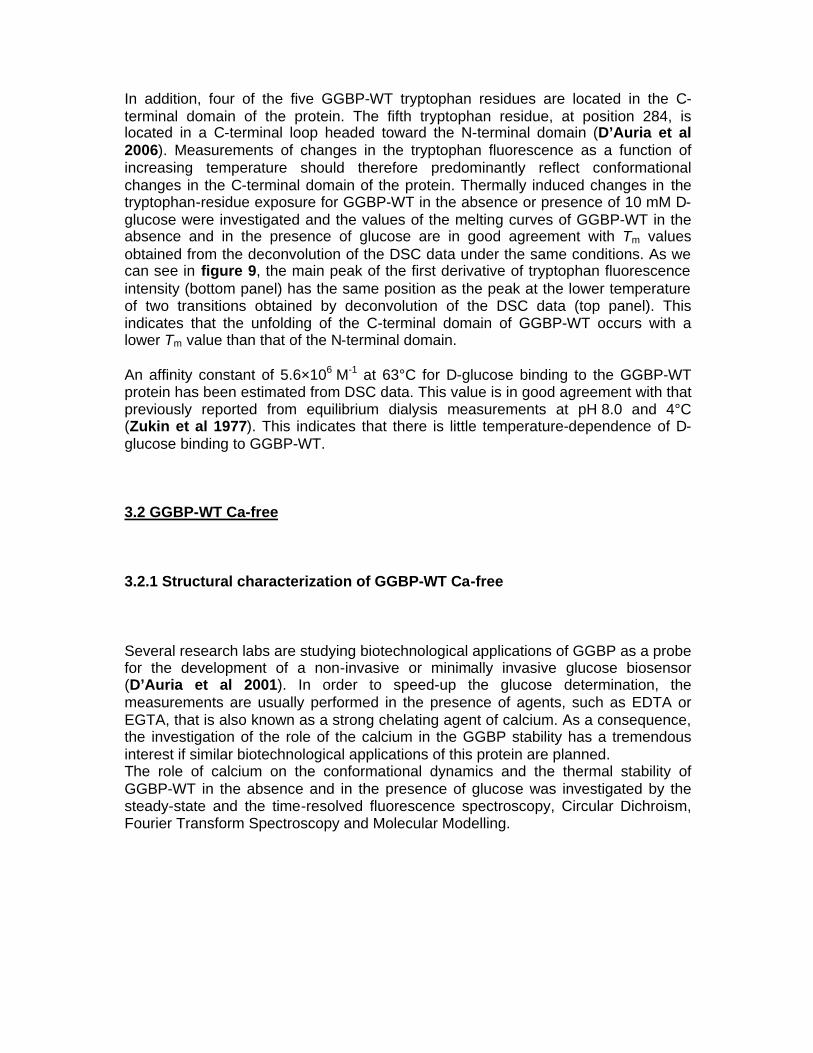
In addition, four of the five GGBP-WT tryptophan residues are located in the C-terminal domain of the protein. The fifth tryptophan residue, at position 284, is located in a C-terminal loop headed toward the N-terminal domain (D’Auria et al 2006). Measurements of changes in the tryptophan fluorescence as a function of increasing temperature should therefore predominantly reflect conformational changes in the C-terminal domain of the protein. Thermally induced changes in the tryptophan-residue exposure for GGBP-WT in the absence or presence of 10 mM D-glucose were investigated and the values of the melting curves of GGBP-WT in the absence and in the presence of glucose are in good agreement with Tm values obtained from the deconvolution of the DSC data under the same conditions. As we can see in figure 9, the main peak of the first derivative of tryptophan fluorescence intensity (bottom panel) has the same position as the peak at the lower temperature of two transitions obtained by deconvolution of the DSC data (top panel). This indicates that the unfolding of the C-terminal domain of GGBP-WT occurs with a lower Tm value than that of the N-terminal domain. An affinity constant of 5.6×10⁶ M-1 at 63°C for D-glucose binding to the GGBP-WT protein has been estimated from DSC data. This value is in good agreement with that previously reported from equilibrium dialysis measurements at pH 8.0 and 4°C (Zukin et al 1977). This indicates that there is little temperature-dependence of D-glucose binding to GGBP-WT. 3.2 GGBP-WT Ca-free 3.2.1 Structural characterization of GGBP-WT Ca-free Several research labs are studying biotechnological applications of GGBP as a probe for the development of a non-invasive or minimally invasive glucose biosensor (D’Auria et al 2001). In order to speed-up the glucose determination, the measurements are usually performed in the presence of agents, such as EDTA or EGTA, that is also known as a strong chelating agent of calcium. As a consequence, the investigation of the role of the calcium in the GGBP stability has a tremendous interest if similar biotechnological applications of this protein are planned. The role of calcium on the conformational dynamics and the thermal stability of GGBP-WT in the absence and in the presence of glucose was investigated by the steady-state and the time-resolved fluorescence spectroscopy, Circular Dichroism, Fourier Transform Spectroscopy and Molecular Modelling.
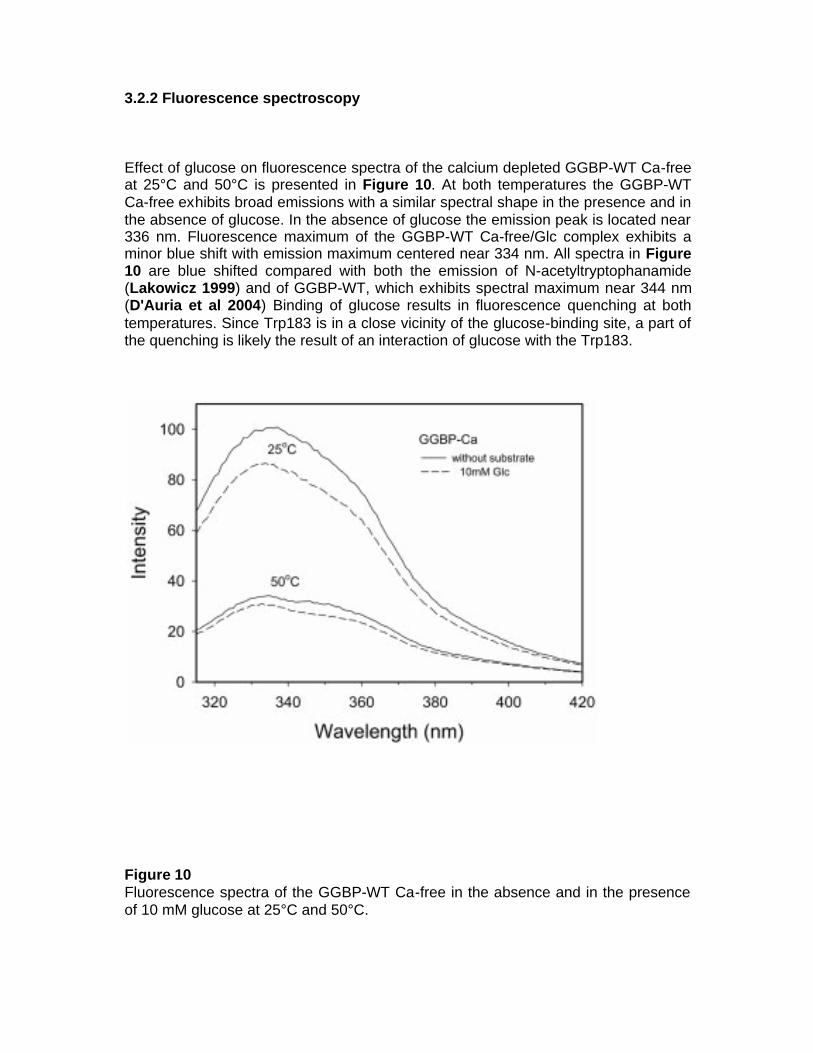
3.2.2 Fluorescence spectroscopy Effect of glucose on fluorescence spectra of the calcium depleted GGBP-WT Ca-free at 25°C and 50°C is presented in Figure 10. At both temperatures the GGBP-WT Ca-free exhibits broad emissions with a similar spectral shape in the presence and in the absence of glucose. In the absence of glucose the emission peak is located near 336 nm. Fluorescence maximum of the GGBP-WT Ca-free/Glc complex exhibits a minor blue shift with emission maximum centered near 334 nm. All spectra in Figure 10 are blue shifted compared with both the emission of N-acetyltryptophanamide (Lakowicz 1999) and of GGBP-WT, which exhibits spectral maximum near 344 nm (D'Auria et al 2004) Binding of glucose results in fluorescence quenching at both temperatures. Since Trp183 is in a close vicinity of the glucose-binding site, a part of the quenching is likely the result of an interaction of glucose with the Trp183.
Figure 10 Fluorescence spectra of the GGBP-WT Ca-free in the absence and in the presence of 10 mM glucose at 25°C and 50°C.
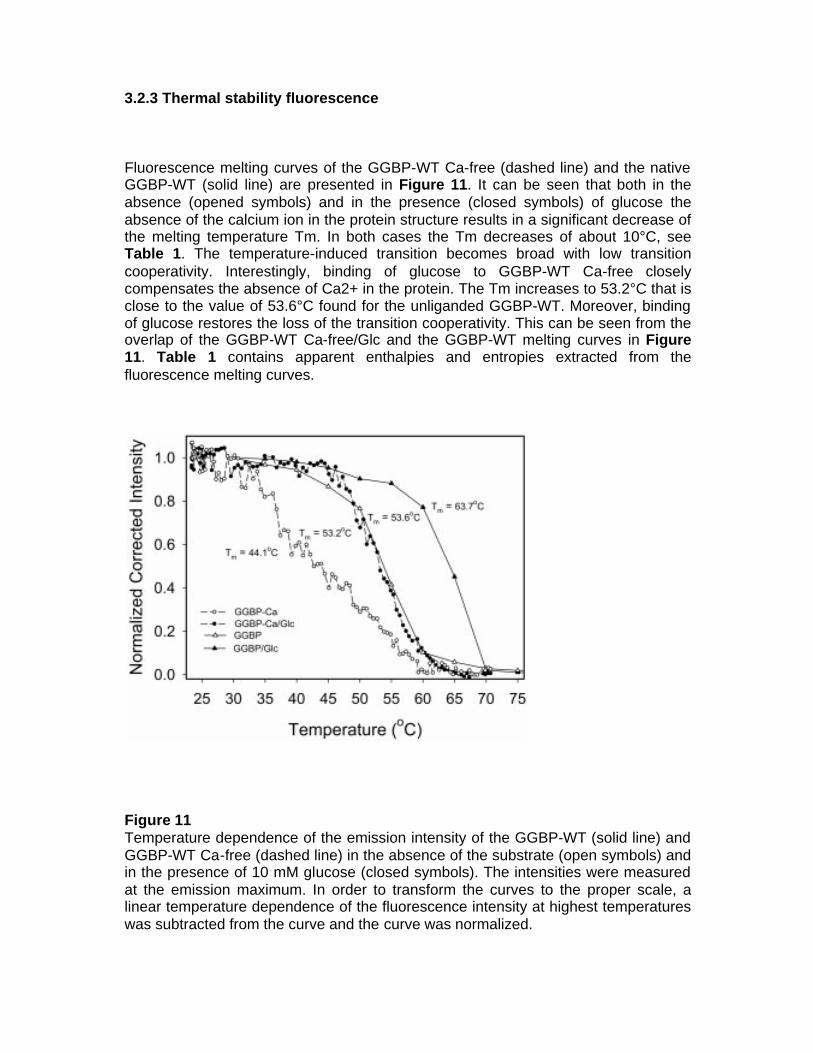
3.2.3 Thermal stability fluorescence Fluorescence melting curves of the GGBP-WT Ca-free (dashed line) and the native GGBP-WT (solid line) are presented in Figure 11. It can be seen that both in the absence (opened symbols) and in the presence (closed symbols) of glucose the absence of the calcium ion in the protein structure results in a significant decrease of the melting temperature Tm. In both cases the Tm decreases of about 10°C, see Table 1. The temperature-induced transition becomes broad with low transition cooperativity. Interestingly, binding of glucose to GGBP-WT Ca-free closely compensates the absence of Ca2+ in the protein. The Tm increases to 53.2°C that is close to the value of 53.6°C found for the unliganded GGBP-WT. Moreover, binding of glucose restores the loss of the transition cooperativity. This can be seen from the overlap of the GGBP-WT Ca-free/Glc and the GGBP-WT melting curves in Figure 11. Table 1 contains apparent enthalpies and entropies extracted from the fluorescence melting curves.
Figure 11 Temperature dependence of the emission intensity of the GGBP-WT (solid line) and GGBP-WT Ca-free (dashed line) in the absence of the substrate (open symbols) and in the presence of 10 mM glucose (closed symbols). The intensities were measured at the emission maximum. In order to transform the curves to the proper scale, a linear temperature dependence of the fluorescence intensity at highest temperatures was subtracted from the curve and the curve was normalized.
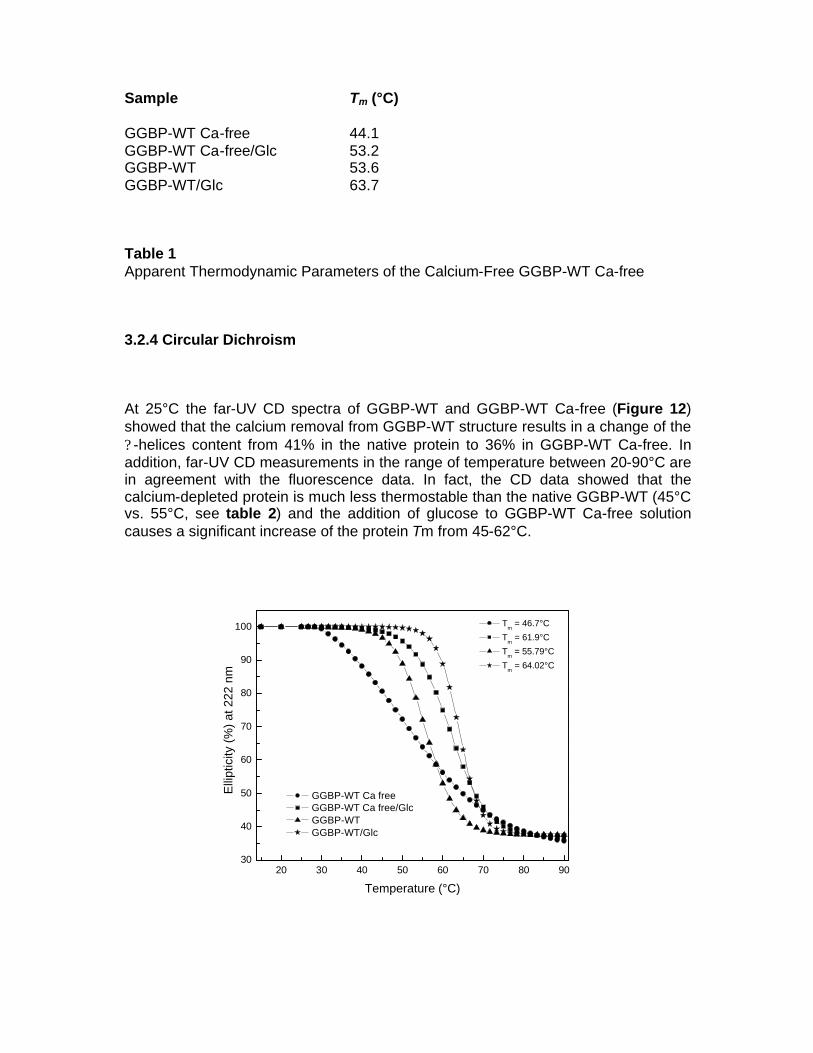
Sample Tm (°C) GGBP-WT Ca-free 44.1 GGBP-WT Ca-free/Glc 53.2 GGBP-WT 53.6 GGBP-WT/Glc 63.7 Table 1 Apparent Thermodynamic Parameters of the Calcium-Free GGBP-WT Ca-free 3.2.4 Circular Dichroism At 25°C the far-UV CD spectra of GGBP-WT and GGBP-WT Ca-free (Figure 12) showed that the calcium removal from GGBP-WT structure results in a change of the ? -helices content from 41% in the native protein to 36% in GGBP-WT Ca-free. In addition, far-UV CD measurements in the range of temperature between 20-90°C are in agreement with the fluorescence data. In fact, the CD data showed that the calcium-depleted protein is much less thermostable than the native GGBP-WT (45°C vs. 55°C, see table 2) and the addition of glucose to GGBP-WT Ca-free solution causes a significant increase of the protein Tm from 45-62°C.
20 30 40 50 60 70 80 9030
40
50
60
70
80
90
100 Tm = 46.7°C
Tm = 61.9°C
Tm = 55.79°C
Tm = 64.02°C
Elli
ptic
ity (
%)
at 2
22 n
m
Temperature (°C)
GGBP-WT Ca free GGBP-WT Ca free/Glc GGBP-WT GGBP-WT/Glc
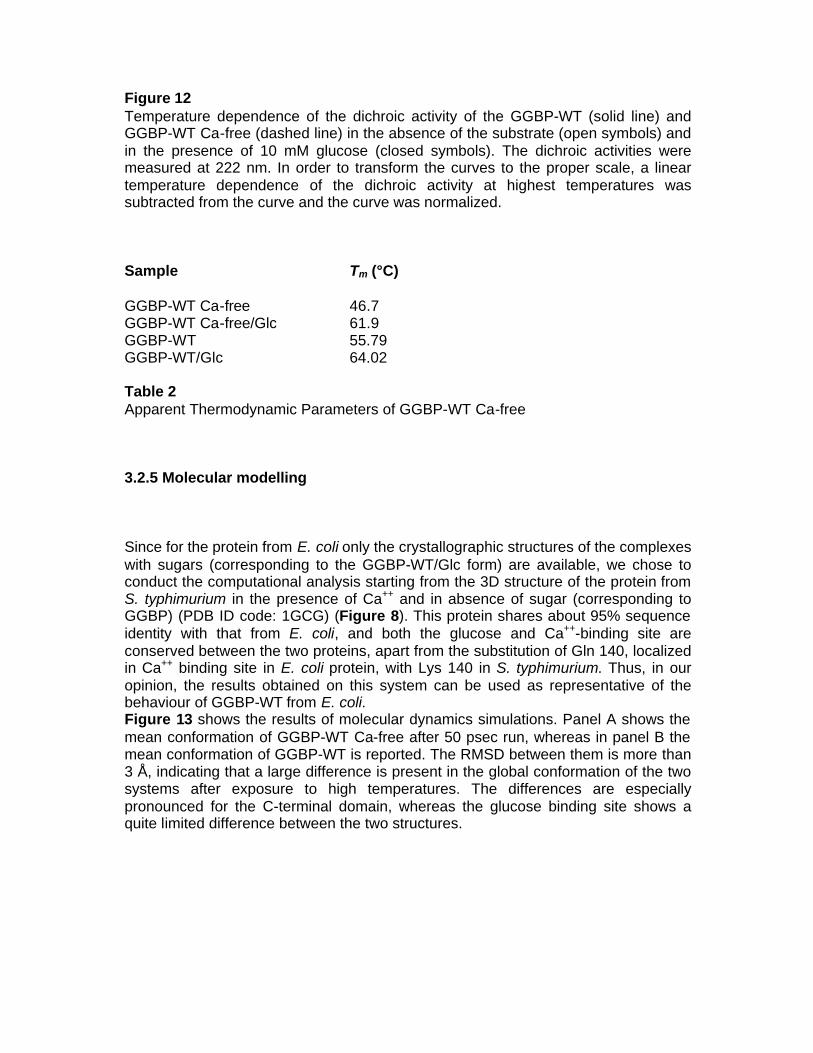
Figure 12 Temperature dependence of the dichroic activity of the GGBP-WT (solid line) and GGBP-WT Ca-free (dashed line) in the absence of the substrate (open symbols) and in the presence of 10 mM glucose (closed symbols). The dichroic activities were measured at 222 nm. In order to transform the curves to the proper scale, a linear temperature dependence of the dichroic activity at highest temperatures was subtracted from the curve and the curve was normalized. Sample Tm (°C) GGBP-WT Ca-free 46.7 GGBP-WT Ca-free/Glc 61.9 GGBP-WT 55.79 GGBP-WT/Glc 64.02 Table 2 Apparent Thermodynamic Parameters of GGBP-WT Ca-free 3.2.5 Molecular modelling Since for the protein from E. coli only the crystallographic structures of the complexes with sugars (corresponding to the GGBP-WT/Glc form) are available, we chose to conduct the computational analysis starting from the 3D structure of the protein from S. typhimurium in the presence of Ca++ and in absence of sugar (corresponding to GGBP) (PDB ID code: 1GCG) (Figure 8). This protein shares about 95% sequence identity with that from E. coli, and both the glucose and Ca++-binding site are conserved between the two proteins, apart from the substitution of Gln 140, localized in Ca++ binding site in E. coli protein, with Lys 140 in S. typhimurium. Thus, in our opinion, the results obtained on this system can be used as representative of the behaviour of GGBP-WT from E. coli. Figure 13 shows the results of molecular dynamics simulations. Panel A shows the mean conformation of GGBP-WT Ca-free after 50 psec run, whereas in panel B the mean conformation of GGBP-WT is reported. The RMSD between them is more than 3 Å, indicating that a large difference is present in the global conformation of the two systems after exposure to high temperatures. The differences are especially pronounced for the C-terminal domain, whereas the glucose binding site shows a quite limited difference between the two structures.
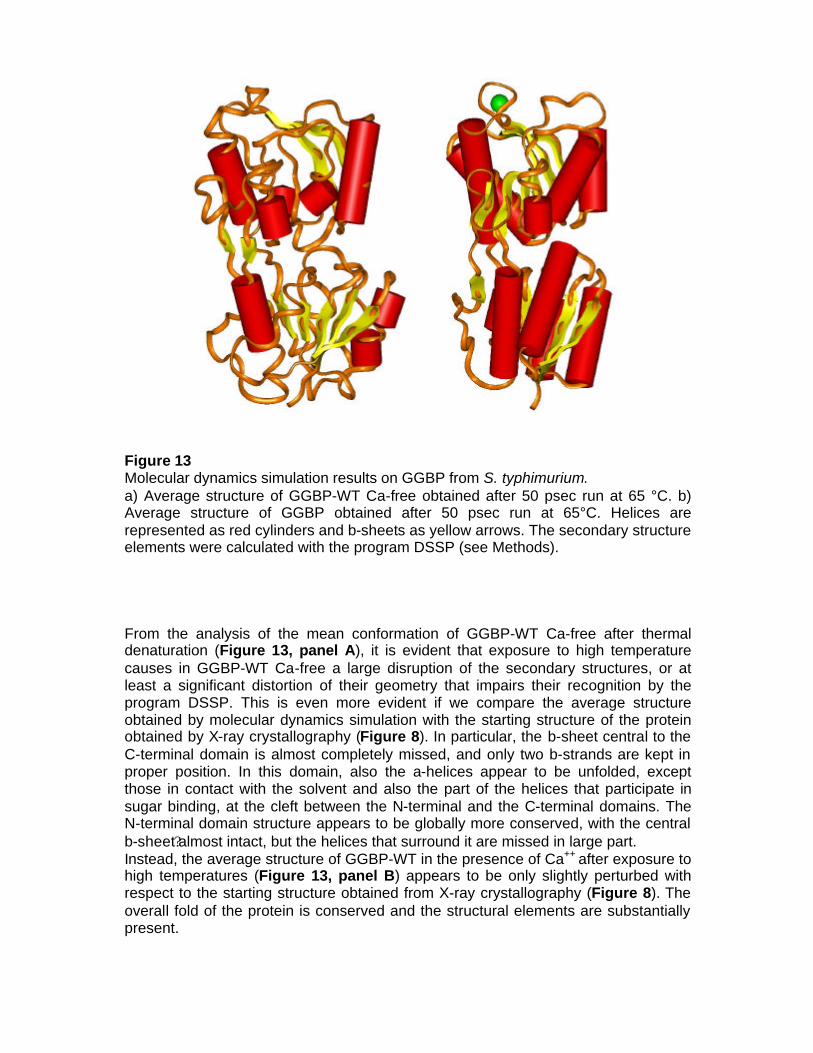
Figure 13 Molecular dynamics simulation results on GGBP from S. typhimurium. a) Average structure of GGBP-WT Ca-free obtained after 50 psec run at 65 °C. b) Average structure of GGBP obtained after 50 psec run at 65°C. Helices are represented as red cylinders and b-sheets as yellow arrows. The secondary structure elements were calculated with the program DSSP (see Methods). From the analysis of the mean conformation of GGBP-WT Ca-free after thermal denaturation (Figure 13, panel A), it is evident that exposure to high temperature causes in GGBP-WT Ca-free a large disruption of the secondary structures, or at least a significant distortion of their geometry that impairs their recognition by the program DSSP. This is even more evident if we compare the average structure obtained by molecular dynamics simulation with the starting structure of the protein obtained by X-ray crystallography (Figure 8). In particular, the b-sheet central to the C-terminal domain is almost completely missed, and only two b-strands are kept in proper position. In this domain, also the a-helices appear to be unfolded, except those in contact with the solvent and also the part of the helices that participate in sugar binding, at the cleft between the N-terminal and the C-terminal domains. The N-terminal domain structure appears to be globally more conserved, with the central b-sheet?almost intact, but the helices that surround it are missed in large part. Instead, the average structure of GGBP-WT in the presence of Ca++ after exposure to high temperatures (Figure 13, panel B) appears to be only slightly perturbed with respect to the starting structure obtained from X-ray crystallography (Figure 8). The overall fold of the protein is conserved and the structural elements are substantially present.
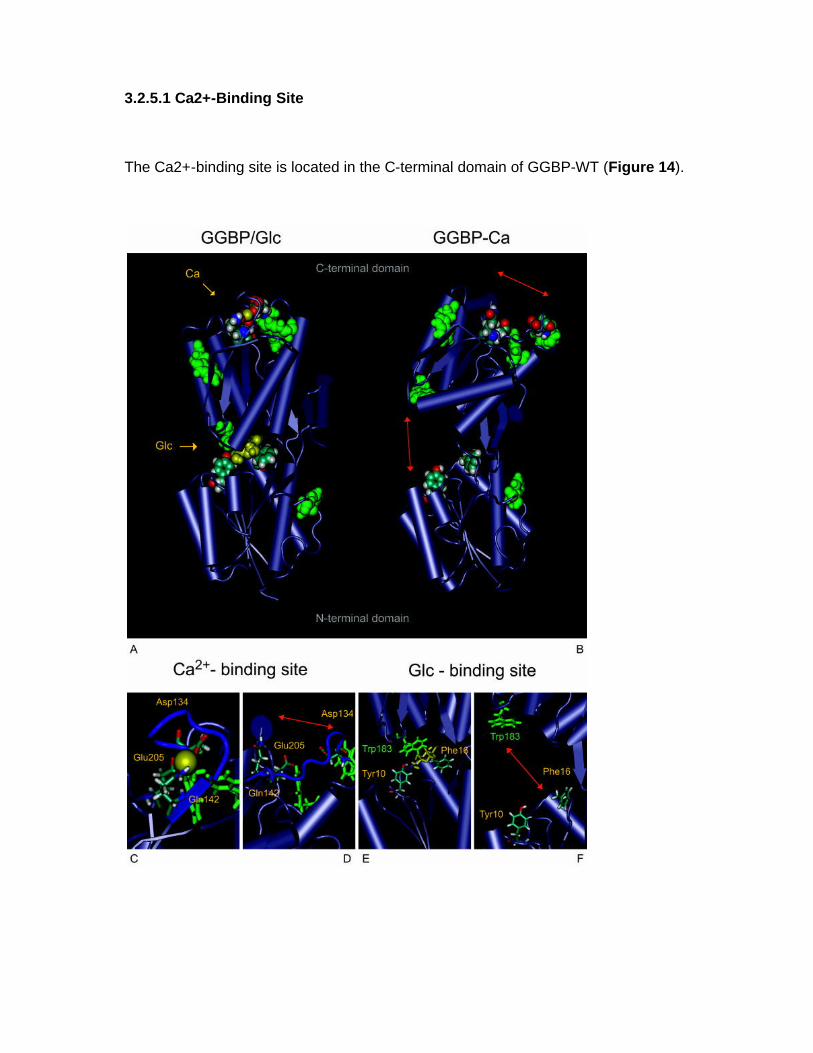
3.2.5.1 Ca2+-Binding Site The Ca2+-binding site is located in the C-terminal domain of GGBP-WT (Figure 14).
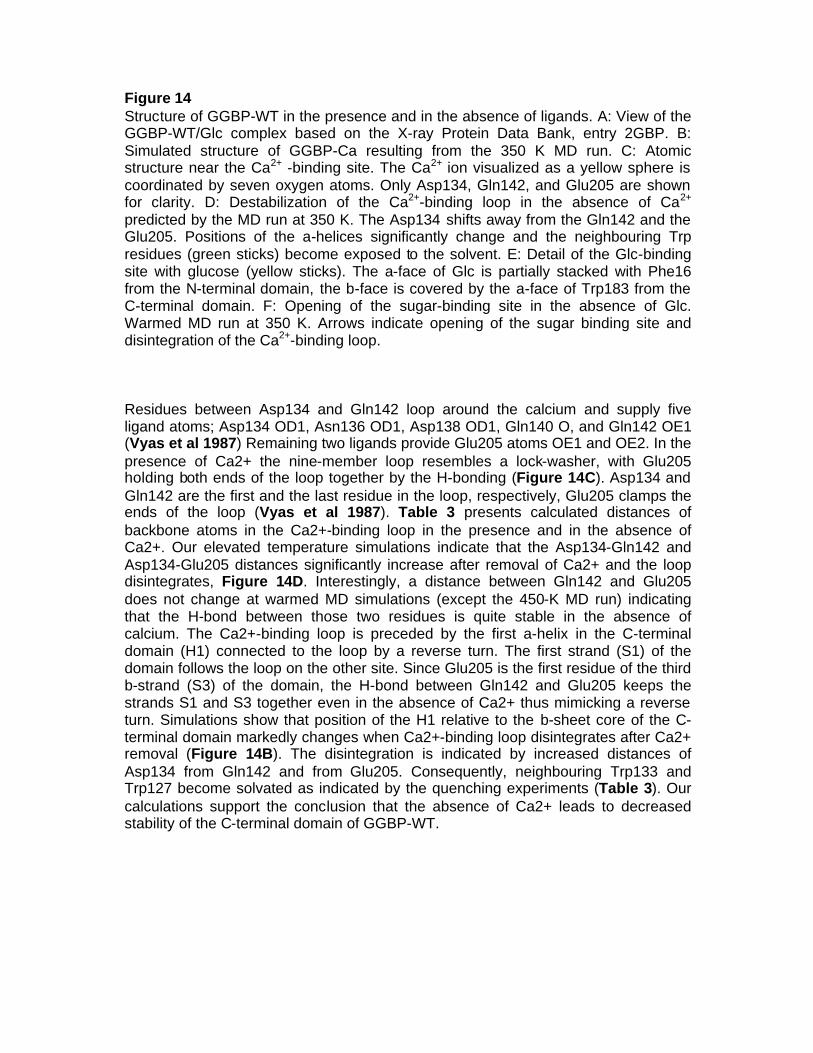
Figure 14 Structure of GGBP-WT in the presence and in the absence of ligands. A: View of the GGBP-WT/Glc complex based on the X-ray Protein Data Bank, entry 2GBP. B: Simulated structure of GGBP-Ca resulting from the 350 K MD run. C: Atomic structure near the Ca2+ -binding site. The Ca2+ ion visualized as a yellow sphere is coordinated by seven oxygen atoms. Only Asp134, Gln142, and Glu205 are shown for clarity. D: Destabilization of the Ca2+-binding loop in the absence of Ca2+ predicted by the MD run at 350 K. The Asp134 shifts away from the Gln142 and the Glu205. Positions of the a-helices significantly change and the neighbouring Trp residues (green sticks) become exposed to the solvent. E: Detail of the Glc-binding site with glucose (yellow sticks). The a-face of Glc is partially stacked with Phe16 from the N-terminal domain, the b-face is covered by the a-face of Trp183 from the C-terminal domain. F: Opening of the sugar-binding site in the absence of Glc. Warmed MD run at 350 K. Arrows indicate opening of the sugar binding site and disintegration of the Ca2+-binding loop. Residues between Asp134 and Gln142 loop around the calcium and supply five ligand atoms; Asp134 OD1, Asn136 OD1, Asp138 OD1, Gln140 O, and Gln142 OE1 (Vyas et al 1987) Remaining two ligands provide Glu205 atoms OE1 and OE2. In the presence of Ca2+ the nine-member loop resembles a lock-washer, with Glu205 holding both ends of the loop together by the H-bonding (Figure 14C). Asp134 and Gln142 are the first and the last residue in the loop, respectively, Glu205 clamps the ends of the loop (Vyas et al 1987). Table 3 presents calculated distances of backbone atoms in the Ca2+-binding loop in the presence and in the absence of Ca2+. Our elevated temperature simulations indicate that the Asp134-Gln142 and Asp134-Glu205 distances significantly increase after removal of Ca2+ and the loop disintegrates, Figure 14D. Interestingly, a distance between Gln142 and Glu205 does not change at warmed MD simulations (except the 450-K MD run) indicating that the H-bond between those two residues is quite stable in the absence of calcium. The Ca2+-binding loop is preceded by the first a-helix in the C-terminal domain (H1) connected to the loop by a reverse turn. The first strand (S1) of the domain follows the loop on the other site. Since Glu205 is the first residue of the third b-strand (S3) of the domain, the H-bond between Gln142 and Glu205 keeps the strands S1 and S3 together even in the absence of Ca2+ thus mimicking a reverse turn. Simulations show that position of the H1 relative to the b-sheet core of the C-terminal domain markedly changes when Ca2+-binding loop disintegrates after Ca2+ removal (Figure 14B). The disintegration is indicated by increased distances of Asp134 from Gln142 and from Glu205. Consequently, neighbouring Trp133 and Trp127 become solvated as indicated by the quenching experiments (Table 3). Our calculations support the conclusion that the absence of Ca2+ leads to decreased stability of the C-terminal domain of GGBP-WT.
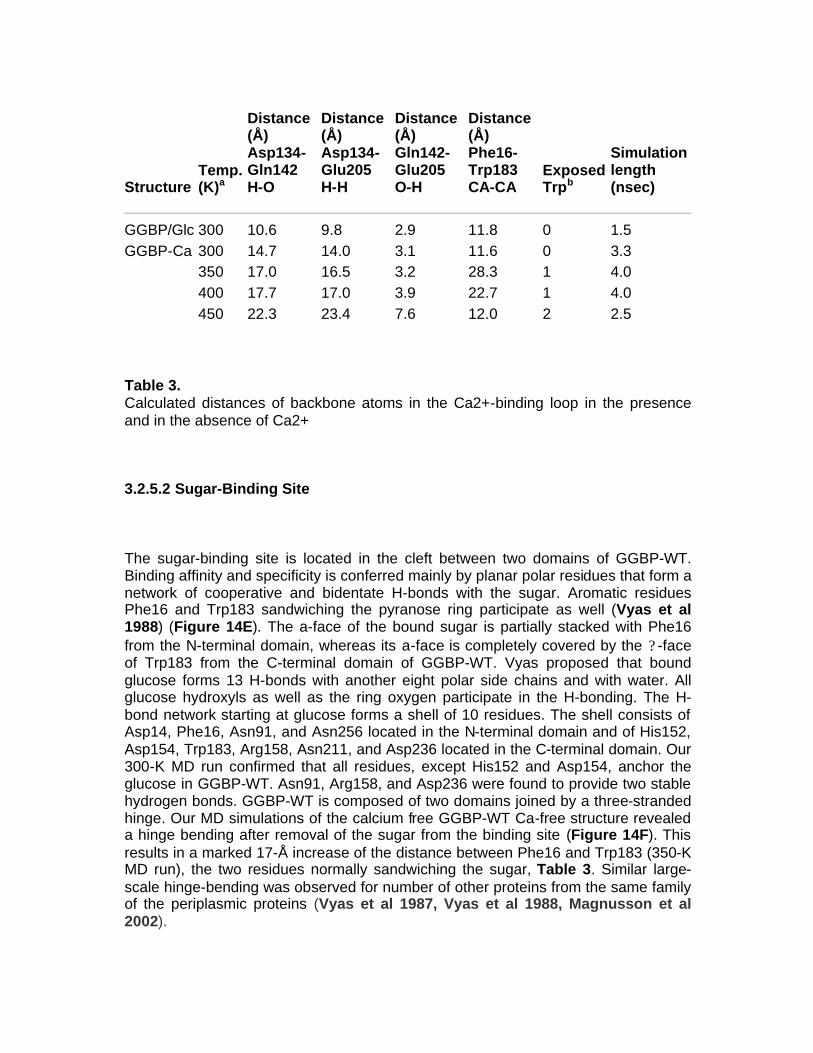
Structure Temp. (K)a
Distance (Å) Asp134-Gln142 H-O
Distance (Å) Asp134-Glu205 H-H
Distance (Å) Gln142-Glu205 O-H
Distance (Å) Phe16-Trp183 CA-CA
Exposed Trpb
Simulation length (nsec)
GGBP/Glc 300 10.6 9.8 2.9 11.8 0 1.5 GGBP-Ca 300 14.7 14.0 3.1 11.6 0 3.3 350 17.0 16.5 3.2 28.3 1 4.0 400 17.7 17.0 3.9 22.7 1 4.0 450 22.3 23.4 7.6 12.0 2 2.5 Table 3. Calculated distances of backbone atoms in the Ca2+-binding loop in the presence and in the absence of Ca2+ 3.2.5.2 Sugar-Binding Site The sugar-binding site is located in the cleft between two domains of GGBP-WT. Binding affinity and specificity is conferred mainly by planar polar residues that form a network of cooperative and bidentate H-bonds with the sugar. Aromatic residues Phe16 and Trp183 sandwiching the pyranose ring participate as well (Vyas et al 1988) (Figure 14E). The a-face of the bound sugar is partially stacked with Phe16 from the N-terminal domain, whereas its a-face is completely covered by the ? -face of Trp183 from the C-terminal domain of GGBP-WT. Vyas proposed that bound glucose forms 13 H-bonds with another eight polar side chains and with water. All glucose hydroxyls as well as the ring oxygen participate in the H-bonding. The H-bond network starting at glucose forms a shell of 10 residues. The shell consists of Asp14, Phe16, Asn91, and Asn256 located in the N-terminal domain and of His152, Asp154, Trp183, Arg158, Asn211, and Asp236 located in the C-terminal domain. Our 300-K MD run confirmed that all residues, except His152 and Asp154, anchor the glucose in GGBP-WT. Asn91, Arg158, and Asp236 were found to provide two stable hydrogen bonds. GGBP-WT is composed of two domains joined by a three-stranded hinge. Our MD simulations of the calcium free GGBP-WT Ca-free structure revealed a hinge bending after removal of the sugar from the binding site (Figure 14F). This results in a marked 17-Å increase of the distance between Phe16 and Trp183 (350-K MD run), the two residues normally sandwiching the sugar, Table 3. Similar large-scale hinge-bending was observed for number of other proteins from the same family of the periplasmic proteins (Vyas et al 1987, Vyas et al 1988, Magnusson et al 2002).
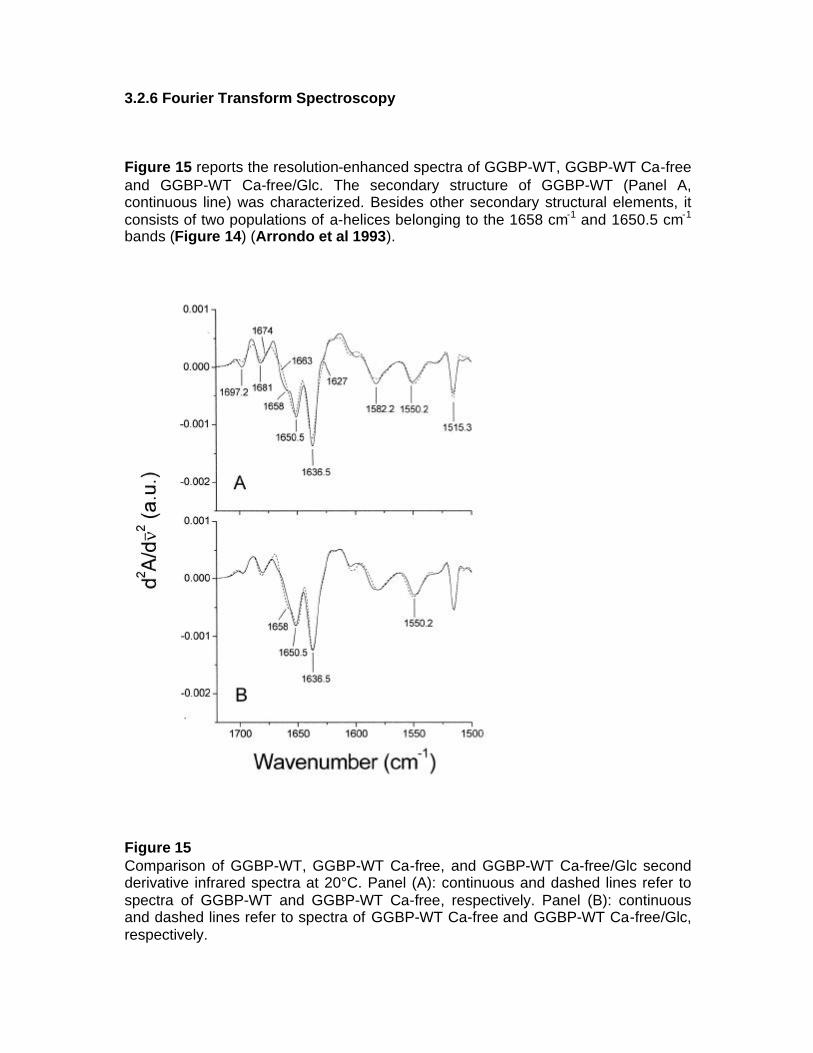
3.2.6 Fourier Transform Spectroscopy Figure 15 reports the resolution-enhanced spectra of GGBP-WT, GGBP-WT Ca-free and GGBP-WT Ca-free/Glc. The secondary structure of GGBP-WT (Panel A, continuous line) was characterized. Besides other secondary structural elements, it consists of two populations of a-helices belonging to the 1658 cm-1 and 1650.5 cm-1 bands (Figure 14) (Arrondo et al 1993).
Figure 15 Comparison of GGBP-WT, GGBP-WT Ca-free, and GGBP-WT Ca-free/Glc second derivative infrared spectra at 20°C. Panel (A): continuous and dashed lines refer to spectra of GGBP-WT and GGBP-WT Ca-free, respectively. Panel (B): continuous and dashed lines refer to spectra of GGBP-WT Ca-free and GGBP-WT Ca-free/Glc, respectively.
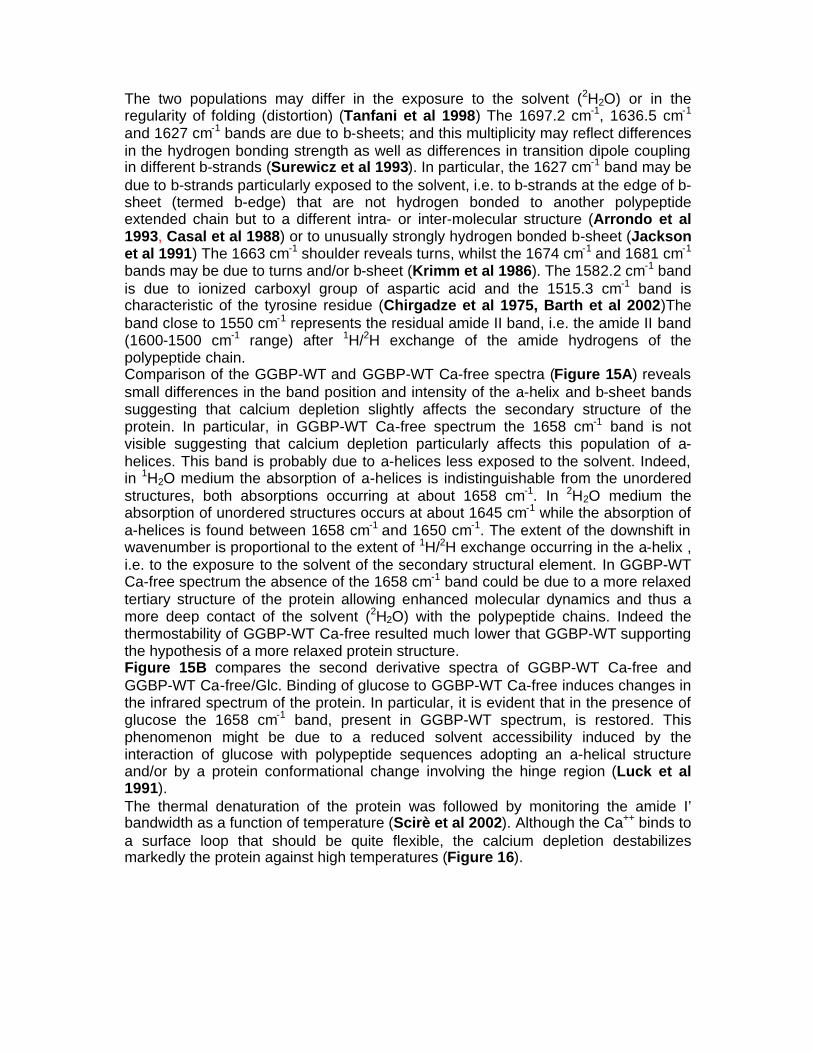
The two populations may differ in the exposure to the solvent (2H2O) or in the regularity of folding (distortion) (Tanfani et al 1998) The 1697.2 cm-1, 1636.5 cm-1 and 1627 cm-1 bands are due to b-sheets; and this multiplicity may reflect differences in the hydrogen bonding strength as well as differences in transition dipole coupling in different b-strands (Surewicz et al 1993). In particular, the 1627 cm-1 band may be due to b-strands particularly exposed to the solvent, i.e. to b-strands at the edge of b-sheet (termed b-edge) that are not hydrogen bonded to another polypeptide extended chain but to a different intra- or inter-molecular structure (Arrondo et al 1993, Casal et al 1988) or to unusually strongly hydrogen bonded b-sheet (Jackson et al 1991) The 1663 cm-1 shoulder reveals turns, whilst the 1674 cm-1 and 1681 cm-1 bands may be due to turns and/or b-sheet (Krimm et al 1986). The 1582.2 cm-1 band is due to ionized carboxyl group of aspartic acid and the 1515.3 cm-1 band is characteristic of the tyrosine residue (Chirgadze et al 1975, Barth et al 2002)The band close to 1550 cm-1 represents the residual amide II band, i.e. the amide II band (1600-1500 cm-1 range) after 1H/2H exchange of the amide hydrogens of the polypeptide chain. Comparison of the GGBP-WT and GGBP-WT Ca-free spectra (Figure 15A) reveals small differences in the band position and intensity of the a-helix and b-sheet bands suggesting that calcium depletion slightly affects the secondary structure of the protein. In particular, in GGBP-WT Ca-free spectrum the 1658 cm-1 band is not visible suggesting that calcium depletion particularly affects this population of a-helices. This band is probably due to a-helices less exposed to the solvent. Indeed, in 1H2O medium the absorption of a-helices is indistinguishable from the unordered structures, both absorptions occurring at about 1658 cm-1. In 2H2O medium the absorption of unordered structures occurs at about 1645 cm-1 while the absorption of a-helices is found between 1658 cm-1 and 1650 cm-1. The extent of the downshift in wavenumber is proportional to the extent of 1H/2H exchange occurring in the a-helix , i.e. to the exposure to the solvent of the secondary structural element. In GGBP-WT Ca-free spectrum the absence of the 1658 cm-1 band could be due to a more relaxed tertiary structure of the protein allowing enhanced molecular dynamics and thus a more deep contact of the solvent (2H2O) with the polypeptide chains. Indeed the thermostability of GGBP-WT Ca-free resulted much lower that GGBP-WT supporting the hypothesis of a more relaxed protein structure. Figure 15B compares the second derivative spectra of GGBP-WT Ca-free and GGBP-WT Ca-free/Glc. Binding of glucose to GGBP-WT Ca-free induces changes in the infrared spectrum of the protein. In particular, it is evident that in the presence of glucose the 1658 cm-1 band, present in GGBP-WT spectrum, is restored. This phenomenon might be due to a reduced solvent accessibility induced by the interaction of glucose with polypeptide sequences adopting an a-helical structure and/or by a protein conformational change involving the hinge region (Luck et al 1991). The thermal denaturation of the protein was followed by monitoring the amide I’ bandwidth as a function of temperature (Scirè et al 2002). Although the Ca++ binds to a surface loop that should be quite flexible, the calcium depletion destabilizes markedly the protein against high temperatures (Figure 16).
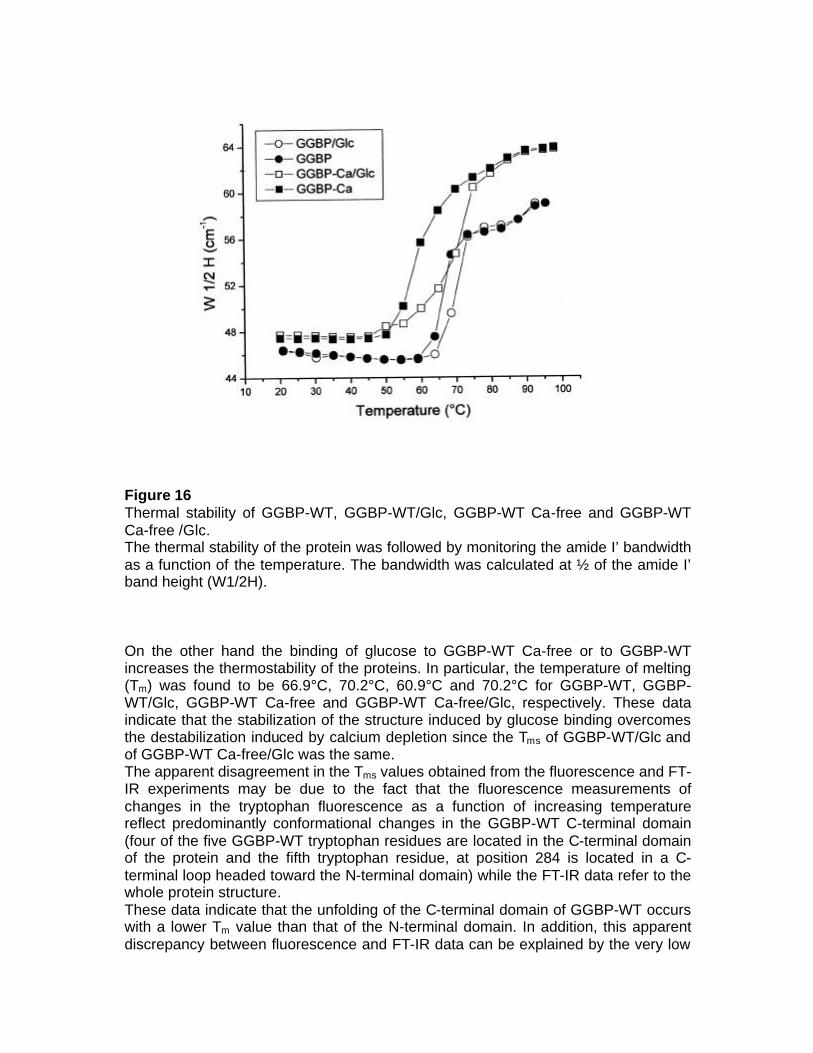
Figure 16 Thermal stability of GGBP-WT, GGBP-WT/Glc, GGBP-WT Ca-free and GGBP-WT Ca-free /Glc. The thermal stability of the protein was followed by monitoring the amide I’ bandwidth as a function of the temperature. The bandwidth was calculated at ½ of the amide I’ band height (W1/2H). On the other hand the binding of glucose to GGBP-WT Ca-free or to GGBP-WT increases the thermostability of the proteins. In particular, the temperature of melting (Tm) was found to be 66.9°C, 70.2°C, 60.9°C and 70.2°C for GGBP-WT, GGBP-WT/Glc, GGBP-WT Ca-free and GGBP-WT Ca-free/Glc, respectively. These data indicate that the stabilization of the structure induced by glucose binding overcomes the destabilization induced by calcium depletion since the Tms of GGBP-WT/Glc and of GGBP-WT Ca-free/Glc was the same. The apparent disagreement in the Tms values obtained from the fluorescence and FT-IR experiments may be due to the fact that the fluorescence measurements of changes in the tryptophan fluorescence as a function of increasing temperature reflect predominantly conformational changes in the GGBP-WT C-terminal domain (four of the five GGBP-WT tryptophan residues are located in the C-terminal domain of the protein and the fifth tryptophan residue, at position 284 is located in a C-terminal loop headed toward the N-terminal domain) while the FT-IR data refer to the whole protein structure. These data indicate that the unfolding of the C-terminal domain of GGBP-WT occurs with a lower Tm value than that of the N-terminal domain. In addition, this apparent discrepancy between fluorescence and FT-IR data can be explained by the very low
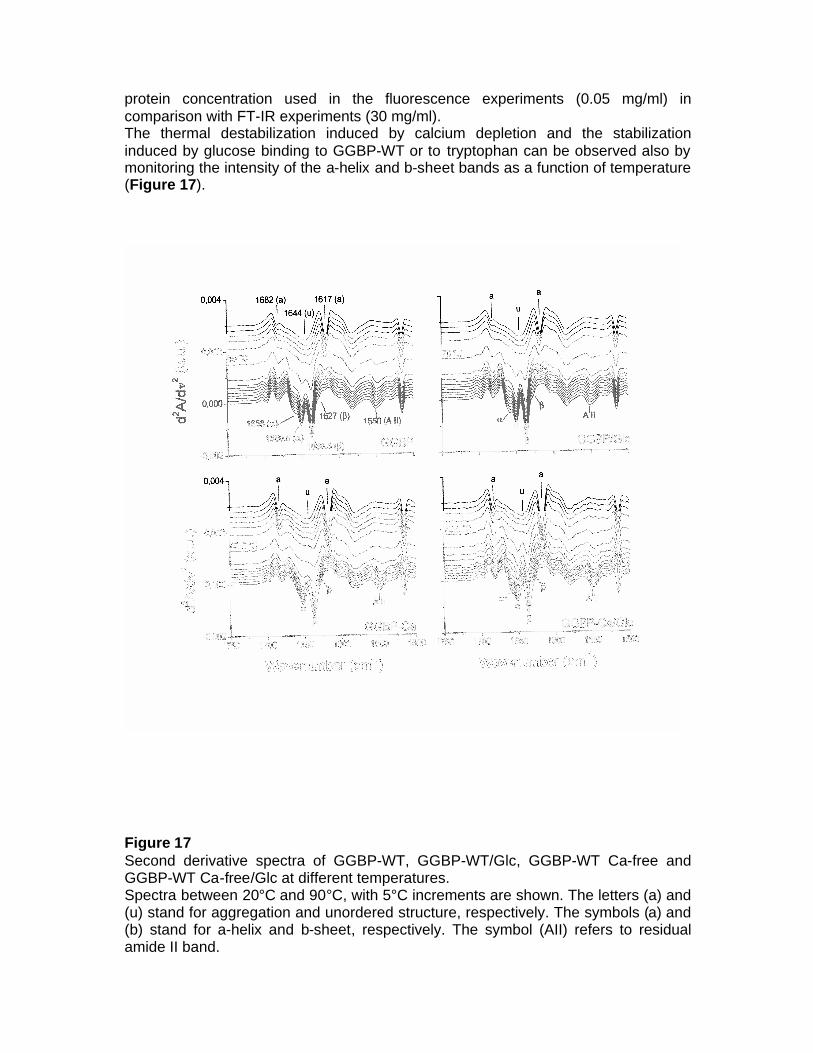
protein concentration used in the fluorescence experiments (0.05 mg/ml) in comparison with FT-IR experiments (30 mg/ml). The thermal destabilization induced by calcium depletion and the stabilization induced by glucose binding to GGBP-WT or to tryptophan can be observed also by monitoring the intensity of the a-helix and b-sheet bands as a function of temperature (Figure 17).
Figure 17 Second derivative spectra of GGBP-WT, GGBP-WT/Glc, GGBP-WT Ca-free and GGBP-WT Ca-free/Glc at different temperatures. Spectra between 20°C and 90°C, with 5°C increments are shown. The letters (a) and (u) stand for aggregation and unordered structure, respectively. The symbols (a) and (b) stand for a-helix and b-sheet, respectively. The symbol (AII) refers to residual amide II band.
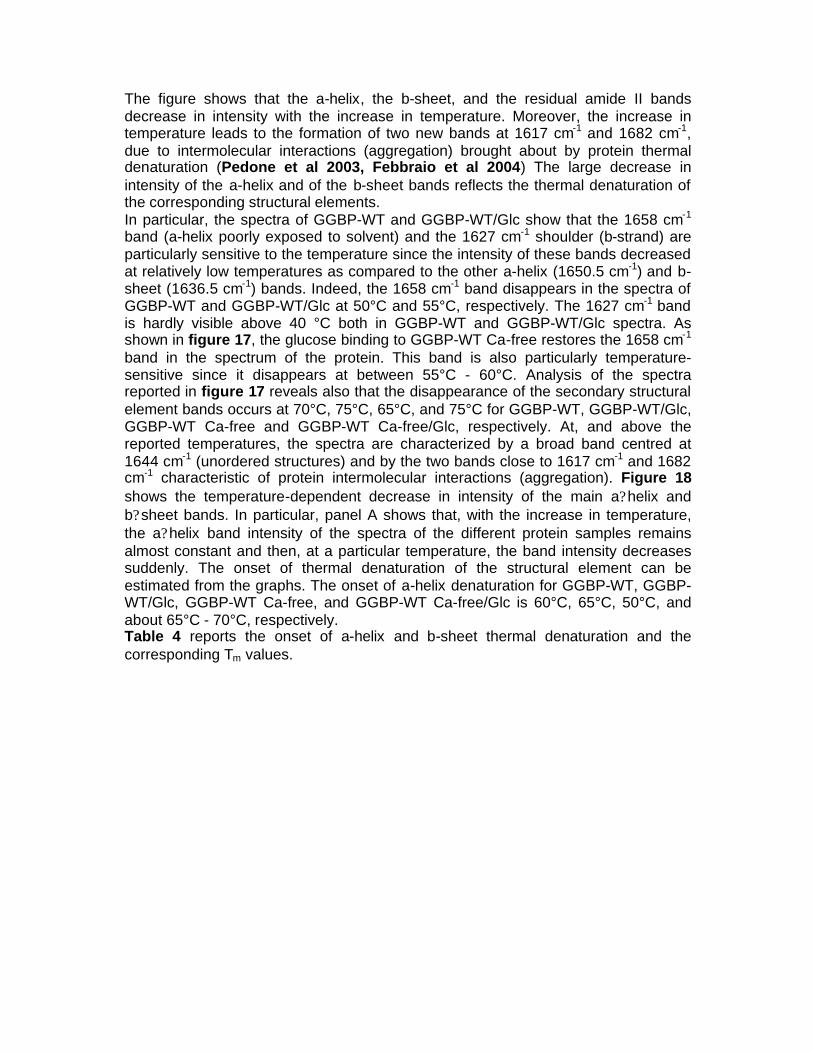
The figure shows that the a-helix, the b-sheet, and the residual amide II bands decrease in intensity with the increase in temperature. Moreover, the increase in temperature leads to the formation of two new bands at 1617 cm-1 and 1682 cm-1, due to intermolecular interactions (aggregation) brought about by protein thermal denaturation (Pedone et al 2003, Febbraio et al 2004) The large decrease in intensity of the a-helix and of the b-sheet bands reflects the thermal denaturation of the corresponding structural elements. In particular, the spectra of GGBP-WT and GGBP-WT/Glc show that the 1658 cm-1 band (a-helix poorly exposed to solvent) and the 1627 cm-1 shoulder (b-strand) are particularly sensitive to the temperature since the intensity of these bands decreased at relatively low temperatures as compared to the other a-helix (1650.5 cm-1) and b-sheet (1636.5 cm-1) bands. Indeed, the 1658 cm-1 band disappears in the spectra of GGBP-WT and GGBP-WT/Glc at 50°C and 55°C, respectively. The 1627 cm-1 band is hardly visible above 40 °C both in GGBP-WT and GGBP-WT/Glc spectra. As shown in figure 17, the glucose binding to GGBP-WT Ca-free restores the 1658 cm-1 band in the spectrum of the protein. This band is also particularly temperature-sensitive since it disappears at between 55°C - 60°C. Analysis of the spectra reported in figure 17 reveals also that the disappearance of the secondary structural element bands occurs at 70°C, 75°C, 65°C, and 75°C for GGBP-WT, GGBP-WT/Glc, GGBP-WT Ca-free and GGBP-WT Ca-free/Glc, respectively. At, and above the reported temperatures, the spectra are characterized by a broad band centred at 1644 cm-1 (unordered structures) and by the two bands close to 1617 cm-1 and 1682 cm-1 characteristic of protein intermolecular interactions (aggregation). Figure 18 shows the temperature-dependent decrease in intensity of the main a?helix and b?sheet bands. In particular, panel A shows that, with the increase in temperature, the a?helix band intensity of the spectra of the different protein samples remains almost constant and then, at a particular temperature, the band intensity decreases suddenly. The onset of thermal denaturation of the structural element can be estimated from the graphs. The onset of a-helix denaturation for GGBP-WT, GGBP-WT/Glc, GGBP-WT Ca-free, and GGBP-WT Ca-free/Glc is 60°C, 65°C, 50°C, and about 65°C - 70°C, respectively. Table 4 reports the onset of a-helix and b-sheet thermal denaturation and the corresponding Tm values.
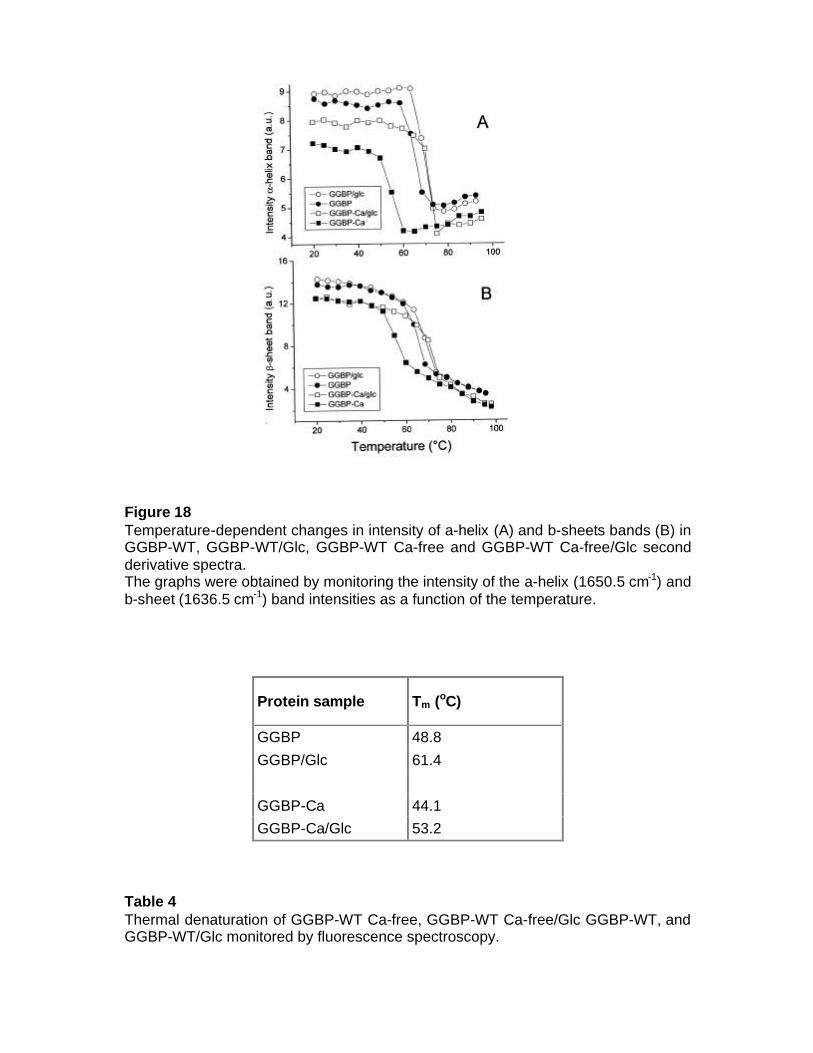
Figure 18 Temperature-dependent changes in intensity of a-helix (A) and b-sheets bands (B) in GGBP-WT, GGBP-WT/Glc, GGBP-WT Ca-free and GGBP-WT Ca-free/Glc second derivative spectra. The graphs were obtained by monitoring the intensity of the a-helix (1650.5 cm-1) and b-sheet (1636.5 cm-1) band intensities as a function of the temperature.
Protein sample Tm (oC)
GGBP 48.8
GGBP/Glc 61.4
GGBP-Ca 44.1 GGBP-Ca/Glc 53.2
Table 4 Thermal denaturation of GGBP-WT Ca-free, GGBP-WT Ca-free/Glc GGBP-WT, and GGBP-WT/Glc monitored by fluorescence spectroscopy.
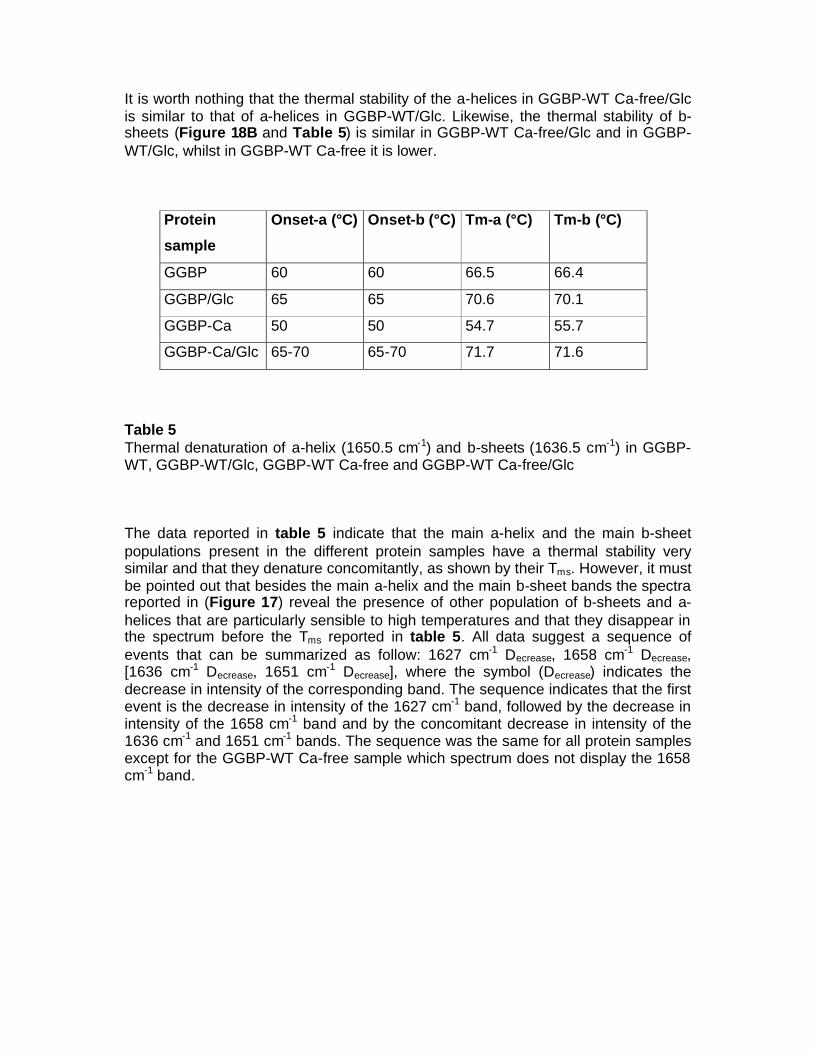
It is worth nothing that the thermal stability of the a-helices in GGBP-WT Ca-free/Glc is similar to that of a-helices in GGBP-WT/Glc. Likewise, the thermal stability of b-sheets (Figure 18B and Table 5) is similar in GGBP-WT Ca-free/Glc and in GGBP-WT/Glc, whilst in GGBP-WT Ca-free it is lower.
Protein
sample
Onset-a (°C) Onset-b (°C) Tm-a (°C) Tm-b (°C)
GGBP 60 60 66.5 66.4
GGBP/Glc 65 65 70.6 70.1
GGBP-Ca 50 50 54.7 55.7
GGBP-Ca/Glc 65-70 65-70 71.7 71.6
Table 5 Thermal denaturation of a-helix (1650.5 cm-1) and b-sheets (1636.5 cm-1) in GGBP-WT, GGBP-WT/Glc, GGBP-WT Ca-free and GGBP-WT Ca-free/Glc The data reported in table 5 indicate that the main a-helix and the main b-sheet populations present in the different protein samples have a thermal stability very similar and that they denature concomitantly, as shown by their Tms. However, it must be pointed out that besides the main a-helix and the main b-sheet bands the spectra reported in (Figure 17) reveal the presence of other population of b-sheets and a-helices that are particularly sensible to high temperatures and that they disappear in the spectrum before the Tms reported in table 5. All data suggest a sequence of events that can be summarized as follow: 1627 cm-1 Decrease, 1658 cm-1 Decrease, [1636 cm-1 Decrease, 1651 cm-1 Decrease], where the symbol (Decrease) indicates the decrease in intensity of the corresponding band. The sequence indicates that the first event is the decrease in intensity of the 1627 cm-1 band, followed by the decrease in intensity of the 1658 cm-1 band and by the concomitant decrease in intensity of the 1636 cm-1 and 1651 cm-1 bands. The sequence was the same for all protein samples except for the GGBP-WT Ca-free sample which spectrum does not display the 1658 cm-1 band.
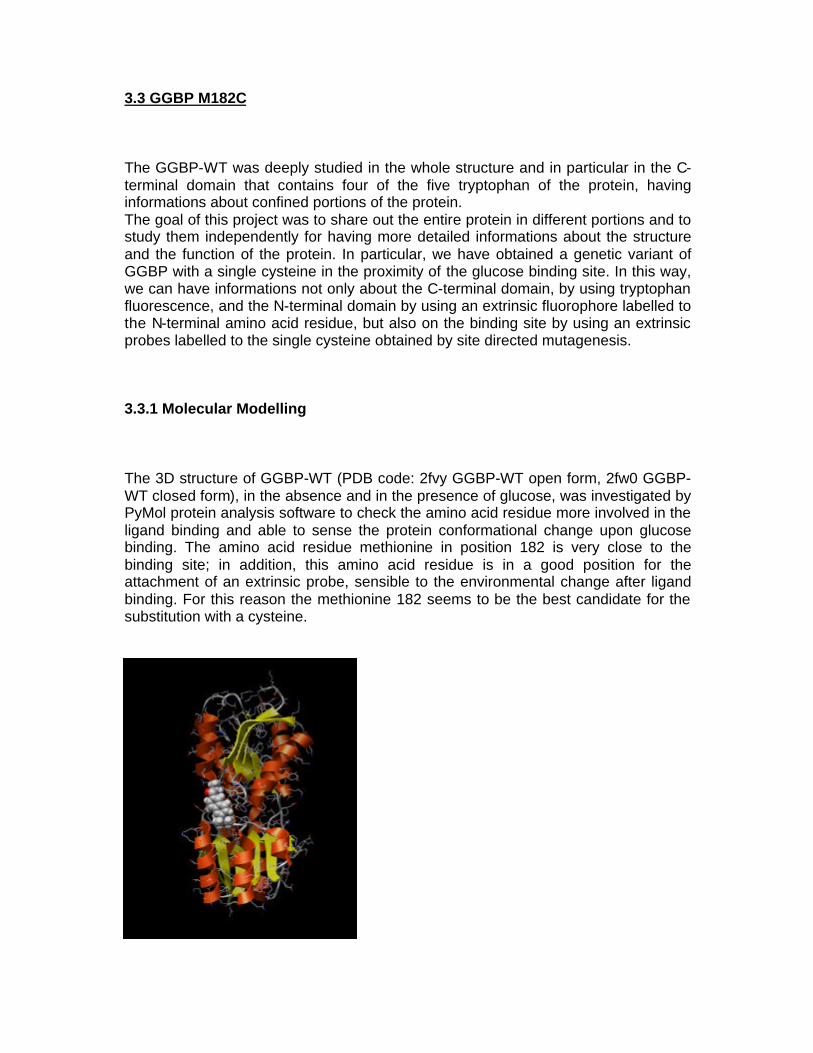
3.3 GGBP M182C The GGBP-WT was deeply studied in the whole structure and in particular in the C-terminal domain that contains four of the five tryptophan of the protein, having informations about confined portions of the protein. The goal of this project was to share out the entire protein in different portions and to study them independently for having more detailed informations about the structure and the function of the protein. In particular, we have obtained a genetic variant of GGBP with a single cysteine in the proximity of the glucose binding site. In this way, we can have informations not only about the C-terminal domain, by using tryptophan fluorescence, and the N-terminal domain by using an extrinsic fluorophore labelled to the N-terminal amino acid residue, but also on the binding site by using an extrinsic probes labelled to the single cysteine obtained by site directed mutagenesis. 3.3.1 Molecular Modelling The 3D structure of GGBP-WT (PDB code: 2fvy GGBP-WT open form, 2fw0 GGBP-WT closed form), in the absence and in the presence of glucose, was investigated by PyMol protein analysis software to check the amino acid residue more involved in the ligand binding and able to sense the protein conformational change upon glucose binding. The amino acid residue methionine in position 182 is very close to the binding site; in addition, this amino acid residue is in a good position for the attachment of an extrinsic probe, sensible to the environmental change after ligand binding. For this reason the methionine 182 seems to be the best candidate for the substitution with a cysteine.
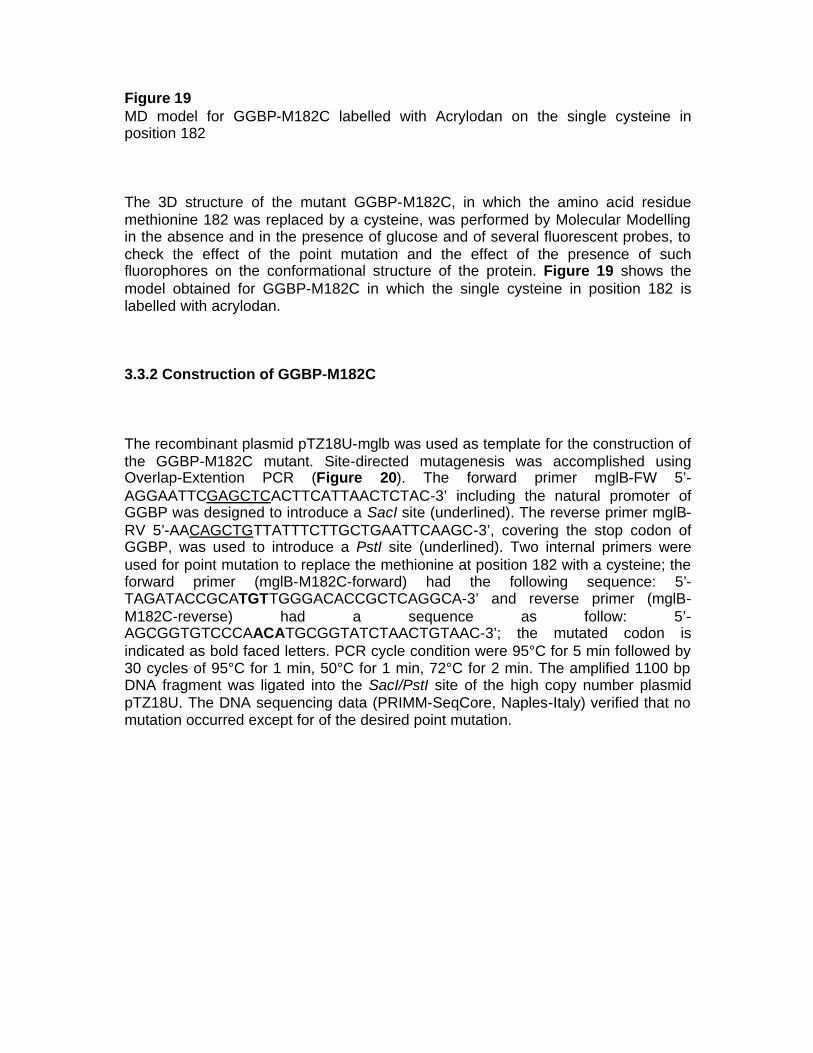
Figure 19 MD model for GGBP-M182C labelled with Acrylodan on the single cysteine in position 182 The 3D structure of the mutant GGBP-M182C, in which the amino acid residue methionine 182 was replaced by a cysteine, was performed by Molecular Modelling in the absence and in the presence of glucose and of several fluorescent probes, to check the effect of the point mutation and the effect of the presence of such fluorophores on the conformational structure of the protein. Figure 19 shows the model obtained for GGBP-M182C in which the single cysteine in position 182 is labelled with acrylodan. 3.3.2 Construction of GGBP-M182C The recombinant plasmid pTZ18U-mglb was used as template for the construction of the GGBP-M182C mutant. Site-directed mutagenesis was accomplished using Overlap-Extention PCR (Figure 20). The forward primer mglB-FW 5’-AGGAATTCGAGCTCACTTCATTAACTCTAC-3’ including the natural promoter of GGBP was designed to introduce a SacI site (underlined). The reverse primer mglB-RV 5’-AACAGCTGTTATTTCTTGCTGAATTCAAGC-3’, covering the stop codon of GGBP, was used to introduce a PstI site (underlined). Two internal primers were used for point mutation to replace the methionine at position 182 with a cysteine; the forward primer (mglB-M182C-forward) had the following sequence: 5’-TAGATACCGCATGTTGGGACACCGCTCAGGCA-3’ and reverse primer (mglB-M182C-reverse) had a sequence as follow: 5’-AGCGGTGTCCCAACATGCGGTATCTAACTGTAAC-3’; the mutated codon is indicated as bold faced letters. PCR cycle condition were 95°C for 5 min followed by 30 cycles of 95°C for 1 min, 50°C for 1 min, 72°C for 2 min. The amplified 1100 bp DNA fragment was ligated into the SacI/PstI site of the high copy number plasmid pTZ18U. The DNA sequencing data (PRIMM-SeqCore, Naples-Italy) verified that no mutation occurred except for of the desired point mutation.
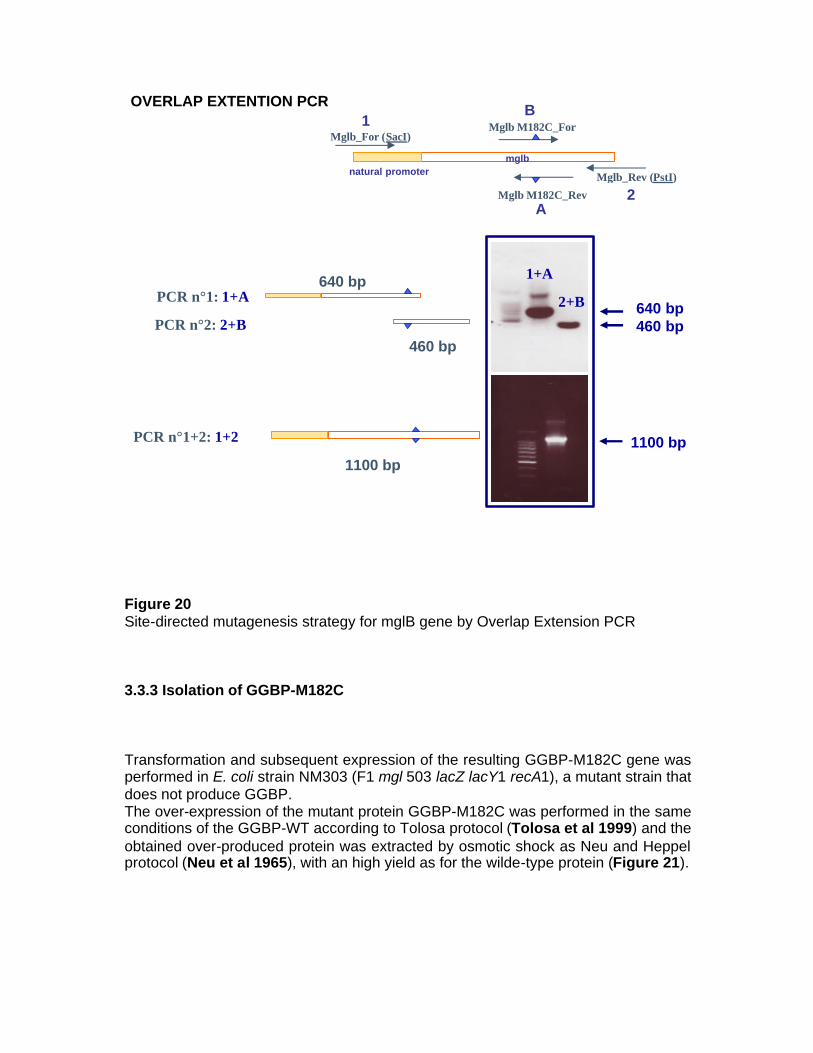
Figure 20 Site-directed mutagenesis strategy for mglB gene by Overlap Extension PCR 3.3.3 Isolation of GGBP-M182C Transformation and subsequent expression of the resulting GGBP-M182C gene was performed in E. coli strain NM303 (F1 mgl 503 lacZ lacY1 recA1), a mutant strain that does not produce GGBP. The over-expression of the mutant protein GGBP-M182C was performed in the same conditions of the GGBP-WT according to Tolosa protocol (Tolosa et al 1999) and the obtained over-produced protein was extracted by osmotic shock as Neu and Heppel protocol (Neu et al 1965), with an high yield as for the wilde-type protein (Figure 21).
1
natural promoter
mglb
Mglb M182C_For
Mglb M182C_Rev
Mglb_For (SacI)
Mglb_Rev (PstI)
A
B
2
PCR n°1: 1+A
PCR n°2: 2+B
640 bp
460 bp
PCR n°1+2: 1+2
1100 bp
1+A
2+B
OVERLAP EXTENTION PCR
640 bp 460 bp
1100 bp
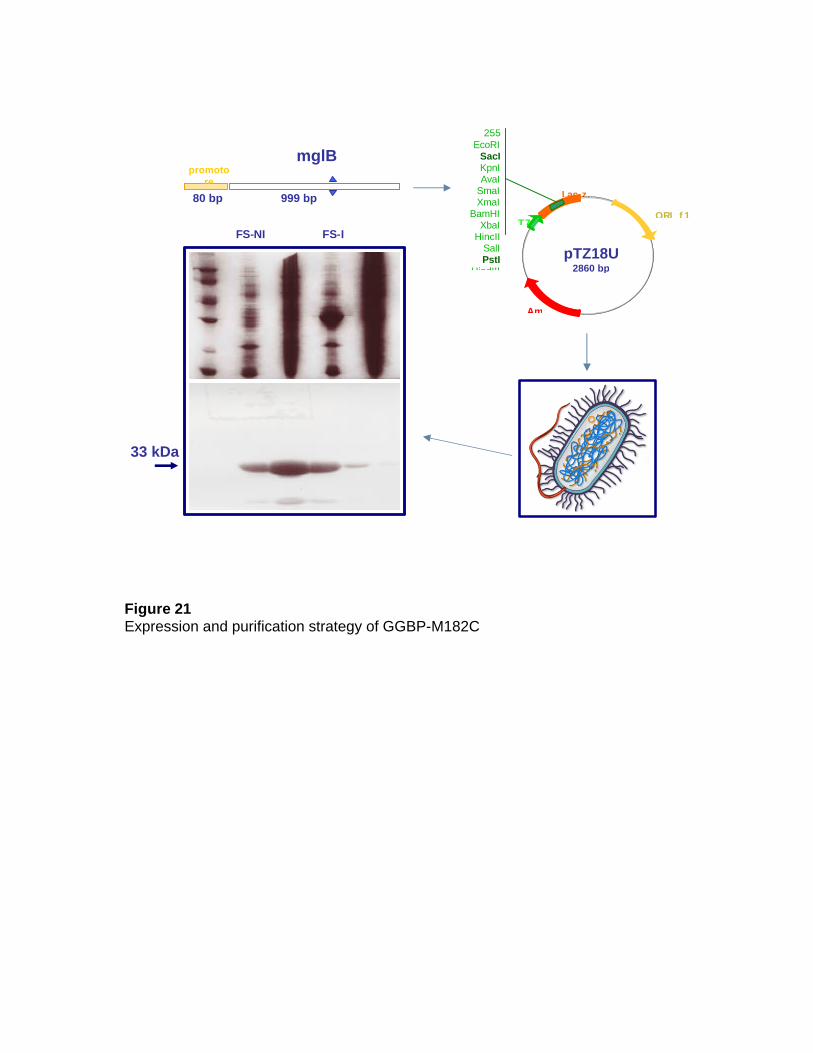
Figure 21 Expression and purification strategy of GGBP-M182C
ORI f1
Lac z
T7
pTZ18U 2860 bp
Am
255 EcoRI
SacI KpnI AvaI
SmaI XmaI
BamHI XbaI
HincII SalI PstI
HindIII
NM303 E. coli
promotore
mglB
999 bp 80 bp
FS-NI FS-I
33 kDa
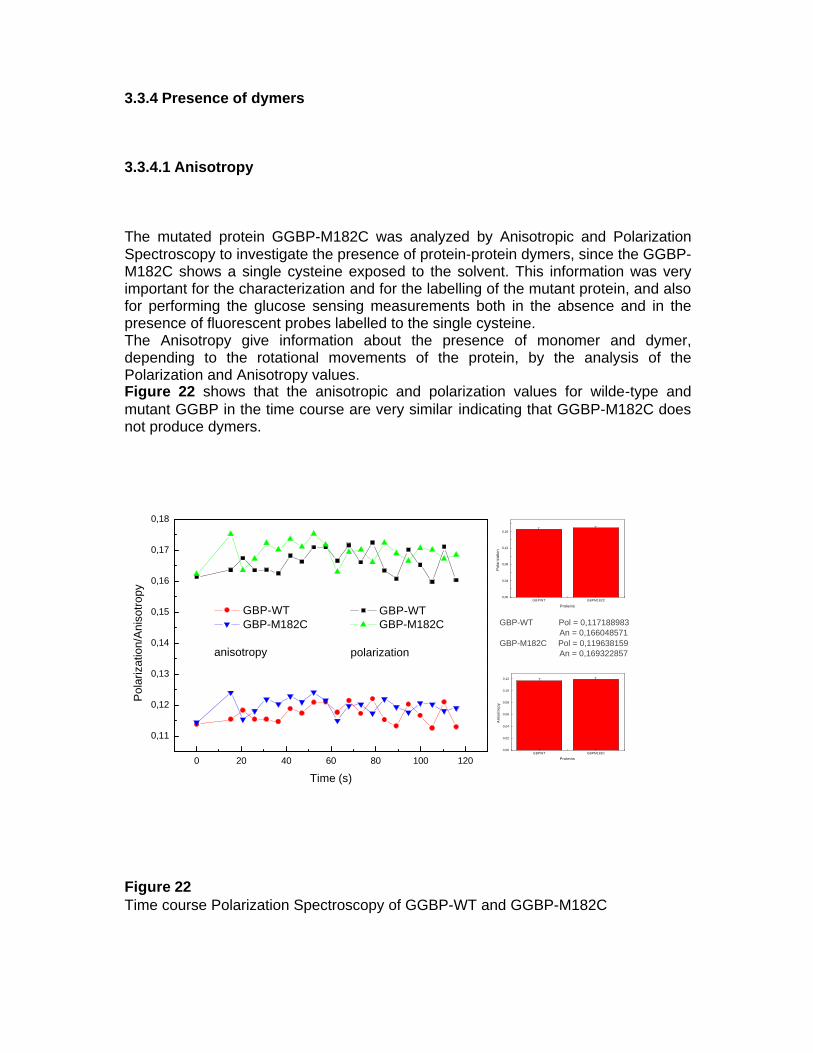
3.3.4 Presence of dymers 3.3.4.1 Anisotropy The mutated protein GGBP-M182C was analyzed by Anisotropic and Polarization Spectroscopy to investigate the presence of protein-protein dymers, since the GGBP-M182C shows a single cysteine exposed to the solvent. This information was very important for the characterization and for the labelling of the mutant protein, and also for performing the glucose sensing measurements both in the absence and in the presence of fluorescent probes labelled to the single cysteine. The Anisotropy give information about the presence of monomer and dymer, depending to the rotational movements of the protein, by the analysis of the Polarization and Anisotropy values. Figure 22 shows that the anisotropic and polarization values for wilde-type and mutant GGBP in the time course are very similar indicating that GGBP-M182C does not produce dymers.
Figure 22 Time course Polarization Spectroscopy of GGBP-WT and GGBP-M182C
0 20 40 60 80 100 120
0,11
0,12
0,13
0,14
0,15
0,16
0,17
0,18
GBPWT GBPM182C0,00
0,04
0,08
0,12
0,16
Pol
ariz
atio
n
Proteins
GBPWT GBPM182C0,00
0,02
0,04
0,06
0,08
0,10
0,12
An
iso
tro
py
Proteins
GBP-WT GBP-M182C
anisotropy
Pol
ariz
atio
n/A
niso
trop
y
Time (s)
GBP-WT GBP-M182C
polarization
GBP-WT Pol = 0,117188983 An = 0,166048571GBP-M182C Pol = 0,119638159 An = 0,169322857
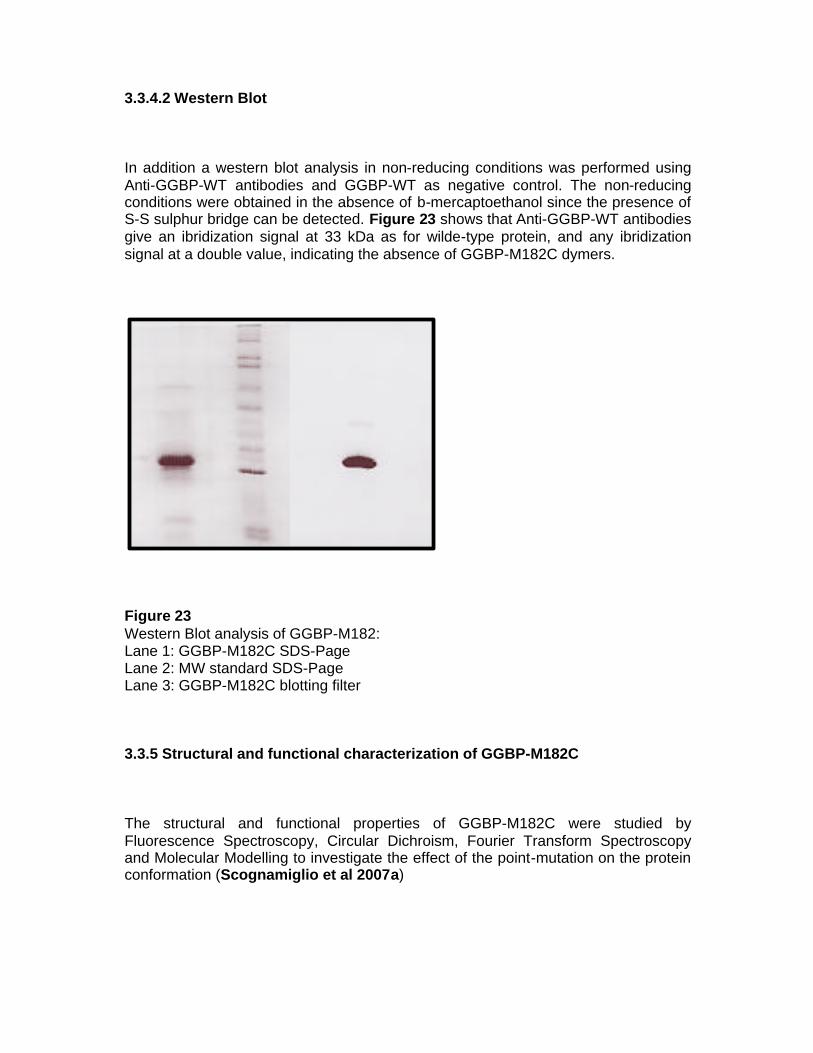
3.3.4.2 Western Blot In addition a western blot analysis in non-reducing conditions was performed using Anti-GGBP-WT antibodies and GGBP-WT as negative control. The non-reducing conditions were obtained in the absence of b-mercaptoethanol since the presence of S-S sulphur bridge can be detected. Figure 23 shows that Anti-GGBP-WT antibodies give an ibridization signal at 33 kDa as for wilde-type protein, and any ibridization signal at a double value, indicating the absence of GGBP-M182C dymers.
Figure 23 Western Blot analysis of GGBP-M182: Lane 1: GGBP-M182C SDS-Page Lane 2: MW standard SDS-Page Lane 3: GGBP-M182C blotting filter 3.3.5 Structural and functional characterization of GGBP-M182C The structural and functional properties of GGBP-M182C were studied by Fluorescence Spectroscopy, Circular Dichroism, Fourier Transform Spectroscopy and Molecular Modelling to investigate the effect of the point-mutation on the protein conformation (Scognamiglio et al 2007a)
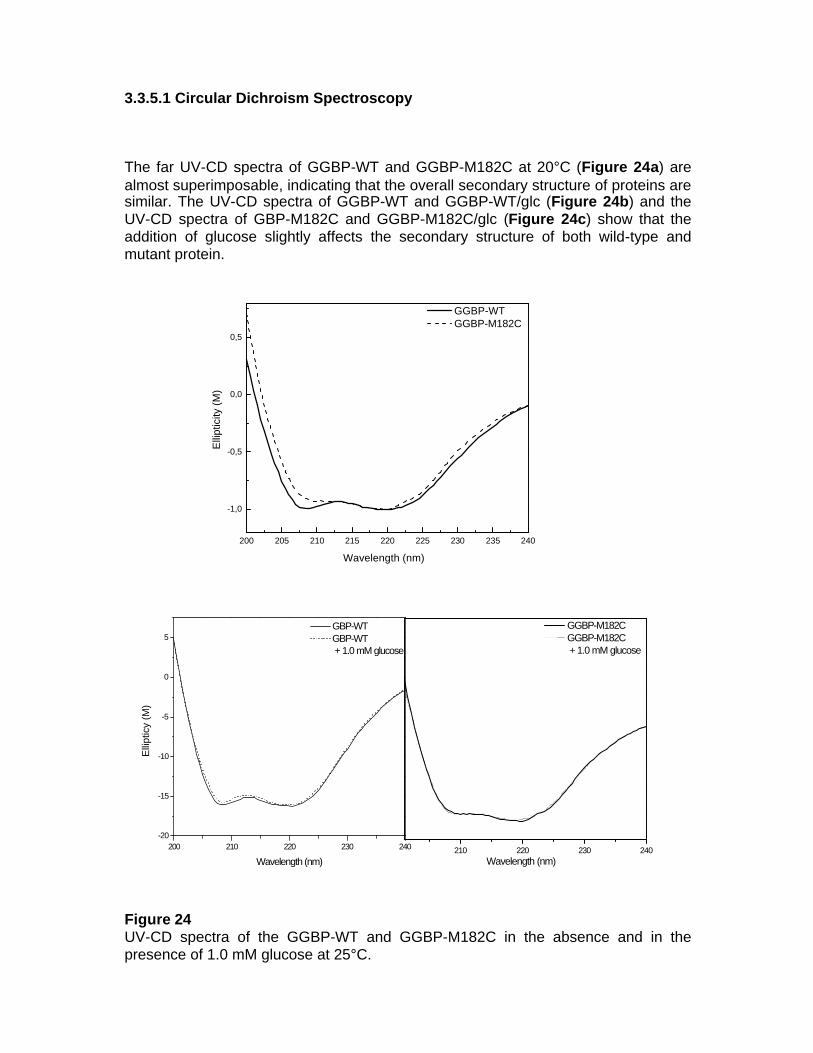
3.3.5.1 Circular Dichroism Spectroscopy The far UV-CD spectra of GGBP-WT and GGBP-M182C at 20°C (Figure 24a) are almost superimposable, indicating that the overall secondary structure of proteins are similar. The UV-CD spectra of GGBP-WT and GGBP-WT/glc (Figure 24b) and the UV-CD spectra of GBP-M182C and GGBP-M182C/glc (Figure 24c) show that the addition of glucose slightly affects the secondary structure of both wild-type and mutant protein.
Figure 24 UV-CD spectra of the GGBP-WT and GGBP-M182C in the absence and in the presence of 1.0 mM glucose at 25°C.
200 205 210 215 220 225 230 235 240
-1,0
-0,5
0,0
0,5
Wavelength (nm)
GGBP-WT GGBP-M182C
Elli
ptic
ity (M
)
210 220 230 240
GGBP-M182C GGBP-M182C
+ 1.0 mM glucose
Wavelength (nm)200 210 220 230 240
-20
-15
-10
-5
0
5
Elli
ptic
y (M
)
Wavelength (nm)
GBP-WT GBP-WT
+ 1.0 mM glucose
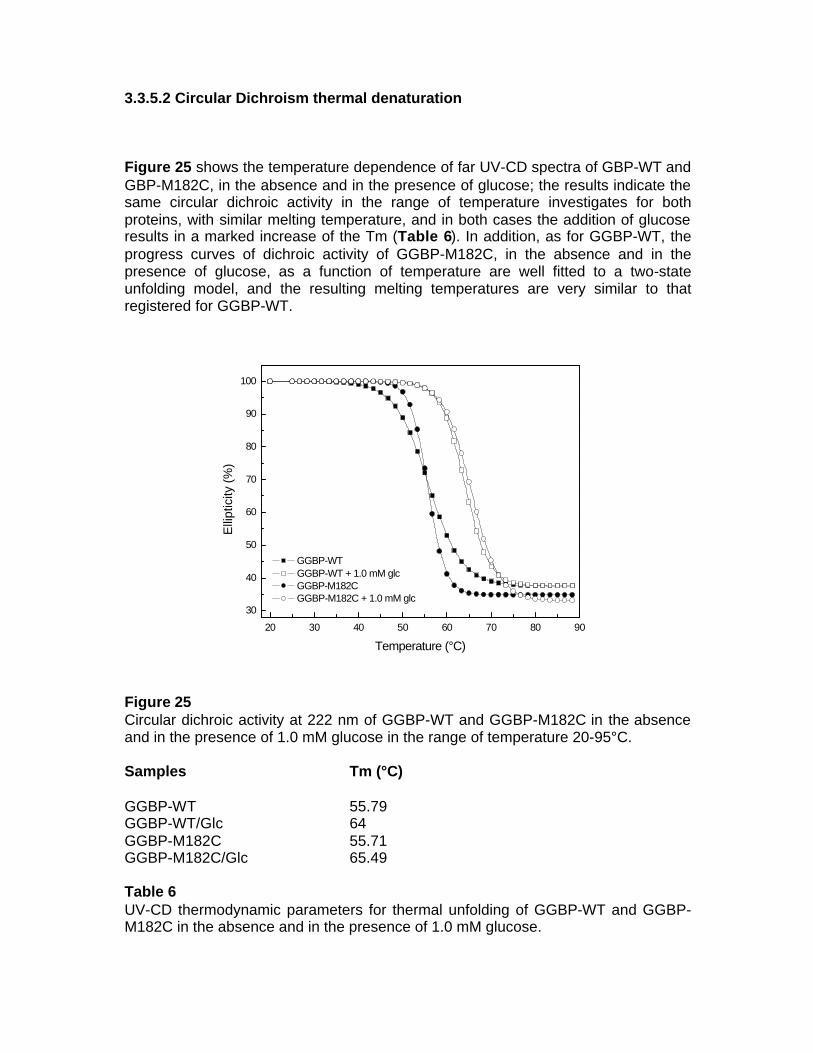
3.3.5.2 Circular Dichroism thermal denaturation Figure 25 shows the temperature dependence of far UV-CD spectra of GBP-WT and GBP-M182C, in the absence and in the presence of glucose; the results indicate the same circular dichroic activity in the range of temperature investigates for both proteins, with similar melting temperature, and in both cases the addition of glucose results in a marked increase of the Tm (Table 6). In addition, as for GGBP-WT, the progress curves of dichroic activity of GGBP-M182C, in the absence and in the presence of glucose, as a function of temperature are well fitted to a two-state unfolding model, and the resulting melting temperatures are very similar to that registered for GGBP-WT. Figure 25 Circular dichroic activity at 222 nm of GGBP-WT and GGBP-M182C in the absence and in the presence of 1.0 mM glucose in the range of temperature 20-95°C. Samples Tm (°C) GGBP-WT 55.79 GGBP-WT/Glc 64 GGBP-M182C 55.71 GGBP-M182C/Glc 65.49 Table 6 UV-CD thermodynamic parameters for thermal unfolding of GGBP-WT and GGBP-M182C in the absence and in the presence of 1.0 mM glucose.
20 30 40 50 60 70 80 90
30
40
50
60
70
80
90
100
Elli
ptic
ity (%
)
Temperature (°C)
GGBP-WT GGBP-WT + 1.0 mM glc GGBP-M182C GGBP-M182C + 1.0 mM glc
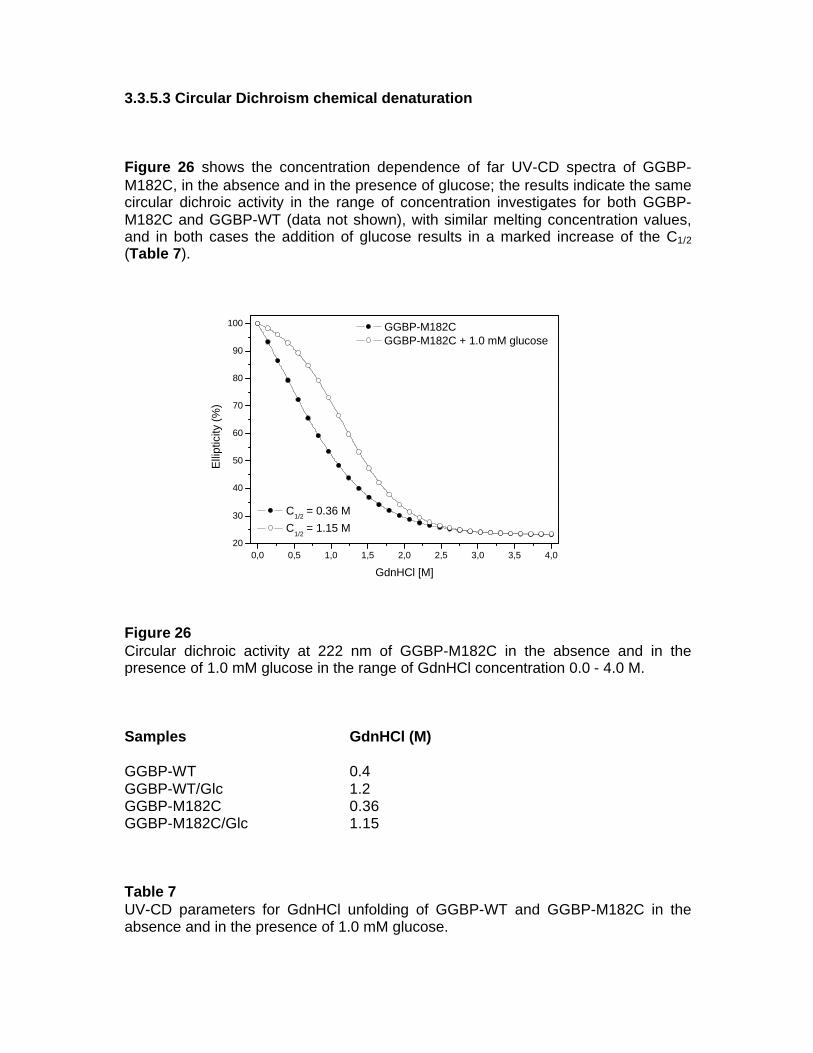
3.3.5.3 Circular Dichroism chemical denaturation Figure 26 shows the concentration dependence of far UV-CD spectra of GGBP-M182C, in the absence and in the presence of glucose; the results indicate the same circular dichroic activity in the range of concentration investigates for both GGBP-M182C and GGBP-WT (data not shown), with similar melting concentration values, and in both cases the addition of glucose results in a marked increase of the C1/2 (Table 7). Figure 26 Circular dichroic activity at 222 nm of GGBP-M182C in the absence and in the presence of 1.0 mM glucose in the range of GdnHCl concentration 0.0 - 4.0 M. Samples GdnHCl (M) GGBP-WT 0.4 GGBP-WT/Glc 1.2 GGBP-M182C 0.36 GGBP-M182C/Glc 1.15 Table 7 UV-CD parameters for GdnHCl unfolding of GGBP-WT and GGBP-M182C in the absence and in the presence of 1.0 mM glucose.
0,0 0,5 1,0 1,5 2,0 2,5 3,0 3,5 4,020
30
40
50
60
70
80
90
100
C1/2
= 0.36 M
C1/2
= 1.15 M
GGBP-M182C GGBP-M182C + 1.0 mM glucose
Elli
ptic
ity (%
)
GdnHCl [M]
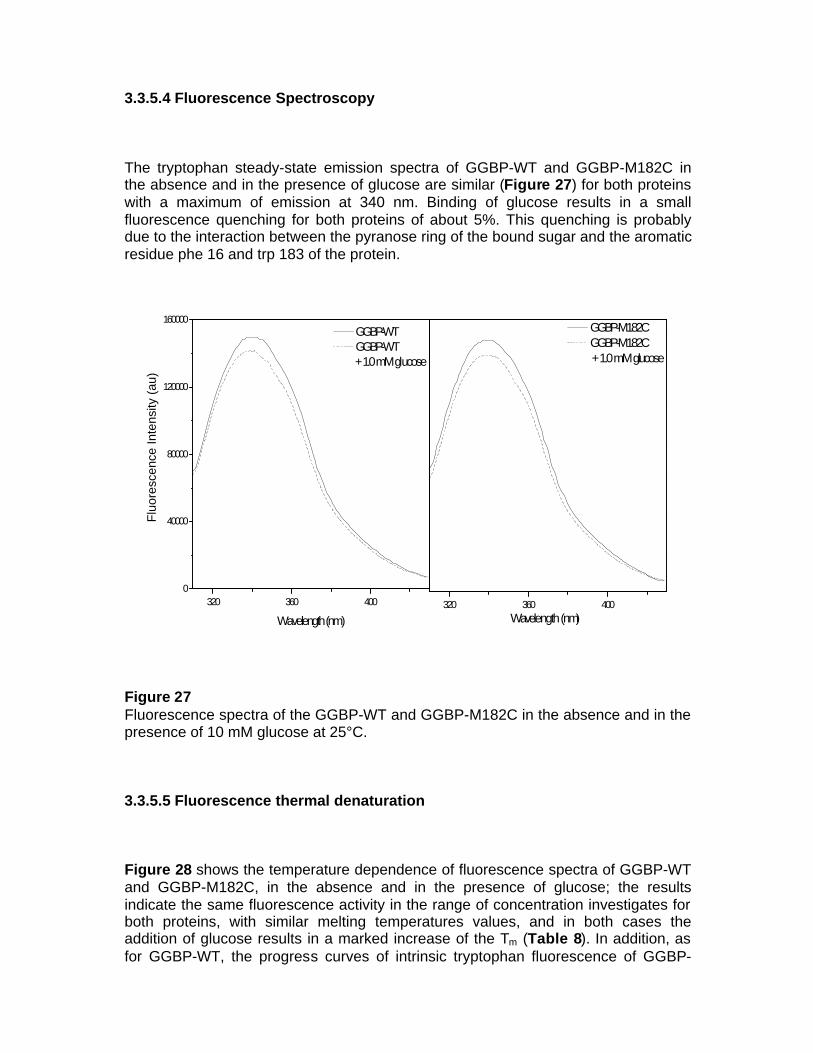
3.3.5.4 Fluorescence Spectroscopy The tryptophan steady-state emission spectra of GGBP-WT and GGBP-M182C in the absence and in the presence of glucose are similar (Figure 27) for both proteins with a maximum of emission at 340 nm. Binding of glucose results in a small fluorescence quenching for both proteins of about 5%. This quenching is probably due to the interaction between the pyranose ring of the bound sugar and the aromatic residue phe 16 and trp 183 of the protein.
Figure 27 Fluorescence spectra of the GGBP-WT and GGBP-M182C in the absence and in the presence of 10 mM glucose at 25°C. 3.3.5.5 Fluorescence thermal denaturation Figure 28 shows the temperature dependence of fluorescence spectra of GGBP-WT and GGBP-M182C, in the absence and in the presence of glucose; the results indicate the same fluorescence activity in the range of concentration investigates for both proteins, with similar melting temperatures values, and in both cases the addition of glucose results in a marked increase of the Tm (Table 8). In addition, as for GGBP-WT, the progress curves of intrinsic tryptophan fluorescence of GGBP-
320 360 4000
40000
80000
120000
160000
Flu
ores
cenc
e In
tens
ity (
au)
Wavelength (nm)
GGBP-WT GGBP-WT
+ 1.0 mM glucose
320 360 400
Wavelength (nm)
GGBP-M182C GGBP-M182C
+ 1.0 mM glucose
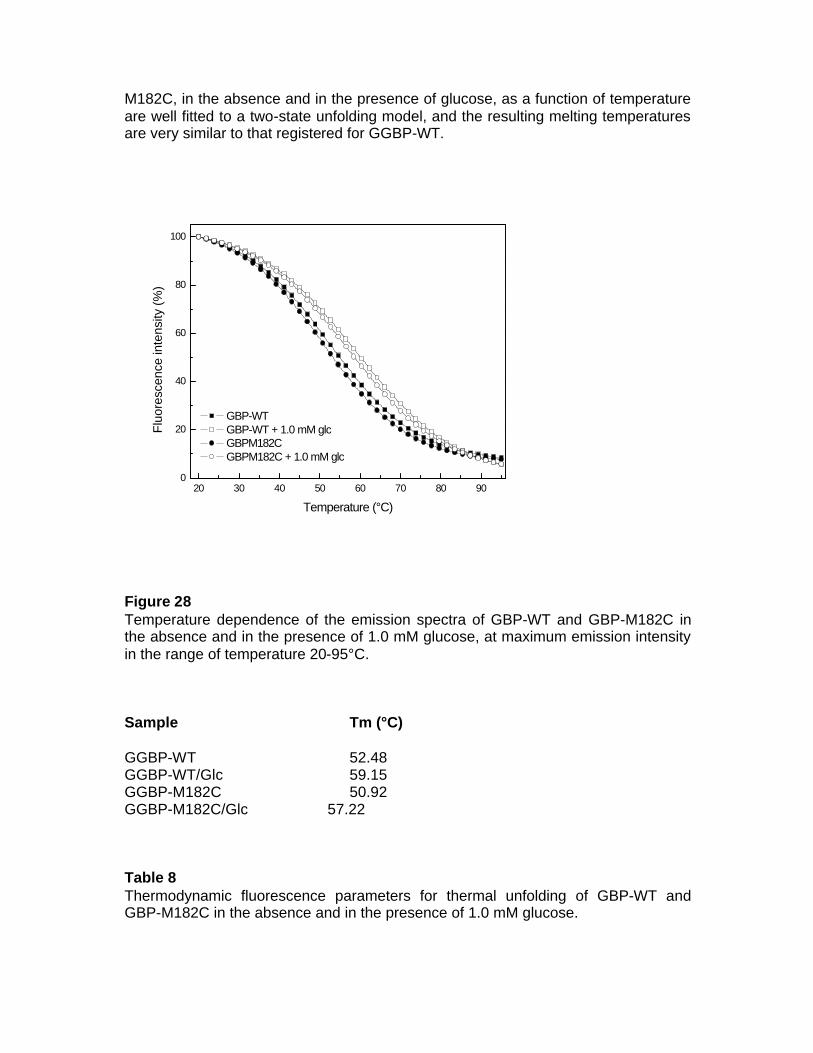
M182C, in the absence and in the presence of glucose, as a function of temperature are well fitted to a two-state unfolding model, and the resulting melting temperatures are very similar to that registered for GGBP-WT.
Figure 28 Temperature dependence of the emission spectra of GBP-WT and GBP-M182C in the absence and in the presence of 1.0 mM glucose, at maximum emission intensity in the range of temperature 20-95°C. Sample Tm (°C)
GGBP-WT 52.48 GGBP-WT/Glc 59.15 GGBP-M182C 50.92 GGBP-M182C/Glc 57.22 Table 8 Thermodynamic fluorescence parameters for thermal unfolding of GBP-WT and GBP-M182C in the absence and in the presence of 1.0 mM glucose.
20 30 40 50 60 70 80 900
20
40
60
80
100
Flu
ores
cenc
e in
tens
ity (%
)
Temperature (°C)
GBP-WT GBP-WT + 1.0 mM glc GBPM182C GBPM182C + 1.0 mM glc
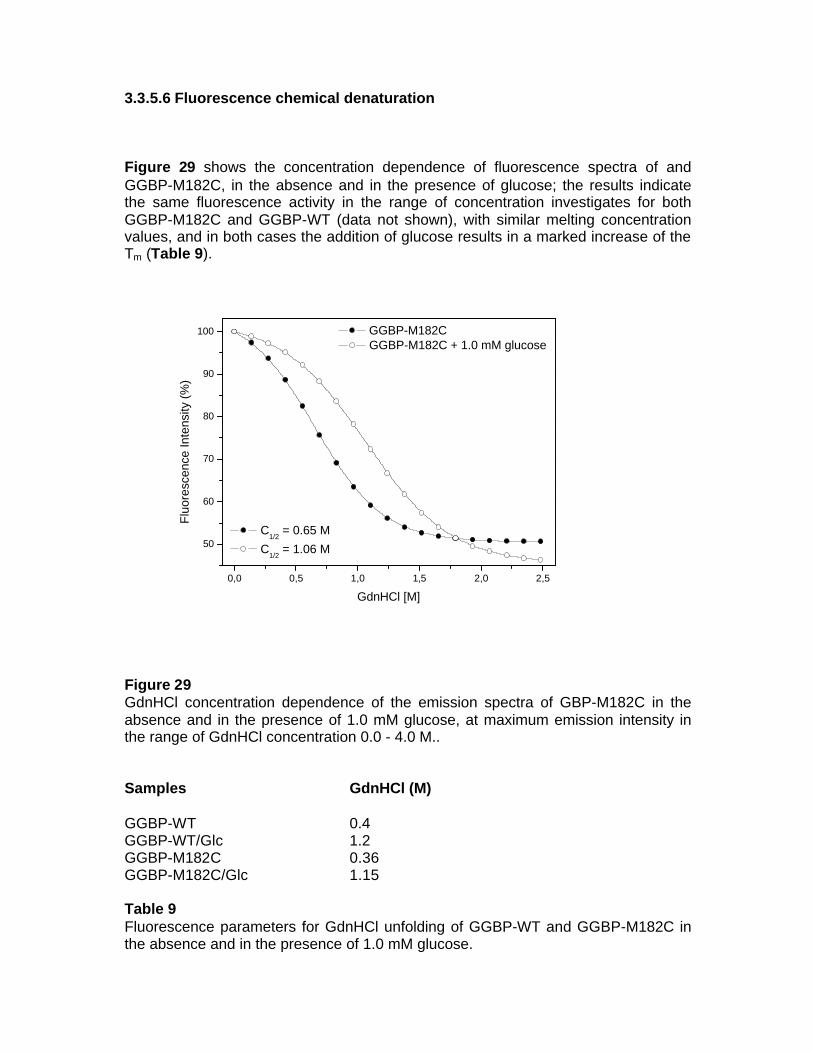
3.3.5.6 Fluorescence chemical denaturation Figure 29 shows the concentration dependence of fluorescence spectra of and GGBP-M182C, in the absence and in the presence of glucose; the results indicate the same fluorescence activity in the range of concentration investigates for both GGBP-M182C and GGBP-WT (data not shown), with similar melting concentration values, and in both cases the addition of glucose results in a marked increase of the Tm (Table 9).
Figure 29 GdnHCl concentration dependence of the emission spectra of GBP-M182C in the absence and in the presence of 1.0 mM glucose, at maximum emission intensity in the range of GdnHCl concentration 0.0 - 4.0 M.. Samples GdnHCl (M) GGBP-WT 0.4 GGBP-WT/Glc 1.2 GGBP-M182C 0.36 GGBP-M182C/Glc 1.15 Table 9 Fluorescence parameters for GdnHCl unfolding of GGBP-WT and GGBP-M182C in the absence and in the presence of 1.0 mM glucose.
0,0 0,5 1,0 1,5 2,0 2,5
50
60
70
80
90
100
C1/2
= 0.65 M
C1/2
= 1.06 M
Flu
ores
cenc
e In
tens
ity (%
)
GdnHCl [M]
GGBP-M182C GGBP-M182C + 1.0 mM glucose
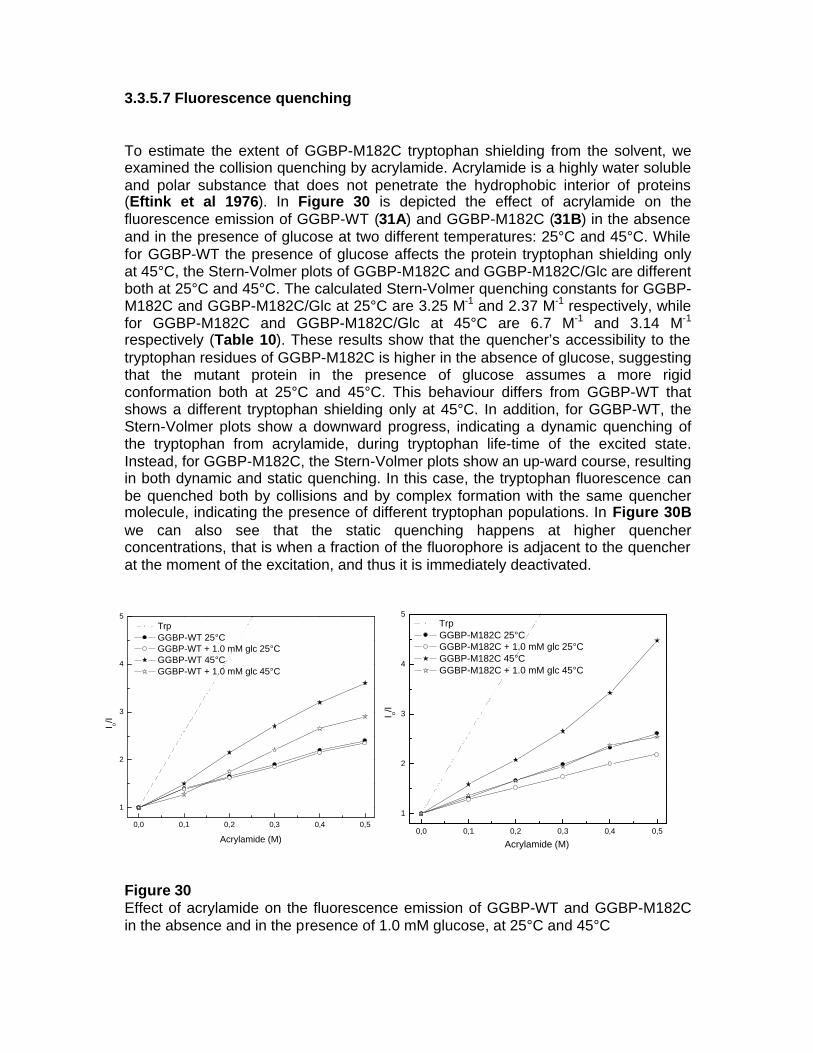
3.3.5.7 Fluorescence quenching To estimate the extent of GGBP-M182C tryptophan shielding from the solvent, we examined the collision quenching by acrylamide. Acrylamide is a highly water soluble and polar substance that does not penetrate the hydrophobic interior of proteins (Eftink et al 1976). In Figure 30 is depicted the effect of acrylamide on the fluorescence emission of GGBP-WT (31A) and GGBP-M182C (31B) in the absence and in the presence of glucose at two different temperatures: 25°C and 45°C. While for GGBP-WT the presence of glucose affects the protein tryptophan shielding only at 45°C, the Stern-Volmer plots of GGBP-M182C and GGBP-M182C/Glc are different both at 25°C and 45°C. The calculated Stern-Volmer quenching constants for GGBP-M182C and GGBP-M182C/Glc at 25°C are 3.25 M-1 and 2.37 M-1 respectively, while for GGBP-M182C and GGBP-M182C/Glc at 45°C are 6.7 M-1 and 3.14 M-1 respectively (Table 10). These results show that the quencher’s accessibility to the tryptophan residues of GGBP-M182C is higher in the absence of glucose, suggesting that the mutant protein in the presence of glucose assumes a more rigid conformation both at 25°C and 45°C. This behaviour differs from GGBP-WT that shows a different tryptophan shielding only at 45°C. In addition, for GGBP-WT, the Stern-Volmer plots show a downward progress, indicating a dynamic quenching of the tryptophan from acrylamide, during tryptophan life-time of the excited state. Instead, for GGBP-M182C, the Stern-Volmer plots show an up-ward course, resulting in both dynamic and static quenching. In this case, the tryptophan fluorescence can be quenched both by collisions and by complex formation with the same quencher molecule, indicating the presence of different tryptophan populations. In Figure 30B we can also see that the static quenching happens at higher quencher concentrations, that is when a fraction of the fluorophore is adjacent to the quencher at the moment of the excitation, and thus it is immediately deactivated.
Figure 30 Effect of acrylamide on the fluorescence emission of GGBP-WT and GGBP-M182C in the absence and in the presence of 1.0 mM glucose, at 25°C and 45°C
0,0 0,1 0,2 0,3 0,4 0,5
1
2
3
4
5
I o/I
Acrylamide (M)
Trp GGBP-WT 25°C GGBP-WT + 1.0 mM glc 25°C GGBP-WT 45°C GGBP-WT + 1.0 mM glc 45°C
0,0 0,1 0,2 0,3 0,4 0,5
1
2
3
4
5
I o/I
Acrylamide (M)
Trp GGBP-M182C 25°C GGBP-M182C + 1.0 mM glc 25°C GGBP-M182C 45°C GGBP-M182C + 1.0 mM glc 45°C
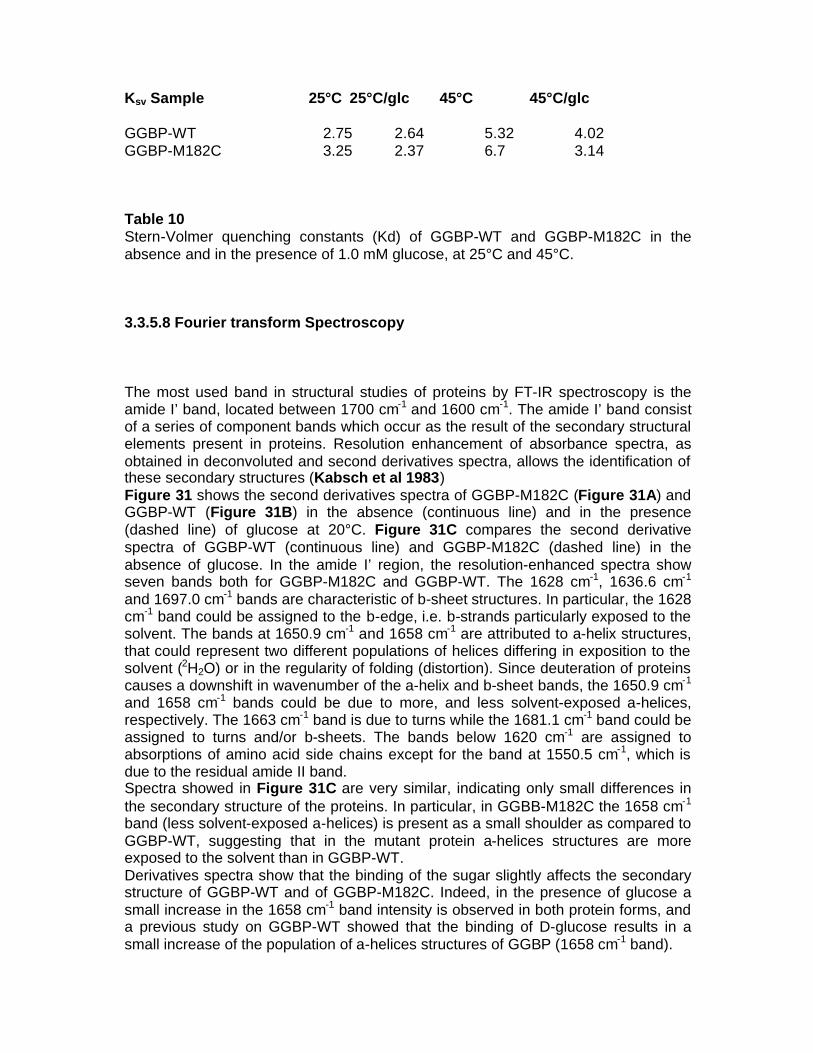
Ksv Sample 25°C 25°C/glc 45°C 45°C/glc GGBP-WT 2.75 2.64 5.32 4.02 GGBP-M182C 3.25 2.37 6.7 3.14 Table 10 Stern-Volmer quenching constants (Kd) of GGBP-WT and GGBP-M182C in the absence and in the presence of 1.0 mM glucose, at 25°C and 45°C. 3.3.5.8 Fourier transform Spectroscopy The most used band in structural studies of proteins by FT-IR spectroscopy is the amide I’ band, located between 1700 cm-1 and 1600 cm-1. The amide I’ band consist of a series of component bands which occur as the result of the secondary structural elements present in proteins. Resolution enhancement of absorbance spectra, as obtained in deconvoluted and second derivatives spectra, allows the identification of these secondary structures (Kabsch et al 1983) Figure 31 shows the second derivatives spectra of GGBP-M182C (Figure 31A) and GGBP-WT (Figure 31B) in the absence (continuous line) and in the presence (dashed line) of glucose at 20°C. Figure 31C compares the second derivative spectra of GGBP-WT (continuous line) and GGBP-M182C (dashed line) in the absence of glucose. In the amide I’ region, the resolution-enhanced spectra show seven bands both for GGBP-M182C and GGBP-WT. The 1628 cm-1, 1636.6 cm-1 and 1697.0 cm-1 bands are characteristic of b-sheet structures. In particular, the 1628 cm-1 band could be assigned to the b-edge, i.e. b-strands particularly exposed to the solvent. The bands at 1650.9 cm-1 and 1658 cm-1 are attributed to a-helix structures, that could represent two different populations of helices differing in exposition to the solvent (2H2O) or in the regularity of folding (distortion). Since deuteration of proteins causes a downshift in wavenumber of the a-helix and b-sheet bands, the 1650.9 cm-1 and 1658 cm-1 bands could be due to more, and less solvent-exposed a-helices, respectively. The 1663 cm-1 band is due to turns while the 1681.1 cm-1 band could be assigned to turns and/or b-sheets. The bands below 1620 cm-1 are assigned to absorptions of amino acid side chains except for the band at 1550.5 cm-1, which is due to the residual amide II band. Spectra showed in Figure 31C are very similar, indicating only small differences in the secondary structure of the proteins. In particular, in GGBB-M182C the 1658 cm-1 band (less solvent-exposed a-helices) is present as a small shoulder as compared to GGBP-WT, suggesting that in the mutant protein a-helices structures are more exposed to the solvent than in GGBP-WT. Derivatives spectra show that the binding of the sugar slightly affects the secondary structure of GGBP-WT and of GGBP-M182C. Indeed, in the presence of glucose a small increase in the 1658 cm-1 band intensity is observed in both protein forms, and a previous study on GGBP-WT showed that the binding of D-glucose results in a small increase of the population of a-helices structures of GGBP (1658 cm-1 band).
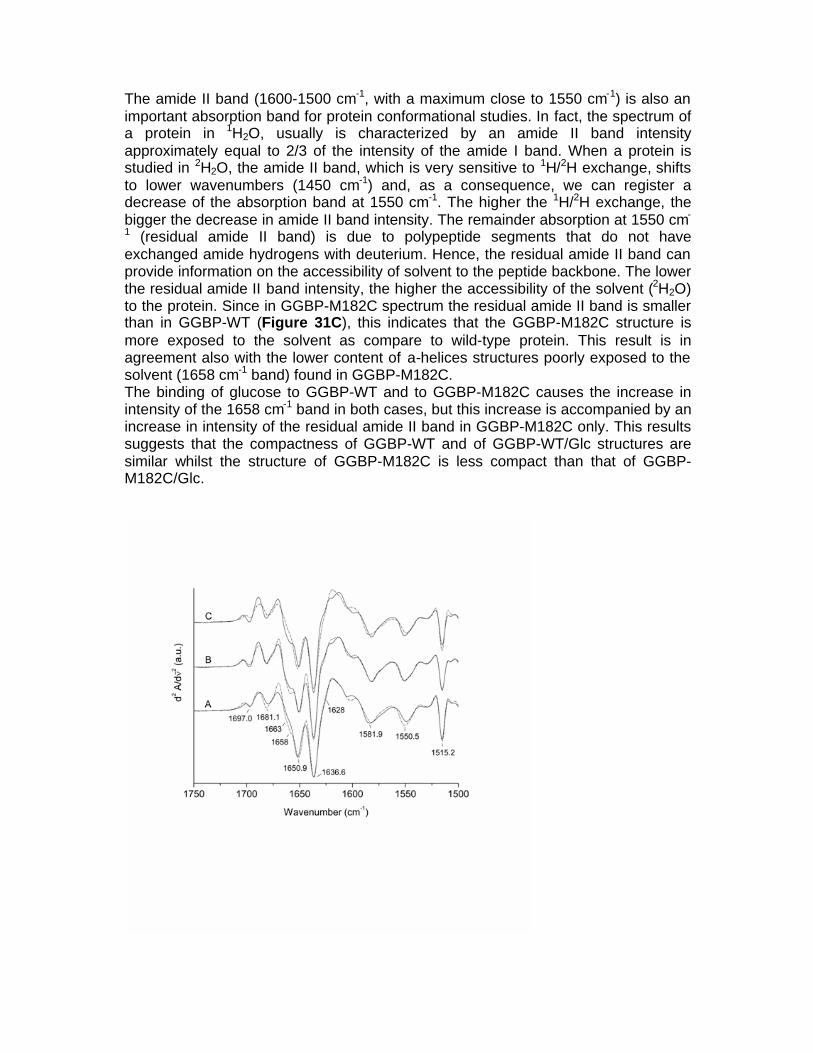
The amide II band (1600-1500 cm-1, with a maximum close to 1550 cm-1) is also an important absorption band for protein conformational studies. In fact, the spectrum of a protein in 1H2O, usually is characterized by an amide II band intensity approximately equal to 2/3 of the intensity of the amide I band. When a protein is studied in 2H2O, the amide II band, which is very sensitive to 1H/2H exchange, shifts to lower wavenumbers (1450 cm-1) and, as a consequence, we can register a decrease of the absorption band at 1550 cm-1. The higher the 1H/2H exchange, the bigger the decrease in amide II band intensity. The remainder absorption at 1550 cm-
1 (residual amide II band) is due to polypeptide segments that do not have exchanged amide hydrogens with deuterium. Hence, the residual amide II band can provide information on the accessibility of solvent to the peptide backbone. The lower the residual amide II band intensity, the higher the accessibility of the solvent (2H2O) to the protein. Since in GGBP-M182C spectrum the residual amide II band is smaller than in GGBP-WT (Figure 31C), this indicates that the GGBP-M182C structure is more exposed to the solvent as compare to wild-type protein. This result is in agreement also with the lower content of a-helices structures poorly exposed to the solvent (1658 cm-1 band) found in GGBP-M182C. The binding of glucose to GGBP-WT and to GGBP-M182C causes the increase in intensity of the 1658 cm-1 band in both cases, but this increase is accompanied by an increase in intensity of the residual amide II band in GGBP-M182C only. This results suggests that the compactness of GGBP-WT and of GGBP-WT/Glc structures are similar whilst the structure of GGBP-M182C is less compact than that of GGBP-M182C/Glc.
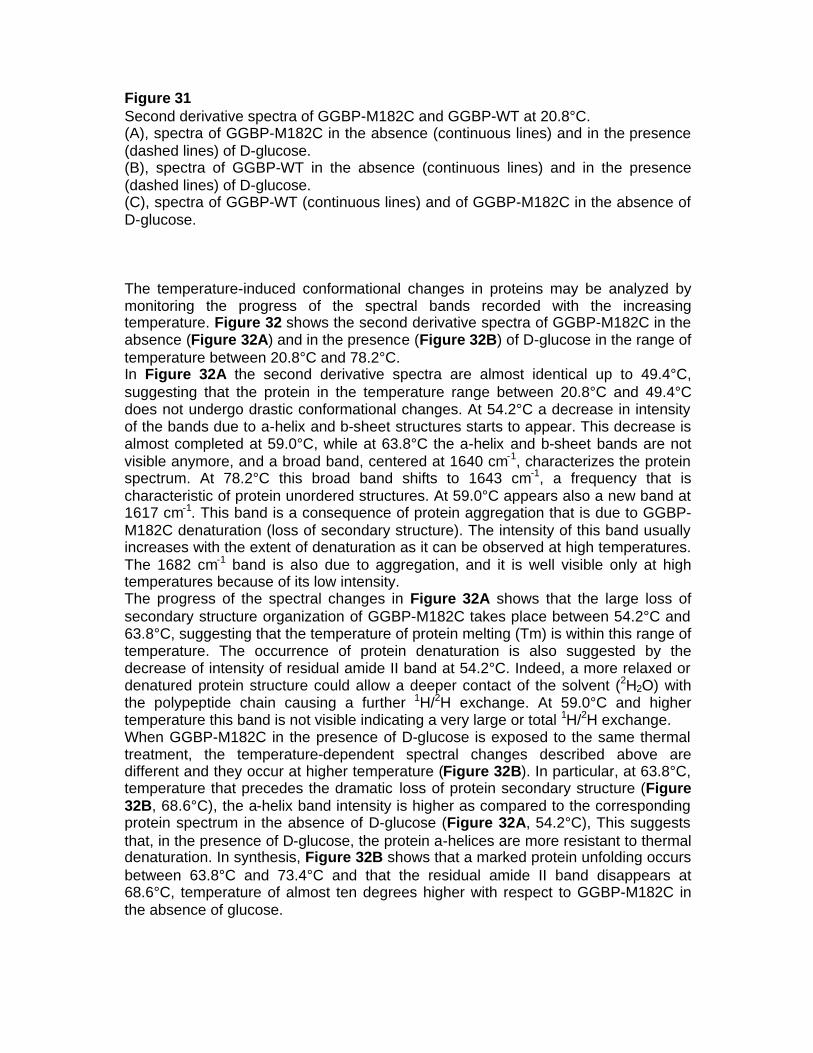
Figure 31 Second derivative spectra of GGBP-M182C and GGBP-WT at 20.8°C. (A), spectra of GGBP-M182C in the absence (continuous lines) and in the presence (dashed lines) of D-glucose. (B), spectra of GGBP-WT in the absence (continuous lines) and in the presence (dashed lines) of D-glucose. (C), spectra of GGBP-WT (continuous lines) and of GGBP-M182C in the absence of D-glucose. The temperature-induced conformational changes in proteins may be analyzed by monitoring the progress of the spectral bands recorded with the increasing temperature. Figure 32 shows the second derivative spectra of GGBP-M182C in the absence (Figure 32A) and in the presence (Figure 32B) of D-glucose in the range of temperature between 20.8°C and 78.2°C. In Figure 32A the second derivative spectra are almost identical up to 49.4°C, suggesting that the protein in the temperature range between 20.8°C and 49.4°C does not undergo drastic conformational changes. At 54.2°C a decrease in intensity of the bands due to a-helix and b-sheet structures starts to appear. This decrease is almost completed at 59.0°C, while at 63.8°C the a-helix and b-sheet bands are not visible anymore, and a broad band, centered at 1640 cm-1, characterizes the protein spectrum. At 78.2°C this broad band shifts to 1643 cm-1, a frequency that is characteristic of protein unordered structures. At 59.0°C appears also a new band at 1617 cm-1. This band is a consequence of protein aggregation that is due to GGBP-M182C denaturation (loss of secondary structure). The intensity of this band usually increases with the extent of denaturation as it can be observed at high temperatures. The 1682 cm-1 band is also due to aggregation, and it is well visible only at high temperatures because of its low intensity. The progress of the spectral changes in Figure 32A shows that the large loss of secondary structure organization of GGBP-M182C takes place between 54.2°C and 63.8°C, suggesting that the temperature of protein melting (Tm) is within this range of temperature. The occurrence of protein denaturation is also suggested by the decrease of intensity of residual amide II band at 54.2°C. Indeed, a more relaxed or denatured protein structure could allow a deeper contact of the solvent (2H2O) with the polypeptide chain causing a further 1H/2H exchange. At 59.0°C and higher temperature this band is not visible indicating a very large or total 1H/2H exchange. When GGBP-M182C in the presence of D-glucose is exposed to the same thermal treatment, the temperature-dependent spectral changes described above are different and they occur at higher temperature (Figure 32B). In particular, at 63.8°C, temperature that precedes the dramatic loss of protein secondary structure (Figure 32B, 68.6°C), the a-helix band intensity is higher as compared to the corresponding protein spectrum in the absence of D-glucose (Figure 32A, 54.2°C), This suggests that, in the presence of D-glucose, the protein a-helices are more resistant to thermal denaturation. In synthesis, Figure 32B shows that a marked protein unfolding occurs between 63.8°C and 73.4°C and that the residual amide II band disappears at 68.6°C, temperature of almost ten degrees higher with respect to GGBP-M182C in the absence of glucose.
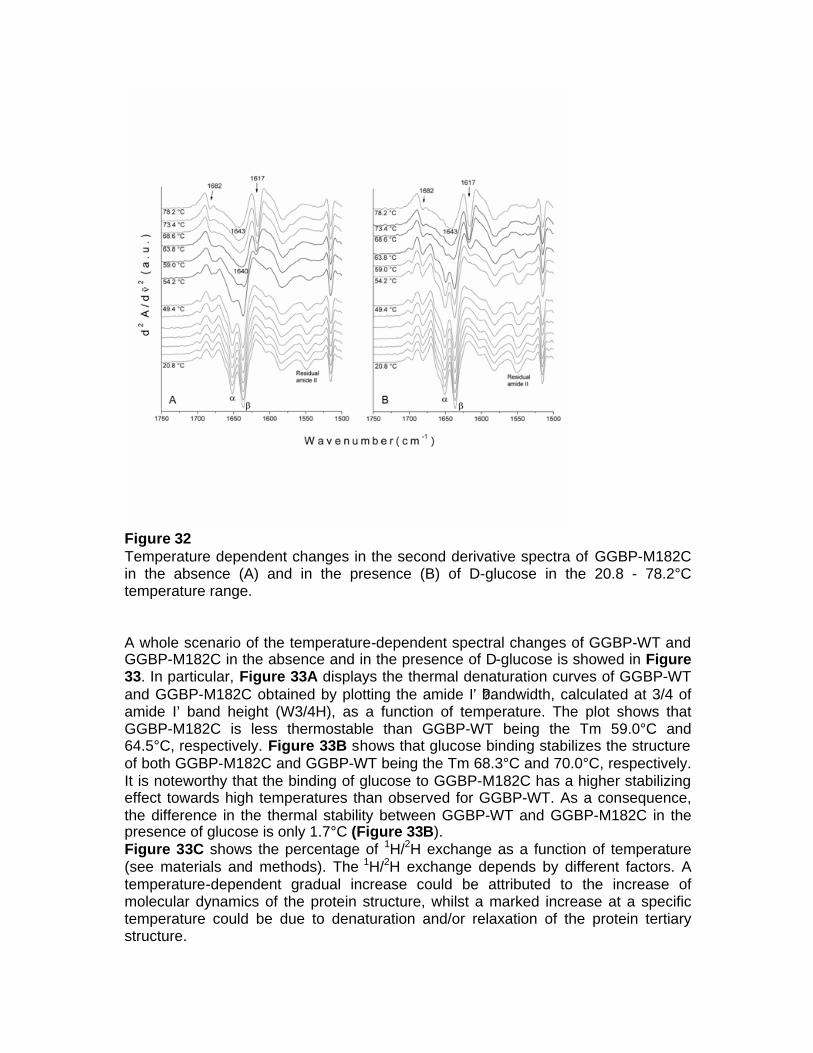
Figure 32 Temperature dependent changes in the second derivative spectra of GGBP-M182C in the absence (A) and in the presence (B) of D-glucose in the 20.8 - 78.2°C temperature range. A whole scenario of the temperature-dependent spectral changes of GGBP-WT and GGBP-M182C in the absence and in the presence of D-glucose is showed in Figure 33. In particular, Figure 33A displays the thermal denaturation curves of GGBP-WT and GGBP-M182C obtained by plotting the amide I’ ?bandwidth, calculated at 3/4 of amide I’ band height (W3/4H), as a function of temperature. The plot shows that GGBP-M182C is less thermostable than GGBP-WT being the Tm 59.0°C and 64.5°C, respectively. Figure 33B shows that glucose binding stabilizes the structure of both GGBP-M182C and GGBP-WT being the Tm 68.3°C and 70.0°C, respectively. It is noteworthy that the binding of glucose to GGBP-M182C has a higher stabilizing effect towards high temperatures than observed for GGBP-WT. As a consequence, the difference in the thermal stability between GGBP-WT and GGBP-M182C in the presence of glucose is only 1.7°C (Figure 33B). Figure 33C shows the percentage of 1H/2H exchange as a function of temperature (see materials and methods). The 1H/2H exchange depends by different factors. A temperature-dependent gradual increase could be attributed to the increase of molecular dynamics of the protein structure, whilst a marked increase at a specific temperature could be due to denaturation and/or relaxation of the protein tertiary structure.
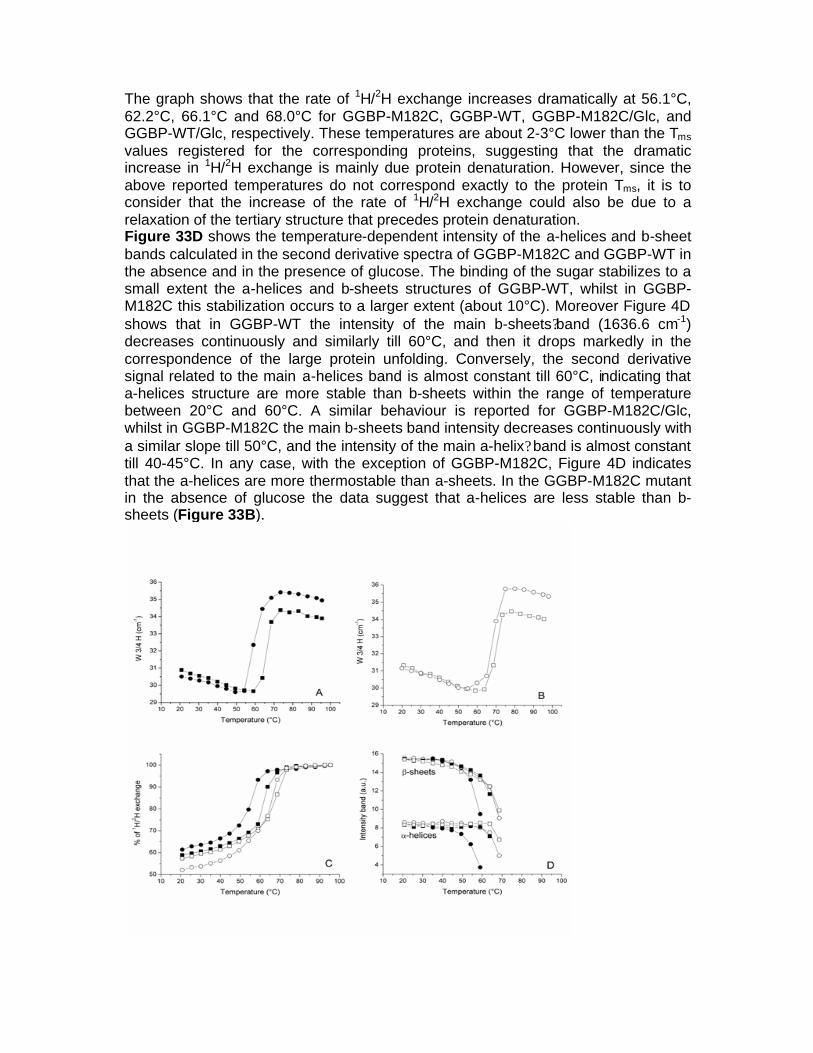
The graph shows that the rate of 1H/2H exchange increases dramatically at 56.1°C, 62.2°C, 66.1°C and 68.0°C for GGBP-M182C, GGBP-WT, GGBP-M182C/Glc, and GGBP-WT/Glc, respectively. These temperatures are about 2-3°C lower than the Tms values registered for the corresponding proteins, suggesting that the dramatic increase in 1H/2H exchange is mainly due protein denaturation. However, since the above reported temperatures do not correspond exactly to the protein Tms, it is to consider that the increase of the rate of 1H/2H exchange could also be due to a relaxation of the tertiary structure that precedes protein denaturation. Figure 33D shows the temperature-dependent intensity of the a-helices and b-sheet bands calculated in the second derivative spectra of GGBP-M182C and GGBP-WT in the absence and in the presence of glucose. The binding of the sugar stabilizes to a small extent the a-helices and b-sheets structures of GGBP-WT, whilst in GGBP-M182C this stabilization occurs to a larger extent (about 10°C). Moreover Figure 4D shows that in GGBP-WT the intensity of the main b-sheets?band (1636.6 cm-1) decreases continuously and similarly till 60°C, and then it drops markedly in the correspondence of the large protein unfolding. Conversely, the second derivative signal related to the main a-helices band is almost constant till 60°C, indicating that a-helices structure are more stable than b-sheets within the range of temperature between 20°C and 60°C. A similar behaviour is reported for GGBP-M182C/Glc, whilst in GGBP-M182C the main b-sheets band intensity decreases continuously with a similar slope till 50°C, and the intensity of the main a-helix? band is almost constant till 40-45°C. In any case, with the exception of GGBP-M182C, Figure 4D indicates that the a-helices are more thermostable than a-sheets. In the GGBP-M182C mutant in the absence of glucose the data suggest that a-helices are less stable than b-sheets (Figure 33B).
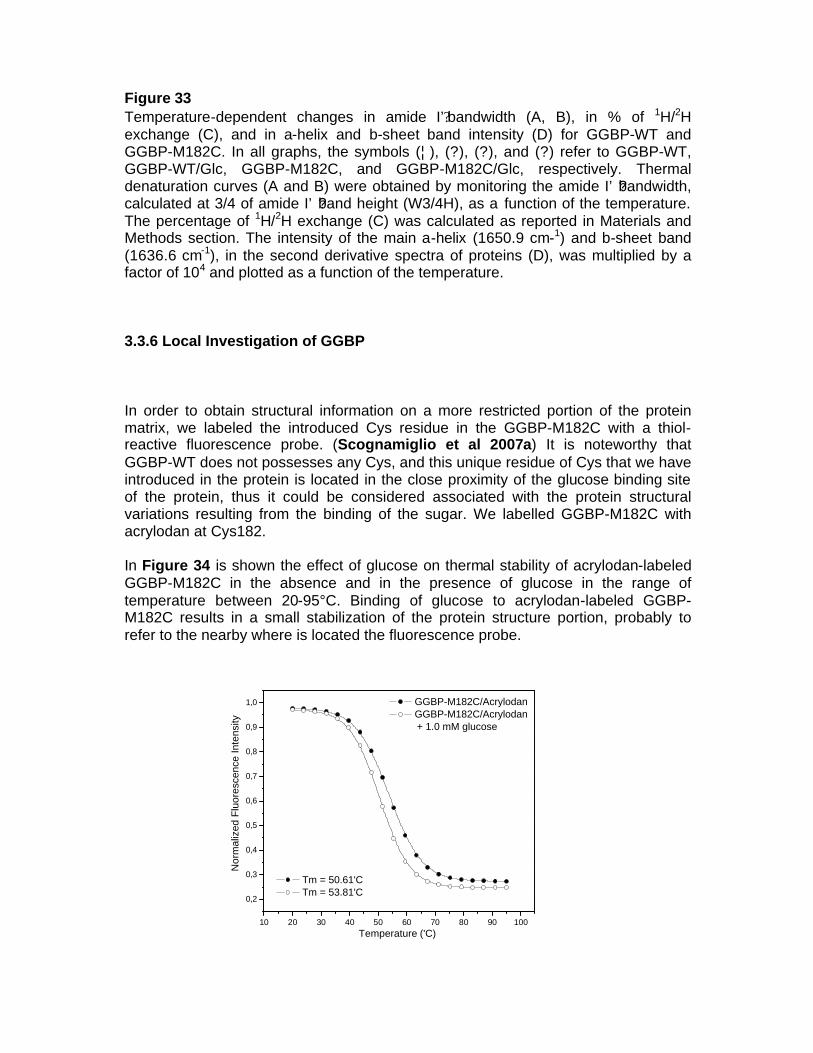
Figure 33 Temperature-dependent changes in amide I’?bandwidth (A, B), in % of 1H/2H exchange (C), and in a-helix and b-sheet band intensity (D) for GGBP-WT and GGBP-M182C. In all graphs, the symbols (¦ ), (?), (?), and (?) refer to GGBP-WT, GGBP-WT/Glc, GGBP-M182C, and GGBP-M182C/Glc, respectively. Thermal denaturation curves (A and B) were obtained by monitoring the amide I’ ?bandwidth, calculated at 3/4 of amide I’ ?band height (W3/4H), as a function of the temperature. The percentage of 1H/2H exchange (C) was calculated as reported in Materials and Methods section. The intensity of the main a-helix (1650.9 cm-1) and b-sheet band (1636.6 cm-1), in the second derivative spectra of proteins (D), was multiplied by a factor of 104 and plotted as a function of the temperature. 3.3.6 Local Investigation of GGBP In order to obtain structural information on a more restricted portion of the protein matrix, we labeled the introduced Cys residue in the GGBP-M182C with a thiol-reactive fluorescence probe. (Scognamiglio et al 2007a) It is noteworthy that GGBP-WT does not possesses any Cys, and this unique residue of Cys that we have introduced in the protein is located in the close proximity of the glucose binding site of the protein, thus it could be considered associated with the protein structural variations resulting from the binding of the sugar. We labelled GGBP-M182C with acrylodan at Cys182. In Figure 34 is shown the effect of glucose on thermal stability of acrylodan-labeled GGBP-M182C in the absence and in the presence of glucose in the range of temperature between 20-95°C. Binding of glucose to acrylodan-labeled GGBP-M182C results in a small stabilization of the protein structure portion, probably to refer to the nearby where is located the fluorescence probe.
10 20 30 40 50 60 70 80 90 100
0,2
0,3
0,4
0,5
0,6
0,7
0,8
0,9
1,0
Tm = 50.61'C Tm = 53.81'C
GGBP-M182C/Acrylodan GGBP-M182C/Acrylodan
+ 1.0 mM glucose
Temperature ('C)
Nor
mal
ized
Flu
ores
cenc
e In
tens
ity
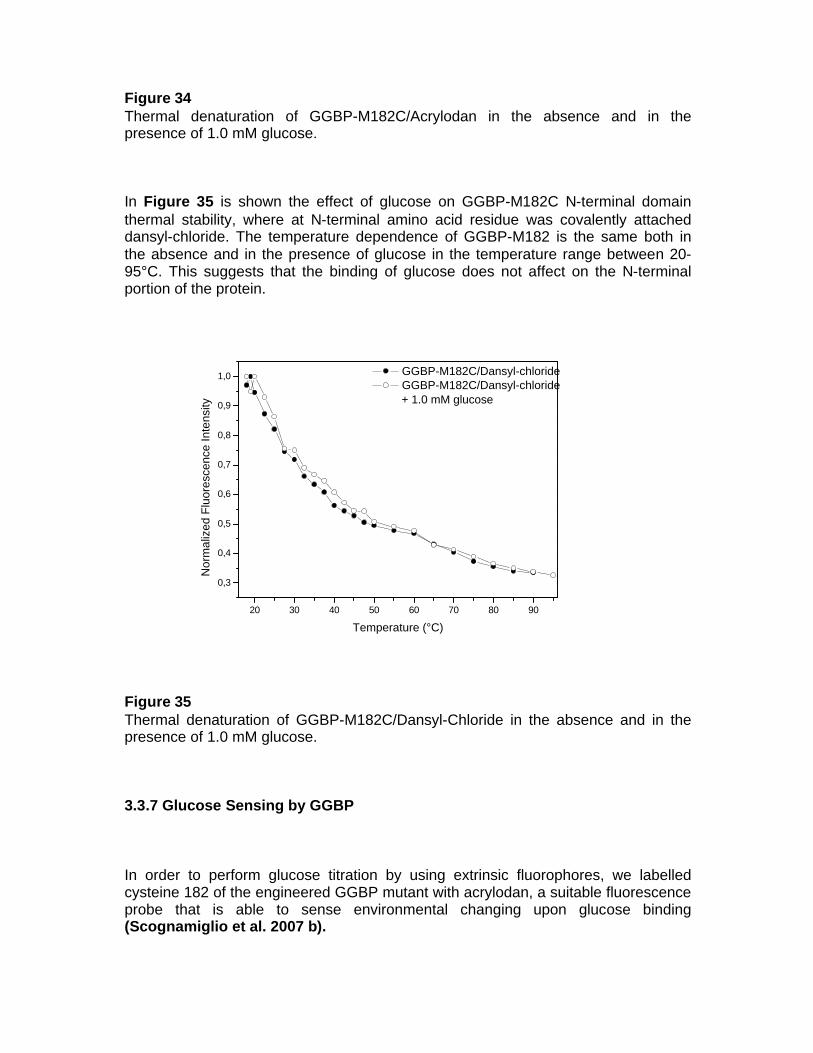
Figure 34 Thermal denaturation of GGBP-M182C/Acrylodan in the absence and in the presence of 1.0 mM glucose. In Figure 35 is shown the effect of glucose on GGBP-M182C N-terminal domain thermal stability, where at N-terminal amino acid residue was covalently attached dansyl-chloride. The temperature dependence of GGBP-M182 is the same both in the absence and in the presence of glucose in the temperature range between 20-95°C. This suggests that the binding of glucose does not affect on the N-terminal portion of the protein. Figure 35 Thermal denaturation of GGBP-M182C/Dansyl-Chloride in the absence and in the presence of 1.0 mM glucose. 3.3.7 Glucose Sensing by GGBP In order to perform glucose titration by using extrinsic fluorophores, we labelled cysteine 182 of the engineered GGBP mutant with acrylodan, a suitable fluorescence probe that is able to sense environmental changing upon glucose binding (Scognamiglio et al. 2007 b).
20 30 40 50 60 70 80 90
0,3
0,4
0,5
0,6
0,7
0,8
0,9
1,0
Nor
mal
ized
Flu
ores
cenc
e In
tens
ity
Temperature (°C)
GGBP-M182C/Dansyl-chloride GGBP-M182C/Dansyl-chloride
+ 1.0 mM glucose
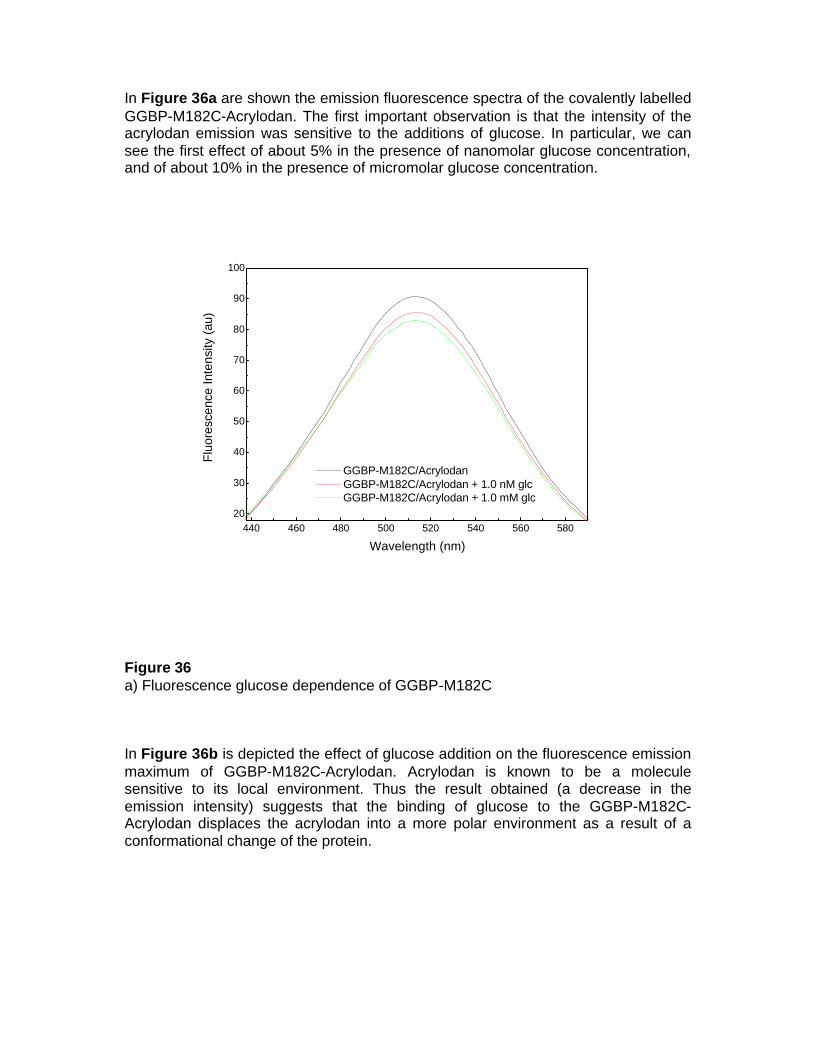
In Figure 36a are shown the emission fluorescence spectra of the covalently labelled GGBP-M182C-Acrylodan. The first important observation is that the intensity of the acrylodan emission was sensitive to the additions of glucose. In particular, we can see the first effect of about 5% in the presence of nanomolar glucose concentration, and of about 10% in the presence of micromolar glucose concentration. Figure 36 a) Fluorescence glucose dependence of GGBP-M182C In Figure 36b is depicted the effect of glucose addition on the fluorescence emission maximum of GGBP-M182C-Acrylodan. Acrylodan is known to be a molecule sensitive to its local environment. Thus the result obtained (a decrease in the emission intensity) suggests that the binding of glucose to the GGBP-M182C-Acrylodan displaces the acrylodan into a more polar environment as a result of a conformational change of the protein.
440 460 480 500 520 540 560 58020
30
40
50
60
70
80
90
100
Flu
ores
cenc
e In
tens
ity (
au)
Wavelength (nm)
GGBP-M182C/Acrylodan GGBP-M182C/Acrylodan + 1.0 nM glc GGBP-M182C/Acrylodan + 1.0 mM glc
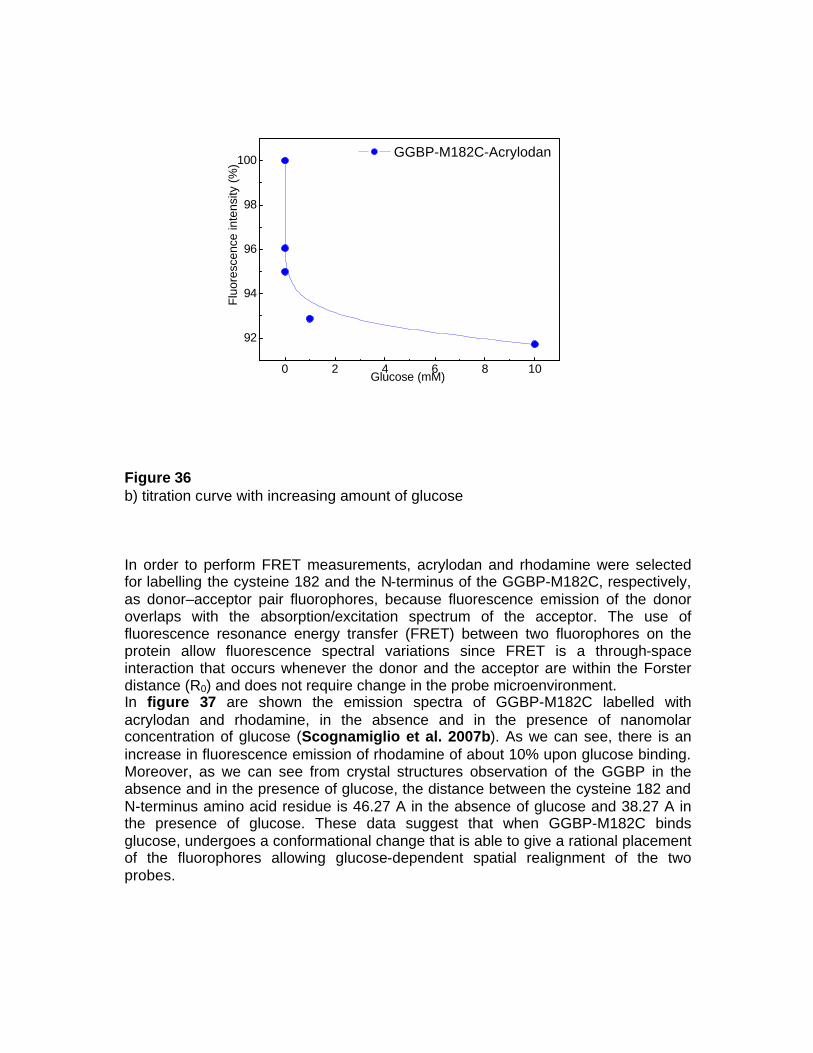
Figure 36 b) titration curve with increasing amount of glucose In order to perform FRET measurements, acrylodan and rhodamine were selected for labelling the cysteine 182 and the N-terminus of the GGBP-M182C, respectively, as donor–acceptor pair fluorophores, because fluorescence emission of the donor overlaps with the absorption/excitation spectrum of the acceptor. The use of fluorescence resonance energy transfer (FRET) between two fluorophores on the protein allow fluorescence spectral variations since FRET is a through-space interaction that occurs whenever the donor and the acceptor are within the Forster distance (R0) and does not require change in the probe microenvironment. In figure 37 are shown the emission spectra of GGBP-M182C labelled with acrylodan and rhodamine, in the absence and in the presence of nanomolar concentration of glucose (Scognamiglio et al. 2007b). As we can see, there is an increase in fluorescence emission of rhodamine of about 10% upon glucose binding. Moreover, as we can see from crystal structures observation of the GGBP in the absence and in the presence of glucose, the distance between the cysteine 182 and N-terminus amino acid residue is 46.27 A in the absence of glucose and 38.27 A in the presence of glucose. These data suggest that when GGBP-M182C binds glucose, undergoes a conformational change that is able to give a rational placement of the fluorophores allowing glucose-dependent spatial realignment of the two probes.
0 2 4 6 8 10
92
94
96
98
100
Glucose (mM)
Flu
ores
cenc
e in
tens
ity (
%)
GGBP-M182C-Acrylodan
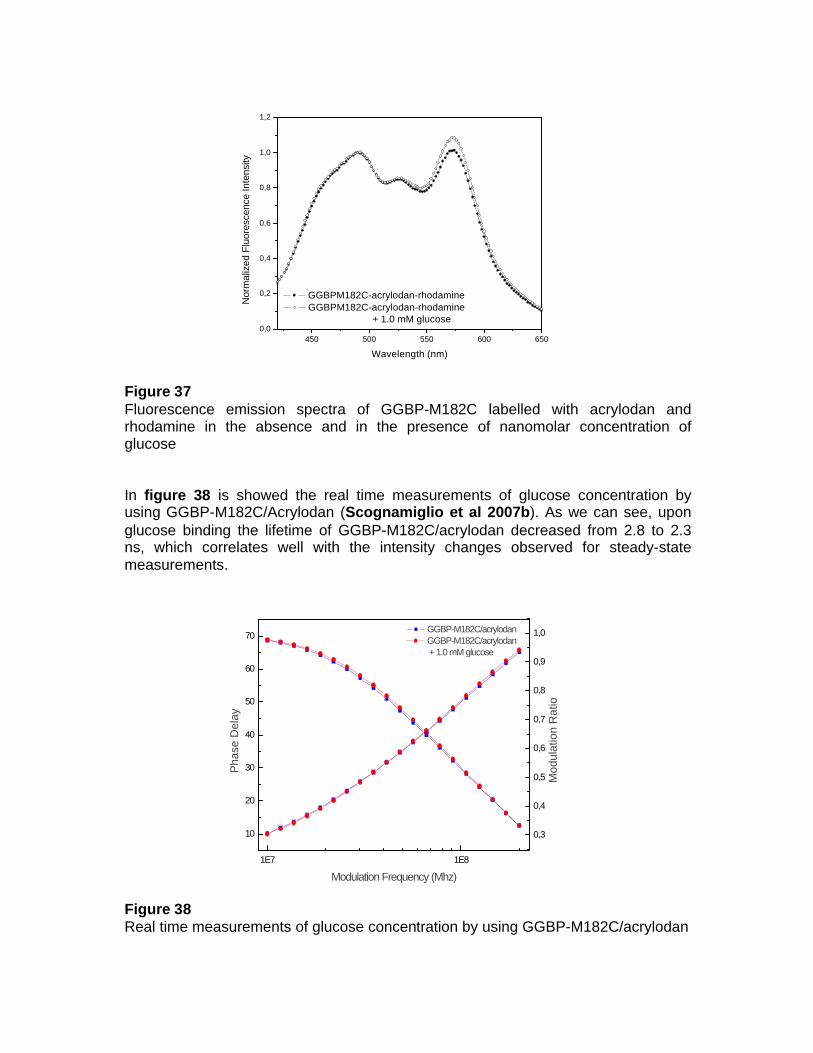
Figure 37 Fluorescence emission spectra of GGBP-M182C labelled with acrylodan and rhodamine in the absence and in the presence of nanomolar concentration of glucose In figure 38 is showed the real time measurements of glucose concentration by using GGBP-M182C/Acrylodan (Scognamiglio et al 2007b). As we can see, upon glucose binding the lifetime of GGBP-M182C/acrylodan decreased from 2.8 to 2.3 ns, which correlates well with the intensity changes observed for steady-state measurements. Figure 38 Real time measurements of glucose concentration by using GGBP-M182C/acrylodan
450 500 550 600 6500,0
0,2
0,4
0,6
0,8
1,0
1,2
Nor
mal
ized
Flu
ores
cenc
e In
tens
ity
Wavelength (nm)
GGBPM182C-acrylodan-rhodamine GGBPM182C-acrylodan-rhodamine
+ 1.0 mM glucose
0,3
0,4
0,5
0,6
0,7
0,8
0,9
1,0 GGBP-M182C/acrylodan GGBP-M182C/acrylodan
+ 1.0 mM glucose
Mod
ulat
ion
Rat
io
1E7 1E8
10
20
30
40
50
60
70
Pha
se D
elay
Modulation Frequency (Mhz)
4. DISCUSSION 4.1 Production of GGBP-WT, GGBP-WT/Ca free and GGBP-M182C The GGBP-WT from E. coli was over-produced by using the Neu and Heppel osmotic shock protocol. By this method, it is possible to purify periplasmic proteins that are able to pass the plasmatic membrane and go to the periplasmic space by using a signal peptide sequence. For this reason, the proteins are cloned in expression plasmids together with the signal sequence. In particular the mglB gene for GGBP-WT was cloned in pTZ18U vector, a genetic variant of the commercial plasmid pUC18, together with its promoter and its signal sequence, with SacI and PstI as restriction enzymes. The protein was over-expressed in NM303 E. coli strain, that is a mutant strain that does not produce GGBP, in order to obtain the expression of the recombinant GGBP and to avoid the basal production of the protein. In the same way, the mutant protein GGBP-M182C was cloned in the same vector and over-expressed by using the same protocol. In particular, the mutant GGBP-M182C was constructed by site-directed mutagenesis, using a template the recombinant plasmid pTZ18U-mglB; the obtained mutated gene was cloned in pTZ18U plasmid with SacI and PstI as restriction enzymes and transformed in NM303 E. coli strain. The mutated protein was over-expressed in the same growth conditions for wilde-type protein and purified by osmotic shock as Neu and Heppel protocol. The recombinant protein GGBP-M182C was successfully expressed and purified with a high yield as for GGBP-WT. 4.2 Structural and Functional Characterization of GGBP Many Spectroscopic studies were performed on GGBP for a deeply understanding the structural properties of this protein, such as FI-TR Spectroscopy, DSC, Fluorescence Spectroscopy, CD. All data indicate that when D-glucose binds to the ligand-binding site located in the cleft between the two GGBP domains of the native folded protein, the relative positions of domains change, which involves some of the amino acids in a network of hydrogen bonds. In particular, when upon glucose binding, GGBP undergoes a large conformational change in the global structure to accommodate the ligand inside the binding site. The effect of this conformational change is a dramatic stabilization of the protein structure, in fact, this interaction results in a large Tm increase of 13°C that can be observed by spectroscopy methods. In addition, we have documented that temperature stability and character of the melting curves of GGBP-WT are strongly modulated by the presence of glucose but also of calcium, whose binding site is located at C-terminal domain.
From dynamics data it is evident that, although the metal ion is inserted in a binding site at the surface of the protein, it exerts a stabilizing effect that encompasses the whole structure of the protein, probably via the central b-sheet?of the C-terminal domain. The ion depletion does not act only locally, but it also affects the core conformation of this domain, that is no longer able to resist to the perturbation caused by the high temperature. These results are in agreement with the fluorescence and infrared data and offer a molecular portrait of the events occurring for GGBP-WT Ca-free during the thermal denaturation. Infrared data show that the calcium depletion of GGBP markedly reduces the thermal stability of the protein, while it affects marginally the presence of secondary structures at room temperature. The small changes in the secondary structure involve an a-helix band (1658 cm-1) that is not present in the calcium-depleted GGBP spectrum and that is restored in GGBP-WT Ca-free/Glc spectrum. The nature of this band may be correlated with a population of ? -helices or a segment of a-helix poorly exposed to the solvent. It is possible that the lack of the band in GGBP-Ca and its presence in GGBP-Ca/Glc is due to enhanced and reduced exposure to the solvent of the a-helix or part of it, respectively. The binding of glucose to GGBP-WT Ca-free also stabilizes the structure of the protein against high temperatures since the temperature of melting of GGBP-WT Ca-free/Glc resulted very similar to that of GGBP-WT/Glc. Our experiments demonstrated that absence of calcium promote decrease of thermal stability and of the melting-curve cooperativity. Presence of glucose on GGBP-WT calcium free stabilizes the protein structure and restores the cooperativity of the temperature-induced transition. For this reason, we expect that observed stability changes of the GGBP-WT structure caused by removal of calcium and by the glucose binding are related mainly to the region of the C-terminal domain. These observations were corroborated by once more experiments, in which was demonstrated that glucose binding imposes an order in which the domain unfold; that is, the stability of one domain is dependent on whether the other domain is folded or unfolded. The mutated form of GGBP was investigated by Fluorescence Spectroscopy, CD, FI-TR and MD. All data obtained, suggest that the protein undergoes no important alteration of its structural properties upon substitution of methionine 182 with cysteine, and that the presence of a single cysteine gave us the possibility to obtain more detailed informations about different region of the protein and in particular to the glucose binding site. In this contest, in the present study, we have documented that the binding of glucose to GGBP results in no stabilizing effect on the N-terminus of GGBP and in a moderate stabilization of the protein matrix close to the sugar-binding site of GGBP. On the contrary, the binding of glucose has a strong stabilization effect on the C-terminal domain of the GGBP. In particular, infrared data showed that GGBP-WT and GGBP-M182C have a similar secondary structure content with two populations of a-helices differently exposed to the solvent. In the mutant protein the infrared data indicated a lower content of buried a-helices than in GGBP-WT. This finding is in agreement with the fact that GGBP-M182C shows also a higher 1H/2H exchange than GGBP-WT as well as with the Stern-Volmer results. Taken together these data
suggest a less compact structure of the mutant protein with respect to GGBP-WT. The binding of glucose to GGBP-M182C leads to the increase in content of buried a-helices and to a lower accessibility of the solvent to the protein. In conclusion, we have documented that the presence of glucose results in a slightly affect on the glucose binding site portion of the protein, that the glucose has a strong stabilization of the C-terminal domain of the mutant form of GGBP and, finally, that does not affect on the N-terminal domain. On the basis of these more detailed observations, we can assume that the presence of glucose affect the thermal stability of the whole protein but in particular of the C-terminal domain.
4.3 Glucose Sensing In order to use GGBP as a glucose sensor system, we investigated glucose binding by steady-state and life-time fluorescence spectroscopy and FRET measurements. In particular, we performed glucose titration by using extrinsic fluorophore, labelling cysteine 182 of the engineered GGBP mutant with acrylodan, a suitable fluorescence probe that is able to sense environmental changing upon glucose binding. The first important observation was that the intensity of the acrylodan emission was sensitive to the additions of glucose, since the results obtained (a decrease in the emission intensity) suggest that the binding of glucose to the GGBP-M182C-Acrylodan displaces the acrylodan into a more polar environment as a result of a conformational change of the protein. To perform glucose sensing by FRET measurements, acrylodan and rhodamine were selected for labelling the cysteine 182 and the N-terminus of the GGBP-M182C, respectively, as donor–acceptor pair fluorophores. Upon glucose binding, we obtained an increase in fluorescence emission of rhodamine of about 10%. In addition, the real time measurements of glucose concentration by using GGBP-M182C/acrylodan shows that, upon glucose binding, the lifetime slightly changes, which correlates well with the intensity changes observed for steady-state measurements. These results demonstrate that the GGBP-M182C can be a good candidate as a probe for the development of a non-consuming glucose biosensor. Additional studies are needed to obtain a GGBP-M182C-based sensor that displays larger spectral changes. For example, we hope that GGBP-M182C labelled with other fluorophores will display larger intensity changes and/or spectral shifts, or it could be useful to adopt different genetic strategies to construct other mutated proteins, in which extrinsic probes are in a position more involved in the conformational changes of the protein.
5. REFERENCES:
1. Arrondo JL, Muga A, Castresana J, Goñi FM. (1993) Quantitative studies of the structure of proteins in solutions by Fourier-transform infrared spectroscopy. Prog. Biophys. Mol. Biol. 59, 23-56
2. Barth A, Zscherp C. (2002) What vibrations tell us about proteins. Q. Rev. Biophys. 35, 369-430
3. Boos W,. Lucht JM. (1996) Periplasmic Binding Protein-Dependent ABC Transporter. In: Escherichia coli and Salmonella typhimurium; cellular and molecular biology. F.C
4. Borrok MJ, Kiessling LL, Forest KT. Conformational changes of D-glucose/D-galactose binding protein illuminated by apo and ultrahigh resolution ligand-bound structures. to be published
5. Bradford MM. (1976) A rapid and sensitive method for the quantitation of microgram quantities of protein utilizing the principle of protein-dye binding. Anal Biochem. 72, 248-54
6. Casal HL, Kohler U, Mantsch HH. (1988) Structural and conformational changes of beta-lactoglobulin B: an infrared spectroscopic study of the effect of pH and temperature. Biochim. Biophys. Acta 957, 11-20
7. Chirgadze YN, Fedorov OV, Trushina NP. (1975) Estimation of amino acid residue side-chain absorption in the infrared spectra of protein solutions in heavy water. Biopolymers 14, 679-694
8. Cornell WD, Cieplak P, Bayly CI, Gould IR, Merz KM, Ferguson DM, Spellmeyer DC, Fox T, Caldwell JW, Kollman PA (1995) A 2nd generation force-field for the simulation of proteins, nucleic-acids, and organic-molecules. J Am Chem Soc; 117, 5179-5197
9. Darden T, York D, Pedersen L. (1993) Particle Mesh Ewald - an N.Log(N) method for Ewald sums in large systems. J Chem Phys 98, 10089-10092
10. D’Auria S, Lakowicz JR. (2001) Enzyme fluorescence as a sensing tool: new perspectives in biotechnology Curr Opin Biotechnol 12, 99 –104
11. D'Auria S, Alfieri F, Staiano M, Pelella F, Rossi M, Scire A, Tanfani F, Bertoli E, Grycznyski Z, Lakowicz JR. (2004) Structural and thermal stability characterization of Escherichia coli D-galactose/D-glucose-binding protein. Biotechnol Prog 20(1), 330-337
12. D'Auria S, Ausili A, Marabotti A, Varriale A, Scognamiglio V, Staiano M, Bertoli E, Rossi M, Tanfani F., Binding of glucose to the D-galactose/D-glucose-binding protein from Escherichia coli restores the native protein secondary structure and thermostability that are lost upon calcium depletion. J Biochem (Tokyo). 2006 Feb;139(2):213-21.
13. Eftink MR, Ghiron CA (1976) Exposure of tryptophanyl residues in proteins. Quantitative determination by fluorescence quenching studies. Biochemistry 15(3), 672-80
14. Febbraio F, Andolfo A, Tanfani F, Briante R, Gentile F, Formisano S, Vaccaro C, Scirè A, Bertoli E, Pucci P, Nucci R. (2004) Thermal stability and aggregation of Sulfolobus solfataricus beta-glycosidase are dependent upon the N-epsilon-methylation of specific lysyl residues: critical role of in vivo post-translational modifications. J. Biol. Chem 279, 10185-10194
15. Ge X, Tolosa L, Simpson J, Govind. (2003) Genetically Engineered Binding Proteins as Biosensors for Fermentation and Cell Culture Rao Biotechnol Bioeng 84(6), 723-31
16. Herman P, Vecer J, Barvik I Jr, Scognamiglio V, Staiano M, de Champdore M, Varriale A, Rossi M, D'Auria S. (2005) The role of calcium in the conformational dynamics and thermal stability of the D-galactose/D-glucose-binding protein from Escherichia coli. Proteins. 61(1), 184-95
17. Hogg RW, Voelker C, Von Carlowitz I. (1991) Nucleotide sequence and analysis of the mgl operon of Escherichia coli K12. Mol Gen Genet.229(3), 453-9
18. Jackson M, Mantsch HH. (1991) Beware of proteins in DMSO. Biochim. Biophys. Acta 1078, 231-235
19. Kabsch W, Sander C. (1983) Dictionary of protein secondary structure: pattern recognition of hydrogen-bonded and geometrical features. Biopolymers 22, 2577-2637
20. Krimm S, Bandekar J. (1986) Vibrational spectroscopy and conformation of peptides, polypeptides and proteins. Adv. Protein Chem 38, 181-364
21. Laemmli UK. (1970) Cleavage of structural proteins during the assembly of the head of bacteriophage T4. Nature 227(5259), 680-685
22. Lakowicz JR. (1994) Emerging biomedical applications of time-resolved fluorescence spectroscopy. In: Lakowicz, JR. (Ed.), Topics in Fluo-rescence Spectroscopy, vol. 4. Plenum Press, New York 1-19
23. Lakowicz JR. (1999) Principles of Fluorescence Spectroscopy. second ed. Plenum Press, New York
24. Luck LA, Falke JJ. (1991) Open conformation of a substrate binding cleft: 19F NMR studies of cleft angle in the D-galactose chemosensory receptor. Biochemistry 30, 6484-6490
25. Magnusson U, Chaudhuri BN, Ko J, Park C, Jones TA, Mowbray SL. (2002) Hinge-bending motion of D-allose-binding protein from Escherichia coli: three open conformations. J Biol Chem; 277, 14077-14084
26. Marabotti A, Ausili A, Staiano M, Scire A, Tanfani F, Parracino A, Varriale A, Rossi M, D'Auria S. (2006) Pressure affects the structure and the dynamics of the D-galactose/D-glucose-binding protein from Escherichia coli by perturbing the C-terminal domain of the protein. Biochemistry 45(39), 11885-94
27. McShane MJ. (2002) Potential for glucose monitoring with nanoengi-neered fluorescent biosensors. Diabetes Technol Ther 4, 533–538
28. Neu HC, Heppel LA (1965) The Release of Enzymes from Kwherichia coli by Osmotic Shock and during the Formation of Spheroplasts Journal Biol Chem 240, 9
29. Pedone E, Bartolucci S, Rossi M, Pierfederici FM, Scirè A, Cacciamani T, Tanfani F. (2003) Structural and thermal stability analysis of Escherichia coli and Alicyclobacillus acidocaldarius thioredoxin revealed a molten globule-like state in the thermal denaturation pathway of the proteins: An infrared spectroscopic study. Biochem J 373, 875-883
30. Piszczek G, D'Auria S, Staiano M, Rossi M, Ginsburg A. (2004) Conformational stability and domain coupling in D-glucose/D-galactose-binding protein from Escherichia coli. Biochem J 381(Pt 1), 97-103
31. Ragusa S, Cambria MT, Pierfederici F, Scirè A, Bertoli E, Tanfani F, Cambria A. (2002) Structure-activity relationship on fungal laccase from
Rigidoporus lignosus: A Fourier-transform infrared spectroscopic study. Biochim. Biophys. Acta 1601, 155-162
32. Scirè A, Saccucci F, Bertoli E, Cambria MT, Principato G, D’Auria S, Tanfani F. (2002) Effect of acidic phospholipids on the structural properties of recombinant cytosolic human glyoxalase II. Proteins 48, 126-133
33. (A) Scognamiglio V, Scirè A, Aurilia V, Staiano M, Crescenzo R, Palmucci C, Bertoli E, Rossi M, Tanfani F, D’Auria S. (2007) A strategic fluorescence labelling of D-galactose/D-glucose-binding protein from E. coli for a better understanding of the protein structural stability and dynamics. Journal of Proteom research In Press
34. (B) Scognamiglio V, Aurilia V, Cennamo N, Ringhieri P, Iozzino L, Tartaglia M, Staiano M, Ruggiero G, Orlando P, Labella T, Zeni L, Vitale A, D’Auria S. (2007) The D-galactose/D-glucose-binding protein from Escherichia coli as probe for a non-consuming glucose implantable fluorescence biosensor. Sensors Journal In Press
35. Selvin PR. (1995) Fluorescence resonance energy transfer. Method. En-zymol. 246, 300-334
36. Surewicz WK, Mantsch HH, Chapman D. (1993) Determination of protein secondary structure by Fourier transform infrared spectroscopy: A critical assessment. Biochemistry 32, 389-394
37. Tanfani F, Lapathitis G, Bertoli E, Kotyk A. (1998) Structure of yeast plasma membrane H+-ATPase: comparison of activated and basal-level enzyme forms. Biochim. Biophys. Acta 1369, 109-118
38. Tolosa L, Gryczynski I, Eichhorn LR, Dattelbaum JD, Castellano FN, Rao G, Lakowicz JR. (1999) Glucose sensor for low-cost lifetime-based sensing using a genetically engineered protein. Anal Biochem 267, 114-120
39. Urban A, Neukirchen S, Jaeger KE. (1997) A rapid and efficient method for site-directed mutagenesis using one-step overlap extension PCR. Nucleic Acids Res 25(11), 2227-2228
40. Vyas N.K Vyas MN, Quiocho FA. (1988). Sugar and signal-transducer binding sites of the Escherichia coli galactose chemoreceptor protein. Science, 242, 1290-1295
41. Vyas NK, Vyas MN, Quiocho FA (1991) Comparison of the periplasmic receptors for L-arabinose, D-glucose/D-galactose, and D-ribose. Structural and Functional Similarity. J Biol Chem 266, 5226-5237
42. Vyas NK, Vyas MN, Quiocho FA. (1987) A novel calcium binding site in the galactose-binding protein of bacterial transport and chemotaxis. Nature 327, 635-638
43. Weiss S. (1999) Fluorescence spectroscopy of single molecules. Science 283, 1676-1683
44. Zukin RS, Strange PG, Heavey LR, Koshland Jr DE. (1977) Properties of the galactose binding protein of Salmonella typhimurium and Escherichia coli. Biochemistry 16, 381-386
6. PUBBLICATIONS EXPERIENCES IN FOREIGN LABORATORIES 24 May 2007 – 9 June 2007 in Prof. Turoverov K. Konstantin Lab, Laboratory of
Structural Dynamics, Stability and Folding of Proteins, Institute of Cytology, Russian
Academy of Science, Tikhoretsky av., 4, 194064 St. Petersburg, RUSSIA, for pre-
stationary state measurements of binding kinetics by stopped-flow fluorescence
spectroscopy.
PUBLICATIONS ON INTERNATIONAL JOURNAL Herman P, Vecer J, Scognamiglio V, Staiano M, Rossi M, D'Auria S. (2004) A recombinant glutamine-binding protein from Escherichia coli: effect of ligand-binding on protein conformational dynamics. Biotechnol Prog 20(6), 1847-1854 Staiano M, Sapio M, Scognamiglio V, Marabotti A, Facchiano AM, Bazzicalupo P, Rossi M, D'Auria S. (2004) A thermostable sugar-binding protein from the Archaeon Pyrococcus horikoshii as a probe for the development of a stable fluorescence biosensor for diabetic patients. Biotechnol Prog 20(5), 1572-1577 Scognamiglio V, Staiano M, Rossi M, D'Auria S. (2004) Protein-based biosensors for diabetic patients. J Fluoresc 14(5), 491-498 Stepanenko OV, Kuznetsova IM, Turoverov KK, Scognamiglio V, Staiano M, D'Auria S. (2005) The structure and stability of the glutamine-binding protein from Escherichia coli and its complex with glutamine. Tsitologiia (Russia) 47(11), 988-1006 Herman P, Vecer J, Barvik I Jr, Scognamiglio V, Staiano M, de Champdore M, Varriale A, Rossi M, D'Auria S. (2005) The role of calcium in the conformational dynamics and thermal stability of the D-galactose/D-glucose-binding protein from Escherichia coli. Proteins 61(1), 184-195 Staiano M, Scognamiglio V, Rossi M, D'Auria S, Stepanenko OV, Kuznetsova IM, Turoverov KK. (2005) Unfolding and refolding of the glutamine-binding protein from Escherichia coli and its complex with glutamine induced by guanidine hydrochloride. Biochemistry 44(15), 5625-5633 Kuznetsova IM, Stepanenko OV, Turoverov KK, Staiano M, Scognamiglio V, Rossi M, D'Auria S. (2005) Fluorescence properties of glutamine-binding protein from Escherichia coli and its complex with glutamine. J Proteome Res 4(2), 417-423 D'Auria S, Scire A, Varriale A, Scognamiglio V, Staiano M, Ausili A, Marabotti A,
Rossi M, Tanfani F. (2005) Binding of glutamine to glutamine-binding protein from Escherichia coli induces changes in protein structure and increases protein stability. Proteins 58(1), 80-87 Staiano M, Scognamiglio V, Mamone G, Rossi M, Parracino A, Rossi M, D'Auria S. (2006) Glutamine-binding protein from Escherichia coli specifically binds a wheat gliadin peptide. 2. Resonance energy transfer studies suggest a new sensing approach for an easy detection of wheat gliadin. J Proteome Res 5(9), 2083-2086 D'Auria S, Staiano M, Varriale A, Scognamiglio V, Rossi M, Parracino A, Campopiano S, Cennamo N, Zeni L. (2006) The odorant-binding protein from Canis familiaris: purification, characterization and new perspectives in biohazard assessment. Protein Pept Lett 13(4), 349-352 D'Auria S, Ausili A, Marabotti A, Varriale A, Scognamiglio V, Staiano M, Bertoli E, Rossi M, Tanfani F. (2006) Binding of glucose to the D-galactose/D-glucose-binding protein from Escherichia coli restores the native protein secondary structure and thermostability that are lost upon calcium depletion. J Biochem (Tokyo) 139(2), 213-221 De Stefano L, Rotiroti L, Rendina I, Moretti L, Scognamiglio V, Rossi M, D'Auria S. (2006) Porous silicon-based optical microsensor for the detection of L-glutamine. Biosens Bioelectron 21(8), 1664-1667 Scognamiglio V, Aurilia V, Ringhieri P, Iozzino L, Tartaglia M, Staiano M, Zeni L, Cennamo N, Vitale A, Rossi M, D’Auria S. (2007) The Galactose/Glucose-binding protein from Escherichia coli as probe for a non-consuming glucose implantable fluorescence biosensor. In Press Scognamiglio V, Scirè A, Aurilia V, Staiano M, Crescenzo R, Palmucci C, Bertoli E, Rossi M, Tanfani F, D’Auria S. (2007) A strategic fluorescence labelling of D-galactose/D-glucose-binding protein from E. coli for a better understanding of the protein structural stability and dynamics. In Press PUBBLICATIONS ON ITALIAN JOURNAL Rossi M, Staiano M, Parracino A, Aurilia V, de Champdorè M, Varriale A, Aquino G, Vitale A, Cocozza I, Scognamiglio V, Rossi M, D’Auria S. (2005) Le nanotecnologie in campo diagnostico al servizio di diabetici e celiaci. Rivista Italaina di Materiali e Nanotecnologie BOOK CHAPTER D’Auria S, Ghirlanda G, Parracino A, de Campdorè M, Scognamiglio V, Staiano M, Rossi M. Fluorescence biosensor for continuously monitoring the blood glucose level of diabetic patients. Glucose Sensing (Topycs in Fluorescence Spectroscopy) 11, 117-127
Aurilia V, Staiano M, Crescenzo R, Varriale A, Scognamiglio V, Tartaglia M, Vitale A, Ringhieri P, Iozzino L, D’Auria S. (2007) New biomolecules for advanced sensing devices. “binding-protein family” as a model. Proceedings of the International School on Advanced Material Science and echnology CONGRESS COMUNICATIONS Piszczek G, Staiano M, Scognamiglio V, Rossi M, Ginsburg A, D’Auria S. (2003) Sugar-binding induces a change in the unfolding behaviour of the glucose/galactose-binding protein isolated from Escherichia coli. Italian journal of Biochemistry 52(3), 15-12 Scognamiglio V, Scirè A, Varriale A, Staiano M, Rossi M, Kuznetsova IM, Turoverov KK, D’Auria S. (2003) Probing the structure conformational dynamics of the glutamine-binding protein from E. coli by fluorescence spectroscopy and computational analysis of the protein three-dimensional structure. Italian journal of Biochemistry 52(3), 15-48 Varriale A, Scognamiglio V, Scirè A, Staiano M, Tanfani F, Rossi M, D’Auria S. (2003) Thermal stability characterization of a recombinant glutamine-binding protein expressed in E. coli. Italian journal of Biochemistry 52(3), 15-55 Stepanenko OV, Kuznetsova IM, Turoverov KK, Scognamiglio V, Staiano M, D'Auria S. (2003) Conformational change of Glutamine-Binding Protein and its complex with glutamine induced by GdnHCl. A study by intrinsic fluorescence. III Congress of Biophysicists of Russia, Voroneg, Russia D’Auria S, Scognamiglio V, Staiano M, Parracino A, Rossi M. (2003) Innovative Enzyme-Based Biosensors. Italy-Japan Symposium New Trends in Enzyme Scienze and Technology, Naples, Italy D’Auria S, Scirè A, Varriale A, Scognamiglio V, Staiano M, Ausili A, Marabotti A, Rossi M, Bertoli E, Tanfani F. (2004) Structural characterization of Glutamine-binding protein by FT-IR spectroscopy. Italian journal of Biochemistry 53(3), 15-26 Parracino A, Scognamiglio V, Staiano M, Varriale A, Rossi M, D’Auria S, Kuznetsova IM, Stepanenko OV, Turoverov KK. (2004) Glutamine-binding protein from E. coli: location of tryptophan and tyrosine residues, characteristics of their microenvironments, and their contribution to the bulk fluorescence of the protein. Proteine, 2004 Viterbo, Italia D’Auria S, V. Scognamiglio, M. Rossi, M. Staiano, S. Campopiano, N. Cennamo, L. Zeni. (2004). Odor-binding protein as probe for a refractive index-based biosensor: new perspectives in biohazard assessment. Biohazard Detection Optics Conference September 13-17, San Jose, California USA Staiano M, A. Marabotti, V. Scognamiglio, A. Varriale, A. Parracino, G. Aquino, M. De Champdorè, A. Facchiano, M. Rossi, S. D'Auria (2004). A Thermostable Sugar-
Binding Protein from the Archaeon Pyrococcus horikoshii as Probe for the Development of a Stable Fluorescence Biosensor for Diabetic Patients. Extremophiles, September 19-25, Baltimore, MD, USA De Stefano L, Rendina I, Moretti L, Scognamiglio V, Rossi M, D’Auria S. (2004) Detection of L-glutamine in a porous silicon based optical biosensor. IEEE Sensors, Vienna, Austria D’Auria S, Scognamiglio V, Rossi M, Staiano M, Campopiano S, Cennamo N, Zeni L. (2004) Odor-binding protein as probe for a refractive index-based biosensor: new perspectives in biohazard assessment. Biohazard Detection Optics Conference Scognamiglio V. (2005) Glucose Biosensors as Models for the Development of Advanced Protein-Based Biosensors. 8° Congresso Nazionale delle Biotecnologie (CNB8), Siena, Italy Stepanenko OV, Kuznetsova IM, Turoverov KK, Scognamiglio V, Staiano M, D'Auria S. (2005) Conformational change of glutamine-binding protein and its complex with glutamine induced by guanidine hydrochloride. 30th FEBS Congress - 9th IUBMB Conference, Budapest, Hungary De Stefano L, Rendina I, Rossi M, Rotiroti L, Scognamiglio V, D'Auria S. (2005) An optical biosensor for explosives detection based on porous silicon technology. SPIE- Security & Defence Conference, Bruges, Belgium De Stefano L, Rotiroti L, Rendina I, Moretti L, Scognamiglio V, Rossi M, D’Auria S. (2005) Protein-ligand interaction detection by porous silicon optical sensor. Associazione Italiana Sensori e Microsistemi X Conferenza Annuale Firenze, Italy Staiano M, Scognamiglio V, Aurilia V, Parracino A, Varriale A, de Champodorè M, Vitale A, Aquino G, Rossi M, D’Auria S. (2005) Proteins from extremophiles as probes for advanced fluorescence biosensors for analyses of high social interest. International Symposium on Extremophiles and their applications Tokyo, Japan de Champdoré M, Staiano M, Marabotti A, Facchiano A, Varriale A, Scognamiglio V, Aquino G, Cocozza I, Vitale A, Ringhieri P, Iozzino L, Parracino A, Aurilia V, Rossi M, D'Auria S. (2007) Proteins from Thermophiles for the Design of Advanced Fluorescence Biosensors. Glucose sensing as Model. Proceedings of International Symposium on Extremophiles and Their Applications vol. 2005, 302-30 Staiano M, Crescenzo R, Iozzino L, Ringhieri P, Tartaglia M, Parracino A, Varriale A, Scognamiglio V, Kold A, Povorova O, Vitale A, Labella T, Aurilia V, D’Auria S. (2007) Advanced optical biosensors and biochips for analyses in the space environment. ISSBB II congresso Nazionale, Bari, Italy