flutter echoes; templates for dafx-08, finland, france
TRANSCRIPT

Proc. of the 18th Int. Conference on Digital Audio Effects (DAFx-15), Trondheim, Norway, Nov 30 – Dec 3, 2015
DAFX-1
FLUTTER ECHOES; TIMBRE AND POSSIBLE USE AS SOUND EFFECT
TEMPLATES FOR DAFX-08, FINLAND, FRANCE
Tor Halmrast,
1) Statsbygg, Oslo, Norway,
2) University of Oslo, Musicology [email protected]
ABSTRACT
Flutter echoes are usually regarded as a defect we want to avoid by simple treatments like absorbents or angling/tilting of
surfaces. Since the treatments are so simple to understand, flutter has not been investigated much. The physics of flutter echoes is, however, not simple, and flutter sounds quite interesting, so perhaps we can use it intentionally, as a Digital Audio Effect?
Repetitive reflections with Δt [s] between each reflections give a perceived tone with a frequency of fo=1/Δt [Hz] and multiples of this; 2fo, 3fo etc. Such a repetive sound will be perceived as fo, (if higher than some 20 Hz). Often this “Repetition Tonality” is used to explain the “tonal” character of a flutter echo in common (not too big) rooms with two parallel,
reflecting surfaces and all other surfaces almost totally absorbing. However, fo=1/Δt is in the low frequency range (for a distance of 3.43 m, fo=100 Hz, assuming a velocity of sound of 343 m/s), but the perceived, “almost tonal” character of a flutter echo is of mid/high frequency, typically around 2 kHz.
This paper describes several methods of investigating flutter echoes. None of them give answers to all aspects of flutter, but together they show that the resulting mid/high frequency timbre of flutter in common rooms is not really a “tone”, but band pass filtering of the broad banded impulsive signal. This filtering is a
combination of two filtering effects: a Low Frequency Filtering (due to the increasing source distance and diffraction, which gives that the sound field is transferred from spherical to plane waves), and a High Pass Filtering due to air absorption. The sound pressure level of a plane wave is reduced only by air absorption and the absorption at the surfaces, while a spherical wave is reduced by additional 6 dB per doubling of distance. Together these two main filtering effects give the mid/high frequency “almost tonal” character of flutter, which we will call the “Flutter Band Tonality”, as a distinction from the “Repetition Tonality” mentioned above. Depending on the amount of bass in the signal, its duration and especially the position of the sender/receiver with respect to the resonance peaks and nodes of the standing wave pattern of the room resonances between the surfaces (called fres,o etc), the ”Repetition Tonality” (fo. 2fo….) will appear, but for most positions between the reflecting surfaces, the Flutter Band Tonality “tail” in mid/high frequencies will last longer.
In addition, there is also a third tonality that we will call the “Fresnel Diffraction Tonality”. The last part of the paper shows that the combination of these “tonal” effects of the flutter echo
can be simulated in Max/Msp and used as a Digital Audio Effect for speech and music.
1. INTRODUCTION
The tonal effect of repetitive short sound events is well known from acoustic literature and electroacoustic music; in the
Karplus-Strong algorithm and in Stockhausen´s Kontakte [1]
which incorporates a transform from tone to pulse/rhythm when
the repetition rate gradually decreases to below some 20 Hz. In daily life, rhythmic reflections are common when an impulsive
sound is “trapped” between two parallel, reflecting surfaces in a
room with otherwise absorbing surfaces; Flutter Echoes. The
signal must be shorter than, or at least comparable to the time for the sound to travel the path between the reflecting surfaces, for
instance handclaps. (See Appendix regarding coloration of longer
signals).
In Part 2 we look at some measurements of flutter echoes,
the “tail” around 2 kHz and the relationship between the
Repetition Tonality (fo) and the standing wave/room resonances
between the surfaces. We will see that the latter is of importance only for some positions of sender and receiver in a room. In Part
3 we see the transition from a spherical wave to a plane wave,
due to the diffraction from the edges of the surfaces in a
simulation (Odeon). In part 4 we look at a calculation method from the literature, and in Part 5 and 6 we will look into
calculations of diffraction using Fresnel Zones and Edge
Diffraction Toolbox for MatLab, and compare this with the
actual measurements. Each of the methods, by itself, does not give answers to all aspects of flutter, but together they give
interesting view on what is happening.
Part 8 shows that the timbre of flutter can be used as an audio effect. In Appendix we will see that there is also a third tonality that we might call the “Fresnel Zone Tonality”. This is, however, of minor importance in common rooms.
2. MEASUREMENTS OF FLUTTER ECHOES
2.1. Flutter Tonality/“Tail”
A typical measurement of a flutter echo in a foyer with absorbent
ceiling and two reflecting, parallel walls is shown in fig. 1. (Taken from an Impulse Response measurement. For details and
other similar measurements, see Halmrast[2]).

Proc. of the 18th Int. Conference on Digital Audio Effects (DAFx-15), Trondheim, Norway, Nov 30 – Dec 3, 2015
DAFX-2
Figure 1: Decay, Spectrogram (Wavelet) and Waterfall of a
typical flutter echo
We see that the decay ends up in a “tail” around 2 kHz. Halmrast [2] shows several similar examples of such a mid/high frequency
“tail”, almost like a gradual subtractive synthesis. There we also
find that when the surfaces are somewhat absorbing for high
frequencies, this “tail” appears at a somewhat lower frequency. The influence of such a small amount of absorption at the
surfaces of and of the actual geometry will be further discussed
in Part 4.
2.2. Repetition Tonality/Room Resonances//Standing Waves Two parallel surfaces with a distance l [m] give an axial
resonance at fres,o=c/2πl [Hz] and multiples of this; 2fres,o, etc.
This means that the Repetition Pitch (fo) is twice the Resonance
frequency, (like even partials: 2,4,6 etc of the lowest room
resonance). The sound pressure distribution of the corresponding standing waves is shown in the lower part of fig. 2. The upper
part of fig. 2 shows the decay at fo for the measurements with
two parallel surfaces in an anechoic chamber, with constant
sender position and varying receiver position (1, 2 and 3). (For details regarding the measurement, see [2]). We see that the
level and decay highly depends on receiver position; slowest
decay for positions close to pressure maximum, closest to the
wall. Flutter is most commonly perceived when clapping at positions not very close to walls. Also, the result is reciprocal for
sender/receiver, and in practice, both sender and receiver must be
positioned at points of maximum sound pressure levels of 2fres,o
etc. in order for the resonances between the surfaces to be of
importance. Unfortunately we could not measure exactly in the
centre, but generally: Even though 2fres,o etc. represents
“standing waves”, we shall see in Part 7 that the Repetition
Tonality Band “stands” even longer. For signals with little
energy in the bass (handclaps), the impact of room
resonances/standing waves is even smaller.
Figure2: Schroeder curves showing the decay at different
receiver positions between the surfaces Distance between surfaces:1.5m, fo=114 Hz
For bigger rooms, fo (=2 fres,o) will be much lower than the
frequency of most common signals. Repetition Tonality might
appear for 2fo, 3fo etc., but their corresponding room resonances
are generally weaker than for fo.
Figure 3: Reverberation Times of flutter.
Filtered Schroeder Curve
Name: ImpulsresponsParallelleLhoyt075Lmic0281
Measured - Unknown Plotted - 03:27:49, 12Sep 2015
Time [ms]2402302202102001901801701601501401301201101009080706050403020100
uncal. , [dB
]
-120
-122
-124
-126
-128
-130
-132
-134
-136
-138
-140
-142
-144
WinMLS 2008 L7
2 kHz
Receiver positions 1 2 3
1
2
3
Schroeder curve, 1/3 oct. around fo (=2fres,o )
Receiver Pos.1 cfr. fig2
Pos.2 cfr fig.2
Foyer
Anechoic chamber

Proc. of the 18th Int. Conference on Digital Audio Effects (DAFx-15), Trondheim, Norway, Nov 30 – Dec 3, 2015
DAFX-3
The T30 curves fig. 3 are in the standard 1/3 octave. We see the
characteristic peak at mid/high frequencies, but, compared to the
spectrograms and waterfall curves (1/12 octave), the peak is not
shown to be as sharp in T30. In fig.3, lower pane, it is interesting to notice that the reverberation time for the 1/3 oct. around fo
changes with receiver position, which confirms the findings in
fig. 2.
The set up in the anechoic chamber (see [2] and [3]) allowed for additional measurements of reverberation times (T30) for
different angles between the two surfaces. In fig. 4 we see that,
for constant sender/receiver positions, just a small angling of the
surface give reduction in the flutter, and that the lower frequencies (fo, 2fo) are not influenced by such small angles,
because the changes in geometry due to the angling are much
smaller than the actual wavelength.
Figure 4: Rev. time in anechoic chamber.
Reduction of flutter for increasing
angle between the surfaces[3]
Figure 5: Decay of sound between two surfaces.
Fig. 5 shows that for the measurement in the anechoic room, the
mid/high frequencies (2kHz) have a linear decay (which indicates a plane wave), but for the octave around fo (125 Hz)
we see the decay of a spherical wave. We need to look further
into aspects of spherical and plane waves.
3. ROOM ACOUSTICS MODEL
Spherical to plane waves A very simple Odeon [4] room acoustics model with two parallel, reflecting surfaces was prepared (with all other surfaces totally absorbing). Figure 6 shows the radiation from a point source (spherical wave). The dimensions are as for the measurement in section 2.2. The sender is positioned almost on the centre line between the surfaces, and closer to the bottom of the surfaces, giving the possibility to inspect the situation both for a small surface (in the upper part of each figure) and a bigger surface (in the lower part of each figure).
8ms 13ms 20ms 40ms 46ms
52ms 60ms 66ms 75ms 85ms 95 ms
105ms 112ms 116ms 125ms 135 ms 145ms
Figure 6: Snapshots of flutter
between two surfaces (Odeon simulation)
We see that the propagation changes from a spherical to almost a
plane wave after just a few reflections. It is interesting to notice
that from 9th reflections and onwards to maximum for the Odeon
program, we lose almost no “particles” (as they are called in Odeon) in this simulation. In general, the sound pressure level of
a spherical wave is reduced by 6 dB pr. doubling of distance,
while a plane wave is affected only by air absorption
(and possibly of absorption at the surfaces). The reason for the transformation from spherical to plane waves is that the distance from the mirror source to the corresponding reflecting surfaces
grow very fast. If we call the distance from source to surface a1,
and surface to receiver a2 it is visualised in [1] that a2 will remain constant, but a1 will grow very quickly as the mirror source
moves further and further away from the reflecting surface for
each “flutter-reflection”. For the nth reflection a1,n= (2n-1)a1,0.
The transition from spherical to plane is frequency dependent, as shown in fig.5. More studies on the transformation from
spherical to plane waves are shown in [2].
4. INFLUENCE ON DIMENSIONS AND ABSORPTION.
KUHL´S EQUATION Flutter was investigated by Maa [5], Krait et al. [6] and Kuhl [7]. Both [6] and [7] states that for a plane wave between two surfaces of S [m2] with distance l [m], the wave is dampened only by the absorption coefficients α (in general frequency dependent, but for simplicity kept frequency independent and equal for both surfaces), and the air absorption, m (frequency dependent). Halmrast [2] includes the background for Kuhl´s
125Hz (1/1 oct.)
2kHz (1/1 oct.)
-5
-30
-60
500 1000 [ms]]
8dB
0 0

Proc. of the 18th Int. Conference on Digital Audio Effects (DAFx-15), Trondheim, Norway, Nov 30 – Dec 3, 2015
DAFX-4
equations. The frequency content of flutter can be looked upon as the combined effect of three reverberation “asymptotes” for the reverberation time versus frequency, f: (c=velocity of sound). 1. Low Frequency damping due to finite surface areas:
(1) 2. Damping due to absorption on the surfaces:
(2)
3. Damping in the air (dissipation):
(3)
The total reverberation time TFL can be written as:
(4)
Fig. 7 shows how these three “asymptotes” work together to give
the total maximum reverberation for a mid/high frequency band, and how the different parameters influence on the position of the “peak” and, to a certain degree, how narrow this “tail” will be, (the “Q-factor” of the total combined filter).
Figure 7: Illustration of Kuhl´s equation, showing
how the different parameters influence the reverberation time of
flutter echoes
For the understanding of flutter, T1 and T3 are the most
important, and, for simplicity, the absorption coefficient α is set
frequency independent and equal for both surfaces. Compared to the measurements in 2.1 (and several measurements in [2]), fig. 7
shows that Kuhl [7] gives a good explanation of what is
happening, and we can see how the “tonal” characteristic of the
flutter changes with different geometry and minor changes in surface absorption, but the method uses reverberation time only
as a parameter, the equation for the effect of non-infinite surfaces
is empirical, and the results do not give as sharp “tail”/Flutter
Band Tonality as measured in actual rooms.
5. CALCULATING DIFFRACTION
5.1 Approximation of Fresnel/Kirchhoff
The behaviour of a physical reflector lies somewhere in between
two extremes: Low frequency sound is not affected by a small
surface (smaller than the wavelength), and if the reflector is really large, it reflects (almost) all frequencies. Between these
extremes, diffraction from the edges influences the frequency
response. Before we go into Fresnel Zones more in detail in the
next section, we will look at an approximation of edge diffraction
for two parallel surfaces. We will start with just one single
surface. Fig. 8 shows a typical situation for the diffraction from
the edge.
Figure 8: Mirror source and Diffraction from the edge of a finite
surface.)
Rindel [8] has developed an approximation of Fresnel/Kirchhoff.
(See also [2]). The method was developed for a single reflection
and for situations where Source-Surface distance and Surface-Receiver distance are about the same size. For our investigation
of flutter, we will disregard these assumptions, and investigate if
this method (described in [8] and [2]) gives reasonable results
also for repetitive reflections when Source-Surface distance quickly grows much longer as the mirror source moves longer
and longer away from the reflecting surface(s) (and the wave is
transformed from a spherical wave to plane wave). A typical
result from such a calculation for the same small dimensions as in section 2.3 is presented in fig. 9, showing the gradual
reduction in the bass as a function of the number of flutter
reflections.
Figure 9: Attenuation [dB] versus frequency for
increasing number of flutter reflections.
Fresnel/Kirchhoff approximation. (small surfaces)
We see that this Fresnel/Kirchhoff approximation shows
reasonably good agreement with the measurements for this small
surface (typical dimension 1.5m). Similar tests for bigger surfaces however, give that this method does not show the large
high pass filtering measured.
5.2 Fresnel zones
The peaks and dips in the frequency response due to diffraction
can be investigated by looking at the Fresnel zones (see Halmrast
[2]), which are shown as circles in fig. 10, left. In rooms with flutter echoes, the surface is often a rectangle, not a circular
plate. Then we need to plot the rectangle and the Fresnel Zones
for the given source/receiver positions and a given frequency (see fig. 10, left), and see which zone “most of edges” will fall into, in
order to find if the edge diffraction will be in-phase or out-of-
phase. Fig. 10 (right) shows a typical frequency response due to
diffraction from the edges of a single, non-infinite surface.
TFL [s]
log. scale
Freq. [Hz] log scale
Number of
Reflections (Time)
16 32 63 125 250 500 1k 2k
[Hz]
Proc. of the 18th Int. Conference on Digital Audio Effects (DAFx-15), Trondheim, Norway, Nov 30 – Dec 3, 2015
DAFX-5
Figure 10: Fresnel zones and their influence on
frequency response [2]
In [2] it is shown that for repetitive flutter echoes, the gradually
increasing (mirror)source distance gives that the Fresnel radius
gradually increases for each flutter repetition, but only up to some 10-12 reflections, as shown in fig. 11. After that, the
Fresnel radii are almost constant. This is another way of showing
how fast the wave is transformed from spherical to plane. In
addition, the Fresnel zones actually give a “Fresnel tonality” of minor importance which is described in Appendix.
Figure 11: Fresnel zones radii after repetitive flutter reflections
6. CALCULATING DIFFRACTION
Flutter was investigated [3] using the EDB (Edge Diffraction
toolBox) from Peter Svensson [11]. One typical comparison of
measured and simulated impulse responses is shown in fig. 12. (Surfaces 1.5m x 1.5m). We see the edge diffraction (black
circle).
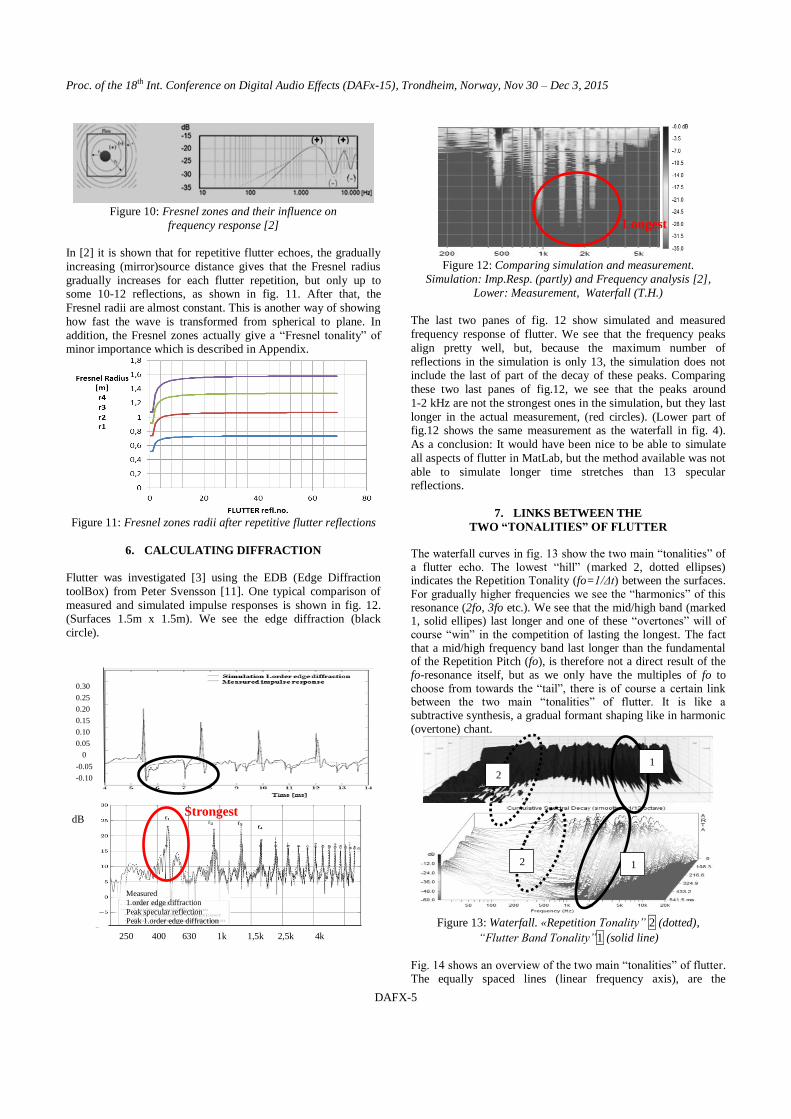
Figure 12: Comparing simulation and measurement.
Simulation: Imp.Resp. (partly) and Frequency analysis [2],
Lower: Measurement, Waterfall (T.H.)
The last two panes of fig. 12 show simulated and measured
frequency response of flutter. We see that the frequency peaks
align pretty well, but, because the maximum number of
reflections in the simulation is only 13, the simulation does not include the last of part of the decay of these peaks. Comparing
these two last panes of fig.12, we see that the peaks around
1-2 kHz are not the strongest ones in the simulation, but they last
longer in the actual measurement, (red circles). (Lower part of fig.12 shows the same measurement as the waterfall in fig. 4).
As a conclusion: It would have been nice to be able to simulate
all aspects of flutter in MatLab, but the method available was not
able to simulate longer time stretches than 13 specular reflections.
7. LINKS BETWEEN THE
TWO “TONALITIES” OF FLUTTER The waterfall curves in fig. 13 show the two main “tonalities” of a flutter echo. The lowest “hill” (marked 2, dotted ellipses) indicates the Repetition Tonality (fo=1/Δt) between the surfaces. For gradually higher frequencies we see the “harmonics” of this resonance (2fo, 3fo etc.). We see that the mid/high band (marked 1, solid ellipes) last longer and one of these “overtones” will of course “win” in the competition of lasting the longest. The fact that a mid/high frequency band last longer than the fundamental of the Repetition Pitch (fo), is therefore not a direct result of the fo-resonance itself, but as we only have the multiples of fo to choose from towards the “tail”, there is of course a certain link between the two main “tonalities” of flutter. It is like a subtractive synthesis, a gradual formant shaping like in harmonic (overtone) chant.
Figure 13: Waterfall. «Repetition Tonality” 2 (dotted),
“Flutter Band Tonality”1 (solid line)
Fig. 14 shows an overview of the two main “tonalities” of flutter. The equally spaced lines (linear frequency axis), are the
Measured 1.order edge diffraction
Peak specular reflection Peak 1.order edge diffraction
250 400 630 1k 1,5k 2,5k 4k
6,3kHz Hz
0.30
0.25
0.20
0.15
0.10
0.05
0
-0.05
-0.10
dB
1 2
2
1
Strongest
Longest

Proc. of the 18th Int. Conference on Digital Audio Effects (DAFx-15), Trondheim, Norway, Nov 30 – Dec 3, 2015
DAFX-6
“overtones” of the “Repetition Tonality” fo (marked 2). The overall filtering giving the mid/high frequency “tail” is the “Flutter-Band-Tonality”(marked 1) as a result of the High Pass Filter due to non-infinite surfaces and increasing distance between mirror source and surface for each flutter reflection, and the Low Pass filtering due to air absorption. The Flutter Band Filtering is perceived easily for all positions, but the impact of
the Repetition Tonality is highly dependent on positions of sender and receiver.
Figure 14: The two main “tonalities” of flutter.
Measurement and schematic overview The Appendix includes additional remarks on possible comb filter coloration due to flutter for longer signals, and a third tonality that we have called “Fresnel Zone Tonality”. Both these effects are of minor importance on the overall timbre, compared to the two main “tonalities” of flutter shown in fig.14.
8. FLUTTER AS AN AUDIO EFFECT Simplifications of the equations shown in this paper were put into a simple Max/Msp patch. To check this patch, a Dirac pulse was used as signal and the result in fig. 15 shows good agreement with the measurements shown in the earlier chapters.
Figure 15: Dirac pulse sent through Max/Msp patch. Impulse Response, Reverberation Time
Wavelet Spectrogram and Waterfall
Different musical signals were sent into the patch and the flutter-effect sounds somewhat “alien” or like being inside a (big, light weight) metal cylinder. For musical purposes, one could of course just convolve a signal with a recorded impulse response of a nice flutter, but the patch allows changing the parameters (moving the surfaces closer and farther away, changing the size of the surfaces and their absorption coefficients, as well as the
positions of sender/receiver). For short percussive sounds and fast speech, “normal settings” in the Flutter-Patch give a rattling sound ending up around 2 kHz. For longer signals with a certain amount of bass, changing the distance between the surfaces allows a sort of “formant-resonance” change (also glissando) in the “bass”, while keeping the main part of the decay almost constant as a “tail” at app. 2 kHz. Such a glissando might seem un-natural, but it is actually found in in real life in the bird- or snake-like sound heard when clapping in front of high stairs like the Chichen Itza pyramid in Mexico, where the steps of the stair are so high that the effective length between each reflection is
gradually increasing, giving gradually longer time between each reflection. Such a glissando appears only for the “Repetition Tonality” of the flutter. The “Flutter-Band Tonality” of the patch will, as shown in this paper, remain (almost) constant when changing “distance between surfaces”. In the patch the “Repetition Tonality” can be shifted (un-naturally) all the way up to match the “Flutter Band Tonality” (around some 2 kHz) (and of course even further), giving a transition between the two main “tonalities” of the flutter. An extended version of the Flutter-patch includes sending the reflections successively to Left/Right (as for the physical situation when standing between two walls), and changing the distance between the ears for binaural listening as well as the distance between source and receiver. The patch can of course easily be expanded to any number of distinct loudspeakers. Some “musical” tests of the Flutter-patch with different music/speech as signal can be downloaded from: www.tor.halmrast.no
9. CONCLUSIONS It is shown that the main “almost tonal” character of a flutter echo is not a (direct) result of the time between the reflections, but a result of two main filtering effects: The low frequencies are gradually reduced because the surfaces are finite, so that the fast growing distance from mirror source to reflecting surface gives a transformation from spherical waves to plane waves, and diffraction from the edges. The (very) high frequencies are reduced due to air absorption. It is shown that flutter actually has three “tonalities”, but the combined filtering effect above is the most important. Flutter can be used as a digital effect (in a Max/Msp patch). By changing the “geometry” in the simulation, one can gradually change the amount of filtering. The effect is different from
ordinary delay/comb filters because the “tonality” is not (directly) dependent on the repetition rate, but will “always” end up in a mid/high frequency range, often around app. 2 kHz, assuming rigid, almost totally reflecting surfaces.
10. ACKNOWLEDGMENTS Thanks to Harald Skjong (now at Norconsult, Sandvika, Norway) for permission to use parts of his M.Sc. Thesis [3].
0.4 0.8 1.2 1,6 s Time 63 125 250 500 1k 2k 4k 8k [Hz]
←T
ime
Frequency → 50 100 200 500 1k 2k 5k 10k [Hz]
1
2

Proc. of the 18th Int. Conference on Digital Audio Effects (DAFx-15), Trondheim, Norway, Nov 30 – Dec 3, 2015
DAFX-7
11. REFERENCES
[1] K. Stockhausen: Kontakte 1958-60. http://en.wikipedia.org/wiki/Kontakte_(Stockhausen)
[2] T. Halmrast: “Why do flutter echoes ´always´ end up at 1-2 kHz?” Proceeding of the Institute of Acoustics Vol. 37 Pt.3 2015. Available also from www.tor.halmrast.no
[3] H. Skjong: Master Thesis, NTNU, Trondheim, Norway, 2015 (in Norwegian)
[4] Odeon Room Acoustics Software. http://www.odeon.dk/ [5] D. Y. Maa: “The flutter echoes”. J. Acoust. Soc. Amer.
13 [1941], 170 [6] E. Krauth, R. Bücklein: “Modelluntersuchungen an Flatter-
echos” Frequenz. Zeitschrift für Schwingungs- und
Schwachstromtechnik, Band 18 Aug. 1964. Nr. 8. pp. 247-252.
[7] W. Kuhl: “Nachhallzeiten schwach gedampfter
geschlossener Wellenzüge“, Acustica, Vol. 55 1984, pp. 187-192
[8] J.H. Rindel: “Attenuation of sound reflections due to
diffraction”, Nordic Acoustical Meeting, Aalborg, Denmark Aug. 1986, pp. 257-260
[9] C.S. Clay et al.: “Specular reflections of transient pressures
from finite width plane faces”, Journ. of the Acoustical Society of America, 94(1993) Oct. No.4
[10] M. Kleiner: Electroacoustics CRC Press, Taylor & Francis.
2013, p 83. [11] P. Svensson: “Edge diffraction Matlab toolbox.”
http://www.iet.ntnu.no/~svensson/software/,2013
[12] T. Halmrast: “Orchestral Timbre; Combfilter-Coloration from Reflections”. Journal of Sound and Vibration 2000(1)352
[13] T. Halmrast: “Musical Timbre; Combfilter-Coloration from reflections”, Proceedings of the 2nd COST G-6 Workshop on Digital Audio Effects (DAFx-99), 1999,Trondheim,
Norway
APPENDIX COMB FILTER COLOURATION AND A THIRD TONALITY OF FLUTTER
Coloration One or more repetitive reflections might give some kind of comb filtering; see [12] and [13]. The “tail” of the “Repetition Tonality” for flutter echoes will give a “Box-Klangfarbe” (a Comb-Between-Teeth-Bandwidth in the order of Critical Bandwidth) for most typical rooms in dwellings, for as long part of the decay as the Flutter Tonality pass band of the “tail” is broad enough to include sufficient amount of dips and peaks in the comb. For the last part of the flutter echo, the “tail” will include too so few dips and peaks that the subtractive synthesis has reached almost a pure tone, (a comb with just one or very few teeth).
Flutter Zone Tonality
A third tonality of flutter might be called the Fresnel-Zone-Tonality. This is not as easily perceived as the two main tonalities, and is highly dependent on geometry. The reflections from the edges of the surfaces form an additional rhythmic pattern which gives small extra lines in the specter. The difference in frequency between each of these lines is a function of the typical dimension of the surface (the closest Fresnel radius).
Figure App.1: Zoom in on start (13reflections) of flutter.
Glissando due to changes in Fresnel Radii
in the first part of the decay
As shown in fig. 11, the Fresnel radii increase for flutter reflections up to some 10-12. This gives that the Fresnel Zone Tonality shows small glissandi downwards for these first 10-12 flutter reflections, as the radius of the Fresnel zones increases (see fig.App.1). Fig. App.2 shows measurement showing this “Fresnel tonality” of flutter in the upper part of the figure, and in
the lower part it is included in the schematic overview from fig. 14.
Figure App.2: Fresnel “tonality”
included in the overview from fig. 14
Glissando
down