fmolhs - healthcare financial management association · fmolhs overview the system’s service area...
TRANSCRIPT

1
FMOLHS HFMA Capital Conference
April 2014
FMOLHS Profile
2
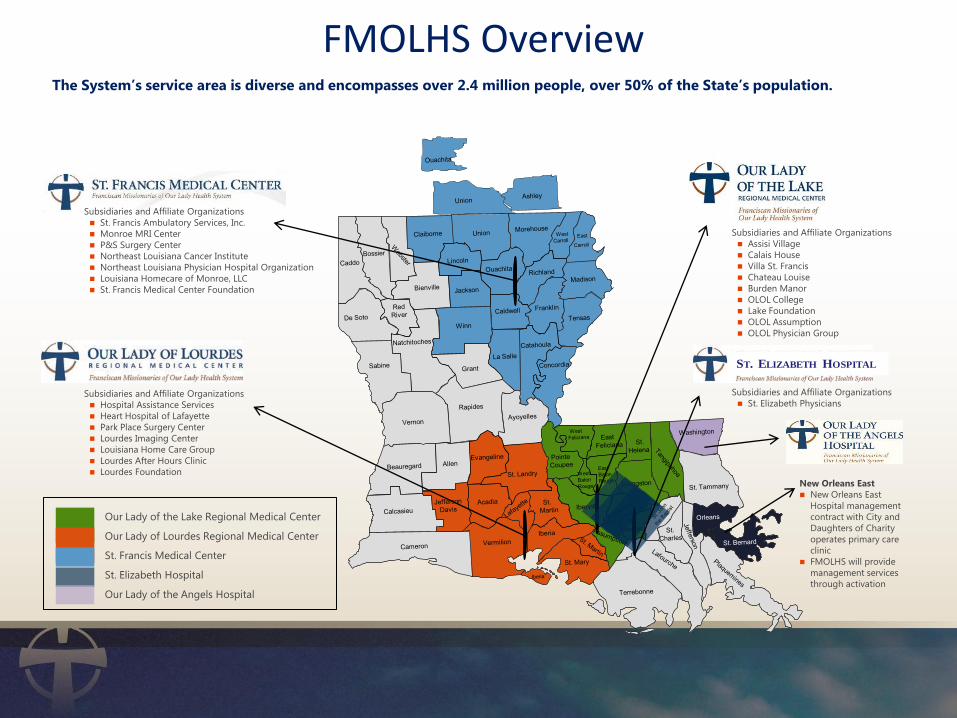
FMOLHS Overview The System’s service area is diverse and encompasses over 2.4 million people, over 50% of the State’s population.
Subsidiaries and Affiliate Organizations
St. Francis Ambulatory Services, Inc.
Monroe MRI Center
P&S Surgery Center
Northeast Louisiana Cancer Institute
Northeast Louisiana Physician Hospital Organization
Louisiana Homecare of Monroe, LLC
St. Francis Medical Center Foundation
ST. ELIZABETH HOSPITAL
Our Lady of the Lake Regional Medical Center
Our Lady of Lourdes Regional Medical Center
St. Francis Medical Center
St. Elizabeth Hospital
Our Lady of the Angels Hospital
Subsidiaries and Affiliate Organizations
Assisi Village
Calais House
Villa St. Francis
Chateau Louise
Burden Manor
OLOL College
Lake Foundation
OLOL Assumption
OLOL Physician Group
Subsidiaries and Affiliate Organizations
Hospital Assistance Services
Heart Hospital of Lafayette
Park Place Surgery Center
Lourdes Imaging Center
Louisiana Home Care Group
Lourdes After Hours Clinic
Lourdes Foundation
Subsidiaries and Affiliate Organizations
St. Elizabeth Physicians
New Orleans East
New Orleans East
Hospital management
contract with City and
Daughters of Charity
operates primary care
clinic
FMOLHS will provide
management services
through activation
Our Lady of Angels
Hospital (Bogalusa)

FMOLHS Profile
• 8 Hospitals in Louisiana • >1700 acute care beds: • >67,000 annual admissions • >573,000 outpatient visits • >11,000 team members • >2000 medical staff members • >200 employed physicians
• >20 Physician Joint Ventures • Senior Services Division • Population Health Management Company • College • >1.6 Billion Annual Net Revenue • GME Relationship with LSU
• 160 GME caps/year

Mission, Vision, Values
5

6
Vision Statement To make a significant difference in our communities through Catholic health services.
Mission Statement
Inspired by the vision of St. Francis and in the tradition of the Roman Catholic Church, we extend the healing ministry of Jesus Christ to God's people, especially those most in need.
We call forth all who serve in this healthcare ministry to share their gifts and talents to create
a spirit of healing - with reverence and love for all of life, with joyfulness of spirit, and with humility and justice for all those entrusted to our care.
We are, with God's help, a healing and spiritual presence for each other and for the
communities we are privileged to serve.
Core Values Service
Reverence and love for all of life Joyfulness of Spirit
Humility Justice
Franciscan Missionaries of Our Lady Health System Vision – Mission – Core Values

Strategies
7

OUR ASPIRING VISION
By 2016, Franciscan Missionaries of Our Lady Health System, a Catholic Healthcare Ministry, will provide clinically integrated, market-based care through its sponsored organizations to effectively and efficiently manage the health of specific populations, especially those most in need. Through its Team Members and culture of excellence the Health System will provide distinctive value for all constituents.
Sustainable financial performance ensures the long-term viability of our sponsored organizations and the System as a whole.
8

PREPARING FOR 2016 AND BEYOND: FOUR STRATEGIES
1. Lead and grow care for the elderly by testing and developing
new, innovative geriatric models and processes across a broad
spectrum of services
2. Transform current healthcare delivery into more innovative and
integrated systems of care
3. Distinguish ourselves through superior performance. We seek
excellence in our care of those most in need, clinical quality,
physician satisfaction, patient satisfaction, and team member
engagement
4. Manage and sustain a healthy financial profile
9 Adopted May, 2011
Senior Care Strategy
• Program for All Inclusive Care for the Elderly (PACE)
– Offers adult day health care services, primary care, supportive services for the elderly and currently consists of 130 enrollees
• Senior Companion Program
– 50 low income volunteers assisting others in their homes and FMOL Health System facilities
• Services for Seniors
– Expansion of Program for All Inclusive Care for the Elderly (PACE) across our markets
– Growing primary care geriatric providers
– Establishment of Palliative Care Services at each of our markets
• Nursing Homes
• HUD Housing for elderly

Redesign
11

HEALTH CARE BUSINESS MODEL
Population
Insurers
Providers/ Physicians
Institution Ambulatory Home
12

Population Health Management Experience • Healthy LivesTM
– Implemented in November 2010 for FMOLHS employees and insured members in the 2011 benefits year
• 80% participation rate
• $21 million in savings over two years with quality measures that exceed national benchmarks
• 1 in 30 companies in the US recognized as Best Employers for Healthy Lifestyles from the National Business Group on Health in 2012 and 2013
• Fourth consecutive year with no premium increase for members (2014)
– Population management consulting services in partnership with 38 clients in 9states
• Approximately 100,000 lives
• Consulting, implementation and program infrastructure
• Clinical integration and patient-centered medical home programs
• Program for All Inclusive Care for the Elderly (PACE)

Franciscan Clinical Network
Includes all provider types (MDs, Institutional, Ambulatory, Home Care) Through various relationships (affiliated, employed, joint ventures, contracted,
owned) To assure predictable quality and cost at levels which demonstrate the network as
“best performer” A centralized resource to support and coordinate local networks, Using services of Franciscan Health and Wellness Services to manage population
health and data When operational –
o establish criteria for participation, o identify necessary services to be included, o determine terms of relationship, o establish performance expectations and incentives, o monitor results.

Unified Medical Group
Provide physician leadership of clinical performance standards within Clinical
Network,
Design physician incentives to reward clinical improvement,
Standardize practice administrative functions,
Identify opportunities to share administrative systems with independent MDs,
Lead growth strategy into new markets.

Performance
16

FMOLHS Metrics
17
Appropriate Care Measures Inpatient Satisfaction
Risk Adjusted Complication Index Risk Adjusted Mortality Index Risk Adjusted Readmission Index
Team Member Commitment

FMOLHS Performance
18
WE STRIVE TO DO WELL BECAUSE OF WHO WE ARE, AND RECOGNITIONS ARE CONFIRMATION –
to mention a few:
• US News and World Report
• Blue Cross Blue Shield Centers of Distinction
• Louisiana Quality Foundation Performance Excellence
• Magnet designation
• Nurses Improving Care for Health System Elders (NICHE)
• The Joint Commission
• Press Ganey
• Morehead Associates
• Modern Healthcare

1 Does not include potential impact in areas we did not assess or additional potential upside from growth opportunities
Organizational Review/Healthy 2016
Steering committee identified 52 opportunities with projected impact of >$165M1 in today’s dollars
$31M
Materials Management
10 opportunities
$17M Shared Services
12 opportunities
$19M
$10M Clinical Cost Variation
3 opportunities
Strategic Growth
15 opportunities
$37M
Revenue Cycle
6 opportunities
$53M
Labor Productivity/
Operations
6 opportunities
52
opportunities
>$165M
opportunity
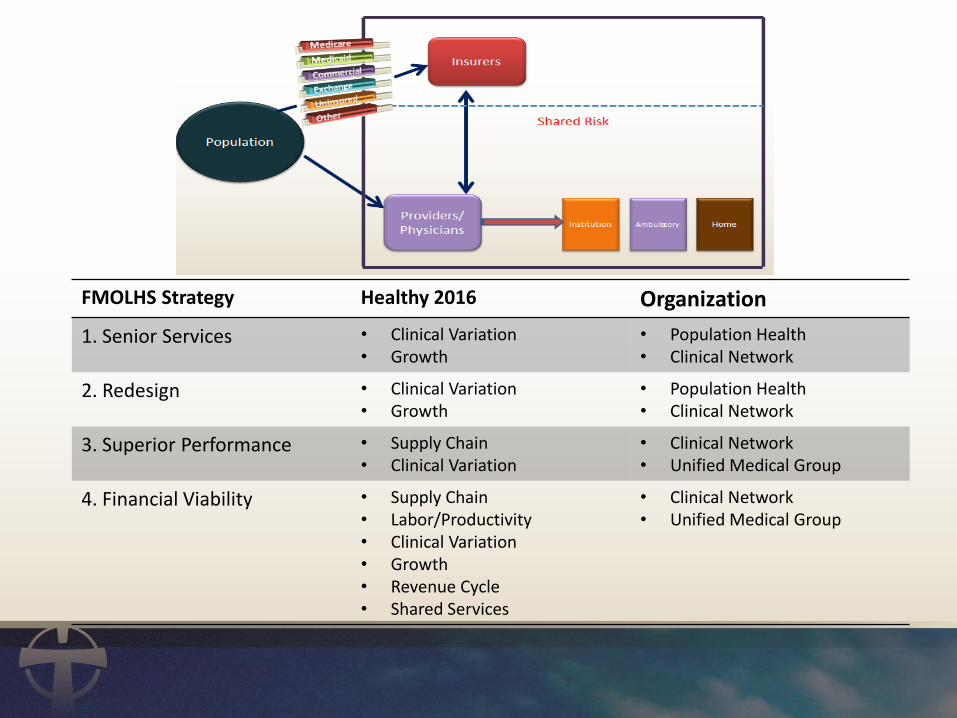
FMOLHS Strategy Healthy 2016 Organization
1. Senior Services • Clinical Variation • Growth
• Population Health • Clinical Network
2. Redesign • Clinical Variation • Growth
• Population Health • Clinical Network
3. Superior Performance • Supply Chain • Clinical Variation
• Clinical Network • Unified Medical Group
4. Financial Viability • Supply Chain • Labor/Productivity • Clinical Variation • Growth • Revenue Cycle • Shared Services
• Clinical Network • Unified Medical Group

2017
2016
2014-2015
Quality
•NHIQM (Enhanced Adoption)
•eQuality Check
•MU Stage II
•Quality outcomes and e-Submission
•ICD-10
•Decision alerting adoption
•DQR (Doc Quality Review)
•Readmission prevention
•Disease Regsistries
•Case Management Modules
Transformational Customer Experience
•eSignature
•MVCC/Multi Patient Priority View
•Patient Image Capture (Wound care, Photo’s on Demog bar, etc.)
•Biometric Pt. ID/Pt. Secure
•Patient Portal
•eHealth
•ePrescribing (Narcotics)
Care Integration and Efficiency
•Closed Loop Medication administration
•Device Integration – IV pumps, patient monitors
•Bed Integration
•Vitals Link
•Rhythm Strip Integration
•CVIS (Lumedx)
•Infusion Management
•Nursing Mobility
•Sky Vue
•Provider Documentation
Quality
•Quality Modules
•Population Health Management
Transformational Customer Experience
•Interactive TV (My Chart)
•eHealth
Care Integration and Efficiency
•iAware/Apache Outcomes Integration
•Device integration – Vitals Link, Beds, IV pumps
•Infusion Management
•Nursing Mobility
•Provider Documentation
FMOLHS
Clinical
Strategic
Cascade (Version 2013)
Quality
•Quality Modules
•Population Health Management
Transformational Customer Experience
•Room Link (Investigation)
•eHealth
Care Integration and Efficiency
•Device Integration – IV pumps
•Nursing Mobility
•MD Mobility
•Enhanced Care Environment

Information Technology Strategy • System-wide Electronic Health Record (EHR)
– Cerner Inpatient Integrated Health Record – Epic Ambulatory Health Record - Formed a shared services organization with
three physician groups and implemented Epic ambulatory software suite of products (300 physicians)
• FMOLHS eHealth Strategy – under development – Caring for patients through virtual visits focusing initially on TelePsych,
TeleStroke, and Mobile Virtual Critical Care programs – Engaging consumers through Patient Health Portals to improve overall health
and the patient experience – Connecting electronically through HIE’s to coordinate care
• Meaningful Use Status and Plan – Successful submission for Stage 1 in 3 consecutive years – Planned submission for Stage 2 in October 2014

Financial Performance
23

BlueCross/
BlueShield
16.4%Commercial
2.1%Managed Care
15.4%
Medicare
44.3%
Medicaid
14.3%Self Pay
7.5%
BlueCross/
BlueShield
25.2%Commercial
4.2%
Managed Care
19.1%
Medicare
32.1%
Medicaid
7.2%Self Pay
12.2%
Consolidated: Payor Mix
Payer Mix (Net Revenue – June 30, 2013) Payer Mix (Gross Revenue – June 30, 2013)
48.5% Managed Care and Commercial Payers
39.3%
Government
Payers
33.9% Managed Care and Commercial Payers
58.6%
Government
Payers

FMOLHS Financial Profile
($000s) 2009 2010 2011 2012 2013 Budget 2014
Days Cash on Hand 214.1 233.8 288.8 260.7 235.5 220.0
Operating Income Margin
0.0% 2.9% 1.4% 3.0% 1.6% 1.7%
Operating EBIDA Margin 9.4% 9.4%
MADS Coverage 2.5x 2.8x 2.1x 2.7x 2.6x 3.1x
Debt to Capitalization 38.2% 39.7% 32.3% 33.8% 34.2% 33.5%
Cash-to-Debt 125.9% 125.2% 160.7% 154.7% 133.1% 143.2%
Capital Expenditure Ratio 202.7%
25
Notes: 1. Fiscal Year End June 30 2. FY 2011 does not include payment from Department of Health & Hospitals of $129 million

FMOLHS Financial Profile
($000s) 2009 2010 2011 2012 2013 Budget 2014
Operating Revenue $1,130,527 $1,205,214 $1,228,441 $1,300,924 $1,415,654 $1,587,200
Operating Cash Flow $88,798 $132,394 $107,725 $144,109 $131,879 $145,065
Operating Income $68 $35,200 $17,305 $38,419 $21,960 $27,763
Excess Margin (19.2%) 8.3% 9.6% 2.0% 5.4% 4.3%
Cash & Unrestricted Investments
$620,975 $700,453 $904,096 $842,770 $844,814 $886,517
Debt $493,044 $559,359 $562,436 $544,690 $634,940 $618,911
Debt –to-Operating Cash Flow
5.6x 4.2x 5.2x 3.8x 4.8x 4.3x
26
Notes: 1. Fiscal Year End June 30 2. FY 2011 does not include payment from Department of Health & Hospitals of $129 million

FMOLHS Financial and Capital Projections (in Millions)
27
Budget FY14 Projected FY 15 Projected FY 16
Net Patient Service Revenue
$1,471.8 $1,504.6 $1,579.8
Operating Income $32.6 $69.9 $57.8
Operating EBIDA $149.9 $180.7 $191.1
Cash Flow $181.9 $192.7 $200.6
Unrestricted Cash $840.0 $866.3 $962.4
Total Debt $618.9 $600.1 $707.6
Capital Expenditure $177.5 $171.7 $219.1

Joint Venture/Partnership Financial Results
28
Joint Venture Financial Summary
Revenues Expenses Net Income FMOLHS Share of
Net Income
Fiscal Year 2013 $ 205,815,823.00 $ 178,381,866.00 $ 27,433,957.00 $ 12,449,487.80
Fiscal Year 2014 (through 12/31/13)
$ 114,932,307.00 $ 95,220,388.00 $ 19,711,919.00 $ 9,004,753.96
Outstanding Debt Total
Average Life
Average Coupon
Fixed Variable Synthetic Fixed
$597,081,000 17.1 4.92% $428,281,000 $49,700,000 $119,100,000
FMOLHS Debt Profile

Questions/Comments?
29