fmri group analysis - fslfsl.fmrib.ox.ac.uk/fslcourse/lectures/feat2_part1.pdffmri group analysis...
TRANSCRIPT
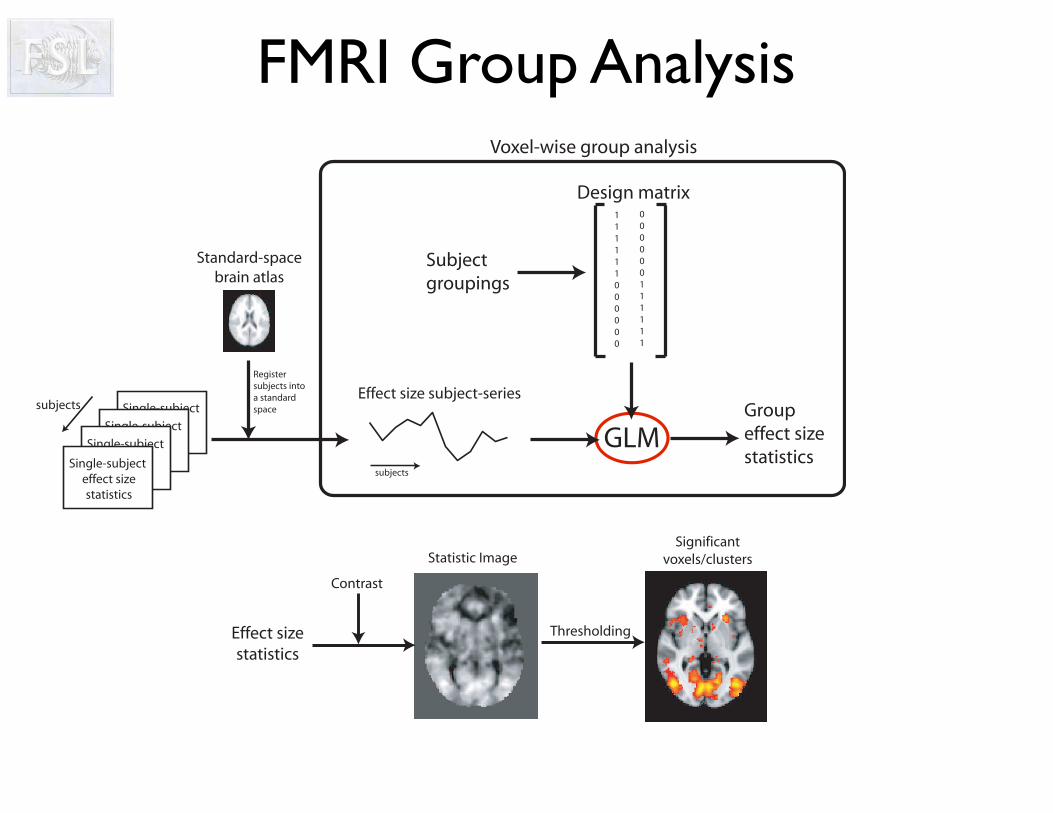
FMRI Group Analysis
GLM
Design matrix
Effect size subject-series
Voxel-wise group analysis
Groupeffect sizestatistics
Subjectgroupings
111111000000
000000111111
Standard-spacebrain atlas
subjects
Single-subject effect sizestatistics
Single-subject effect sizestatistics
Single-subject effect sizestatistics
Single-subject effect sizestatistics
subjects
Registersubjects intoa standardspace
Effect sizestatistics
Statistic ImageSignificant
voxels/clusters
Contrast
Thresholding
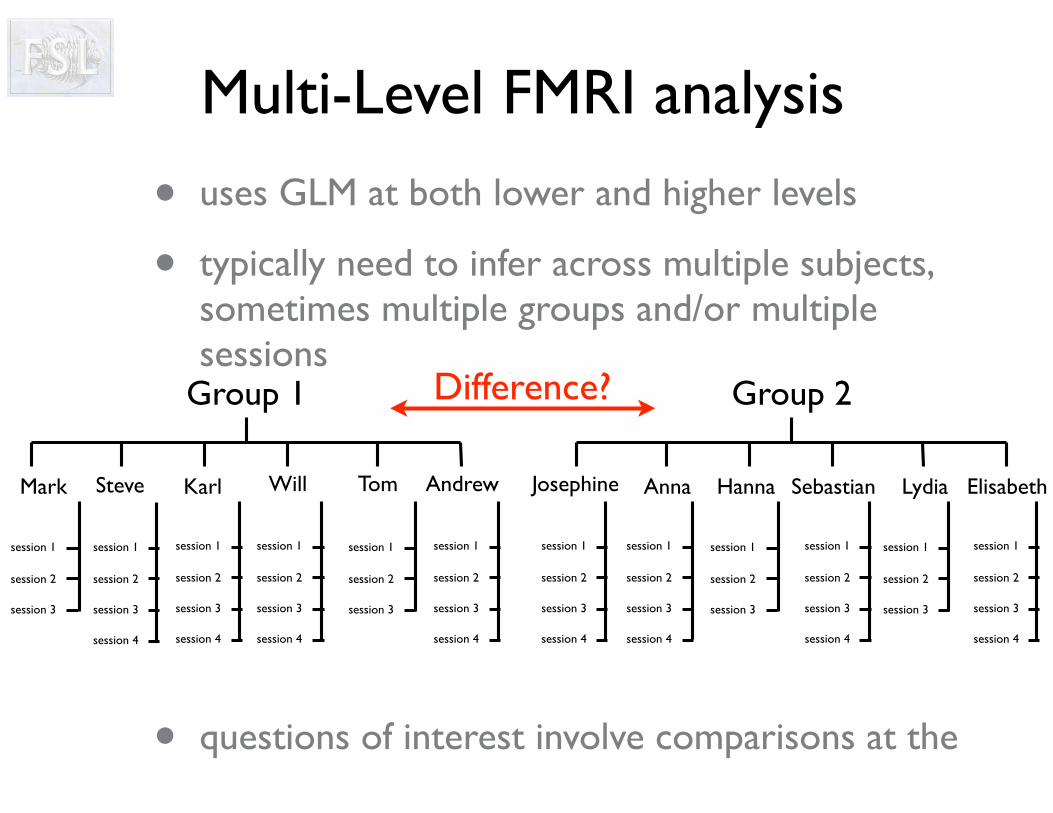
• uses GLM at both lower and higher levels
• typically need to infer across multiple subjects, sometimes multiple groups and/or multiple sessions
• questions of interest involve comparisons at the
Multi-Level FMRI analysis
Group 2
HannaJosephine Anna Sebastian Lydia Elisabeth
Group 1
Mark Steve Karl Will Tom Andrew
session 1
session 2
session 3
session 4
session 1
session 2
session 3
session 1
session 2
session 3
session 4
session 1
session 2
session 3
session 1
session 2
session 3
session 4
session 1
session 2
session 3
session 4
session 1
session 2
session 3
session 4
session 1
session 2
session 3
session 1
session 2
session 3
session 4
session 1
session 2
session 3
session 1
session 2
session 3
session 4
session 1
session 2
session 3
session 4
Difference?
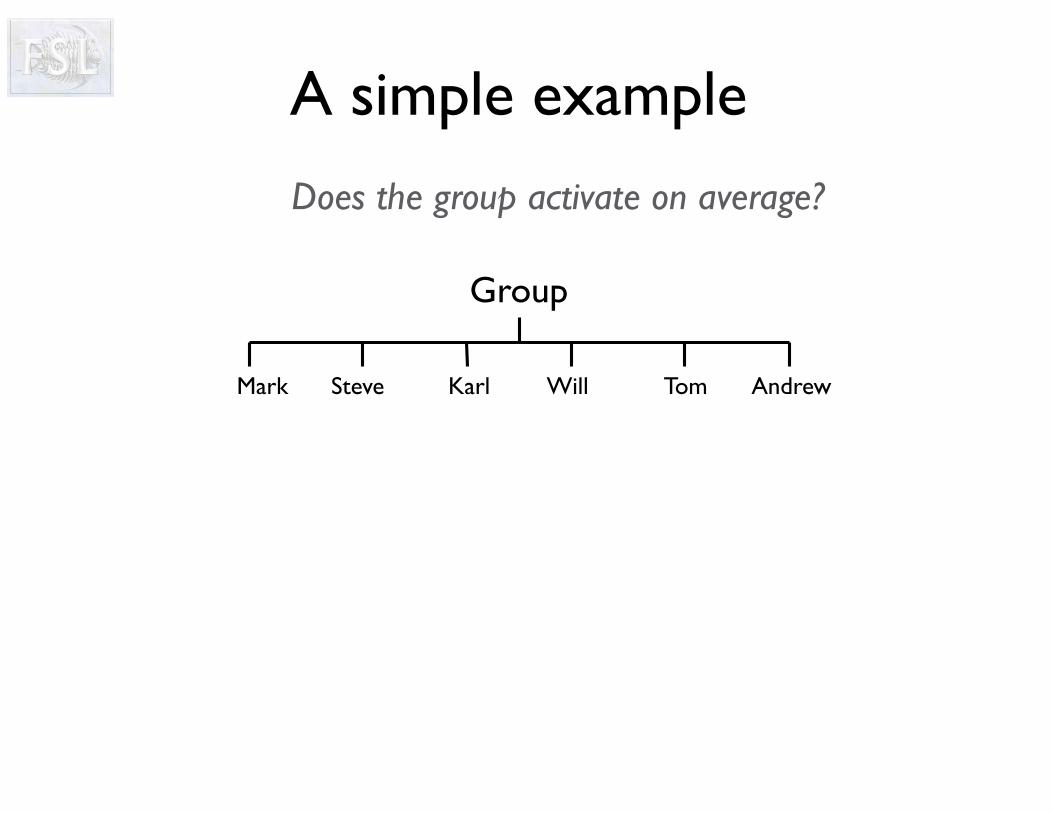
Does the group activate on average?
A simple example
Group
Mark Steve Karl Will Tom Andrew
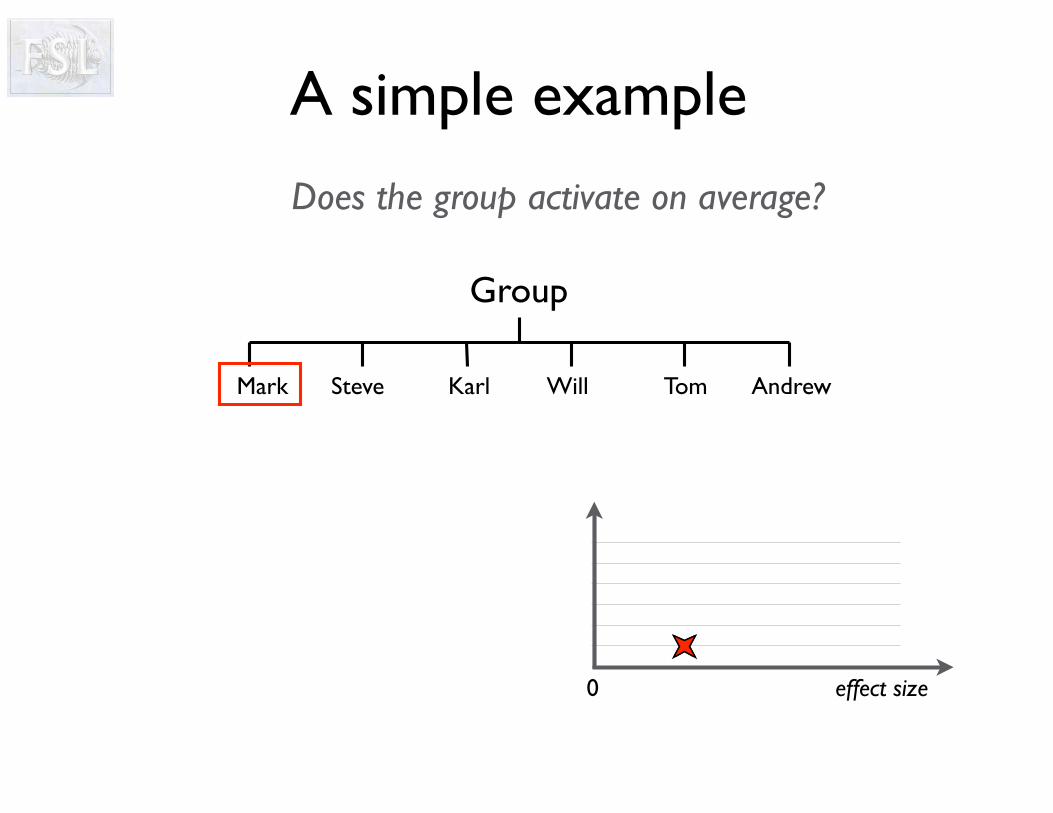
Does the group activate on average?
0 effect size
A simple example
Group
Mark Steve Karl Will Tom Andrew
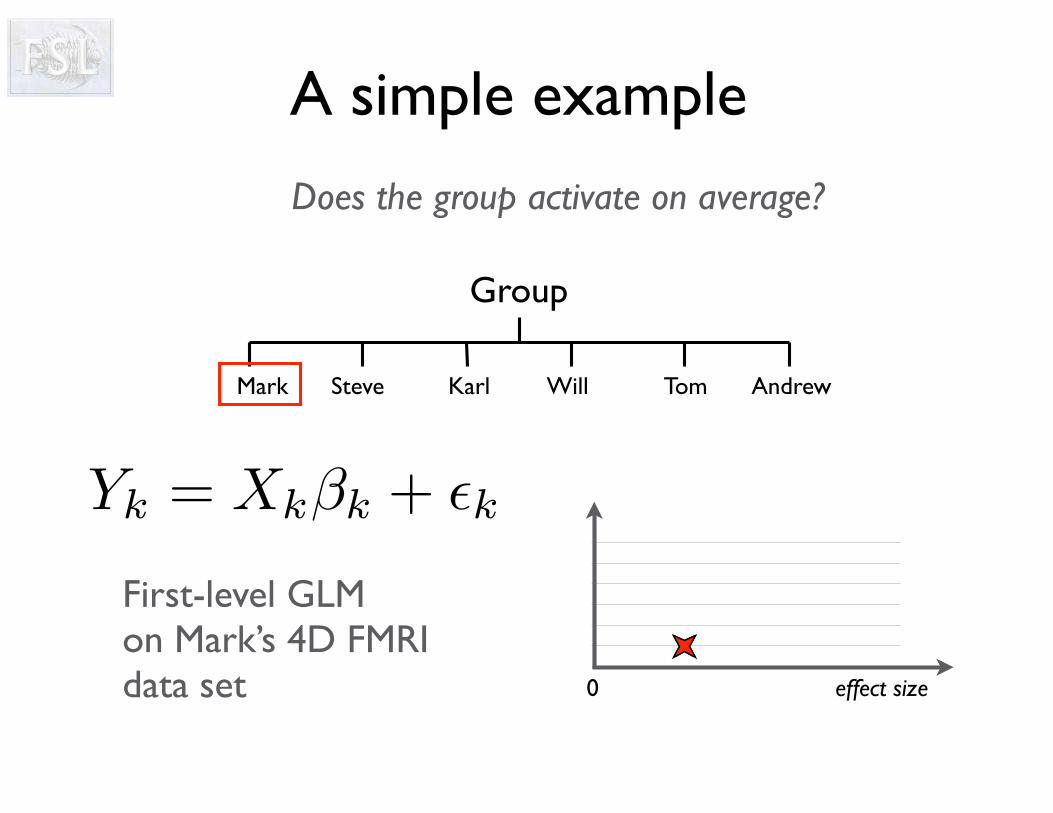
Does the group activate on average?
0 effect size
A simple example
Group
Mark Steve Karl Will Tom Andrew
Yk = Xk�k + ⇥k
First-level GLMon Mark’s 4D FMRIdata set

Does the group activate on average?
0 effect size
A simple example
Group
Mark Steve Karl Will Tom Andrew
Yk = Xk�k + ⇥k
Mark’s effect size
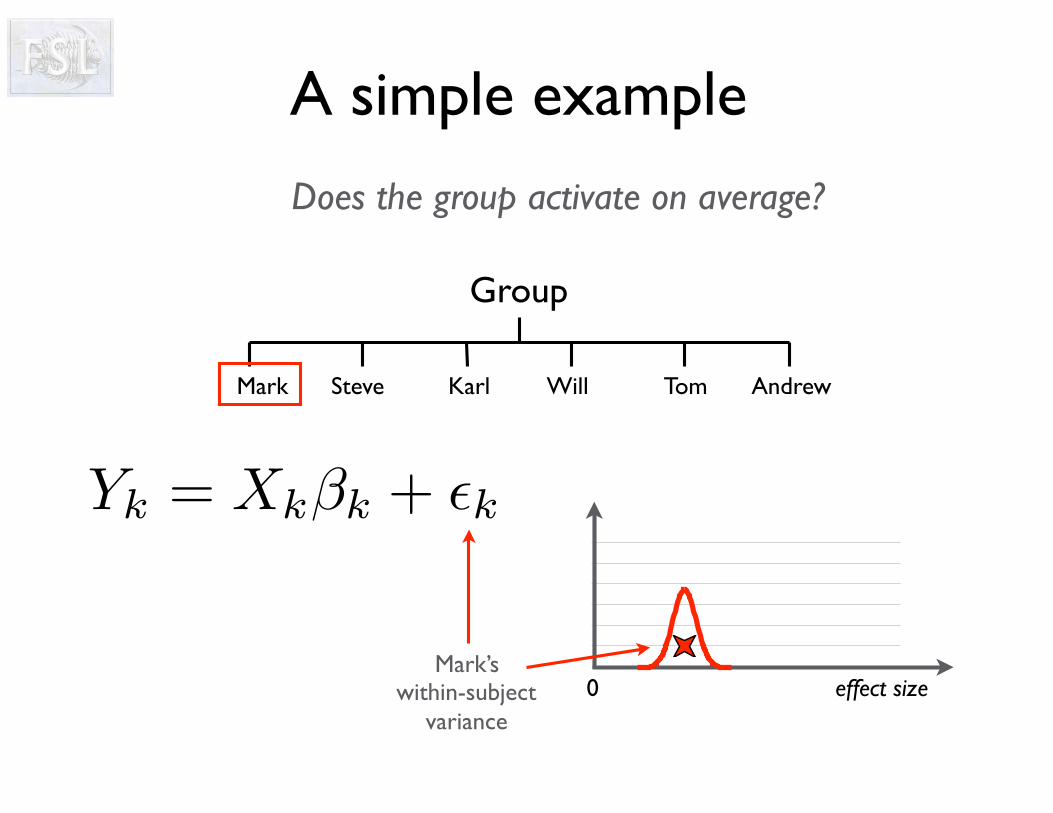
Does the group activate on average?
0 effect size
A simple example
Group
Mark Steve Karl Will Tom Andrew
Yk = Xk�k + ⇥k
Mark’s within-subject
variance
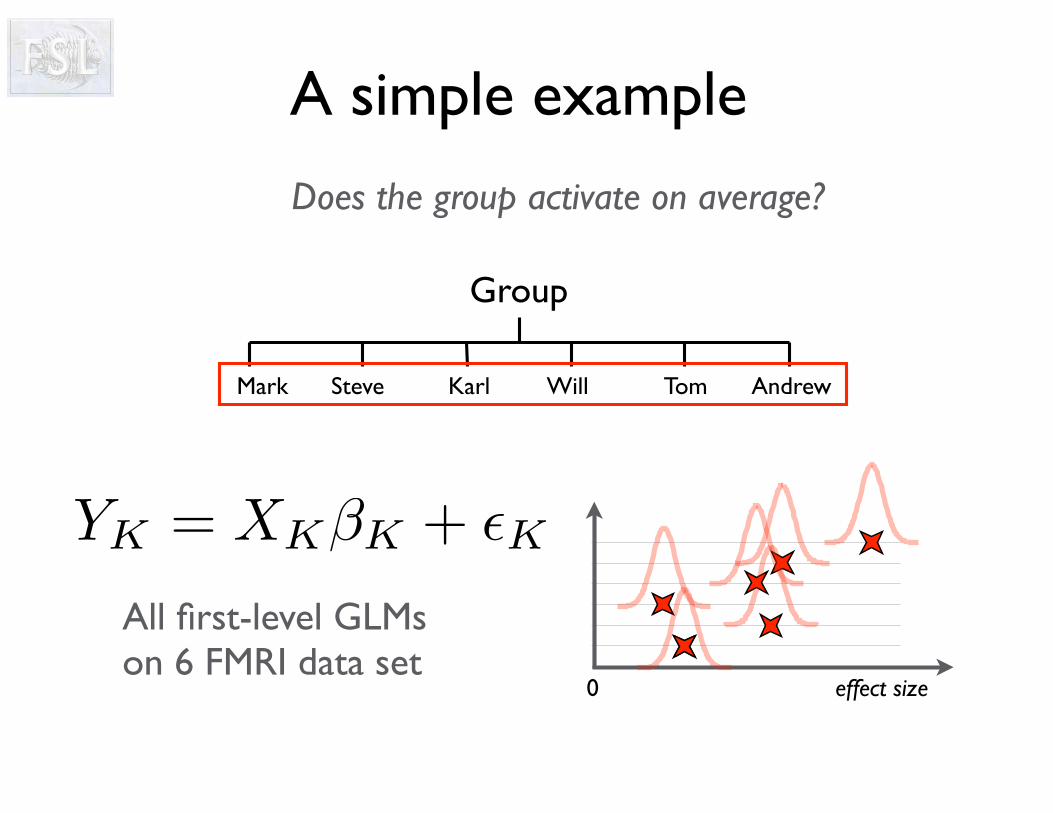
Does the group activate on average?
0 effect size
A simple example
Group
Mark Steve Karl Will Tom Andrew
All first-level GLMson 6 FMRI data set
YK = XK�K + ⇥K
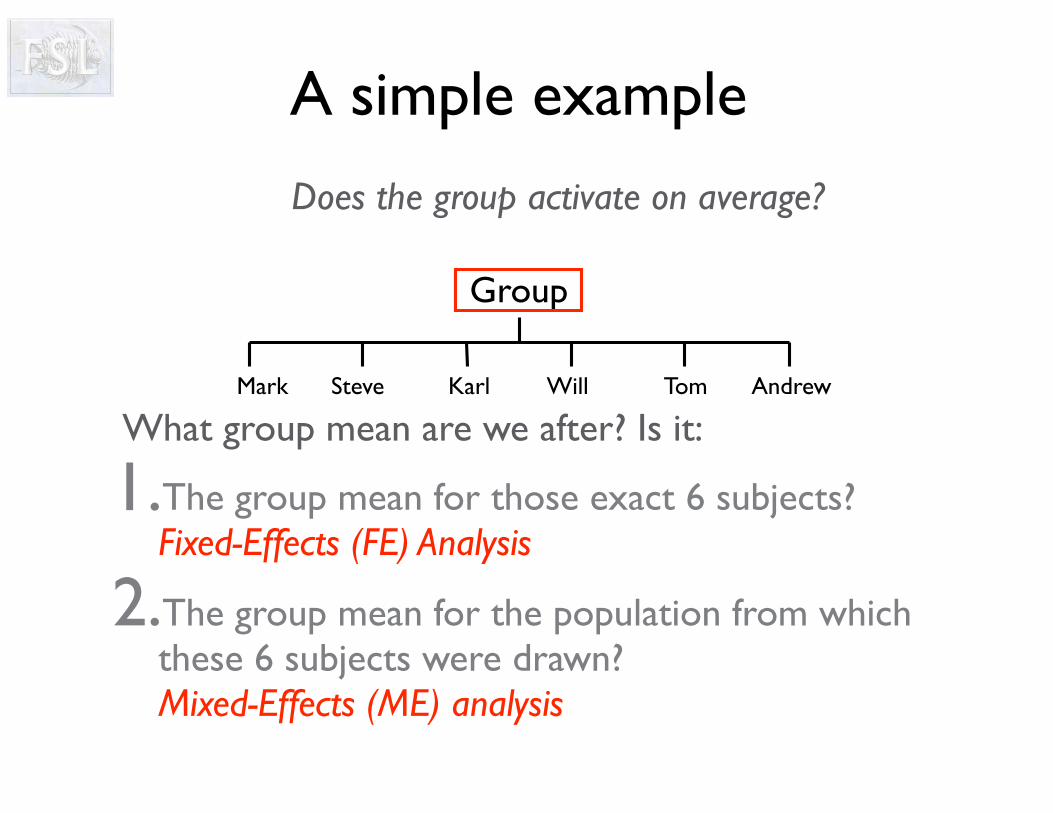
Does the group activate on average?
What group mean are we after? Is it:
1.The group mean for those exact 6 subjects?Fixed-Effects (FE) Analysis
2.The group mean for the population from which these 6 subjects were drawn?Mixed-Effects (ME) analysis
A simple example
Group
Mark Steve Karl Will Tom Andrew
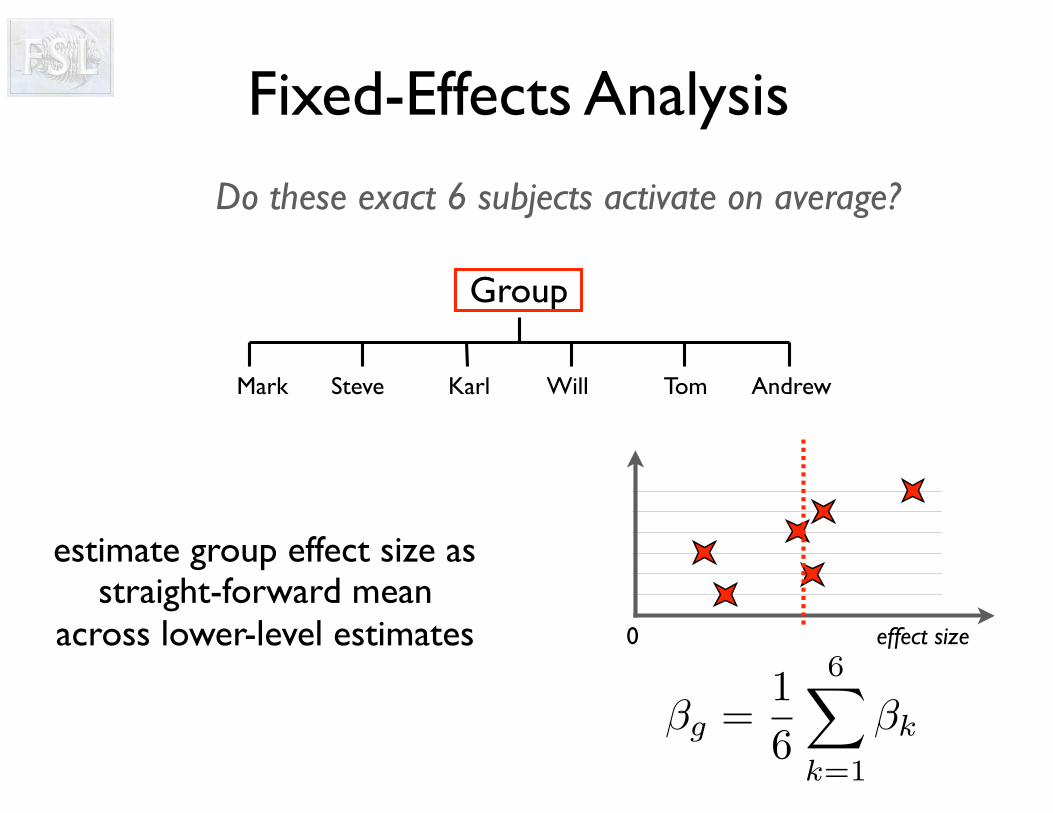
Do these exact 6 subjects activate on average?
Fixed-Effects Analysis
Group
Mark Steve Karl Will Tom Andrew
0 effect size
�g =16
6�
k=1
�k
estimate group effect size as straight-forward mean
across lower-level estimates
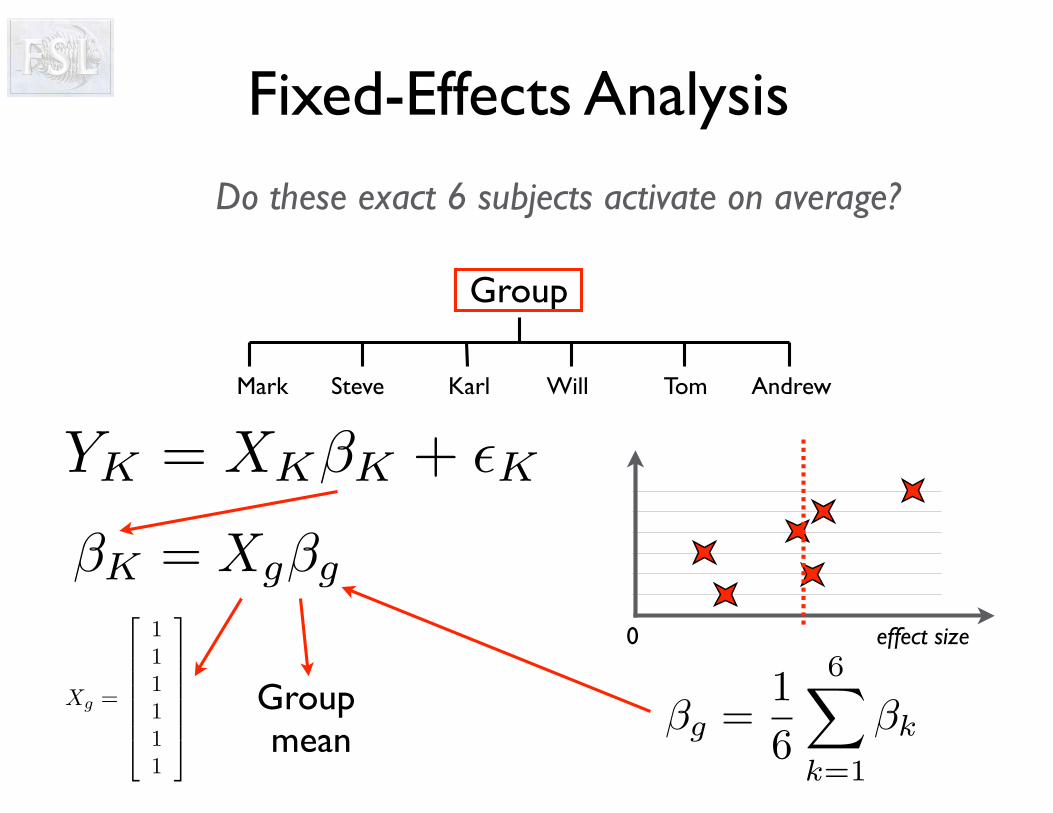
Do these exact 6 subjects activate on average?
Fixed-Effects Analysis
Group
Mark Steve Karl Will Tom Andrew
0 effect size
YK = XK�K + ⇥K
�K = Xg�g
�g =16
6�
k=1
�kXg =
�
⇧⇧⇧⇧⇧⇧⇤
111111
⇥
⌃⌃⌃⌃⌃⌃⌅Group mean
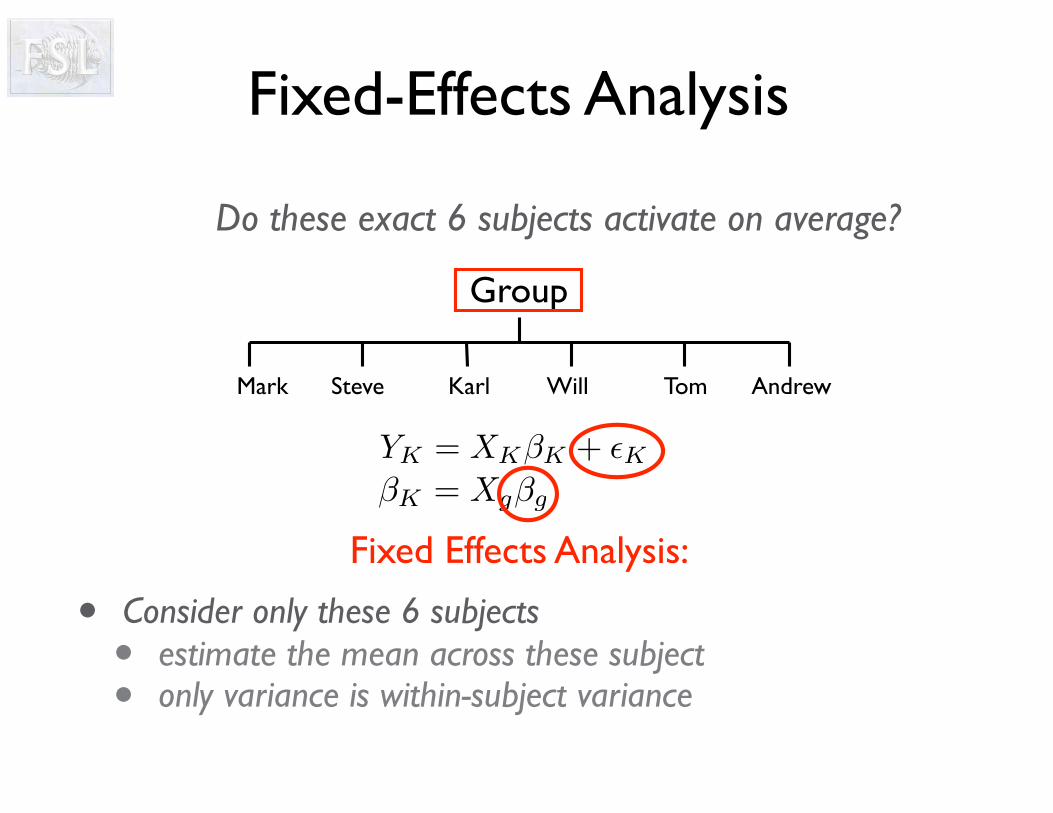
Do these exact 6 subjects activate on average?
• Consider only these 6 subjects• estimate the mean across these subject• only variance is within-subject variance
Fixed-Effects Analysis
Group
Mark Steve Karl Will Tom Andrew
YK = XK�K + ⇥K
�K = Xg�g
Fixed Effects Analysis:

Does the group activate on average?
What group mean are we after? Is it:
1.The group mean for those exact 6 subjects?Fixed-Effects (FE) Analysis
2.The group mean for the population from which these 6 subjects were drawn?Mixed-Effects (ME) analysis
A simple example
Group
Mark Steve Karl Keith Tom Andrew
0 effect size
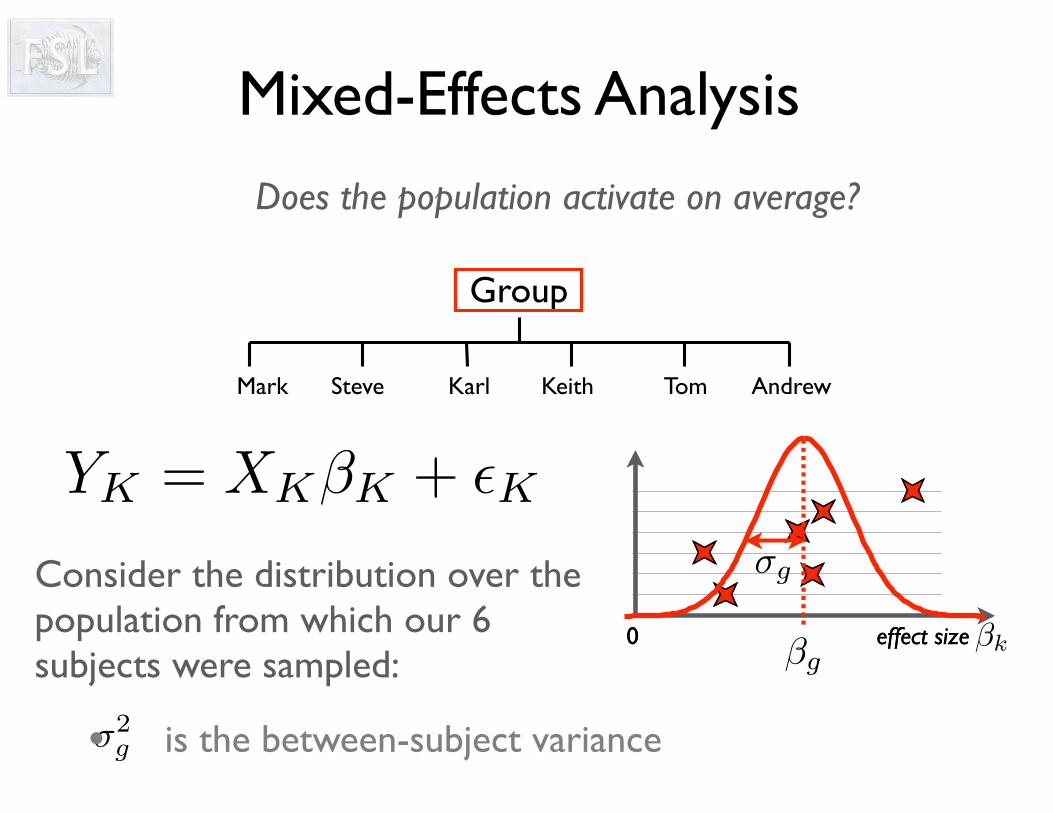
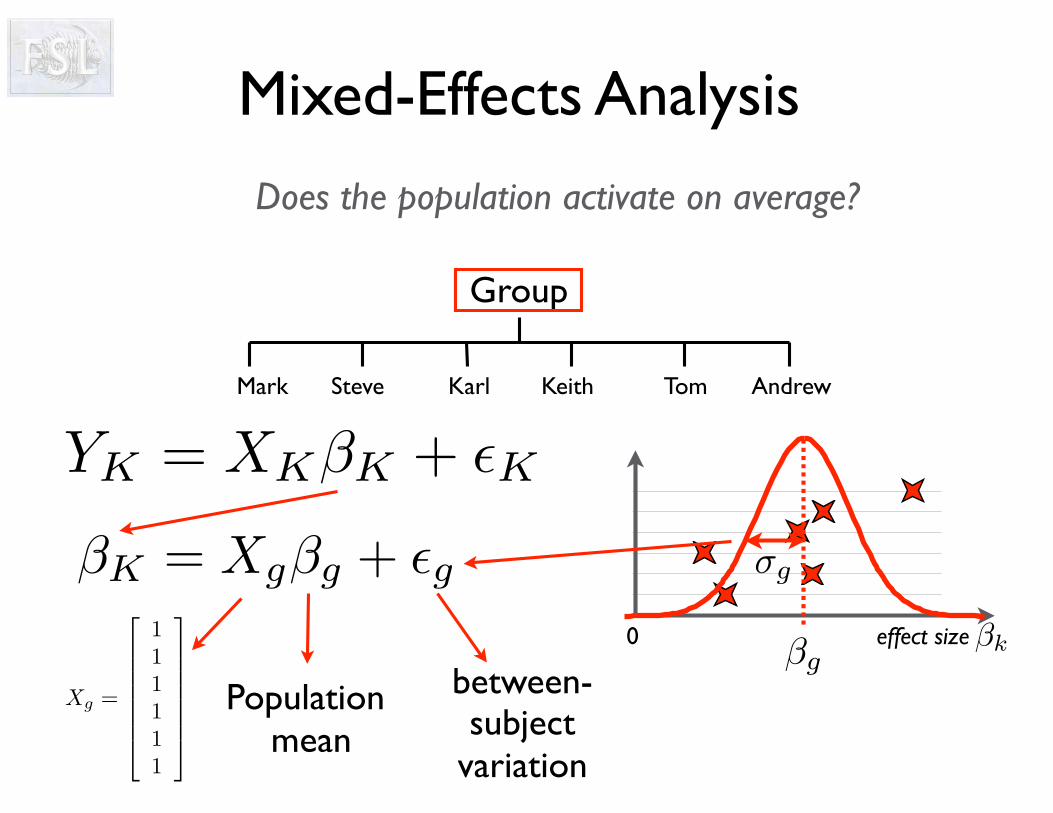
Does the population activate on average?
Mixed-Effects Analysis
Group
Mark Steve Karl Keith Tom Andrew
0 effect size
YK = XK�K + ⇥K
�g�k
Consider the distribution over the population from which our 6 subjects were sampled:
�2g• is the between-subject variance
�g
Does the population activate on average?
Mixed-Effects Analysis
Group
Mark Steve Karl Keith Tom Andrew
YK = XK�K + ⇥K
0 effect size�g�k
�g�K = Xg�g + ⇥g
Xg =
�
⇧⇧⇧⇧⇧⇧⇤
111111
⇥
⌃⌃⌃⌃⌃⌃⌅Population
mean
between-subject
variation

Does the population activate on average?
• Consider the 6 subjects as samples from a wider population• estimate the mean across the population• between-subject variance accounts for random sampling
Mixed-Effects Analysis
Group
Mark Steve Karl Keith Tom Andrew
YK = XK�K + ⇥K
Mixed-Effects Analysis:
�K = Xg�g + ⇥g
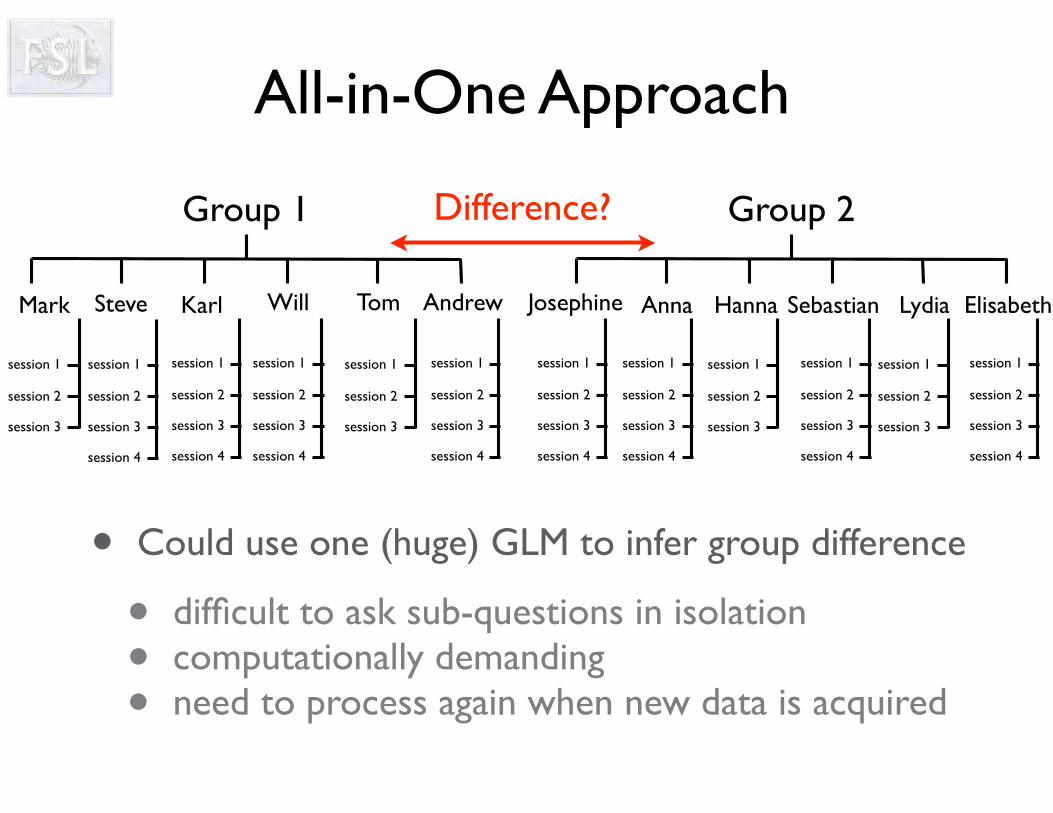
All-in-One Approach
• Could use one (huge) GLM to infer group difference
• difficult to ask sub-questions in isolation• computationally demanding• need to process again when new data is acquired
Group 2
HannaJosephine Anna Sebastian Lydia Elisabeth
Group 1
Mark Steve Karl Will Tom Andrew
session 1
session 2
session 3
session 4
session 1
session 2
session 3
session 1
session 2
session 3
session 4
session 1
session 2
session 3
session 1
session 2
session 3
session 4
session 1
session 2
session 3
session 4
session 1
session 2
session 3
session 4
session 1
session 2
session 3
session 1
session 2
session 3
session 4
session 1
session 2
session 3
session 1
session 2
session 3
session 4
session 1
session 2
session 3
session 4
Difference?

Summary Statistics Approach
• At each level:
• Inputs are summary stats from levels below (or FMRI data at the lowest level)
• Outputs are summary stats or statistic maps for inference
• Need to ensure formal equivalence between different approaches!
In FEAT estimate levels one stage at a time
Group
Subject
Session
Groupdifference
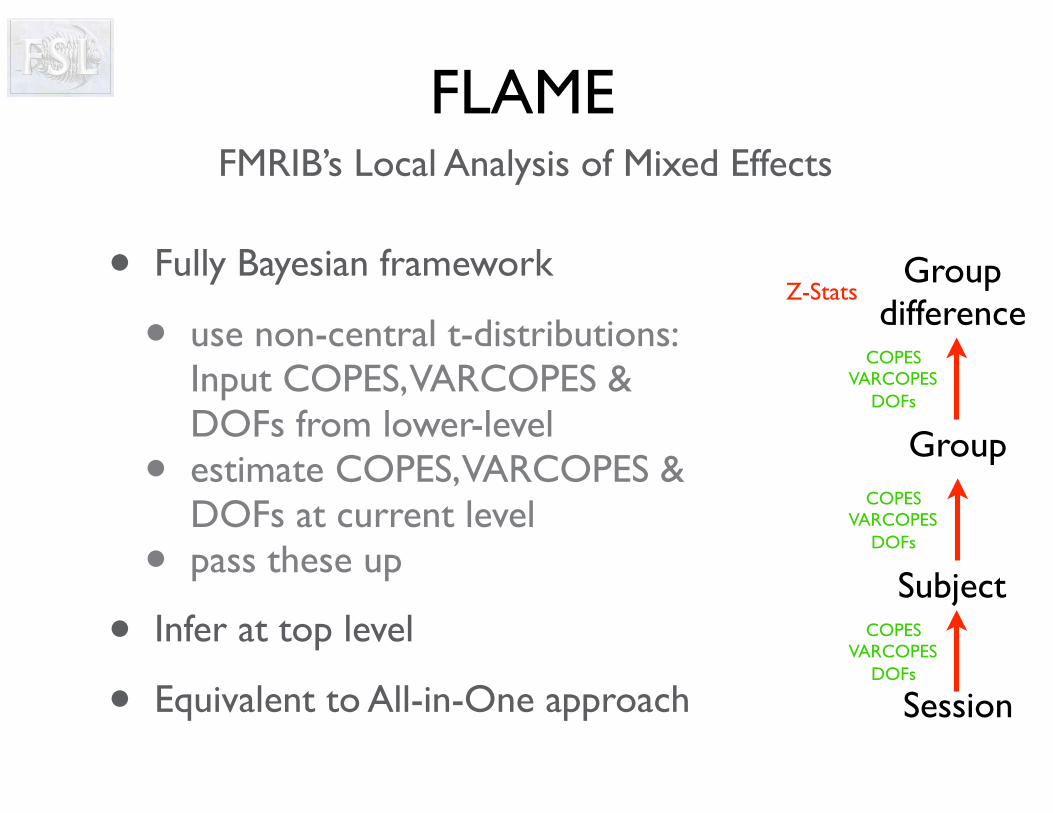
FLAME
• Fully Bayesian framework
• use non-central t-distributions: Input COPES, VARCOPES & DOFs from lower-level
• estimate COPES, VARCOPES & DOFs at current level
• pass these up
• Infer at top level
• Equivalent to All-in-One approach
FMRIB’s Local Analysis of Mixed Effects
Group
Subject
Session
Groupdifference
COPESVARCOPES
DOFs
Z-Stats
COPESVARCOPES
DOFs
COPESVARCOPES
DOFs
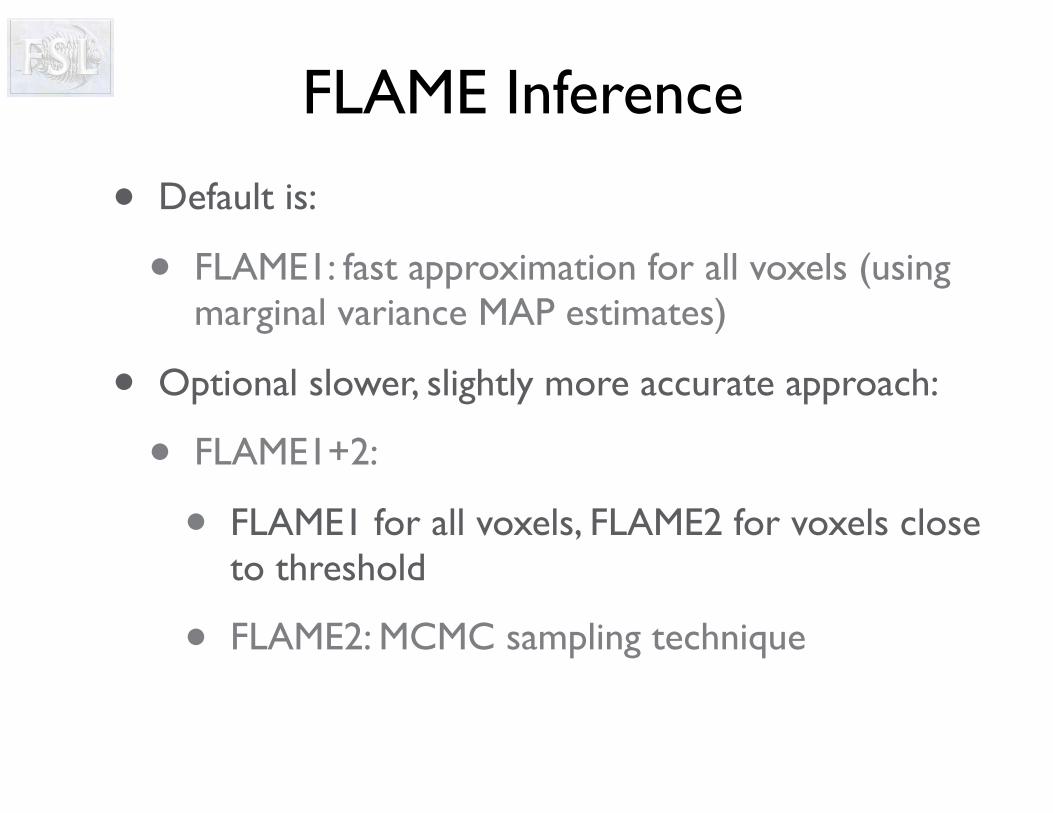
FLAME Inference
• Default is:
• FLAME1: fast approximation for all voxels (using marginal variance MAP estimates)
• Optional slower, slightly more accurate approach:
• FLAME1+2:
• FLAME1 for all voxels, FLAME2 for voxels close to threshold
• FLAME2: MCMC sampling technique
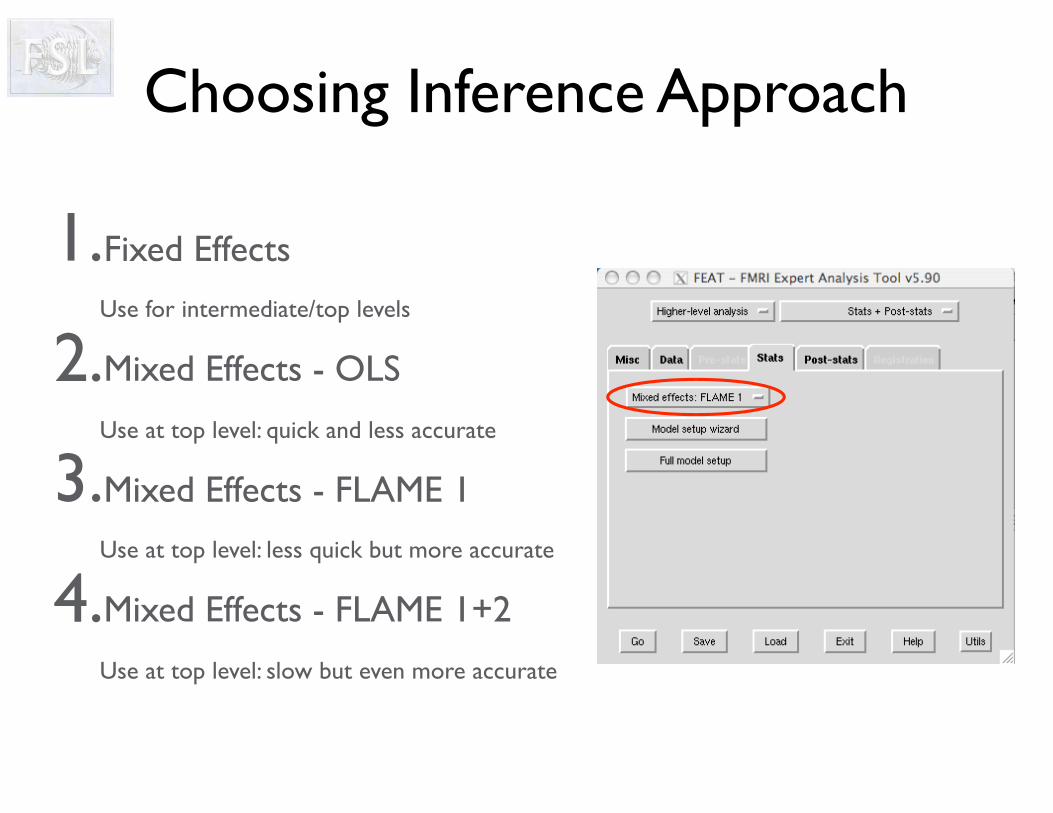
Choosing Inference Approach
1.Fixed Effects
Use for intermediate/top levels
2.Mixed Effects - OLS
Use at top level: quick and less accurate
3.Mixed Effects - FLAME 1
Use at top level: less quick but more accurate
4.Mixed Effects - FLAME 1+2
Use at top level: slow but even more accurate
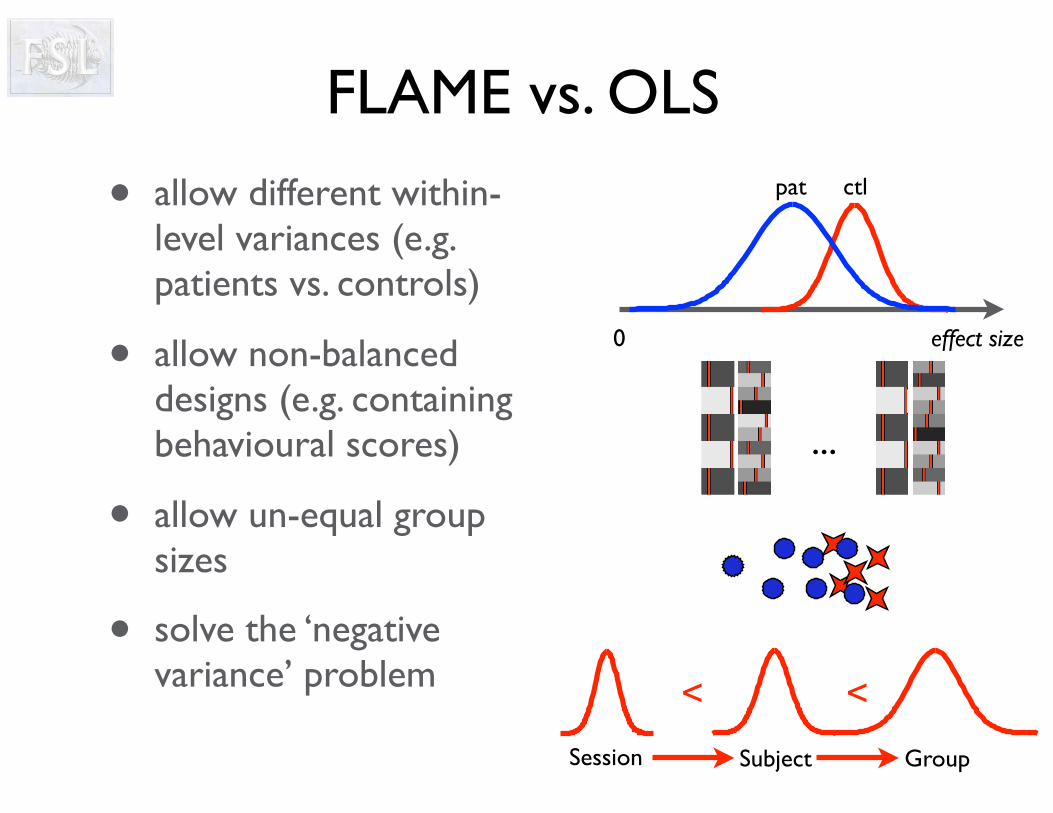
FLAME vs. OLS
• allow different within-level variances (e.g. patients vs. controls)
• allow non-balanced designs (e.g. containing behavioural scores)
• allow un-equal group sizes
• solve the ‘negative variance’ problem
0 effect size
pat ctl
GroupSubjectSession
< <
...
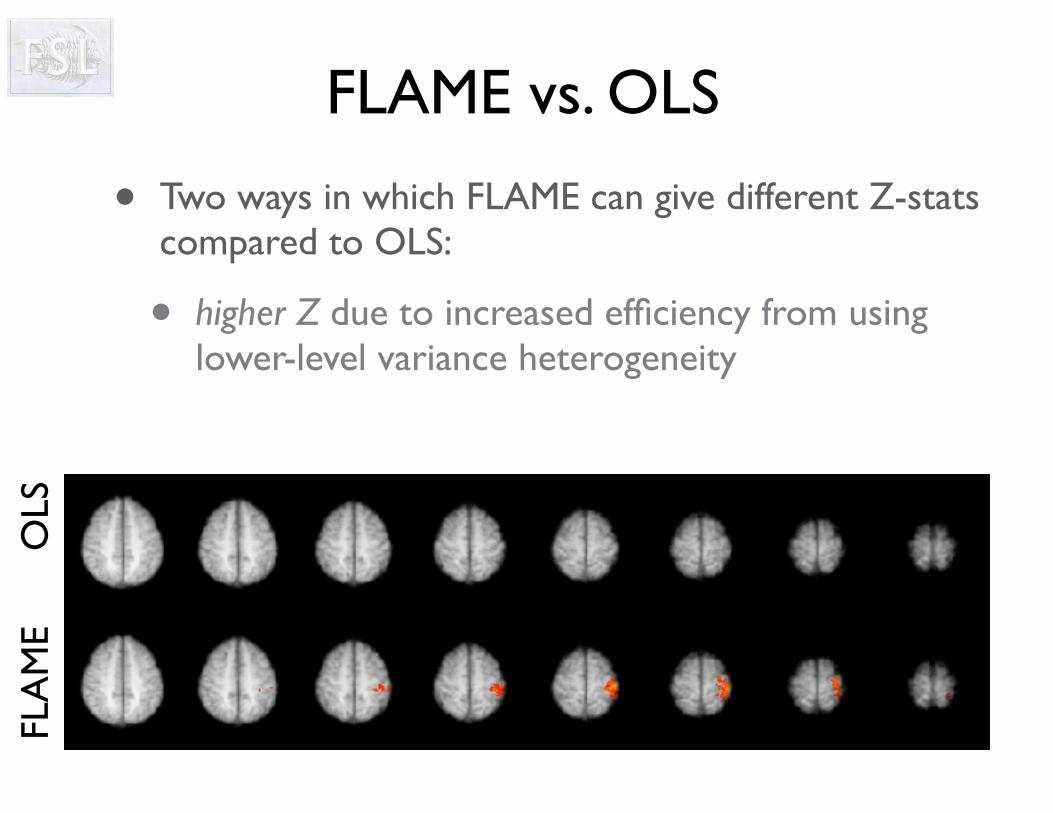
FLAME vs. OLS
• Two ways in which FLAME can give different Z-stats compared to OLS:
• higher Z due to increased efficiency from using lower-level variance heterogeneity
OLS
FLA
ME
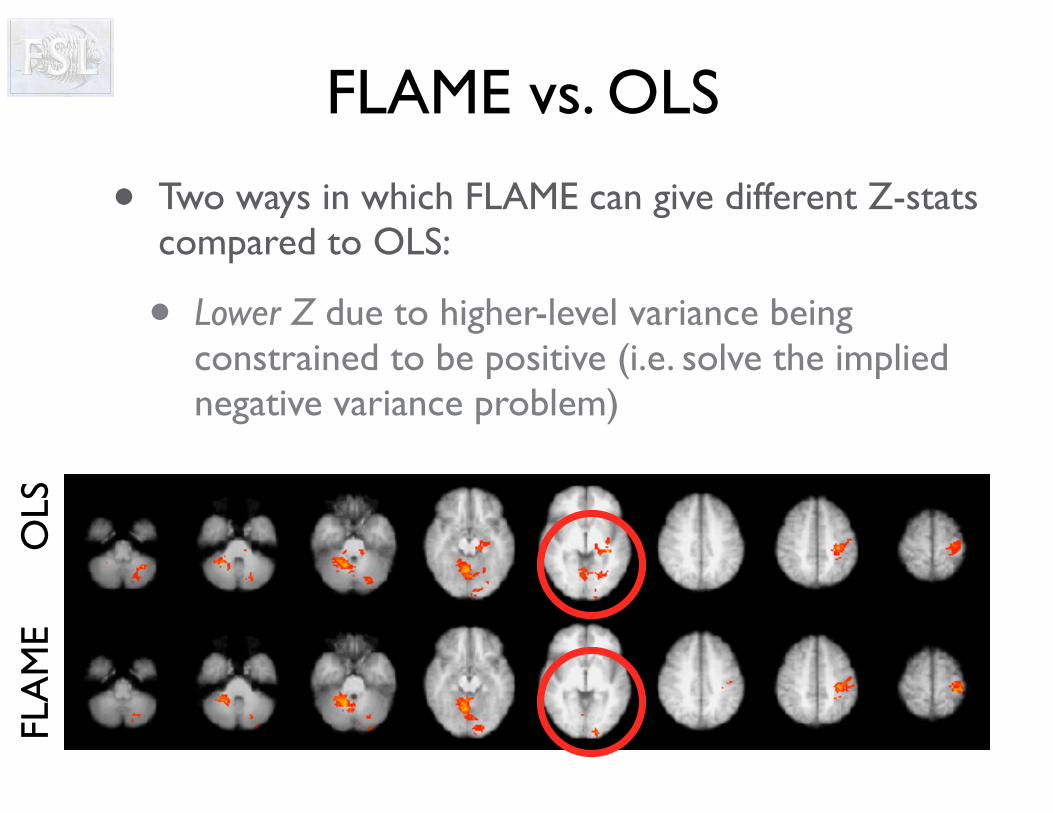
FLAME vs. OLS
• Two ways in which FLAME can give different Z-stats compared to OLS:
• Lower Z due to higher-level variance being constrained to be positive (i.e. solve the implied negative variance problem)
OLS
FLA
ME
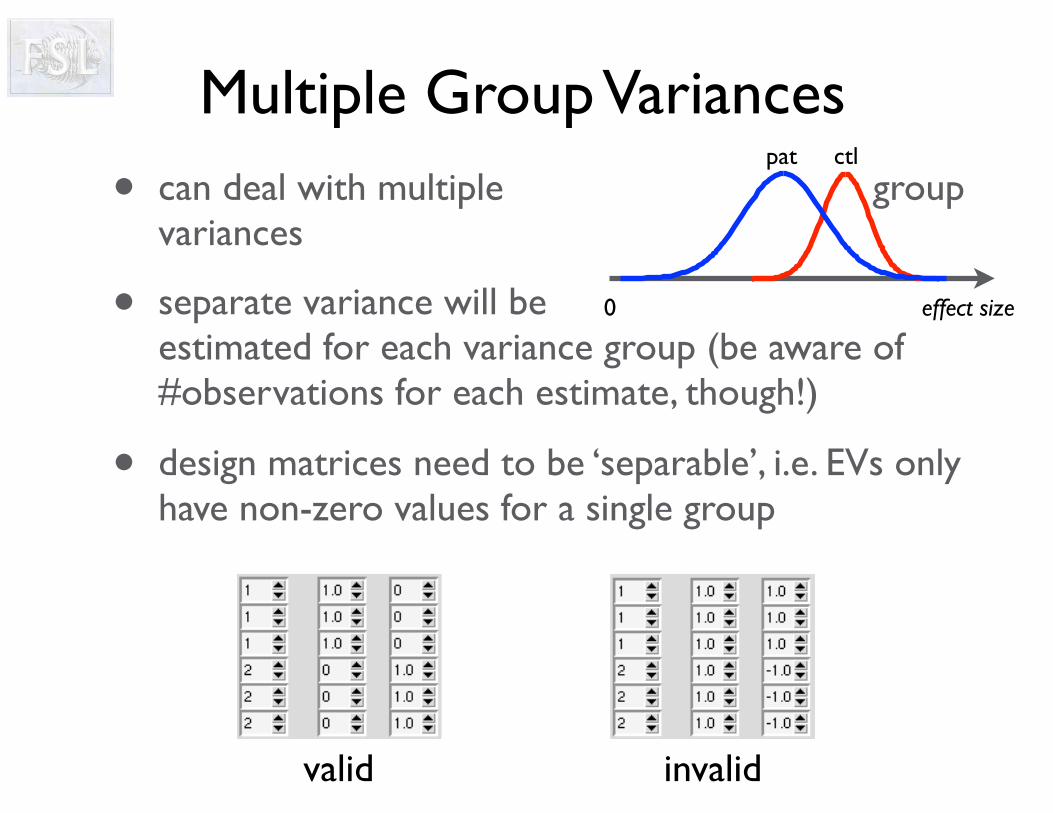
Multiple Group Variances
• can deal with multiple group variances
• separate variance will be estimated for each variance group (be aware of #observations for each estimate, though!)
• design matrices need to be ‘separable’, i.e. EVs only have non-zero values for a single group
0 effect size
pat ctl
valid invalid
Examples
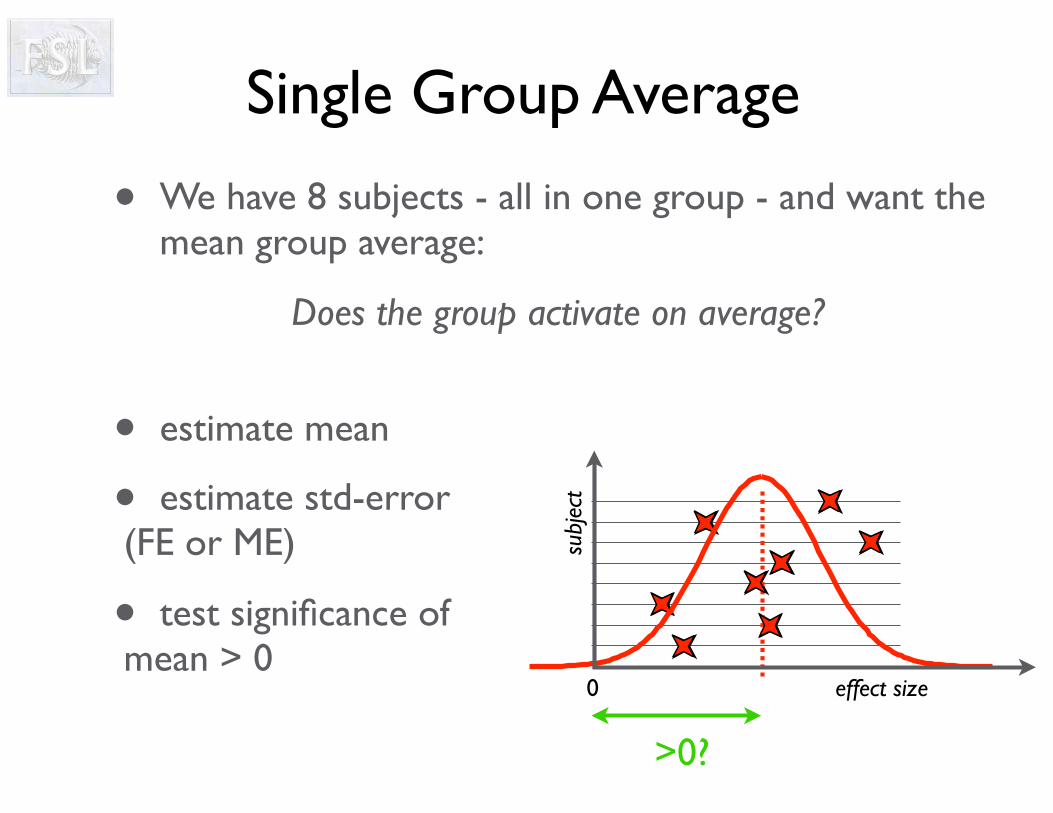
Single Group Average
• We have 8 subjects - all in one group - and want the mean group average:
Does the group activate on average?
• estimate mean
• estimate std-error(FE or ME)
• test significance of mean > 0
>0?
0
subj
ect
effect size
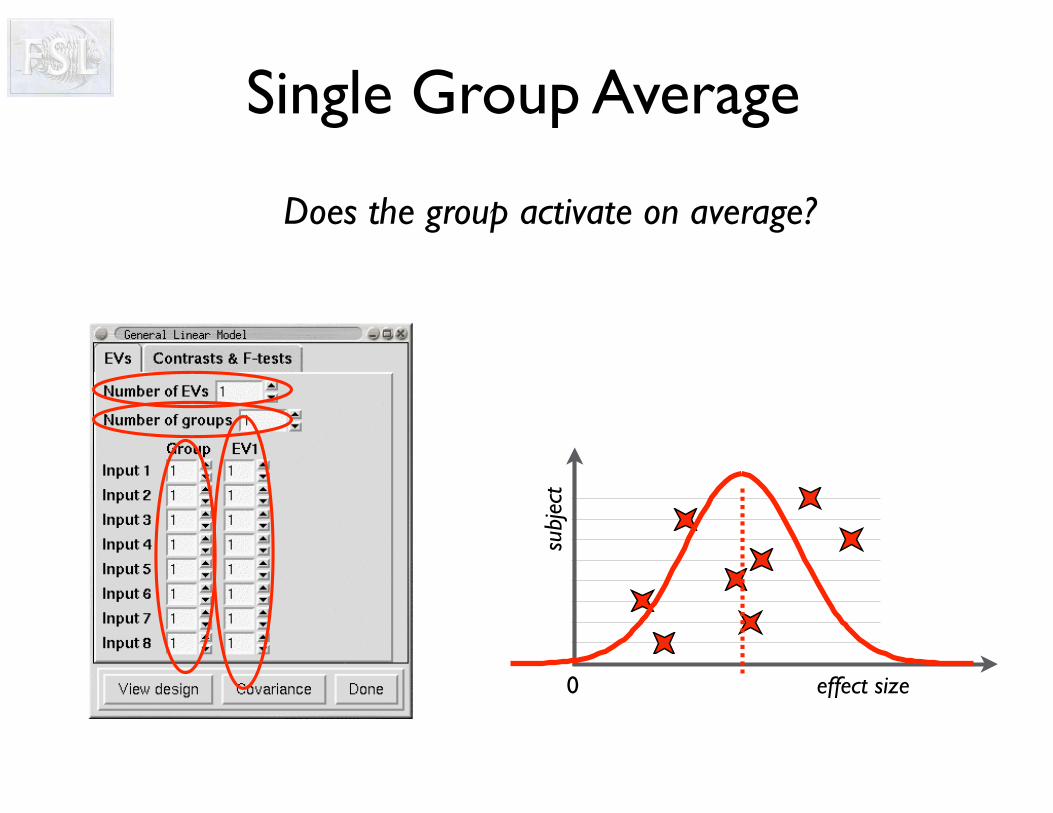
Single Group Average
Does the group activate on average?
0
subj
ect
effect size

Single Group Average
Does the group activate on average?
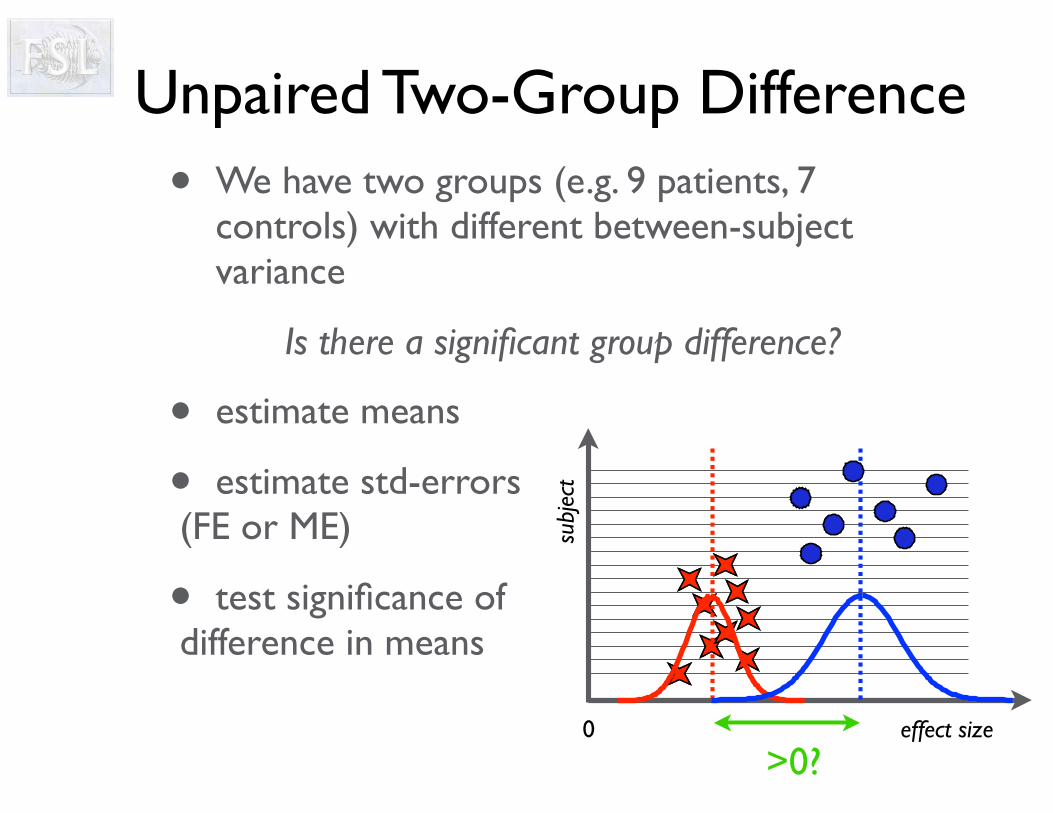
Unpaired Two-Group Difference• We have two groups (e.g. 9 patients, 7
controls) with different between-subject variance
Is there a significant group difference?
• estimate means
• estimate std-errors(FE or ME)
• test significance of difference in means
>0?0
subj
ect
effect size
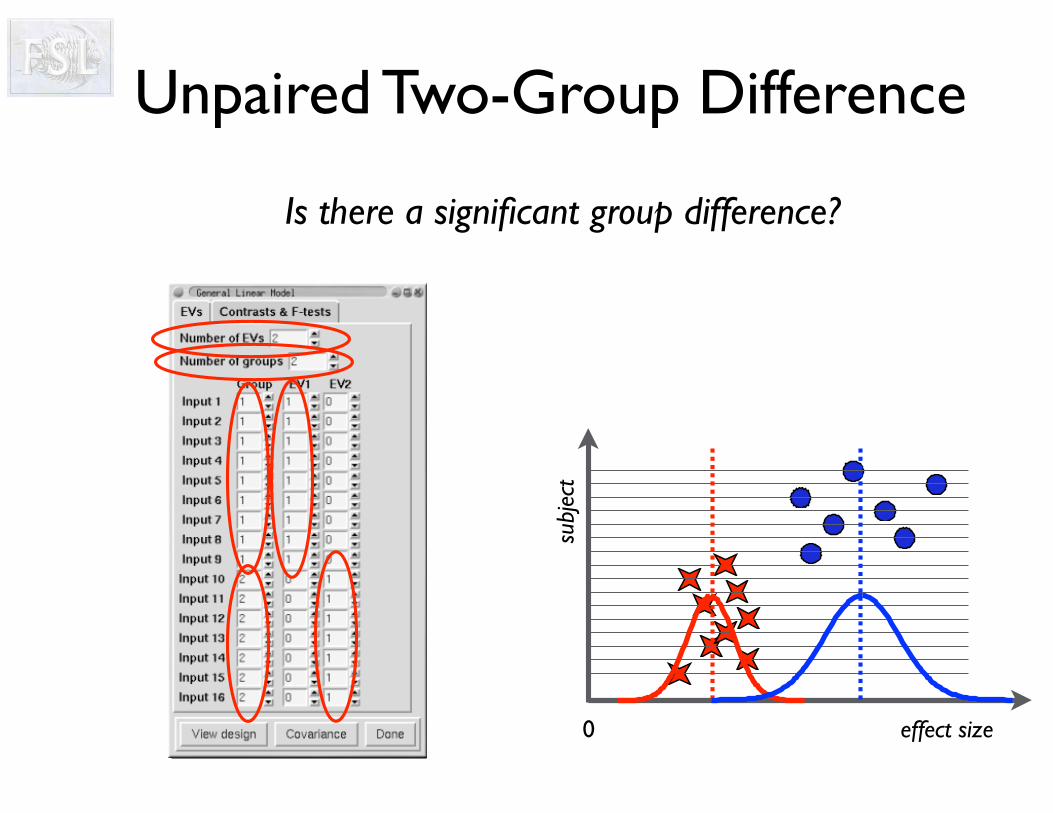
Unpaired Two-Group Difference
Is there a significant group difference?
0
subj
ect
effect size
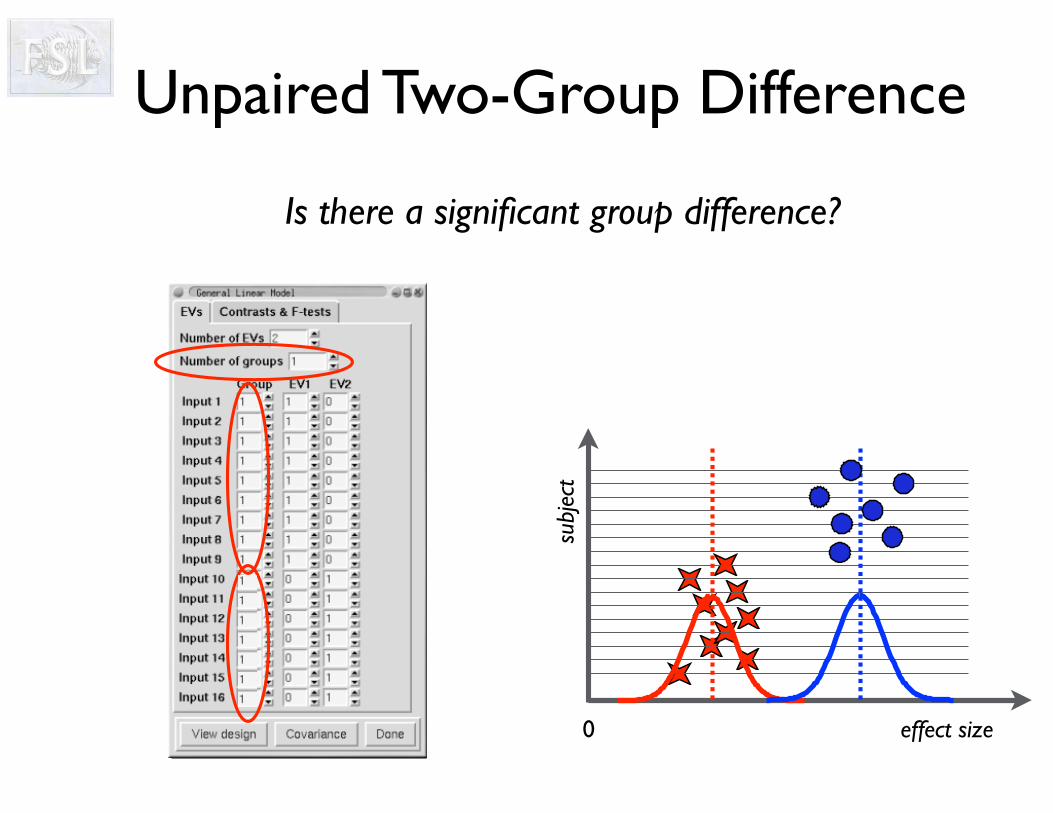
Unpaired Two-Group Difference
Is there a significant group difference?
0
subj
ect
effect size
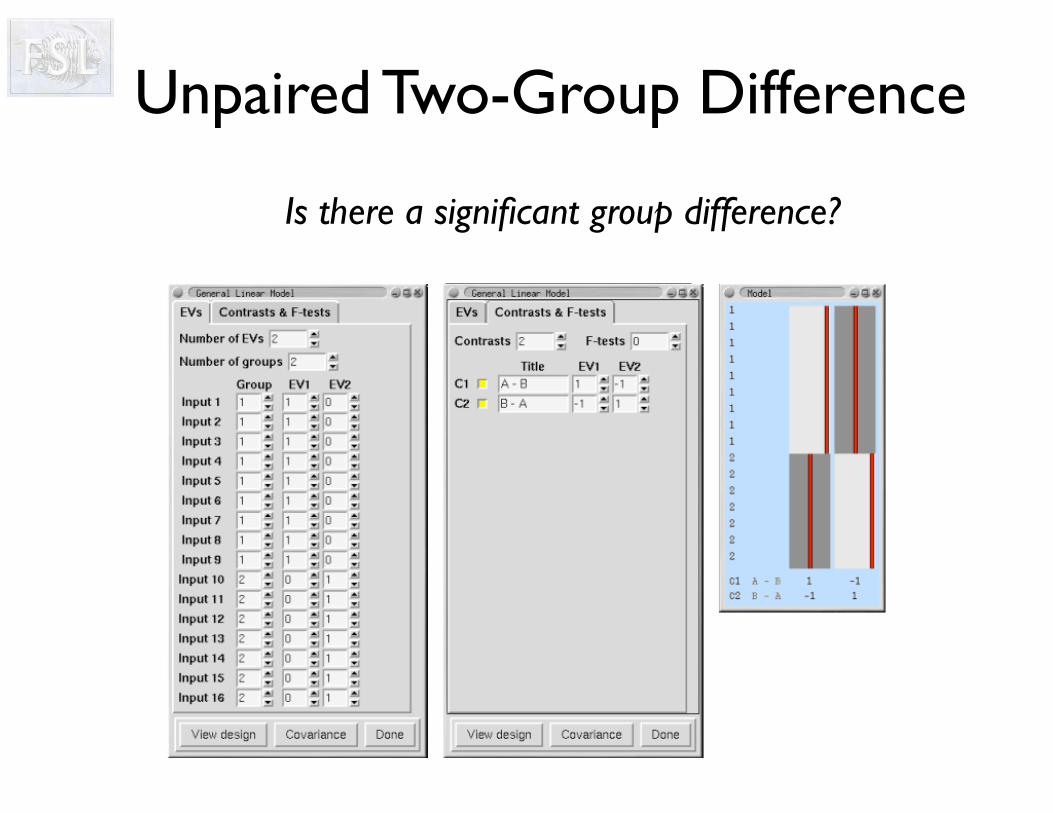
Unpaired Two-Group Difference
Is there a significant group difference?
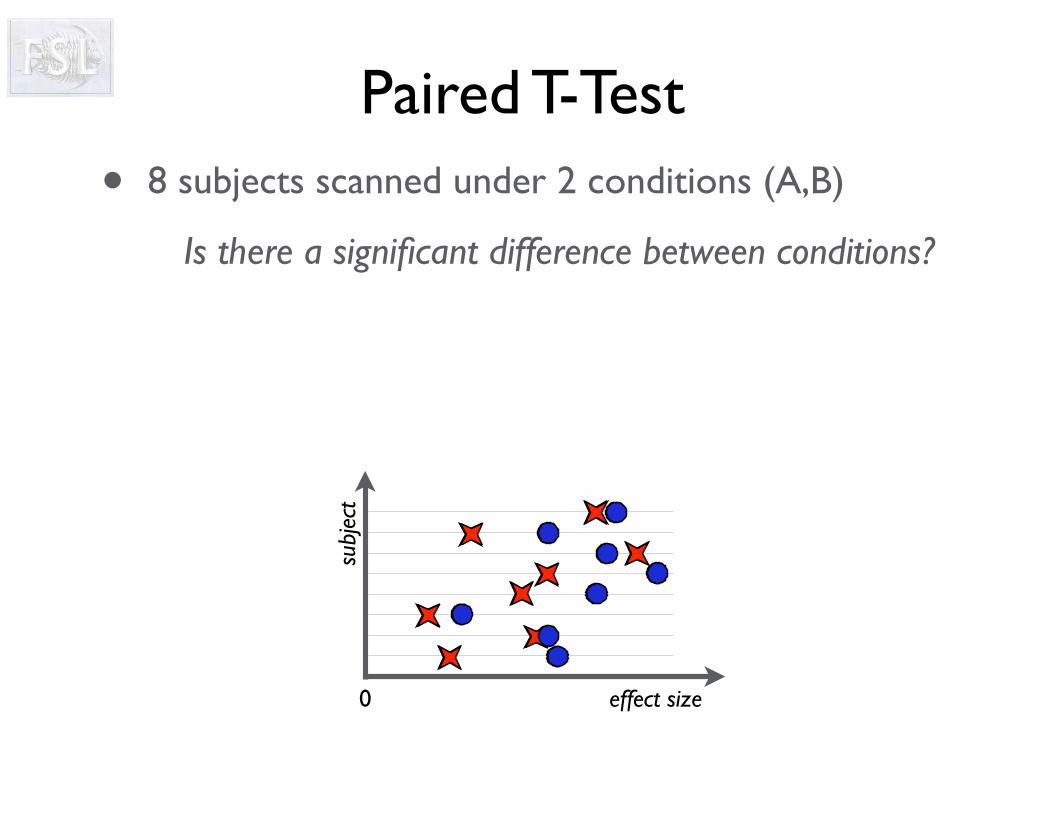
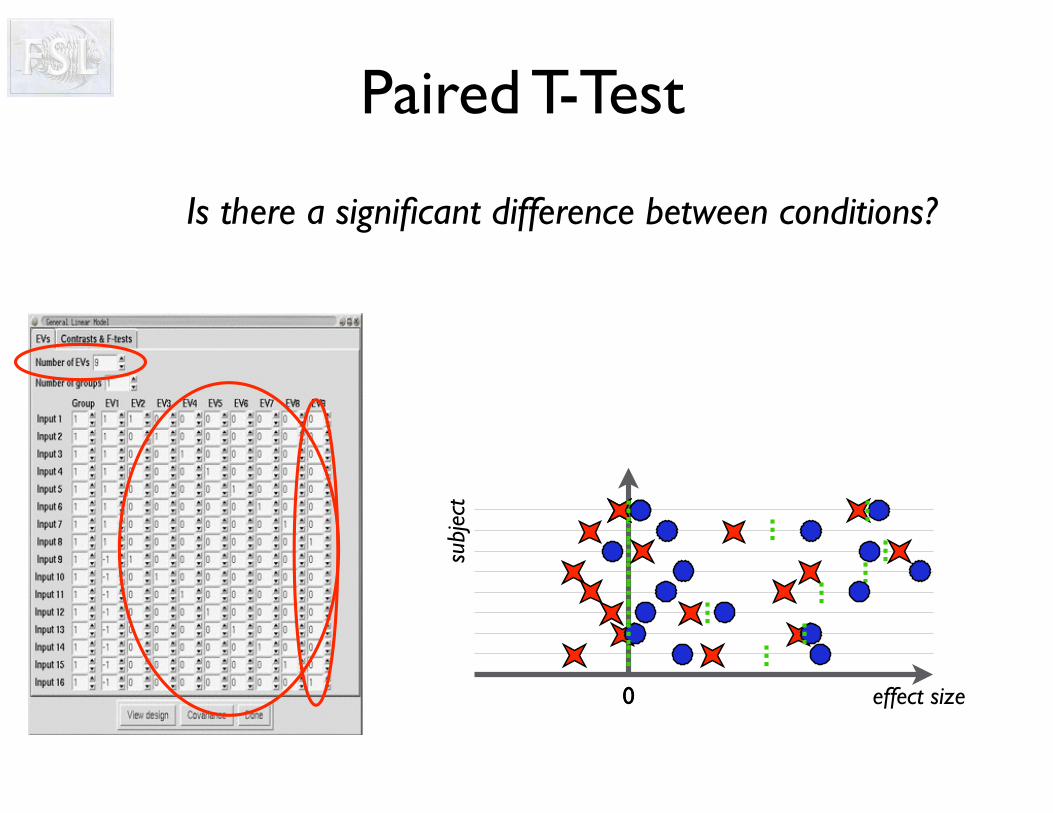
Paired T-Test• 8 subjects scanned under 2 conditions (A,B)
Is there a significant difference between conditions?
0
subj
ect
effect size
>0?
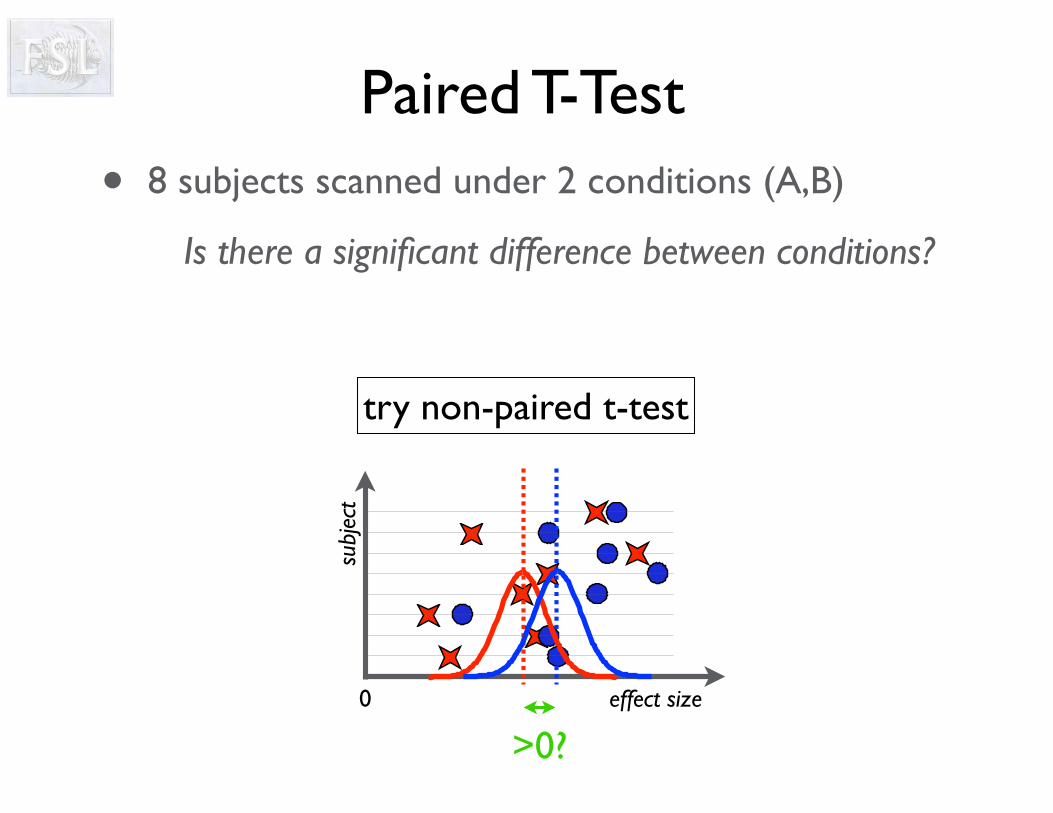
Paired T-Test• 8 subjects scanned under 2 conditions (A,B)
Is there a significant difference between conditions?
0
subj
ect
effect size
try non-paired t-test
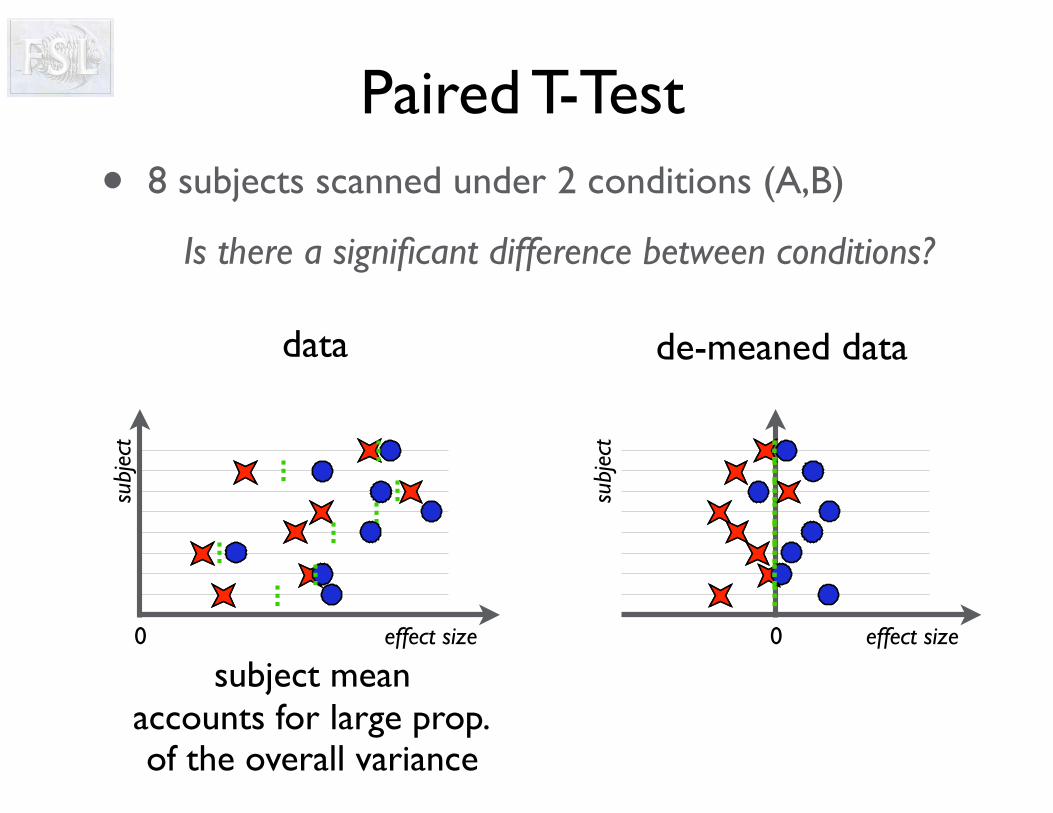
• 8 subjects scanned under 2 conditions (A,B)
Is there a significant difference between conditions?
de-meaned data
0su
bjec
teffect size
data
0
subj
ect
effect size
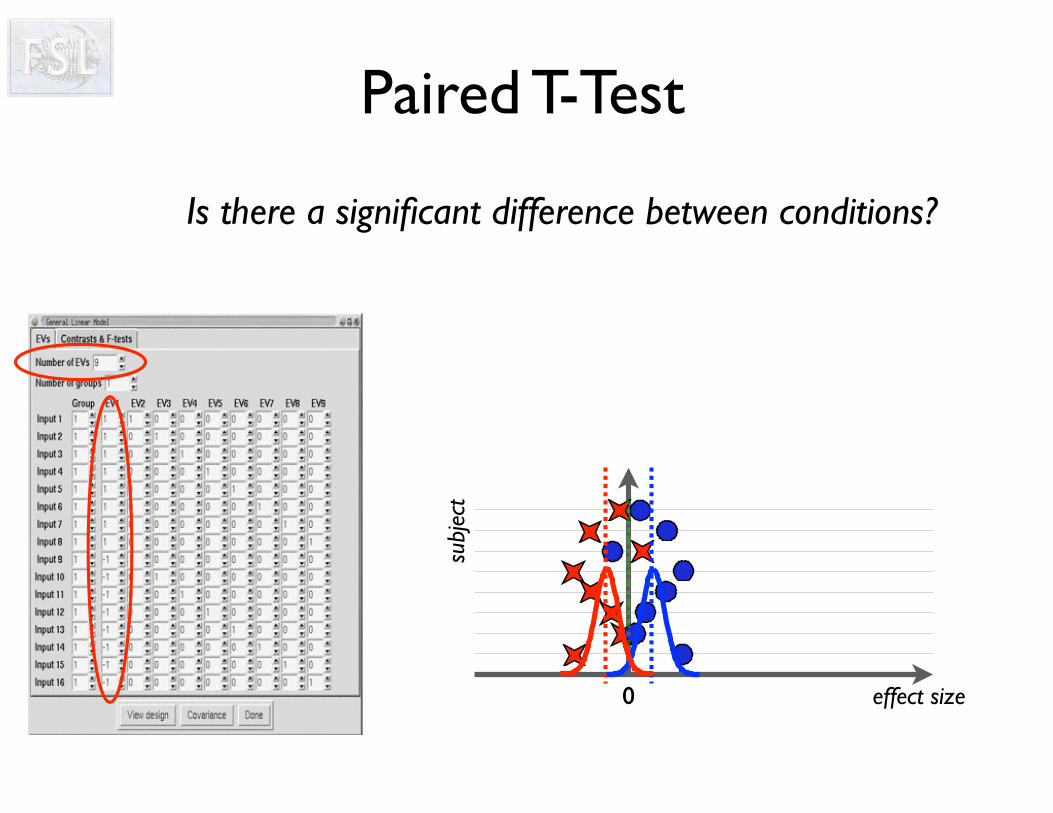
Paired T-Test
subject mean accounts for large prop.of the overall variance
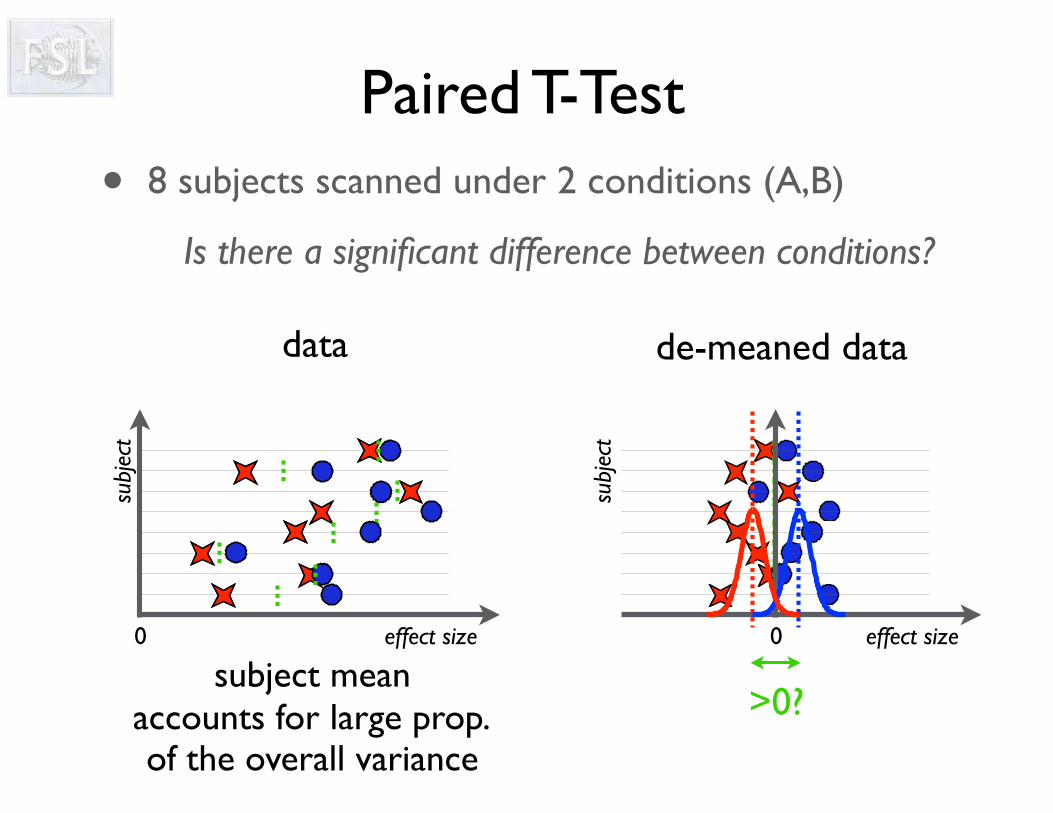
• 8 subjects scanned under 2 conditions (A,B)
Is there a significant difference between conditions?
de-meaned data
0su
bjec
teffect size
data
0
subj
ect
effect size
Paired T-Test
>0?subject mean
accounts for large prop.of the overall variance
subj
ect
effect size00
Paired T-Test
Is there a significant difference between conditions?
subj
ect
effect size00
Paired T-Test
Is there a significant difference between conditions?
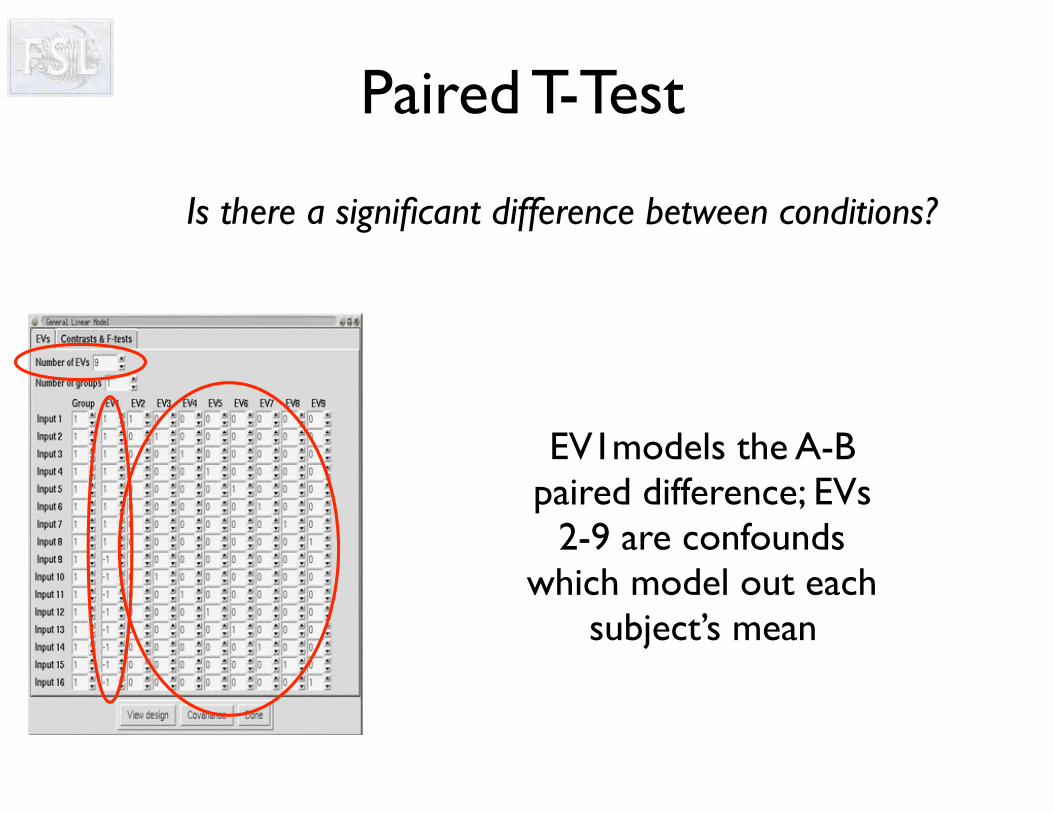
Paired T-Test
Is there a significant difference between conditions?
EV1models the A-B paired difference; EVs
2-9 are confounds which model out each
subject’s mean
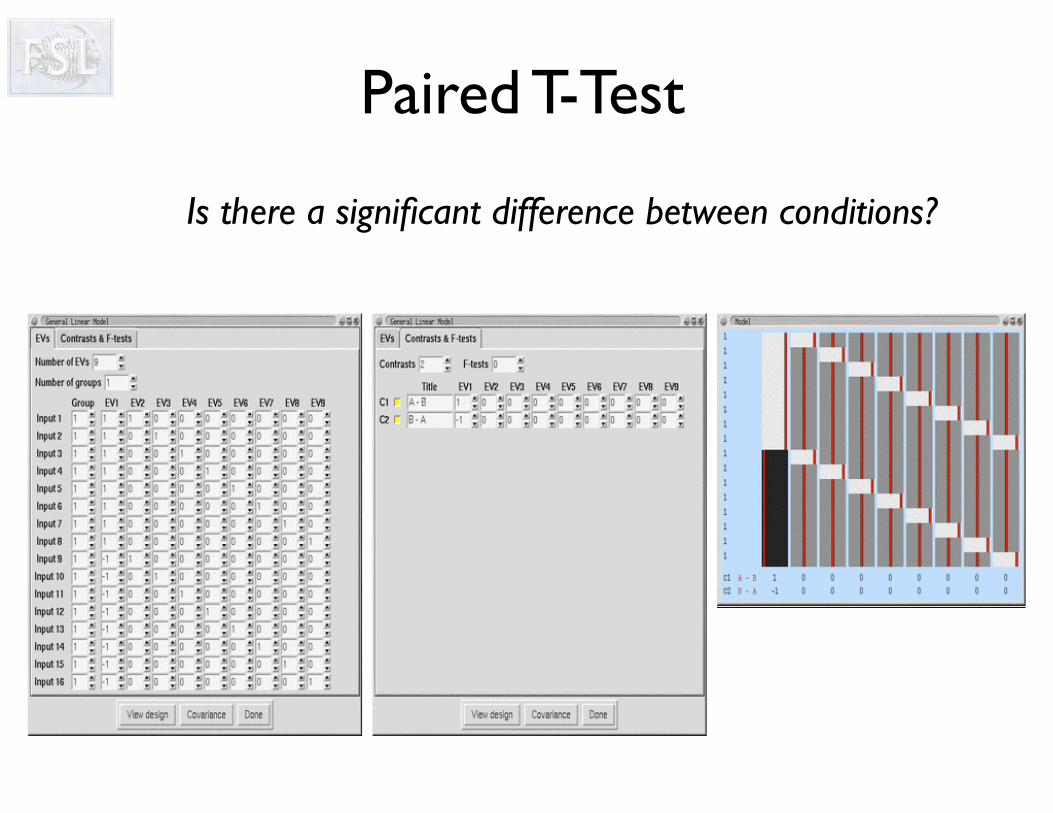
Paired T-Test
Is there a significant difference between conditions?
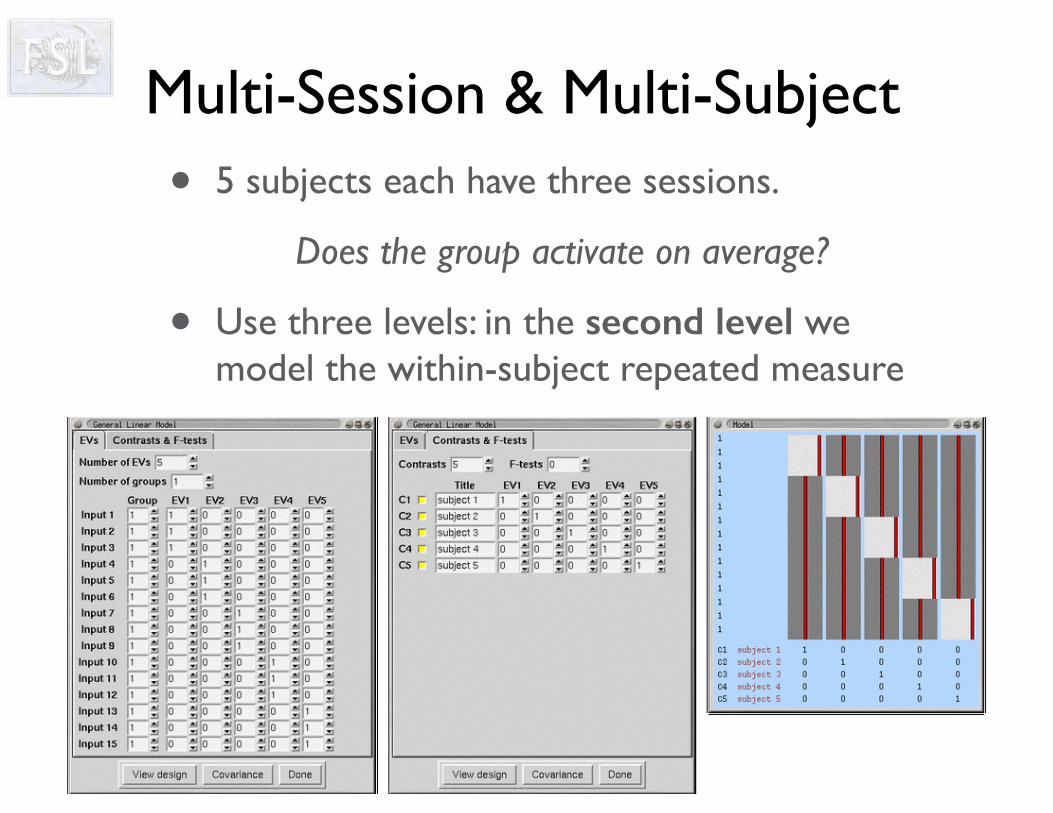
Multi-Session & Multi-Subject• 5 subjects each have three sessions.
Does the group activate on average?
• Use three levels: in the second level we model the within-subject repeated measure
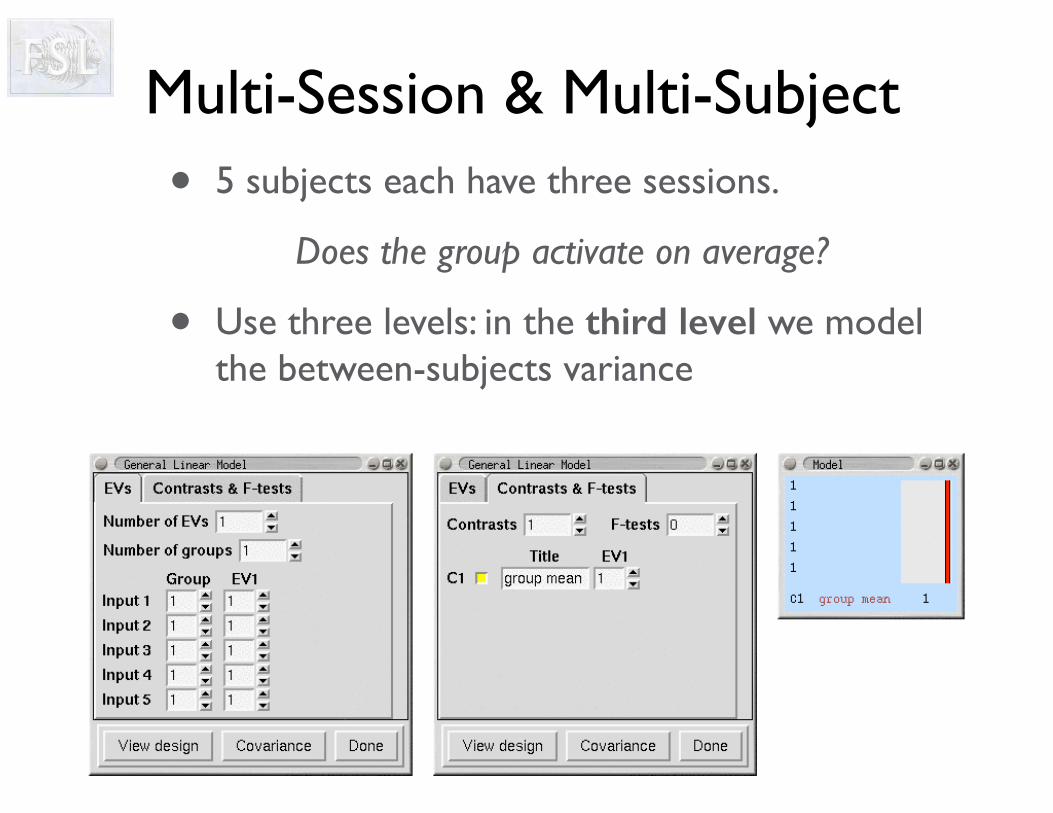
Multi-Session & Multi-Subject• 5 subjects each have three sessions.
Does the group activate on average?
• Use three levels: in the third level we model the between-subjects variance
Multi-Session & Multi-Subject
• 5 subjects each have three sessions.
• Does the group activate on average?
• Use three levels:
• in the second level we model the within subject repeated measure typically using fixed effects(!) as #sessions are small
• in the third level we model the between subjects variance using fixed or mixed effects

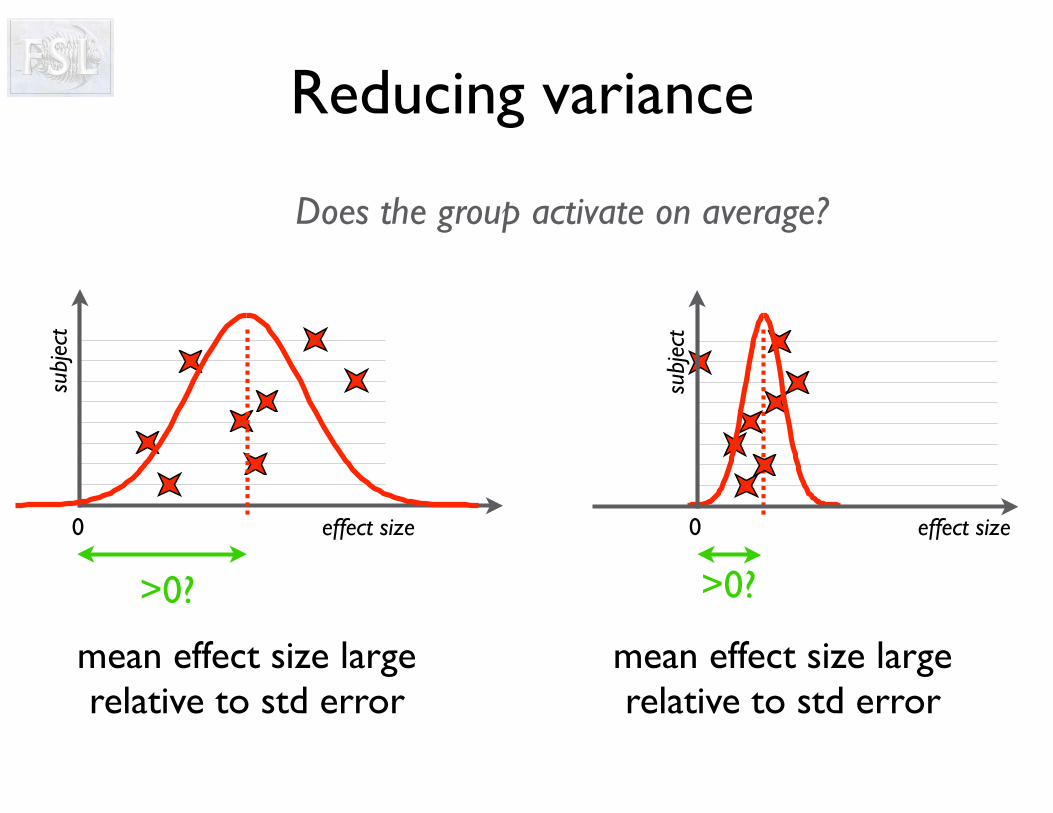
Reducing variance
Does the group activate on average?
mean effect size smallrelative to std error
mean effect size largerelative to std error
0
subj
ect
effect size
>0?
0
subj
ect
effect size
>0?
mean effect size largerelative to std error
Reducing variance
Does the group activate on average?
mean effect size largerelative to std error
0
subj
ect
effect size
>0?
0
subj
ect
effect size
>0?
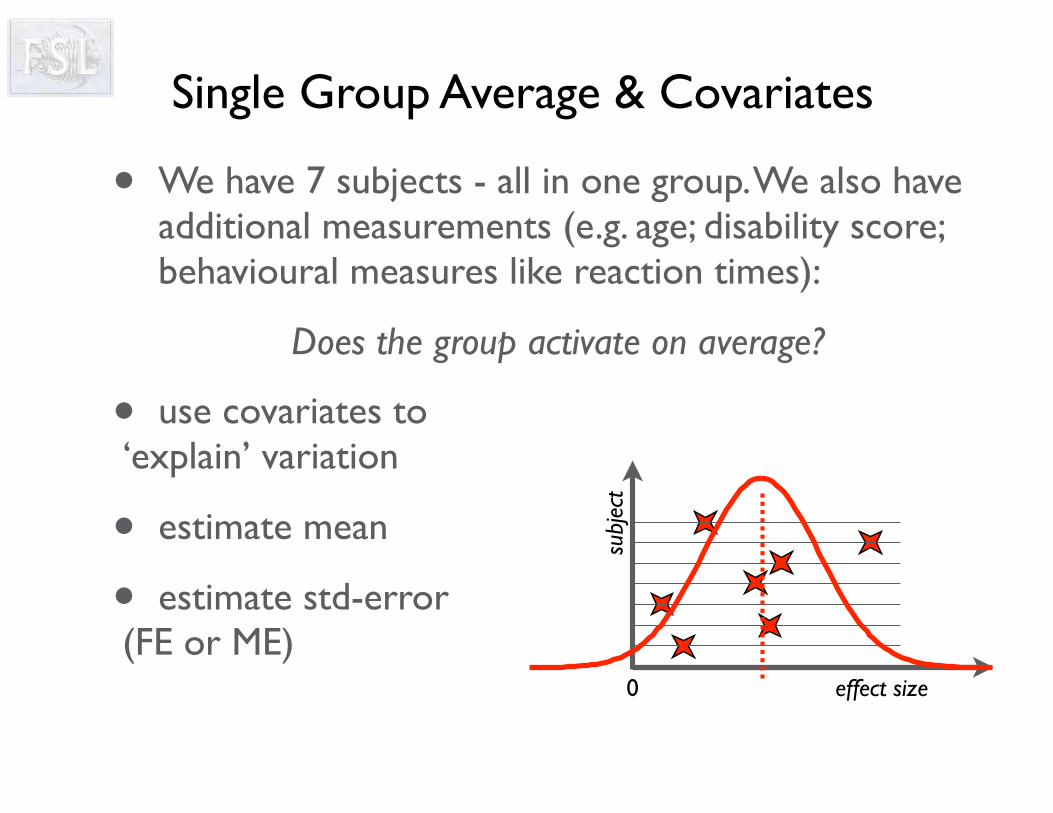
• We have 7 subjects - all in one group. We also have additional measurements (e.g. age; disability score; behavioural measures like reaction times):
Does the group activate on average?
• use covariates to ‘explain’ variation
• estimate mean
• estimate std-error(FE or ME)
0
subj
ect
effect size
Single Group Average & Covariates
fastRTslow
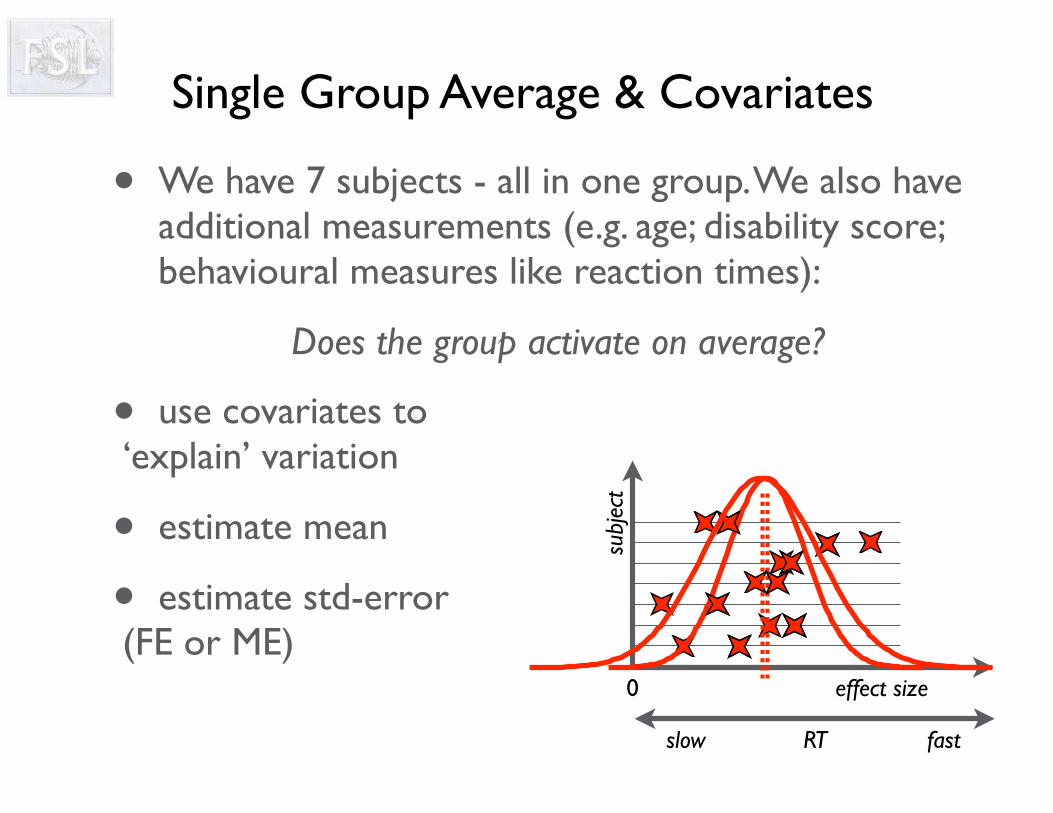
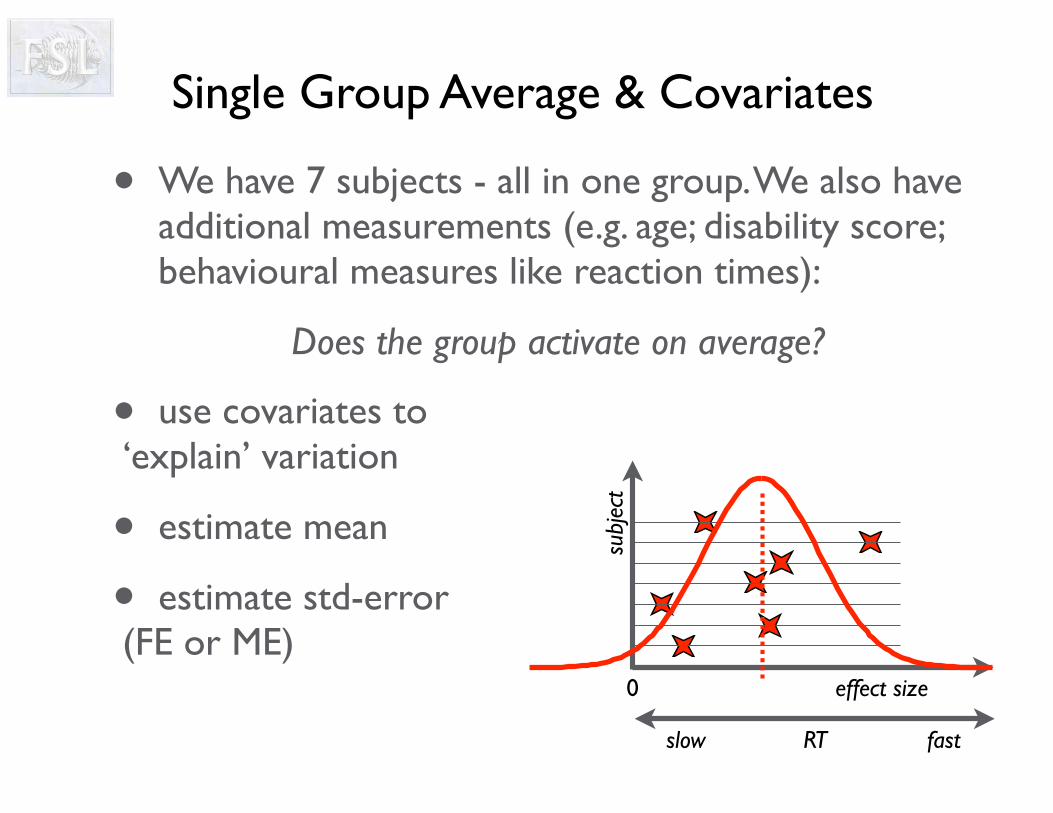
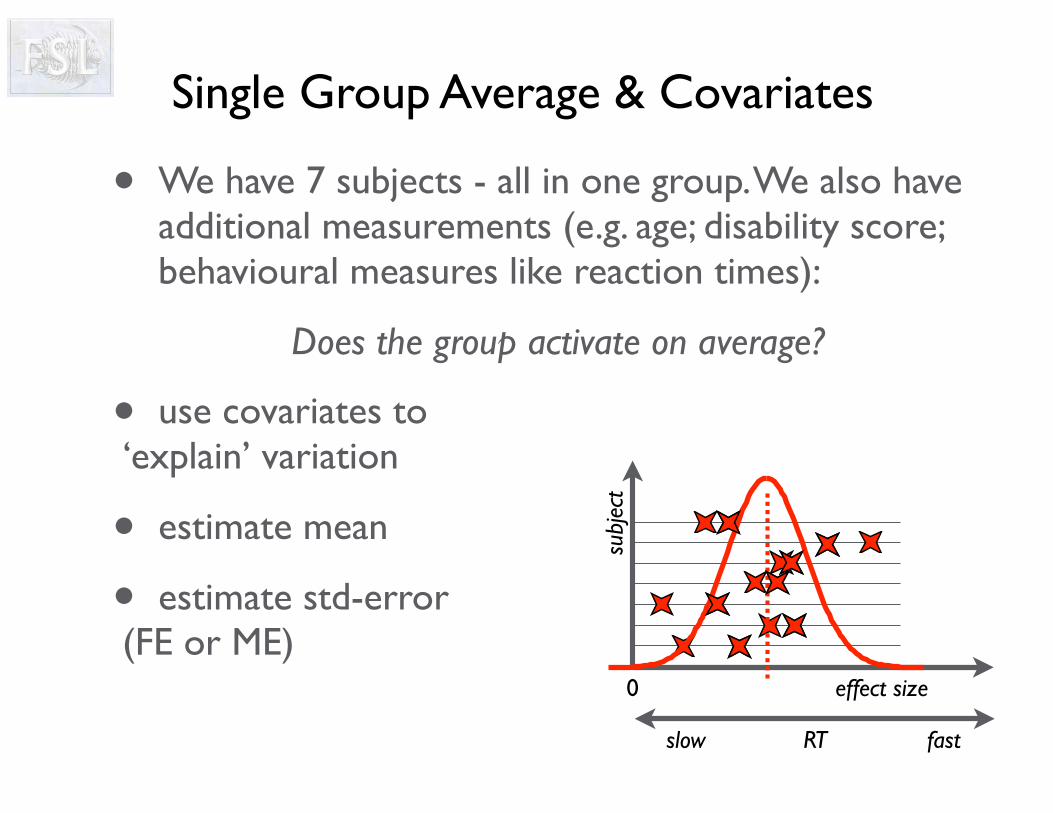
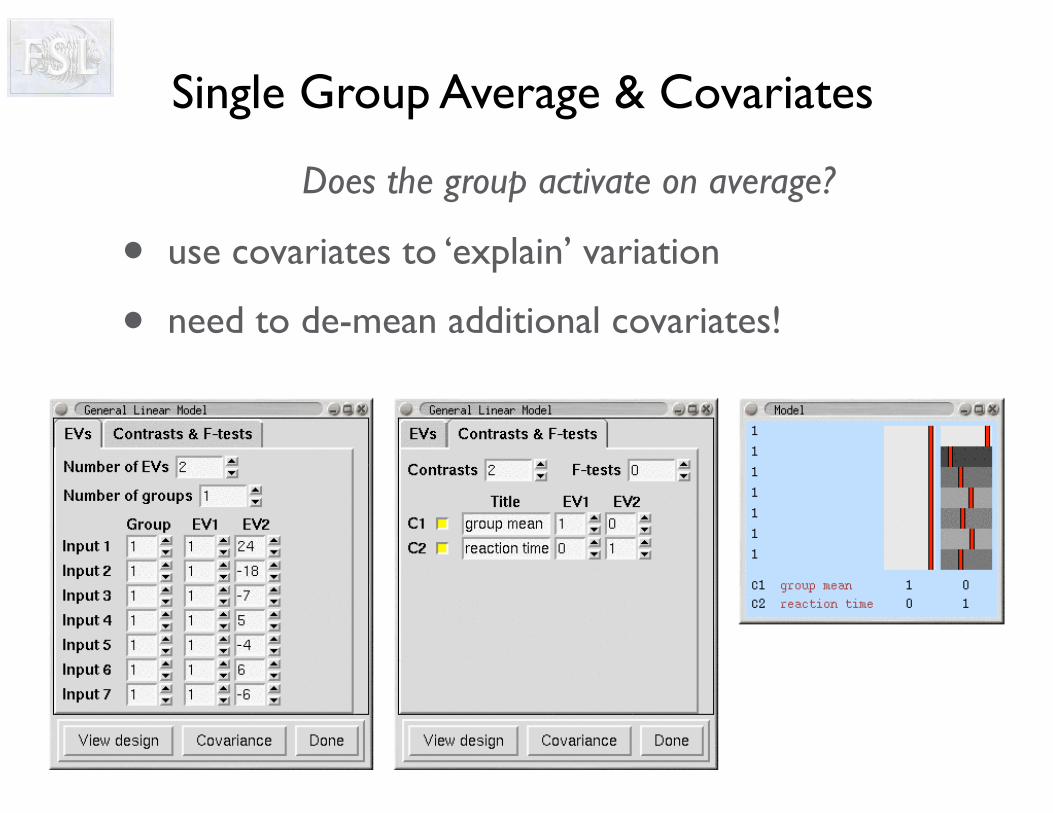
Does the group activate on average?
• use covariates to ‘explain’ variation
• need to de-mean additional covariates!
Single Group Average & Covariates
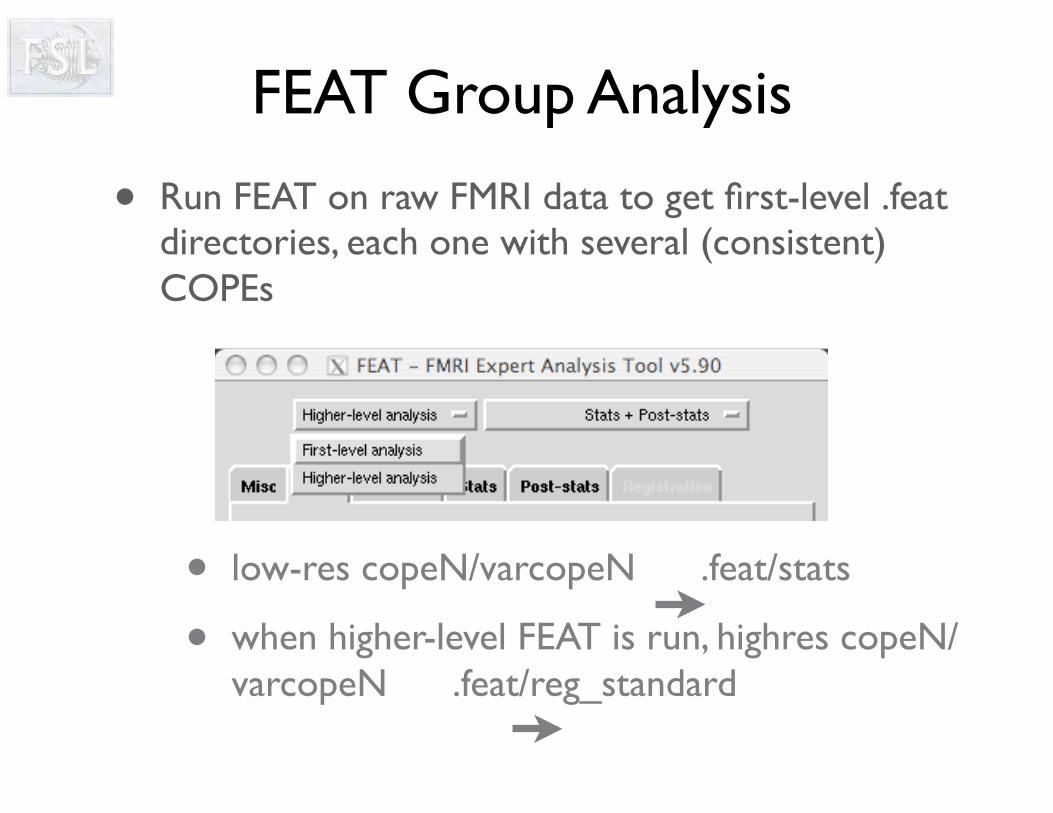
• Run FEAT on raw FMRI data to get first-level .feat directories, each one with several (consistent) COPEs
• low-res copeN/varcopeN .feat/stats
• when higher-level FEAT is run, highres copeN/varcopeN .feat/reg_standard
FEAT Group Analysis
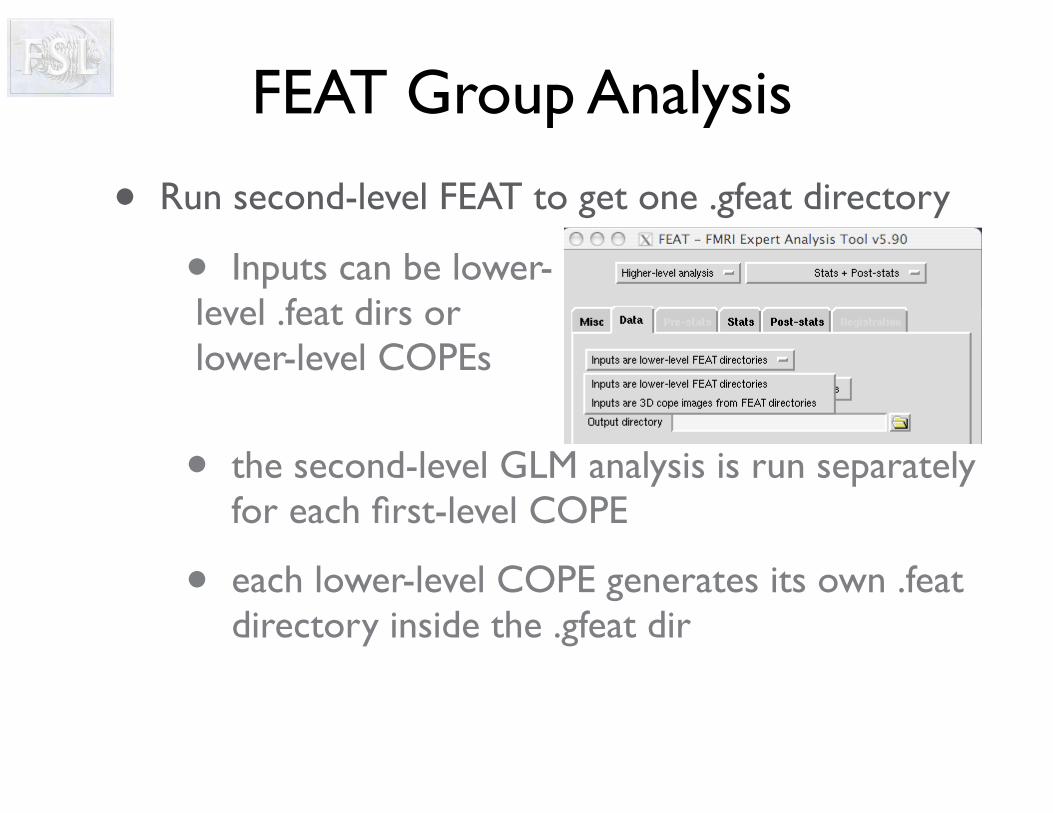
FEAT Group Analysis
• Run second-level FEAT to get one .gfeat directory
• Inputs can be lower-level .feat dirs or lower-level COPEs
• the second-level GLM analysis is run separately for each first-level COPE
• each lower-level COPE generates its own .feat directory inside the .gfeat dir
That’s all folks
Appendix:
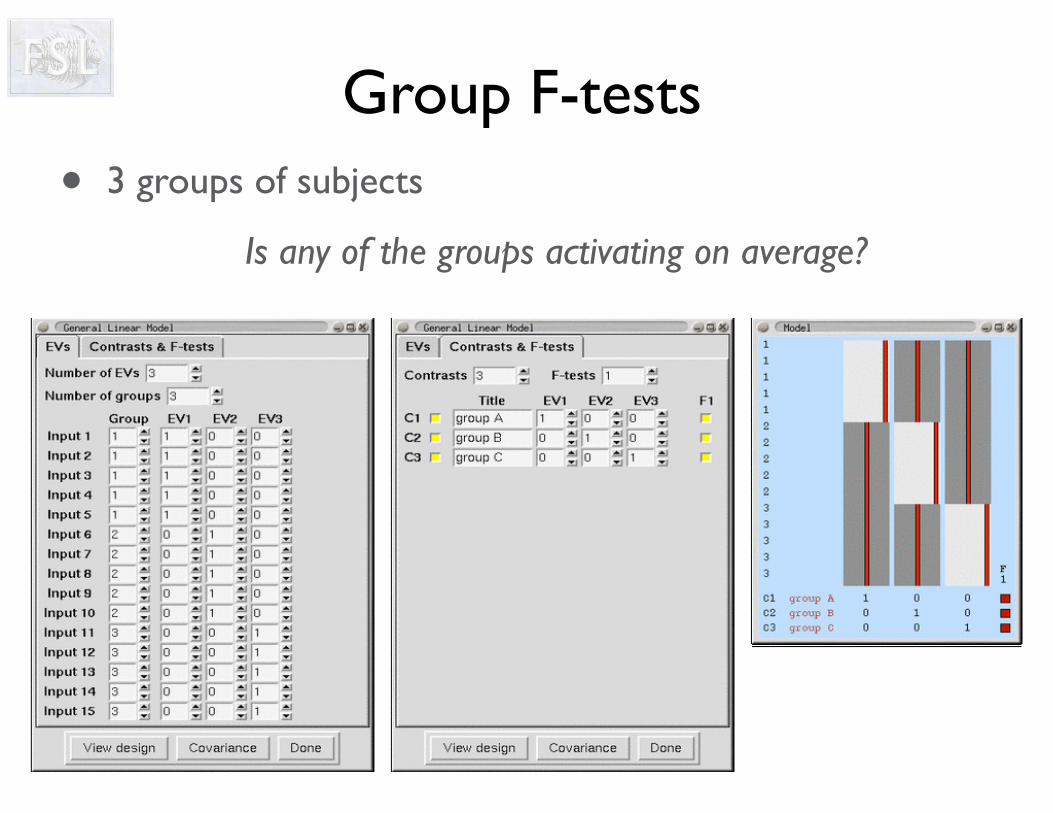
Group F-tests• 3 groups of subjects
Is any of the groups activating on average?
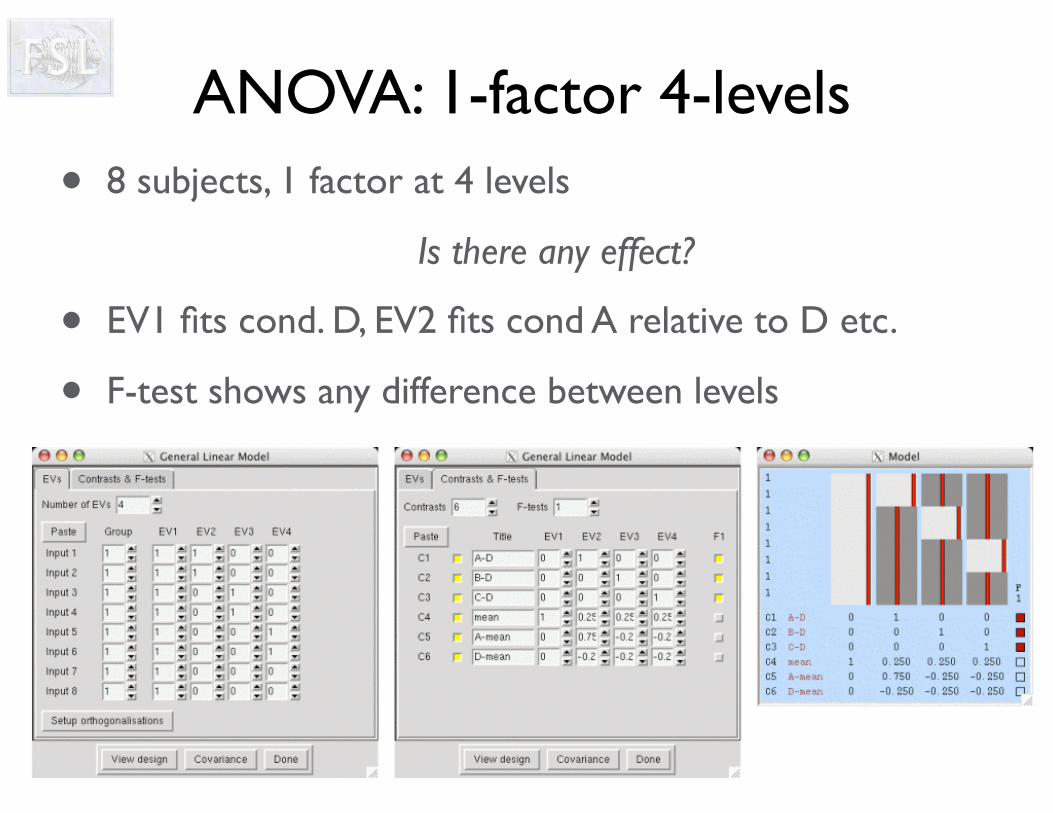
ANOVA: 1-factor 4-levels• 8 subjects, 1 factor at 4 levels
Is there any effect?
• EV1 fits cond. D, EV2 fits cond A relative to D etc.
• F-test shows any difference between levels
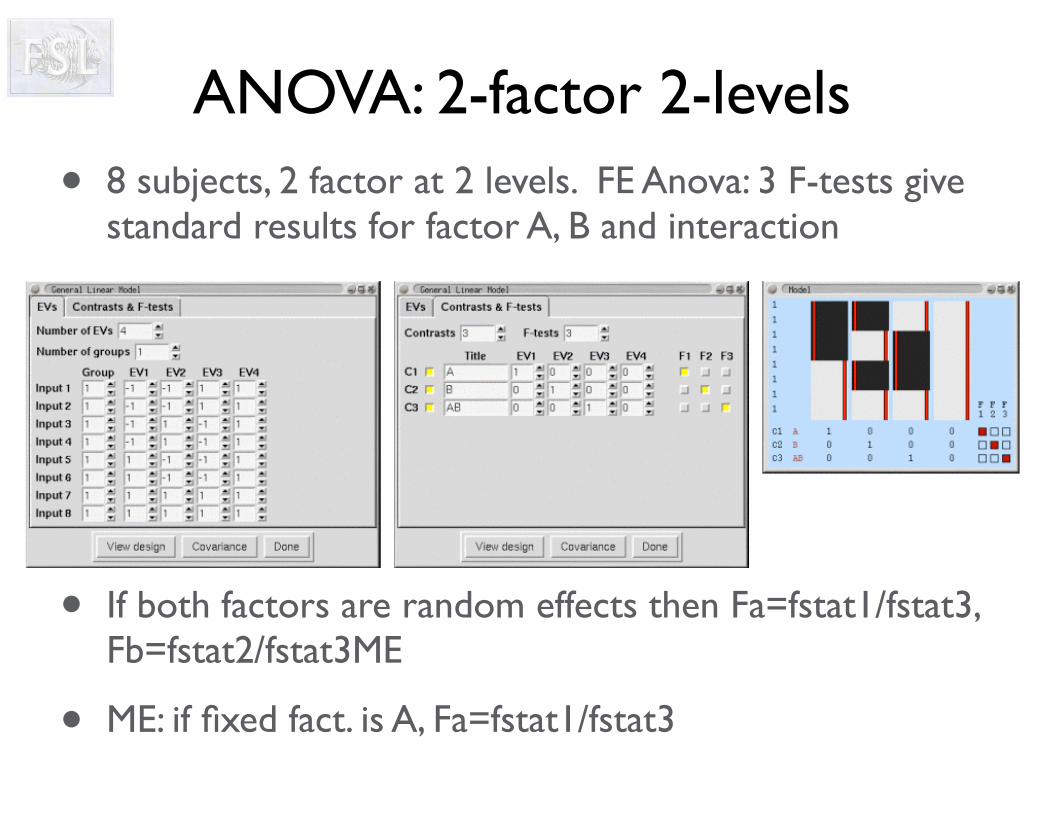
ANOVA: 2-factor 2-levels• 8 subjects, 2 factor at 2 levels. FE Anova: 3 F-tests give
standard results for factor A, B and interaction
• If both factors are random effects then Fa=fstat1/fstat3, Fb=fstat2/fstat3ME
• ME: if fixed fact. is A, Fa=fstat1/fstat3
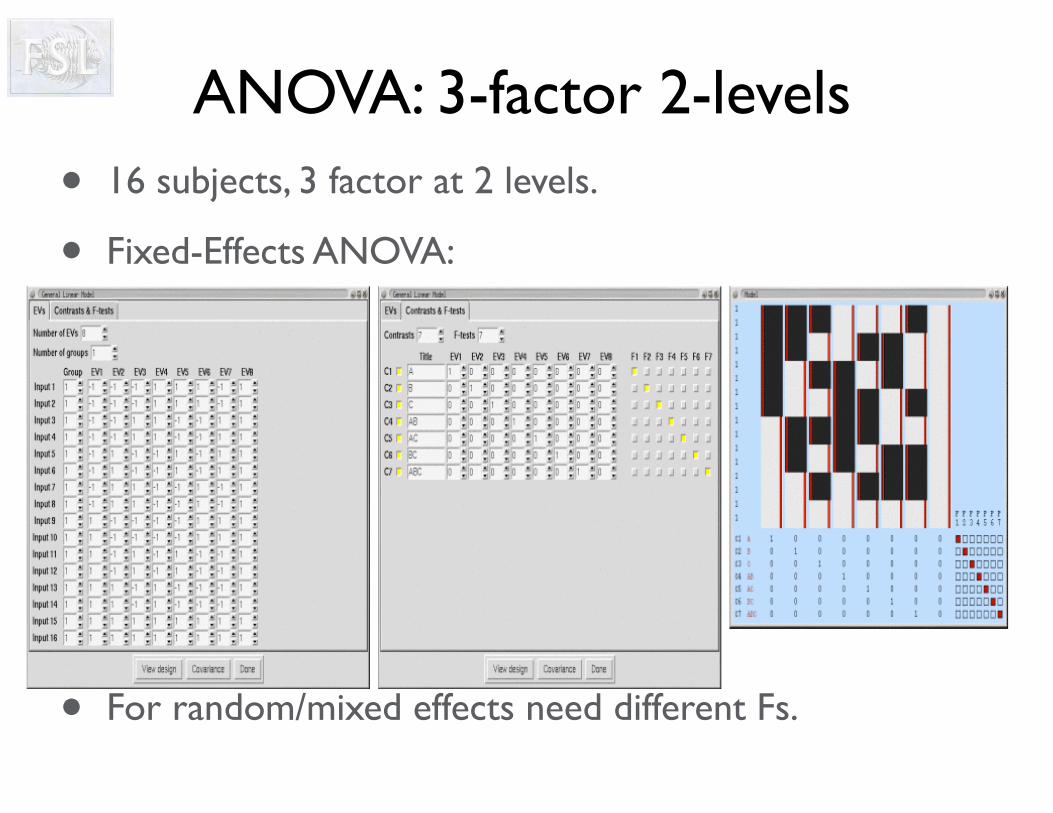
ANOVA: 3-factor 2-levels• 16 subjects, 3 factor at 2 levels.
• Fixed-Effects ANOVA:
• For random/mixed effects need different Fs.

Understanding FEAT dirs
• First-level analysis:
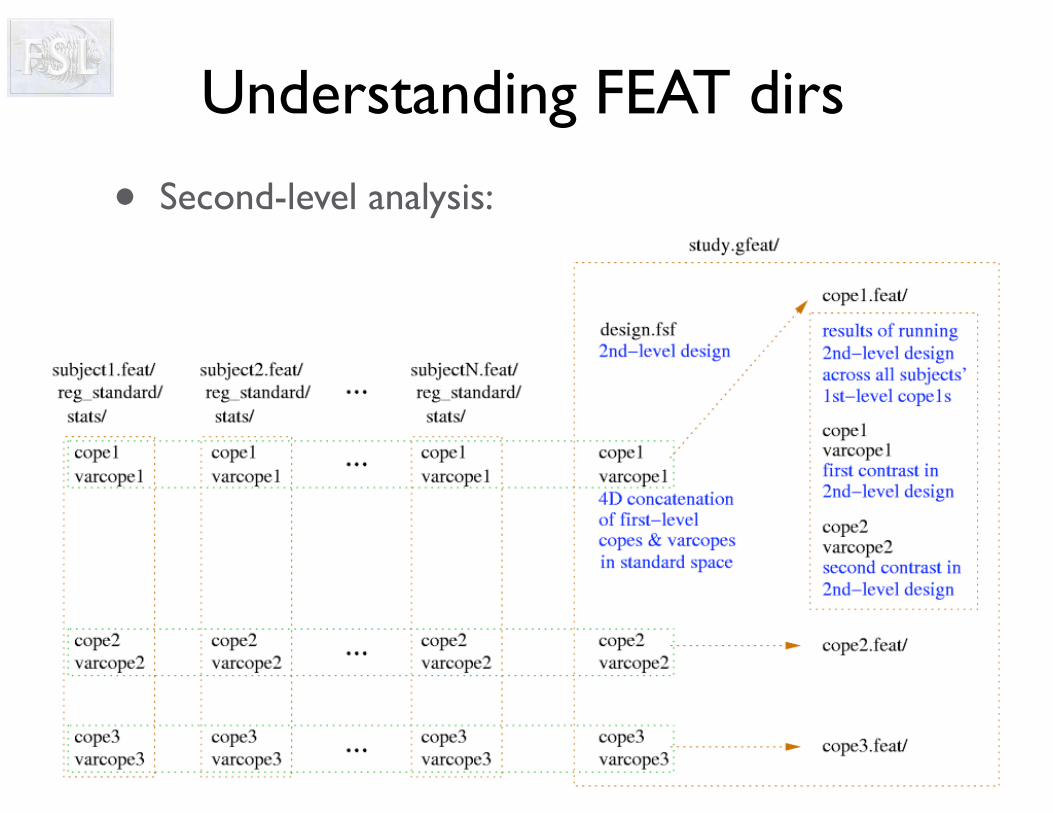
Understanding FEAT dirs
• Second-level analysis:

That’s all folks