fnx mining company inc. victoria advanced exploration
TRANSCRIPT

July 2015
FNX MINING COMPANY INC. VICTORIA ADVANCED EXPLORATION PROJECT
Emission Summary and Dispersion Modelling Report Version 2.0
RE
PO
RT
Report Number: 1419949
Distribution:
1 copy/1 e-copy - FNX Mining Company Inc. 1 copy - Golder Associates Ltd.
This report documents the compliance status of the Facility as of December 2015.
Submitted to:
FNX Mining Company Inc. 1300 Kelly Lake Road Sudbury, Ontario P3E 5P4

EMISSION SUMMARY AND DISPERSION MODELLING REPORT
Report No. 1419949 Version 2.0
Document Version Control
This Emission Summary and Dispersion Modelling (ESDM) Report documents the operations at the FNX Mining Company Inc. (FNX) Victoria Advanced Exploration Project in Denison Township in Sudbury, Ontario (the Facility) and has been prepared in accordance with s.26 of Ontario Regulation 419/05 (O. Reg. 419/05) to document compliance with s. 20 of O. Reg. 419/05. The Report is a living document and should be kept up-to-date at all times. Therefore, it is necessary to have appropriate version control. This version control will allow facility personnel, compliance auditors, or the Ontario Ministry of the Environment and Climate Change (MOECC) to track and monitor ESDM Report changes over time.
As facility operations change and sources are added to or removed from the Facility, this ESDM Report will be updated as required. These changes will be documented in a Modification Log. The Modification Log is included in Appendix A. Changes listed in the Modification Log have been incorporated into the ESDM Report. When the ESDM Report is updated, the version number will be changed to correspond with the information in the Modification Log.
Version Date Revision Description Prepared By
Reviewed By
(Facility
Contact)
1.0 April 2012 Original ESDM Report to support the ECA Application
N. Hamilton Golder Associates Ltd.
V. Felix FNX Mining
Company Inc.
2.0 July 2015
Updates to operations at the site including changes to generators and comfort
heating equipment, addition of a crushing plant and water
treatment plant, and changes to mine ventilation exhausts
Update to the current MOECC-accepted regulatory version of AERMOD and its
pre-processors
D. Corelli Golder Associates Ltd
V. Felix FNX Mining
Company Inc.

EMISSION SUMMARY AND DISPERSION MODELLING REPORT
July 2015 Report No. 1419949 Version 2.0 i
Executive Summary
This Emission Summary and Dispersion Modelling (ESDM) Report update was prepared to reflect modifications made by FNX Mining Company Inc. (FNX) at the Victoria Advanced Exploration Project (the Facility) under the Limited Operational Flexibility (LOF) of Environmental Compliance Approval (ECA) Number 8794-8VFJ7B, issued July 2, 2014. This ESDM Report, along with the appended Modification Log, satisfy Condition 4.1 of the ECA.
The contents of this ESDM Report satisfy the requirements of s.26 of Ontario Regulation (O.Reg.) 419/05. In addition, guidance in the Ontario Ministry of the Environment and Climate Change (MOECC) publication Guideline A-10: Procedure for Preparing an Emission Summary and Dispersion Modelling (ESDM) Report,
Version 3.0, dated March 2009 (ESDM Procedure Document) PIBS 3614e03 was followed, as appropriate.
The Facility includes site preparation and the installation of surface facilities and underground workings to support future mining operations. It can operate up to 24 hours per day, seven days per week, 52 weeks per year and is permitted with LOF to a maximum extraction limit of 401,500 tonnes per year. The Facility is expected to emit particulate matter and products of combustion. The North American Industry Classification System (NAICS) code that best applies to the Facility is 2122 (Metal Ore Mining).
There are no equipment or activities at the Facility that are registered on the Environmental Activity and Sector Registry (EASR) and as such all equipment and activities are approved under the ECA.
A screening level assessment was completed for the emergency equipment at the Facility using the approach outlined in the Emergency Generator Checklist Supplement to Application for Approval, EPA s.9 PIBS 7976e, dated November, 2010. This assessment is provided Appendix E – Emergency Diesel Equipment Assessment.
The remaining equipment at the Facility is subject to s.20 of O.Reg.419/05, therefore, the Facility’s assessment of compliance was performed using the current MOECC-accepted regulatory versions of the AERMOD dispersion model (v.14134) and its pre-processors.
The maximum emission rates for each significant contaminant emitted from the significant sources were calculated in accordance with s.11 of O.Reg.419/05 and the data quality assessment follows the classification system outlined in the ESDM Procedure Document. Some of the sources were considered negligible in accordance with s.8 of O.Reg.419/05.
The modelling scenario, for the relevant averaging period, assumed operating conditions for the Facility that result in the highest concentration of each significant contaminant at a Point of Impingement (POI). A POI concentration for each significant contaminant emitted from the Facility was calculated based on the emission rate estimates and the output from the dispersion model; the results are presented in the Emission Summary Table in accordance with s.26 of O.Reg.419/05.
The POI concentrations listed in the Emission Summary Table were compared against the standards listed in Schedule 3 of O.Reg.419/05, as well as the applicable limits listed in the MOECC publication Summary of
Standards and Guidelines to support Ontario Regulation 419: Air Pollution - Local Air Quality (including
EMISSION SUMMARY AND DISPERSION MODELLING REPORT
July 2015 Report No. 1419949 Version 2.0 ii
Schedule 6 of O.Reg.419 on Upper Risk Thresholds), dated April 2012 (List of MOECC POI Limits). At 82%, nitrogen oxides have the highest predicted POI concentration relative to the corresponding MOECC POI Limit.
This ESDM Report demonstrates that the Facility can operate in compliance with s.20 of O.Reg.419/05.

EMISSION SUMMARY AND DISPERSION MODELLING REPORT
July 2015 Report No. 1419949 Version 2.0 iii
Table I: Emission Summary Table
Contaminant CAS No.
Total Facility
Emission Rate (g/s)
Air Dispersion
Model Used
Ave. Period (hours)
Maximum POI Conc.
(µg/m³)
POI Location
(See Figure 8)
MOECC POI Limit (µg/m³)
Limiting Effect
Regulation /Schedule
No.
Percentage of MOECC
Limit (%)
Ammonia 7664-41-7 2.22E+00 AERMOD 24 32.37 POI1 100 Health Schedule 3 32%
Carbon Monoxide 630-08-0 3.62E+00 AERMOD ½ 379.75 POI2 6000 Health Schedule 3 6%
Nitrogen Oxides 10102-44-0 4.07E+00 AERMOD 1 328.39 POI3 400 Health Schedule 3 82%
Nitrogen Oxides 10102-44-0 4.07E+00 AERMOD 24 50.08 POI4 200 Health Schedule 3 25%
PM N/A 6.11E-01 AERMOD 24 5.38 POI1 120 Visibility Schedule 3 4%
Sulphur Dioxide 7446-09-5 3.48E-01 AERMOD 1 28.89 POI2 690 Health and
Vegetation Schedule 3 <1%
Sulphur Dioxide 7446-09-5 3.48E-01 AERMOD 24 5.06 POI2 275 Health and
Vegetation Schedule 3 11%


EMISSION SUMMARY AND DISPERSION MODELLING REPORT CHECKLIST
PIBS 5357e * This checklist is taken from the document titled “Procedure for Preparing an Emission Summary and Dispersion Modelling Report” dated July, 2005
Required Information Submitted Explanation/Reference Executive Summary and Emission Summary Table 1.1 Overview of ESDM Report Yes Executive Summary 1.2 Emission Summary Table Yes Table 5, Page iv
1.0 Introduction and Facility Description 1.1 Purpose and Scope of ESDM Report Yes Section 1.1 1.2 Description of Processes and NAICS code(s) Yes Section 1.3 1.3 Description of Products and Raw Materials Yes Section 1.2 1.4 Process Flow Diagram Yes Section 1.3, Figure 2 1.5 Operating Schedule Yes Section 1.4
2.0 Initial Identification of Sources and Contaminants 2.1 Sources and Contaminants Identification Table Yes Section 2.1, Table 1
3.0 Assessment of the Significance of Contaminants and
Sources
Yes
3.1 Identification of Negligible Contaminants and Sources Yes Section 3.1 3.2 Rationale for Assessment Yes Section 3.2
4.0 Operating Conditions, Emission Estimating and Data Quality 4.1 Description of operating conditions, for each significant
contaminant that results in the maximum POI concentration for that contaminant
Yes Section 4.1
4.2 Explanation of Method used to calculate the emission rate for each contaminant
Yes Section 4.2
4.3 Sample calculation for each method Yes Section 4.3 4.4 Assessment of Data Quality for each emission rate Yes
5.0 Source Summary Table and Property Plan 5.1 Source Summary Table Yes Section 5.1, Table 2 5.2 Site Plan (scalable) Yes Section 5.1, Figure 3
6.0 Dispersion Modelling 6.1 Dispersion Modelling Input Summary Table Yes Section 6.1, Tables 1 & 3 6.2 Land Use Zoning Designation Plan Yes Figure 4 6.3 Dispersion Modelling Input and Output Files Yes Appendix D
7.0 Emission Summary Table and Conclusions 7.1 Emission Summary Table Yes Section 7.1, Table 5 7.2 Assessment of Contaminants with no MOECC POI Limits Yes Section 7.0 7.3 Conclusions Yes Section 8.0 Appendices Appendix A – Modification Log Yes Appendix B – Emission Rate Calculations Yes Appendix C – Supporting Information for Emission Rate Calculations Yes Appendix D – Dispersion Modelling Files (CD Only) Yes Appendix E – Emergency Diesel Equipment Assessment Yes Yes Yes

EMISSION SUMMARY AND DISPERSION MODELLING REPORT
July 2015 Report No. 1419949 Version 2.0 vi
Table of Contents
1.0 INTRODUCTION AND FACILITY DESCRIPTION ........................................................................................................... 1
1.1 Purpose and Scope of ESDM Report .................................................................................................................. 1
1.1.1 Summary of Modifications .............................................................................................................................. 1
1.2 Description of Processes and North American Industry Classification System Code(s) ...................................... 2
1.3 Process Flow Diagram ......................................................................................................................................... 2
1.4 Operating Schedule ............................................................................................................................................. 2
2.0 INITIAL IDENTIFICATION OF SOURCES AND CONTAMINANTS ................................................................................. 3
2.1 Sources and Contaminants Identification Table................................................................................................... 3
3.0 ASSESSMENT OF THE SIGNIFICANCE OF CONTAMINANTS AND SOURCES ......................................................... 3
3.1 Identification of Negligible Contaminants and Sources ........................................................................................ 3
3.2 Rationale for Assessment .................................................................................................................................... 3
4.0 OPERATING CONDITIONS, EMISSION ESTIMATING AND DATA QUALITY ............................................................... 3
4.1 Description of Operating Conditions .................................................................................................................... 3
4.2 Explanation of the Methods Used to Calculate Emission Rates .......................................................................... 4
4.3 Sample Calculations ............................................................................................................................................ 4
4.4 Assessment of Data Quality................................................................................................................................. 5
4.5 Conservatism of Emission Estimates and Operating Condition ........................................................................... 5
5.0 SOURCE SUMMARY TABLE AND SITE PLAN .............................................................................................................. 5
5.1 Source Summary Table ....................................................................................................................................... 5
5.2 Site Plan .............................................................................................................................................................. 5
6.0 DISPERSION MODELLING .............................................................................................................................................. 6
6.1 Dispersion Modelling Input Summary Table ........................................................................................................ 6
6.1.1 Dispersion Modelling Source Parameters ...................................................................................................... 7
6.1.2 Conservatism of Dispersion Modelling Source Parameters ........................................................................... 7
6.2 Land Use Zoning Designation Plan ..................................................................................................................... 7
6.3 Coordinate System .............................................................................................................................................. 7
6.4 Meteorology and Surrounding Land Use ............................................................................................................. 7
6.5 Terrain ................................................................................................................................................................. 8
6.6 Receptors ............................................................................................................................................................ 8

EMISSION SUMMARY AND DISPERSION MODELLING REPORT
July 2015 Report No. 1419949 Version 2.0 vii
6.7 Building Downwash ............................................................................................................................................. 9
6.8 Averaging Periods and Conversions .................................................................................................................... 9
6.9 Dispersion Modelling Options .............................................................................................................................. 9
6.10 Dispersion Modelling Input and Output Files ..................................................................................................... 10
7.0 EMISSION SUMMARY TABLE ...................................................................................................................................... 10
7.1 Emission Summary Table .................................................................................................................................. 10
8.0 CONCLUSIONS .............................................................................................................................................................. 10
TABLES
Table I: Emission Summary Table Table 1: Sources and Contaminants Identification Table Table 2: Source Summary Table Table 3: Dispersion Modelling Input Summary Table Table 4: Dispersion Modelling Source Summary Table Table 5: Emission Summary Table
FIGURES
Figure 1 – Site Location Plan Figure 2 – Process Flow Diagram Figure 3 – Site Plan Figure 4 – Land Use Zoning Plan Figure 5 – Dispersion Modelling Plan Figure 6 – 3 km Satellite Image Figure 7 – Terrain Elevations Figure 8 – Dispersion Modelling Receptors and POI Locations
APPENDICES
APPENDIX A Modification Log
APPENDIX B Emission Rate Calculations
APPENDIX C Supporting Information for Emission Rate Calculations
APPENDIX D Dispersion Modelling Files (CD Only)
APPENDIX E Emergency Diesel Equipment Assessment

EMISSION SUMMARY AND DISPERSION MODELLING REPORT
July 2015 Report No. 1419949 Version 2.0 1
1.0 INTRODUCTION AND FACILITY DESCRIPTION
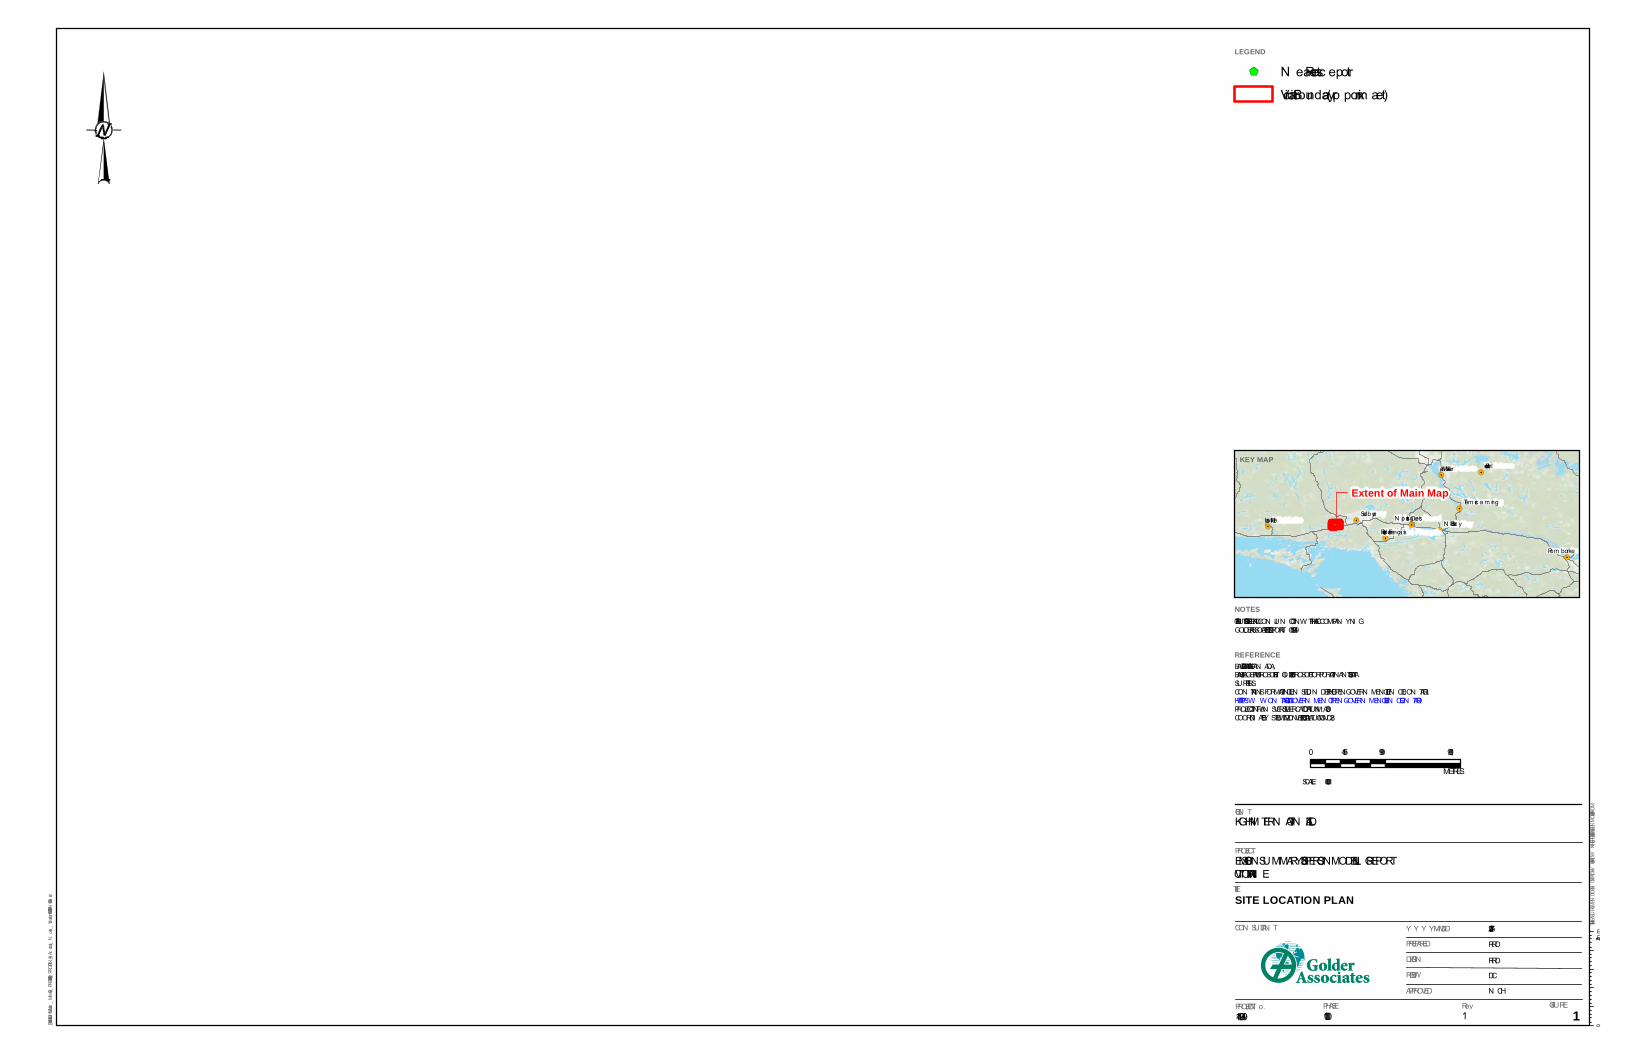
FNX Mining Company Inc. (FNX) operates the Victoria Advanced Exploration Project located in Denison Township, Ontario (the Facility). The location of the Facility is presented in Figure 1 – Site Location Plan.
1.1 Purpose and Scope of ESDM Report
The Facility currently operates under Environmental Compliance Approval (ECA) with Limited Operational Flexibility No. 8794-8VFJ7B, issued on July 2, 2014. The Limited Operational Flexibility (LOF) for the Facility expires on August 6, 2023. Condition 4.1 of the ECA requires FNX to maintain the following documentation:
a) an ESDM Report that demonstrates compliance with the Performance Limits for the Facility;
b) an up-to-date log that describes each modification to the Facility; and
c) a record of the changes to the ESDM Report that documents how each Modification is in compliance with the Performance Limits specified in s.3.2 of the ECA.
This Emission Summary and Dispersion Modelling (ESDM) Report, along with the Modification Log found in Appendix A, satisfies ECA Condition 4.1.
The contents of this ESDM Report satisfy the requirements of s.26 of Ontario Regulation (O.Reg.) 419/05. In addition, guidance in the Ontario Ministry of the Environment and Climate Change (MOECC) publication Guideline A-10: Procedure for Preparing an Emission Summary and Dispersion Modelling (ESDM) Report,
Version 3.0, dated March 2009 (ESDM Procedure Document) PIBS 3614e03 was followed, as appropriate.
A screening level assessment was completed for the emergency equipment at the Facility using the approach outlined in the Emergency Generator Checklist Supplement to Application for Approval, EPA s.9 PIBS 7976e, dated November, 2010. This assessment is provided in Appendix E – Emergency Diesel Equipment Assessment.
The remaining equipment at the Facility is subject to s.20 of O.Reg.419/05, therefore, the Facility’s assessment of compliance was performed using the most current MOECC-accepted regulatory version of the AERMOD dispersion model (version 14134) and its pre-processors.
The information provided in this report could be used to derive proprietary information on FNX as well as production numbers at the Facility. This information is thus considered to be a trade secret and of a proprietary nature by FNX. It is therefore requested that it be held in confidence and not released to anyone outside of the review procedure without prior consent of FNX. This request relies on Section 17 of the Ontario Freedom of
Information and Protection of Individual Privacy Act.
1.1.1 Summary of Modifications
The following modifications were made since Version 1.0 of this report:
removal of ready mix batching activities;

EMISSION SUMMARY AND DISPERSION MODELLING REPORT
July 2015 Report No. 1419949 Version 2.0 2
changes to the mine ventilation exhausts;
changes to comfort heating equipment;
changes to diesel power equipment;
addition of crushing and material handling activities; and
addition of a water treatment plant.
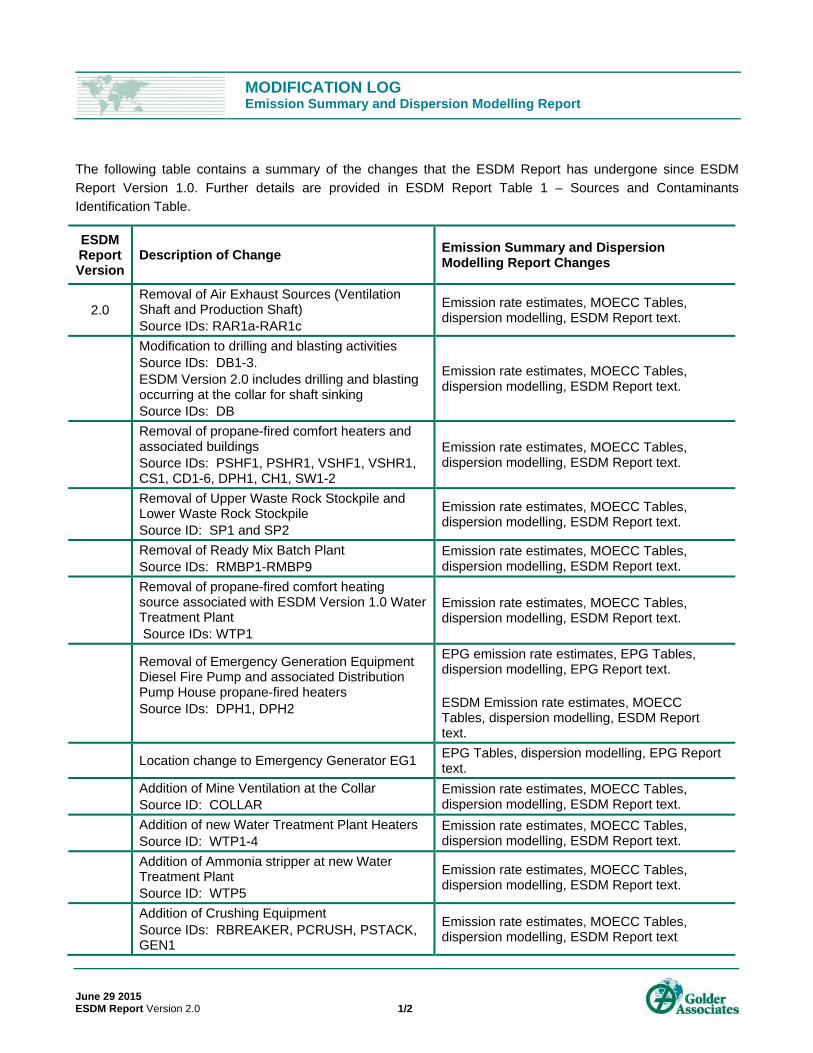
Appendix A contains a Modification Log which summarizes in more detail the changes that the ESDM Report has undergone since ESDM Report Version 1.0.
1.2 Description of Processes and North American Industry Classification System Code(s)
FNX operates an advanced exploration underground mining project. The project involves site preparation and the installation of surface facilities and underground workings to support future mining operations. The maximum material extraction limit for the Facility is 401,500 tonnes per year.
Surface operations and facilities include: shaft sinking drilling and blasting, mine ventilation installation, surface crushing operations and material handling. A water treatment plant will also be operated at the site.
There are also support operations at the Facility, namely: diesel generators to provide power, propane fired heating equipment, a maintenance shop/warehouse with some minor welding, as well as emergency back-up power equipment.
Product usages and process information are provided in detail in Appendix B – Emission Rate Calculations. Table 1 – Sources and Contaminants Identification Table contains a summary of the individual sources of emissions at the Facility.
The North American Industry Classification System (NAICS) code that best applies to the Facility is 2122 (Metal ore Mining).
1.3 Process Flow Diagram
A process flow diagram is provided in Figure 2 – Process Flow Diagram.
1.4 Operating Schedule
The Facility operates 24 hours per day, seven days a week, up to 52 weeks per year.

EMISSION SUMMARY AND DISPERSION MODELLING REPORT
July 2015 Report No. 1419949 Version 2.0 3
2.0 INITIAL IDENTIFICATION OF SOURCES AND CONTAMINANTS
2.1 Sources and Contaminants Identification Table
Table 1 – Sources and Contaminants Identification Table includes all the potential emission sources at the Facility. The expected contaminants emitted from each source are also identified in Table 1. Each of the identified sources has been assigned a source reference number.
There may be general ventilation from the Facility that only discharges uncontaminated air from the workspaces or air from the workspace that may include contaminants that come from commercial office supplies, building maintenance products or supplies and activities; these types of ventilation sources are considered to be negligible and were not identified as sources at the Facility. General ventilation located in the process area that does not vent process emissions is also considered to be negligible.
3.0 ASSESSMENT OF THE SIGNIFICANCE OF CONTAMINANTS AND SOURCES
Contaminants and sources at the Facility were assessed for significance following the guidance outlined in the ESDM Procedure Document.
In accordance with s.8 of O.Reg.419/05, emission rate calculations and dispersion modelling does not have to be performed for emissions from negligible sources.
3.1 Identification of Negligible Contaminants and Sources
Sources and contaminants that are discharged from the Facility in negligible amounts were excluded from further analysis. Table 1 lists the sources and contaminants that were deemed insignificant and were not included in the modelling assessment for the Facility.
3.2 Rationale for Assessment
For each source and/or contaminant that has been deemed negligible, information required to substantiate this classification, including references to MOECC guidance where applicable, is also provided in Table 1.
4.0 OPERATING CONDITIONS, EMISSION ESTIMATING AND DATA QUALITY
4.1 Description of Operating Conditions
Section 10 of O.Reg.419/05 states that an acceptable operating condition is a scenario in which operating conditions for the Facility would result, for the relevant contaminant, in the highest concentration of the contaminant possible at the point of impingement (POI). The operating condition described in this ESDM Report meets this requirement.

EMISSION SUMMARY AND DISPERSION MODELLING REPORT
July 2015 Report No. 1419949 Version 2.0 4
The maximum emission scenario for the dispersion modelling analysis includes all significant sources at the Facility operating simultaneously at their respective maximum rates. The following table outlines the maximum rates for each significant source of emissions as assessed herein.
Source Source ID(s) Maximum Rate
Fresh Air Heater FAR 1,100,000 Btu/hr propane fired
Drilling and Blasting DB
2 blasts of 61 m² per day 161 holes drilled per day 612 kg of bulk emulsion, 231 kg of ANFO used per blast
Propane Combustion WTP1-WTP4 1,200,000 Btu/hr total
Water Treatment Plant – Ammonia Stripper WTP5
1,400 L/min circulation rate 100 mg/L inlet loading of ammonia 5 mg/L effluent ammonia concentration
Diesel Generators IDGEN1-3, IDGEN5-7, GEN1 993 kW total
Rock Breaker RBREAKER 20 tonnes/day Crushing PCRUSH, PSTACK 1000 tonnes/day Material Handling PAG_SP1, PAG_SP2 1000 tonnes/day each
The averaging periods for the maximum rates provided in the above table were selected based on the averaging periods for the MOECC POI Limits of the significant contaminants emitted from each source. The use of the above maximum rates to estimate emission rates of contaminants for each emission source results in an operating condition which satisfies section 10 of O.Reg.419/05. More details on the maximum operating rates are provided in Appendix B – Emission Rate Calculations.
4.2 Explanation of the Methods Used to Calculate Emission Rates
The maximum emission rates for each significant contaminant emitted from the significant sources were estimated in accordance with requirements of s.11 of O.Reg.419/05 and the ESDM Procedure Document. These rates and methods are summarized in Table 2 – Source Summary Table.
4.3 Sample Calculations
Sample calculations are presented in Appendix B – Emission Rate Calculations. All of the emission estimation methods are acceptable methods as outlined in the ESDM Procedure Document. Where the emission rate calculation relies on data that is not readily available, the data are provided in Appendix C – Supporting Information for Emission Rate Calculations.

EMISSION SUMMARY AND DISPERSION MODELLING REPORT
July 2015 Report No. 1419949 Version 2.0 5
4.4 Assessment of Data Quality
The data quality for each contaminant emission rate is documented in Table 2 – Source Summary Table and Appendix B – Emission Rate Calculations.
4.5 Conservatism of Emission Estimates and Operating Condition
The following assumptions were included in the development of the emission estimates and operating condition for the Facility:
The highest emission rate that each source is capable of (i.e. maximum usage rates or throughputs) was used to characterize the emissions.
All sources are assumed to be operating simultaneously at the corresponding maximum emission rate for the averaging period.
All fuel-fired combustion equipment (i.e. comfort heating and power) emission rates were determined using the highest emission factor, combined with the maximum thermal heat input or engine rating for each piece of equipment.
Based on the conservative assumptions summarized above and detailed in Appendix B – Emission Rate Calculations, the emission rates listed in Table 2 are not likely to be an underestimate of the actual emission rates.
5.0 SOURCE SUMMARY TABLE AND SITE PLAN
5.1 Source Summary Table
The emission rates for each source of significant contaminants are documented in Table 2 – Source Summary Table in accordance with requirements of sub paragraph 8 of s.26(1) of O.Reg.419/05.
5.2 Site Plan
A scaled site plan is provided in Figure 3. This figure presents the following:
the property boundary (coordinates for the property boundary are contained in the Dispersion Modelling Input File “RECEPTORS.REC” in Appendix D);
each significant source of significant contaminants;
the location, dimensions and elevation of every structure on the property; and
an indication of which structures contain sensitive receptors (if applicable).
Where reasonable, the location, dimensions, and elevations of only those on-site structures that may affect the dispersion of emissions from significant sources are included.

EMISSION SUMMARY AND DISPERSION MODELLING REPORT
July 2015 Report No. 1419949 Version 2.0 6
For ease of reference, each of the sources is labelled with the source reference number in Table 2 – Source Summary Table.
6.0 DISPERSION MODELLING
Dispersion modelling was conducted in accordance with the MOECC publication Guideline A-11: Air Dispersion
Modelling Guideline for Ontario, Version, 3.0, dated May 2015 (ADMGO) PIBS 5165e03.
The Facility is subject to s.20 of O.Reg.419/05, therefore the modelled impact to POI criteria are required to be assessed against Schedule 3 Standards using an advanced dispersion model such as AERMOD.
The AERMOD modelling system is made up of the AERMOD dispersion model, the AERMET meteorological pre-processor, the AERMAP terrain pre-processor, and the BPIP building downwash pre-processor. The version of the AERMOD model which was used in this assessment is the current MOECC-accepted regulatory version. The AERMET pre-processor was not used in this assessment; however the most current version of the appropriate pre-processed MOECC meteorological dataset was used.
The following is a list of the model and pre-processors which were used in this assessment, along with the version numbers of each:
AERMOD dispersion model (v. 14134); and
AERMAP surface pre-processor (v. 09040).
The BPIP building downwash pre-processor (v.04272) was not used as there are no buildings that may impact the dispersion of the one point source at the site.
The dispersion modelling was conducted in accordance with the ADMGO. A general description of the input data used in the dispersion model is provided below and summarized in Table 3.
The emission rates used in the dispersion model meet the requirements of s.11(1)1 of O.Reg.419/05, which requires that the emission rate used in the dispersion model be at least as high as the maximum emission rate that the source of contaminant is reasonably capable of for the relevant contaminant. These emission rates are further described in Appendix B – Emission Rate Calculations.
There are no sensitive receptors (e.g. child care facility, health care facility, senior's residence, long-term care facility or an educational facility) located at the Facility. Therefore, same structure contamination was not considered.
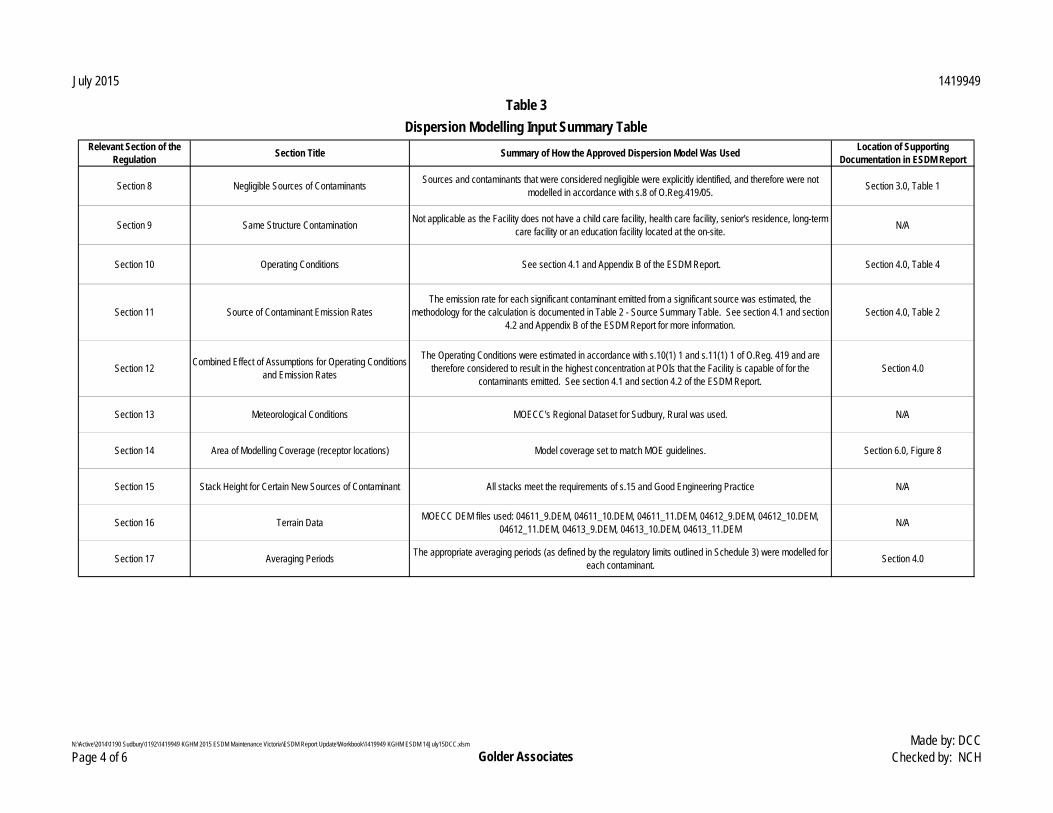
6.1 Dispersion Modelling Input Summary Table
A description of the way in which the approved dispersion model was performed is included as Table 3 – Dispersion Modelling Input Summary Table. This table meets both the requirements of s.26(1)11 and sections 8-17 of O.Reg.419/05 and follows the format provided in the ESDM Procedure Document.

EMISSION SUMMARY AND DISPERSION MODELLING REPORT
July 2015 Report No. 1419949 Version 2.0 7
6.1.1 Dispersion Modelling Source Parameters
The source parameter data required for each source was determined according to the procedures provided in ADMGO. Furthermore, the dispersion modelling input parameters are summarized in Table 4 – Dispersion Modelling Source Summary Table.
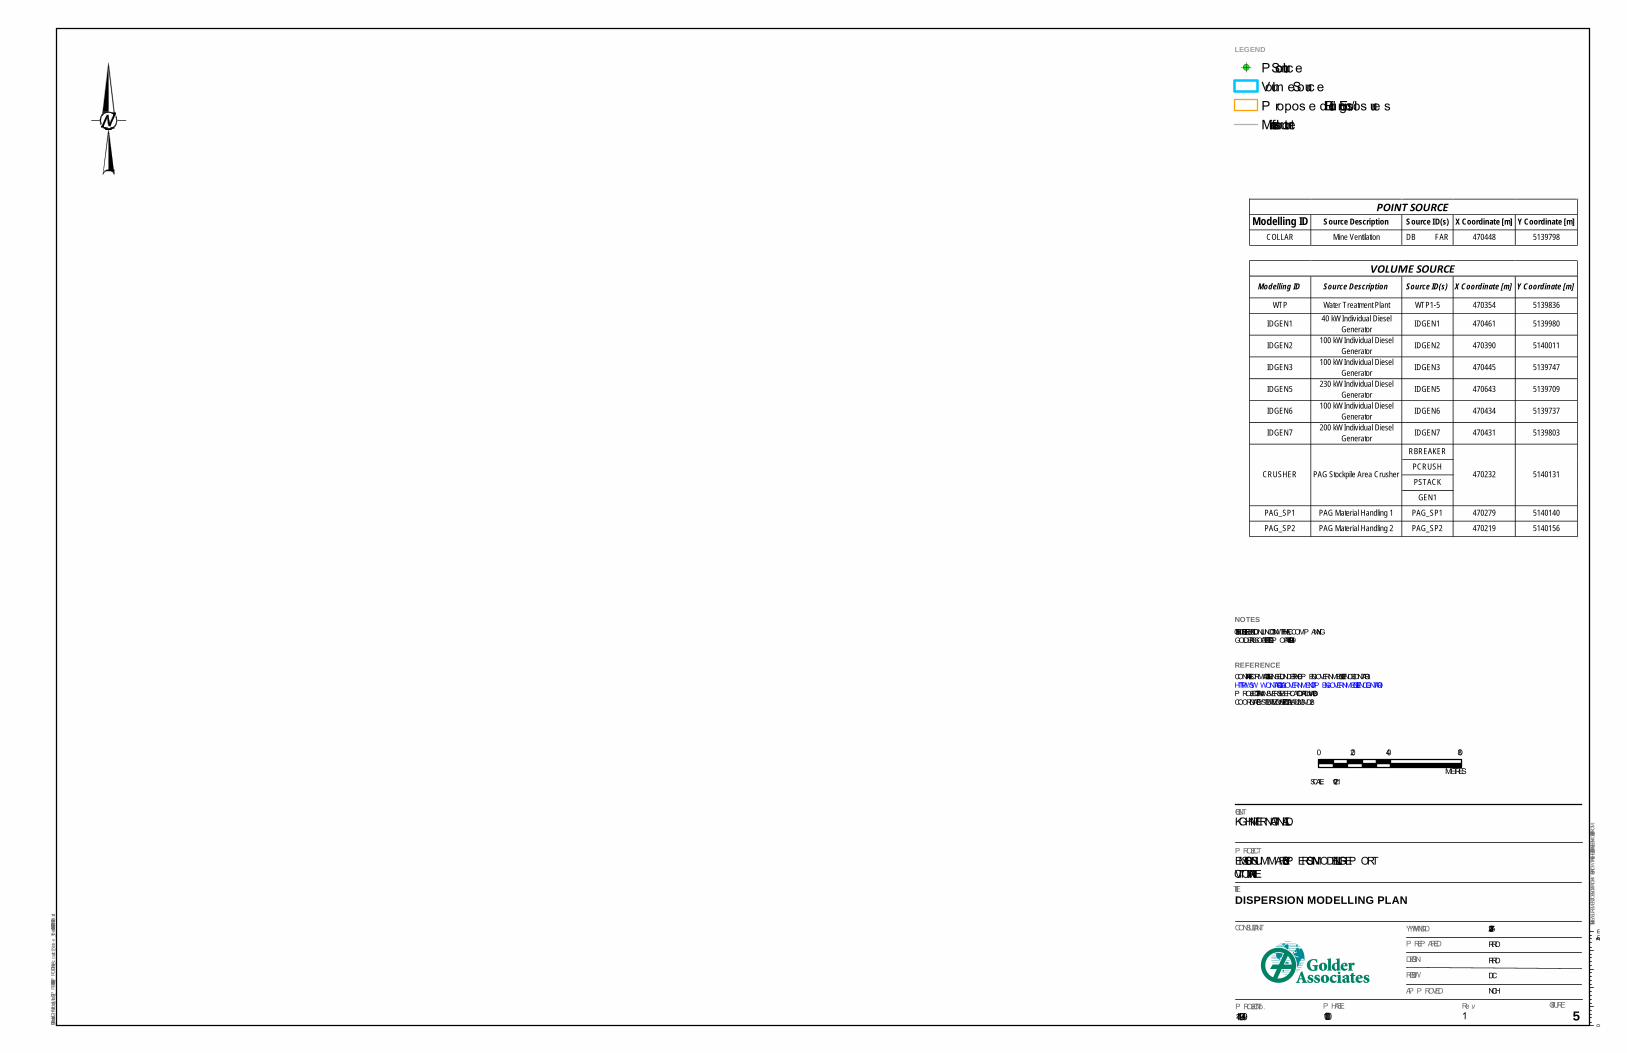
There is one point source and 10 volume sources, as presented in Figure 5 – Dispersion Modelling Plan. The stack parameters used for the point source are based on the current dimensions of the shaft opening. The volume source parameters are based on the dimensions of the buildings or enclosures associated with the generators and water treatment plant. The parameters for the crushing operations are based on the equipment working layout whereas the dimensions of the material handling volume sources are based on the size of the disturbed area within the storage pile while material handling would be occurring.
6.1.2 Conservatism of Dispersion Modelling Source Parameters
The following assumptions were included in the development of the conservative dispersion model inputs for the Facility:
most sources were modelled as volume sources, which is conservative since this model source type does not take advantage of favourable dispersion characteristics such as plume buoyancy and initial exit velocity of emissions; and
the location of the crushing and material handling sources was chosen to be the closest possible location to the property boundary. These sources will be located further into the site for the majority of the operating time.
6.2 Land Use Zoning Designation Plan
The land use designation of the site and surrounding area is presented in Figure 4 – Land Use Zoning Designation Plan.
6.3 Coordinate System
The Universal Transverse Mercator (UTM) coordinate system, as per Section 5.2.2 of the ADMGO, was used to specify model object sources, buildings and receptors. All coordinates were defined in the North American Datum of 1983 (NAD83).
6.4 Meteorology and Surrounding Land Use
Sub paragraph 10 of s.26(1) of O.Reg.419/05 requires a description of the local land use conditions if meteorological data, as described in paragraph 2 of s.13(l) of O.Reg.419/05, was used. In this assessment, the AERMOD model was run using a MOECC pre-processed five year dispersion meteorological dataset (i.e. surface and profile files), last updated in 2015, in accordance with paragraph 1 of s.13(1) of
EMISSION SUMMARY AND DISPERSION MODELLING REPORT
July 2015 Report No. 1419949 Version 2.0 8
O.Reg.419/05. As the Facility is located in the Northern MOECC Region, the meteorological dataset for Sudbury is used. Furthermore, the land use surrounding the Facility would be characterized as rural, as illustrated in Figure 6 – 3 km Satellite Image. As a result, MOECCs “Forest” meteorological dataset is used.
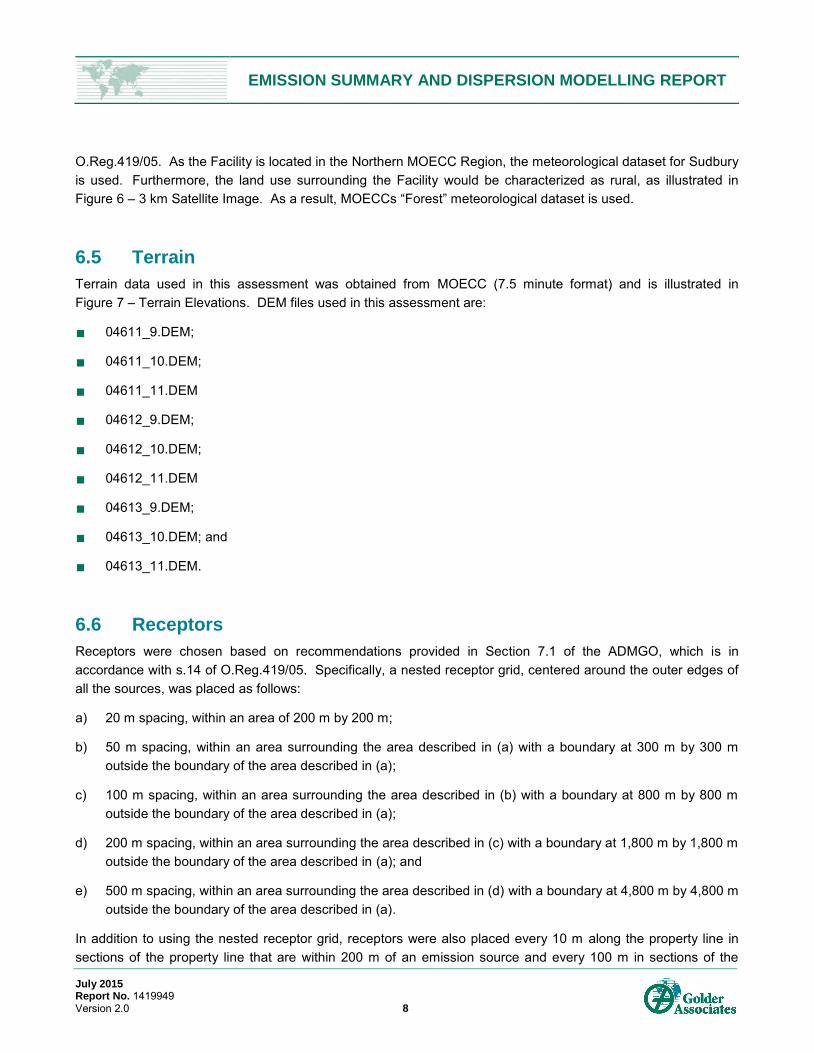
6.5 Terrain
Terrain data used in this assessment was obtained from MOECC (7.5 minute format) and is illustrated in Figure 7 – Terrain Elevations. DEM files used in this assessment are:
04611_9.DEM;
04611_10.DEM;
04611_11.DEM
04612_9.DEM;
04612_10.DEM;
04612_11.DEM
04613_9.DEM;
04613_10.DEM; and
04613_11.DEM.
6.6 Receptors
Receptors were chosen based on recommendations provided in Section 7.1 of the ADMGO, which is in accordance with s.14 of O.Reg.419/05. Specifically, a nested receptor grid, centered around the outer edges of all the sources, was placed as follows:
a) 20 m spacing, within an area of 200 m by 200 m;
b) 50 m spacing, within an area surrounding the area described in (a) with a boundary at 300 m by 300 m outside the boundary of the area described in (a);
c) 100 m spacing, within an area surrounding the area described in (b) with a boundary at 800 m by 800 m outside the boundary of the area described in (a);
d) 200 m spacing, within an area surrounding the area described in (c) with a boundary at 1,800 m by 1,800 m outside the boundary of the area described in (a); and
e) 500 m spacing, within an area surrounding the area described in (d) with a boundary at 4,800 m by 4,800 m outside the boundary of the area described in (a).
In addition to using the nested receptor grid, receptors were also placed every 10 m along the property line in sections of the property line that are within 200 m of an emission source and every 100 m in sections of the

EMISSION SUMMARY AND DISPERSION MODELLING REPORT
July 2015 Report No. 1419949 Version 2.0 9
property line that are greater than 200 m from an emission source. Only receptors located outside of the property line were considered. The area of modeling coverage is illustrated on Figure 8 – Dispersion Modelling Receptors and POI Locations.
AERMAP did not provide an elevation for one receptor point. This receptor is located significantly far away from any of the contaminant POI locations therefore it was removed from the AERMOD input files. The coordinates for this receptor are noted in the Dispersion Modelling Input File “RECEPTORS.REC” in Appendix D.
There is no child care facility, health care facility, senior's residence, long-term care facility or an educational facility located at the Facility. As such, same structure contamination was not considered. The nearest residence is located greater than 1 km from the Facility’s property line.
6.7 Building Downwash
BPIP building downwash was not used in this assessment, as building wake effects are not anticipated since most of the sources are modelled as volumes. Only the mine ventilation emissions were modelled as a point source (source ID COLLAR). As shown in Figure 3, there are no buildings in the area surrounding the source that would create building wake effects.
6.8 Averaging Periods and Conversions
Schedule 3 standards of O.Reg.419/05 apply to this Facility. Many of these standards are based on 1-hour and 24-hour averaging times, which are averaging times that are easily provided by AERMOD. In cases where a standard has an averaging period that AERMOD is not designed to predict (e.g. ½-hr or 30-day), a conversion to the appropriate averaging period would be completed using the MOECC recommended conversion factors, as documented in the ADMGO.
6.9 Dispersion Modelling Options
The options used in the AERMOD dispersion model are summarized in the table below.
Modelling Parameter Description Used in the
Assessment?
DFAULT Specifies that regulatory default options will be used Yes CONC Specifies that concentration values will be calculated Yes AVERTIME Time averaging periods calculated 1-hr, 24-hr
URBANOPT Allows the model to incorporate the effects of increased surface heating from an urban area on pollutant dispersion under stable atmospheric conditions
No

EMISSION SUMMARY AND DISPERSION MODELLING REPORT
July 2015 Report No. 1419949 Version 2.0 10
6.10 Dispersion Modelling Input and Output Files
Electronic copies of all input and output files are provided in Appendix D – Dispersion Modelling Files on compact disc (CD) only.
Individual model runs were conducted for the following contaminants:
Particulate matter (PM);
Carbon monoxide (CO);
Nitrogen oxide (NOx);
Sulphur dioxide (SO2); and
Ammonia.
7.0 EMISSION SUMMARY TABLE
7.1 Emission Summary Table
A POI concentration for each significant contaminant emitted from the Facility was calculated based on the emission rates listed in Table 2 – Source Summary Table and the output from the dispersion model. The results are presented in Table 5 – Emission Summary Table. POI locations are indicated in Figure 8 – Dispersion Modelling Receptors and POI locations.
The POI concentrations listed in Table 5 were compared against the MOECC POI Limits. At 82%, nitrogen oxides have the highest concentration relative to the corresponding MOECC POI Limit. There are no contaminants without MOECC POI Limits emitted from the Facility.
8.0 CONCLUSIONS
This ESDM Report was prepared in accordance with s.26 of O.Reg.419/05. In addition, guidance in the ESDM Procedure Document was followed, as appropriate.
The Facility is subject to s. 20 of O.Reg.419/05, contaminant emissions were assessed for their appropriate averaging periods using the AERMOD dispersion model.
All the emission rates listed in Table 2 – Source Summary Table correspond to the operating scenario which results in the maximum POI concentration from the site. For this reason and conservatisms discussed in s.4.5, the emission rates listed in Table 2 – Source Summary Table are not likely to be an underestimate of the actual emission rates.
A POI concentration for each significant contaminant emitted from the Facility was calculated based on the calculated emission rates and the output from the dispersion model. Conservatisms in the modelling approach are discussed in s.6.1.2. The results are presented in Table 5 – Emission Summary Table.

EMISSION SUMMARY AND DISPERSION MODELLING REPORT
July 2015 Report No. 1419949 Version 2.0 11
The POI concentrations listed in the Emission Summary Table were compared against published MOECC publication Summary of Standards and Guidelines to support Ontario Regulation 419: Air Pollution - Local Air
Quality (including Schedule 6 of O.Reg.419 on Upper Risk Thresholds), dated April 2012 (MOECC POI Limits). At 82%, nitrogen oxides have the highest predicted POI concentration relative to the corresponding MOECC POI Limit. There are no contaminants released by the Facility that are considered to be ‘Contaminants with No MOECC POI Limits’.
It is assumed that the conservative emission rates, when combined with the conservative operating conditions and conservative dispersion modelling assumptions, are not likely to under predict the concentrations at a POI. Therefore, this assessment demonstrates that the Facility can operate in compliance with s.20 of O.Reg.419/05.

June 2015 1419949
Rationale if Deemed Insignificant/Negligible
Source ID Source Description or Title General Location and Description Reference to section of the MOE Procedure Document
COLLAR Mine Ventilation Collar PM, Carbon Monoxide, Nitrogen Oxides, Sulphur Dioxide Yes Yes —
DB Drilling and Blasting Emissions attributed to Collar PM, Carbon Monoxide, Nitrogen Oxides, Sulphur Dioxide Yes Yes —
FAR Mine Air Heater Emissions attributed to Collar Products of Propane Combustion Yes Yes Only Nitrogen Oxides are modelled as per Section 7.1.1 of the ESDM Procedure DocumentWTP1 Water Treatment Plant Heater Water Treatment Plant Products of Propane Combustion Yes Yes Only Nitrogen Oxides are modelled as per Section 7.1.1 of the ESDM Procedure DocumentWTP2 Water Treatment Plant Heater Water Treatment Plant Products of Propane Combustion Yes Yes Only Nitrogen Oxides are modelled as per Section 7.1.1 of the ESDM Procedure DocumentWTP3 Water Treatment Plant Heater Water Treatment Plant Products of Propane Combustion Yes Yes Only Nitrogen Oxides are modelled as per Section 7.1.1 of the ESDM Procedure DocumentWTP4 Water Treatment Plant Heater Water Treatment Plant Products of Propane Combustion Yes Yes Only Nitrogen Oxides are modelled as per Section 7.1.1 of the ESDM Procedure DocumentWTP5 Water Treatment Plant Ammonia Strripper Water Treatment Plant Ammonia Yes Yes —
IDGEN1 40 kW Individual Diesel Generator North East Side of Main Site Products of Diesel Combustion Yes Yes —IDGEN2 100 kW Individual Diesel Generator North Side of Main Site Products of Diesel Combustion Yes Yes —IDGEN3 100 kW Individual Diesel Generator South Side of Main Site Products of Diesel Combustion Yes Yes —IDGEN5 230 kW Individual Diesel Generator South Side of Main Site Products of Diesel Combustion Yes Yes —IDGEN6 100 kW Individual Diesel Generator Construction Trailers Products of Diesel Combustion Yes Yes —IDGEN7 200 kW Individual Diesel Generator Construction Around Headframe Products of Diesel Combustion Yes Yes —
RBREAKER Rock Breaker PAG stockpile area PM Yes Yes —PCRUSH Primary Crusher PAG stockpile area PM Yes Yes —PSTACK Stacker PAG stockpile area PM Yes Yes —
GEN1 Primary Crusher Diesel Generator PAG stockpile area Products of Diesel Combustion Yes Yes —PAG_SP1 PAG Material Handling 1 PAG stockpile area PM Yes Yes —PAG_SP2 PAG Material Handling 2 PAG stockpile area PM Yes Yes —
WELD Maintenance Welding Shop PM, Metals No No As per Section 7.2.1 Appendix B Table B-3 of the ESDM Procedure DocumentPR1 Paved Roads Throughout the Site PM Yes No Facility implements a BMPP as per Section 7.4 of the ESDM Procedure Document
UPR1 Unpaved Roads Throughout the Site PM Yes No Facility implements a BMPP as per Section 7.4 of the ESDM Procedure DocumentSP Miscellaneous Overburden Stockpiles Throughout the Site PM No No Facility implements a BMPP as per Section 7.4 of the ESDM Procedure Document
EG1 3000 ekW/3750 kVA Emergency Generator South East Side of Main Site Nitrogen Oxides Yes No See Generator Assessment in Appendix E
Source InformationSources and Contaminants Identification Table
Table 1
Expected Contaminants Significant (Yes or No)
Modelled (Yes or No)
N:\Active\2014\1190 Sudbury\1192\1419949 KGHM 2015 ESDM Maintenance Victoria\ESDM Report Update\Workbook\1419949 KGHM ESDM 14July15DCC.xlsm
Page 1 of 6 Golder AssociatesMade by: DCC
Checked by: RLP

July 2015 1419949
Stack Volumetric Flow Rate
[Am³/s]
Stack Exit Gas Temperature
[K]
Stack Inner Diameter
[m]
Stack Height Above Grade
[m]
Stack Height Above Roof
[m]Contaminant CAS No. Averaging
Period
Emission Estimating Technique
Emissions Data Quality
Maximum Emission Rate
[g/s]
Percentage of Overall
Emissions
COLLAR Mine Ventilation Collar 47.19 288.50 7.60 0.00 0.00 PM N/A 24-hr EF A-Average 3.30E-01 54%CO 630-08-0 ½-hr EF Marginal 2.57E+00 71%NOx 10102-44-0 1-hr, 24-hr EF Marginal 5.67E-01 14%SO2 7446-09-5 1-hr, 24-hr EF Marginal 3.85E-03 1%
WTP1 Water Treatment Plant Heater Water Treatment Plant — — — — — NOx 10102-44-0 1-hr, 24-hr EF Marginal 5.37E-03 <1%WTP2 Water Treatment Plant Heater Water Treatment Plant — — — — — NOx 10102-44-0 1-hr, 24-hr EF Marginal 5.37E-03 <1%WTP3 Water Treatment Plant Heater Water Treatment Plant — — — — — NOx 10102-44-0 1-hr, 24-hr EF Marginal 5.37E-03 <1%WTP4 Water Treatment Plant Heater Water Treatment Plant — — — — — NOx 10102-44-0 1-hr, 24-hr EF Marginal 5.37E-03 <1%
WTP5 Water Treatment Plant Ammonia Strripper Water Treatment Plant Ammonia 7664-41-7 24-hr EF Average 2.22E+00 100%
IDGEN1 40 kW Individual Diesel Generator North East Side of Main Site — — — — — CO 630-08-0 ½-hr EF Marginal 4.51E-02 1%
NOx 10102-44-0 1-hr, 24-hr EF Marginal 2.10E-01 5%PM N/A 24-hr EF Marginal 1.49E-02 2%SO2 7446-09-5 1-hr, 24-hr EF Marginal 1.39E-02 4%
IDGEN2 100 kW Individual Diesel Generator North Side of Main Site — — — — — CO 630-08-0 ½-hr EF Marginal 1.13E-01 3%
NOx 10102-44-0 1-hr, 24-hr EF Marginal 5.24E-01 13%PM N/A 24-hr EF Marginal 3.72E-02 6%SO2 7446-09-5 1-hr, 24-hr EF Marginal 3.46E-02 10%
IDGEN3 100 kW Individual Diesel Generator South Side of Main Site — — — — — CO 630-08-0 ½-hr EF Marginal 1.13E-01 3%
NOx 10102-44-0 1-hr, 24-hr EF Marginal 5.24E-01 13%PM N/A 24-hr EF Marginal 3.72E-02 6%SO2 7446-09-5 1-hr, 24-hr EF Marginal 3.46E-02 10%
IDGEN5 230 kW Individual Diesel Generator South Side of Main Site — — — — — CO 630-08-0 ½-hr EF Average 2.23E-01 6%
NOx 10102-44-0 1-hr, 24-hr EF Average 2.57E-01 6%PM N/A 24-hr EF Average 1.29E-02 2%SO2 7446-09-5 1-hr, 24-hr EF Marginal 7.97E-02 23%
IDGEN6 100 kW Individual Diesel Generator Construction Trailers — — — — — CO 630-08-0 ½-hr EF Marginal 1.13E-01 3%
NOx 10102-44-0 1-hr, 24-hr EF Marginal 5.24E-01 13%PM N/A 24-hr EF Marginal 3.72E-02 6%SO2 7446-09-5 1-hr, 24-hr EF Marginal 3.46E-02 10%
Table 2Source Summary Table
Source Identifier Source Description
Source Parameters Emission Data
Source Location
N:\Active\2014\1190 Sudbury\1192\1419949 KGHM 2015 ESDM Maintenance Victoria\ESDM Report Update\Workbook\1419949 KGHM ESDM 14July15DCC.xlsm
Page 2 of 6 Golder AssociatesMade by: DCC
Checked by: NCH

July 2015 1419949
Stack Volumetric Flow Rate
[Am³/s]
Stack Exit Gas Temperature
[K]
Stack Inner Diameter
[m]
Stack Height Above Grade
[m]
Stack Height Above Roof
[m]Contaminant CAS No. Averaging
Period
Emission Estimating Technique
Emissions Data Quality
Maximum Emission Rate
[g/s]
Percentage of Overall
Emissions
Source Summary Table
Source Identifier Source Description
Source Parameters Emission Data
Source Location
IDGEN7 200 kW Individual Diesel Generator — — — — — CO 630-08-0 ½-hr EF Marginal 2.26E-01 6%
NOx 10102-44-0 1-hr, 24-hr EF Marginal 1.05E+00 26%PM N/A 24-hr EF Marginal 7.43E-02 12%SO2 7446-09-5 1-hr, 24-hr EF Marginal 6.93E-02 20%
RBREAKER Rock Breaker PAG stockpile area — — — — — PM N/A 24-hr EF Marginal 6.25E-04 <1%PCRUSH Primary Crusher PAG stockpile area — — — — — PM N/A 24-hr EF Marginal 3.13E-02 5%PSTACK Stacker PAG stockpile area — — — — — PM N/A 24-hr EF Marginal 8.68E-03 1%
GEN1 PAG stockpile area — — — — — CO 630-08-0 ½-hr EF Average 2.16E-01 6%NOx 10102-44-0 1-hr, 24-hr EF Average 4.07E-01 5%PM N/A 24-hr EF Average 1.25E-02 2%SO2 7446-09-5 1-hr, 24-hr EF Marginal 7.72E-02 22%
PAG_SP1 PAG Material Handling 1 PAG stockpile area — — — — — PM N/A 24-hr EF Above Average 7.26E-03 1%PAG_SP2 PAG Material Handling 2 PAG stockpile area — — — — — PM N/A 24-hr EF Above Average 7.26E-03 1%
Data Quality Categories: "Above-Average"; "Average"; and "Marginal"
Primary Crusher Diesel Generator
Construction Around Headframe
N:\Active\2014\1190 Sudbury\1192\1419949 KGHM 2015 ESDM Maintenance Victoria\ESDM Report Update\Workbook\1419949 KGHM ESDM 14July15DCC.xlsm
Page 3 of 6 Golder AssociatesMade by: DCC
Checked by: NCH
July 2015 1419949
Relevant Section of the Regulation Section Title Summary of How the Approved Dispersion Model Was Used Location of Supporting
Documentation in ESDM Report
Section 8 Negligible Sources of Contaminants Sources and contaminants that were considered negligible were explicitly identified, and therefore were not modelled in accordance with s.8 of O.Reg.419/05. Section 3.0, Table 1
Section 9 Same Structure Contamination Not applicable as the Facility does not have a child care facility, health care facility, senior's residence, long-term care facility or an education facility located at the on-site. N/A
Section 10 Operating Conditions See section 4.1 and Appendix B of the ESDM Report. Section 4.0, Table 4
Section 11 Source of Contaminant Emission RatesThe emission rate for each significant contaminant emitted from a significant source was estimated, the
methodology for the calculation is documented in Table 2 - Source Summary Table. See section 4.1 and section 4.2 and Appendix B of the ESDM Report for more information.
Section 4.0, Table 2
Section 12 Combined Effect of Assumptions for Operating Conditions and Emission Rates
The Operating Conditions were estimated in accordance with s.10(1) 1 and s.11(1) 1 of O.Reg. 419 and are therefore considered to result in the highest concentration at POIs that the Facility is capable of for the
contaminants emitted. See section 4.1 and section 4.2 of the ESDM Report.Section 4.0
Section 13 Meteorological Conditions MOECC's Regional Dataset for Sudbury, Rural was used. N/A
Section 14 Area of Modelling Coverage (receptor locations) Model coverage set to match MOE guidelines. Section 6.0, Figure 8
Section 15 Stack Height for Certain New Sources of Contaminant All stacks meet the requirements of s.15 and Good Engineering Practice N/A
Section 16 Terrain Data MOECC DEM files used: 04611_9.DEM, 04611_10.DEM, 04611_11.DEM, 04612_9.DEM, 04612_10.DEM, 04612_11.DEM, 04613_9.DEM, 04613_10.DEM, 04613_11.DEM N/A
Section 17 Averaging Periods The appropriate averaging periods (as defined by the regulatory limits outlined in Schedule 3) were modelled for each contaminant. Section 4.0
Dispersion Modelling Input Summary TableTable 3
N:\Active\2014\1190 Sudbury\1192\1419949 KGHM 2015 ESDM Maintenance Victoria\ESDM Report Update\Workbook\1419949 KGHM ESDM 14July15DCC.xlsm
Page 4 of 6 Golder AssociatesMade by: DCC
Checked by: NCH

July 2015 1419949
POINT SOURCES
Modelling ID Source Description Source ID(s)
Stack Volumetric Flow Rate
[m3/s]
Stack Gas Exit Velocity [m3/s]
Stack Exit Gas Temperature
[K]
Stack Inner Diameter [m]
Stack Height Above Grade
[m]
Stack Height Above Roof [m]
X Coordinate [m]
Y Coordinate [m] Contaminant CAS #
Maximum Emission Rate [g/s]
Averaging Period [hours]
COLLAR Mine Ventilation DB 47.19 1.04 289 7.60 0.00 0.00 470448 5139798 PM N/A 3.30E-01 24-hrFAR CO 630-08-0 2.57E+00 ½-hr
NOx 10102-44-0 5.67E-01 1-hr, 24-hrSO2 7446-09-5 3.85E-03 1-hr, 24-hr
VOLUME SOURCES
Modelling ID Source Description Source ID(s)Release Height Above Grade
[m]
Length of Side [m]
Volume Source Height
[m]
Initial Lateral Dimension of
Volume[m]
Initial Vertical Dimension of
Volume[m]
X Coordinate [m]
Y Coordinate [m] Contaminant CAS #
Maximum Emission Rate[g/s]
Averaging Period [hours]
WTP Water Treatment Plant WTP1-4 3.00 23.69 6.00 5.51 2.79 470354 5139836 NOx 10102-44-0 2.15E-02 1-hr, 24-hrWTP Ammonia 7664-41-7 2.22E+00 24-hr
IDGEN1 40 kW Individual Diesel Generator IDGEN1 0.91 1.59 1.83 0.37 0.85 470461 5139980 CO 630-08-0 4.51E-02 ½-hrIDGEN1 NOx 10102-44-0 2.10E-01 1-hr, 24-hrIDGEN1 PM N/A 1.49E-02 24-hrIDGEN1 SO2 7446-09-5 1.39E-02 1-hr, 24-hrIDGEN2 100 kW Individual Diesel Generator IDGEN2 0.91 1.70 1.83 0.39 0.85 470390 5140011 CO 630-08-0 1.13E-01 ½-hrIDGEN2 NOx 10102-44-0 5.24E-01 1-hr, 24-hrIDGEN2 PM N/A 3.72E-02 24-hrIDGEN2 SO2 7446-09-5 3.46E-02 1-hr, 24-hrIDGEN3 100 kW Individual Diesel Generator IDGEN3 0.91 2.48 1.83 0.58 0.85 470445 5139747 CO 630-08-0 1.13E-01 ½-hrIDGEN3 NOx 10102-44-0 5.24E-01 1-hr, 24-hrIDGEN3 PM N/A 3.72E-02 24-hrIDGEN3 SO2 7446-09-5 3.46E-02 1-hr, 24-hrIDGEN5 230 kW Individual Diesel Generator IDGEN5 1.44 2.63 2.88 0.61 1.34 470643 5139709 CO 630-08-0 2.23E-01 ½-hrIDGEN5 NOx 10102-44-0 2.57E-01 1-hr, 24-hrIDGEN5 PM N/A 1.29E-02 24-hrIDGEN5 SO2 7446-09-5 7.97E-02 1-hr, 24-hrIDGEN6 100 kW Individual Diesel Generator IDGEN6 0.92 1.70 1.83 0.40 0.85 470434 5139737 CO 630-08-0 1.13E-01 ½-hrIDGEN6 NOx 10102-44-0 5.24E-01 1-hr, 24-hrIDGEN6 PM N/A 3.72E-02 24-hrIDGEN6 SO2 7446-09-5 3.46E-02 1-hr, 24-hrIDGEN7 200 kW Individual Diesel Generator IDGEN7 1.44 2.63 2.88 0.61 1.34 470431 5139803 CO 630-08-0 2.26E-01 ½-hrIDGEN7 NOx 10102-44-0 1.05E+00 1-hr, 24-hrIDGEN7 PM N/A 7.43E-02 24-hrIDGEN7 SO2 7446-09-5 6.93E-02 1-hr, 24-hr
CRUSHER RBREAKER 1.98 6.61 3.96 1.54 1.84 470232 5140131 CO 630-08-0 2.16E-01 ½-hrCRUSHER PCRUSH NOx 10102-44-0 4.07E-01 1-hr, 24-hrCRUSHER PSTACK PM N/A 5.30E-02 24-hrCRUSHER GEN1 SO2 7446-09-5 7.72E-02 1-hr, 24-hrPAG_SP1 PAG Material Handling 1 PAG_SP1 2.50 5.00 5.00 1.16 2.33 470279 5140140 PM N/A 7.26E-03 24-hrPAG_SP2 PAG Material Handling 2 PAG_SP2 2.50 5.00 5.00 1.16 2.33 470219 5140156 PM N/A 7.26E-03 24-hr
Dispersion Modelling Source Summary Table
PAG Stockpile Area Crusher
Table 4
N:\Active\2014\1190 Sudbury\1192\1419949 KGHM 2015 ESDM Maintenance Victoria\ESDM Report Update\Workbook\1419949 KGHM ESDM 14July15DCC.xlsm
Page 5 of 6 Golder AssociatesMade by: DCC
Checked by: NCH

July 2015 1419949
Contaminant CAS No.Total Facility
Emission Rate [g/s]
Air Dispersion Model Used
Averaging Period [hours]
Maximum POI Concentration
[µg/m³]
POI Location[See Figure 8]
MOECC POI Limit
[µg/m³]Limiting Effect Regulation /
Schedule No.Percentage of
MOECC Limit [%]
Ammonia 7664-41-7 2.22E+00 AERMOD 24 3.24E+01 POI1 100 Health Schedule 3 32%
Carbon Monoxide 630-08-0 3.62E+00 AERMOD ½ 3.80E+02 POI2 6000 Health Schedule 3 6%
Nitrogen Oxides 10102-44-0 4.08E+00 AERMOD 1 3.28E+02 POI3 400 Health Schedule 3 82%
Nitrogen Oxides 10102-44-0 4.08E+00 AERMOD 24 5.01E+01 POI2 200 Health Schedule 3 25%
PM N/A 6.11E-01 AERMOD 24 5.38E+00 POI2 120 Visibility Schedule 3 4%
Sulphur Dioxide 7446-09-5 3.48E-01 AERMOD 1 2.89E+01 POI2 690 Health & Vegetation Schedule 3 <1%
Sulphur Dioxide 7446-09-5 3.48E-01 AERMOD 24 5.06E+00 POI2 275 Health & Vegetation Schedule 3 11%
Table 5Emission Summary Table
N:\Active\2014\1190 Sudbury\1192\1419949 KGHM 2015 ESDM Maintenance Victoria\ESDM Report Update\Workbook\1419949 KGHM ESDM 14July15DCC.xlsm
Page 6 of 6 Golder AssociatesMade by: DCC
Checked by: NCH
$+
Fairbank Lake Road
CreanHill Road
1.9 km
Victoria Mine
%k
%k
LockerbyMine
Crean HillMine
TottenMine
FairbankLake
SkillLake
BassLake
EthelLake
PerchLake
St. PothierLake
Mond Lake
MonkLake
MayLake
CLIEN TKGHM IN TERN ATION AL LTD
NOTES
REFERENCE
THIS FIGURE IS TO BE READ IN CON JUN CTION W ITH THE ACCOMPAN Y IN GGOLDER ASSOCIATES LTD. REPORT N O.1419949
BASE DATA - ATLAS OF CAN ADA,BASE IMAGERY - MICROSOFT BIN G ©2015 MICROSOFT CORPORATION AN D ITS DATASUPPLIERS.CON TAIN S IN FORMATION LICEN SED UN DER THE OPEN GOVERN MEN T LICEN CE – ON TARIO.HTTPS://W W W .ON TARIO.CA/GOVERN MEN T/OPEN -GOVERN MEN T-LICEN CE-ON TARIOPROJECTION : TRAN SVERSE MERCATOR DATUM: N AD 83COORDIN ATE SY STEM: UTM ZON E 17 VERTICAL DATUM: CGVD28
PROJECTEMISSION SUMMARY & DISPERSION MODELLIN G REPORTVICTORIA MIN ETITLESITE LOCATION PLAN
1419949 1000 1 1
2015-07-22 RRDRRDDCN CH
Path: A:\_Clients\KGHM\Victoria_Mine\99_PROJ\1419949\40_PROD\RN-Air_Acoustic_Noise_Vibration\1419949-0001-RN-0004.mxd
!.
!.
!.
!. !.!.
!.
!.
!.
Extent of Main MapSudb ury
Pem b roke
N orth Ba y
Belleterre
Elliot La ke
Ville-Ma rie
Tém isc a m ing
N ip issing OuestRivière des Fra nça is
KEY MAP
IF THIS MEASUREMENT DOES NOT MATCH WHAT IS SHOWN, THE SHEET SIZE HAS BEEN MODIFIED FROM:
CON SULTAN T
PROJECT N o. PHASE Rev. FIGURE
Y Y Y Y -MM-DDPREPAREDDESIGNREVIEWAPPROVED
25mm
0
0 990 1,980495METRES
1:50,000SCALE
LEGEND
$+ N ea rest Rec ep torVic toria Bounda ry (a p p roxim a te)

CLIENTKGHM INTERNATIO NAL LTD
NOTES
REFERENCE
THIS SCHEMATIC REPRESENTS THE MAJO R PRO CESSES TAKING PLACE AT THE FACILITY.SIMPLE PRO CESSES SUCH AS FUGITIVE EMISSIO NS, ETC. ARE NO T INCLUDED.
BASE DATA - ATLAS O F CANADA,BASE IMAGERY - MICRO SO FT BING ©2015 MICRO SO FT CO RPO RATIO N AND ITS DATASUPPLIERS.CO NTAINS INFO RMATIO N LICENSED UNDER THE O PEN GO VERNMENT LICENCE – O NTARIO .HTTPS://WWW.O NTARIO .CA/GO VERNMENT/O PEN-GO VERNMENT-LICENCE-O NTARIOPRO JECTIO N: TRANSVERSE MERCATO R DATUM: NAD 83CO O RDINATE SYSTEM: UTM ZO NE 17 VERTICAL DATUM: CGVD28
PRO JECTEMISSIO N SUMMARY & DISPERSIO N MO DELLING REPO RTVICTO RIA MINETITLEPROCESS FLOW DIAGRAM
1419949 1000 1 2
2015-07-22 RRDDCCDCCNCH
Path: A:\_Clients\KGHM\Victoria_Mine\99_PROJ\1419949\40_PROD\RN-Air_Acoustic_Noise_Vibration\1419949-0001-RN-0005.mxd
IF THIS MEASUREMENT DOES NOT MATCH WHAT IS SHOWN, THE SHEET SIZE HAS BEEN MODIFIED FROM:
CO NSULTANT
PRO JECT No. PHASE Rev. FIGURE
YYYY-MM-DDPREPAREDDESIGNREVIEWAPPRO VED
25mm
0
0 0.6 1.20.3METRES
1:31SCALE
LEGEND

!A
!A
!A
!A
!A
!A!A
!A
!A!A
!A
!A
!A
!A!A
!A
!A
Fairbank East Road
GEN1
COLLAR
PAG_SP2
PAG_SP1
EG1
WTP5
IDGEN3
IDGEN2
IDGEN1
IDGEN6
IDGEN5
IDGEN7
WTP1-4
RBREAKER
DB & FAR
PSCREEN
PCRUSH
470500
470500
5140
000
5140
000
CLIENTKGHM INTERNATIO NAL LTD
NOTES
REFERENCE
THIS FIGURE IS TO BE READ IN CO NJUNCTIO N WITH THE ACCO MPANYINGGO LDER ASSO CIATES LTD. REPO RT NO . 1419949
CO NTAINS INFO RMATIO N LICENSED UNDER THE O PEN GO VERNMENT LICENCE – O NTARIO .HTTPS://WWW.O NTARIO .CA/GO VERNMENT/O PEN-GO VERNMENT-LICENCE-O NTARIOPRO JECTIO N: TRANSVERSE MERCATO R DATUM: NAD 83CO O RDINATE SYSTEM: UTM ZO NE 17 VERTICAL DATUM: CGVD28
PRO JECTEMISSIO N SUMMARY & DISPERSIO N MO DELLING REPO RTVICTO RIA MINETITLESITE PLAN
1419949 1000 1 3
2015-07-22 RRDRRDDCNCH
Path: A:\_Clients\KGHM\Victoria_Mine\99_PROJ\1419949\40_PROD\RN-Air_Acoustic_Noise_Vibration\1419949-0001-RN-0001.mxd
IF THIS MEASUREMENT DOES NOT MATCH WHAT IS SHOWN, THE SHEET SIZE HAS BEEN MODIFIED FROM:
CO NSULTANT
PRO JECT No. PHASE Rev. FIGURE
YYYY-MM-DDPREPAREDDESIGNREVIEWAPPRO VED
25mm
0
0 30 6015METRES
1:2,000SCALE
LEGEND
Roa d s_CityMod elling Bound a ry
!A Em ission Sourc esMine Infra struc tureProposed Build ings / Enc losures
Source Identifier Source DescriptionCOLLAR Shaft CollarDB Drilling and BlastingEG1 300 ekW/3750 Kva Emergency GeneratorFAR Mine Ventilation: Fresh Air RaiseGEN1 Primary Crusher 223 kW Diesel GeneratorIDGEN1 40 kW Individual Diesel GeneratorIDGEN2 100 kW Individual Diesel GeneratorIDGEN3 100 kW Individual Diesel GeneratorIDGEN5 230 kW Individual Diesel GeneratorIDGEN6 100 kW Individual Diesel GeneratorIDGEN7 200 kW Individual Diesel GeneratorPAG Stockpile 1 PAG Material Handling 1PAG Stockpile 2 PAG Material Handling 2PCRUSH Primary CrusherPSTACK StackerRBREAKER Rock BreakerWTP1-4 Water Treatment Plant HeatersWTP5 Water Treatment Plant Ammonia Stripper
Inset Ma p
Crean Hill Road
Fairbank East Road
Extent of Main Map

$+
Fairbank Lake Road
CreanHill Road
1.9 km
Victoria Mine
%k
%k
LockerbyMine
Crean HillMine
TottenMine
FairbankLake
SkillLake
BassLake
EthelLake
PerchLake
St. PothierLake
Mond Lake
MonkLake
MayLake
464500
464500
467000
467000
469500
469500
472000
472000
474500
474500
477000
477000
5134
500
5134
500
5137
000
5137
000
5139
500
5139
500
5142
000
5142
000
5144
500
5144
500
CLIENTKGHM INTERNATIONAL LTD
NOTES
REFERENCE
THIS FIGURE IS TO BE READ IN CONJUNCTION WITH THE ACCOMPANYINGGOLDER ASSOCIATES LTD. REPORT NO.1419949
ZONING DATA (BY-LAW SCHEDULE A TO BY-LAW 2010-100Z) ACQUIRED FROM:HTTP://WWW.GREATERSUDBURY.CA/CONTENT/ZONINGBYLAWS/2010/KEYMAP2010.PDFPROJECTION: TRANSVERSE MERCATOR DATUM: NAD 83COORDINATE SYSTEM: UTM ZONE 17 VERTICAL DATUM: CGVD28
PROJECTEMISSION SUMMARY & DISPERSION MODELLING REPORTVICTORIA MINETITLELAND USE
1419949 1000 1 4
2015-07-22
RRD
RRD
DC
NCH
Pat
h: A
:\_C
lient
s\K
GH
M\V
icto
ria_M
ine\
99_P
RO
J\14
1994
9\40
_PR
OD
\RN
-Air_
Aco
ustic
_Noi
se_V
ibra
tion\
1419
949-
0001
-RN
-000
6.m
xd
IF T
HIS
ME
AS
UR
EM
EN
T D
OE
S N
OT
MAT
CH
WH
AT IS
SH
OW
N, T
HE
SH
EE
T S
IZE
HA
S B
EE
N M
OD
IFIE
D F
RO
M:
CONSULTANT
PROJECT No. PHASE Rev. FIGURE
YYYY-MM-DD
PREPARED
DESIGN
REVIEW
APPROVED
25m
m0
0 1,000 2,000500
METRES1:50,000SCALE
LEGEND
$+ Nearest Receptor
Victoria Boundary (approximate)Zoning
Agricultural
Commercial
Industrial
Open Space
Residential
!ACOLLAR
WTP1-5
PAG_SP2
PAG_SP1RBREAKERPCRUSHPSTACKGEN1
IDGEN7
IDGEN5
IDGEN3IDGEN6
IDGEN2
IDGEN1
470500
470500
5140
000
5140
000
CLIENTKGHM INTERNATIONAL LTD
NOTES
REFERENCE
THIS FIGURE IS TO BE READ IN CONJUNCTION W ITH THE ACCOMP ANYINGGOLDER ASSOCIATES LTD. REP ORT NO. 1419949
CONTAINS INFORMATION LICENSED UNDER THE OP EN GOVERNMENT LICENCE – ONTARIO.HTTP S://W W W.ONTARIO.CA/GOVERNMENT/OP EN-GOVERNMENT-LICENCE-ONTARIOP ROJECTION: TRANSVERSE MERCATOR DATUM: NAD 83COORDINATE SYSTEM: UTM ZONE 17 VERTICAL DATUM: CGVD28
P ROJECTEMISSION SUMMARY & DISP ERSION MODELLING REP ORTVICTORIA MINETITLEDISPERSION MODELLING PLAN
1419949 1000 1 5
2015-07-22 RRDRRDDCNCH
Path: A:\_Clients\KGHM\Victoria_Mine\99_PROJ\1419949\40_PROD\RN-Air_Acoustic_Noise_Vibration\1419949-0001-RN-0003.mxd
IF THIS MEASUREMENT DOES NOT MATCH WHAT IS SHOWN, THE SHEET SIZE HAS BEEN MODIFIED FROM:
CONSULTANT
P ROJECT No. P HASE Re v. FIGURE
YYYY-MM-DDP REP AREDDESIGNREVIEWAP P ROVED
25mm
0
0 40 8020METRES
1:2,107SCALE
LEGEND
!A P oint Sourc eVolum e Sourc eP ropos e d Build ings / Enclos ure sMine Infras tructure
Modelling ID Source Description Source ID(s) X Coordinate [m] Y Coordinate [m]COLLAR Mine Ventilation DB FAR 470448 5139798
Modelling ID Source Description Source ID(s) X Coordinate [m] Y Coordinate [m]WTP Water Treatment Plant WTP1-5 470354 5139836
IDGEN1 40 kW Individual Diesel Generator IDGEN1 470461 5139980
IDGEN2 100 kW Individual Diesel Generator IDGEN2 470390 5140011
IDGEN3 100 kW Individual Diesel Generator IDGEN3 470445 5139747
IDGEN5 230 kW Individual Diesel Generator IDGEN5 470643 5139709
IDGEN6 100 kW Individual Diesel Generator IDGEN6 470434 5139737
IDGEN7 200 kW Individual Diesel Generator IDGEN7 470431 5139803
RBREAKER
PCRUSH
PSTACK
GEN1
PAG_SP1 PAG Material Handling 1 PAG_SP1 470279 5140140
PAG_SP2 PAG Material Handling 2 PAG_SP2 470219 5140156
VOLUME SOURCE
POINT SOURCE
470232 5140131PAG Stockpile Area CrusherCRUSHER

Fairbank Lake Road
Crean Hill Road
Crean HillMine
EthelLake
PerchLake
MondLake
MonkLake
MayLake
CLIEN TKGHM IN TERN ATION AL LTD
NOTES
REFERENCE
THIS FIGURE IS TO BE READ IN CON JUN CTION W ITH THE ACCOMPAN Y IN GGOLDER ASSOCIATES LTD. REPORT N O.1419949
BASE DATA - ATLAS OF CAN ADA,BASE IMAGERY - MICROSOFT BIN G ©2015 MICROSOFT CORPORATION AN D ITS DATASUPPLIERS.CON TAIN S IN FORMATION LICEN SED UN DER THE OPEN GOVERN MEN T LICEN CE – ON TARIO.HTTPS://W W W .ON TARIO.CA/GOVERN MEN T/OPEN -GOVERN MEN T-LICEN CE-ON TARIOPROJECTION : TRAN SVERSE MERCATOR DATUM: N AD 83COORDIN ATE SY STEM: UTM ZON E 17 VERTICAL DATUM: CGVD28
PROJECTEMISSION SUMMARY & DISPERSION MODELLIN G REPORTVICTORIA MIN ETITLE3 KM SATELLITE IMAGE
1419949 1000 1 6
2015-07-22 RRDRRDDCN CH
Path: A:\_Clients\KGHM\Victoria_Mine\99_PROJ\1419949\40_PROD\RN-Air_Acoustic_Noise_Vibration\1419949-0001-RN-0008.mxd
IF THIS MEASUREMENT DOES NOT MATCH WHAT IS SHOWN, THE SHEET SIZE HAS BEEN MODIFIED FROM:
CON SULTAN T
PROJECT N o. PHASE Rev. FIGURE
Y Y Y Y -MM-DDPREPAREDDESIGNREVIEWAPPROVED
25mm
0
0 490 980245METRES
1:25,000SCALE
LEGEND
3KM BufferVic toria Bounda ry (a pproximate)

Fairbank Lake Road
Crean Hill Road
Crean HillMine
EthelLake
PerchLake
MondLake
MonkLake
MayLake
CLIENTKGHM INTERNATIONAL LTD
NOTES
REFERENCE
THIS FIGURE IS TO BE READ IN CONJUNCTION W ITH THE ACCOMP ANYINGGOLDER ASSOCIATES LTD. REP ORT NO.1419949
CONTAINS INFORMATION LICENSED UNDER THE OP EN GOVERNMENT LICENCE – ONTARIO.HTTP S://W W W.ONTARIO.CA/GOVERNMENT/OP EN-GOVERNMENT-LICENCE-ONTARIOP ROJECTION: TRANSVERSE MERCATOR DATUM: NAD 83COORDINATE SYSTEM: UTM ZONE 17 VERTICAL DATUM: CGVD28
P ROJECTEMISSION SUMMARY & DISP ERSION MODELLING REP ORTVICTORIA MINETITLETERRAIN ELEVATION
1419949 1000 1 7
2015-07-22 RRDRRDDCNCH
Path: A:\_Clients\KGHM\Victoria_Mine\99_PROJ\1419949\40_PROD\RN-Air_Acoustic_Noise_Vibration\1419949-0001-RN-0009.mxd
IF THIS MEASUREMENT DOES NOT MATCH WHAT IS SHOWN, THE SHEET SIZE HAS BEEN MODIFIED FROM:
CONSULTANT
P ROJECT No. P HASE Re v. FIGURE
YYYY-MM-DDP REP AREDDESIGNREVIEWAP P ROVED
25mm
0
0 490 980245METRES
1:25,000SCALE
LEGEND
Major RoadLocal RoadP rivate Road
Elevation (masl)High : 343.911Low : 235

Fairbank Lake Road
CreanHill Road
%k
%k
LockerbyMine
Crean HillMine
TottenMine
FairbankLake
SkillLake
BassLake
EthelLake
PerchLake
St. PothierLake
Mond Lake
MonkLake
MayLake
POI 3
POI 2
POI 1
CLIENTKGHM INTERNATIONAL LTD
NOTES
REFERENCE
THIS FIGURE IS TO BE READ IN CONJUNCTION W ITH THE ACCOMP ANYINGGOLDER ASSOCIATES LTD. REP ORT NO.1419949
BASE DATA - ATLAS OF CANADA,BASE IMAGERY - MICROSOFT BING ©2015 MICROSOFT CORP ORATION AND ITS DATASUP P LIERS.CONTAINS INFORMATION LICENSED UNDER THE OP EN GOVERNMENT LICENCE – ONTARIO.HTTP S://W W W.ONTARIO.CA/GOVERNMENT/OP EN-GOVERNMENT-LICENCE-ONTARIOP ROJECTION: TRANSVERSE MERCATOR DATUM: NAD 83COORDINATE SYSTEM: UTM ZONE 17 VERTICAL DATUM: CGVD28
P ROJECTEMISSION SUMMARY & DISP ERSION MODELLING REP ORTVICTORIA MINETITLEDISPERSION MODELLING RECEPTORS AND POI LOCATIONS
1419949 1000 1 8
2015-07-22 RRDRRDDCNCH
Path: A:\_Clients\KGHM\Victoria_Mine\99_PROJ\1419949\40_PROD\RN-Air_Acoustic_Noise_Vibration\1419949-0001-RN-0007.mxd
IF THIS MEASUREMENT DOES NOT MATCH WHAT IS SHOWN, THE SHEET SIZE HAS BEEN MODIFIED FROM:
CONSULTANT
P ROJECT No. P HASE Re v. FIGURE
YYYY-MM-DDP REP AREDDESIGNREVIEWAP P ROVED
25mm
0
0 990 1,980495METRES
1:50,000SCALE
LEGEND
P OI LocationsRe c e ptor Grid

EMISSION SUMMARY AND DISPERSION MODELLING REPORT
July 2015 Report No. 1419949
APPENDIX A Modification Log
MODIFICATION LOG Emission Summary and Dispersion Modelling Report
June 29 2015 ESDM Report Version 2.0 1/2
The following table contains a summary of the changes that the ESDM Report has undergone since ESDM Report Version 1.0. Further details are provided in ESDM Report Table 1 – Sources and Contaminants Identification Table.
ESDM Report Version
Description of Change Emission Summary and Dispersion Modelling Report Changes
2.0 Removal of Air Exhaust Sources (Ventilation Shaft and Production Shaft) Source IDs: RAR1a-RAR1c
Emission rate estimates, MOECC Tables, dispersion modelling, ESDM Report text.
Modification to drilling and blasting activities Source IDs: DB1-3. ESDM Version 2.0 includes drilling and blasting occurring at the collar for shaft sinking Source IDs: DB
Emission rate estimates, MOECC Tables, dispersion modelling, ESDM Report text.
Removal of propane-fired comfort heaters and associated buildings Source IDs: PSHF1, PSHR1, VSHF1, VSHR1, CS1, CD1-6, DPH1, CH1, SW1-2
Emission rate estimates, MOECC Tables, dispersion modelling, ESDM Report text.
Removal of Upper Waste Rock Stockpile and Lower Waste Rock Stockpile Source ID: SP1 and SP2
Emission rate estimates, MOECC Tables, dispersion modelling, ESDM Report text.
Removal of Ready Mix Batch Plant Source IDs: RMBP1-RMBP9
Emission rate estimates, MOECC Tables, dispersion modelling, ESDM Report text.
Removal of propane-fired comfort heating source associated with ESDM Version 1.0 Water Treatment Plant Source IDs: WTP1
Emission rate estimates, MOECC Tables, dispersion modelling, ESDM Report text.
Removal of Emergency Generation Equipment Diesel Fire Pump and associated Distribution Pump House propane-fired heaters Source IDs: DPH1, DPH2
EPG emission rate estimates, EPG Tables, dispersion modelling, EPG Report text. ESDM Emission rate estimates, MOECC Tables, dispersion modelling, ESDM Report text.
Location change to Emergency Generator EG1 EPG Tables, dispersion modelling, EPG Report text.
Addition of Mine Ventilation at the Collar Source ID: COLLAR
Emission rate estimates, MOECC Tables, dispersion modelling, ESDM Report text.
Addition of new Water Treatment Plant Heaters Source ID: WTP1-4
Emission rate estimates, MOECC Tables, dispersion modelling, ESDM Report text.
Addition of Ammonia stripper at new Water Treatment Plant Source ID: WTP5
Emission rate estimates, MOECC Tables, dispersion modelling, ESDM Report text.
Addition of Crushing Equipment Source IDs: RBREAKER, PCRUSH, PSTACK, GEN1
Emission rate estimates, MOECC Tables, dispersion modelling, ESDM Report text
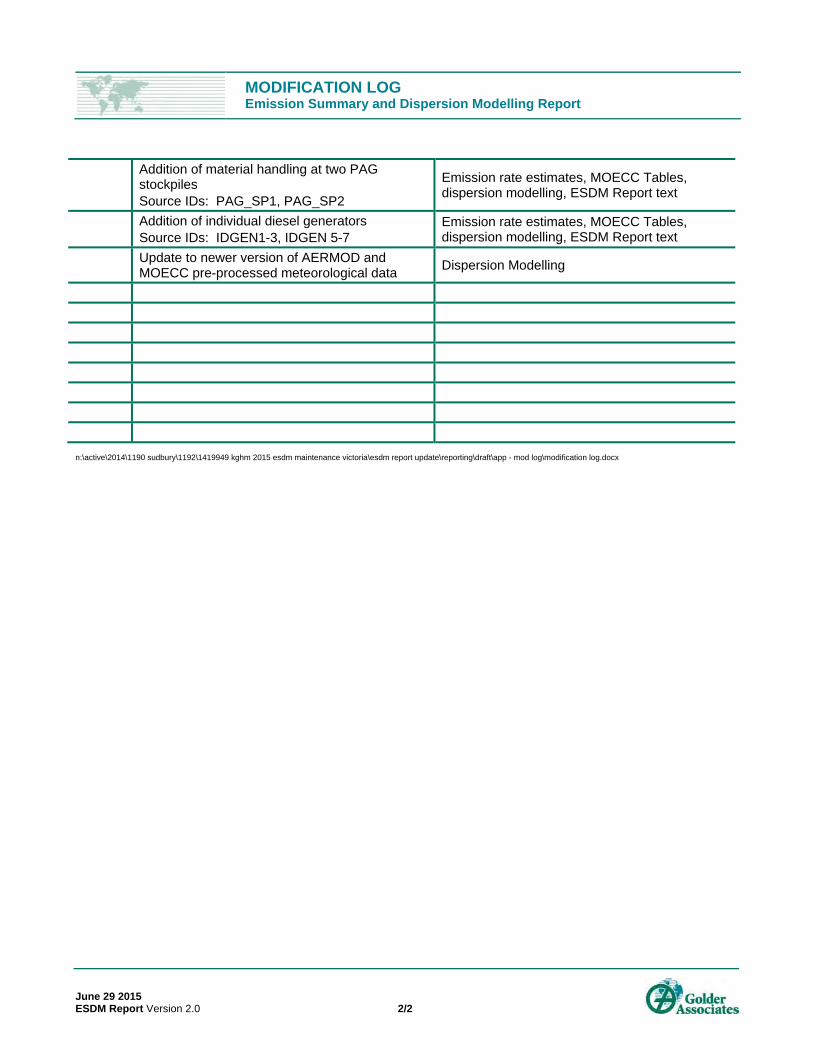
MODIFICATION LOG Emission Summary and Dispersion Modelling Report
June 29 2015 ESDM Report Version 2.0 2/2
Addition of material handling at two PAG stockpiles Source IDs: PAG_SP1, PAG_SP2
Emission rate estimates, MOECC Tables, dispersion modelling, ESDM Report text
Addition of individual diesel generators Source IDs: IDGEN1-3, IDGEN 5-7
Emission rate estimates, MOECC Tables, dispersion modelling, ESDM Report text
Update to newer version of AERMOD and MOECC pre-processed meteorological data Dispersion Modelling
n:\active\2014\1190 sudbury\1192\1419949 kghm 2015 esdm maintenance victoria\esdm report update\reporting\draft\app - mod log\modification log.docx

EMISSION SUMMARY AND DISPERSION MODELLING REPORT
July 2015 Report No. 1419949
APPENDIX B Emission Rate Calculations

June 2015 1419949
Drilling and Blasting
ParametersSource ID DB Sample Calculation
Source Description Drilling and Blasting Blasting- PM
A: Area Blasted [m²] 61 EFPM = 0.00022(A)1.5
Bulk Emulsion: Usage per Blast [Mg] 0.612ANFO: Usage per Blast [Mg] 0.231 ERPM = 0.00022( 61.0 m² )1.5 kg x 2 blast x 1 hour x 1000 g
Total Number of Blasts in 24-hr 2 blast 24 hour 3600 s 1 kgNumber of Holes Drilled in 24-hr 161 ERPM = 2.43E-03 g
Drilling Control 70% s
Drilling- PMPM Emissions from Drilling and Blasting ERPM = 0.59 kg x 161 holes x 1000 g x 1 hr x ( 100% - 70% )
Contaminant CAS EF EF Units ER[g/s]
hole 24 hr kg 3600 s
PM - Blasting N/A 0.00022(A)1.5 kg/blast 2.43E-03 ERPM = 3.30E-01 gPM - Drilling N/A 0.59 kg/hole 3.30E-01 s
Particulate Matter Emissions from Drilling and Blasting
An equation from Table 11.9-2, U.S. EPA AP-42 Chapter 11.9 “Western Surface Coal Mining ” (dated 7/98) was used to calculate the fugitive dust emissions associated with blasting activities. The equation is as follows: EF=0.00022×A^1.5×SFwhere: EF = PM emission factor (kg/blast) A = horizontal area (m²)
The particulate emission factors for drilling and blasting were taken from U.S. EPA AP-42 Chapter 11.9 "Western Surface Coal Mining ", Table 11.9-2 and 11.9 -4 (dated 7/98). The data quality is rated "C" or "Average".
Wet sprays are used during drilling therefore a 70% control is applied as per Table 4 in the Australian Government document "National Pollutant Inventory Emission Estimation Technique Manual for Mining " Version 3.1 dated January 2012. PM emissions from drilling are carried through to Table 2 as a maximum emission scenario because drilling and blasting cannot occur simultaneously.
Drilling and blasting activities occur at the shaft collar to support construction activities. A maximum of 2 blasts will occur per day. The largest area blasted will be 61 m². A total of 161 holes will be drilled; some for construction blasting and some for ground support. The emissions are discharged via mine ventilation at the collar surface.
\\golder.gds\gal\Sudbury\Data\Active\2014\1190 Sudbury\1192\1419949 KGHM 2015 ESDM Maintenance Victoria\ESDM Report Update\Workbook\1419949 KGHM ESDM 14July15DCC.xlsm
Page 1 of 8 Golder AssociatesMade by: DCC
Checked by: RLP

June 2015 1419949
Contaminant CAS Emulsion EF[kg/Mg]
ER[g/s]
ANFO EF[kg/Mg]
ER[g/s] Total [g/s] Sample Calculation
Carbon Monoxide 630-08-0 2.3 3.91E-01 34 2.18E+00 2.57E+00 Blasting- Carbon MonoxideNitrogen Oxides 11104-93-1 0.2 3.40E-02 8 5.13E-01 5.47E-01 ERCO = Emission Rate for Emulsion + Emission Rate for ANFOSulphur Dioxide 7446-09-5 — — 0.06 3.85E-03 3.85E-03
ERCO = 2.3 kg 0.612 Mg 1000 g 1 hr + 34 kg 0.231 Mg 1000 g 1 hrMg hr kg 3600 s Mg hr kg 3600 s
ERCO = 3.91E-01 g + 2.18E+00 gs s
ERCO = 2.57E+00 gs
Gaseous Emissions from Blasting
The Carbon Monoxide, Nitrogen Oxides and Sulphur Dioxide emission factors for the blasting using ANFO and emulsion explosives was obtained from the Australian NPI "Emission estimation technique manual for Explosives detonation and firing ranges " Version 3.0 January 2012. The data quality is rated "U" or "Unrated" for Emulsion and "D" or "Below Average" for ANFO. The emissions of Carbon Monoxide, Nitrogen Oxides and Sulphur Dioxide from the blast are estimated to occur over a 1-hr averaging period for comparison with the 1-hr standards. These 1-hr averaged emission rates are conservative when used in modelling for the 24-hr averaging period. This will result in conservative contributions to the 24-hr average POI concentrations for these contaminants.
\\golder.gds\gal\Sudbury\Data\Active\2014\1190 Sudbury\1192\1419949 KGHM 2015 ESDM Maintenance Victoria\ESDM Report Update\Workbook\1419949 KGHM ESDM 14July15DCC.xlsm
Page 2 of 8 Golder AssociatesMade by: DCC
Checked by: RLP

June 2015 1419949
Propane Comfort Heating Sources
Sample Calculation for WTP1Source ID Building Source Description Btu Rating
[MMBtu/hr]Btu Rating of Heater = 0.300 MMBtu/hr WTP1 Water Treatment Plant Water Treatment Plant Heater 0.300U.S. EPA AP-42 Emission Factor = 13 lb/10³ gal WTP2 Water Treatment Plant Water Treatment Plant Heater 0.300Heat Content of Propane = 91.5 MMBtu/103 gal (from Table 1.5-1 of AP-42 EF document) WTP3 Water Treatment Plant Water Treatment Plant Heater 0.300
WTP4 Water Treatment Plant Water Treatment Plant Heater 0.300ERNOx = 0.3 MMBtu x 13 lb x 453.59 g x 1 hr x 1000 gal FAR Emissions attributed to Collar Mine Air Heater 1.100
hr 1000 gal lb 3600 s 91.5 MMBtuERNOx = 5.37E-03 g
s
NOx emissions for the other sources were calculated in the same manner as above
1.97E-025.37E-03
Propane heaters are used for comfort heating in Water Treatment Plant and for the Mine Air Heater.
NOx Emission Rate[g/s]
5.37E-035.37E-035.37E-03
The emission rates for the propane fired heaters were calculated using emission factors from the U.S. EPA AP-42 Chapter 1.5 "Liquefied Petroleum Gas Combustion " (dated 7/08) and are based on the heat input rating for the heaters as shown in the table below. The data quality is rated "E" or "Marginal".
The emission rates of Nitrogen Oxide are calculated using a 1-hr averaging period and are therefore conservative when used in modelling for the 24-hr averaging period. This will result in conservative contributions to the 24-hr average POI concentrations for this contaminant.
\\golder.gds\gal\Sudbury\Data\Active\2014\1190 Sudbury\1192\1419949 KGHM 2015 ESDM Maintenance Victoria\ESDM Report Update\Workbook\1419949 KGHM ESDM 14July15DCC.xlsm
Page 3 of 8 Golder AssociatesMade by: DCC
Checked by: RLP

June 2015 1419949
Ammonia StripperWater Treatment Plant
Maximum ammonia influent concentration = 100 mg/LMinimum ammonia effluent concentration = 5 mg/LPlant capacity = 1400 L/min
ER = 100 mg - 5 mg x 1400 L x 1 min x 1 gL L min 60 s 1000 mg
ER = 2.22E+00 gs
Note: CAS No. for ammonia is 7664-41-7
Ammonia is stripped from the mine water in the water treatment plant. The maximum influent ammonia concentration, the minimum effluent ammonia concentration and the capacity of the plant are used to determine the maximum possible ammonia emissions from the plant. This is a conservative assumption.
)(
\\golder.gds\gal\Sudbury\Data\Active\2014\1190 Sudbury\1192\1419949 KGHM 2015 ESDM Maintenance Victoria\ESDM Report Update\Workbook\1419949 KGHM ESDM 14July15DCC.xlsm
Page 4 of 8 Golder AssociatesMade by: DCC
Checked by: RLP

June 2015 1419949
Individual Diesel Generators IDGEN1-IDGEN7
Source ID Power Rating[kW]
Power Rating[hp]
IDGEN1 40 54 Contaminant CAS # EF[lb/hp-hr]
EFReference
IDGEN2 100 134 CO 630-08-0 6.68E-03 U.S. EPA AP-42IDGEN3 100 134 NOx 10102-44-0 3.10E-02 U.S. EPA AP-42IDGEN5 230 308 PM N/A 2.20E-03 U.S. EPA AP-42IDGEN6 100 134 SO2 7446-09-5 2.05E-03 U.S. EPA AP-42IDGEN7 200 268
Source ID Power Rating[kW]
Power Rating[hp] Contaminant CAS #
EF [g/hp-hr] EF
Reference
IDEGEN5 230 308 CO 630-08-0 2.6 Tier 3NOx 10102-44-0 3.0 Tier 3PM N/A 0.15 Tier 3SO2 7446-09-5 2.05E-03 U.S. EPA AP-42
Source ID Power Rating[kW]
Power Rating[hp] Contaminant CAS #
EF [g/hp-hr] EF
ReferenceGEN1 223 299 CO 630-08-0 2.6 Tier 2
NOx 10102-44-0 4.9 Tier 2Sample Calculation for IDGEN1 PM N/A 0.15 Tier 2
ERNOx = 54 hp x 3.10E-02 lb x 453.6 g x 1 hr SO2 7446-09-5 2.05E-03 U.S. EPA AP-42hp-hr lb 3600 s
ERNOx = g/s
Sample Calculation for IDGEN5ERNOx = 308 hp x 3.0 g x 1 hr
hp-hr 3600 sERNOx = g/s
The contaminants CO and PM were calculated in a similar manner. The results are tabulated in the emission summary table below.
The emission rate for SO2 was calculated as follows:ERSO2= 308 hp x 2.05E-03 lb x 453.6 g x 1 hr
hp-hr lb 3600 sERSO2 = g/s7.97E-02
Individual diesel generators are used for on-site power generation at various locations on site. Source GEN1 is associated with the primary crusher at the Potentially Acid-Generating (PAG) rock stockpile.
Emission factors for generators IDGEN1-IDEN4 and IDGEN6-7 were obtained from U.S. EPA AP-42 Chapter 3.3 "Gasoline and Diesel Industrial Engines " Table 3.3-1, section dated 10/96. The emission factor for oxides of sulphur was taken to be the emission factor for sulphur dioxide (SO2) and the emission factor for PM10 was taken to be the emission factor for particulate matter (PM). The data is of "Marginal" quality.
The emission factors for IDGEN5 and GEN1 were taken from Nonroad Compression-Ignition Engines -- Exhaust Emission Standards Table 1: Nonroad CI Engine Emission Standards Table 1 dated 07/10 for Tier 2 and Tier 3 engines. The data quality is assumed to be "Average."
The emission factor for oxides of sulphur obtained from U S EPA AP-42 Chapter 3 3 "Gasoline and Diesel Industrial Engines " Table 3 3-1 section dated 10/96 was taken to be the emission factor for sulphur dioxide (SO2) in the absence of emission factors for SO2 from
2.10E-01
Diesel Generators <600 hp
2.57E-01
Diesel Generators Tier 3 Emission Standards
Diesel Generators Tier 2 Emission Standards
All other contaminants for IDGEN1-4, IDGEN6-7 were calculated in a similar manner. The results are tabulated in the emission summary table below.
U.S. EPA AP-42 Emission Factors Generators <600hp
Emission Factors for IDGEN5
Tier 2 Emission Factors for GEN1
\\golder.gds\gal\Sudbury\Data\Active\2014\1190 Sudbury\1192\1419949 KGHM 2015 ESDM Maintenance Victoria\ESDM Report Update\Workbook\1419949 KGHM ESDM 14July15DCC.xlsm
Page 5 of 8 Golder AssociatesMade by: DCC
Checked by: RLP

June 2015 1419949
The results are tabulated in the emission summary table below.
Sample Calculation for GEN1ERNOx = 299 hp x 4.9 g x 1 hr
hp-hr 3600 sERNOx = g/s
The contaminants CO and PM were calculated in a similar manner. The results are tabulated in the emission summary table below.
The emission rate for SO2 was calculated as follows:ERSO2= 299 hp x 2.05E-03 lb x 453.6 g x 1 hr
hp-hr lb 3600 sERSO2 = g/s
The results are tabulated in the emission summary table below.
Emission Rate Summary Table
Contaminant IDGEN1[g/s]
IDGEN2[g/s]
IDGEN3[g/s]
IDGEN5[g/s]
IDGEN6[g/s]
IDGEN7[g/s]
GEN1[g/s]
CO 4.51E-02 1.13E-01 1.13E-01 2.23E-01 1.13E-01 2.26E-01 2.16E-01NOx 2.10E-01 5.24E-01 5.24E-01 2.57E-01 5.24E-01 1.05E+00 4.07E-01PM 1.49E-02 3.72E-02 3.72E-02 1.29E-02 3.72E-02 7.43E-02 1.25E-02SO2 1.39E-02 3.46E-02 3.46E-02 7.97E-02 3.46E-02 6.93E-02 7.72E-02
4.07E-01
7.72E-02
\\golder.gds\gal\Sudbury\Data\Active\2014\1190 Sudbury\1192\1419949 KGHM 2015 ESDM Maintenance Victoria\ESDM Report Update\Workbook\1419949 KGHM ESDM 14July15DCC.xlsm
Page 6 of 8 Golder AssociatesMade by: DCC
Checked by: RLP

June 2015 1419949
Primary Crushing
PM Emissions from Crushing, Screening and Stacking Activities
Source IDMaximum
Processing [tonnes/day]
EF[kg/tonne] % Control Emission
Rate [g/s]
RBREAKER 20 0.0027 0 6.25E-04PCRUSH 1000 0.0027 0 3.13E-02PSTACK 1000 0.0015 50 8.68E-03
Sample Calculation for PSTACK
ERPM = Processing rate x EF x conversion factors
ERPM = 1000 tonnes x 0.0015 kg x 1000 g x 1 day x 1 hr x ( 100 - 50 )day tonne kg 24 hr 3600 s 100
ERPM = 8.68E-03 gs
Source Description
Primary CrusherStacker
The facility operates a portable crushing plant to perform on-site primary crushing and stacking of Potentially Acid-Generating (PAG) rock. A rock breaker is also used for oversize material. The particulate matter (PM) emission factors were obtained from U.S. EPA AP-42 Chapter 11.19.2 "Crushed Stone Processing and Pulverized Mineral Processing" Table 11.19.2-1, section dated 8/04. The data is of "Marginal" quality. The tertiary crushing emission factors for the Rockbreaker and the Primary Crusher were conservatively used in the absence of emission factors for primary crushing.
The portable unit consists of one 9'7" discharge height conveyor for stacking. A 50% control factor has been applied to the stacker PM estimates to account for the full skirting to the head pulley.
Rockbreaker
\\golder.gds\gal\Sudbury\Data\Active\2014\1190 Sudbury\1192\1419949 KGHM 2015 ESDM Maintenance Victoria\ESDM Report Update\Workbook\1419949 KGHM ESDM 14July15DCC.xlsm
Page 7 of 8 Golder AssociatesMade by: DCC
Checked by: RLP

June 2015 1419949
Source ID PAG_SP1 PAG_SP2
Source Description PAG Material Handling 1
PAG Material Handling 2
Where: Material Processing Rate [Mg/day] 1000 1000E = Emission Factor [kg/Mg] PM EF [kg/Mg] 6.27E-04 6.27E-04
k = particle size multiplier Contaminant CAS ER [g/s] ER [g/s]U = Mean wind speed [m/s] PM N/A 7.26E-03 7.26E-03M = Material moisture content [%]
Sample Calculation (for PAG_SP1)U = 3.62M = 5 % Material Processing Rate = 1000 Mg/dayk (<30 µm) = 0.74
EFPM = 0.74 x 0.0016 3.62 1.3 5 1.42.2 2
EFPM = 6.27E-04 kg/Mg
ERPM = 6.27E-04 kg x 1000 x 1000 g x 1 day x 1 hrMg day kg 24 hr 3600 s
ERPM = 7.26E-03
Mg
g/s
Material Handling
EF = k x 0.0016 x ((U/2.2)1.3)/(M/2)1.4))
Particulate Matter (PM) emissions due to material handling in stockpiles are estimated using the method described in the US EPA AP-42 Chapter 13.2.4 "Aggregate Handling and Storage Piles " (11/06). The emission factor has a quality rating of Above-Average.
(Average wind speed from Met data used in AERMOD model)
x (( ) / ( ) )
\\golder.gds\gal\Sudbury\Data\Active\2014\1190 Sudbury\1192\1419949 KGHM 2015 ESDM Maintenance Victoria\ESDM Report Update\Workbook\1419949 KGHM ESDM 14July15DCC.xlsm
Page 8 of 8 Golder AssociatesMade by: DCC
Checked by: RLP

EMISSION SUMMARY AND DISPERSION MODELLING REPORT
July 2015 Report No. 1419949
APPENDIX C Supporting Information for Emission Rate Calculations


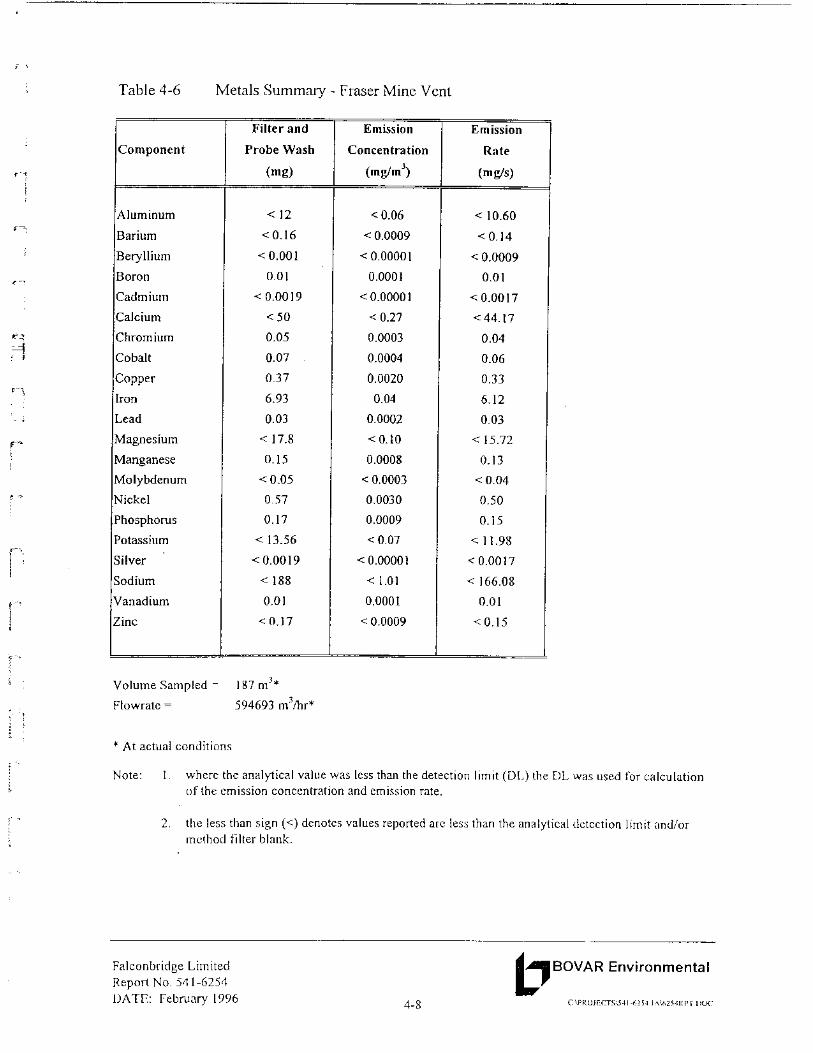

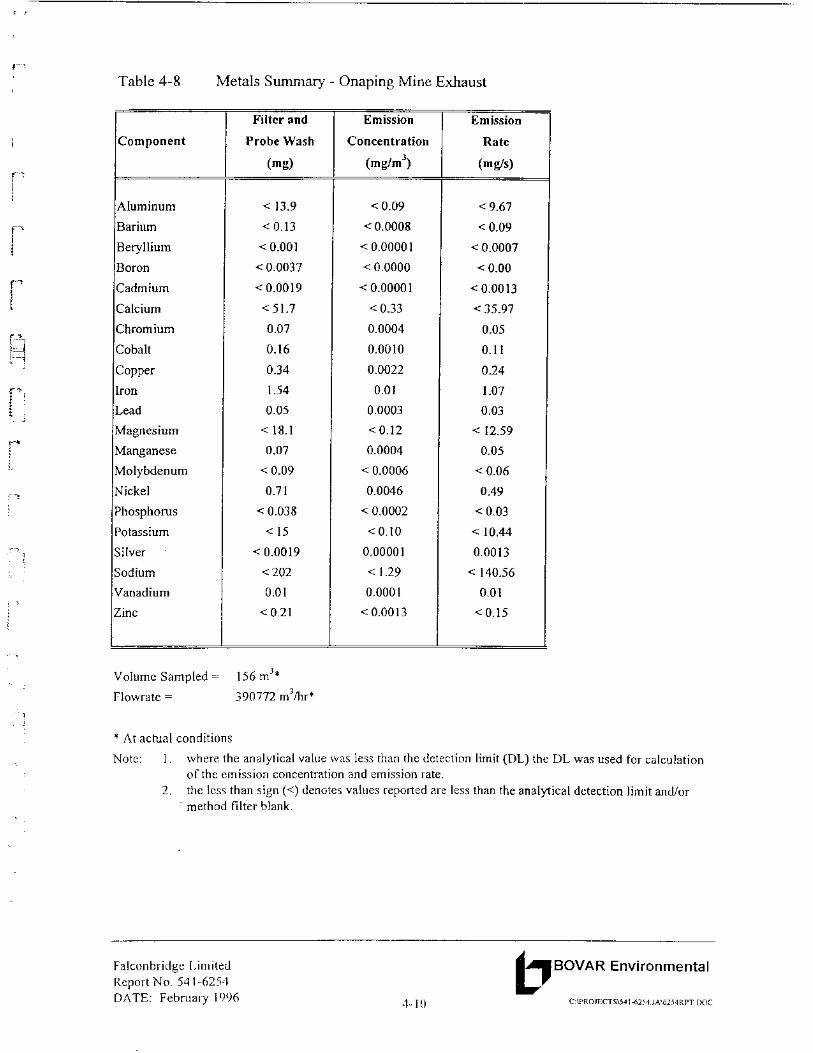


Ontario Mining Association Revised DRAFT February 2003 Emission Inventory Guidance Document Page 63
Table 4-12 AP-42 Emission Factors for Explosives Detonation
EMISSION FACTOR FOR EXPLOSIVES KG/TONNE
CO Methane NOx NH3 HCN H2S SO2 Black powder 85 2.1 ND NA NA 12 NA
Smokeless powder 38 0.6 ND NA NA 10 NA
Dynamite, straight 141 1.3 ND NA NA 3 NA
Dynamite, ammonia 32 0.7 ND NA NA 16 NA
Dynamite, gelatin 52 0.3 26 NA NA 2 1
ANFO 34 NA 8 NA NA NA 1 TNT 398 7.2 ND 14 13 NA NA RDX 98 NA ND 22 NA NA NA PETN 149 NA ND 1.3 NA NA NA
Source: USEPA, AP-42, Table 13.3-1 Notes: Emission Rating Factor for all of the above: “D” NA = Not Available
4.5.12 Mine Ventilation
Generally, mine ventilation exhaust is a high volume source with very low concentrations of various species. The contaminants found in the exhaust include particulate, NOx, VOCs, NH3 and metals which are typically from diesel combustion and blasting. Previous studies (Ciccone and Adams, 1996) for Falconbridge have shown that PM concentrations range between 0.7-1 mg/m3, NOx levels are between 4.4 –1.9 ppm and CO levels are between 7.4 –2.4 ppm. These have been compared to other reports for different mines and all the data fall within the same range. It is suggested that with respect to estimating annual emissions from the mine ventilation raises, the emission factors in Table 4-13 be used.
The above emission factors along with the ventilation flows can be used with equations 3-1, 3-2 and 3-6 to calculate the emissions. Care must be taken to ensure that the temperature of the ventilation flow is corrected to 25°C.
Note that the above emission factors include tail-pipe emissions from the under-ground equipment. These need to be subtracted from the above emissions. On-site diesel vehicles will emit PM (assumed as PM10), CO, NOx , SO2 and VOC’s. Emission factors for various mine-site vehicles are presented in Table 4-14.

Ontario Mining Association Revised DRAFT February 2003 Emission Inventory Guidance Document Page 64
Table 4-13 Emission Factor for Mine Ventilation
CONTAMINANT EMISSION FACTOR
UNITS
PM 0.86 mg/m3 @ 25°C PM10 0.43 mg/m3 @ 25°C PM2.5 0.22 mg/m3 @ 25°C Nox 3.16 ppmv CO 3.74 ppmv
Source: BOVAR Environmental, 1996, Report for Falconbridge Ltd., Table 1 Note: PM10 and PM2.5 assumed to be 50% and 25% of PM, respectively NOx is expressed as NO
Table 4-14 Mine-Site Vehicle Tail-Pipe Exhaust Emission Factors
EQUIPMENT TYPE EMISSION FACTOR (KG/1000 LITRE DIESEL FUEL)
PM CO NOX SO2 VOC Formalde
hyde Rating Track Type Tractor 9.8 30.6 111.4 12.1 10.7 2.4 N/A Wheeled Tractor 18.0 104.4 169.8 12.1 25.0 4.0 N/A Wheeled Dozer 5.8 49.9 115.7 12.3 5.3 2.3 N/A Scraper 11.3 34.8 106.1 12.8 7.9 4.0 N/A Grader 8.9 21.9 101.6 12.4 5.1 1.7 N/A Off-Highway Truck 7.1 49.9 115.7 12.6 5.3 3.1 N/A Wheeled Loader 11.5 38.5 125.2 12.2 16.9 2.8 N/A Track type Loader 9.3 32.2 132.7 12.1 15.8 1.4 N/A Source: Environment Australia, NPI, Emission Estimation Technique Manual for Combustion Engines Version 2.1, Section 3.4.1, Table 5. Assuming the heating value of diesel fuel to be 38.21 MJ/L (Source: Appendix 1, Table 25 of the above document) PM10 emission factors for these sources are identical to PM emission factors. To obtain emission factors for PM2.5, multiply by 0.5
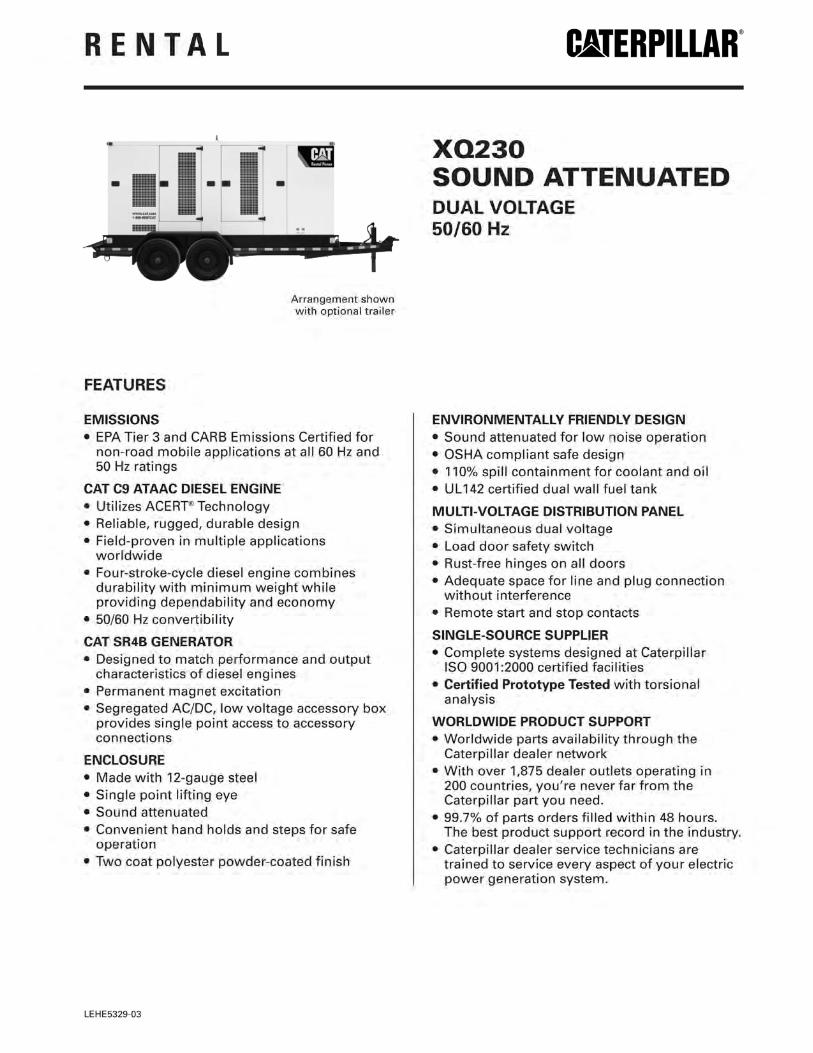


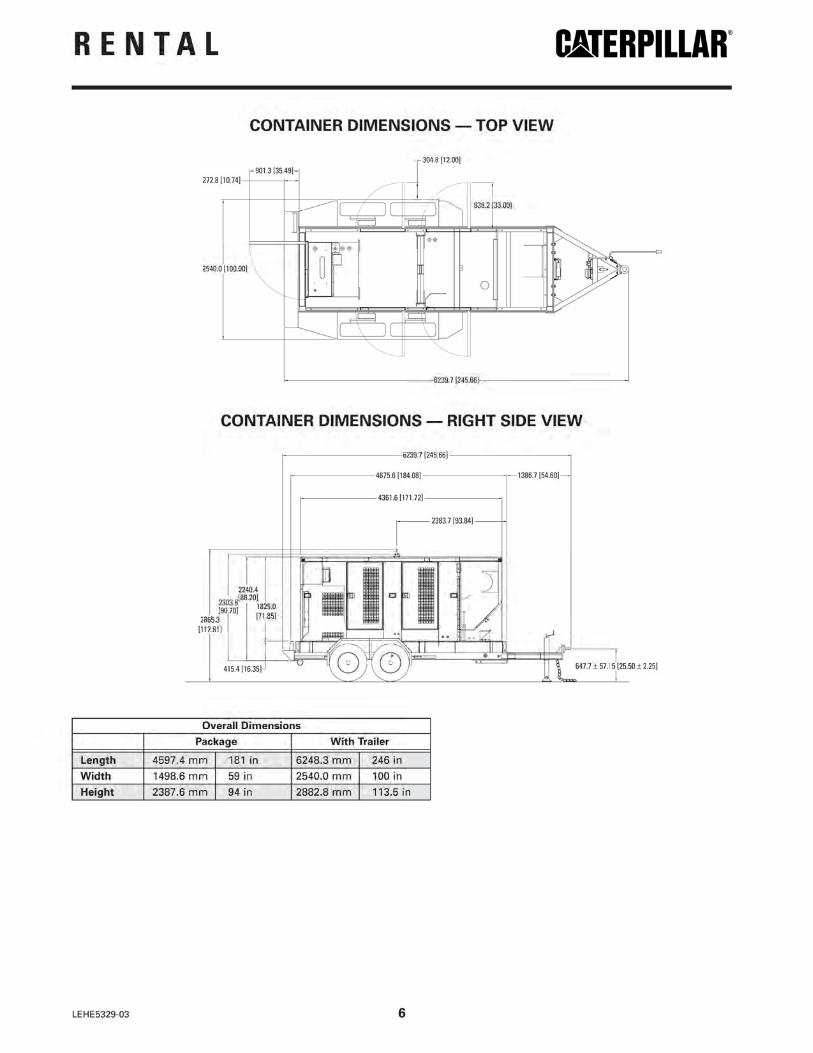


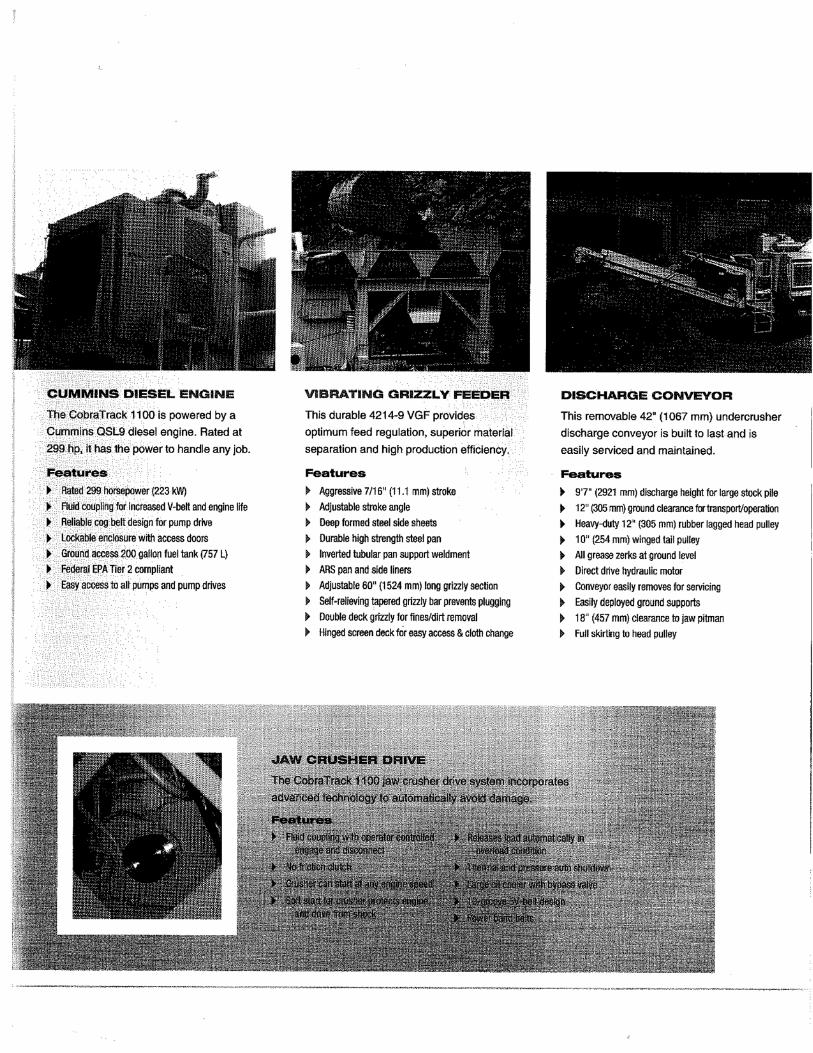


EMISSION SUMMARY AND DISPERSION MODELLING REPORT
July 2015 Report No. 1419949
APPENDIX D Dispersion Modelling Files (CD Only)
EMISSION SUMMARY AND DISPERSION MODELLING REPORT
July 2015 Report No. 1419949
APPENDIX E Emergency Diesel Equipment Assessment

APPENDIX E Emergency Diesel Equipment Assessment
July 2015 Project No. 1419949 1/2
Emergency Diesel Equipment Assessment
Introduction
A screening level assessment was completed for the Emergency Diesel Equipment at the FNX Mining Company Inc. (FNX) Victoria Advanced Exploration Project in Denison Township in Sudbury, Ontario (the Facility)) using the approach outlined in the Emergency Generator Checklist Supplement to Application for Approval, EPA s.9 PIBS 7976e, dated November, 2010 (the EG Checklist).
The source assessed herein (the Equipment) is Source EG1 - One diesel powered emergency generator (EG) with an output power capacity of 3,000 kW (4,023 horsepower).
Source EG1 meets the criteria for a standby power source as defined in Ontario Regulation (O.Reg.) 419/05, as amended by O.Reg.516/07, thus section 20 does not apply.
This document provides supporting documentation including an assessment of the contaminants, assessment of receptors, dispersion modelling, emission summary, noise assessment and other information required by the EG Checklist as follows:
EMERGENCY GENERATOR CHECKLIST
Supporting Documentation Included Location
Brief description of the facility ESDM Report Section 1.2
Brief description of the intended use of the emergency generator(s) Appendix E1
Brief description of the generator(s) including fuel type and kilowatt power rating Appendix E1
Location of emergency generator(s) (e.g. indoors, outdoors in enclosure) Figure E1
Land use zoning designation plan (best available information for the area) ESDM Report Figure 4
Site Plan drawn to scale indicating the location of source(s), nearby buildings, property line and receptors
Figure E1, Figure E2
Elevation Drawing drawn to scale Appendix E1
Distance to the closest sensitive receptor (e.g. child care facility, health care facility, school, senior citizen’s residence)
Figure E2
Distance to the closest Point of Reception and a brief description of the Point of Reception Figure E2, Emergency Diesel
Equipment Assessment

APPENDIX E Emergency Diesel Equipment Assessment
July 2015 Project No. 1419949 2/2
Supporting Documentation Included Location
Noise Statement (if applicable) including supporting information
The Facility is sufficiently far from the closest sensitive receptor.
Source Summary Table Table E1
Dispersion Modelling Input Data and Output Results ESDM Report Appendix D
(on CD)
Emission Summary Table Table E2
Manufacturer Specification Sheets (if available) Appendix E1
Note: Based on Emergency Generator Checklist Supplement to Application for Approval, EPA s.9 (PIBS: 4131e)
Assessment of Contaminants
The Equipment is expected to emit products of combustion; refer to Appendix E1 for detailed calculations. Nitrogen oxides are the only contaminants required to be assessed as per the EG Checklist.
The emission factor used to calculate the emission rate was taken from the manufacturer’s specification sheets included in Appendix E1. Stack and/or modelling parameters are provided in Table E1 – Emergency Diesel Equipment Dispersion Modelling Source Summary Table.
Assessment of Receptors
The following table describes the receptors that were considered in this assessment. Receptors locations are shown on Figure E2.
Receptor Type Description
Non-Sensitive All receptors included in the nested receptor grid, as described in section 6.6 of the ESDM Report
Sensitive Den Lou Community Centre/Hall, 26 Den Lou Road, Whitefish
Dispersion Modelling
The Equipment meets the criteria for standby power sources as defined in O.Reg.419/05, as amended by O.Reg.516/07, thus section 20 does not apply. The EG Checklist has set a screening level of 1,880 µg/m3 for a maximum ½-hour averaging period at non-sensitive receptors and the Schedule 2 POI Standard of 500 µg/m³ for nitrogen oxides applies at sensitive receptors. The maximum point of impingement (POI) impact was calculated

APPENDIX E Emergency Diesel Equipment Assessment
July 2015 Project No. 1419949 3/2
using the United States Environmental Protection Agency’s AERMOD dispersion model. Dispersion Modelling was conducted in accordance with the MOE publication, Air Dispersion Modelling Guideline for Ontario, Version
2.0, dated March 2009, PIBS 5165e02 and as described in section 6 of the ESDM Report.
Source EG1 was represented as a point source in the dispersion modelling. Potential building wake effects on point source EG1 were considered in this assessment using the U.S. EPAs Building Profile Input Program (BPIP-PRIME), which is a pre-processor to AERMOD. The inputs to this pre-processor that were used for this assessment include the coordinates and heights of surrounding buildings and stack characteristics for point source EG1.
The PRIME plume rise algorithms include vertical wind shear calculations [important for buoyant releases from short stacks (i.e. stacks at release heights within the recirculation zones of buildings)]. The PRIME algorithm also allows for the wind speed deficit induced by the building to change with respect to the distance from the building. These factors improve the accuracy of predicted concentrations within building wake zones that form in the lee of buildings. Refer to Figure E1 which illustrates the BPIP inputs.
The one-hour concentrations predicted by the AERMOD dispersion model, after the meteorological anomalies were removed, were converted to ½-hour concentrations for direct comparison to the EG Checklist screening level limit of 1,880 µg/m³ for non-sensitive receptors and the Schedule 2 POI Standard of 500 µg/m³ for sensitive receptors. Dispersion modelling results are summarized in Table E2 – Emergency Diesel Equipment Emission Summary Table.
The resulting maximum POI concentration of 73.0 µg/m³ at the nearest receptor along the property boundary is below the EG Checklist screening level limit of 1,880 µg/m³. In addition, the resulting concentration of 18.0 µg/m³ at the nearest sensitive receptor is also below the Schedule 2 POI Standard for nitrogen oxides of 500 µg/m³.
All dispersion modelling input and output files are provided in Appendix E2 on CD.
Emissions Summary
As demonstrated in Table E2 – Emergency Diesel Equipment Emission Summary Table, the results from the dispersion modelling demonstrate that emissions resulting from testing of Source EG1 are in compliance with the screening levels set forth in the EG Checklist for sensitive and non-sensitive receptors.
Noise Assessment
Per the EG Checklist, if the emergency generator is located outdoors, in an enclosure and the combustion exhaust stack is greater than 60 m from the nearest residence or sensitive receptor, a Noise Statement is not required. Since the Equipment is located far more than 60 m from the nearest residence or sensitive receptor, a noise statement has not been prepared.

APPENDIX E Emergency Diesel Equipment Assessment
July 2015 Project No. 1419949 4/2
Closure
The assessment as described herein, demonstrates that the Equipment can operate in compliance with applicable MOECC criteria as set-out for emergency power generators.

July 2015 1419949
POINT SOURCE
Modelling ID Source Description
Stack Volumetric Flow Rate
[Am³/s]
Stack Gas Exit Velocity
[m/s]
Stack Exit Gas
Temperature [K]
Stack Inner Diameter [m]
Stack Height Above Grade
[m]
Stack Height Above Roof
[m]Stack UTM X Stack UTM Y
Source NOx Emission Rate
[g/s]
Averaging Period [hours]
Emission Estimating Technique
Emissions Data Quality
EG1 3 MW Emergency Generator 11.56 70.49 753.55 0.457 5.00 1.50 470573 5139743 6.02E+00 ½ EF Marginal
"EF" - Emission Factor CalculationNOx - Nitrogen Oxide
Table E1Emergency Diesel Equipment Dispersion Modelling Source Summary Table
N:\Active\2014\1190 Sudbury\1192\1419949 KGHM 2015 ESDM Maintenance Victoria\ESDM Report Update\Workbook\1419949 KGHM ESDM 1July15DCC.xlsm
Page 1 of 2 Golder AssociatesMade by: DCC
Checked by: NCH

July 2015 1419949
Maximum POI Concentration
[µg/m³]*
MOE POI Limit [µg/m³]
Percentage of MOE POI Limit
[%]
Maximum POI Concentration
[µg/m³]*
MOE POI Limit [µg/m³]
Percentage of MOE POI Limit
[%]
Testing of Source EG1 Nitrogen oxides 10102-44-0 ½ AERMOD 6.02E+00 73.0 1880 3.9% 18.0 500 3.6%
*The one hour POI concentration found using the AERMOD dispersion model was converted to a half hour value using the formula in Section 4.4 of the Air Dispersion Modelling Guideline for Ontario, July 2005.
Total Scenario Emission Rate
[g/s]
Non-Sensitive Receptors Sensitive Receptor
Table E2Emergency Diesel Equipment Emission Summary Table
Scenario Description Contaminant CAS No. Air Dispersion Model Used
Averaging Period [hours]
N:\Active\2014\1190 Sudbury\1192\1419949 KGHM 2015 ESDM Maintenance Victoria\ESDM Report Update\Workbook\1419949 KGHM ESDM 1July15DCC.xlsm
Page 2 of 2 Golder AssociatesMade by: DCC
Checked by: NCH

See inset "MAP A"On-site Power Generator
On-site Power Generator
On-site Power Generator
Water TreatmentPlant
On-site Power Generator
Crusher
On-site Power Generator
EG1
On-site Power Generator
4 321
470500
470500
5140
000
5140
000
CLIENTKGHM INTERNATIO NAL LTD
NOTES
REFERENCE
THIS FIGURE IS TO BE READ IN CO NJUNCTIO N WITH THE ACCO MPANYINGGO LDER ASSO CIATES LTD. REPO RT NO . 1419949
CO NTAINS INFO RMATIO N LICENSED UNDER THE O PEN GO VERNMENT LICENCE – O NTARIO .HTTPS://WWW.O NTARIO .CA/GO VERNMENT/O PEN-GO VERNMENT-LICENCE-O NTARIOPRO JECTIO N: TRANSVERSE MERCATO R DATUM: NAD 83CO O RDINATE SYSTEM: UTM ZO NE 17 VERTICAL DATUM: CGVD28
PRO JECTEMISSIO N SUMMARY & DISPERSIO N MO DELLING REPO RTVICTO RIA MINETITLEAPPENDIX EEMERGENCY DIESEL EQUIPMENT ASSESSMENT
1419949 1000 1 E1
2015-07-22 RRDRRDDCNCH
Path: A:\_Clients\KGHM\Victoria_Mine\99_PROJ\1419949\40_PROD\RN-Air_Acoustic_Noise_Vibration\1419949-0001-RN-0010.mxd
IF THIS MEASUREMENT DOES NOT MATCH WHAT IS SHOWN, THE SHEET SIZE HAS BEEN MODIFIED FROM:
CO NSULTANT
PRO JECT No. PHASE Rev. FIGURE
YYYY-MM-DDPREPAREDDESIGNREVIEWAPPRO VED
25mm
0
0 30 6015METRES
1:2,000SCALE
LEGEND
3MW Em ergenc y Genera torMine Infra s truc ture / Build ings
Id Easting Northing1 470571 51397462 470575 51397463 470575 51397404 470571 5139740
3MW Emergency Generator
4 3
21
EG1
MAP A
Build ing Corners

#
"
_̂
Fairbank Lake Road
CreanHill Road
%k
%k
LockerbyMine
Crean HillMine
TottenMine
4.9 KM
2.0 KM
FairbankLake
SkillLake
BassLake
EthelLake
PerchLake
St. PothierLake
Mond Lake
MonkLake
CLIENTKGHM INTERNATIONAL LTD
NOTES
REFERENCE
THIS FIGURE IS TO BE READ IN CONJUNCTION W ITH THE ACCOMP ANYINGGOLDER ASSOCIATES LTD. REP ORT NO.1419949
BASE DATA - ATLAS OF CANADA,BASE IMAGERY - MICROSOFT BING ©2015 MICROSOFT CORP ORATION AND ITS DATASUP P LIERS.CONTAINS INFORMATION LICENSED UNDER THE OP EN GOVERNMENT LICENCE – ONTARIO.HTTP S://W W W.ONTARIO.CA/GOVERNMENT/OP EN-GOVERNMENT-LICENCE-ONTARIOP ROJECTION: TRANSVERSE MERCATOR DATUM: NAD 83COORDINATE SYSTEM: UTM ZONE 17 VERTICAL DATUM: CGVD28
P ROJECTEMISSION SUMMARY & DISP ERSION MODELLING REP ORTVICTORIA MINETITLEAPPENDIX EEMERGENCY DIESEL EQUIPMENT ASSESSMENT
1419949 1000 1 E2
2015-07-22 RRDRRDDCNCH
Path: A:\_Clients\KGHM\Victoria_Mine\99_PROJ\1419949\40_PROD\RN-Air_Acoustic_Noise_Vibration\1419949-0001-RN-0011.mxd
IF THIS MEASUREMENT DOES NOT MATCH WHAT IS SHOWN, THE SHEET SIZE HAS BEEN MODIFIED FROM:
CONSULTANT
P ROJECT No. P HASE Re v. FIGURE
YYYY-MM-DDP REP AREDDESIGNREVIEWAP P ROVED
25mm
0
0 990 1,980495METRES
1:50,000SCALE
Legend
Re c e ptor Grid" Se nsitive Re c e ptor#Maxim u m P OI Conc e ntration - Non-Se nsitive Re c e ptors
APPENDIX E Emergency Diesel Equipment Assessment
July 2015 Project No. 1419949
APPENDIX E1 Supporting Information

June 2015 1419949
Emergency Diesel Equipment
Equipment InformationSource ID
EG1
Nitrogen Oxide Emissions
Source ID Power Output[MW]
Power Output[HP]
Emission Factor
Emission Factor Unit
Emission Rate [g/s]
EG1 3.00 4023 5.39 g/HP-hr 6.02E+00
Sample Calculation for EG:
ERNOx = 5.39 g 4023 HP 1 hrHP-hr 3600 s
ERNOx = 6.02E+00 gs
Facility operations will include a diesel fired generator intended for backup power in emergency situations. The nitrogen oxides emission factor was obtained from the manufacturer specifications which are provided with this memorandum.
3 MW Diesel GeneratorDescription
N:\Active\2014\1190 Sudbury\1192\1419949 KGHM 2015 ESDM Maintenance Victoria\ESDM Report Update\Workbook\1419949 KGHM ESDM 30June15 DCC.xlsm
Page 1 of 1 Golder AssociatesMade by: DCC
Checked by: NCH

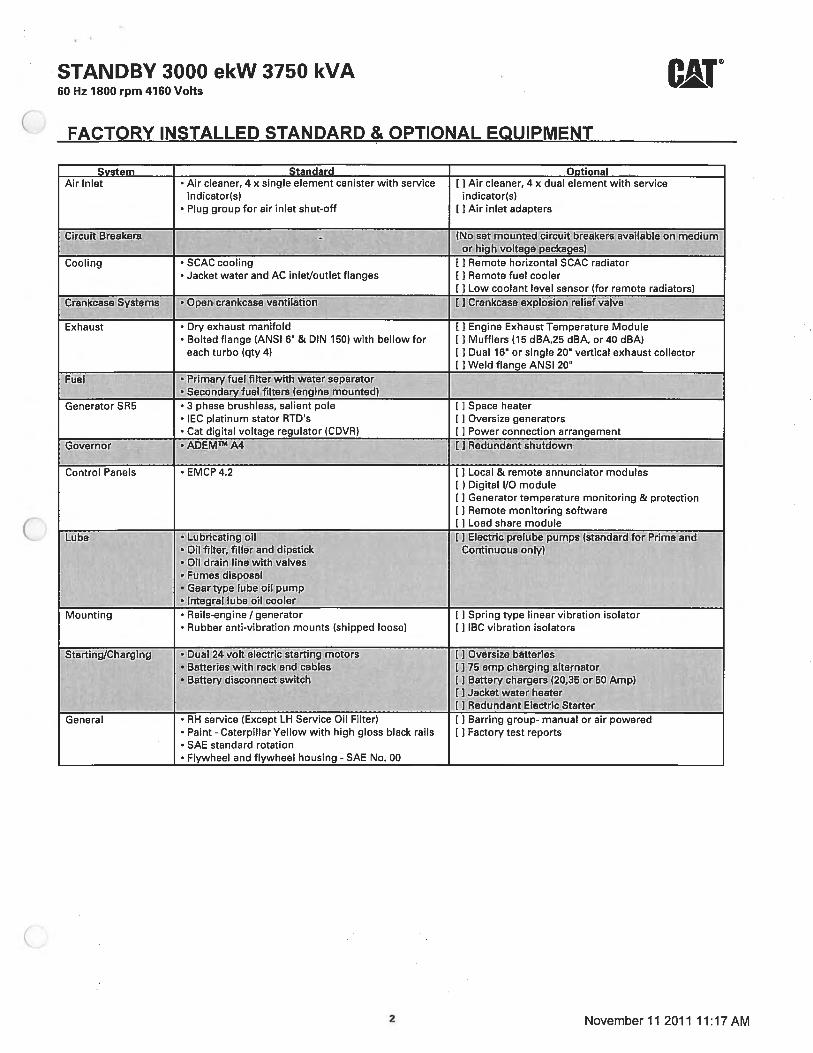

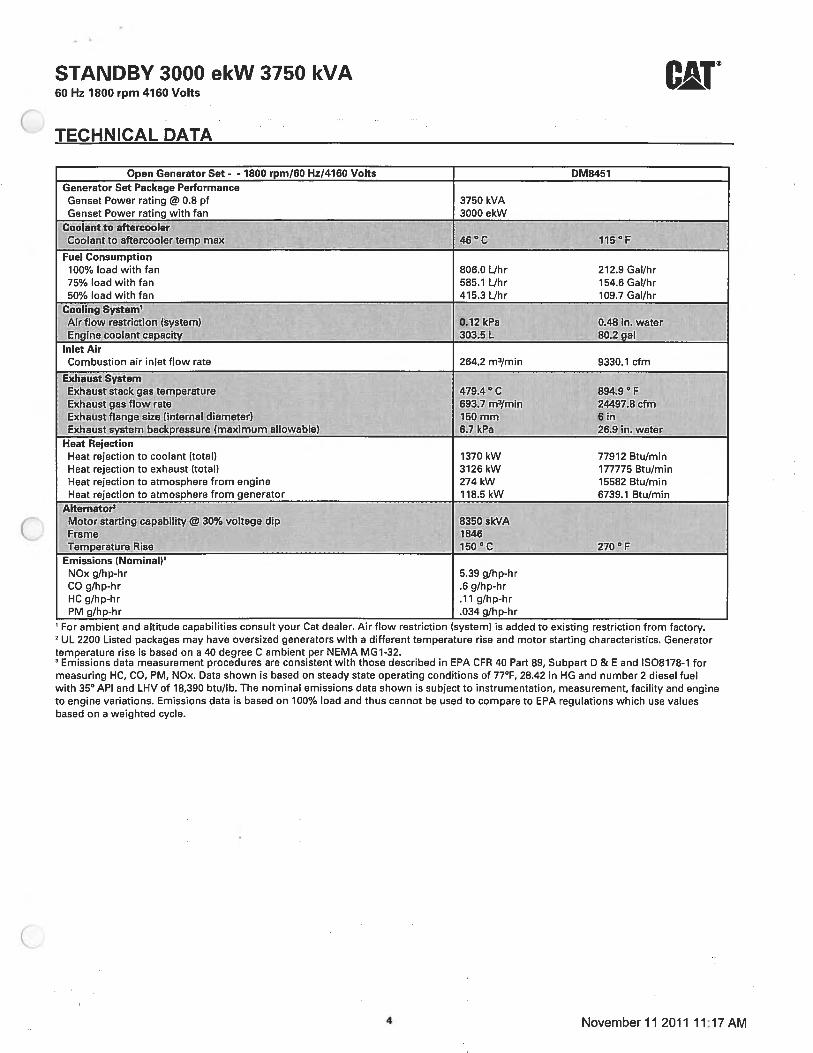


Golder Associates Ltd.
33 Mackenzie Street, Suite 100
Sudbury, Ontario, P3C 4Y1
Canada
T: +1 (705) 524 6861
Caption Text