focal enhancement of the skeleton to exercise...
TRANSCRIPT

RESEARCH ARTICLE
Focal enhancement of the skeleton to exercise correlates withresponsivity of bone marrow mesenchymal stem cells rather thanpeak external forcesIan J. Wallace1,*,‡,§, Gabriel M. Pagnotti2,‡, Jasper Rubin-Sigler3, Matthew Naeher1, Lynn E. Copes4,Stefan Judex2, Clinton T. Rubin2 and Brigitte Demes3
ABSTRACTForce magnitudes have been suggested to drive the structuralresponse of bone to exercise. As importantly, the degree to whichany given bone can adapt to functional challengesmay be enabled, orconstrained, by regional variation in the capacity ofmarrow progenitorsto differentiate into bone-forming cells. Here, we investigate therelationship between bone adaptation and mesenchymal stem cell(MSC) responsivity in growing mice subject to exercise. First, using aforce plate, we show that peak external forces generated by forelimbsduring quadrupedal locomotion are significantly higher than hindlimbforces. Second, by subjecting mice to treadmill running and thenmeasuring bone structure with μCT, we show that skeletal effects ofexercise are site-specific but not defined by load magnitudes.Specifically, in the forelimb, where external forces generated byrunning were highest, exercise failed to augment diaphyseal structurein either the humerus or radius, nor did it affect humeral trabecularstructure. In contrast, in the ulna, femur and tibia, exercise led tosignificant enhancements of diaphyseal bone areas and moments ofarea. Trabecular structure was also enhanced by running in the femurand tibia. Finally, using flow cytometry, we show that marrow-derivedMSCs in the femuraremore responsive toexercise-induced loads thanhumeral cells, such that running significantly loweredMSCpopulationsonly in the femur. Together, these data suggest that the ability of theprogenitor population to differentiate toward osteoblastogenesis maycorrelate better with bone structural adaptation than peak externalforces caused by exercise.
KEY WORDS: Physical activity, Ground reaction forces, Boneadaptation, Cortical bone, Trabecular bone, Osteoprogenitor cells,Mechanical loading
INTRODUCTIONNumerous aspects of organismal structure and function can bepositively affected by load-bearing exercise, not least of which is theskeleton. Studies of humans and other animals frequently demonstratethe potential for activities such as running and jumping to promotebone formation, delay bone loss, and, ultimately, enhance skeletal
structure and strength (e.g. Woo et al., 1981; Biewener and Bertram,1994; Lieberman et al., 2003;McKayet al., 2005;Weeks et al., 2008).Yet, as potent an anabolic stimulus as exercise may be, the parametersof the regimen that stimulate bone’s adaptive response remain difficultto identify, nor is it clear if all elements of the skeleton are equallyresponsive to loading.
It is oftenpresumed that skeletal benefits of exercise are proportionalto load magnitudes, and thus the greatest structural enhancement isexpected where the greatest functional challenges occur (Tommerupet al., 1993; Nikander et al., 2006; Wilks et al., 2009). Awell-knownexample of focal adaptation to physical demand is the humeralhypertrophyof the playing arms of tennis players and baseball pitchersrelative to their non-playing arms (Jones et al., 1977; Haapasalo et al.,2000; Warden et al., 2014). Implicitly, these athletes demonstrate theability of bone to perceive and respond to biophysical signals in a site-specific manner, perhaps to maintain an optimal mechanicalenvironment to cells regulating the response (Rubin, 1984).
Notwithstanding load magnitudes, it is also possible that the site-specificity of skeletal adaptation to exercise is defined to someextent by regional variation in the mechanoresponsiveness of boneprogenitor cells. The mesenchymal stem cell (MSC) is a pluripotentprogenitor that has the ability to differentiate into cells that formbone, fat, tendon, muscle and ligament. Accumulating evidenceindicates that fate selection of marrow-based MSCs is influenced bymechanical signals, biasing differentiation of MSCs toward boneand away from fat (Luu et al., 2009a; Ozcivici et al., 2010; Chanet al., 2012; Pagnotti et al., 2012). It has further been shown thatbone marrow in some skeletal elements may contain MSCs withgreater osteogenic potential than those located in the marrow ofother elements (Risbud et al., 2006; Volk et al., 2012), which wouldsuggest that some bones may be more responsive to exercise-induced mechanical signals than others.
In this study, we used a mouse model to examine the site-specificity of the adaptive response to treadmill-running exercisein five weight-bearing limb bones (humerus, radius, ulna, femurand tibia) and a non-weight-bearing cranial bone (interparietal).If the presumption that higher loads cause more structuralenhancement is true, then anabolic adaptation would beexpected to be greatest in those skeletal regions subject to thehighest loads. Alternatively, if the adaptive response to exercisefailed to correlate with load magnitude, perhaps it would betterassociate with a biological rather than a mechanical parameter,specifically, the osteoprogenitor population.
RESULTSLimb forces generated during locomotionTo assess the relationship between the magnitude of loads producedby exercise and the site-specific osteogenic response, we firstReceived 21 December 2014; Accepted 20 July 2015
1Department of Anthropology, Stony Brook University, Stony Brook, NY 11794,USA. 2Department of Biomedical Engineering, Stony Brook University, Stony Brook,NY 11794, USA. 3Department of Anatomical Sciences, Stony Brook University,Stony Brook, NY 11794, USA. 4Department of Medical Sciences, QuinnipiacUniversity, Hamden, CT 06518, USA.*Present address: Department of Human Evolutionary Biology, Harvard University,Cambridge, MA 02138, USA.‡These authors contributed equally to this work
§Author for correspondence ([email protected])
3002
© 2015. Published by The Company of Biologists Ltd | Journal of Experimental Biology (2015) 218, 3002-3009 doi:10.1242/jeb.118729
Journal
ofEx
perim
entalB
iology

determined whether the forelimbs or hindlimbs experience greaterexternal forces during mouse quadrupedal locomotion. To this end,the vertical component of peak ground reaction forces generated bysteady-state symmetrical gaits was measured in a sample of outbredfemale mice (N=10; 6–7 weeks old) using a force plate. Over a rangeof speeds chosen by the animals, involving both walking andrunning gaits, peak forces generated by the forelimbs weresignificantly higher than those experienced by the hindlimbs(P<0.0001; Fig. 1). Therefore, if the skeleton’s adaptive response toexercise correlates with load magnitude, then elevated locomotoractivity would be expected to augment bone structure more in theforelimbs than the hindlimbs.
Effects of running on skeletal structureThe skeletal effects of exercise were established through anexperiment in which a second cohort of female mice from thesame outbred stock were either treated with a treadmill-runningregimen for 4 weeks (N=20) or served as sedentary controls (N=20),beginning shortly after weaning (4 weeks of age). Animals assignedto the treadmill group ran 5 days week−1 for 30 min day−1.At the beginning of the experiment, body mass was not
significantly different between the experimental groups (P=0.15;Fig. 2A). In both groups, body mass increased steadily over thecourse of the experiment, with the most rapid increase occurringduring the first week. By the end of the experiment, body massremained similar between controls and runners (P=0.49). Limbmuscle mass was also not significantly different between groups atthe end of the experiment (triceps brachii: P=0.32, quadriceps:P=0.29, triceps surae: P=0.49; Fig. 2B). Home-cage activityquantified at the end of week 3 of the exercise program wascomparable between groups (Fig. 2C), such that the total numberof ambulatory movements over 24 h did not significantlydiffer between controls and runners (P=0.50; Fig. 2D). Thus, anydifferences in skeletal structure between groups can be confidentlyattributed to exercise treatment, rather than group differences inbody size, muscle mass or cage activity.The effects of treadmill running on skeletal structure (quantified
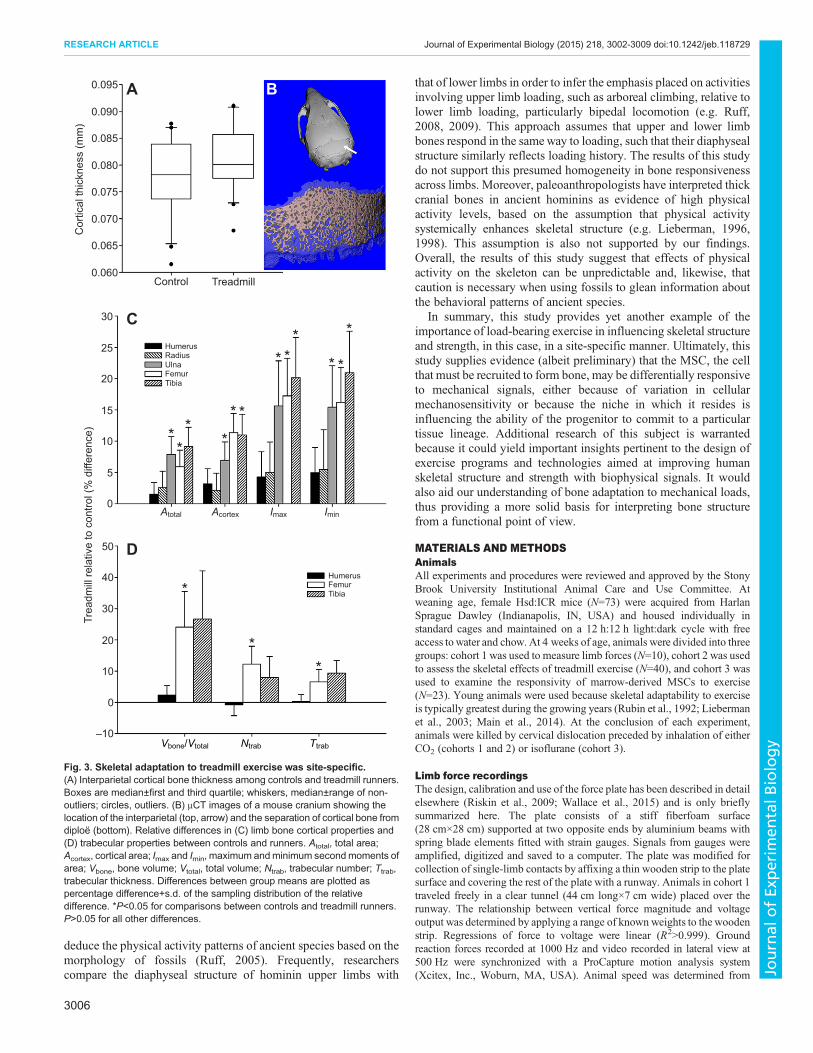
with μCT) were found to vary greatly across anatomical regions(Table 1; Fig. 3). In the cranium, where loads produced by runningwere presumably lowest, the thickness of interparietal corticalbone was not significantly altered by exercise treatment (P=0.19;Fig. 3A,B), nor was interparietal total thickness (P=0.20). Similarly,in the forelimb, where external loads generated by running werehighest, exercise failed to significantly augment mid-diaphysealcortical bone structure in either the humerus or radius (Fig. 3C).By contrast, in the ulna, running led to 6.9±3.0% greater
mid-diaphyseal cortical area (P=0.024) and 7.9±2.8% greater total(subperiosteal) area (P<0.01), as well as a 15.7±7.2% increase inmaximum second moment of area (P=0.036) and a 15.4±6.6%increase in minimum second moment of area (P=0.026). In thehindlimb, where running-induced external load magnitudes werelower than in the forelimb, exercise resulted in several significantcortical bone structural enhancements in both the femur and tibia.Compared with controls, runners had femora with 11.4±3.1% largermid-diaphyseal cortical area (P<0.001), a 9.7±2.6% thicker cortex(P<0.001) and 5.9±2.7% larger total area (P=0.032). In runners,femoral mid-diaphyseal maximum and minimum second momentsof area were increased by 17.2±6.0% (P<0.01) and 16.2±5.6%(P<0.01), respectively. In the tibia, relative to controls, runners had11.0±3.3% larger mid-diaphyseal cortical area (P<0.01), a 3.6±1.5% thicker cortex (P=0.025) and 9.1±3.1% larger total area(P<0.01). Tibial mid-diaphyseal maximum and minimum secondmoments of area were enhanced in runners by 20.2±6.4% (P<0.01)and 21.0±6.6% (P<0.01), respectively.
Responsivity of trabecular bone to exercise was also observed tovary among limb elements (Table 2; Fig. 3D). In the forelimb,exercise failed to significantly affect trabecular morphology in thedistal humeral epiphysis. By contrast, in the hindlimb, trabecularbone volume fraction in the distal femoral metaphysis was 24.1±11.4% greater in runners compared with controls (P=0.041) and
B
Speed (cm s–1)10
A
Time (s)0.05 0.10 0.15 0.20
20 30 40 50 60 70 800.08
0.10
0.12
0.14
0.16
0.18
0.20
0.22
0.24Forc
e (N
)
0.02
0
0.06
0.04
0.12
0.10
0.16
0.14
0.08
0.18
0.25
Hindlimb
Forelimb
HindlimbForelimb
Fig. 1. Mouse forelimbs generated higher peak vertical ground reactionforces than hindlimbs during quadrupedal locomotion. (A) Representativevertical ground reaction force trace from a 22.3 g mouse running at39.4 cm s−1. (B) Bivariate plot of peak vertical ground reaction forces sustainedby forelimbs and hindlimbs versus subject speed. Plotted lines weredetermined by least-squares regression. P<0.0001 for ANCOVA comparisonbetween forelimb and hindlimb forces with speed as a covariate.
List of symbols and abbreviationsAcortex cortical areaAmarrow marrow areaAtotal total areaImax maximum second moment of areaImin minimum second moment of areaMSC mesenchymal stem cellNtrab trabecular numberStrab trabecular separationTcortex mean cortical thicknessTdip mean diploë thicknessTtrab trabecular thicknessTtotal mean total thicknessVbone bone volumeVtotal total volume
3003
RESEARCH ARTICLE Journal of Experimental Biology (2015) 218, 3002-3009 doi:10.1242/jeb.118729
Journal
ofEx
perim
entalB
iology

trabecular number was 12.2±5.8% higher (P=0.043). Moreover, inthe proximal tibial metaphysis, trabeculae were 9.3±4.1% thicker asa result of running (P=0.028).
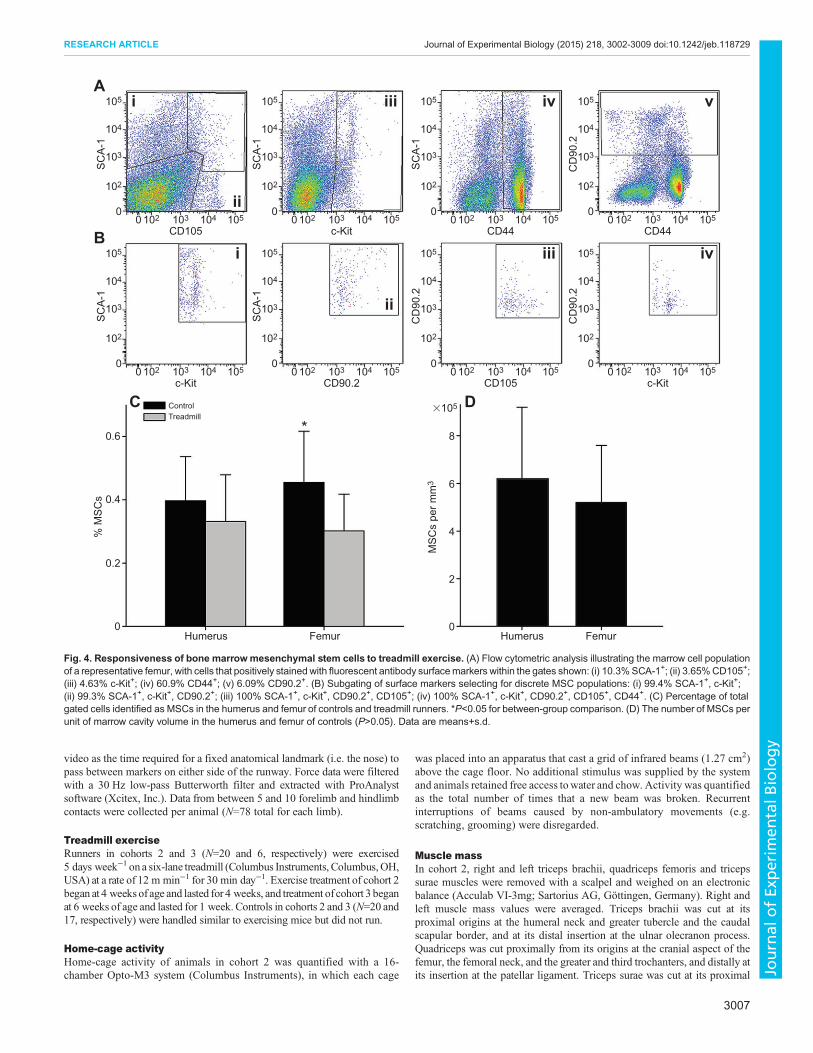
Marrow-derived mesenchymal stem cellsThe responsivity to exercise of marrow-derived MSCs in thehumerus and femur was determined by treating a third cohortof female mice from the same outbred stock (N=6) to 5 days oftreadmill running (30 min day−1) beginning at 6 weeks of age andcomparing MSC populations at the end of the experimental period(quantified with flow cytometry) with those obtained from a sampleof age-matched controls (N=17). In the humerus, MSCs in the bonemarrow population, identified as positive for SCA-1, c-Kit, CD90.2,CD105 and CD44 surface antigens (Fig. 4A,B), did not differbetween runners and controls (P=0.39; Fig. 4C), whereas in thefemur, running significantly lowered the number of MSCs(P=0.044), implying that they had been signaled away from theirprogenitor state. The number of MSCs relative to marrow cavityvolume was not significantly different between the two bones incontrols (P=0.61; Fig. 4D), indicating that baseline density ofMSCsin the humerus and femur was similar.
DISCUSSIONThis study demonstrates the adaptive capacity of the mouse skeletonto be site-specific, with some regions being more responsive thanothers to exercise-induced loads. Treadmill running stimulatedsignificant cortical bone structural enhancement in the femur, tibia
and ulna, whereas cortical structure failed to respond in the humerusand radius, despite external load magnitudes being significantlyhigher in the forelimb as opposed to the hindlimb. Trabecularstructure was also significantly enhanced by exercise in the femurand tibia, but exercise failed to initiate an anabolic response in thehumerus. Cranial bone morphology was not influenced by running,emphasizing the absence of a systemic stimulus for bone growth.These results are inconsistent with any hypothesis predicting thatskeletal adaptation is proportional to external load magnitudes andoppose the idea that exercise releases a systemic humor thatstimulates a generic response.
If skeletal adaptation to exercise was not correlated with loadmagnitude, what biological parameter might have modulatedvariation in bone responsivity? That the density of MSCs per unitvolume of marrow space was comparable in the humerus and femurof controls undermines any conclusion that bases the differentialstructural response of those two bones on a difference in baselineavailability of osteoprogenitors. There was, however, a significantreduction in the number of MSCs in the femora of exercised animalscompared with controls, but no significant difference was observedin the humerus. First, these data imply that cortical and trabecularenhancement of the femur might be related to the recruitment ofMSCs toward osteoblastogenesis (Luu et al., 2009a). Although thecortical response primarily affected the periosteal surface rather thanthe endosteal surface, this does not preclude the possibility thatmarrow-derived MSCs contributed to the observed cortical growth,as there is evidence that MSCs migrate outside the marrow cavity to
C D
Hour1 3 5 7 9 11 13 15 17 19 21 23
0
1000
2000
3000
4000
5000
6000
Am
bula
tory
cou
nts
Am
bula
tory
cou
nts
Lights offTreadmillControl
Lights on
TreadmillControl0
10,000
20,000
30,000
40,000
50,000
60,000
70,000
A
Bod
y m
ass
(g)
Age (weeks)4 5 6 7 8
16
18
20
22
24
26
28
30
TreadmillControl
B
Mus
cle
mas
s (g
)
Tricepsbrachii
Quadriceps Tricepssurae
0
0.20
0.05
0.10
0.15
TreadmillControl
Fig. 2. Treadmill exercise did not altermouse bodymass, musclemass or home-cage activity level. (A) Change inmean bodymass (±s.d.) among controlsand treadmill runners during the experiment. (B) Mean limb muscle mass (+s.d.) among controls and runners at the end of the experiment. (C) Mean hourlyambulatory counts (±s.d.) among controls and runners throughout a 24 h period on a non-running day. (D) Total number of ambulatory counts among controls andrunners during the 24 h. Boxes, median±first and third quartile; whiskers, median±range of non-outliers; circles, outliers. P>0.05 for all comparisons betweencontrols and treadmill runners.
3004
RESEARCH ARTICLE Journal of Experimental Biology (2015) 218, 3002-3009 doi:10.1242/jeb.118729
Journal
ofEx
perim
entalB
iology

be recruited at the periosteum and other sites (Luu et al., 2009b).Second, these data indicate that MSCs in the humerus were lessresponsive to mechanical signals, either because of reduced cellularmechanosensitivity per se (Volk et al., 2012), or perhaps due toaspects of the marrow niche (e.g. adjacency to hematopoietic stemcells, higher concentration of adipocytes, marrow viscosity) thatconfounded the ability of MSCs to commit to an osteoblast lineage(Adler et al., 2014; Metzger et al., 2015). These interpretations mustbe considered with caution, because changes in MSC numbersalone are not a direct indication of differentiation activity towardosteoblast production, and we did not directly show here thatosteoblast numbers increased with exercise treatment. Nevertheless,the observed associations between changes in MSCs and bonestructure are compelling.Teleologically, it is not clear why mouse forelimb bones would
be less responsive to exercise than hindlimb bones, although itmay relate to maintaining a lightly built architecture for theappendage that is also routinely used for manipulation. Yet, from abroad evolutionary perspective, it is easier to imagine how it couldbe advantageous in some instances for certain bones to be more orless affected by mechanical signals. In migratory birds, forexample, if routinely large wing forces were to lead to equallylarge gains in bone mass, then this would probably deleteriously
increase energetic costs of flight (Dumont, 2010). Similarly, ifwoodpecker crania were to become progressively thickened withevery bout of tree drumming, then this could constrict tinyforamina and damage vital nerves and blood vessels. At the otherextreme, bones that rarely sustain large loads, such as elements ofthe inner ear, would be likely to erode away over time (Schutzet al., 2014). Thus, evolution of bone adaptability can be expectedto have involved some degree of fine-tuning of responsivity acrossdifferent skeletal locations in order to achieve site-specificcompromises between maintaining equilibrium mechanicalconditions while still ensuring that bones preserve optimalstructure for their respective functional roles (Lieberman andCrompton, 1998; Currey, 2002; Lieberman et al., 2003). Boneprogenitors are perhaps just one of several cells that orchestratesuch regional variation in skeletal responsivity.
It is important to emphasize that to characterize the mechanicalenvironment of the forelimbs and hindlimbs during exercise,we reliedon a force plate to quantify only peak external limb forces.We did notattempt, however, to calculate internal forces (stresses) or measurein vivo strains experienced by the individual bones during running.Lacking bone stress and strain data, we cannot exclude the possibilitythat differences inmechanical signals experienced locally by forelimband hindlimb bones were not as great as suggested by external limbforces. Indeed, this seems likely in light of evidence that peak bonestresses/strains are generally similar between homologous limbelements (e.g. humerus, femur) among quadrupeds (Biewener,1983) and across different limb elements among a variety ofanimals (Rubin and Lanyon, 1984; Biewener, 1990). Such broaduniformity in local mechanical signals is possible due to numeroussuites of evolutionary adaptations related to anatomy (e.g. skeletalallometry, bone curvature) and locomotor kinematics and kinetics(e.g. speed, joint posture) that modulate variation in external forces(Biewener, 1990). However, even with internal forces and tissuedeformation magnitudes being broadly similar, the difference inosteogenic response between proximal forelimb and hindlimbelements of the mice in this study is clear. Therefore, it is plausiblethat our conclusion that the responsiveness of bone to exercise-induced loading was not proportional to external force magnitudecould also apply to local stresses and strains; but a rigorous test of thishypothesis would require a different approach than that adopted here.
Beyond possible implications of this study for the physiologicalresponse of bone to exercise, this study is also relevant forpaleontologists, including paleoanthropologists, who attempt to
Table 1. Mouse cortical bone properties in controls and treadmillrunners
Region Measure Control Treadmill P
Interparietal Ttotal 0.260±0.026 0.270±0.019 0.20Tdip 0.104±0.015 0.108±0.012 0.36Tcortex 0.078±0.007 0.081±0.006 0.19
Humerus Atotal 0.86±0.05 0.87±0.05 0.43Amarrow 0.31±0.05 0.31±0.05 0.76Acortex 0.55±0.04 0.56±0.04 0.21Tcortex 0.212±0.020 0.218±0.023 0.37Imax 0.063±0.008 0.065±0.008 0.30Imin 0.038±0.005 0.040±0.005 0.22
Radius Atotal 0.33±0.02 0.33±0.03 0.34Amarrow 0.08±0.01 0.08±0.02 0.54Acortex 0.25±0.02 0.25±0.02 0.44Tcortex 0.166±0.014 0.167±0.013 0.82Imax 0.008±0.001 0.009±0.001 0.31Imin 0.007±0.001 0.007±0.001 0.39
Ulna Atotal 0.33±0.03 0.36±0.03 0.008Amarrow 0.06±0.02 0.06±0.01 0.12Acortex 0.28±0.03 0.30±0.03 0.024Tcortex 0.193±0.017 0.197±0.014 0.50Imax 0.017±0.004 0.020±0.003 0.036Imin 0.004±0.001 0.005±0.001 0.026
Femur Atotal 1.72±0.13 1.82±0.15 0.032Amarrow 0.90±0.10 0.91±0.10 0.78Acortex 0.82±0.08 0.91±0.08 0.0007Tcortex 0.203±0.019 0.223±0.015 0.0007Imax 0.210±0.036 0.246±0.043 0.007Imin 0.125±0.020 0.146±0.024 0.007
Tibia Atotal 0.84±0.08 0.92±0.08 0.006Amarrow 0.26±0.04 0.28±0.04 0.27Acortex 0.58±0.06 0.64±0.05 0.002Tcortex 0.21±0.01 0.22±0.01 0.025Imax 0.060±0.013 0.073±0.012 0.003Imin 0.043±0.009 0.052±0.009 0.003
Values are means±s.d. Ttotal, mean total thickness (mm); Tdip, mean diploëthickness (mm); Tcortex, mean cortical thickness (mm); Atotal, total area (mm2);Amarrow, marrow area (mm2); Acortex, cortical area (mm2); Imax, maximumsecond moment of area (mm4); Imin, minimum second moment of area (mm4).Bold P-values represent statistically significant (P<0.05) differences betweencontrols and treadmill runners.
Table 2. Mouse trabecular bone properties in controls and treadmillrunners
Bone Trait Control Treadmill P
Humerus Vbone/Vtotal 49.4±5.3 50.5±3.9 0.44Ntrab 10.6±1.1 10.5±1.2 0.81Ttrab 65.9±4.6 66.2±4.2 0.87Strab 103±15 102±14 0.82
Femur Vbone/Vtotal 15.1±5.7 18.7±5.2 0.041Ntrab 5.5±1.1 6.2±0.9 0.043Ttrab 45.2±5.1 48.2±6.1 0.10Strab 195±38 172±27 0.035
Tibia Vbone/Vtotal 12.6±6.4 15.9±5.9 0.09Ntrab 5.5±1.2 5.9±1.1 0.25Ttrab 40.5±5.6 44.2±4.8 0.028Strab 198±40 184±32 0.22
Values are means±s.d. Vbone/Vtotal, bone volume fraction (%); Ntrab,trabecular number (1 mm−1); Ttrab, trabecular thickness (μm); Strab,trabecular separation (μm). Bold P-values represent statistically significant(P<0.05) differences between controls and treadmill runners.
3005
RESEARCH ARTICLE Journal of Experimental Biology (2015) 218, 3002-3009 doi:10.1242/jeb.118729
Journal
ofEx
perim
entalB
iology
deduce the physical activity patterns of ancient species based on themorphology of fossils (Ruff, 2005). Frequently, researcherscompare the diaphyseal structure of hominin upper limbs with
that of lower limbs in order to infer the emphasis placed on activitiesinvolving upper limb loading, such as arboreal climbing, relative tolower limb loading, particularly bipedal locomotion (e.g. Ruff,2008, 2009). This approach assumes that upper and lower limbbones respond in the sameway to loading, such that their diaphysealstructure similarly reflects loading history. The results of this studydo not support this presumed homogeneity in bone responsivenessacross limbs. Moreover, paleoanthropologists have interpreted thickcranial bones in ancient hominins as evidence of high physicalactivity levels, based on the assumption that physical activitysystemically enhances skeletal structure (e.g. Lieberman, 1996,1998). This assumption is also not supported by our findings.Overall, the results of this study suggest that effects of physicalactivity on the skeleton can be unpredictable and, likewise, thatcaution is necessary when using fossils to glean information aboutthe behavioral patterns of ancient species.
In summary, this study provides yet another example of theimportance of load-bearing exercise in influencing skeletal structureand strength, in this case, in a site-specific manner. Ultimately, thisstudy supplies evidence (albeit preliminary) that the MSC, the cellthat must be recruited to form bone, may be differentially responsiveto mechanical signals, either because of variation in cellularmechanosensitivity or because the niche in which it resides isinfluencing the ability of the progenitor to commit to a particulartissue lineage. Additional research of this subject is warrantedbecause it could yield important insights pertinent to the design ofexercise programs and technologies aimed at improving humanskeletal structure and strength with biophysical signals. It wouldalso aid our understanding of bone adaptation to mechanical loads,thus providing a more solid basis for interpreting bone structurefrom a functional point of view.
MATERIALS AND METHODSAnimalsAll experiments and procedures were reviewed and approved by the StonyBrook University Institutional Animal Care and Use Committee. Atweaning age, female Hsd:ICR mice (N=73) were acquired from HarlanSprague Dawley (Indianapolis, IN, USA) and housed individually instandard cages and maintained on a 12 h:12 h light:dark cycle with freeaccess to water and chow. At 4 weeks of age, animals were divided into threegroups: cohort 1 was used to measure limb forces (N=10), cohort 2 was usedto assess the skeletal effects of treadmill exercise (N=40), and cohort 3 wasused to examine the responsivity of marrow-derived MSCs to exercise(N=23). Young animals were used because skeletal adaptability to exerciseis typically greatest during the growing years (Rubin et al., 1992; Liebermanet al., 2003; Main et al., 2014). At the conclusion of each experiment,animals were killed by cervical dislocation preceded by inhalation of eitherCO2 (cohorts 1 and 2) or isoflurane (cohort 3).
Limb force recordingsThe design, calibration and use of the force plate has been described in detailelsewhere (Riskin et al., 2009; Wallace et al., 2015) and is only brieflysummarized here. The plate consists of a stiff fiberfoam surface(28 cm×28 cm) supported at two opposite ends by aluminium beams withspring blade elements fitted with strain gauges. Signals from gauges wereamplified, digitized and saved to a computer. The plate was modified forcollection of single-limb contacts by affixing a thin wooden strip to the platesurface and covering the rest of the plate with a runway. Animals in cohort 1traveled freely in a clear tunnel (44 cm long×7 cm wide) placed over therunway. The relationship between vertical force magnitude and voltageoutput was determined by applying a range of known weights to the woodenstrip. Regressions of force to voltage were linear (R2>0.999). Groundreaction forces recorded at 1000 Hz and video recorded in lateral view at500 Hz were synchronized with a ProCapture motion analysis system(Xcitex, Inc., Woburn, MA, USA). Animal speed was determined from
BAC
ortic
al th
ickn
ess
(mm
)
TreadmillControl0.060
C
Trea
dmill
rela
tive
to c
ontro
l (%
diff
eren
ce)
Atotal Acortex
*
0
5
10
20
25
30
15
0.065
0.070
0.075
0.080
0.085
0.090
0.095
RadiusHumerus
FemurUlna
Tibia
D
*
**
–10
0
10
20
30
40
50
HumerusFemurTibia
**
*
* *
Imax Imin
* **
* *
*
Vbone/Vtotal Ntrab Ttrab
Fig. 3. Skeletal adaptation to treadmill exercise was site-specific.(A) Interparietal cortical bone thickness among controls and treadmill runners.Boxes are median±first and third quartile; whiskers, median±range of non-outliers; circles, outliers. (B) μCT images of a mouse cranium showing thelocation of the interparietal (top, arrow) and the separation of cortical bone fromdiploe (bottom). Relative differences in (C) limb bone cortical properties and(D) trabecular properties between controls and runners. Atotal, total area;Acortex, cortical area; Imax and Imin, maximum andminimum secondmoments ofarea; Vbone, bone volume; Vtotal, total volume; Ntrab, trabecular number; Ttrab,trabecular thickness. Differences between group means are plotted aspercentage difference+s.d. of the sampling distribution of the relativedifference. *P<0.05 for comparisons between controls and treadmill runners.P>0.05 for all other differences.
3006
RESEARCH ARTICLE Journal of Experimental Biology (2015) 218, 3002-3009 doi:10.1242/jeb.118729
Journal
ofEx
perim
entalB
iology
video as the time required for a fixed anatomical landmark (i.e. the nose) topass between markers on either side of the runway. Force data were filteredwith a 30 Hz low-pass Butterworth filter and extracted with ProAnalystsoftware (Xcitex, Inc.). Data from between 5 and 10 forelimb and hindlimbcontacts were collected per animal (N=78 total for each limb).
Treadmill exerciseRunners in cohorts 2 and 3 (N=20 and 6, respectively) were exercised5 days week−1 on a six-lane treadmill (Columbus Instruments, Columbus,OH,USA) at a rate of 12 m min−1 for 30 min day−1. Exercise treatment of cohort 2began at 4 weeks of age and lasted for 4 weeks, and treatment of cohort 3 beganat 6 weeks of age and lasted for 1 week. Controls in cohorts 2 and 3 (N=20 and17, respectively) were handled similar to exercising mice but did not run.
Home-cage activityHome-cage activity of animals in cohort 2 was quantified with a 16-chamber Opto-M3 system (Columbus Instruments), in which each cage
was placed into an apparatus that cast a grid of infrared beams (1.27 cm2)above the cage floor. No additional stimulus was supplied by the systemand animals retained free access towater and chow. Activity was quantifiedas the total number of times that a new beam was broken. Recurrentinterruptions of beams caused by non-ambulatory movements (e.g.scratching, grooming) were disregarded.
Muscle massIn cohort 2, right and left triceps brachii, quadriceps femoris and tricepssurae muscles were removed with a scalpel and weighed on an electronicbalance (Acculab VI-3mg; Sartorius AG, Göttingen, Germany). Right andleft muscle mass values were averaged. Triceps brachii was cut at itsproximal origins at the humeral neck and greater tubercle and the caudalscapular border, and at its distal insertion at the ulnar olecranon process.Quadriceps was cut proximally from its origins at the cranial aspect of thefemur, the femoral neck, and the greater and third trochanters, and distally atits insertion at the patellar ligament. Triceps surae was cut at its proximal
A
0 102 103 104 1050
102
103
104
105S
CA
-1
TreadmillControl
CD105
i
0 102 103 104 1050
102
103
104
105
SC
A-1
c-Kit
iii iv
0 102 103 104 1050
102
103
104
105
SC
A-1
CD440 102 103 104 105
0
102
103
104
105
CD
90.2
CD44
v
ii
B
0 102 103 104 1050
102
103
104
105
SC
A-1
c-Kit
C
0
0.2
0.4
0.6
% M
SC
s
Humerus Femur
D
0
2
4
6
8M
SC
s pe
r mm
3
Humerus Femur
i
0 102 103 104 1050
102
103
104
105S
CA
-1
CD90.2
ii
iii
0 102 103 104 1050
102
103
104
105
CD
90.2
CD1050 102 103 104 105
0
102
103
104
105
CD
90.2
c-Kit
iv
�105
*
Fig. 4. Responsiveness of bone marrowmesenchymal stem cells to treadmill exercise. (A) Flow cytometric analysis illustrating the marrow cell populationof a representative femur, with cells that positively stained with fluorescent antibody surfacemarkers within the gates shown: (i) 10.3%SCA-1+; (ii) 3.65%CD105+;(iii) 4.63% c-Kit+; (iv) 60.9% CD44+; (v) 6.09% CD90.2+. (B) Subgating of surface markers selecting for discrete MSC populations: (i) 99.4% SCA-1+, c-Kit+;(ii) 99.3% SCA-1+, c-Kit+, CD90.2+; (iii) 100% SCA-1+, c-Kit+, CD90.2+, CD105+; (iv) 100% SCA-1+, c-Kit+, CD90.2+, CD105+, CD44+. (C) Percentage of totalgated cells identified as MSCs in the humerus and femur of controls and treadmill runners. *P<0.05 for between-group comparison. (D) The number of MSCs perunit of marrow cavity volume in the humerus and femur of controls (P>0.05). Data are means+s.d.
3007
RESEARCH ARTICLE Journal of Experimental Biology (2015) 218, 3002-3009 doi:10.1242/jeb.118729
Journal
ofEx
perim
entalB
iology

origins at the medial and lateral femoral epicondyles and the fibular head,and at its distal insertion at the calcaneal tendon.
Microcomputed tomographyIn cohort 2, right limb bones were scanned in distilled water at a 10 μm3
voxel size (70 kVp, 114 μA, 150 ms integration time) using a μCT 40scanner (Scanco Medical AG, Brüttisellen, Switzerland). Cortical bonestructure was assessed in a 300-μm-long region of the tibial diaphysis and in600-μm-long regions of the diaphyses of other limb bones. The humeralvolume of interest (VOI) began 100 μm distal to the deltoid tuberosity, andthe VOI in the other four limb elements was centered at half bone length. Asmaller VOI for the tibia relative to other bones was deemed appropriategiven the large degree of longitudinal structural variation along the shaft ofthat element (Bab et al., 2007). Trabecular bone was assessed in a 300-μm-long region of the distal humeral epiphysis starting 100 μm proximal to thecortical–trabecular bone interface, in a 1100-μm-long region of the distalfemoral metaphysis starting 850 μm proximal to the growth plate, and in a600-μm-long region of the proximal tibial metaphysis starting 500 μm distalto the growth plate. Although most studies of trabecular bone in rodentsfocus on bone tissue in the metaphysis rather than the epiphysis (Bouxseinet al., 2010), the humeral distal epiphysis was analyzed in this study becauseof the low quantity of trabecular bone in mouse humeral metaphyses (Babet al., 2007). Volumes were segmented using a constrained 3D-Gaussianfilter to reduce noise [support=1, sigma=0.1 (diaphysis) and 0.5 (epiphysisand metaphysis)] and thresholded to extract the bone phase. Thresholdvalues chosen for cortical and trabecular bone (593.1 and 428.1 mgHA/cm3, respectively) were determined empirically to achieve maximalconcordance between raw and thresholded images (Judex et al., 2004).Trabecular bone was isolated from the cortical shell using an automatedalgorithm (Lublinsky et al., 2007). Interparietals were scanned using thesame scanner settings as those used for limb bones. Volumes were filtered(3D Gauss; support=1, sigma=0.1) and thresholded at 634.4 mg HA/cm3.Cortical layers were separated from the diploë using an automated algorithm(Copes, 2012). All bone properties were computed using the internalimaging code supplied by the scanner manufacturer, and were defined asrecommended (Bouxsein et al., 2010). Structural data from the femur havebeen reported previously (Wallace et al., 2015).
In cohort 3, right humeri and femorawere scanned dry at a 20 μm3 voxel size(70 kVp, 114 μA, 150 ms integration time). μCT image processing followedthe same protocol as in cohort 2. Marrow cavity volume was calculated usingthe BoneJ plugin for ImageJ (Doube et al., 2010). The humeral marrow cavityVOI was defined proximally by the growth plate and distally by the coronoid-olecranon notch. The femoral VOI was defined proximally by the mostprojecting point of the lesser trochanter and distally by the growth plate.
Flow cytometryCellular constituents of bone marrow were quantified in left humeri andfemora of animals in cohort 3 immediately after death. Using a 25AWGneedle, bone marrow was flushed from each endocortical cavity withsupplemented medium, then mixed, and filtered through a 40 μmmesh (BDBiosciences, San Jose, CA, USA). Supplemented medium was preparedwith Dulbecco’s modified essential medium (Life Technologies, Inc.,Gaithersburg, MD, USA), 2% fetal bovine serum (Invitrogen, Carlsbad,CA, USA), 1% penicillin/streptomycin and 10 mmol l−1 HEPES buffer(Life Technologies, Inc.). Bone marrow erythrocytes were lysed with 1×PharmLyse (BD Biosciences). Samples were diluted in Dulbecco’sphosphate-buffered saline at a concentration of 1:100. A hemocytometerwas used to quantify the number of cells in each sample. This enabled backcalculation of the total number of marrow cells within each bone. A single-cell suspension containing 2×10⁶ cells from each sample was then preparedto identify MSC populations through direct immunofluorescence stainingwith flow cytometry. Specifically, fluorescent antibody probes for SCA-1,c-Kit, CD90.2, CD105 and CD44 (BD Biosciences) were designated as theunique MSC surface identifiers (Pagnotti et al., 2012), and populationspositive for all five markers were sub-gated accordingly using FlowJocytometric analytical software (TreeStar, Inc., Ashland, OR, USA). Thepercentage ofMSCswithin each 2×10⁶-cell samplewas used to calculate thetotal number of MSCs within each bone.
StatisticsStatistical analyses were performed in SPSS (v20; IBMCorp., Armonk, NY,USA). Analysis of covariance was used to compare peak vertical groundreaction forces experienced by the forelimbs and hindlimbs of animals incohort 1, with subject speed as the covariate (Wallace and Demes, 2008).Independent-samples t-tests were used to assess differences in body mass,muscle mass and bone traits between controls and exercised animals incohort 2. Mann–Whitney U-tests were used to compare home-cage activitybetween controls and runners in cohort 2 (because of non-normaldistribution of data), as well as MSC populations between controls andrunners in cohort 3 (because of uneven sample sizes). A paired-sample t-testwas used to compare MSC density in the humeri and femora of controls incohort 3. Significance level for tests was P<0.05 and tests were two-tailed.Relative differences between group means were calculated as percentagedifference±s.d. of the sampling distribution of the relative difference(Wallace et al., 2015).
AcknowledgementsWe thank D. Riskin and S. Swartz for allowing us to use their force plate, A. Tuthilland T. Zimmerman for facilitating the experiments and S. Lublinsky for providingtechnical assistance with μCT analyses. We also thank A. Biewener and twoanonymous reviewers for very helpful comments on earlier versions of this article.
Competing interestsThe authors declare no competing or financial interests.
Author contributionsI.J.W., G.M.P., C.T.R. and B.D. conceived of the study. I.J.W., G.M.P., S.J., C.T.R.and B.D. designed the experiments. I.J.W., G.M.P. and B.D. performed theexperiments. I.J.W., G.M.P., J.R.-S., M.N., L.E.C. and B.D. collected and analyzeddata. I.J.W., G.M.P., C.T.R. and B.D. drafted the manuscript. All authors contributedto the interpretation of the findings and helped to edit the manuscript.
FundingSupported primarily by a grant from the L.S.B. Leakey Foundation, as well as grantsfrom the National Science Foundation (BCS 0935321), the National Aeronautics andSpace Administration (NNX12AL25G and NNX08BA35G), the National Institutes ofHealth (AR 043498) and Sigma Xi. Deposited in PMC for release after 12 months.
ReferencesAdler, B. J., Kaushansky, K. and Rubin, C. T. (2014). Obesity-driven disruption of
haematopoiesis and the bone marrow niche. Nat. Rev. Endocrinol. 10, 737-748.Bab, I. A., Hajbi-Yonissi, C., Gabet, Y. and Muller, R. (2007). Micro-tomographic
Atlas of the Mouse Skeleton. New York: Springer.Biewener, A. A. (1983). Locomotory stresses in the limb bones of two small
mammals: the ground squirrel and chipmunk. J. Exp. Biol. 103, 131-154.Biewener, A. A. (1990). Biomechanics of mammalian terrestrial locomotion.
Science 250, 1097-1103.Biewener, A. A. and Bertram, J. E. A. (1994). Structural response of growing bone
to exercise and disuse. J. Appl. Physiol. 72, 946-955.Bouxsein, M. L., Boyd, S. K., Christiansen, B. A., Guldberg, R. E., Jepsen, K. J.
and Muller, R. (2010). Guidelines for assessment of bone microstructure inrodents using micro-computed tomography. J. Bone Miner. Res. 25, 1468-1486.
Chan, M. E., Adler, B. J., Green, D. E. and Rubin, C. T. (2012). Bone structure andB-cell populations, crippled by obesity, are partially rescued by brief dailyexposure to low-magnitude mechanical signals. FASEB J. 26, 4855-4863.
Copes, L. (2012). Comparative and Experimental Investigations of CranialRobusticity in Mid-Pleistocene Hominins. Ph.D. dissertation, Arizona StateUniversity.
Currey, J. D. (2002). Bones: Structure and Mechanics. Princeton: PrincetonUniversity Press.
Doube, M., Kłosowski, M. M., Arganda-Carreras, I., Cordelieres, F. P.,Dougherty, R. P., Jackson, J., Schmid, B., Hutchinson, J. R. andShefelbine, S. J. (2010). BoneJ: free and extensible bone image analysis inImageJ. Bone 47, 1076-1079.
Dumont, E. R. (2010). Bone density and the lightweight skeletons of birds.Proc. R. Soc. B Biol. Sci. 277, 2193-2198.
Haapasalo, H., Kontulainen, S., Sievanen, H., Kannus, P., Jarvinen, M. andVuori, I. (2000). Exercise-induced bone gain is due to enlargement in bone sizewithout a change in volumetric bone density: a peripheral quantitative computedtomography study of the upper arms of male tennis players. Bone 27, 351-357.
Jones, H. H., Priest, J. D., Hayes, W. C., Tichenor, C. C. and Nagel, D. A. (1977).Humeral hypertrophy in response to exercise. J. Bone Jt. Surg. Am. 59, 204-208.
3008
RESEARCH ARTICLE Journal of Experimental Biology (2015) 218, 3002-3009 doi:10.1242/jeb.118729
Journal
ofEx
perim
entalB
iology

Judex, S., Garman, R. A., Squire, M. E., Donahue, L. R. and Rubin, C. T. (2004).Genetically based influences on the site-specific regulation of trabecular andcortical bone morphology. J. Bone Miner. Res. 19, 600-606.
Lieberman, D. E. (1996). How and why humans grow thin skulls: experimentalevidence for systemic cortical robusticity. Am. J. Phys. Anthropol. 101, 217-236.
Lieberman, D. E. (1998). Neandertal and early modern human mobility patterns. InNeandertals and Modern Humans in Western Asia (ed. T. Akazawa, K. Aoki andO. Bar-Yosef ), pp. 263-275. New York: Plenum Press.
Lieberman, D. E. and Crompton, A. W. (1998). Responses of bone to stress:constraints on symmorphosis. In Principles of Animal Design: The Optimizationand Symmorphosis Debate (ed. E. R.Weibel, C. R. Taylor and L. Bolis), pp. 78-86.Cambridge: Cambridge University Press.
Lieberman, D. E., Pearson, O. M., Polk, J. D., Demes, B. and Crompton, A. W.(2003). Optimization of bone growth and remodeling in response to loading intapered mammalian limbs. J. Exp. Biol. 206, 3125-3138.
Lublinsky, S., Ozcivici, E. and Judex, S. (2007). An automated algorithm to detectthe trabecular-cortical bone interface in micro-computed tomographic images.Calcif. Tissue Int. 81, 285-293.
Luu, Y. K., Capilla, E., Rosen, C. J., Gilsanz, V., Pessin, J. E., Judex, S. andRubin, C. T. (2009a). Mechanical stimulation of mesenchymal stem cellproliferation and differentiation promotes osteogenesis while preventing dietary-induced obesity. J. Bone Miner. Res. 24, 50-61.
Luu, Y. K., Pessin, J. E., Judex, S., Rubin, J. and Rubin, C. T. (2009b).Mechanical signals as a non-invasive means to influence mesenchymal stem cellfate, promoting bone and suppressing the fat phenotype. BoneKey 6, 132-149.
Main, R. P., Lynch, M. E. and van der Meulen, M. C. H. (2014). Load-inducedchanges in bone stiffness and cancellous and cortical bone mass following tibialcompression diminish with age in female mice. J. Exp. Biol. 217, 1775-1783.
McKay, H. A., MacLean, L., Petit, M., MacKelvie-O’Brien, K., Janssen, P., Beck,T. and Khan, K. M. (2005). “Bounce at the Bell”: a novel program of short bouts ofexercise improves proximal femur bone mass in early pubertal children.Br. J. Sports Med. 39, 521-526.
Metzger, T. A., Kreipke, T. C., Vaughan, T. J., McNamara, L. M. and Niebur, G. L.(2015). The in situ mechanics of trabecular bone marrow: the potential formechanobiological response. J. Biomech. Eng. 137, 011006.
Nikander, R., Sievanen, H., Uusi-Rasi, K., Heinonen, A. and Kannus, P. (2006).Loadingmodalities and bone structures at nonweight-bearing upper extremity andweight-bearing lower extremity: a pQCT study of adult female athletes. Bone 39,886-894.
Ozcivici, E., Luu, Y. K., Rubin, C. T. and Judex, S. (2010). Low-level vibrationsretain bone marrow’s osteogenic potential and augment recovery of trabecularbone during reambulation. PLoS ONE 5, e11178.
Pagnotti, G. M., Adler, B. J., Green, D. E., Chan, M. E., Frechette, D. M., Shroyer,K. R., Beamer, W. G., Rubin, J. and Rubin, C. T. (2012). Low magnitudemechanical signals mitigate osteopenia without compromising longevity in anaged murine model of spontaneous granulosa cell ovarian cancer. Bone 51,570-577.
Risbud, M. V., Shaprio, I. M., Guttapalli, A., Di Martino, A., Danielson, K. G.,Beiner, J. M., Hillibrand, A., Albert, T. J., Anderson, D. G. and Vaccaro, A. R.
(2006). Osteogenic potential of adult human stem cells of the lumbar vertebralbody and the iliac crest. Spine 31, 83-89.
Riskin, D. K., Bahlman, J. W., Hubel, T. Y., Ratcliffe, J. M., Kunz, T. H. andSwartz, S. M. (2009). Bats go head-under-heels: the biomechanics of landing ona ceiling. J. Exp. Biol. 212, 945-953.
Rubin, C. T. (1984). Skeletal strain and the functional significance of bonearchitecture. Calcif. Tissue Int. 36, S11-S18.
Rubin, C. T. and Lanyon, L. E. (1984). Dynamic strain similarity in vertebrates: analternative to allometric limb bone scaling. J. Theor. Biol. 107, 321-327.
Rubin, C. T., Bain, S. D. and McLeod, K. J. (1992). Suppression of the osteogenicresponse in the aging skeleton. Calcif. Tissue Int. 50, 306-313.
Ruff, C. B. (2005). Mechanical determinants of bone form: insights from skeletalremains. J. Musculoskelet. Neuronal Interact. 5, 202-212.
Ruff, C. (2008). Femoral/humeral strength in early African Homo erectus. J. Hum.Evol. 54, 383-390.
Ruff, C. (2009). Relative limb strength and locomotion in Homo habilis. Am. J. Phys.Anthropol. 138, 90-100.
Schutz, H., Jamniczky, H. A., Hallgrımsson, B. and Garland, T., Jr (2014).Shape-shift: semicircular canal morphology responds to selective breeding forincreased locomotor activity. Evolution 68, 3184-3198.
Tommerup, L. J., Raab, D. M., Crenshaw, T. D. and Smith, E. L. (1993). Doesweight-bearing exercise affect non-weight-bearing bone? J. Bone Miner. Res. 8,1053-1058.
Volk, S. W., Wang, Y. and Hankenson, K. D. (2012). Effects of donorcharacteristics and ex vivo expansion on canine mesenchymal stem cellproperties: implications for MSC-based therapies.Cell Transplant. 21, 2189-2200.
Wallace, I. J. and Demes, B. (2008). Symmetrical gaits of Cebus apella:implications for the functional significance of diagonal sequence gait inprimates. J. Hum. Evol. 54, 783-794.
Wallace, I. J., Judex, S. and Demes, B. (2015). Effects of load-bearing exercise onskeletal structure and mechanics differ between outbred populations of mice.Bone 72, 1-8.
Warden, S. J., Mantila Roosa, S. M., Kersh, M. E., Hurd, A. L., Fleisig, G. S.,Pandy, M. G. and Fuchs, R. K. (2014). Physical activity when young provideslifelong benefits to cortical bone size and strength in men. Proc. Natl. Acad. Sci.USA 111, 5337-5342.
Weeks, B. K., Young, C. M. and Beck, B. R. (2008). Eight months of regular in-school jumping improves indices of bone strength in adolescent boys and girls: thePOWER PE study. J. Bone Miner. Res. 23, 1002-1011.
Wilks, D. C., Winwood, K., Gilliver, S. F., Kwiet, A., Chatfield, M., Michaelis, I.,Sun, L. W., Ferretti, J. L., Sargeant, A. J., Felsenberg, D. and Rittweger, J.(2009). Bone mass and geometry of the tibia and the radius of master sprinters,middle and long distance runners, race-walkers and sedentary controlparticipants: a pQCT study. Bone 45, 91-97.
Woo, S. L. Y., Kuei, S. C., Amiel, D., Gomez, M. A., Hayes, W. C., White, F. C. andAkeson, W. H. (1981). The effect of prolonged physical training on the propertiesof long bone: a study of Wolff’s Law. J. Bone Jt. Surg. Am. 63, 780-787.
3009
RESEARCH ARTICLE Journal of Experimental Biology (2015) 218, 3002-3009 doi:10.1242/jeb.118729
Journal
ofEx
perim
entalB
iology