focus on gender retirement savings and spending 4 ......2019/06/25 · by baby boomer generation...
TRANSCRIPT
Focus on GenderRETIREMENT SAVINGS AND SPENDING 4:FINANCIAL BEHAVIOR & ATTITUDES
T. Rowe PriceJune 25, 2019

2
Contents Methodology
Workers: Gender Profile
Workers: Financial Behaviors & Attitudes by Gender
Retirees: Gender Profile
Retirees: Retirement Experience by Gender

3
Methodology Representative national study of 3,005 adults 21+ never retired, currently contributing to a 401(k) plan or
eligible to contribute and have a balance of $1,000+
Along with 1,005 adults who have retired with a Rollover IRA or left-in-plan 401(k) balance
Conducted online July 24 through August 14, 2018
Worker design included oversamples which were then weighted back to naturally occurring proportions
Due to the small sample size of Generation X respondents, generational comparisons are limited to millennial and baby boomer workers
WorkersActual N =
Actual Proportion
WeightedProportion
Millennial (21-37) 1,251 42% 36%
Gen X (38 -53) 503 17% 39%
Baby Boomer (54 or older) 1,251 42% 26%
Total 3,005 100% 100%
RSS4 © 2018 NMG Consulting. All rights reservedConducted for T. Rowe Price by NMG Consulting
WORKERS: GENDER PROFILE

5
Workers2018 2017 2015
N= 3005 3,022 3,026Male 61% 63% 60%Female 39% 37% 40%
Average age 44 43 42
Work status:Working full time 92% 92% 91%Working part time 8% 8% 9%
Married/Partnered 72% 70% 68%
ProfileBy total workers
As of 2018. Base: total interviews.

6
Workers2018 2017 2015
N= 3005 3,022 3,026Have children < 18 in HH 43% 45% 41%Have adult children 50% 47% 41%Have a living parent 74% 73% 82%
Education:High school or less 25% 26% 25%Some post secondary 29% 29% 30%College degree or more 46% 45% 45%
Personal income (average $ in thousands) $91 $83 $82Personal income (median $ in thousands) $77 $69 $70
Household income (average $ in thousands) $159 $142 $127Household income (median $ in thousands) $125 $125 $113
ProfileBy total workers
As of 2018. Base: total interviews.

7
$79,000 $77,400
$89,400
$57,500 $55,300
$62,400
$0
$20,000
$40,000
$60,000
$80,000
$100,000
$120,000
2015 2017 2018
Men Women
By total workers
Median Annual Income

8
$86,200 $82,700
$102,800
$53,600 $51,300
$61,200
$0
$20,000
$40,000
$60,000
$80,000
$100,000
$120,000
2015 2017 2018
Men Women
By baby boomer generation
Median Annual Income

9
$63,300 $63,900
$84,900
$47,900
$55,000 $56,100
$0
$20,000
$40,000
$60,000
$80,000
$100,000
$120,000
2015 2017 2018
Men Women
By millennial generation
Median Annual Income

WORKERS: FINANCIAL BEHAVIORS AND ATTITUDES BY GENDER
11
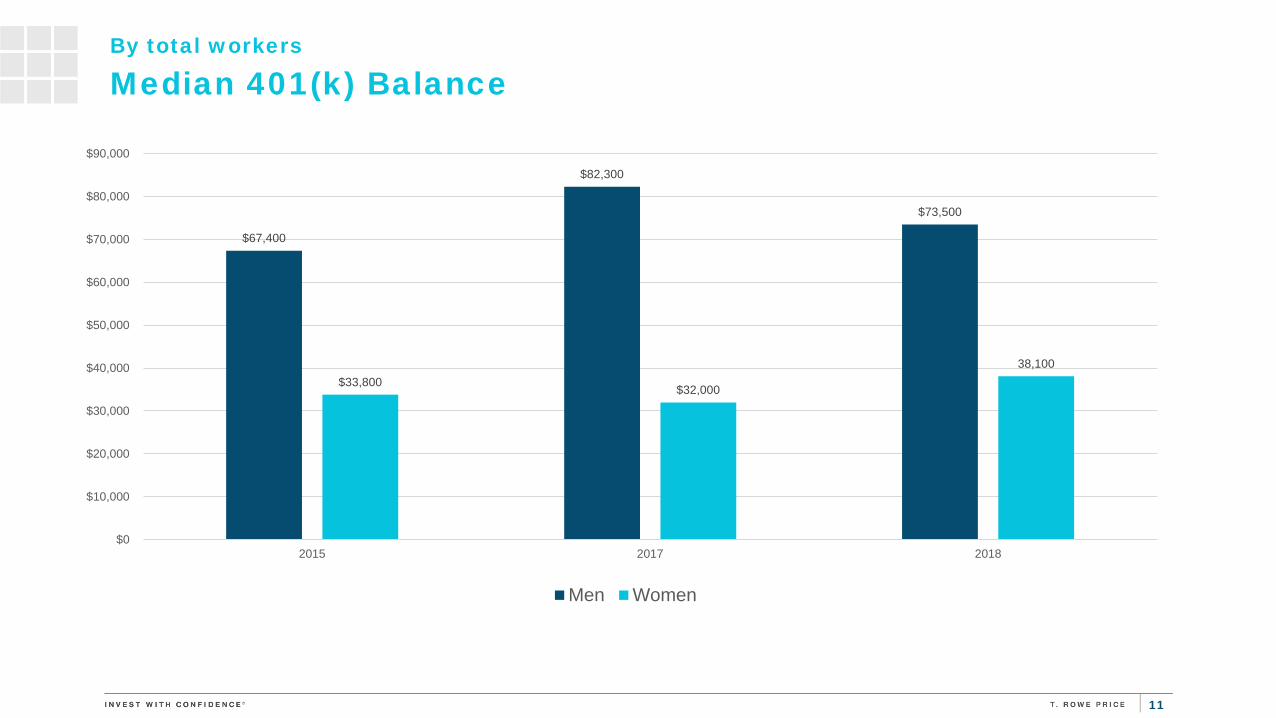
$67,400
$82,300
$73,500
$33,800 $32,000
38,100
$0
$10,000
$20,000
$30,000
$40,000
$50,000
$60,000
$70,000
$80,000
$90,000
2015 2017 2018
Men Women
By total workers
Median 401(k) Balance
12
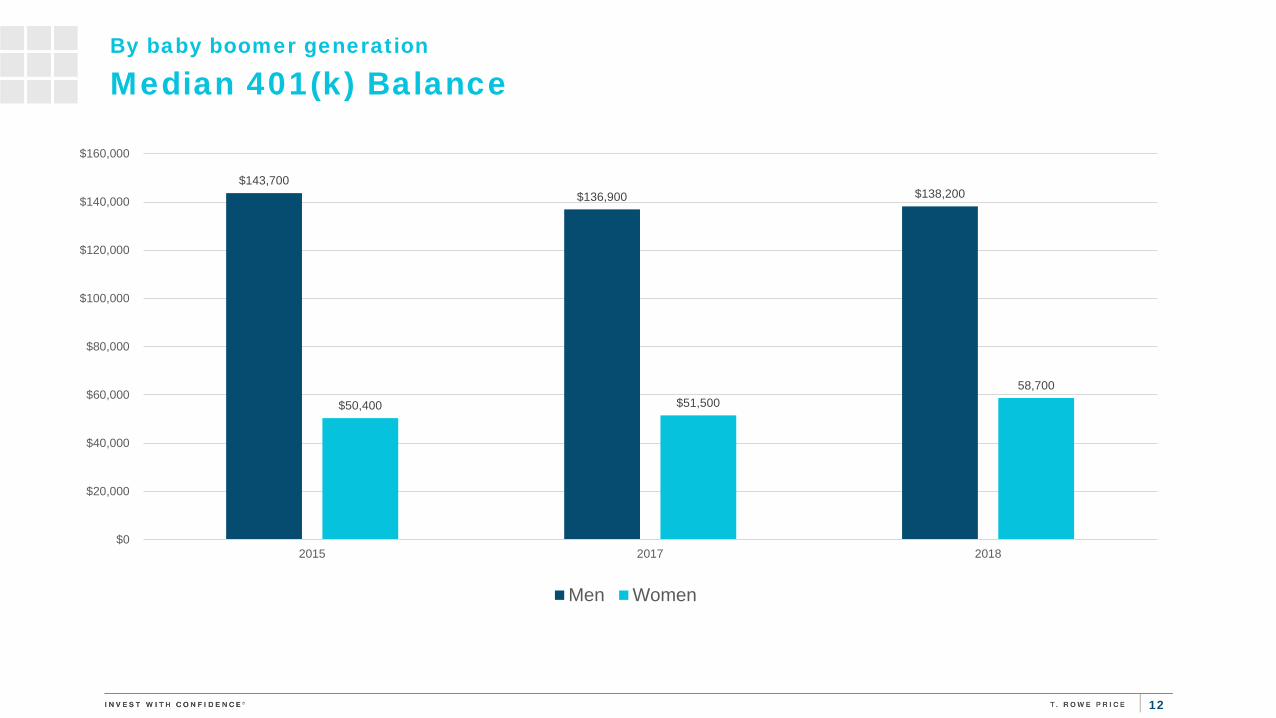
$143,700 $136,900 $138,200
$50,400 $51,500 58,700
$0
$20,000
$40,000
$60,000
$80,000
$100,000
$120,000
$140,000
$160,000
2015 2017 2018
Men Women
By baby boomer generation
Median 401(k) Balance

13
$22,000
$44,800
$42,300
$10,600 $11,200 $12,300
$-
$5,000
$10,000
$15,000
$20,000
$25,000
$30,000
$35,000
$40,000
$45,000
$50,000
2015 2017 2018
Men Women
By millennial generation
Median 401(k) Balance

14
8%
10%
5%
7%
0%
2%
4%
6%
8%
10%
12%
Millennials Baby Boomers
Men Women
By worker generations
Median 401(k) Deferral Rates
15
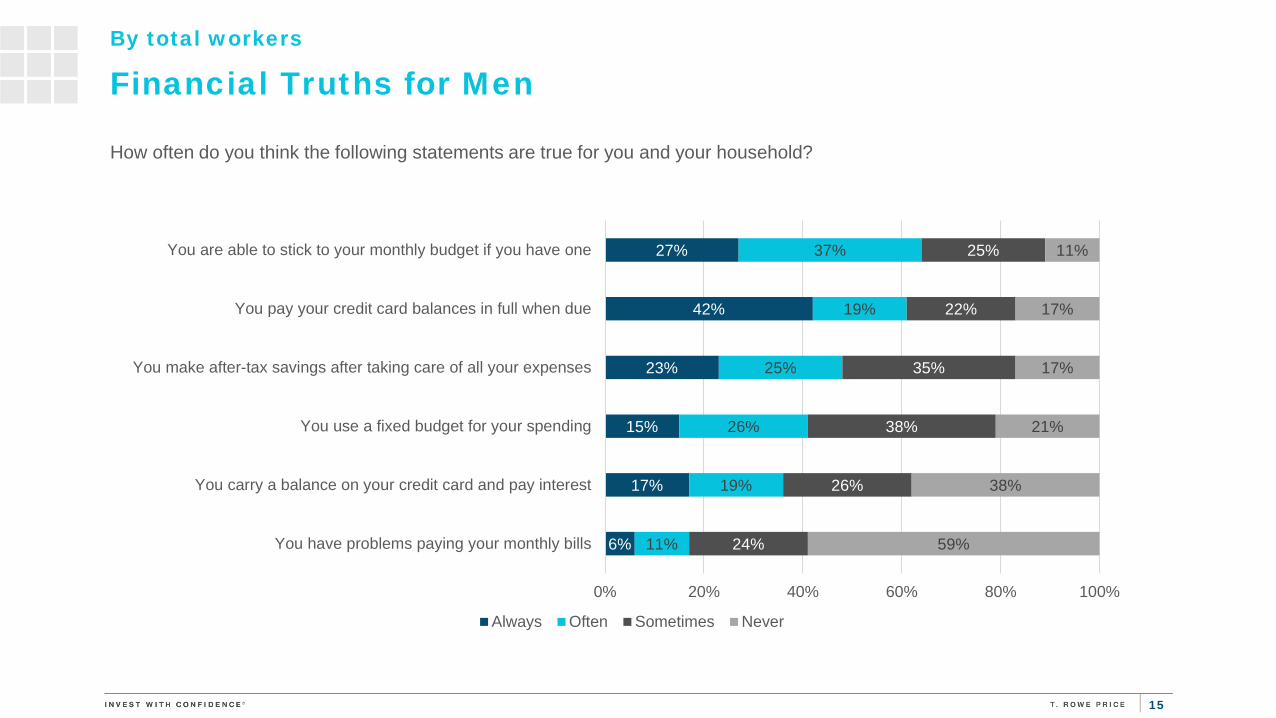
By total workers
Financial Truths for Men
How often do you think the following statements are true for you and your household?
6%
17%
15%
23%
42%
27%
11%
19%
26%
25%
19%
37%
24%
26%
38%
35%
22%
25%
59%
38%
21%
17%
17%
11%
0% 20% 40% 60% 80% 100%
You have problems paying your monthly bills
You carry a balance on your credit card and pay interest
You use a fixed budget for your spending
You make after-tax savings after taking care of all your expenses
You pay your credit card balances in full when due
You are able to stick to your monthly budget if you have one
Always Often Sometimes Never
16
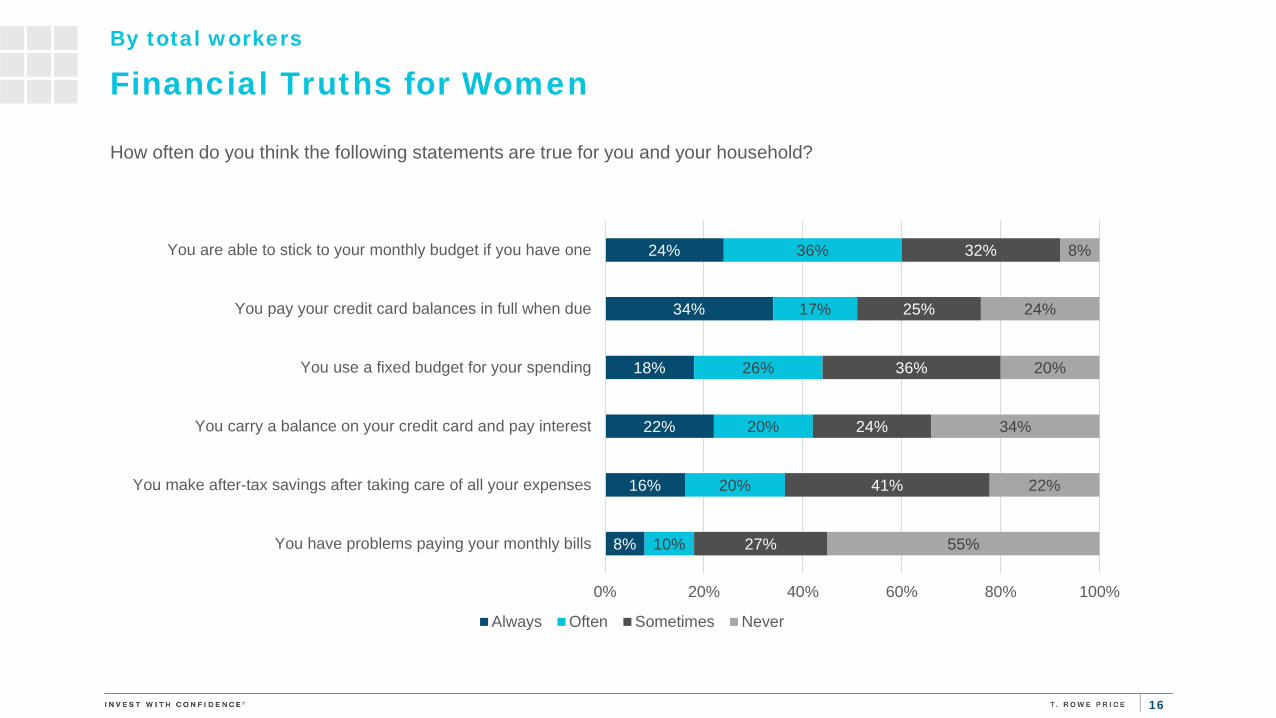
By total workers
Financial Truths for Women
How often do you think the following statements are true for you and your household?
8%
16%
22%
18%
34%
24%
10%
20%
20%
26%
17%
36%
27%
41%
24%
36%
25%
32%
55%
22%
34%
20%
24%
8%
0% 20% 40% 60% 80% 100%
You have problems paying your monthly bills
You make after-tax savings after taking care of all your expenses
You carry a balance on your credit card and pay interest
You use a fixed budget for your spending
You pay your credit card balances in full when due
You are able to stick to your monthly budget if you have one
Always Often Sometimes Never

17
Employment IndustryBy total workers
Which one of the following industries most nearly describes your work?
15%
15%
13%
12%
10%
8%
7%
7%
4%
4%
2%
2%
Trade, transportation or utilities
Professional or business services
Manufacturing
The financial industry
Health care and social assistance
Other services (except public administration)
The information industry
The construction industry
Educational services
Leisure and hospitality
Agriculture, natural resources or mining
Public administration

18
6%
2%3%
13%
7%5%
20%
2%
15%
20%
1%
5%
1%
4%3%
15%14%
5%
4%
11%
1%
15%
17%
1%
8%
0%0%
5%
10%
15%
20%
25%
Construction EducationalServices
Health Careand SocialAssistance
FinancialIndustry
InformationIndustry
Leisure andHospitality
Manufacturing Agriculture,Natural
Resources orMining
Professional orBusinessServices
Trade,Transportation
or Utilities
PublicAdministration
Other Services(except PublicAdministration)
Other
Men Women
By baby boomer generation
Employment IndustryWhich one of the following industries most nearly describes your work?
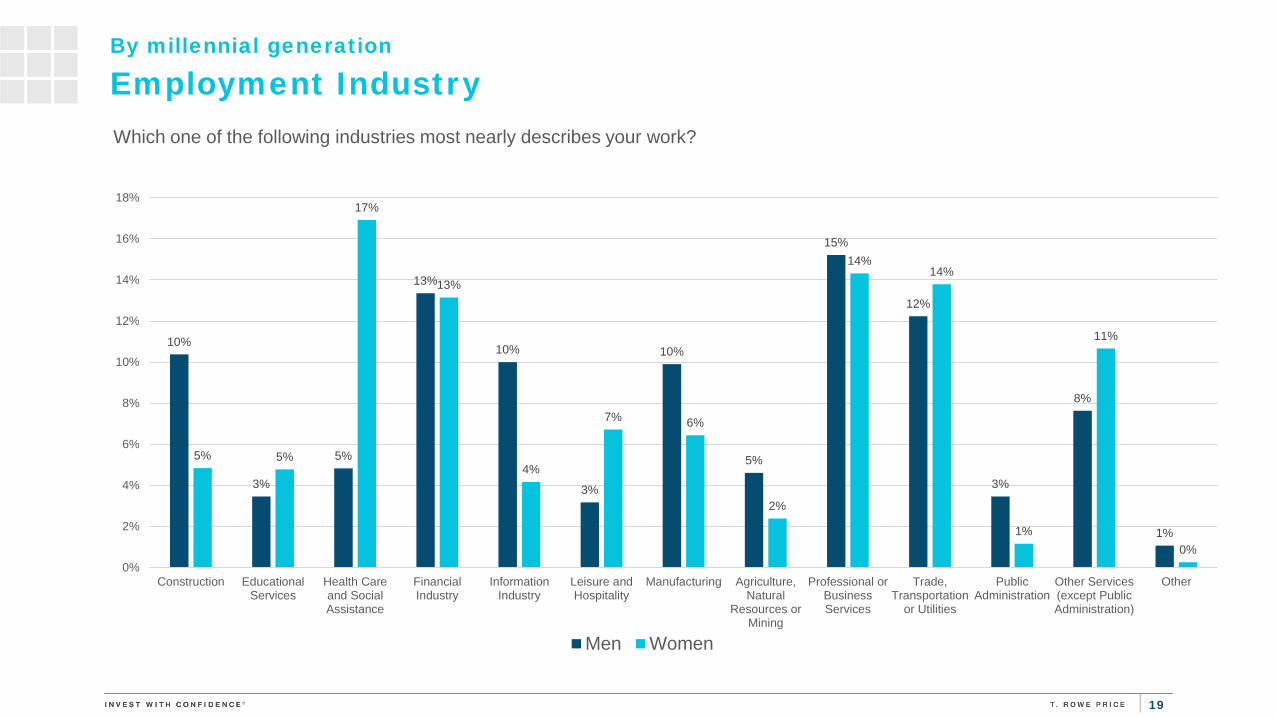
19
10%
3%
5%
13%
10%
3%
10%
5%
15%
12%
3%
8%
1%
5% 5%
17%
13%
4%
7% 6%
2%
14%14%
1%
11%
0%0%
2%
4%
6%
8%
10%
12%
14%
16%
18%
Construction EducationalServices
Health Careand SocialAssistance
FinancialIndustry
InformationIndustry
Leisure andHospitality
Manufacturing Agriculture,Natural
Resources orMining
Professional orBusinessServices
Trade,Transportation
or Utilities
PublicAdministration
Other Services(except PublicAdministration)
Other
Men Women
By millennial generation
Employment IndustryWhich one of the following industries most nearly describes your work?
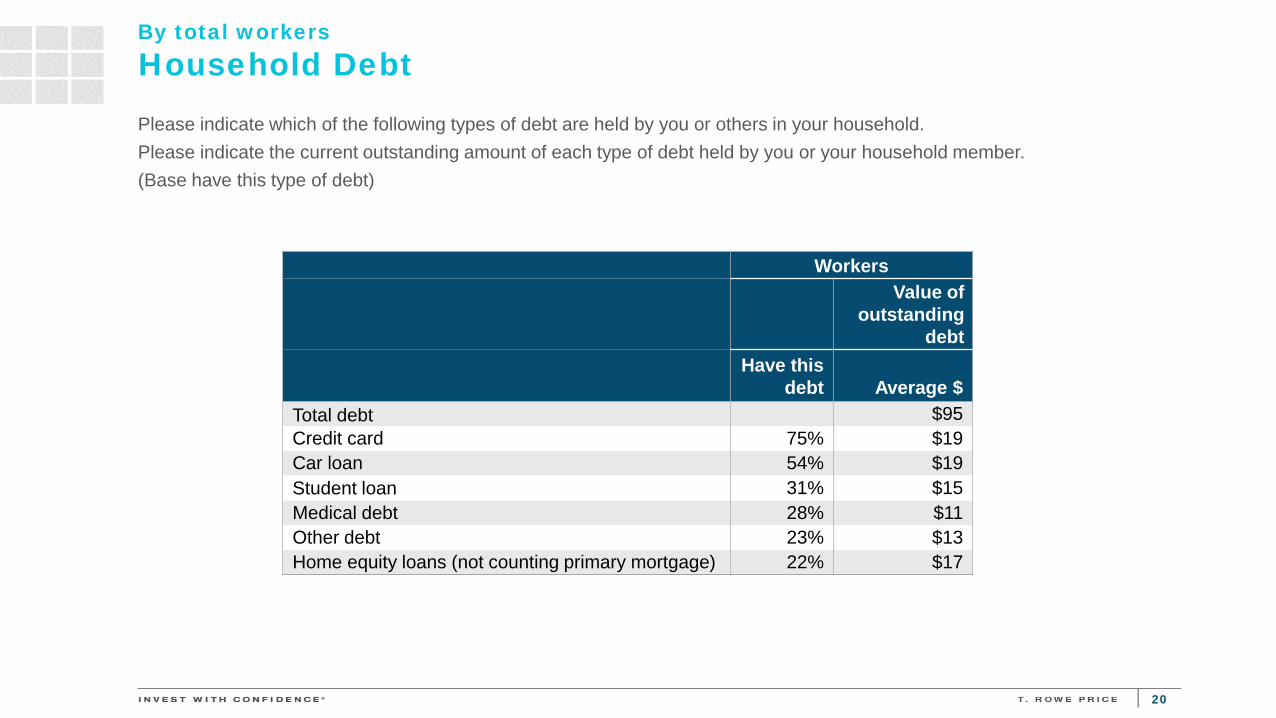
20
WorkersValue of
outstanding debt
Have this debt Average $
Total debt $95Credit card 75% $19Car loan 54% $19Student loan 31% $15Medical debt 28% $11Other debt 23% $13Home equity loans (not counting primary mortgage) 22% $17
Household DebtBy total workers
Please indicate which of the following types of debt are held by you or others in your household.Please indicate the current outstanding amount of each type of debt held by you or your household member. (Base have this type of debt)

21
62%
4%
34%
9%
17% 15%
63%
6%
36%
14%17%
13%
0%
10%
20%
30%
40%
50%
60%
70%
Credit Card Student Loan Car Loan Medical Debt Other Debt Home Equity Loans (notcounting primary mortgage)
Men Women
By baby boomer generation
Please indicate which of the following types of debt are held by you or others in your household.
Household Debt

22
$2,192
$28,686
$15,400
$3,352 $4,535
$19,139
$3,071
$16,049
$13,182
$1,961 $1,921
$21,494
$-
$5,000
$10,000
$15,000
$20,000
$25,000
$30,000
$35,000
Credit Card Student Loan Car Loan Medical Debt Other Debt Home Equity Loans (notcounting primary mortgage)
Men Women
By baby boomer generation
Household Debt--Median ValuesPlease indicate the current outstanding amount of each type of debt held by you or your household member. (Base have this type of debt)

23
76%
32%
45%
24%
16%19%
74%
34%
50%
33%
23%
16%
0%
10%
20%
30%
40%
50%
60%
70%
80%
Credit Card Student Loan Car Loan Medical Debt Other Debt Home Equity Loans (notcounting primary mortgage)
Men Women
By millennial generation
Please indicate which of the following types of debt are held by you or others in your household.
Household Debt
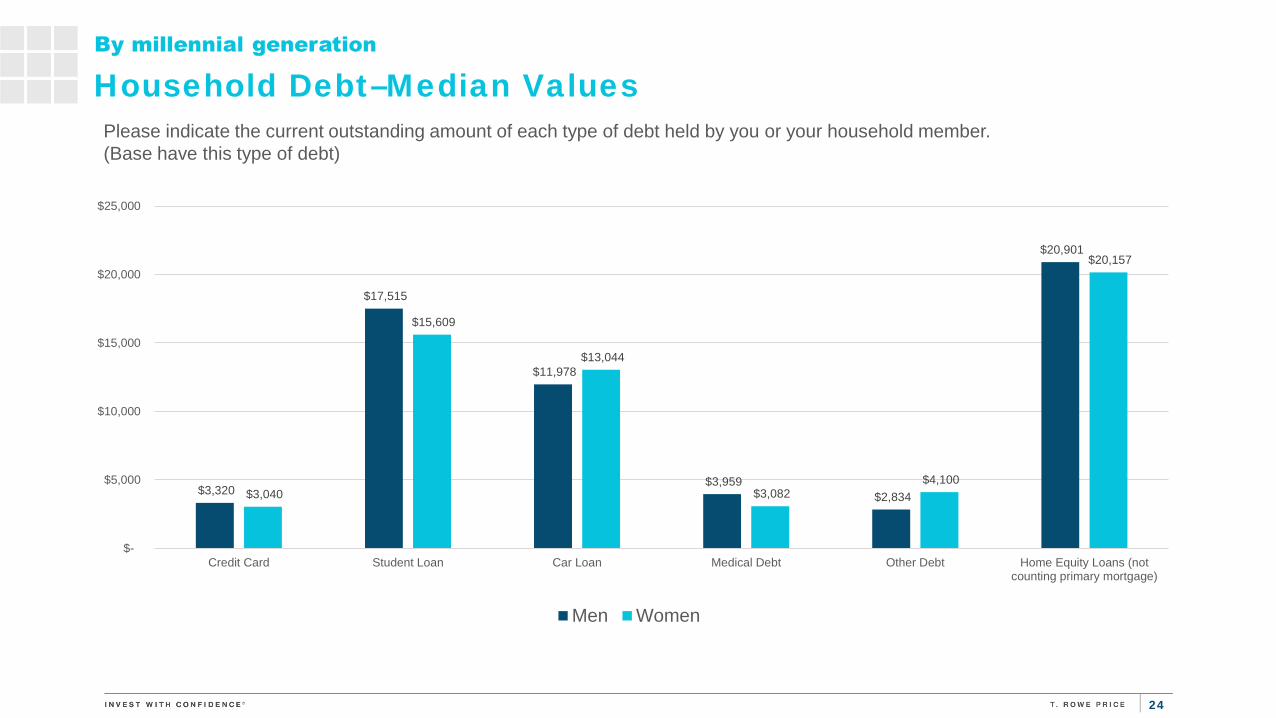
24
$3,320
$17,515
$11,978
$3,959 $2,834
$20,901
$3,040
$15,609
$13,044
$3,082 $4,100
$20,157
$-
$5,000
$10,000
$15,000
$20,000
$25,000
Credit Card Student Loan Car Loan Medical Debt Other Debt Home Equity Loans (notcounting primary mortgage)
Men Women
Please indicate the current outstanding amount of each type of debt held by you or your household member. (Base have this type of debt)
Household Debt–Median Values

25
As far as you know, what percentage of your income, including employer contributions, do financial experts typically recommend someone your age should contribute to your 401(k) to make sure you have a comfortable retirement?
13%
25% 24%
15%
10%
14%14%
25%
20%
11% 11%
20%
0%
5%
10%
15%
20%
25%
30%
1-4% 5-9% 10-14% 15-19% 20%+ Not Sure
Men Women
Financial Expert Recommendation By total workers

26
50%
22%
32%
18%15%
66%
31%
10%
18%16%
0%
10%
20%
30%
40%
50%
60%
70%
You're contributing all you canafford
You're paying back deby otherthan college loans
You're saving for retirementthrough outher vehicles
You're building up an emergencyfund
You're paying back college loans
Men Women
As you probably know, you (combined with your employer) are contributing less to your 401(k) than what financial experts typically recommend. Please indicate below the extent to which any of the items below are a reason for this.
Base: contributing less than what experts recommendReasons for Contributing Below Recommended By total workers

27
47%
43%
28%
32% 31%
28%
23%21% 21%
12%
17% 16% 15%
29%
15% 15%
4% 3%
50%
46%
35%
43%
32%29%
20% 20%18%
12%
16% 17%
22%
15%12% 12%
5% 4%
0%
10%
20%
30%
40%
50%
60%
Married Single Married Single Married Single Married Single Married Single Married Single Married Single Married Single Married Single
Credit Cards Family members orfriends
A specialemergency fund
account you haveestablished for
such needs
A specialenergency fund you
mentally earmarkfor such needs
Home equity loan Other bank loan Your after-taxpersonal savingsand investments
Your balances intax-deferredworkplace
retirement accounts
No source ofemergency cash
Men
Women
If you suddenly faced an emergency that required more cash than you had on hand, to which of the following sources of funds would you turn?
Sources of Funds for Emergency By total workers

28
28%
38%
48%
45%
21%
37%
51%
20%
24%
43%
30% 31%
46%
54%
0%
10%
20%
30%
40%
50%
60%
You will be able to helpyounger family members
with tuition or housingexpenses
You will be able to leavemoney to family members
or charities
You will have enoughmoney to pay for health
care
You will live as well orbetter as you did when you
were working
You will run out of money You will have to reduceyour standard of living
You will work at least part-time in retirement
Men Women
Given the retirement savings you have in place right now and the rate at which you may be adding to those savings, which of the statements below do you expect will be true for you in retirement? Please select all that apply.
Retirement Expectations

29
19%
41%
54%
34%
49%
14%
52%
14%
29%
45% 45%
34%
22%
56%
0%
10%
20%
30%
40%
50%
60%
You will be able to helpyounger family members
with tuition or housingexpenses
You will be able to leavemoney to family members
or charities
You will have enoughmoney to pay for health
care
You will have to reduceyour standard of living
You will live as well orbetter as you did when you
were working
You will run out of money You will work at least part-time in retirement
Men Women
Given the retirement savings you have in place right now and the rate at which you may be adding to those savings, which of the statements below do you expect will be true for you in retirement? Please select all that apply.
By baby boomer generationRetirement Expectations

30
By baby boomer generation
Have Considered Delaying RetirementIn the past 12 months have you considered delaying your retirement beyond your original target age, or haven’t you?
42%
50%
0%
10%
20%
30%
40%
50%
60%
YES - Men YES - Women

31
By total workers
Top 5 Financial Advice Attributes for MenThinking about advice to help you achieve your lifetime financial goals, how important is having advice that does the following?
36%
37%
39%
40%
50%
41%
45%
41%
40%
37%
15%
11%
13%
13%
9%
8%
6%
7%
7%
4%
0% 20% 40% 60% 80% 100%
Motivates you to stay on track
Fits into your work or personal schedule
Is based on personalized recommendations tailored to yourfinancial situation
Alerts you to critical developments in your account
Is easy to use
Very important Somewhat important Not very important Not important at all

32
By total workers
Top 5 Financial Advice Attributes for Women
Thinking about advice to help you achieve your lifetime financial goals, how important is having advice that does the following?
42%
42%
44%
46%
63%
41%
40%
38%
39%
27%
11%
11%
12%
10%
6%
6%
7%
6%
6%
4%
0% 20% 40% 60% 80% 100%
Is based on personalized recommendations tailored to yourfinancial situation
Motivates you to stay on track
Alerts you to critical developments in your account
Fits into your work or personal schedule
Is easy to use
Very important Somewhat important Not very important Not important at all

RETIREES: GENDER PROFILE

34
RSS4 © 2018 NMG Consulting. All rights reservedConducted for T. Rowe Price by NMG Consulting
ProfileBy total retirees
As of 2018. Base: total interviews.
Total retirees Male Female
N= 1004 466 538Male 49% 100% 0%Female 51% 0% 100%
Average age 72 72 73
Average years since retirement 11 11 11
Work status:Working full time 2% 3% 1%Working part time 8% 9% 7%Retired and not working or looking for work 85% 83% 87%
Married/partnered 64% 73% 56%

35
ProfileBy retiree gender
As of 2018. Base: total interviews.
Total retirees Male Female
N= 1004 466 538Have children < 18 in HH 2% 1% 3%Have adult children 77% 76% 78%Have a living parent 17% 20% 13%
Education:High school or less 35% 25% 45%Some post secondary 23% 24% 22%College degree or more 41% 51% 32%
Personal income (average $ in thousands) $67 $79 $55 Personal income (median $ in thousands) $53 $67 $41
Household income (average $ in thousands) $110 $126 $95 Household income (median $ in thousands) $88 $100 $70
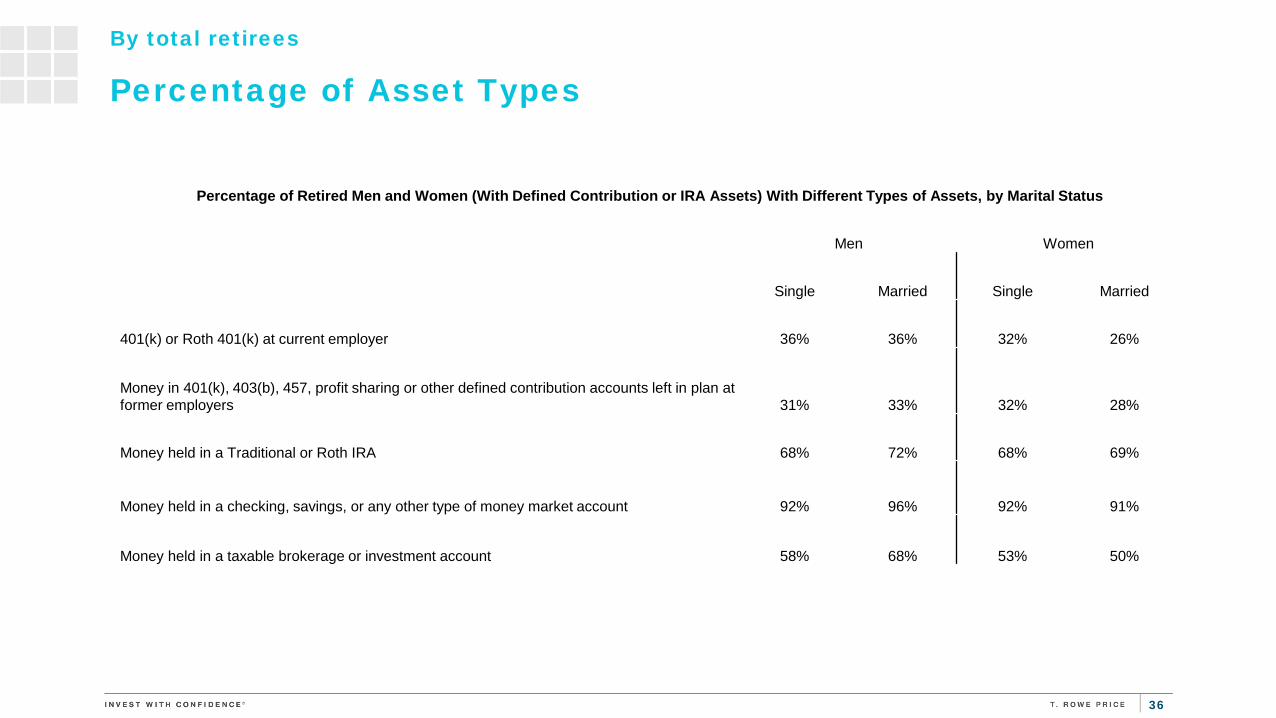
36
Percentage of Retired Men and Women (With Defined Contribution or IRA Assets) With Different Types of Assets, by Marital Status
Men Women
Single Married Single Married
401(k) or Roth 401(k) at current employer 36% 36% 32% 26%
Money in 401(k), 403(b), 457, profit sharing or other defined contribution accounts left in plan at former employers 31% 33% 32% 28%
Money held in a Traditional or Roth IRA 68% 72% 68% 69%
Money held in a checking, savings, or any other type of money market account 92% 96% 92% 91%
Money held in a taxable brokerage or investment account 58% 68% 53% 50%
By total retirees
Percentage of Asset Types
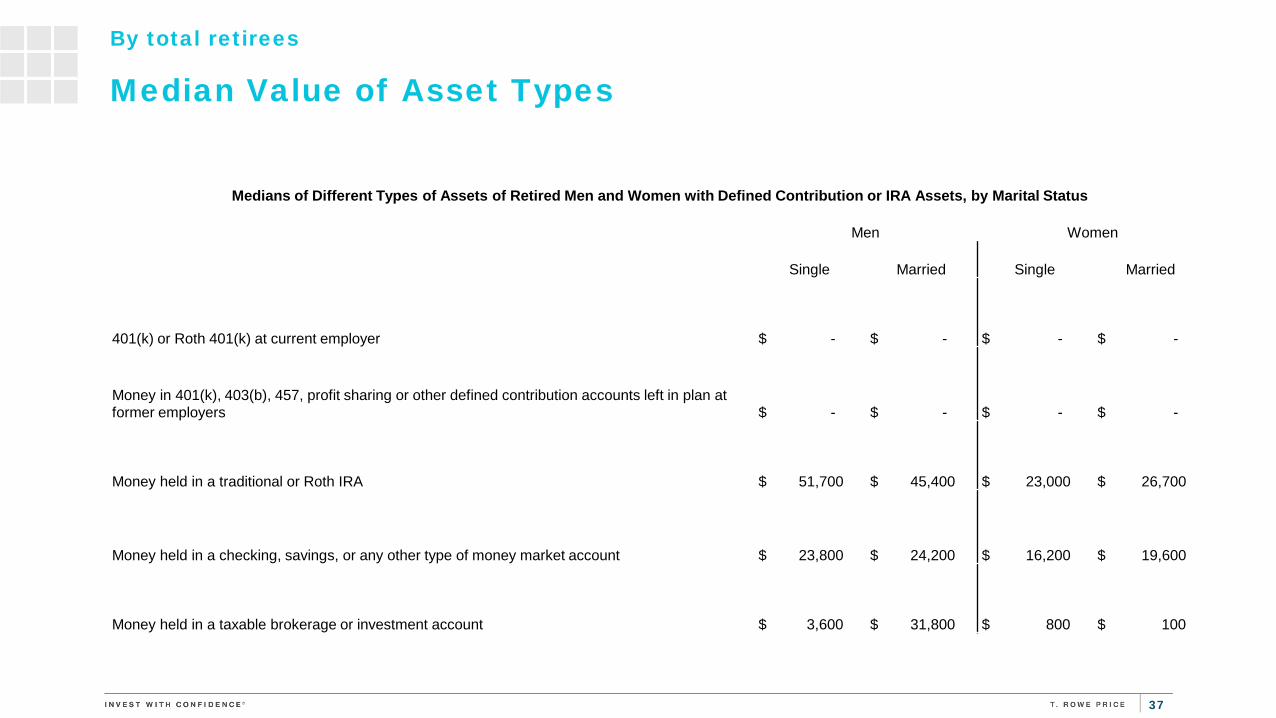
37
Medians of Different Types of Assets of Retired Men and Women with Defined Contribution or IRA Assets, by Marital Status
Men Women
Single Married Single Married
401(k) or Roth 401(k) at current employer $ - $ - $ - $ -
Money in 401(k), 403(b), 457, profit sharing or other defined contribution accounts left in plan at former employers $ - $ - $ - $ -
Money held in a traditional or Roth IRA $ 51,700 $ 45,400 $ 23,000 $ 26,700
Money held in a checking, savings, or any other type of money market account $ 23,800 $ 24,200 $ 16,200 $ 19,600
Money held in a taxable brokerage or investment account $ 3,600 $ 31,800 $ 800 $ 100
By total retirees
Median Value of Asset Types
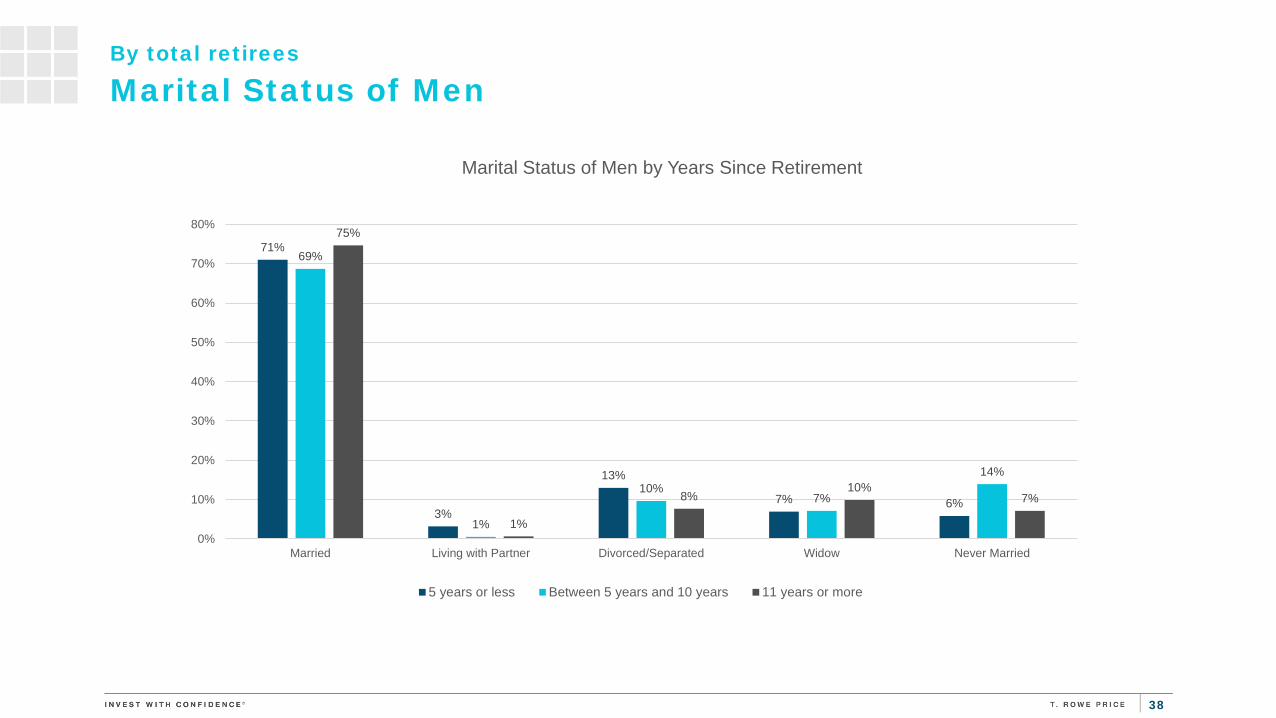
38
71%
3%
13%
7% 6%
69%
1%
10%7%
14%
75%
1%
8%10%
7%
0%
10%
20%
30%
40%
50%
60%
70%
80%
Married Living with Partner Divorced/Separated Widow Never Married
Marital Status of Men by Years Since Retirement
5 years or less Between 5 years and 10 years 11 years or more
By total retirees
Marital Status of Men

39
56%
3%
19%
15%
7%
58%
4%
13%
20%
5%
50%
0%
10%
35%
5%
0%
10%
20%
30%
40%
50%
60%
70%
Married Living with Partner Divorced/Separated Widow Never Married
Marital Status of Women by Years Since Retirement
5 years or less Between 5 years and 10 years 11 years or more
By total retirees
Marital Status of Women

40
2%6%
1%3%
6%
83%
1%4%
0%4% 5%
87%
0%
10%
20%
30%
40%
50%
60%
70%
80%
90%
100%
Retired but now workingfull-time as an employee
Retired but now workingpart-time as an employee
Retired but now workingfull-time as a contractor
Retired but now workingpart-time as a contractor
Retired but now lookingfor work
Retired and not working orlooking for work
Men Women
By total retirees
Bearing in mind that some people retire and then go back to work, which one of the following phrases best describes your work situation?
Work Status
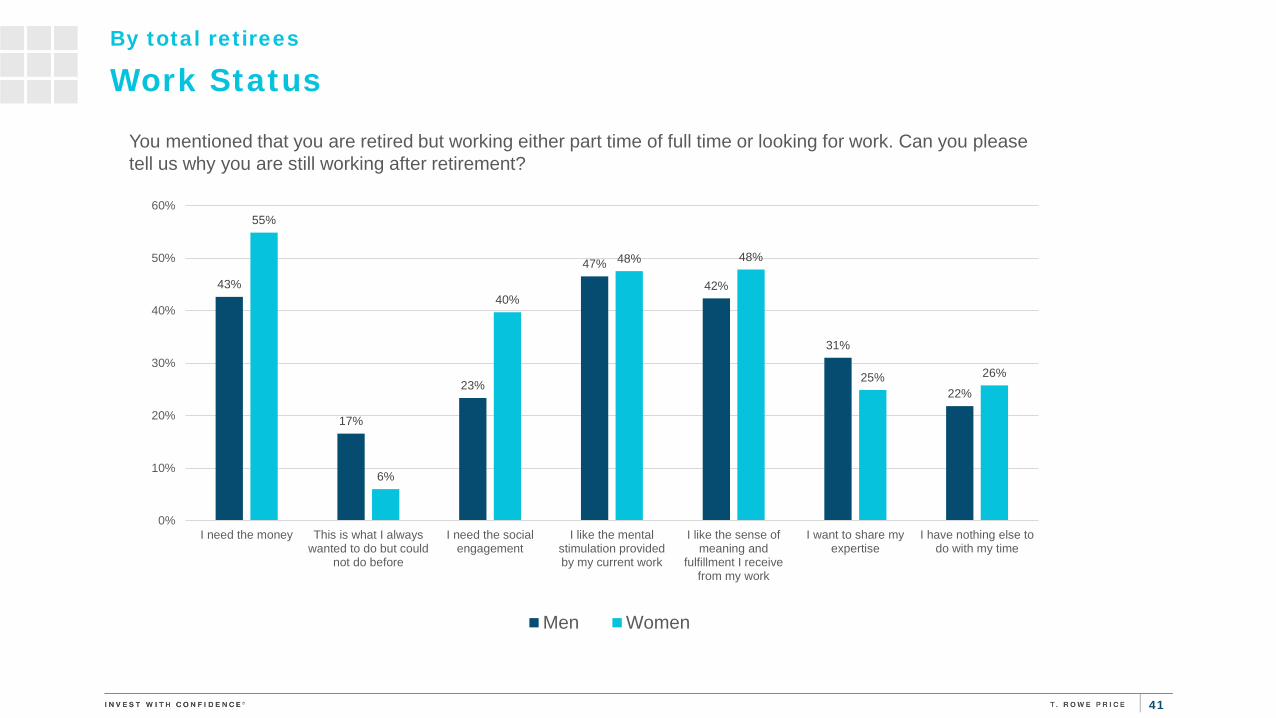
41
43%
17%
23%
47%
42%
31%
22%
55%
6%
40%
48% 48%
25% 26%
0%
10%
20%
30%
40%
50%
60%
I need the money This is what I alwayswanted to do but could
not do before
I need the socialengagement
I like the mentalstimulation providedby my current work
I like the sense ofmeaning and
fulfillment I receivefrom my work
I want to share myexpertise
I have nothing else todo with my time
Men Women
You mentioned that you are retired but working either part time of full time or looking for work. Can you please tell us why you are still working after retirement?
By total retirees
Work Status

RETIREES:RETIREMENT EXPERIENCE BY GENDER

43
38%
47%
5%
10%
6%8%
62%
24%
41%44%
4%
11%
39% 38%
7%
16%
7%
17%
56%
20%
36%
43%
3%
19%
0%
10%
20%
30%
40%
50%
60%
70%
AgreeCompletely
AgreeSomewhat
DisagreeCompletely
DisagreeSomewhat
AgreeCompletely
AgreeSomewhat
DisagreeCompletely
DisagreeSomewhat
AgreeCompletely
AgreeSomewhat
DisagreeCompletely
DisagreeSomewhat
So far, my retirement has turned out to be just asgood or better than I expected
My retirement has turned out to be worse than Iexpected
I am enjoying my retirement years more than myprimary working years
Retirement Experience by Gender for Those Retired for 5 Years or Less
Men
Women
How much do you agree or disagree with the following statements?
Retirement Experience

44
40%
53%
3% 4% 3% 4%
68%
25%
36%
47%
5%
12%
32%
46%
6%
16%
5%
21%
55%
19%
32%
44%
6%
19%
0%
10%
20%
30%
40%
50%
60%
70%
80%
AgreeCompletely
AgreeSomewhat
DisagreeCompletely
DisagreeSomewhat
AgreeCompletely
AgreeSomewhat
DisagreeCompletely
DisagreeSomewhat
AgreeCompletely
AgreeSomewhat
DisagreeCompletely
DisagreeSomewhat
So far, my retirement has turned out to be just asgood or better than I expected
My retirement has turned out to be worse than Iexpected
I am enjoying my retirement years more than myprimary working years
Retirement Experience by Gender for Those Retired for More Than 5 Years but 10 Years or Less
Men
Women
Retirement Experience
How much do you agree or disagree with the following statements?
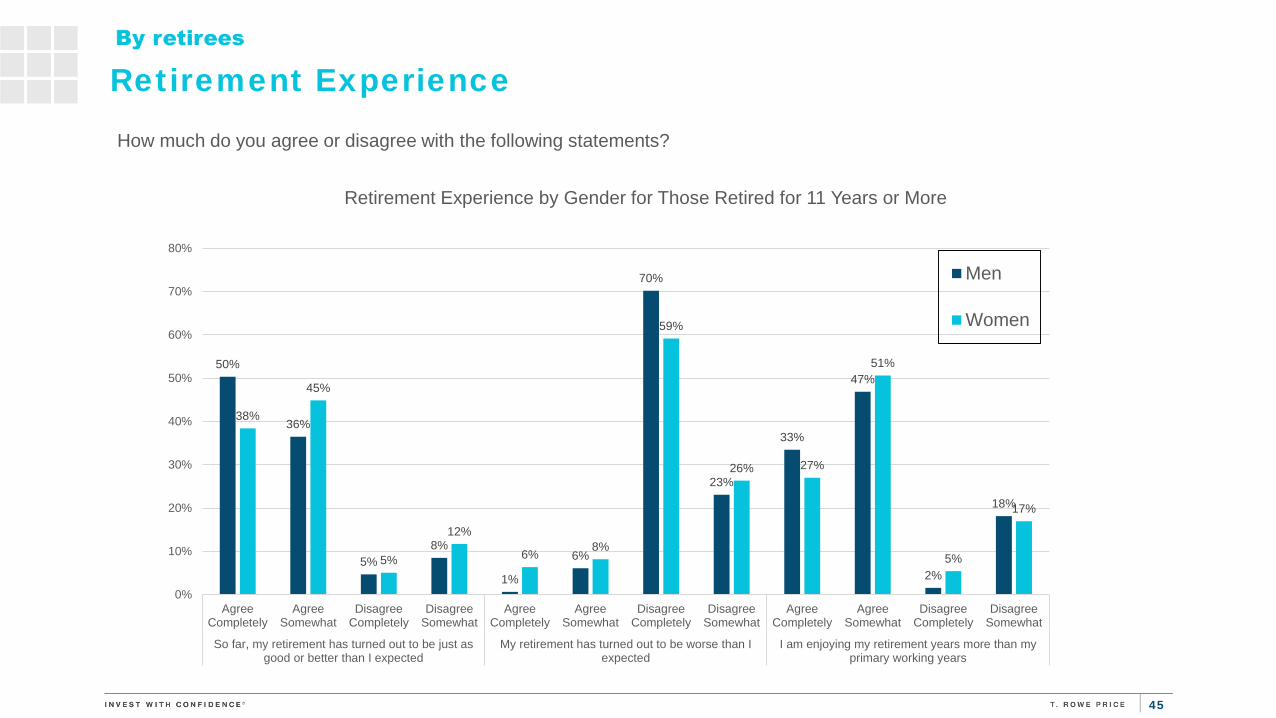
45
50%
36%
5%8%
1%
6%
70%
23%
33%
47%
2%
18%
38%
45%
5%
12%
6% 8%
59%
26% 27%
51%
5%
17%
0%
10%
20%
30%
40%
50%
60%
70%
80%
AgreeCompletely
AgreeSomewhat
DisagreeCompletely
DisagreeSomewhat
AgreeCompletely
AgreeSomewhat
DisagreeCompletely
DisagreeSomewhat
AgreeCompletely
AgreeSomewhat
DisagreeCompletely
DisagreeSomewhat
So far, my retirement has turned out to be just asgood or better than I expected
My retirement has turned out to be worse than Iexpected
I am enjoying my retirement years more than myprimary working years
Retirement Experience by Gender for Those Retired for 11 Years or More
Men
Women
Retirement Experience
How much do you agree or disagree with the following statements?