focusing on qep goals. “the institution has developed an acceptable quality enhancement plan (qep)...
TRANSCRIPT

Focusing on QEP Goals

“The institution has developed an acceptable Quality Enhancement Plan (QEP) that (1) includes a broad-based institutional process identifying key issues emerging from institutional assessment, (2) focuses on learning outcomes and/or the environment supporting student learning and accomplishing the mission of the institution, (3) demonstrates institutional capability for the initiation, implementation, and completion of the QEP, (4) includes broad-based involvement of institutional constituencies in the development and proposed implementation of the QEP, and (5) identifies goals and a plan to assess their achievement.”

LU Data
Review:Framing A QEP
Student demographi
cs
PeerQEPs
Focus Groups:
Strengths and
Weaknesses
List of potential activities:survey of faculty
preferences
Goals?
So far
QEP Development Committee
Recommendations

What challenges are we going to tackle?
andWhat goals are we trying
to achieve?
Today: Goals
By September: ballpark budget

Then . . .
QEP Design Committee – Chooses specific activities to meet the
goals and scope, with extensive faculty input
– Designs a procedure for implementation– Selects assessments– Develops detailed 5 year budget– Keeps Leadership Team informed– Directs public relations and marketing of
QEP

Assumptions of LU QEP
• Scope will be adjusted to fit budgetary constraints. Whatever we do, we want to do well
• No new course requirements• Will elicit faculty involvement
voluntarily using incentives• Will attempt to incorporate the
activities most preferred by faculty

LU Data
QEP Dev.Committee
BestPractices
LU Mission,Vision
QEP Goals
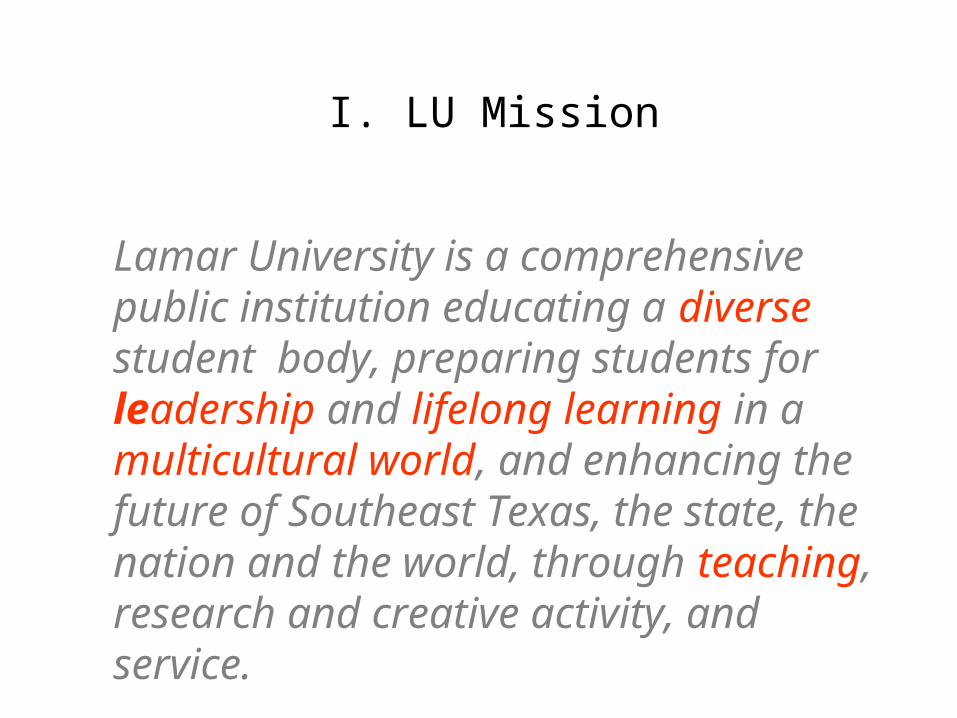
I. LU Mission
Lamar University is a comprehensive public institution educating a diverse student body, preparing students for leadership and lifelong learning in a multicultural world, and enhancing the future of Southeast Texas, the state, the nation and the world, through teaching, research and creative activity, and service.

LU Strategic Goals
Strategic Plan“To attract, retain and graduate . . .”“To engage students with faculty and staff. . ““To meet learning needs of students. . .”“To provide educational experiences of excellence. . . .”“To enhance student life. . .”
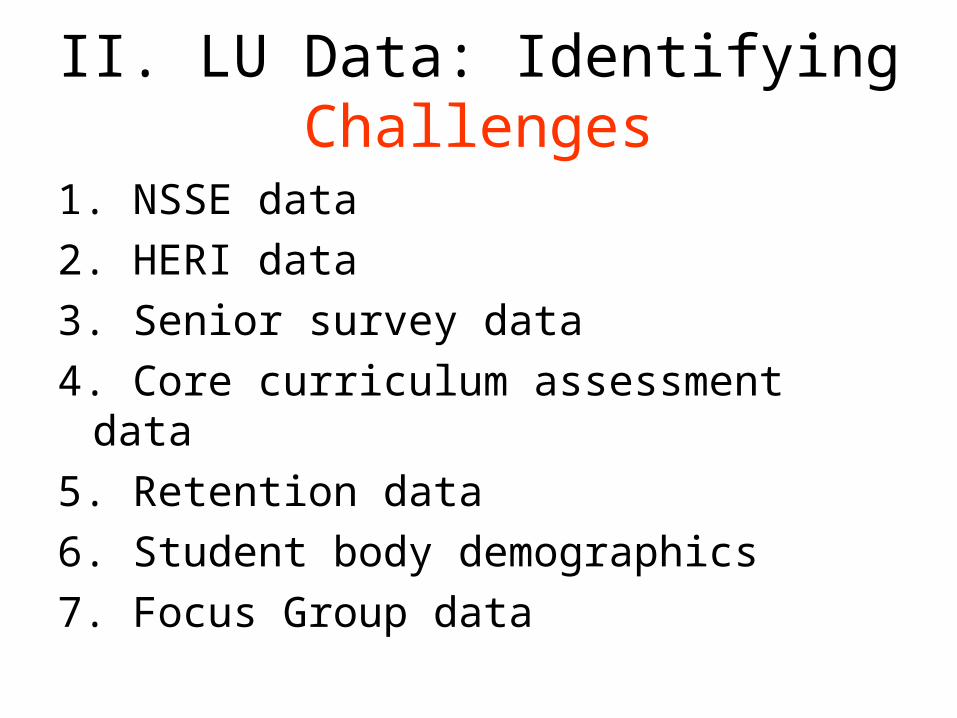
II. LU Data: Identifying Challenges
1. NSSE data2. HERI data3. Senior survey data4. Core curriculum assessment data5. Retention data6. Student body demographics7. Focus Group data
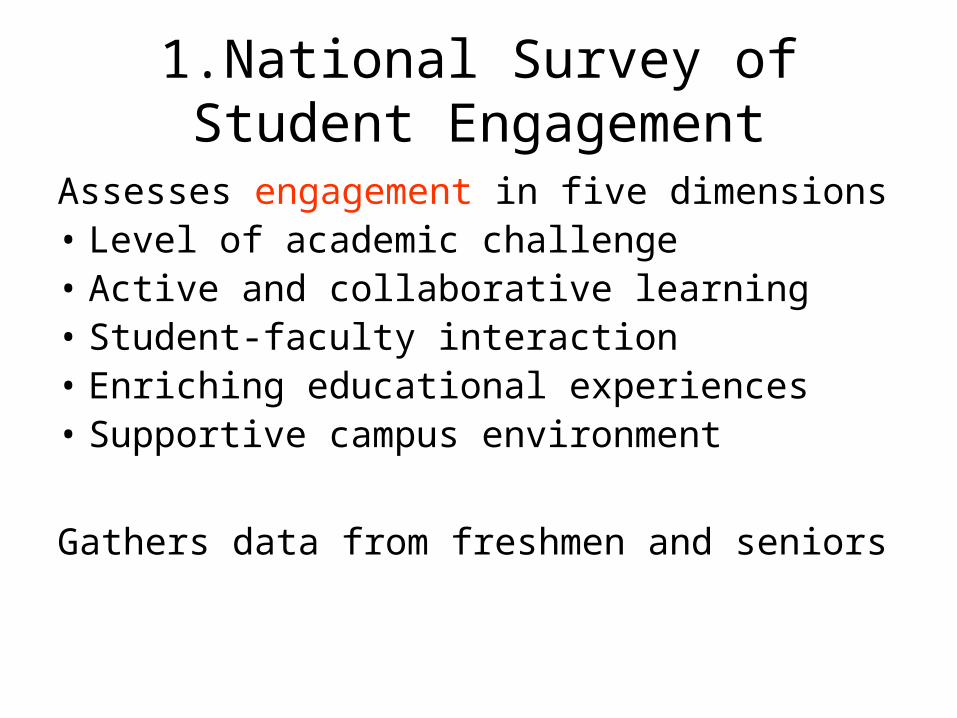
1.National Survey of Student Engagement
Assesses engagement in five dimensions• Level of academic challenge• Active and collaborative learning• Student-faculty interaction• Enriching educational experiences• Supportive campus environment
Gathers data from freshmen and seniors

Why engagement is importantGeorge Kuh, creator of the NSSE. . .
“Students who participate in collaborative learning and educational activities outside the classroom and who interact more with faculty members get better grades, are more satisfied with their education, and are more likely to remain in college. But the gains from those practices are even greater for students from underrepresented racial and ethnic backgrounds, or who come to college less prepared than their peers."
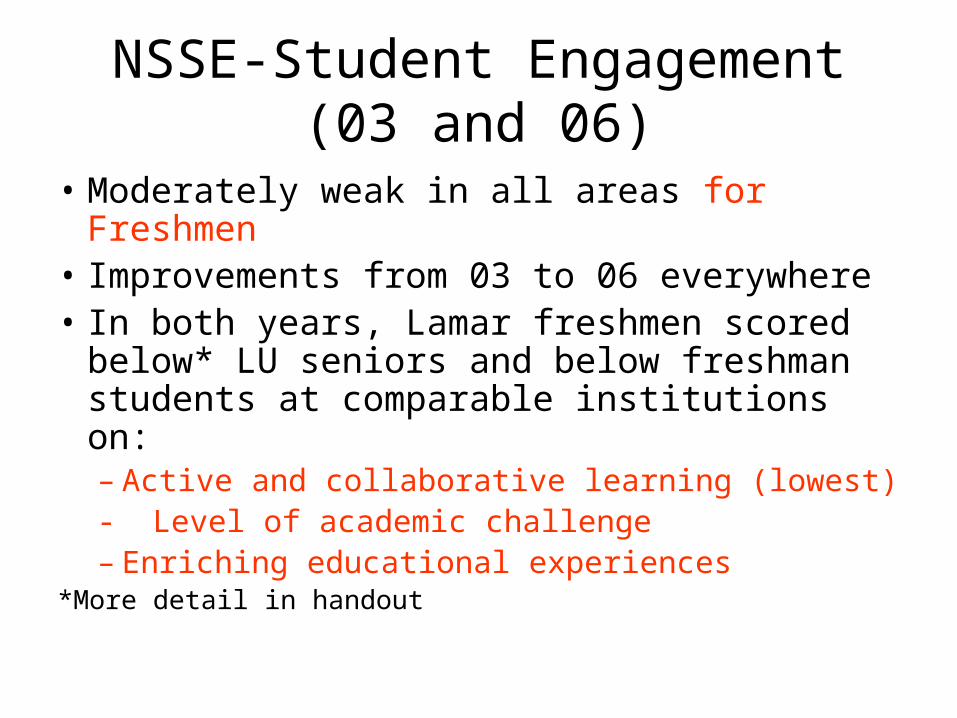
NSSE-Student Engagement (03 and 06)
• Moderately weak in all areas for Freshmen
• Improvements from 03 to 06 everywhere• In both years, Lamar freshmen scored
below* LU seniors and below freshman students at comparable institutions on: – Active and collaborative learning (lowest)- Level of academic challenge– Enriching educational experiences
*More detail in handout
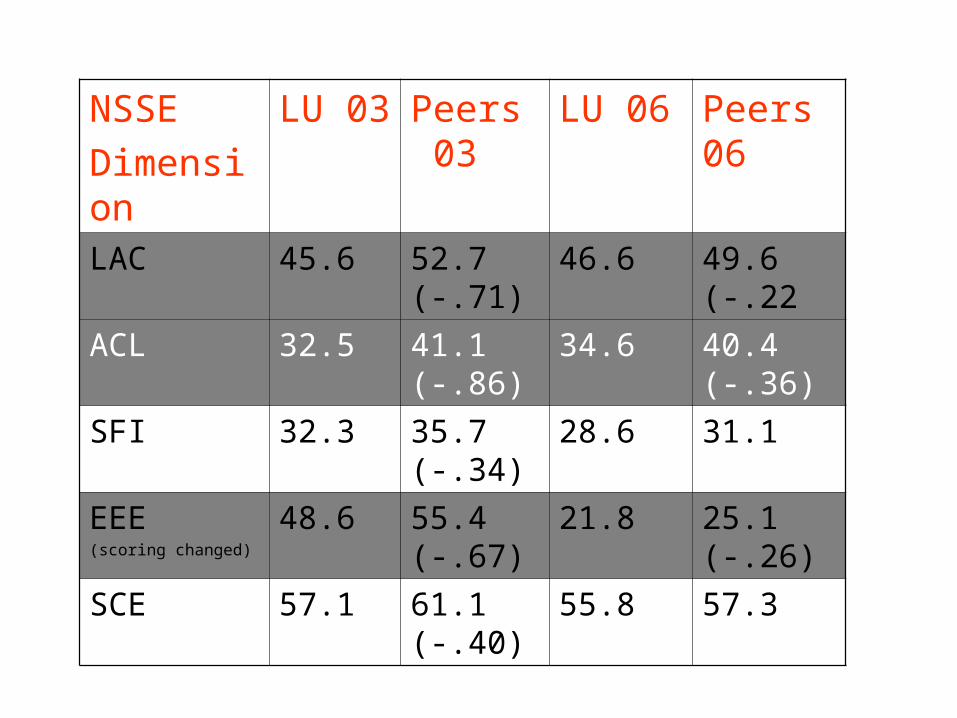
NSSEDimension
LU 03 Peers 03
LU 06 Peers 06
LAC 45.6 52.7 (-.71)
46.6 49.6 (-.22
ACL 32.5 41.1 (-.86)
34.6 40.4 (-.36)
SFI 32.3 35.7 (-.34)
28.6 31.1
EEE(scoring changed)
48.6 55.4 (-.67)
21.8 25.1 (-.26)
SCE 57.1 61.1 (-.40)
55.8 57.3

2. HERI 04: Faculty report on methods they use in most or all of their courses
METHOD LU % 4-Yr Colleges %
Class discussion 74 81
Cooperative learning 32 49
Essay midterm/final 48 57
Extensive lecturing 68 56
Group projects 25 36
Multiple drafts of written wk 18 27
MC midterm/final 49 34
Short answer midterm/final 24 39
Student presentations 40 46
Student-selected topics 10 15
Challenge?
Lamar faculty report NOT using instruction which promotes active and collaborative learning.
More use of lecture and multiple-choice exams than in peer institutions. Less use of discussion, collaborative learning, projects, etc.

3. Senior survey: Satisfaction with Core and Major (fall 05, spring 06)
Lowest Highest
FALL 05 SPRING 06Writing (comp) 3.24 3.14
Math/Qualitative
2.86 3.1
Fine Arts 2.79 2.75
Literature 2.96 2.73
Social Science 2.89 2.8
Oral Comm. 3.27 3.29
Phil of Know. 2.62 2.72
Physical Activity
2.25 2.4
Major courses 3.67 3.66

Implications?• Overall mean satisfaction with
core academic areas (2.86) lower than mean satisfaction for ALL other areas (3.08).
• Courses that students like best (Written and Oral Communications) focus on active learning. Academic course they dislike most is least active.
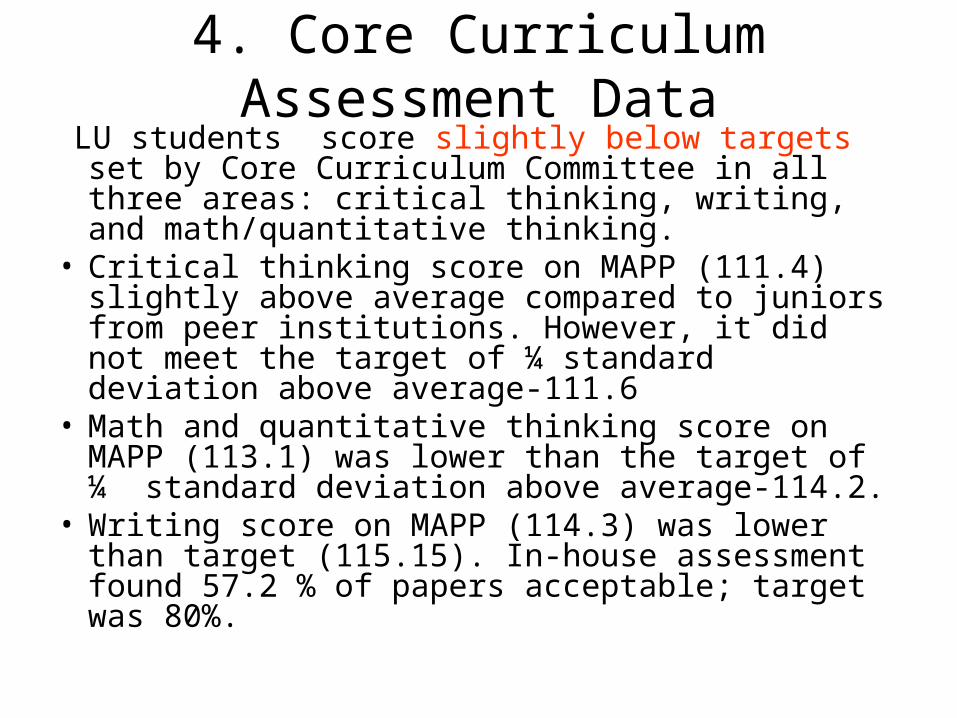
4. Core Curriculum Assessment Data
LU students score slightly below targets set by Core Curriculum Committee in all three areas: critical thinking, writing, and math/quantitative thinking.
• Critical thinking score on MAPP (111.4) slightly above average compared to juniors from peer institutions. However, it did not meet the target of ¼ standard deviation above average-111.6
• Math and quantitative thinking score on MAPP (113.1) was lower than the target of ¼ standard deviation above average-114.2.
• Writing score on MAPP (114.3) was lower than target (115.15). In-house assessment found 57.2 % of papers acceptable; target was 80%.

* Attrition rates higher in some sub-groups
5. LU Freshman Retention1-yr Retention
rateAttrition rate
Fall 2004 entering FTIC freshmen to fall 05
59.01% 40.99%*
Fall 2005 entering FTIC freshmen to fall 06
57.93% 42.07%*
National average of public comprehensive “low-lows” 65% in Pell Institute report, “Demography is not Destiny: Increasing the Graduation Rates of Low-Income College Students at Large Public
Institutions” (2007)

THECB Comparisons: 1 yr persistence
LU UTPanAm
SFA PrairieView
Tarleton
WT A&M
TAMUInt’l
TAMUCorpus
2004
72.8
76.6 86.6
76.1 82.9
79.3 84.8 81.1
2005
75.6
82.3 84.7
82 79.5
78.6 86.8 80.1
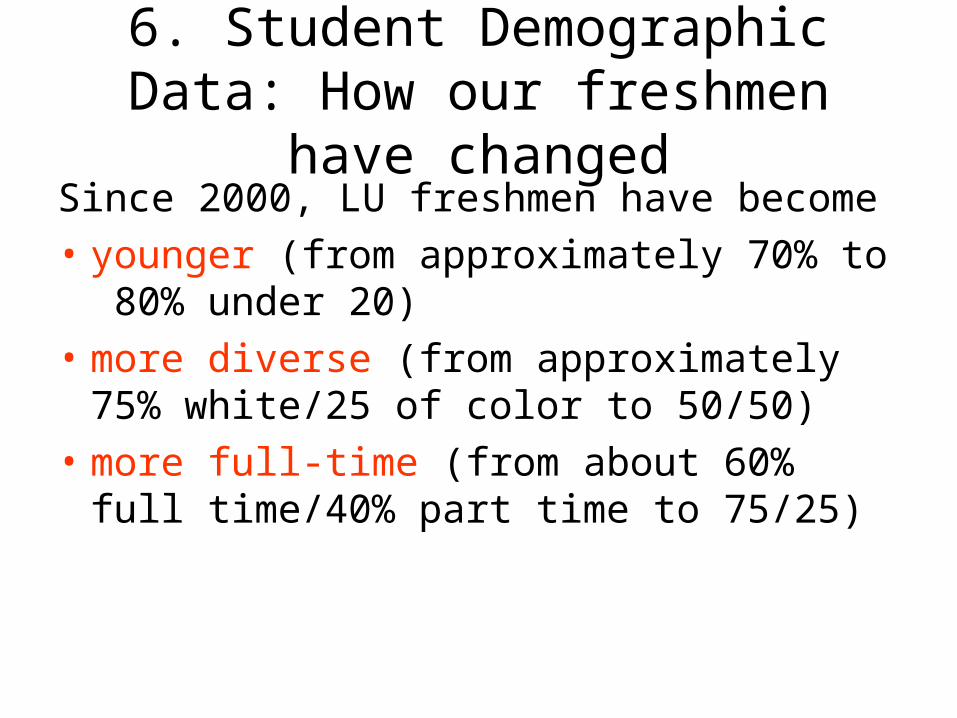
6. Student Demographic Data: How our freshmen have
changedSince 2000, LU freshmen have become• younger (from approximately 70% to
80% under 20)• more diverse (from approximately
75% white/25 of color to 50/50)• more full-time (from about 60% full
time/40% part time to 75/25)
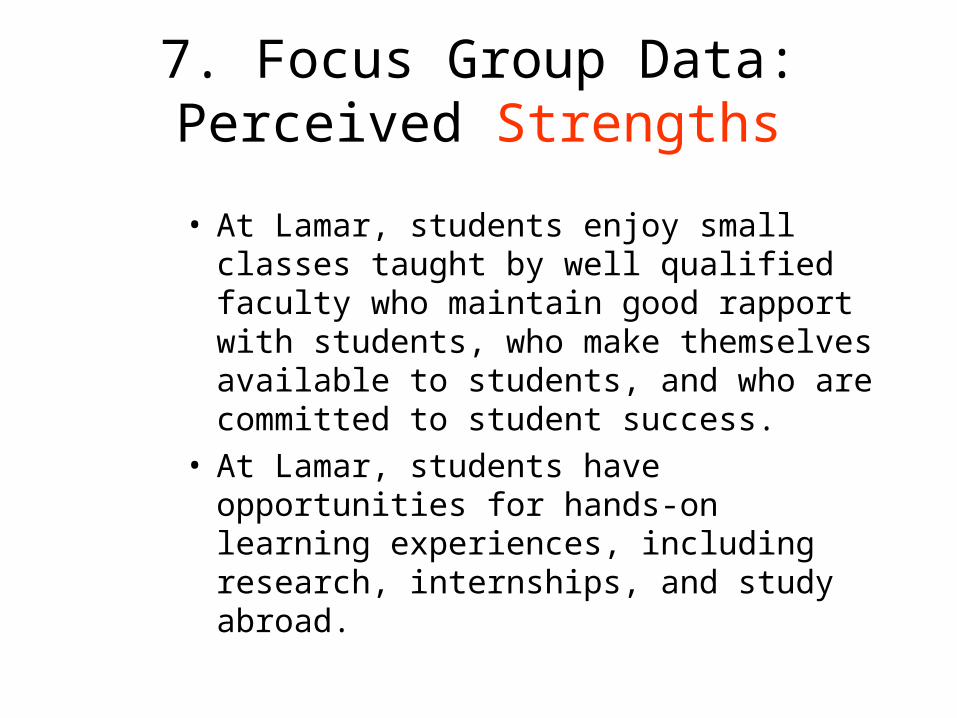
• At Lamar, students enjoy small classes taught by well qualified faculty who maintain good rapport with students, who make themselves available to students, and who are committed to student success.
• At Lamar, students have opportunities for hands-on learning experiences, including research, internships, and study abroad.
7. Focus Group Data: Perceived Strengths

More perceived strengths …
• Lamar has a lively and livable campus environment.
• Lamar makes information technology available.
• Lamar has diverse academic programs meeting the needs of a diverse student body.
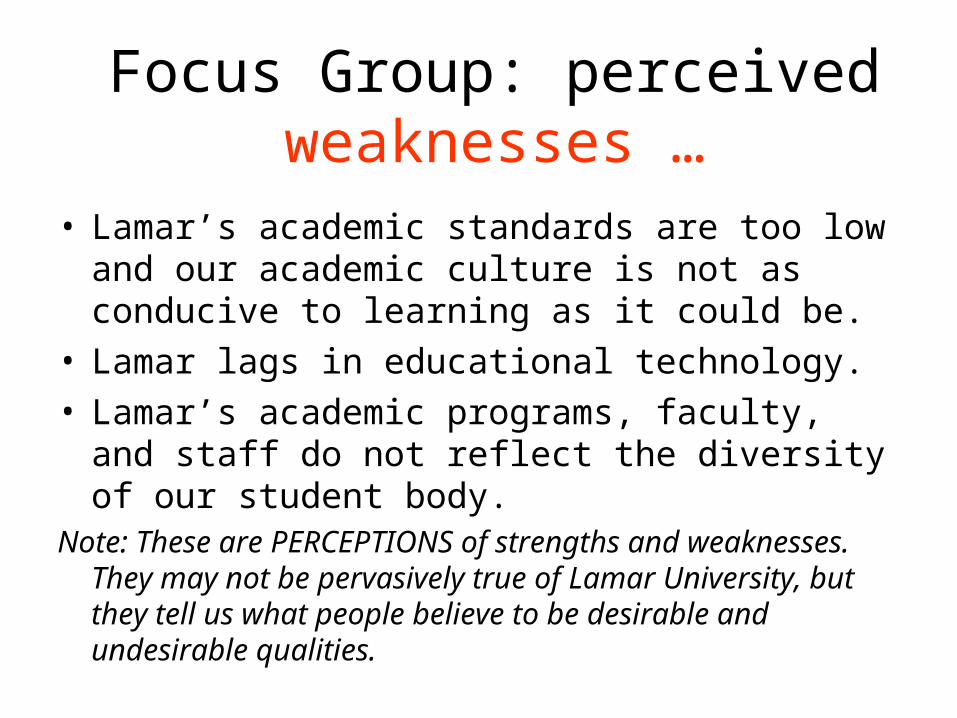
Focus Group: perceived weaknesses …
• Lamar’s academic standards are too low and our academic culture is not as conducive to learning as it could be.
• Lamar lags in educational technology. • Lamar’s academic programs, faculty, and
staff do not reflect the diversity of our student body.
Note: These are PERCEPTIONS of strengths and weaknesses. They may not be pervasively true of Lamar University, but they tell us what people believe to be desirable and undesirable qualities.

Conclusions of the QEP Development Group
• We already have as perceived strengths Strong faculty-student relations Opportunities for hands-on learning
experiences A high level of diversity
• These offer a strong foundation for a QEP focused on student engagement and active learning in the freshman year.

Possible QEP activities identified by QEP Development
Committee*Highest faculty interest
• Course Redesign• Undergraduate Research • Inquiry-Based Learning*• Enhanced Use of Technology in
Teaching and Learning* • Experiential/Applied Learning• Integrative Learning

-- Chronicle of Higher Education
1. Does this group concur with the general
recommendation of the QEP Development committee that our goal should be a QEP focused on student engagement and active learning in the freshman
year?
Discussion
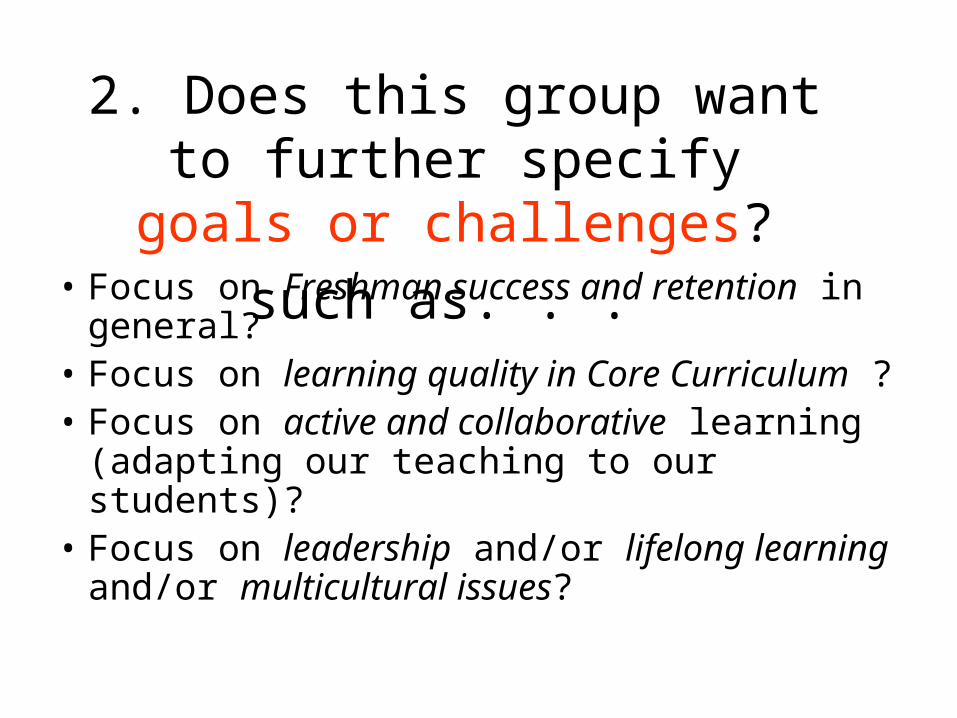
• Focus on Freshman success and retention in general?
• Focus on learning quality in Core Curriculum ?
• Focus on active and collaborative learning (adapting our teaching to our students)?
• Focus on leadership and/or lifelong learning and/or multicultural issues?
2. Does this group want to further specify goals or
challenges?such as. . .

Priorities
Use the “ballot” to indicate the three issues which are your top priorities for the QEP. Number the items 1, 2, 3.

The Documented Challenges
1.Too little active and collaborative learning2. Low student satisfaction with core
curriculum3. Student learning in core lagging slightly4. High attrition rate from freshman-
sophomore year. Persistence for all students lagging.
5. Changing student demographics6. Perception that Lamar’s academic standards
are too low and our academic culture is not as conducive to learning as it could be.
Freshman Success and Retention Best Practices: the
packagefrom “Demography is Not Destiny” Pell Institute 2007
• Freshman-year experiences • Redesign of Freshman/core courses for active
learning• Learning communities (and living/learning)• Coordinated, proactive advising system• Student engagement activities: service learning,
undergrad research, clubs, groups and organizations.
• Financial aid education

Learning Quality in Core Curriculum: Best Practices
• Revised teaching methods; more active learning
• Use of technology• Clarified and revised learning outcomes• Improved assessments• More student feedback• More use of collaboration, service
learning, projects