fomc 20070628 g bpt 120070620
TRANSCRIPT

Content last modified 02/07/2013.
Prefatory Note The attached document represents the most complete and accurate version available based on original files from the FOMC Secretariat at the Board of Governors of the Federal Reserve System. Please note that some material may have been redacted from this document if that material was received on a confidential basis. Redacted material is indicated by occasional gaps in the text or by gray boxes around non-text content. All redacted passages are exempt from disclosure under applicable provisions of the Freedom of Information Act.
Class II FOMC - Restricted (FR)
Part 1 June 20, 2007
CURRENT ECONOMICAND FINANCIAL CONDITIONS
Summary and Outlook
Prepared for the Federal Open Market Committeeby the staff of the Board of Governors of the Federal Reserve System

Class II FOMC - Restricted (FR)
June 20, 2007
Summary and Outlook
Prepared for the Federal Open Market Committeeby the staff of the Board of Governors of the Federal Reserve System

Class II FOMC—Restricted (FR)
Domestic Developments
I-1
The recent economic data have been a little stronger, on balance, than we were anticipating at the time of the last Greenbook. Although consumer spending has decelerated about in line with our previous forecast, the level of personal income was revised up in recent quarters and employment gains have continued apace, suggesting that households will have a bit more wherewithal to spend in the period ahead. Businesses also seem to be on firmer footing overall: The softness in fixed investment that began late last year appears to have diminished, and businesses have made noticeable progress in addressing their inventory imbalances. To be sure, the residential construction sector remains weak; but in contrast to the situation in so many of our recent forecasts, the ongoing decline in residential investment has not outstripped our expectations. In addition, the fallout from problems in the subprime lending market does not look to have spread. Financial market participants appear to have interpreted this incoming news as having reduced the downside risk to activity. Investors no longer expect a significant easing of monetary policy over the next year, and bond rates have moved up considerably in recent weeks on the change in policy expectations and on a rise in term premiums. However, this recent rise in rates mostly brings forward the increases that we had previously expected to occur later in the forecast period and thus imparts only a small drag on growth. Indeed, because of the greater momentum that we see in economic activity, slightly higher equity prices, and a slightly lower path for the exchange value of the dollar in this forecast, we have nudged up our projection for real GDP growth to an annual rate of roughly 2½ percent over the forecast period. With this small upward revision to growth, we now show a bit less easing of resource utilization in this projection, and the unemployment rate moves up to only 4¾ percent next year, compared with 5 percent in the May Greenbook. Core inflation in April and May came in lower than expected, and we now estimate that core PCE inflation will average an annual rate of only 1.9 percent over the first two quarters of this year. We view much of the recent favorable news as transitory, and we project that core PCE inflation will move back up to an annual pace of 2.2 percent in the second half. Even so, we have taken some signal that inflation will run a little lower than we had thought, and we have reduced our core PCE inflation projection over the forecast period 0.1 percentage point below that in the May Greenbook; our projection for 2008 is now 2 percent. Total PCE prices are projected to rise almost 3 percent this year, pushed

Class II FOMC -- Restricted (FR)
Key Background Factors Underlying the Baseline Staff Projection
2003 2004 2005 2006 2007 20080
1
2
3
4
5
6
7
0
1
2
3
4
5
6
7Percent
Federal Funds Rate
Quarterly average
Note. The assumed federal funds rate is unchanged from the MayGreenbook.
Note. In each panel, shading represents the projection period.
Current Greenbook
May Greenbook
Market forecast
2003 2004 2005 2006 2007 20083
4
5
6
7
8
9
3
4
5
6
7
8
9Percent
Long-Term Interest Rates
Quarterly average
Baa corporate rate
May GB
10-yearTreasury rate
May GB
2003 2004 2005 2006 2007 200890
2302003:Q1=100, ratio scale
90
110
130
150
170
190
210
230Quarter-end
Equity Prices
Wilshire 5000
May GB
2003 2004 2005 2006 2007 200890
1702003:Q1=100, ratio scale
90
110
130
150
170Quarterly
House Prices
OFHEO purchase-only index
May GB
2003 2004 2005 2006 2007 200820
30
40
50
60
70
80
90
20
30
40
50
60
70
80
90Dollars per barrel
Crude Oil Prices
Quarterly average
West Texasintermediate
May GB
2003 2004 2005 2006 2007 200875
80
85
90
95
100
105
75
80
85
90
95
100
1052003:Q1=100
Broad Real Dollar
Quarterly average
May GB
I-2

Domestic Developments Class II FOMC—Restricted (FR) I-3
up both by sharp increases in energy prices and by sizable increases in food prices. In 2008, we project headline inflation to rise the same 2 percent as core inflation. Key Background Factors We continue to assume that the Committee will hold the federal funds rate at 5¼ percent through the end of 2008. At the time of the last Greenbook, market participants had been expecting a policy easing of more than 75 basis points by the end of next year, but they have since revised their expectations and now anticipate only a small change in policy over the forecast period. Reflecting both this revision to policy expectations and an increase in term premiums, ten-year Treasury yields have risen almost 50 basis points since the time of the May Greenbook (or about 40 basis points more than we had anticipated); corporate yields and mortgage rates have risen similar amounts. Because the market path for the federal funds rate has come much closer to our assumptions and because we assume no further appreciable change in term premiums, we now expect long-term yields to hold about steady at the higher rates over the forecast period. This flat pattern contrasts with the updrift we had previously projected. Thus, at the end of 2008, long rates exceed those in our previous forecast by only about 10 basis points. Broad equity indexes are currently about 2½ percent above the level that we had assumed in the May Greenbook. As is our usual practice, we assume that equity prices will increase from their current level at an annual rate of 6½ percent, a pace that roughly maintains risk-adjusted parity with the return on Treasury securities. Regarding house prices, the purchase-only version of the OFHEO price index posted a small increase in the first quarter that was about in line with our expectations. We continue to expect this index to be essentially unchanged through the end of 2008. Our fiscal policy assumptions are little changed from the last Greenbook. The $120 billion supplemental appropriations bill that passed last month was in line with our expectations, and it included $100 billion of additional budget authority for defense spending. We continue to assume that real defense purchases will move up modestly next year and that nondefense purchases will hold steady in real terms. On the tax side, we expect that relief from the alternative minimum tax will be extended through 2008. In all, we project federal fiscal policy to provide an impetus to real GDP growth of about ¼ percentage point both this year and next, close to the forecast in the May Greenbook. We also expect that state and local governments, in the aggregate, will provide around ¼ percentage point of impetus to real GDP growth both this year and next. Finally, our federal deficit projections are little changed from the last forecast, with the federal unified

I-4 Class II FOMC—Restricted (FR) Part 1: Summary and Outlook, June 20, 2007
budget expected to post deficits of $170 billion in the current fiscal year and about $230 billion in fiscal 2008. With bond rates now presumed to remain flat in this projection rather than to rise as we had earlier assumed, we now expect interest rates to provide less support to the dollar over the forecast period. As a result, we project the real trade-weighted dollar to decline at an average annual rate of about 2 percent over the forecast period, compared with a 1 percent average pace of depreciation in the May Greenbook. In addition, we have maintained our view that foreign real GDP will expand at an annual rate of roughly 3½ percent through the end of 2008. Oil prices have moved up a little more than we had expected, on net, since early May. The spot price of West Texas intermediate (WTI) crude oil stands at about $69 per barrel, about $5 per barrel above its level at the time of the May Greenbook, and prices for other grades of oil have moved up a bit more. Consistent with futures markets, our projection calls for the average price of imported oil to rise from $63 per barrel in the second quarter of this year to about $69 per barrel—$1.70 above our previous projection—at the end of the forecast period. Recent Developments and the Near-Term Outlook Real GDP is estimated to have risen at an annual rate of 1 percent in the first quarter, ¼ percentage point slower than we had anticipated at the time of the last Greenbook. Incoming data for the current quarter, however, point to a larger rebound in growth than we had been expecting—to a pace of 3 percent. A larger swing in inventory investment associated with the greater progress that businesses appear to have made in reining in excess stocks contributes importantly to this pattern of revisions. Moreover, final sales are running stronger than we had anticipated in our May forecast, and personal income has revised up. Therefore, even though we have not revised our earlier projection for growth to average an annual pace of 2 percent in the first half of this year, conditions appear to be in place for faster growth after the current quarter than we had previously expected. Labor demand has been increasing at a moderate pace, with private payroll gains averaging 115,000 over the past three months. Although this pace of hiring is down from net monthly gains in excess of 160,000 in the second half of last year, it is still somewhat greater than we think sustainable given the recent and prospective pace of output growth. As a result, we look for private payrolls to decelerate further, to increases of 100,000 in

Domestic Developments Class II FOMC—Restricted (FR) I-5
Summary of the Near-Term Outlook (Percent change at annual rate except as noted)
2007:Q1 2007:Q2 Measure May
GB June GB
May GB
June GB
Real GDP 1.3 1.0 2.6 3.0 Private domestic final purchases 2.5 2.8 .7 .9 Personal consumption expenditures 3.8 4.3 1.9 1.6 Residential investment -14.1 -15.8 -18.5 -12.2 Business fixed investment 2.8 3.3 2.9 2.8 Government outlays for consumption and investment 1.4 1.0 4.9 4.7
Contribution to growth (percentage points)
Inventory investment -.4 -.9 .2 .3 Net exports -.8 -.7 .8 1.0
June and 60,000 per month, on average, in the third quarter. We should note, however, that initial claims for unemployment insurance have yet to provide any convincing evidence that the smaller projected employment gains are in the offing. With this slower pace of hiring going forward, we expect the unemployment rate to start edging up in the coming months. Manufacturing output has firmed, on balance, in recent months after declining in the fourth quarter and in the early part of this year, when firms in many industries restrained production to bring inventories back toward desired levels. Accordingly, we expect factory output to increase at a modest annual pace of about 3¼ percent in the current quarter. Part of that increase is in motor vehicles, where inventories have come into better alignment with sales after a sustained period of reduced assemblies. Vehicle production has stepped up this quarter, and we have taken on board as well some of the automakers’ higher scheduled assemblies in the third quarter. As expected, consumer spending has decelerated markedly in recent months following sizable gains in the fall and winter. Data on retail sales through May point to only a small increase in outlays for goods other than motor vehicles this quarter, and expenditures on vehicles appear to have moved a bit lower after rising sharply in the first quarter. Factoring in continued growth in outlays for services, we now look for real PCE to rise at an annual rate of about 1½ percent in the second quarter following an upward-revised 4¼ percent rate of increase in the first quarter.

I-6 Class II FOMC—Restricted (FR) Part 1: Summary and Outlook, June 20, 2007
The residential construction sector has remained weak. Sales in recent months have averaged well below their pace in the second half of last year, and we are expecting a bit more deterioration in coming months (partly in response to the recent rise in mortgage rates). Moreover, inventories of unsold new homes remain quite high, suggesting that homebuilders will need to cut production further to work off these excess stocks. Although single-family starts moved up in the early spring and fell back only a bit in May, their level seems surprising against the backdrop of further declines in permit issuance—historically a more reliable indicator. We therefore expect starts to move down to an annual pace of around 1.05 million units in the third quarter, bringing them more in line with permits. Business spending on equipment and software (E&S) is projected to be about flat this quarter, held down by a further decline in outlays for transportation equipment—especially medium and heavy trucks, which are experiencing a payback from the pull-forward of sales into 2005 and 2006 before the introduction of new EPA regulations. Elsewhere, E&S spending looks more solid than it did at the time of the May Greenbook. In particular, orders and shipments for nondefense capital goods picked up in March and April following their weakness in earlier months, and indexes from surveys of business conditions have improved as well. Consistent with these indicators, we project that E&S spending outside transportation equipment will rise at a pace of 6¼ percent this quarter. Construction of nonresidential structures appears to have rebounded from its lull around the turn of the year. Incoming monthly data on construction activity suggest that outlays for nonresidential buildings will surge at an annual rate above 14 percent this quarter. Recent readings on architectural billings point to additional growth going forward, albeit at a pace well below that seen since this sector began to rebound in late 2005. Spending in the drilling and mining sector is expected to edge lower this quarter after a sharp decline in the first quarter. However, with prices of oil and natural gas likely to remain high, we expect the weakness in this industry to be short lived. Real nonfarm inventories declined at an annual rate of about $5 billion in the first quarter following a modest $20 billion accumulation in the fourth quarter of last year; that swing subtracted nearly 1 percentage point from first-quarter GDP growth. We expect stockbuilding to turn positive in the current quarter and to contribute about ¼ percentage point to GDP growth. We estimate that inventories of motor vehicles edged a little lower this quarter, but with days’ supply at comfortable levels, inventories were reduced more slowly than in the first quarter. Outside motor vehicles, the pace of inventory investment

Domestic Developments Class II FOMC—Restricted (FR) I-7
stepped down appreciably to $14 billion in the first quarter, and we expect a similar rate of accumulation in the current quarter. With this lower pace of stockbuilding, businesses appear to have made substantial progress in eliminating the excess inventories that had been built up around the turn of the year. Real federal purchases declined at an annual rate of 4 percent in the first quarter, primarily because of a drop in defense outlays. However, data from the April and May issues of Monthly Treasury Statement have been consistent with our expectation of a sharp rebound in defense purchases this quarter. We expect real nondefense spending to edge up at a pace of 1 percent this quarter. In the state and local sector, expenditures rose at a brisk pace of 4 percent in the first quarter, boosted by sizable gains in construction spending; this quarter they are projected to rise at an annual rate of 3 percent. We estimate that net exports subtracted ¾ percentage point from real GDP growth in the first quarter as oil imports surged and exports flattened out after exceptionally rapid growth late last year. In the second quarter, we look for oil imports to fall back, for non-oil imports to extend their previous weakness, and for exports to resume growing at more typical rates; as a result, the arithmetic contribution of net exports is expected to swing to (positive) 1 percentage point. This contribution is somewhat larger than we had anticipated in the May Greenbook and reflects news from the April trade report. A sharp run-up in gasoline prices boosted headline consumer price inflation in recent months. Part of that run-up stems from the updrift in oil prices so far this year, but more important are higher wholesale margins associated with refinery outages and low inventories of gasoline. In the period ahead, as those outages end and inventories are rebuilt, we expect fuel prices to move lower. By contrast, core PCE inflation was below our expectations in April and, judging from the latest readings on the CPI and the PPI, also in May. Indeed, we now project that the core PCE price index will increase at an annual rate of only 1.4 percent this quarter, down ¾ percentage point from the May Greenbook.1
1 We estimate that the core PCE price index rose at an annual rate of 2.4 percent in the first quarter.
Our current estimate is 0.2 percentage point higher than is currently reported by the BEA, reflecting an expected revision to medical prices in January as indicated by last week’s PPI release. This anticipated revision to the first quarter implies an offsetting adjustment in the second quarter and thus accounts for 0.2 percentage point of the downward revision to our projection of core inflation this quarter.

I-8 Class II FOMC—Restricted (FR) Part 1: Summary and Outlook, June 20, 2007
Although we have taken some signal from the recent data, we think that a large portion of the low core PCE readings will prove transitory. Some of the recent softness in core PCE inflation stems from the nonmarket component of prices, which we think provides little signal of underlying inflation trends. Some other categories of prices that have been soft, including apparel and tobacco products, also tend to be erratic, and the recent low readings in these categories followed relatively large increases in preceding months. The rent components have also decelerated somewhat more rapidly than we had anticipated, but part of that deceleration apparently reflects the effects of a standard adjustment made by the BLS to strip the cost of utilities out of owners’ equivalent rent. Because we expect the downward pressure from this source to be temporary, we think that tenants’ rent is providing the truer reading on housing prices at the moment. The Longer-Run Outlook for the Economy Real GDP is projected to step up from an annual rate of 2 percent in the first half of this year to 2¼ percent in the second half and 2½ percent in 2008. As in past Greenbooks, a diminishing drag from the residential construction sector contributes importantly to the strengthening of GDP growth over the forecast period. Household spending. We project real consumer spending to increase at an average annual rate of 2¼ percent in the second half of this year and to accelerate slightly to a gain of 2½ percent in 2008. This year’s increase is a bit faster than we projected in the May Greenbook, largely because of the upward revision to personal income starting in the fourth quarter of last year; the recent backup in interest rates, which is likely to restrain some consumer purchases going into next year, provides an offset to this upward revision. As in earlier Greenbooks, a diminishing impetus to outlays from wealth holds down the growth of consumer spending going forward, whereas spending is supported by the larger gains in real disposable income that occur as headline consumer price inflation decreases in the period ahead. With this pace of consumption growth, the personal saving rate is projected to move higher over the forecast period—albeit only to zero. Our projection for residential construction is little changed from the May Greenbook. Although we have been surprised by the recent level of housing starts, the incoming data on permits and home sales have been about in line with our expectations. In our

Domestic Developments Class II FOMC—Restricted (FR) I-9
Projections of Real GDP (Percent change at annual rate from end of
preceding period except as noted)
2007 Measure
H1 H2 2008
Real GDP 2.0 2.3 2.5 Previous 1.9 2.0 2.4
Final sales 2.3 1.9 2.6 Previous 2.0 1.8 2.4
PCE 3.0 2.3 2.5 Previous 2.9 2.1 2.5
Residential investment -14.1 -16.7 -1.3 Previous -16.3 -13.6 -1.1
BFI 3.1 4.0 4.6 Previous 2.8 3.5 3.8
Government purchases 2.8 3.2 1.9 Previous 3.1 2.9 1.9
Exports 3.3 6.0 5.7 Previous 3.2 6.2 5.7
Imports 1.4 3.8 3.8 Previous 2.1 3.6 4.2
Contribution to growth (percentage points)
Inventory change -.3 .5 -.1 Previous -.1 .2 -.1
Net exports .1 .1 .0 Previous .0 .1 .0
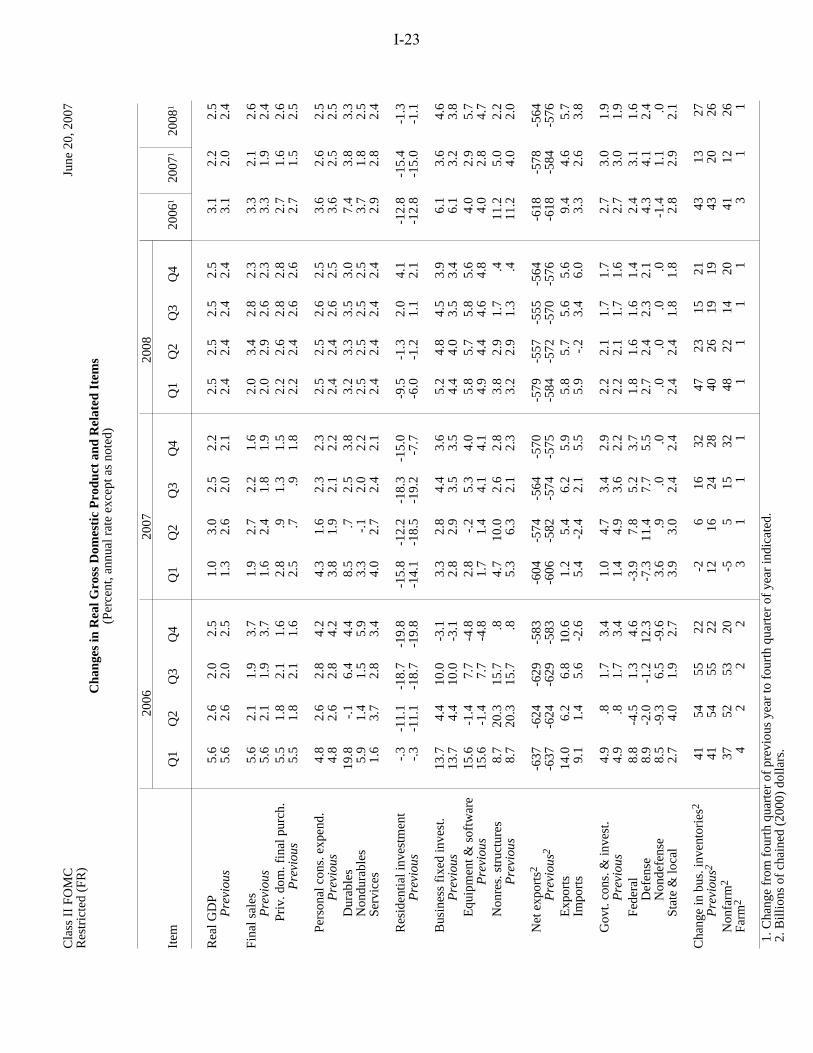
projection, sales stabilize in the second half of this year at a pace only a little below recent levels, and as noted earlier, we look for single-family starts to move down in the second half as well and to average a pace just under 1.05 million units; this combination should make a noticeable dent in the stock of unsold new homes by the end of this year. In 2008, with housing demand expected to firm a bit, single-family starts are projected to edge up to about 1.1 million units. Meanwhile, starts of multifamily units should be maintained at recent levels. In sum, real residential investment is projected to decline about another 17 percent at an annual rate over the second half of 2007 and to be roughly flat in 2008.

I-10 Class II FOMC—Restricted (FR) Part 1: Summary and Outlook, June 20, 2007
Business investment. We expect investment in equipment and software to rise at an annual pace of a little more than 5 percent over the next six quarters. A gradual strengthening of business output growth (though to only a middling rate of change), favorable financial conditions, and improving business attitudes all are expected to contribute to spending gains. With most of the payback in sales of medium and heavy trucks now behind us, we expect truck outlays to bottom out and then start to increase in coming quarters. Growth of spending on high-tech equipment, which has held up reasonably well in recent quarters, is expected to moderate somewhat going forward but to remain fairly solid; this projection is consistent with business surveys of anticipated high-tech spending. Outlays for equipment other than transportation and high-tech are projected to rise at an annual rate of about 2 percent in the second half of this year and in 2008—about in line with their long-run average pace. We expect the growth of real spending in the nonresidential construction sector to ease from the rapid increases seen during the past year and a half. For buildings, those increases probably reflected some catch-up from several years of stagnant activity. As that catch-up wanes, and with a higher cost of capital and slower employment growth, construction spending should decelerate. However, we expect a rebound from the recent weakness in the drilling and mining sector to partially offset the projected deceleration in outlays on buildings. In all, we project nonresidential construction spending to increase 5 percent this year and 2¼ percent in 2008. As discussed above, we believe that businesses in most industries have largely worked off their inventory imbalances. Accordingly, we expect both motor vehicle producers and other manufacturers to step up the pace of stockbuilding a little in the second half of this year. We project that inventory investment in 2008 will be a relatively neutral factor for real GDP growth, with the inventory-sales ratio trending lower. Government spending. Our projection for real government purchases is little changed from the May Greenbook. We expect real defense purchases to rise 4 percent over the four quarters of 2007 and 2½ percent next year, as expenditures for operations in Iraq and Afghanistan are anticipated to rise at a slower pace next year while other real defense outlays move only modestly higher from current levels. Nondefense spending is projected to remain about flat in real terms throughout the projection period. With generally favorable budget conditions in the state and local sector, we expect real spending in this area to rise 3 percent this year and another 2 percent in 2008.
Domestic Developments Class II FOMC—Restricted (FR) I-11
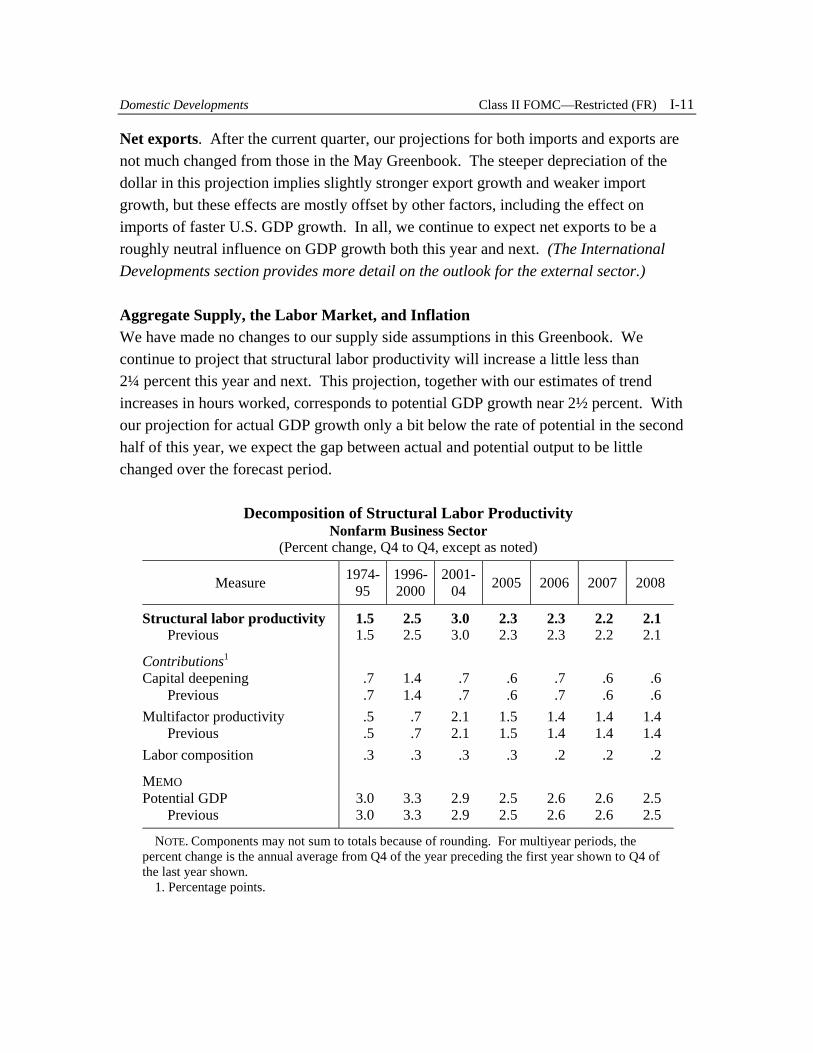
Net exports. After the current quarter, our projections for both imports and exports are not much changed from those in the May Greenbook. The steeper depreciation of the dollar in this projection implies slightly stronger export growth and weaker import growth, but these effects are mostly offset by other factors, including the effect on imports of faster U.S. GDP growth. In all, we continue to expect net exports to be a roughly neutral influence on GDP growth both this year and next. (The International Developments section provides more detail on the outlook for the external sector.) Aggregate Supply, the Labor Market, and Inflation We have made no changes to our supply side assumptions in this Greenbook. We continue to project that structural labor productivity will increase a little less than 2¼ percent this year and next. This projection, together with our estimates of trend increases in hours worked, corresponds to potential GDP growth near 2½ percent. With our projection for actual GDP growth only a bit below the rate of potential in the second half of this year, we expect the gap between actual and potential output to be little changed over the forecast period.
Decomposition of Structural Labor Productivity Nonfarm Business Sector
(Percent change, Q4 to Q4, except as noted)
Measure 1974-95
1996-2000
2001-04 2005 2006 2007 2008
Structural labor productivity 1.5 2.5 3.0 2.3 2.3 2.2 2.1 Previous 1.5 2.5 3.0 2.3 2.3 2.2 2.1
Contributions1 Capital deepening .7 1.4 .7 .6 .7 .6 .6 Previous .7 1.4 .7 .6 .7 .6 .6 Multifactor productivity .5 .7 2.1 1.5 1.4 1.4 1.4 Previous .5 .7 2.1 1.5 1.4 1.4 1.4 Labor composition .3 .3 .3 .3 .2 .2 .2
MEMO Potential GDP 3.0 3.3 2.9 2.5 2.6 2.6 2.5 Previous 3.0 3.3 2.9 2.5 2.6 2.6 2.5
NOTE. Components may not sum to totals because of rounding. For multiyear periods, the percent change is the annual average from Q4 of the year preceding the first year shown to Q4 of the last year shown. 1. Percentage points.

I-12 Class II FOMC—Restricted (FR) Part 1: Summary and Outlook, June 20, 2007
The Outlook for the Labor Market (Percent change, Q4 to Q4, except as noted)
Measure 2005 2006 2007 2008
Output per hour, nonfarm business 2.1 1.6 2.1 2.5 Previous 2.1 1.5 1.9 2.6 Nonfarm private payroll employment 2.0 1.8 1.0 .6 Previous 2.0 1.8 .8 .3 Household survey employment 1.9 2.1 .4 .7 Previous 1.9 2.1 .6 .5 Labor force participation rate1 66.1 66.3 65.9 65.8 Previous 66.1 66.3 66.1 65.8 Civilian unemployment rate1 5.0 4.5 4.7 4.8 Previous 5.0 4.5 4.8 5.0 MEMO GDP gap2 .2 .7 .3 .3 Previous .2 .7 .1 .0
1. Percent, average for the fourth quarter. 2. Actual less potential GDP in the fourth quarter of the year indicated as a percent of potential GDP. A negative number thus indicates that the economy is operating below potential.
Productivity and the labor market. We estimate that labor productivity rose at an annual rate of 1¾ percent in the first half of this year, up from the tepid pace seen in the latter part of 2006. Still, this pace is below our estimate of structural productivity growth, and we expect to see productivity growth pick up to an annual rate of 2½ percent in the second half of 2007 and in 2008 as employers bring payrolls into better alignment with production. Accordingly, private employment gains are projected to average only about 60,000 per month over the rest of the forecast period, about half the pace of hiring seen in the first half of this year. The subpar pace of job gains causes the unemployment rate to edge up to about 4¾ percent by the end of next year; this path averages about 0.1 percentage point below that in our May projection and leaves the unemployment rate a couple of tenths below our estimate of the NAIRU by the end of the forecast period. Prices and labor costs. As discussed above, we believe that much of the recent low readings on core inflation will prove transitory, but we have also taken some signal that inflation is likely to run a bit lower than we had thought; at the same time, energy and import price increases are slightly higher in this projection relative to the May Greenbook, and labor and product markets are slightly tighter. In all, we have revised down our projection for core PCE price inflation 0.3 percentage point this year and

Domestic Developments Class II FOMC—Restricted (FR) I-13
Inflation Projections (Percent change, Q4 to Q4, except as noted)
Measure 2005 2006 2007 2008
PCE chain-weighted price index 3.1 1.9 2.9 2.0 Previous 3.1 1.9 2.9 2.1
Food and beverages 2.1 2.3 3.6 2.2 Previous 2.1 2.3 3.4 2.2
Energy 21.2 -3.7 13.5 1.2 Previous 21.2 -3.7 11.0 .8
Excluding food and energy 2.1 2.2 2.0 2.0 Previous 2.1 2.2 2.3 2.1
Consumer price index 3.7 1.9 3.4 2.2 Previous 3.7 1.9 3.3 2.2
Excluding food and energy 2.1 2.7 2.2 2.2 Previous 2.1 2.7 2.4 2.3
GDP chain-weighted price index 3.1 2.5 2.5 2.2 Previous 3.1 2.5 2.6 2.3
ECI for compensation of private industry workers1 2.9 3.2 3.4 4.0 Previous 2.9 3.2 3.4 4.0
Compensation per hour, nonfarm business sector 3.7 5.6 4.0 4.9 Previous 3.7 4.9 3.9 4.9
Prices of core nonfuel imports 2.2 2.7 3.5 1.6 Previous 2.2 2.7 3.2 1.3
1. December to December. 0.1 percentage point in 2008. In terms of the contour, we expect core PCE inflation to step back up from the recent unusually low readings to an annual rate of 2.2 percent in the second half of this year before moving down to 2 percent next year. Next year’s decline in inflation (relative to the second half of this year) stems from the same factors discussed in previous projections—namely, a waning of the impetus to core inflation from increases in energy and import prices and the continuation of well-anchored inflation expectations. Factoring in this year’s sharp rise in energy prices, together with increases in food prices that are greater than core inflation, our projection for headline PCE inflation is 2.9 percent this year; for 2008, we project that headline inflation will equal core inflation.

I-14 Class II FOMC—Restricted (FR) Part 1: Summary and Outlook, June 20, 2007
The aforementioned upward revisions to labor income imply that nonfarm compensation per hour—a notoriously erratic series—increased more rapidly than initially estimated in the fourth quarter of 2006 and the first quarter of 2007. In the second quarter, incoming data on average hourly earnings point to only a moderate increase in hourly compensation, in line with our previous projection. Looking forward, we continue to expect past productivity gains and price increases to lead to a further pickup in compensation increases, and thus we project nonfarm compensation per hour to accelerate from a gain of 4 percent this year to 5 percent in 2008. Our projection for increases in the ECI is unchanged at 3½ percent this year and 4 percent next year.2 Financial Flows and Conditions The pace of domestic nonfinancial debt growth slowed from 8 percent in 2006 to 7¼ percent in the first quarter of 2007; it is expected to decline further to 6¼ percent over the remainder of 2007 and 5¾ percent in 2008. The projected deceleration in domestic nonfinancial debt holds for all sectors except the federal government. Household debt growth has already slowed considerably and is expected to taper down a bit further over the forecast period. The 5 percent increase in debt anticipated for 2008 would be the slowest pace of household borrowing since 1991. The slowdown to date and the expected further moderation mainly reflect actual and projected declines in the growth of mortgage debt, driven by the deceleration of house prices and rising mortgage interest rates. Consumer credit is also projected to expand more slowly, in line with more-modest growth in spending on consumer durable goods. Weak growth in home prices and higher mortgage interest rates will likely weigh on the credit quality of some households, particularly subprime borrowers with variable-rate mortgages, but the overall credit quality of the household sector is expected to remain solid. Nonfinancial business debt expanded 9½ percent in 2006 and has continued to rise briskly so far this year. We expect the pace of debt growth to slow somewhat in coming quarters and to be 7 percent in 2008. The projected slowdown reflects an anticipated reduction both in cash-financed merger and acquisition activity and in share repurchases from recent extraordinarily high levels. We view corporate defaults as likely to move up through 2008 from their recent near-zero levels, as profits flatten out and leverage rises toward historical norms.
2 Recently enacted legislation calls for the minimum wage to increase from $5.15 an hour currently to $5.85 on July 24, to $6.55 in July 2008, and to $7.25 in July 2009. Because the increase will affect the wages of relatively few workers, the effect on hourly compensation is expected to be less than 0.1 percentage point per year.

Domestic Developments Class II FOMC—Restricted (FR) I-15
Federal government debt, which increased 4 percent in 2006, is expected to rise only a shade more rapidly this year and next, as the federal deficit is projected to remain relatively narrow. Growth of state and local government debt is projected to slow from last year’s pace of 8¼ percent to 7¾ percent this year and 6½ percent in 2008, reflecting reduced opportunities for advance refunding. After having expanded 5 percent in 2006 and 8 percent in the first quarter of 2007, M2 is expected to increase at a pace of 4½ percent for the remainder of 2007 and 5 percent in 2008. The pace for 2008 is a bit faster than the growth rate projected for nominal GDP and is consistent with a gradual decline in opportunity costs over the forecast period. Alternative Simulations In this section, we evaluate alternatives to the staff forecast using simulations of the FRB/US model. The first three scenarios address downside risks to the staff’s forecast for the underlying strength of aggregate demand—specifically, unexpectedly adverse developments in the housing market, in capital spending, and in financial markets. In contrast, the fourth scenario allows for the possibility that we have underestimated the underlying strength of aggregate demand. Moving away from the demand side, the next two scenarios consider opposing risks to the baseline outlook for aggregate supply and inflation; the first addresses the possibility that the NAIRU is lower than the staff’s estimate, and the second explores the implications of rising inflation expectations. In all these scenarios, we assume that monetary policy responds to the change in the outlook as suggested by an estimated version of the Taylor rule. Greater housing correction. The baseline forecast for the housing market could be too optimistic in several ways: The pace of home sales may fall further; builders may cut back on new construction more than we expect in an attempt to reduce the backlog of unsold homes more quickly; and home prices may decline appreciably rather than merely level out as in the baseline. In this scenario, production adjusts more quickly and to a lower level of sales. Thus, the level of real residential investment falls 10 percent below baseline by the middle of 2008. In addition, home prices fall 10 percent both this year and next, lowering household net worth $4½ trillion relative to baseline and eliminating most of the current overvaluation in the housing market that is suggested by some models that we follow. The reductions in employment and income implied by the falloff in construction activity, combined with the loss in wealth, directly damp consumer spending and indirectly depress business investment. As a result, real GDP rises only 2 percent this year and next, causing the unemployment rate to climb above 5 percent by late 2008;

I-16 Class II FOMC—Restricted (FR) Part 1: Summary and Outlook, June 20, 2007
Alternative Scenarios (Percent change, annual rate, from end of preceding period except as noted)
2007 2008 Measure and scenario 2006
H1 H2 H1 H2
Real GDP Greenbook baseline 2.2 2.0 2.3 2.5 2.5 Greater housing correction . . . 2.0 1.9 1.9 2.0 Flat business investment . . . 2.0 1.9 1.8 1.8 Tighter financial markets . . . 2.0 2.0 1.3 1.5 Stronger aggregate demand . . . 2.0 2.8 3.7 3.9 Lower NAIRU . . . 2.0 2.4 2.7 2.7 Drifting inflation expectations . . . 2.0 2.3 2.5 2.6
Unemployment rate1 Greenbook baseline 4.5 4.5 4.7 4.8 4.8 Greater housing correction . . . 4.5 4.8 5.0 5.1 Flat business investment . . . 4.5 4.7 4.9 5.0 Tighter financial markets . . . 4.5 4.7 5.0 5.2 Stronger aggregate demand . . . 4.5 4.6 4.6 4.3 Lower NAIRU . . . 4.5 4.7 4.8 4.7 Drifting inflation expectations . . . 4.5 4.7 4.8 4.8
Core PCE inflation Greenbook baseline 2.0 1.9 2.2 2.1 2.0 Greater housing correction . . . 1.9 2.2 2.1 2.0 Flat business investment . . . 1.9 2.2 2.2 2.1 Tighter financial markets . . . 1.9 2.0 2.0 1.9 Stronger aggregate demand . . . 1.9 2.2 2.1 2.0 Lower NAIRU . . . 1.9 2.0 1.9 1.7 Drifting inflation expectations . . . 1.9 2.2 2.4 2.4
Federal funds rate1 Greenbook baseline 5.2 5.3 5.3 5.3 5.3 Greater housing correction . . . 5.3 5.1 4.8 4.5 Flat business investment . . . 5.3 5.2 4.9 4.7 Tighter financial markets . . . 5.3 5.2 4.5 3.9 Stronger aggregate demand . . . 5.3 5.5 6.0 6.7 Lower NAIRU . . . 5.3 5.3 5.1 4.9 Drifting inflation expectations . . . 5.3 5.3 5.4 5.6
1. Percent, average for the final quarter of the period. . . . Not applicable.

Domestic Developments Class II FOMC—Restricted (FR) I-17
the unemployment rate would rise further in 2009. In response to weaker real activity, the federal funds rate falls to 4½ percent by late next year. Inflation is unchanged from baseline because the additional amount of slack is small over this period and because the easing in monetary policy leads to a lower dollar and somewhat higher import prices. Flat business investment. The recent improvement in business spending indicators could be misleading us about the underlying strength of capital spending. In particular, firms may be more reluctant to invest than we assume, given the continued housing slump and a marked step-down in the projected pace of consumer spending. In this scenario, real outlays for both E&S and nonresidential investment are flat through the end of next year at their levels in the second quarter of this year; in addition, firms are more cautious about expanding their payrolls. With no growth in business spending, real GDP expands at an annual rate of a little less than 2 percent over the remainder of this year and in 2008. The accompanying slower pace of job creation causes the unemployment rate to move up a bit faster than in the baseline. A reduced pace of capital deepening in this scenario restrains the growth of trend labor productivity and so boosts structural unit labor costs; as a result, core inflation is a touch above baseline despite the additional slack in labor and product markets. Using our estimated Taylor rule, the implications of weaker real activity in this scenario outweigh those of the higher inflation, and the federal funds rate falls to 4¾ percent by the end of next year. Tighter financial conditions. Despite the recent back-up in bond yields, term premiums remain unusually low. In this scenario, term premiums on Treasury securities and other bonds climb an additional 100 basis points relative to baseline over the second half of this year and into early 2008, bringing the slope of the yield curve closer to its historical average by the turn of the year. In addition, the weaker economic climate implied by these tighter financial conditions causes an increase in risk spreads on private securities and corporate equity over Treasury yields. These financial market developments—which also include a 15 percent decline in stock prices relative to baseline and a somewhat higher path for the dollar—markedly restrain spending by households and businesses. All told, real GDP expands only 1½ percent next year, causing the unemployment rate to rise to 5¼ percent by late 2008. Monetary policy responds to the weaker real activity by taking the federal funds rate below 4 percent by the end of next year. This easing, in turn, partially offsets the rise in term and risk premiums, so that on net the yield on ten-year Treasury notes is up only 60 basis points relative to baseline over the second half of 2008. Inflation edges down in response to both greater economic slack and the restraint on import prices associated with the higher path of the dollar.
I-18 Class II FOMC—Restricted (FR) Part 1: Summary and Outlook, June 20, 2007
Stronger aggregate demand. Contrary to the implication of the previous three scenarios, we may have overestimated the extent to which real activity will be restrained by slower consumer spending and by moderate growth in business investment. In this scenario, the personal saving rate remains close to negative 1 percent (roughly its average rate over the past year) instead of moving up to zero as in the baseline. In addition, business fixed investment as a share of nominal GDP continues the upward climb seen since the end of the last recession instead of leveling out as in the baseline. As a result, real GDP increases almost 4 percent in 2008, and the unemployment rate edges down to 4¼ percent by late next year. Inflation is nonetheless little changed from the baseline, in part because tighter labor and product markets have only modest price effects in the short run provided that long-run inflation expectations remain well anchored. The response of monetary policy in the scenario helps to ensure that this is the case, as the federal funds rate moves up to 6¾ percent by late next year. Beyond 2008, inflation would move up more noticeably in this scenario. Lower NAIRU. Inflation over the past two years has run somewhat below what many of our forecasting models would have predicted. Although our judgmental projection calls for inflation to remain below these model forecasts, we may have underestimated the extent to which structural changes may be holding down inflation. For example, the NAIRU may be lower than we estimate. In this scenario, we assume that over the past few years the NAIRU has declined to 4¼ percent rather than holding steady at 5 percent as in the baseline. The additional slack in resource utilization allows core PCE inflation to fall to 1¾ percent by the end of next year. In response to both more-favorable inflation developments and the gradual recognition by policymakers that the NAIRU is lower, the federal funds rate moves below 5 percent. Lower interest rates, in turn, provide a mild stimulus to real activity, causing real GDP to expand 2¾ percent in 2008. Drifting inflation expectations. An extended run of elevated readings on headline prices risks causing inflation expectations to drift up. In this scenario, long-run inflation expectations rise ½ percentage point relative to baseline by the end of this year on the misperception that the Fed’s inflation goal has increased by this amount. Over time, this upward drift leads to an increase in actual inflation, and in 2008 core PCE inflation averages nearly 2½ percent. In response, monetary policy—which under the estimated policy rule responds gradually to readings on actual inflation and not to indicators of future inflation—starts to tighten only by the middle of next year. However, nominal bond yields show a more rapid and larger response to the change in inflation expectations and its implications for the stance of monetary policy over the longer run. On net, these financial developments imply little change to real activity relative to baseline.

Domestic Developments Class II FOMC—Restricted (FR) I-19
Selected Greenbook Projections and70 Percent Confidence Intervals Derived from
Historical Forecast Errors and FRB/US Simulations
Measure 2007 2008
Real GDP(percent change, Q4 to Q4)Projection 2.2 2.5Confidence interval
Greenbook forecast errors 1.0–3.3 1.0–4.1FRB/US stochastic simulations 1.4–2.9 1.3–3.9
Civilian unemployment rate(percent, Q4)Projection 4.7 4.8Confidence interval
Greenbook forecast errors 4.4–5.0 4.1–5.6FRB/US stochastic simulations 4.5–4.9 4.4–5.3
PCE pricesexcluding food and energy(percent change, Q4 to Q4)Projection 2.0 2.0Confidence interval
Greenbook forecast errors 1.6–2.5 1.2–2.8FRB/US stochastic simulations 1.8–2.3 1.5–2.6
Federal funds rate(percent, Q4)Projection 5.3 5.3Confidence interval
FRB/US stochastic simulations 4.7–5.9 4.0–6.7
Note. Shocks underlying FRB/US stochastic simulations arerandomly drawn from the 1986-2005 set of model equation residuals.Intervals derived fromGreenbook forecast errors are based on the1986-2005 set of Greenbook historical errors.

Greenbook baseline
Greater housing correction
Flat business investment
Tighter financial conditions
Stronger aggregate demand
Lower NAIRU
Drifting inflation expectations
2005 2006 2007 2008
-1
0
1
2
3
4
5
6
-1
0
1
2
3
4
5
64-quarter percent change
90 percent interval
70 percent interval
Real GDP
2005 2006 2007 2008
1.0
1.5
2.0
2.5
3.0
3.5
1.0
1.5
2.0
2.5
3.0
3.54-quarter percent change
PCE Prices excluding Food and Energy
2005 2006 2007 2008
2
3
4
5
6
7
8
2
3
4
5
6
7
8Percent
Federal Funds Rate
2005 2006 2007 2008
4.0
4.5
5.0
5.5
6.0
4.0
4.5
5.0
5.5
6.0Percent
Unemployment Rate
Class II FOMC - Restricted (FR)
Forecast Confidence Intervals and Alternative Scenarios under
the Assumption that Monetary Policy Follows an Estimated Taylor Rule
Confidence Intervals based on FRB/US Stochastic Simulations
I-20
Class II FOMC - Restricted (FR)
Evolution of the Staff Forecast
1.5
2.0
2.5
3.0
3.5
4.0
1.5
2.0
2.5
3.0
3.5
4.0
Percent, Q4/Q4
1/26 3/16 4/28 6/22 8/4 9/14 10/26 12/7 1/25 3/22 5/3 6/21 8/3 9/13 10/18 12/6 1/24 3/14 5/2 6/20 8/2 9/12 10/24 12/5
2006
2007 2008
Greenbook publication date 2005 2006 2007
Change in Real GDP
4.4
4.6
4.8
5.0
5.2
5.4
5.6
4.4
4.6
4.8
5.0
5.2
5.4
5.6
Percent, fourth quarter
1/26 3/16 4/28 6/22 8/4 9/14 10/26 12/7 1/25 3/22 5/3 6/21 8/3 9/13 10/18 12/6 1/24 3/14 5/2 6/20 8/2 9/12 10/24 12/5
Greenbook publication date 2005 2006 2007
2006 2007
2008
Unemployment Rate
1.0
1.5
2.0
2.5
3.0
1.0
1.5
2.0
2.5
3.0
Percent, Q4/Q4
1/26 3/16 4/28 6/22 8/4 9/14 10/26 12/7 1/25 3/22 5/3 6/21 8/3 9/13 10/18 12/6 1/24 3/14 5/2 6/20 8/2 9/12 10/24 12/5
Greenbook publication date
2005 2006 2007
2006
2007
2008
Change in PCE Prices excluding Food and Energy
I-21

Cla
ss I
I FO
MC
June
20,
200
7R
estr
icte
d (F
R)
Cha
nges
in G
DP
, Pri
ces,
and
Une
mpl
oym
ent
(Per
cent
, ann
ual r
ate
exce
pt a
s no
ted)
Nom
inal
GD
P
R
eal G
DP
PC
E p
rice
inde
x
C
ore
PCE
pri
ce in
dex
Une
mpl
oym
ent r
ate1
Inte
rval
05/0
2/07
06/2
0/07
05/0
2/07
06/2
0/07
05/0
2/07
06/2
0/07
05/0
2/07
06/2
0/07
05/0
2/07
06/2
0/07
Qua
rter
ly20
06:Q
19.
09.
05.
65.
62.
02.
02.
12.
14.
74.
7
Q2
5.9
5.9
2.6
2.6
4.0
4.0
2.7
2.7
4.7
4.7
Q
33.
83.
82.
02.
02.
42.
42.
22.
24.
74.
7
Q4
4.1
4.1
2.5
2.5
-1.0
-1.0
1.8
1.8
4.5
4.5
2007
:Q1
5.2
5.1
1.3
1.0
3.3
3.5
2.2
2.4
4.5
4.5
Q
25.
56.
02.
63.
04.
24.
42.
21.
44.
64.
5
Q3
3.7
3.8
2.0
2.5
2.0
1.8
2.3
2.2
4.7
4.6
Q
44.
24.
12.
12.
22.
21.
92.
32.
24.
84.
7
2008
:Q1
4.7
4.8
2.4
2.5
2.1
2.0
2.2
2.1
4.8
4.7
Q
24.
84.
92.
42.
52.
12.
12.
22.
14.
94.
8
Q3
4.7
4.7
2.4
2.5
2.0
2.0
2.1
2.0
4.9
4.8
Q
44.
54.
62.
42.
52.
02.
02.
12.
05.
04.
8
Tw
o-qu
arte
r2
2006
:Q2
7.5
7.5
4.1
4.1
3.0
3.0
2.4
2.4
-.3
-.3
Q
44.
04.
02.
22.
2.7
.72.
02.
0-.
2-.
2
2007
:Q2
5.3
5.6
1.9
2.0
3.7
3.9
2.2
1.9
.1.0
Q
44.
04.
02.
02.
32.
11.
92.
32.
2.2
.2
2008
:Q2
4.8
4.8
2.4
2.5
2.1
2.0
2.2
2.1
.1.1
Q
44.
64.
72.
42.
52.
02.
02.
12.
0.1
.0
Fou
r-qu
arte
r3
2005
:Q4
6.4
6.4
3.1
3.1
3.1
3.1
2.1
2.1
-.4
-.4
2006
:Q4
5.7
5.7
3.1
3.1
1.9
1.9
2.2
2.2
-.5
-.5
2007
:Q4
4.6
4.8
2.0
2.2
2.9
2.9
2.3
2.0
.3.2
2008
:Q4
4.7
4.8
2.4
2.5
2.1
2.0
2.1
2.0
.2.2
Ann
ual
2005
6.3
6.3
3.2
3.2
2.9
2.9
2.1
2.1
5.1
5.1
2006
6.3
6.3
3.3
3.3
2.7
2.7
2.2
2.2
4.6
4.6
2007
4.7
4.8
2.0
2.1
2.4
2.4
2.2
2.0
4.6
4.6
2008
4.5
4.6
2.3
2.5
2.2
2.1
2.2
2.0
4.9
4.8
1. L
evel
, exc
ept f
or tw
o-qu
arte
r an
d fo
ur-q
uart
er in
terv
als.
2. P
erce
nt c
hang
e fr
om tw
o qu
arte
rs e
arlie
r; f
or u
nem
ploy
men
t rat
e, c
hang
e is
in p
erce
ntag
e po
ints
. 3
. Per
cent
cha
nge
from
fou
r qu
arte
rs e
arlie
r; f
or u
nem
ploy
men
t rat
e, c
hang
e is
in p
erce
ntag
e po
ints
.
I-22
Cla
ss I
I FO
MC
June
20,
200
7R
estr
icte
d (F
R)
Cha
nges
in R
eal G
ross
Dom
esti
c P
rodu
ct a
nd R
elat
ed I
tem
s(P
erce
nt, a
nnua
l rat
e ex
cept
as
note
d)
2
006
20
07
200
8
Item
Q1
Q2
Q3
Q4
Q1
Q2
Q3
Q4
Q1
Q2
Q3
Q4
2006
1 20
071
2008
1
Rea
l GD
P
5.6
2.6
2.0
2.5
1.
03.
02.
52.
2
2.5
2.5
2.5
2.5
3.
12.
22.
5P
revi
ous
5.
62.
62.
02.
5
1.3
2.6
2.0
2.1
2.
42.
42.
42.
4
3.1
2.0
2.4
Fina
l sal
es
5.6
2.1
1.9
3.7
1.
92.
72.
21.
6
2.0
3.4
2.8
2.3
3.
32.
12.
6P
revi
ous
5.
62.
11.
93.
7
1.6
2.4
1.8
1.9
2.
02.
92.
62.
3
3.3
1.9
2.4
Priv
. dom
. fin
al p
urch
.
5.5
1.8
2.1
1.6
2.
8.9
1.3
1.5
2.
22.
62.
82.
8
2.7
1.6
2.6
Pre
viou
s
5.5
1.8
2.1
1.6
2.
5.7
.91.
8
2.2
2.4
2.6
2.6
2.
71.
52.
5
Pers
onal
con
s. e
xpen
d.
4.8
2.6
2.8
4.2
4.
31.
62.
32.
3
2.5
2.5
2.6
2.5
3.
62.
62.
5P
revi
ous
4.
82.
62.
84.
2
3.8
1.9
2.1
2.2
2.
42.
42.
62.
5
3.6
2.5
2.5
Dur
able
s
19.8
-.1
6.4
4.4
8.
5.7
2.5
3.8
3.
23.
33.
53.
0
7.4
3.8
3.3
Non
dura
bles
5.
91.
41.
55.
9
3.3
-.1
2.0
2.2
2.
52.
52.
52.
5
3.7
1.8
2.5
Serv
ices
1.
63.
72.
83.
4
4.0
2.7
2.4
2.1
2.
42.
42.
42.
4
2.9
2.8
2.4
Res
iden
tial i
nves
tmen
t
-.3
-11.
1-1
8.7
-19.
8
-15.
8-1
2.2
-18.
3-1
5.0
-9
.5-1
.32.
04.
1
-12.
8-1
5.4
-1.3
Pre
viou
s
-.3
-11.
1-1
8.7
-19.
8
-14.
1-1
8.5
-19.
2-7
.7
-6.0
-1.2
1.1
2.1
-1
2.8
-15.
0-1
.1
Bus
ines
s fi
xed
inve
st.
13
.74.
410
.0-3
.1
3.3
2.8
4.4
3.6
5.
24.
84.
53.
9
6.1
3.6
4.6
Pre
viou
s
13.7
4.4
10.0
-3.1
2.
82.
93.
53.
5
4.4
4.0
3.5
3.4
6.
13.
23.
8E
quip
men
t & s
oftw
are
15
.6-1
.47.
7-4
.8
2.8
-.2
5.3
4.0
5.
85.
75.
85.
6
4.0
2.9
5.7
Pre
viou
s
15.6
-1.4
7.7
-4.8
1.
71.
44.
14.
1
4.9
4.4
4.6
4.8
4.
02.
84.
7N
onre
s. s
truc
ture
s
8.7
20.3
15.7
.8
4.7
10.0
2.6
2.8
3.
82.
91.
7.4
11
.25.
02.
2P
revi
ous
8.
720
.315
.7.8
5.
36.
32.
12.
3
3.2
2.9
1.3
.4
11.2
4.0
2.0
Net
exp
orts
2
-637
-624
-629
-583
-6
04-5
74-5
64-5
70
-579
-557
-555
-564
-6
18-5
78-5
64P
revi
ous2
-6
37-6
24-6
29-5
83
-606
-582
-574
-575
-5
84-5
72-5
70-5
76
-618
-584
-576
Exp
orts
14
.06.
26.
810
.6
1.2
5.4
6.2
5.9
5.
85.
75.
65.
6
9.4
4.6
5.7
Impo
rts
9.
11.
45.
6-2
.6
5.4
-2.4
2.1
5.5
5.
9-.
23.
46.
0
3.3
2.6
3.8
Gov
t. co
ns. &
inve
st.
4.
9.8
1.7
3.4
1.
04.
73.
42.
9
2.2
2.1
1.7
1.7
2.
73.
01.
9P
revi
ous
4.
9.8
1.7
3.4
1.
44.
93.
62.
2
2.2
2.1
1.7
1.6
2.
73.
01.
9Fe
dera
l
8.8
-4.5
1.3
4.6
-3
.97.
85.
23.
7
1.8
1.6
1.6
1.4
2.
43.
11.
6D
efen
se
8.9
-2.0
-1.2
12.3
-7
.311
.47.
75.
5
2.7
2.4
2.3
2.1
4.
34.
12.
4N
onde
fens
e
8.5
-9.3
6.5
-9.6
3.
6.9
.0.0
.0
.0.0
.0
-1.4
1.1
.0St
ate
& lo
cal
2.
74.
01.
92.
7
3.9
3.0
2.4
2.4
2.
42.
41.
81.
8
2.8
2.9
2.1
Cha
nge
in b
us. i
nven
tori
es2
41
5455
22
-26
1632
47
2315
21
4313
27P
revi
ous2
41
5455
22
1216
2428
40
2619
19
4320
26N
onfa
rm2
37
5253
20
-55
1532
48
2214
20
4112
26Fa
rm2
4
22
2
31
11
1
11
1
31
1
1. C
hang
e fr
om f
ourt
h qu
arte
r of
pre
viou
s ye
ar to
fou
rth
quar
ter
of y
ear
indi
cate
d. 2
. Bill
ions
of
chai
ned
(200
0) d
olla
rs.
I-23

Cla
ss I
I FO
MC
June
20,
200
7R
estr
icte
d (F
R)
Cha
nges
in R
eal G
ross
Dom
esti
c P
rodu
ct a
nd R
elat
ed I
tem
s(P
erce
nt, a
nnua
l rat
e ex
cept
as
note
d)
Item
2000
1
20
011
2002
1
20
031
2004
1
20
051
2006
1
20
071
2008
1
Rea
l GD
P
2.2
.21.
93.
73.
43.
13.
12.
22.
5P
revi
ous
2.
2.2
1.9
3.7
3.4
3.1
3.1
2.0
2.4
Fina
l sal
es
2.9
1.5
.83.
73.
13.
23.
32.
12.
6P
revi
ous
2.
91.
5.8
3.7
3.1
3.2
3.3
1.9
2.4
Priv
. dom
. fin
al p
urch
.
4.3
1.0
1.1
4.1
4.4
3.6
2.7
1.6
2.6
Pre
viou
s
4.3
1.0
1.1
4.1
4.4
3.6
2.7
1.5
2.5
Pers
onal
con
s. e
xpen
d.
4.1
2.8
1.9
3.4
4.0
2.9
3.6
2.6
2.5
Pre
viou
s
4.1
2.8
1.9
3.4
4.0
2.9
3.6
2.5
2.5
Dur
able
s
4.7
10.8
1.2
8.3
5.6
2.5
7.4
3.8
3.3
Non
dura
bles
3.
01.
92.
13.
93.
84.
43.
71.
82.
5Se
rvic
es
4.5
1.6
1.9
2.2
3.7
2.3
2.9
2.8
2.4
Res
iden
tial i
nves
tmen
t
-1.9
1.4
7.0
11.7
6.1
9.0
-12.
8-1
5.4
-1.3
Pre
viou
s
-1.9
1.4
7.0
11.7
6.1
9.0
-12.
8-1
5.0
-1.1
Bus
ines
s fi
xed
inve
st.
7.
8-9
.6-6
.54.
96.
95.
66.
13.
64.
6P
revi
ous
7.
8-9
.6-6
.54.
96.
95.
66.
13.
23.
8E
quip
men
t & s
oftw
are
7.
5-9
.0-3
.46.
68.
37.
04.
02.
95.
7P
revi
ous
7.
5-9
.0-3
.46.
68.
37.
04.
02.
84.
7N
onre
s. s
truc
ture
s
8.8
-11.
1-1
4.9
.22.
71.
811
.25.
02.
2P
revi
ous
8.
8-1
1.1
-14.
9.2
2.7
1.8
11.2
4.0
2.0
Net
exp
orts
2
-379
-399
-471
-519
-591
-619
-618
-578
-564
Pre
viou
s2
-379
-399
-471
-519
-591
-619
-618
-584
-576
Exp
orts
6.
5-1
1.9
3.8
5.8
7.0
6.7
9.4
4.6
5.7
Impo
rts
11
.2-7
.69.
74.
810
.65.
23.
32.
63.
8
Gov
t. co
ns. &
inve
st.
.4
5.0
4.0
1.7
1.1
1.2
2.7
3.0
1.9
Pre
viou
s
.45.
04.
01.
71.
11.
22.
73.
01.
9Fe
dera
l
-2.2
6.4
7.8
5.5
2.3
2.1
2.4
3.1
1.6
Def
ense
-3
.56.
58.
47.
52.
51.
94.
34.
12.
4N
onde
fens
e
.36.
36.
81.
91.
82.
4-1
.41.
1.0
Stat
e &
loca
l
1.7
4.2
2.1
-.4
.4.8
2.8
2.9
2.1
Cha
nge
in b
us. i
nven
tori
es2
56
-32
1214
5320
4313
27P
revi
ous2
56
-32
1214
5320
4320
26N
onfa
rm2
58
-32
1514
4720
4112
26Fa
rm2
-1
0-2
06
03
11
1. C
hang
e fr
om f
ourt
h qu
arte
r of
pre
viou
s ye
ar to
fou
rth
quar
ter
of y
ear
indi
cate
d. 2
. Bill
ions
of
chai
ned
(200
0) d
olla
rs.
I-24

Cla
ss I
I FO
MC
June
20,
200
7R
estr
icte
d (F
R)
Con
trib
utio
ns t
o C
hang
es in
Rea
l Gro
ss D
omes
tic
Pro
duct
(Per
cent
age
poin
ts, a
nnua
l rat
e ex
cept
as
note
d)
2
006
200
7
20
08
Item
Q1
Q2
Q3
Q4
Q1
Q2
Q3
Q4
Q1
Q2
Q3
Q4
2006
1 20
071
2008
1
Rea
l GD
P
5.6
2.6
2.0
2.5
1.
03.
02.
52.
2
2.5
2.5
2.5
2.5
3.
12.
22.
5P
revi
ous
5.
62.
62.
02.
5
1.3
2.6
2.0
2.1
2.
42.
42.
42.
4
3.1
2.0
2.4
Fina
l sal
es
5.6
2.1
1.9
3.6
1.
92.
72.
21.
6
2.0
3.4
2.8
2.3
3.
32.
12.
6P
revi
ous
5.
62.
11.
93.
6
1.6
2.4
1.8
1.9
2.
02.
82.
62.
3
3.3
1.9
2.4
Priv
. dom
. fin
al p
urch
.
4.7
1.5
1.8
1.4
2.
4.8
1.2
1.3
1.
92.
22.
42.
4
2.3
1.4
2.2
Pre
viou
s
4.7
1.5
1.8
1.4
2.
2.6
.81.
5
1.9
2.1
2.2
2.2
2.
31.
32.
1
Pers
onal
con
s. e
xpen
d.
3.4
1.8
2.0
2.9
3.
01.
21.
61.
6
1.8
1.8
1.8
1.8
2.
51.
91.
8P
revi
ous
3.
41.
82.
02.
9
2.7
1.3
1.4
1.5
1.
71.
71.
81.
8
2.5
1.7
1.7
Dur
able
s
1.5
.0.5
.4
.7.1
.2.3
.3
.3.3
.2
.6.3
.3N
ondu
rabl
es
1.2
.3.3
1.2
.7
.0.4
.4
.5.5
.5.5
.7
.4.5
Serv
ices
.7
1.5
1.1
1.4
1.
61.
11.
0.9
1.
01.
01.
01.
0
1.2
1.2
1.0
Res
iden
tial i
nves
tmen
t
.0-.
7-1
.2-1
.2
-.9
-.6
-1.0
-.7
-.
4-.
1.1
.2
-.8
-.8
-.1
Pre
viou
s
.0-.
7-1
.2-1
.2
-.8
-1.0
-1.0
-.4
-.
3-.
1.0
.1
-.8
-.8
.0
Bus
ines
s fi
xed
inve
st.
1.
4.5
1.0
-.3
.3
.3.5
.4
.5.5
.5.4
.6
.4.5
Pre
viou
s
1.4
.51.
0-.
3
.3.3
.4.4
.5
.4.4
.4
.6.3
.4E
quip
men
t & s
oftw
are
1.
1-.
1.6
-.4
.2
.0.4
.3
.4.4
.4.4
.3
.2.4
Pre
viou
s
1.1
-.1
.6-.
4
.1.1
.3.3
.4
.3.3
.3
.3.2
.3N
onre
s. s
truc
ture
s
.3.6
.5.0
.1
.3.1
.1
.1.1
.1.0
.3
.2.1
Pre
viou
s
.3.6
.5.0
.2
.2.1
.1
.1.1
.0.0
.3
.1.1
Net
exp
orts
.0
.4-.
21.
6
-.7
1.0
.3-.
2
-.3
.7.1
-.4
.5
.1.0
Pre
viou
s
.0.4
-.2
1.6
-.
8.8
.3-.
1
-.3
.4.0
-.2
.5
.1.0
Exp
orts
1.
4.7
.71.
1
.1.6
.7.7
.7
.7.7
.7
1.0
.5.7
Impo
rts
-1
.5-.
2-.
9.5
-.
9.4
-.3
-.9
-1
.0.0
-.6
-1.0
-.
5-.
4-.
6
Gov
t. co
ns. &
inve
st.
.9
.2.3
.6
.2.9
.7.6
.4
.4.3
.3
.5.6
.4P
revi
ous
.9
.2.3
.6
.3.9
.7.4
.4
.4.3
.3
.5.6
.4Fe
dera
l
.6-.
3.1
.3
-.3
.5.4
.3
.1.1
.1.1
.2
.2.1
Def
ense
.4
-.1
-.1
.6
-.4
.5.4
.3
.1.1
.1.1
.2
.2.1
Non
defe
nse
.2
-.2
.2-.
2
.1.0
.0.0
.0
.0.0
.0
.0.0
.0St
ate
& lo
cal
.3
.5.2
.3
.5.4
.3.3
.3
.3.2
.2
.3.4
.3
Cha
nge
in b
us. i
nven
tori
es
.0.4
.1-1
.2
-.9
.3.3
.6
.5-.
8-.
3.2
-.
2.1
-.1
Pre
viou
s
.0.4
.1-1
.2
-.4
.2.3
.1
.4-.
5-.
2.0
-.
2.1
-.1
Non
farm
.0
.5.1
-1.2
-.
9.3
.3.6
.5
-.8
-.3
.2
-.2
.1-.
1Fa
rm
.0-.
1.0
.0
.0.0
.0.0
.0
.0.0
.0
.0.0
.0
1. C
hang
e fr
om f
ourt
h qu
arte
r of
pre
viou
s ye
ar to
fou
rth
quar
ter
of y
ear
indi
cate
d.
I-25

Cla
ss I
I FO
MC
June
20,
200
7R
estr
icte
d (F
R)
Cha
nges
in P
rice
s an
d C
osts
(Per
cent
, ann
ual r
ate
exce
pt a
s no
ted)
2006
200
7
20
08
Item
Q1
Q2
Q3
Q4
Q1
Q2
Q3
Q4
Q1
Q2
Q3
Q4
2006
1 20
071
2008
1
GD
P ch
ain-
wt.
pric
e in
dex
3.3
3.3
1.9
1.7
4.1
2.9
1.3
1.9
2.2
2.3
2.2
2.1
2.5
2.5
2.2
Pre
viou
s3.
33.
31.
91.
73.
92.
81.
72.
12.
32.
32.
32.
12.
52.
62.
3PC
E c
hain
-wt.
pric
e in
dex
2.0
4.0
2.4
-1.0
3.5
4.4
1.8
1.9
2.0
2.1
2.0
2.0
1.9
2.9
2.0
Pre
viou
s2.
04.
02.
4-1
.03.
34.
22.
02.
22.
12.
12.
02.
01.
92.
92.
1E
nerg
y.1
29.7
3.7
-36.
016
.152
.9-3
.9-2
.81.
01.
51.
3.9
-3.7
13.5
1.2
Pre
viou
s.1
29.7
3.7
-36.
016
.135
.7-3
.7.2
1.0
1.0
.7.4
-3.7
11.0
.8Fo
od2.
71.
72.
91.
94.
84.
52.
72.
42.
32.
32.
22.
22.
33.
62.
2P
revi
ous
2.7
1.7
2.9
1.9
4.8
3.8
2.6
2.4
2.3
2.2
2.1
2.1
2.3
3.4
2.2
Ex.
foo
d &
ene
rgy
2.1
2.7
2.2
1.8
2.4
1.4
2.2
2.2
2.1
2.1
2.0
2.0
2.2
2.0
2.0
Pre
viou
s2.
12.
72.
21.
82.
22.
22.
32.
32.
22.
22.
12.
12.
22.
32.
1C
PI1.
85.
13.
0-2
.03.
86.
01.
91.
92.
22.
22.
12.
11.
93.
42.
2P
revi
ous
1.8
5.1
3.0
-2.0
3.8
5.1
1.9
2.3
2.3
2.3
2.2
2.0
1.9
3.3
2.2
Ex.
foo
d &
ene
rgy
2.4
3.2
3.2
1.8
2.3
1.9
2.4
2.4
2.3
2.3
2.2
2.2
2.7
2.2
2.2
Pre
viou
s2.
43.
23.
21.
82.
32.
42.
52.
52.
42.
42.
32.
22.
72.
42.
3
EC
I, h
ourl
y co
mpe
nsat
ion2
2.8
3.2
3.6
3.2
2.3
3.8
3.8
3.8
4.0
4.0
4.0
4.0
3.2
3.4
4.0
Pre
viou
s22.
83.
23.
63.
22.
33.
83.
83.
84.
04.
04.
04.
03.
23.
44.
0N
onfa
rm b
usin
ess
sect
orO
utpu
t per
hou
r3.
51.
2-.
52.
11.
42.
02.
82.
22.
62.
52.
42.
41.
62.
12.
5P
revi
ous
3.5
1.2
-.5
1.9
1.5
1.4
2.3
2.4
2.6
2.6
2.6
2.6
1.5
1.9
2.6
Com
pens
atio
n pe
r ho
ur12
.9-1
.4.6
11.2
2.7
3.9
4.7
4.9
4.9
4.8
4.9
4.8
5.6
4.0
4.9
Pre
viou
s12
.9-1
.4.6
8.2
1.7
4.0
4.8
4.9
4.9
4.8
4.9
4.8
4.9
3.9
4.9
Uni
t lab
or c
osts
9.1
-2.5
1.1
8.9
1.3
1.8
1.9
2.6
2.2
2.3
2.4
2.3
4.0
1.9
2.3
Pre
viou
s9.
1-2
.51.
16.
2.2
2.6
2.5
2.5
2.2
2.2
2.2
2.2
3.3
1.9
2.2
1. C
hang
e fr
om f
ourt
h qu
arte
r of
pre
viou
s ye
ar to
fou
rth
quar
ter
of y
ear
indi
cate
d. 2
. Pri
vate
-ind
ustr
y w
orke
rs.
I-26

Cla
ss I
I FO
MC
June
20,
200
7R
estr
icte
d (F
R)
Oth
er M
acro
econ
omic
Ind
icat
ors
20
06
200
7
200
8
Item
Q1
Q2
Q3
Q4
Q1
Q2
Q3
Q4
Q1
Q2
Q3
Q4
2006
1 20
071
2008
1
Em
ploy
men
t and
pro
duct
ion
Non
farm
pay
roll
empl
oym
ent2
.7.5
.5.5
.5.4
.3.2
.2.2
.3.3
2.3
1.4
1.0
Une
mpl
oym
ent r
ate3
4.7
4.7
4.7
4.5
4.5
4.5
4.6
4.7
4.7
4.8
4.8
4.8
4.5
4.7
4.8
Pre
viou
s34.
74.
74.
74.
54.
54.
64.
74.
84.
84.
94.
95.
04.
54.
85.
0G
DP
gap4
.9.9
.7.7
.3.4
.4.3
.3.3
.3.3
.7.3
.3P
revi
ous4
.9.9
.7.7
.4.4
.3.1
.1.1
.1.0
.7.1
.0
Indu
stri
al p
rodu
ctio
n55.
06.
54.
0-1
.5.8
2.8
3.2
2.4
2.8
2.4
2.9
4.1
3.5
2.3
3.1
Pre
viou
s55.
06.
54.
0-1
.51.
44.
02.
63.
13.
23.
03.
63.
93.
52.
83.
4M
anuf
actu
ring
indu
str.
pro
d.5
5.5
5.5
4.4
-1.7
.73.
33.
62.
12.
52.
73.
13.
93.
42.
43.
1P
revi
ous5
5.5
5.5
4.4
-1.7
1.2
4.8
2.5
2.9
3.3
3.4
3.6
3.9
3.4
2.8
3.5
Cap
acity
util
izat
ion
rate
- m
fg.3
80.1
80.6
80.9
80.1
79.8
80.1
80.4
80.4
80.3
80.3
80.4
80.6
80.1
80.4
80.6
Pre
viou
s380
.180
.680
.980
.179
.980
.380
.480
.480
.580
.680
.780
.980
.180
.480
.9
Hou
sing
sta
rts6
2.1
1.9
1.7
1.6
1.5
1.5
1.4
1.3
1.4
1.4
1.4
1.4
1.8
1.4
1.4
Lig
ht m
otor
veh
icle
sal
es6
16.9
16.3
16.6
16.3
16.5
16.1
16.3
16.3
16.3
16.4
16.5
16.5
16.5
16.3
16.4
Inco
me
and
savi
ngN
omin
al G
DP5
9.0
5.9
3.8
4.1
5.1
6.0
3.8
4.1
4.8
4.9
4.7
4.6
5.7
4.8
4.8
Rea
l dis
posa
ble
pers
. inc
ome5
4.6
-1.5
3.2
6.4
4.6
-1.1
3.3
3.3
4.6
2.8
3.5
3.3
3.2
2.5
3.5
Pre
viou
s54.
6-1
.53.
25.
34.
5-1
.53.
83.
24.
23.
13.
63.
42.
92.
43.
6Pe
rson
al s
avin
g ra
te3
-.3
-1.4
-1.4
-.9
-.8
-1.6
-1.4
-1.1
-.6
-.6
-.3
-.1
-.9
-1.1
-.1
Pre
viou
s3-.
3-1
.4-1
.4-1
.2-1
.1-1
.9-1
.5-1
.2-.
8-.
6-.
4-.
2-1
.2-1
.2-.
2
Cor
pora
te p
rofi
ts7
60.8
5.9
16.4
-1.2
8.9
6.0
.41.
5.5
1.5
.3.1
18.3
4.2
.6Pr
ofit
shar
e of
GN
P312
.012
.012
.412
.212
.312
.312
.212
.212
.112
.011
.911
.712
.212
.211
.7
Net
fed
eral
sav
ing8
-147
-163
-173
-121
-134
-179
-184
-184
-225
-216
-214
-224
-154
-170
-220
Net
sta
te &
loca
l sav
ing8
1326
-10
-18
-38
-8-1
7-2
1-3
3-2
0-2
9-3
03
-21
-28
Gro
ss n
atio
nal s
avin
g ra
te3
14.4
13.5
13.3
14.2
13.3
12.9
12.9
13.0
12.8
12.9
12.9
12.9
14.2
13.0
12.9
Net
nat
iona
l sav
ing
rate
32.
91.
91.
72.
32.
31.
61.
51.
61.
51.
61.
61.
62.
31.
61.
6
1. C
hang
e fr
om f
ourt
h qu
arte
r of
pre
viou
s ye
ar to
fou
rth
quar
ter
of y
ear
indi
cate
d, u
nles
s ot
herw
ise
indi
cate
d. 2
. Cha
nge,
mill
ions
. 3
. Per
cent
, ann
ual v
alue
s ar
e fo
r th
e fo
urth
qua
rter
of
the
year
indi
cate
d. 4
. Per
cent
dif
fere
nce
betw
een
actu
al a
nd p
oten
tial G
DP;
a n
egat
ive
num
ber
indi
cate
s th
at th
e ec
onom
y is
ope
ratin
g be
low
pot
entia
l. (
In p
revi
ous
Gre
enbo
oks,
we
expr
esse
d th
e G
DP
gap
with
the
oppo
site
sig
n, s
o th
at a
pos
itive
num
ber
indi
cate
d th
at a
ctua
l out
put f
ell s
hort
of
pote
ntia
l.)
A
nnua
l val
ues
are
for
the
four
th q
uart
er o
f th
e ye
ar in
dica
ted.
5. P
erce
nt c
hang
e, a
nnua
l rat
e. 6
. Lev
el, m
illio
ns, a
nnua
l val
ues
are
annu
al a
vera
ges.
7. P
erce
nt c
hang
e, a
nnua
l rat
e, w
ith in
vent
ory
valu
atio
n an
d ca
pita
l con
sum
ptio
n ad
just
men
ts.
8. B
illio
ns o
f do
llars
, ann
ual v
alue
s ar
e an
nual
ave
rage
s.
I-27

Cla
ss I
I F
OM
CJu
ne 2
0, 2
007
Res
tric
ted
(FR
)St
aff
Pro
ject
ions
of
Fed
eral
Sec
tor
Acc
ount
s an
d R
elat
ed I
tem
s(B
illio
ns o
f do
llars
exc
ept a
s no
ted)
Fisc
al y
ear
2006
2007
2008
Item
2005
a20
06a
2007
2008
Q1a
Q2a
Q3a
Q4a
Q1a
Q2
Q3
Q4
Q1
Q2
Q3
Q4
Uni
fied
bud
get
Not
sea
sona
lly a
djus
ted
Rec
eipt
s121
5424
0725
6726
77
507
772
597
574
547
823
623
611
557
852
657
644
Out
lays
124
7226
5527
3729
06
691
676
639
654
725
692
666
714
765
717
709
747
Surp
lus/
defi
cit1
-318
-248
-170
-229
-1
8496
-42
-80
-178
130
-42
-103
-208
135
-52
-103
P
revi
ous
-3
18-2
48-1
71-2
38
-184
96-4
2-8
0-1
7813
6-4
9-1
14-1
8412
1-6
1-1
27
On-
budg
et
-494
-435
-360
-427
-2
1611
-60
-135
-212
44-5
6-1
71-2
3343
-66
-177
O
ff-b
udge
t
17
518
619
019
8
3285
1955
3487
1468
2492
1473
Mea
ns o
f fi
nanc
ing
B
orro
win
g
297
237
191
235
15
6-7
543
5915
2-9
172
9019
4-1
0556
98
Cas
h de
crea
se
1
-16
710
28
-38
-621
25-2
4-1
616
19-2
50
10
Oth
er2
2128
-28
-17
-1
165
01
-15
-14
-3-5
-5-5
-5
Cas
h op
erat
ing
bala
nce,
end
of
peri
od
36
5245
35
846
5231
630
4529
1035
3525
NIP
A f
eder
al s
ecto
r
Se
ason
ally
adj
uste
d an
nual
rat
es
Rec
eipt
s
21
7424
8026
5527
70
2491
2523
2557
2592
2662
2673
2695
2723
2754
2786
2817
2847
Exp
endi
ture
s
2509
2667
2810
2980
26
3826
8627
3027
1327
9628
5128
7929
0729
7930
0230
3130
70
Con
sum
ptio
n ex
pend
iture
s
758
797
836
890
80
480
280
981
782
584
585
987
088
989
790
491
2
D
efen
se
50
953
356
560
8
538
538
539
553
553
572
584
593
607
613
619
625
Non
defe
nse
24
926
427
128
2
266
265
270
264
273
273
275
277
282
284
286
287
O
ther
spe
ndin
g
1751
1870
1973
2090
18
3418
8419
2118
9619
7120
0620
2020
3720
9021
0521
2621
58C
urre
nt a
ccou
nt s
urpl
us
-3
35-1
87-1
54-2
10
-147
-163
-173
-121
-134
-179
-184
-184
-225
-216
-214
-224
Gro
ss in
vest
men
t
107
117
122
131
11
811
711
812
111
812
412
712
913
013
113
313
4G
ross
sav
ing
less
gro
ss
i
nves
tmen
t3-3
44-2
01-1
69-2
28
-163
-177
-186
-135
-145
-194
-201
-202
-243
-234
-232
-241
Fis
cal i
ndic
ator
s4H
igh-
empl
oym
ent (
HE
B)
sur
plus
/def
icit
-3
41-2
30-1
97-2
45
-197
-215
-219
-171
-169
-221
-226
-222
-260
-251
-247
-255
Cha
nge
in H
EB
, per
cent
of
pote
ntia
l GD
P
-0
.3-1
.0-0
.30.
3
-0.7
0.1
0.0
-0.4
-0.0
0.4
0.0
-0.0
0.3
-0.1
-0.0
0.0
Fisc
al im
petu
s (F
I),
per
cent
of
GD
P
0.
20.
30.
20.
2
0.2
-0.0
0.0
0.1
0.0
0.1
0.1
0.1
0.0
0.0
0.0
0.0
P
revi
ous
0.
20.
30.
20.
2
0.2
-0.0
0.0
0.1
0.0
0.1
0.1
0.0
0.0
0.0
0.0
0.0
1
. Bud
get r
ecei
pts,
out
lays
, and
sur
plus
/def
icit
incl
ude
corr
espo
ndin
g so
cial
sec
urity
(O
ASD
I) c
ateg
orie
s. T
he O
ASD
I su
rplu
s an
d th
e Po
stal
Ser
vice
sur
plus
are
exc
lude
d fr
om th
e on
-bud
get
s
urpl
us a
nd s
how
n se
para
tely
as
off-
budg
et, a
s cl
assi
fied
und
er c
urre
nt la
w.
2
. Oth
er m
eans
of
fina
ncin
g ar
e ch
ecks
issu
ed le
ss c
heck
s pa
id, a
ccru
ed it
ems,
and
cha
nges
in o
ther
fin
anci
al a
sset
s an
d lia
bilit
ies.
3
. Gro
ss s
avin
g is
the
curr
ent a
ccou
nt s
urpl
us p
lus
cons
umpt
ion
of f
ixed
cap
ital o
f th
e ge
nera
l gov
ernm
ent a
s w
ell a
s go
vern
men
t ent
erpr
ises
.
4. H
EB
is g
ross
sav
ing
less
gro
ss in
vest
men
t (N
IPA
) of
the
fede
ral g
over
nmen
t in
curr
ent d
olla
rs, w
ith c
yclic
ally
sen
sitiv
e re
ceip
ts a
nd o
utla
ys a
djus
ted
to th
e st
aff’
s m
easu
re o
f po
tent
ial o
utpu
t and
the
NA
IRU
. Qua
rter
ly f
igur
es f
or c
hang
e in
HE
B a
nd F
I ar
e no
t at a
nnua
l rat
es.
The
sig
n on
Cha
nge
in H
EB
, as
a pe
rcen
t of
nom
inal
pot
entia
l GD
P, is
rev
erse
d. F
I is
the
wei
ghte
d di
ffer
ence
of
disc
retio
nary
chan
ges
in f
eder
al s
pend
ing
and
taxe
s in
cha
ined
(20
00)
dolla
rs, s
cale
d by
rea
l GD
P. T
he a
nnua
l FI
estim
ates
are
on
a ca
lend
ar y
ear
basi
s. A
lso,
for
FI
and
the
chan
ge in
HE
B, p
ositi
ve v
alue
s in
dica
teag
greg
ate
dem
and
stim
ulus
.
a--
Act
ual
I-28

Cla
ss I
I F
OM
CC
hang
e in
Deb
t of
the
Dom
esti
c N
onfi
nanc
ial S
ecto
rsJu
ne 2
0, 2
007
Res
tric
ted
(FR
)(P
erce
nt)
Hou
seho
lds
Mem
o:H
ome
Con
sum
erSt
ate
and
loca
lFe
dera
lN
omin
alPe
riod
1T
otal
Tot
alm
ortg
ages
cred
itB
usin
ess
gove
rnm
ents
gove
rnm
ent
GD
P
Yea
r20
016.
39.
310
.18.
65.
98.
8-.
22.
720
027.
210
.612
.95.
92.
511
.07.
63.
620
038.
211
.614
.45.
22.
68.
310
.95.
920
049.
011
.614
.25.
55.
87.
49.
06.
7
2005
9.4
11.5
13.4
4.2
7.6
10.2
7.0
6.4
2006
8.1
8.7
9.3
4.5
9.6
8.2
3.9
5.7
2007
6.7
5.8
6.0
4.1
8.9
7.7
4.6
4.8
2008
5.7
4.9
5.2
2.9
7.0
6.6
4.8
4.8
Qua
rter
2006
:18.
99.
310
.62.
210
.03.
38.
09.
02
7.5
9.2
9.5
6.0
8.8
6.7
1.0
5.9
36.
97.
98.
65.
47.
08.
23.
63.
84
8.2
7.2
7.3
4.1
11.4
13.6
2.8
4.1
2007
:17.
36.
06.
24.
79.
08.
66.
75.
12
6.5
5.9
6.0
4.2
10.3
8.3
.16.
03
6.5
5.6
5.8
3.7
8.0
6.4
6.0
3.8
45.
95.
25.
43.
46.
96.
95.
14.
120
08:1
6.0
5.0
5.2
3.1
6.8
6.6
7.3
4.8
25.
14.
85.
13.
07.
16.
41.
34.
93
5.5
4.8
5.1
2.8
6.8
6.3
4.5
4.7
45.
64.
85.
12.
86.
76.
25.
64.
6
N
ote.
Qua
rter
ly d
ata
are
at s
easo
nally
adj
uste
d an
nual
rat
es.
1.
Dat
a af
ter
2007
:Q1
are
staf
f pr
ojec
tions
. Cha
nges
are
mea
sure
d fr
om e
nd o
f th
e pr
eced
ing
peri
od to
end
of
peri
od in
dica
ted
exce
pt f
or a
nnua
l nom
inal
GD
P gr
owth
, whi
ch is
cal
cula
ted
from
Q4
to Q
4.
2.6.
3 F
OF
I-29

Cla
ss I
I F
OM
CF
low
of
Fun
ds P
roje
ctio
ns:
Hig
hlig
hts
June
20,
200
7 R
estr
icte
d (F
R)
(Bill
ions
of
dolla
rs a
t sea
sona
lly a
djus
ted
annu
al r
ates
exc
ept a
s no
ted)
2006
2007
2008
Cat
egor
y20
0520
0620
0720
08Q
3 Q
4 Q
1 Q
2 Q
3 Q
4 Q
1 Q
2 Q
3 Q
4
Dom
esti
c no
nfin
anci
al s
ecto
rsN
et f
unds
rai
sed
T
otal
1911
.715
42.5
1387
.114
10.0
1374
.515
84.5
1500
.913
36.9
1413
.712
96.9
1521
.712
46.0
1402
.114
70.0
Net
equ
ity is
suan
ce-3
63.4
-606
.1-5
34.2
-332
.0-5
34.0
-719
.2-5
84.8
-560
.0-5
20.0
-472
.0-3
32.0
-332
.0-3
32.0
-332
.0
N
et d
ebt i
ssua
nce
2275
.121
48.6
1921
.317
42.0
1908
.523
03.7
2085
.718
96.9
1933
.717
68.9
1853
.715
78.0
1734
.118
02.0
Bor
row
ing
indi
cato
rs
Deb
t (pe
rcen
t of
GD
P) 1
204.
320
8.8
213.
921
7.1
209.
521
1.3
212.
721
3.3
214.
721
5.8
216.
521
6.9
217.
221
7.8
B
orro
win
g (p
erce
nt o
f G
DP)
18.3
16.2
13.8
12.0
14.3
17.1
15.3
13.7
13.9
12.5
13.0
10.9
11.9
12.2
H
ouse
hold
s
Net
bor
row
ing
212
15.2
1021
.674
4.4
669.
697
3.9
906.
877
0.7
768.
673
8.3
700.
067
3.8
662.
666
9.6
672.
6
H
ome
mor
tgag
es10
51.8
828.
457
8.6
536.
480
6.5
695.
259
8.0
594.
257
5.3
547.
053
7.6
528.
253
7.6
542.
3
C
onsu
mer
cre
dit
94.4
104.
898
.674
.312
7.3
99.6
113.
310
3.3
92.9
85.0
77.7
75.4
73.0
71.3
D
ebt/D
PI (
perc
ent)
312
3.8
129.
113
1.2
131.
013
0.2
130.
913
0.5
131.
413
1.6
131.
613
1.2
131.
213
1.0
130.
8
B
usin
ess
F
inan
cing
gap
4-1
38.6
68.4
4.6
85.6
48.3
155.
6-1
1.7
-23.
59.
344
.480
.869
.382
.810
9.6
N
et e
quity
issu
ance
-363
.4-6
06.1
-534
.2-3
32.0
-534
.0-7
19.2
-584
.8-5
60.0
-520
.0-4
72.0
-332
.0-3
32.0
-332
.0-3
32.0
C
redi
t mar
ket b
orro
win
g58
1.7
791.
379
9.0
687.
460
6.5
995.
981
5.9
954.
476
1.8
663.
766
5.3
704.
869
0.0
689.
7
S
tate
and
loca
l gov
ernm
ents
N
et b
orro
win
g17
1.4
152.
315
5.4
141.
715
6.6
264.
517
2.3
169.
713
3.7
145.
714
1.7
141.
714
1.7
141.
7
Cur
rent
sur
plus
520
3.8
220.
516
5.0
166.
121
0.2
205.
514
4.3
177.
317
0.0
168.
415
8.1
173.
216
5.8
167.
3
F
eder
al g
over
nmen
t
Net
bor
row
ing
306.
918
3.4
222.
624
3.2
171.
413
6.5
326.
74.
229
9.8
259.
537
3.0
69.0
232.
829
8.0
N
et b
orro
win
g (n
.s.a
.)30
6.9
183.
422
2.6
243.
243
.458
.715
2.2
-91.
471
.989
.819
3.9
-105
.156
.498
.0
Uni
fied
def
icit
(n.s
.a.)
321.
820
9.2
193.
122
9.1
41.7
80.4
178.
0-1
30.4
42.4
103.
020
8.4
-134
.651
.910
3.5
Dep
osit
ory
inst
itut
ions
Fund
s su
pplie
d81
4.1
748.
740
0.2
332.
738
6.9
600.
947
3.6
594.
348
9.8
43.1
63.7
504.
935
1.0
411.
3
N
ote.
Dat
a af
ter
2007
:Q1
are
staf
f pr
ojec
tions
.
1. A
vera
ge d
ebt l
evel
s in
the
peri
od (
com
pute
d as
the
aver
age
of p
erio
d-en
d de
bt p
ositi
ons)
div
ided
by
nom
inal
GD
P.
2. I
nclu
des
chan
ge in
liab
ilitie
s no
t sho
wn
in h
ome
mor
tgag
es a
nd c
onsu
mer
cre
dit.
3.
Ave
rage
deb
t lev
els
in th
e pe
riod
(co
mpu
ted
as th
e av
erag
e of
per
iod-
end
debt
pos
ition
s) d
ivid
ed b
y di
spos
able
per
sona
l inc
ome.
4.
For
cor
pora
tions
, exc
ess
of c
apita
l exp
endi
ture
s ov
er U
.S. i
nter
nal f
unds
.
5. N
IPA
sta
te a
nd lo
cal g
over
nmen
t sav
ing
plus
con
sum
ptio
n of
fix
ed c
apita
l and
net
cap
ital t
rans
fers
.
n.s.
a. N
ot s
easo
nally
adj
uste
d.
2.6.
4 F
OF
I-30

(This page intentionally blank.)

Class II FOMC—Restricted (FR)
International Developments
The foreign economy remains on a firm upward trajectory, with growth averaging around 3¾ percent in the first half of this year and inflation under control in most economies. We expect these favorable trends to continue over the forecast period, aided by a projected moderation in the rate of increase of prices of oil and other commodities. Monetary policy abroad is also expected to play an important role in this outlook, as further tightening will likely be necessary to avoid overheating in some countries where spare capacity is narrowing, including most of the advanced foreign economies. Although to date increases in industrial country interest rates have not had major spillovers to other financial markets, the possibility remains that further monetary policy restraint in these economies could have repercussions for emerging markets. However, the extensive improvement in fundamentals in emerging markets in recent years suggests that such risks are not widespread.
Summary of Staff Projections (Percent change from end of previous period, s.a.a.r., except as noted)
2006 2007 Projection
2007 Indicator H1 H2 Q1
Q2 H2 2008
Foreign output 4.3 3.4 3.7 3.8 3.6 3.5 May GB 4.4 3.5 3.7 3.6 3.5 3.5 Foreign CPI 2.3 1.8 2.8 2.7 2.5 2.3 May GB 2.4 1.8 2.8 2.7 2.4 2.3 U.S. net exports, contributions to growth, (percentage points) .2 .7 -.7 1.0 .1 .0 May GB .2 .7 -.8 .8 .1 .0
Note. Changes for years measured as Q4/Q4; for half-years, Q2/Q4 or Q4/Q2. The current forecast for growth and inflation abroad is similar to that shown in the May Greenbook. Although oil prices have increased somewhat faster than previously expected, futures markets still expect prices to drift up only a little further over the forecast period. The trade-weighted value of the broad nominal dollar has shown little net change since the last FOMC meeting; we continue to expect a gradual real depreciation going forward in response to the pressure of financing the persistent current account deficit.
I-31

I-32 Class II FOMC—Restricted (FR) Part 1: Summary and Outlook, June 20, 2007
With foreign economic growth outpacing the U.S. economic expansion, the arithmetic contribution of net exports to U.S. GDP growth turned positive last year. Although a surge in imports along with little change in exports resulted in a negative contribution of ¾ percentage point in the first quarter, recent data suggest a positive contribution of 1 percentage point in the current quarter. For the rest of the forecast period (smoothing through some volatility resulting from seasonal adjustment of real oil imports), the contribution should be roughly neutral. The U.S. current account deficit widened by $19 billion, to $770 billion, at an annual rate (5.7 percent of GDP) in the first quarter as net transfers abroad increased while the nominal trade deficit and net investment income were little changed. The first quarter deficit was narrower than previously estimated largely as a result of an upward revision to net investment income. However, we continue to expect that net investment income will decline over the forecast period; this is the main factor underlying our projected increase in the current account deficit to about $920 billion, 6¼ percent of GDP, by the end of next year. Oil Prices Oil prices have moved up more than expected at the time of the May Greenbook in response to heightened concerns about supply from Nigeria as well as the possibility of stronger global oil demand. The spot price of West Texas Intermediate (WTI) crude oil rose about $5 per barrel over this period to close at $69.11 on June 19, and the price of Brent crude rose about $7 per barrel. The WTI price remains unusually low relative to other grades owing to high crude oil inventories in the Midwest. WTI futures prices also have risen recently, although not as much as spot prices. In line with futures prices and assuming some narrowing of the WTI discount, we project that the price of imported oil will climb from about $63 per barrel in the second quarter of this year to around $68 at the start of 2008 and will then edge up to $69 by the end of the forecast period. Relative to the May Greenbook, this projection is about $3 per barrel higher in the second half of this year and $1.70 per barrel higher in 2008. The primary factors influencing the oil market continue to be OPEC production restraint and expectations that oil demand will remain strong, both of which have contributed to maintaining oil prices at historically elevated levels. Concerns about supply disruptions from Iraq, Iran, and Nigeria also continue to put upward pressure on oil prices. Long-running production problems in Nigeria, due to a lack of security, have worsened since early May, and more than a quarter of the country’s production is currently off line.

International Developments Class II FOMC—Restricted (FR) I-33
International Financial Markets Long-term bond yields rose considerably over the intermeeting period in most advanced foreign economies along with the rise in U.S. yields. Positive economic news also increased expectations of policy tightening in many countries. Since the May FOMC meeting, yields on long-term benchmark government bonds have risen about 40 basis points in Canada and in the major European countries and 20 basis points in Japan. Yields on inflation-protected government securities increased nearly as much over the period, and implied inflation compensation rose little except in the United Kingdom and Japan. Long-term yields denominated in local currencies also rose in most Asian emerging market economies. Major stock indexes abroad have risen 2 to 3 percent since the May FOMC meeting as growth prospects have improved. Equity prices in many emerging market economies have risen more. Although the Chinese stock market fell sharply at the end of May after government authorities tripled the stamp tax on stock trades to 0.3 percent, spillovers to other markets were minimal. The Chinese stock market has since recouped most of its late-May losses, posting a net gain over the intermeeting period. The nominal trade-weighted exchange value of the dollar against the major foreign currencies has changed little on balance over the intermeeting period. The dollar appreciated against several of the major currencies, broadly in line with movements in interest rate differentials, but this gain was offset by a 3½ percent depreciation against the Canadian dollar. Against the currencies of our other important trading partners, the trade-weighted value of the dollar was down slightly, mainly as a result of an unusually large 1 percent decline against the Chinese renminbi. Overall, the broad nominal dollar was little changed over this period, and our starting point for the broad real dollar is similar to that in the May Greenbook. However, we currently expect a somewhat faster rate of depreciation of about 2 percent in the broad real dollar over the forecast period. The reason for the revision is that market expectations for U.S. monetary policy have been revised up and are now more in line with the staff forecast, so we no longer expect future increases in market interest rates to provide support for the dollar. On June 11, the Reserve Bank of New Zealand sold N.Z. dollars for U.S. dollars, its first intervention since 1985. The precise amount of the operation was not made public, but market participants estimated it to be in the range of about NZ$300 million to NZ$500 million, equivalent to about US$225 million to US$375 million.

I-34 Class II FOMC—Restricted (FR) Part 1: Summary and Outlook, June 20, 2007
. The Desk did not intervene
during the period for the accounts of the System or the Treasury. Advanced Foreign Economies Real GDP growth in the advanced foreign economies averaged 3.3 percent in the first quarter, about ½ percentage point higher than we had expected. Growth was particularly robust in Canada, where the economy rebounded from subpar growth over the previous three quarters, while growth in the euro area also surprised on the upside. In contrast, first-quarter growth in Japan was lower than previously projected, although still quite strong. Recent indicators suggest that the pace of expansion in these economies has moderated to about 3 percent in the current quarter, and we expect a further step-down to about 2½ percent by the beginning of next year, closer to trend growth. The pattern of gradually slowing growth is common to all the major advanced economies and partly reflects continued tightening of monetary policy aimed at containing inflationary pressures as resource utilization rises. (In Canada, recent currency appreciation also has contributed to a tightening of financial conditions.) We now expect official interest rates to be raised 75 basis points by the end of this year in Canada, 50 basis points in the euro area, and 25 basis points in the United Kingdom. Although Japanese inflation remains quite low, we assume that the Bank of Japan will gradually raise its policy rate by 75 basis points to 1.25 percent by the end of the forecast period. We expect that inflation will remain contained in all of these economies, partly as a result of the policy moves, with average four-quarter inflation edging up from 1½ percent in the first half of this year to 2 percent by the end of the year before falling back to 1¾ percent in 2008. In Canada and Europe, inflation recedes in 2008 in response to the projected deceleration in energy prices as well as the monetary policy restraint. We expect Japanese consumer price inflation to remain slightly negative in the near term and then to rise to ½ percent next year in response to continued moderate output growth. On average, projected growth for the advanced economies is a little higher than in the May Greenbook for the remainder of this year. In 2008, expected growth for Canada is slightly lower, mainly because recent statements by the Bank of Canada suggest that increasing concern about a rise in core inflation will prompt more monetary policy tightening than previously expected. The overall inflation forecast for these economies has been revised up a little through mid-2008 in response to the higher path for oil prices.

International Developments Class II FOMC—Restricted (FR) I-35
Emerging Market Economies Average output growth in the emerging market economies is estimated to have rebounded from just over 4 percent in the first quarter to 5 percent in the current quarter, largely owing to an improvement in the Mexican economy. The pace of expansion is expected to remain around this rate over the forecast period, similar to the May Greenbook projection. In emerging Asia, real GDP growth appears to have slowed from about 7 percent in the first quarter to a still-strong rate of 6 percent in the current quarter. The moderation largely reflects our assessment that Chinese growth has cooled somewhat from its 13¾ percent pace in the first quarter, as April and May industrial production data showed some deceleration. However, the trade surplus has continued to expand, and investment and retail sales growth have remained strong, suggesting some upside risk to this projection. Growth is expected to be around 9½ percent in the current quarter and to remain near that rate over the forecast period, as Chinese authorities continue to employ both monetary restraint and administrative measures to slow investment demand. In addition, we have assumed that activity will slow somewhat in the current quarter in India, which also posted growth of 13 percent in the first quarter. Elsewhere in emerging Asia, first-quarter performance was mixed, with strong activity in most of the ASEAN countries but some deceleration in Taiwan and Hong Kong. We expect an improvement in global high-tech demand in the second half of this year to contribute to a firming in growth in the region over the forecast period. In Latin America, recent industrial production data suggest that Mexican real GDP growth has rebounded to about 3¾ percent this quarter, after stagnating in the first quarter. We expect growth in Mexico to average about 3½ percent over the rest of the forecast period, supported by a pickup in construction activity and a firming in demand from the U.S. manufacturing sector. The pace of expansion in Brazil also appears to have improved to 4 percent in the second quarter and is expected to remain around that rate as the authorities continue to ease monetary policy. Four-quarter inflation in emerging market economies is expected to increase from a little less than 3 percent at the end of 2006 to about 3½ percent in the third quarter in response to higher food and energy prices and then to taper off to 3 percent by the end of 2008. This pattern is most pronounced in China, where food price inflation has recently risen to over 8 percent and four-quarter headline inflation is expected to reach 3¾ percent in the third quarter. We expect Chinese inflation to recede over the forecast period as some
I-36 Class II FOMC—Restricted (FR) Part 1: Summary and Outlook, June 20, 2007
temporary factors that have affected meat supply abate. We also assume that the Chinese authorities will take action to restrain food price inflation if necessary, possibly including restricting the production of ethanol, which has contributed directly to higher prices of corn and indirectly to higher meat prices. Chinese inflation is thus expected to drop back to 2¼ percent by the end of 2008. Prices of Internationally Traded Goods Core import prices rose at an annual rate of 2¾ percent in the first quarter of this year, with much of the increase in prices for material-intensive goods. In the current quarter, higher nonfuel commodity prices and the depreciation of the dollar are expected to push core import price inflation up to 4½ percent. Prices of imported metals rose briskly in April and early May, and despite some subsequent weakness in the spot markets, these prices are projected to remain elevated. The dollar, which declined sharply earlier this year, should provide further upward impetus to import prices in the third quarter. For the remainder of the forecast period, core import prices decelerate as commodity prices level off and the pace of dollar depreciation slows. Core export prices surged at an annual rate of almost 6 percent in the first quarter, mainly owing to a rebound in the prices of exported industrial supplies, particularly fuels, which had fallen sharply in the fourth quarter. Prices of exported industrial supplies are also up significantly so far in the second quarter despite some flattening in May. In addition, rising costs for intermediate inputs are putting upward pressure on prices of exported finished goods. As a result, we expect core export price inflation to remain around 6 percent in the second quarter, ½ percentage point higher than projected in the May Greenbook. However, as commodity prices level off, core export price inflation is projected to move down quickly over the next few quarters, falling to 2¾ percent in the fourth quarter of this year and to about 1¼ percent next year.

International Developments Class II FOMC—Restricted (FR) I-37
Staff Projections of Selected Trade Prices (Percent change from end of previous period excepted as noted, s.a.a.r.)
2006 2007 Projection
2007 Indicator H1 H2 Q1
Q2 H2 2008
Imports Core goods 2.7 2.7 2.8 4.5 3.3 1.6 May GB 2.7 2.7 2.8 4.5 2.8 1.3 Oil (dollars per barrel) 63.81 55.33 54.39 63.24 68.32 68.79 May GB 63.75 55.34 54.39 61.90 65.58 67.14
Exports Core goods 5.3 3.0 5.9 6.0 3.2 1.2 May GB 5.3 3.0 5.9 5.5 2.6 1.3
Note. Prices for core exports exclude computers and semiconductors. Prices for core imports exclude computers, semiconductors, oil, and natural gas. Both price series are on a NIPA chain-weighted basis. The price of imported oil for multiquarter periods is the price for the final quarter of the period. Imported oil includes both crude oil and refined products.
Trade in Goods and Services Since the May Greenbook, we have received monthly trade data for March and April, as well as annual revisions to trade data for previous months. These data indicated that both imports and exports were above our previous estimates for the first quarter, although the projected contribution of real net exports to U.S. growth is little changed at negative ¾ percentage point. We estimate that the contribution of net exports swung to a positive 1 percentage point in the current quarter, owing to a contraction of imports, particularly of oil, while exports accelerated. The contribution of net exports is a little higher than in the May Greenbook, as April imports of core goods were down more than we had expected. We continue to project the contribution of real net exports to be roughly neutral on average over the remainder of the forecast period. Although real imports of core goods and services decelerated along with the slower pace of U.S. growth in the first quarter, a surge in imported oil and computers boosted growth of total real imports to an estimated annual rate of 5½ percent. We estimate that real imports have fallen 2½ percent in the current quarter, down from a projection of little change in the May Greenbook, largely owing to weak April data and a downward revision to oil imports. Imports of consumer goods declined significantly in April, notably in the volatile category of pharmaceuticals, and auto imports also fell sharply.

I-38 Class II FOMC—Restricted (FR) Part 1: Summary and Outlook, June 20, 2007
These data suggest that imports of core goods will decline slightly for the second consecutive quarter. In addition, we expect real imports of oil and computers to retrace some of their first-quarter rise. Real imports of services, which were weak in April, are expected to increase at a sluggish rate of 2¼ percent in the quarter.
Staff Projections for Trade in Goods and Services (Percent change from end of previous period, s.a.a.r.)
2006 2007 Projection
2007 Indicator H1 H2 Q1
Q2 H2 2008
Real imports 5.2 1.4 5.4 -2.4 3.8 3.8 May GB 5.2 1.4 4.1 0.1 3.6 4.2
Real exports 10.0 8.7 1.2 5.4 6.0 5.7 May GB 10.0 8.7 -1.1 7.6 6.2 5.7
Note. Changes for years are measured as Q4/Q4; for half-years, Q2/Q4 or Q4/Q2. We expect growth of real imports of goods and services to pick up to about 3¾ percent at an annual rate over the remainder of the forecast period, as slower import price inflation and higher U.S. GDP growth boost imports of core goods and services. In contrast, real imports of oil should decelerate as U.S. production increases through the end of the forecast period. Our projection for next year is down ½ percentage point from the May Greenbook, as the lower path for the dollar and weaker real imports of oil offset a boost from higher projected growth of U.S. GDP. We estimate that the growth of real exports of goods and services slowed sharply in the first quarter to 1¼ percent at an annual rate following a very strong performance in 2006, particularly in the fourth quarter. Although much of the first-quarter slowdown was due to a leveling-out of exports of aircraft, which accounted for a large portion of the fourth-quarter surge, growth of exports of other capital goods also slowed significantly. April data suggest some rebound in the current quarter, as agricultural exports rose strongly, and exports of industrial supplies and consumer goods registered modest gains. Accordingly, we expect growth of real exports of goods and services to improve to a 5½ percent rate in the second quarter. Exports of core goods are projected to increase at a pace of 6 percent, in line with movements in foreign income growth and relative prices. Real exports of services are also projected to pick up again after a weak first quarter.

International Developments Class II FOMC—Restricted (FR) I-39
Partly because of April declines, we expect exports of computers to remain sluggish and exports of semiconductors to fall in the current quarter. Against the backdrop of sustained solid economic growth abroad, we expect growth of real exports of goods and services to improve further in the second half of the year to a 6 percent rate and then to move down slightly from that pace by the end of next year. This includes steady growth of 5 percent in real exports of core goods. Although slowing core export price inflation and past and prospective dollar depreciation provide some lift to exports, this effect is offset by the waning influence of some special factors that have recently boosted growth, such as the surging global demand for U.S. aircraft and other investment goods. Growth of real exports of services peaks in the second half of this year and slows over the forecast period, as the effect of recent rapid dollar depreciation dissipates fairly quickly. Exports of computers and semiconductors are expected to grow at a pace near their historical averages. The projection is little changed from the May Greenbook, as the effect of the lower path for the dollar is offset by the effect of higher core export prices, mainly for agricultural goods. We have also reduced our projection of exports of computers and semiconductors somewhat. Alternative Simulations Our benchmark forecast for oil prices follows futures markets in projecting modest increases, but of course a wide range of outcomes for oil prices is plausible over the forecast period. In our alternative scenario, we used SIGMA, the staff’s forward-looking multicountry model, to consider the effects of a much larger increase in the price of oil.1 Specifically, we assume that an adverse supply shock causes oil prices to rise permanently by 50 percent in real terms relative to our baseline path, starting in the third quarter of 2007. Both households and firms are assumed to understand the shock to be permanent. The simulation exercise also assumes that monetary policy in both the United States and foreign countries follows a Taylor rule and is highly credible, so long-run inflation expectations remain well anchored. In reaction to the higher oil prices, U.S. real GDP growth falls about 0.3 percentage point below baseline in the second half of 2007 before recovering to just a bit below baseline at the end of 2008. Following our specification of the Taylor rule, the U.S. federal funds rate rises 20 basis points relative to baseline throughout the forecast period. Both
1 The effects of an oil shock that are reported below for SIGMA are within the range of estimates
derived from other macroeconomic models used at the Board. These models include the FRB/Global model and variants of the FRB/US model with model-consistent expectations.

I-40 Class II FOMC—Restricted (FR) Part 1: Summary and Outlook, June 20, 2007
consumption and investment fall; consumer spending drops in response to the reduction in permanent income, while elevated energy prices lead firms to reduce investment. Although long-run inflation expectations are unchanged, core PCE price inflation increases ¼ percentage point relative to baseline over the forecast period, reflecting an increase in unit labor costs as the lower investment reduces labor productivity while real wages fall only gradually. Rising energy costs also contribute to a widening of the U.S. trade deficit of about 0.6 percent of GDP.
Alternative Simulation: Higher Oil Price Path
(Percent change from previous period, annual rate)
2007 2008 Indicator and simulation
H1 H2 H1 H2
U.S. real GDP Baseline 2.0 2.3 2.5 2.5 Permanently higher oil price 2.0 2.0 2.3 2.4
U.S. PCE prices excluding food and energy Baseline 1.9 2.2 2.1 2.0 Permanently higher oil price 1.9 2.4 2.4 2.3
U.S. federal funds rate (percent) Baseline 5.3 5.3 5.3 5.3 Permanently higher oil price 5.3 5.5 5.5 5.5
U.S. trade balance (percent of GDP) Baseline -5.2 -5.3 -5.3 -5.1 Permanently higher oil price -5.2 -5.9 -5.9 -5.7
Note. H1 is Q2/Q4; H2 is Q4/Q2. The federal funds rate is the average rate for the final quarter of the period. The monetary authorities in the United States and the major foreign economies adjust their policy rates according to Taylor rules.

Evolution of the Staff Forecast
-8.0
-7.5
-7.0
-6.5
-6.0
-5.5
Class II FOMC -- Restricted (FR)
2006
2007
2008
Greenbook publication date
Current Account BalancePercent of GDP
1/26 3/16 4/28 6/22 8/4 9/14 10/26 12/7 1/25 3/22 5/3 6/21 8/3 9/1310/18 12/6 1/24 3/14 5/2 6/20 8/2 9/12 10/24 12/56/202005 2006 2007
2.5
3.0
3.5
4.0
2006
20072008
Greenbook publication date
Foreign Real GDPPercent change, Q4/Q4
1/26 3/16 4/28 6/22 8/4 9/14 10/26 12/7 1/25 3/22 5/3 6/21 8/3 9/1310/18 12/6 1/24 3/14 5/2 6/20 8/2 9/12 10/24 12/56/202005 2006 2007
-1
0
1
2
3
4
5
2006
2007
2008
Greenbook publication date*Prices for merchandise imports excluding computers, semiconductors, oil, and natural gas.
Core Import Prices*Percent change, Q4/Q4
1/26 3/16 4/28 6/22 8/4 9/14 10/26 12/7 1/25 3/22 5/3 6/21 8/3 9/1310/18 12/6 1/24 3/14 5/2 6/20 8/2 9/12 10/24 12/56/202005 2006 2007
I-41

Class II FOMC June 20, 2007
Restricted (FR)
OUTLOOK FOR FOREIGN REAL GDP AND CONSUMER PRICES: SELECTED COUNTRIES
(Percent, Q4 to Q4)
___________________________________________________________________________________________________
Projected
Measure and country 2000 2001 2002 2003 2004 2005 2006 2007 2008
___________________________________________________________________________________________________
REAL GDP (1)
------------
Total foreign 4.2 0.4 3.1 3.0 3.8 3.8 3.9 3.6 3.5
Advanced Foreign Economies 3.5 0.9 2.5 1.8 2.5 2.7 2.5 2.9 2.4
of which:
Canada 4.1 1.3 3.5 1.5 3.5 3.2 1.9 3.0 2.6
Japan 3.1 -1.7 2.0 2.4 1.1 2.8 2.4 2.6 1.9
United Kingdom 3.1 2.0 2.3 3.3 2.6 1.9 3.0 3.0 2.6
Euro Area (2) 3.3 1.1 1.0 1.1 1.6 1.9 3.3 2.6 2.1
Germany 2.3 1.1 0.0 0.2 0.2 1.7 3.9 2.8 2.1
Emerging Market Economies 5.2 -0.4 3.9 4.8 5.7 5.4 5.7 4.7 4.9
Asia 5.8 1.0 6.3 6.9 6.0 7.5 6.7 6.3 6.2
Korea 4.4 4.7 7.7 4.2 2.9 5.7 4.0 4.1 4.4
China 7.8 7.1 8.5 10.1 9.6 10.0 10.4 10.3 9.2
Latin America 4.5 -1.3 1.6 2.4 5.3 3.1 4.8 3.1 3.6
Mexico 4.8 -1.3 2.0 2.1 4.8 2.5 4.3 2.8 3.4
Brazil 4.4 -0.7 5.0 0.8 5.0 3.1 4.7 3.8 4.0
CONSUMER PRICES (3)
-------------------
Advanced Foreign Economies 1.9 0.9 2.1 1.3 1.8 1.5 1.3 2.1 1.7
of which:
Canada 3.1 1.1 3.8 1.7 2.3 2.3 1.3 2.9 2.0
Japan -0.5 -1.1 -0.5 -0.3 0.5 -1.0 0.3 0.3 0.5
United Kingdom (4) 0.9 1.1 1.5 1.3 1.4 2.1 2.7 2.2 2.0
Euro Area (2) 2.5 2.1 2.3 2.0 2.3 2.3 1.8 2.3 1.9
Germany 1.7 1.5 1.2 1.1 2.1 2.2 1.3 2.4 1.8
Emerging Market Economies 4.1 2.8 2.9 3.1 3.9 3.0 2.9 3.3 3.0
Asia 1.8 1.2 0.8 2.2 3.2 2.6 2.3 3.1 2.6
Korea 2.5 3.3 3.3 3.5 3.4 2.5 2.1 3.2 2.8
China 1.0 -0.1 -0.6 2.7 3.3 1.4 2.1 3.4 2.3
Latin America 8.4 5.3 6.4 4.9 5.7 3.8 4.2 3.7 3.8
Mexico 8.7 5.1 5.2 3.9 5.3 3.1 4.1 3.4 3.5
Brazil 6.4 7.5 10.7 11.5 7.2 6.1 3.2 4.0 3.7
___________________________________________________________________________________________________
1. Foreign GDP aggregates calculated using shares of U.S. exports.
2. Harmonized data for euro area from Eurostat.
3. Foreign CPI aggregates calculated using shares of U.S. non-oil imports.
4. CPI excluding mortgage interest payments, which is the targeted inflation rate.
I-42
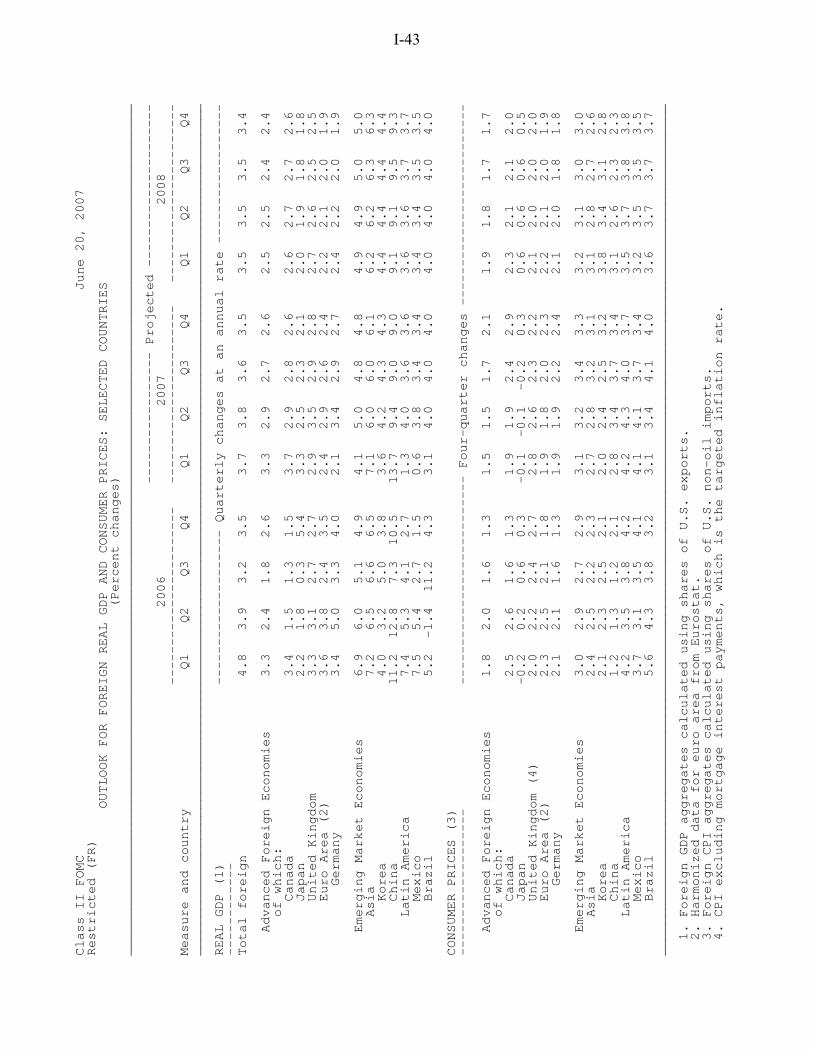
Class II FOMC June 20, 2007
Restricted (FR)
OUTLOOK FOR FOREIGN REAL GDP AND CONSUMER PRICES: SELECTED COUNTRIES
(Percent changes)
______________________________________________________________________________________________________________
----------------- Projected ---------------------
2006 2007 2008
----------------------- ----------------------- -----------------------
Measure and country Q1 Q2 Q3 Q4 Q1 Q2 Q3 Q4 Q1 Q2 Q3 Q4
______________________________________________________________________________________________________________
REAL GDP (1) -------------------- Quarterly changes at an annual rate ------------------
------------
Total foreign 4.8 3.9 3.2 3.5 3.7 3.8 3.6 3.5 3.5 3.5 3.5 3.4
Advanced Foreign Economies 3.3 2.4 1.8 2.6 3.3 2.9 2.7 2.6 2.5 2.5 2.4 2.4
of which:
Canada 3.4 1.5 1.3 1.5 3.7 2.9 2.8 2.6 2.6 2.7 2.7 2.6
Japan 2.2 1.8 0.3 5.4 3.3 2.5 2.3 2.1 2.0 1.9 1.8 1.8
United Kingdom 3.3 3.1 2.7 2.7 2.9 3.5 2.9 2.8 2.7 2.6 2.5 2.5
Euro Area (2) 3.6 3.8 2.4 3.5 2.4 2.9 2.6 2.4 2.2 2.1 2.0 1.9
Germany 3.4 5.0 3.3 4.0 2.1 3.4 2.9 2.7 2.4 2.2 2.0 1.9
Emerging Market Economies 6.9 6.0 5.1 4.9 4.1 5.0 4.8 4.8 4.9 4.9 5.0 5.0
Asia 7.2 6.5 6.6 6.5 7.1 6.0 6.0 6.1 6.2 6.2 6.3 6.3
Korea 4.0 3.2 5.0 3.8 3.6 4.2 4.3 4.3 4.4 4.4 4.4 4.4
China 11.2 12.8 7.3 10.5 13.7 9.4 9.0 9.0 9.1 9.1 9.5 9.3
Latin America 7.4 5.3 4.1 2.7 1.3 4.0 3.6 3.6 3.6 3.6 3.7 3.7
Mexico 7.5 5.4 2.7 1.5 0.6 3.8 3.4 3.4 3.4 3.4 3.5 3.5
Brazil 5.2 -1.4 11.2 4.3 3.1 4.0 4.0 4.0 4.0 4.0 4.0 4.0
CONSUMER PRICES (3)
------------------- --------------------------- Four-quarter changes --------------------------
Advanced Foreign Economies 1.8 2.0 1.6 1.3 1.5 1.5 1.7 2.1 1.9 1.8 1.7 1.7
of which:
Canada 2.5 2.6 1.6 1.3 1.9 1.9 2.4 2.9 2.3 2.1 2.1 2.0
Japan -0.2 0.2 0.6 0.3 -0.1 -0.1 -0.2 0.3 0.6 0.6 0.6 0.5
United Kingdom (4) 2.0 2.2 2.4 2.7 2.8 2.6 2.3 2.2 2.1 2.0 2.0 2.0
Euro Area (2) 2.3 2.5 2.1 1.8 1.9 1.8 2.0 2.3 2.2 2.1 2.0 1.9
Germany 2.1 2.1 1.6 1.3 1.9 1.9 2.2 2.4 2.1 2.0 1.8 1.8
Emerging Market Economies 3.0 2.9 2.7 2.9 3.1 3.2 3.4 3.3 3.2 3.1 3.0 3.0
Asia 2.4 2.5 2.2 2.3 2.7 2.8 3.2 3.1 3.1 2.8 2.7 2.6
Korea 2.1 2.3 2.5 2.1 2.0 2.4 2.5 3.2 3.8 3.4 3.1 2.8
China 1.2 1.3 1.2 2.1 2.8 3.4 3.7 3.4 3.1 2.6 2.3 2.3
Latin America 4.2 3.5 3.8 4.2 4.2 4.3 4.0 3.7 3.5 3.7 3.8 3.8
Mexico 3.7 3.1 3.5 4.1 4.1 4.1 3.7 3.4 3.2 3.5 3.5 3.5
Brazil 5.6 4.3 3.8 3.2 3.1 3.4 4.1 4.0 3.6 3.7 3.7 3.7
______________________________________________________________________________________________________________
1. Foreign GDP aggregates calculated using shares of U.S. exports.
2. Harmonized data for euro area from Eurostat.
3. Foreign CPI aggregates calculated using shares of U.S. non-oil imports.
4. CPI excluding mortgage interest payments, which is the targeted inflation rate.
I-43
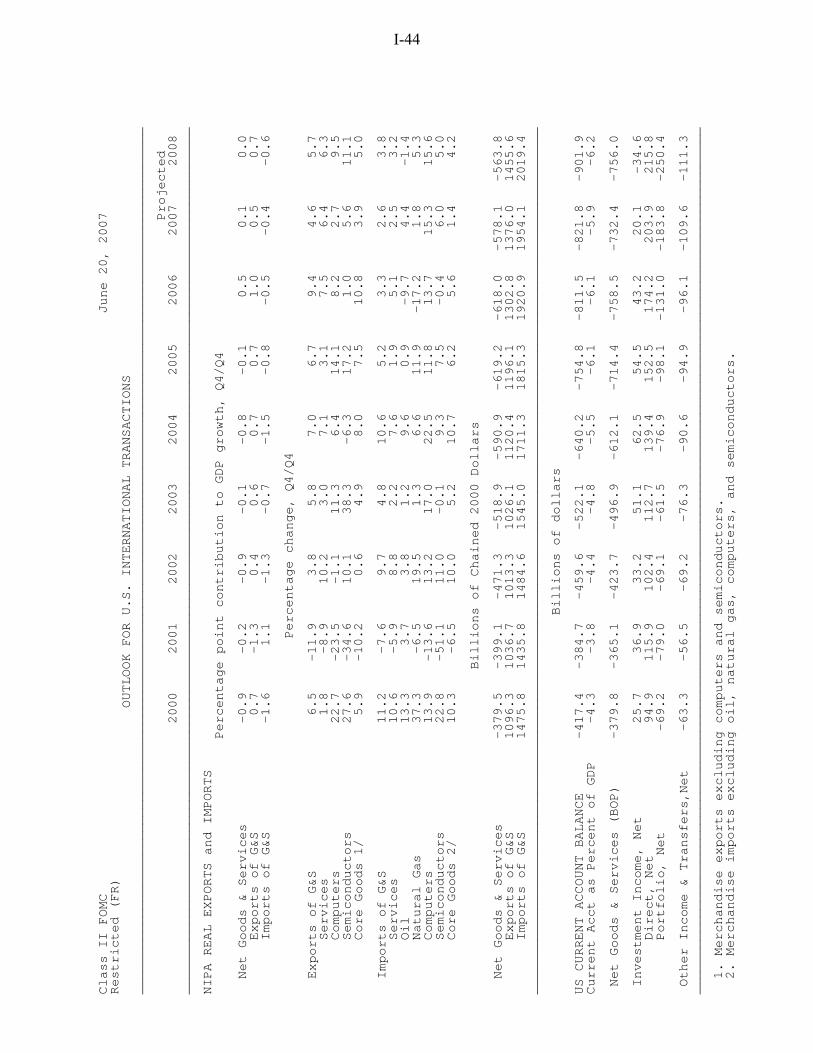
Class II FOMC June 20, 2007
Restricted (FR)
OUTLOOK FOR U.S. INTERNATIONAL TRANSACTIONS
________________________________________________________________________________________________________________
Projected
2000 2001 2002 2003 2004 2005 2006 2007 2008
________________________________________________________________________________________________________________
NIPA REAL EXPORTS and IMPORTS
Percentage point contribution to GDP growth, Q4/Q4
Net Goods & Services -0.9 -0.2 -0.9 -0.1 -0.8 -0.1 0.5 0.1 0.0
Exports of G&S 0.7 -1.3 0.4 0.6 0.7 0.7 1.0 0.5 0.7
Imports of G&S -1.6 1.1 -1.3 -0.7 -1.5 -0.8 -0.5 -0.4 -0.6
Percentage change, Q4/Q4
Exports of G&S 6.5 -11.9 3.8 5.8 7.0 6.7 9.4 4.6 5.7
Services 1.8 -8.9 10.2 3.0 7.1 3.1 7.5 6.4 6.3
Computers 22.7 -23.5 -1.1 11.3 6.4 14.1 8.2 2.7 9.5
Semiconductors 27.6 -34.6 10.1 38.3 -6.3 17.2 1.0 5.6 11.1
Core Goods 1/ 5.9 -10.2 0.6 4.9 8.0 7.5 10.8 3.9 5.0
Imports of G&S 11.2 -7.6 9.7 4.8 10.6 5.2 3.3 2.6 3.8
Services 10.6 -5.9 8.8 2.2 7.6 1.9 5.1 2.5 3.2
Oil 13.3 3.7 3.8 1.2 9.6 0.9 -9.7 4.4 -1.4
Natural Gas 37.3 -6.5 19.5 1.3 6.6 11.9 -17.2 1.8 5.3
Computers 13.9 -13.6 13.2 17.0 22.5 11.8 13.7 15.3 15.6
Semiconductors 22.8 -51.1 11.0 -0.1 9.3 7.5 -0.4 6.0 5.0
Core Goods 2/ 10.3 -6.5 10.0 5.2 10.7 6.2 5.6 1.4 4.2
Billions of Chained 2000 Dollars
Net Goods & Services -379.5 -399.1 -471.3 -518.9 -590.9 -619.2 -618.0 -578.1 -563.8
Exports of G&S 1096.3 1036.7 1013.3 1026.1 1120.4 1196.1 1302.8 1376.0 1455.6
Imports of G&S 1475.8 1435.8 1484.6 1545.0 1711.3 1815.3 1920.9 1954.1 2019.4
________________________________________________________________________________________________________________
Billions of dollars
US CURRENT ACCOUNT BALANCE -417.4 -384.7 -459.6 -522.1 -640.2 -754.8 -811.5 -821.8 -901.9
Current Acct as Percent of GDP -4.3 -3.8 -4.4 -4.8 -5.5 -6.1 -6.1 -5.9 -6.2
Net Goods & Services (BOP) -379.8 -365.1 -423.7 -496.9 -612.1 -714.4 -758.5 -732.4 -756.0
Investment Income, Net 25.7 36.9 33.2 51.1 62.5 54.5 43.2 20.1 -34.6
Direct, Net 94.9 115.9 102.4 112.7 139.4 152.5 174.2 203.9 215.8
Portfolio, Net -69.2 -79.0 -69.1 -61.5 -76.9 -98.1 -131.0 -183.8 -250.4
Other Income & Transfers,Net -63.3 -56.5 -69.2 -76.3 -90.6 -94.9 -96.1 -109.6 -111.3
________________________________________________________________________________________________________________
1. Merchandise exports excluding computers and semiconductors.
2. Merchandise imports excluding oil, natural gas, computers, and semiconductors.
I-44

Class II FOMC June 20, 2007
Restricted (FR)
OUTLOOK FOR U.S. INTERNATIONAL TRANSACTIONS
___________________________________________________________________________________________________________________________
2003 2004 2005
---------------------------- ---------------------------- ---------------------------
Q1 Q2 Q3 Q4 Q1 Q2 Q3 Q4 Q1 Q2 Q3 Q4
___________________________________________________________________________________________________________________________
NIPA REAL EXPORTS and IMPORTS
Percentage point contribution to GDP growth
Net Goods & Services 0.2 -0.7 0.5 -0.5 -0.7 -1.6 -0.2 -0.8 -0.2 0.7 -0.1 -1.1
Exports of G&S -0.5 -0.2 1.0 1.8 0.7 0.6 0.5 1.0 0.5 0.9 0.3 1.0
Imports of G&S 0.7 -0.6 -0.5 -2.3 -1.4 -2.2 -0.7 -1.8 -0.6 -0.2 -0.4 -2.0
Percentage change from previous period, s.a.a.r.
Exports of G&S -5.3 -1.7 11.4 20.8 7.2 6.2 4.8 9.9 4.7 9.4 3.2 9.6
Services -20.0 -2.8 17.5 23.1 7.5 5.6 -2.8 19.2 2.9 2.0 2.1 5.5
Computers -2.3 -5.2 34.7 23.2 -5.8 -3.1 20.7 16.5 13.6 21.9 17.8 3.9
Semiconductors 37.4 30.9 44.6 40.7 11.5 -7.8 -19.1 -7.2 -7.7 21.3 26.3 33.6
Core Goods 1/ 0.2 -2.9 5.2 18.3 7.7 8.2 9.7 6.4 5.8 11.9 1.8 10.7
Imports of G&S -5.0 4.1 3.8 17.6 10.2 16.0 4.4 12.0 4.1 1.4 2.5 13.2
Services -10.6 -15.7 21.2 19.6 10.9 7.6 3.1 9.0 -0.2 -1.5 1.2 8.3
Oil -9.7 12.4 -6.0 9.9 37.2 -22.9 -6.4 45.5 7.0 -21.2 -12.5 40.5
Natural Gas -45.9 72.5 66.4 -32.1 16.2 72.0 43.7 -55.1 23.0 12.3 109.8 -45.9
Computers 11.4 10.7 11.1 36.9 21.1 30.2 27.5 11.9 9.2 9.4 19.6 9.3
Semiconductors -6.3 1.1 -4.2 9.7 43.3 19.6 3.8 -19.9 -7.4 8.4 15.6 14.9
Core Goods 2/ -3.1 7.2 -0.1 18.1 5.3 23.2 4.2 11.0 4.4 5.8 2.7 12.3
Billions of Chained 2000 Dollars, s.a.a.r.
Net Goods & Services -507.2 -526.9 -513.8 -527.8 -548.5 -593.9 -599.4 -621.9 -626.4 -606.1 -607.6 -636.6
Exports of G&S 1003.3 999.0 1026.3 1075.8 1094.8 1111.3 1124.3 1151.3 1164.5 1191.0 1200.5 1228.4
Imports of G&S 1510.5 1525.9 1540.0 1603.6 1643.2 1705.2 1723.7 1773.1 1790.9 1797.1 1808.1 1865.0
___________________________________________________________________________________________________________________________
Billions of dollars, s.a.a.r.
US CURRENT ACCOUNT BALANCE -540.4 -520.4 -522.1 -505.5 -559.8 -634.7 -632.3 -733.8 -729.6 -732.9 -693.6 -863.2
Current Account as % of GDP -5.0 -4.8 -4.7 -4.5 -4.9 -5.4 -5.4 -6.1 -6.0 -5.9 -5.5 -6.8
Net Goods & Services (BOP) -498.6 -494.8 -493.4 -500.9 -544.1 -602.4 -626.4 -675.4 -666.6 -682.7 -723.8 -784.4
Investment Income, Net 34.6 47.8 47.8 74.3 82.2 59.4 69.2 39.2 56.2 53.5 72.8 35.3
Direct, Net 97.1 108.2 109.2 136.2 146.2 129.6 143.4 138.4 140.4 147.3 176.1 146.2
Portfolio, Net -62.4 -60.4 -61.4 -62.0 -63.9 -70.3 -74.2 -99.2 -84.3 -93.8 -103.3 -110.9
Other Inc. & Transfers, Net -76.5 -73.4 -76.5 -78.8 -97.8 -91.7 -75.1 -97.6 -119.2 -103.8 -42.6 -114.1
___________________________________________________________________________________________________________________________
1. Merchandise exports excluding computers and semiconductors.
2. Merchandise imports excluding oil, natural gas, computers, and semiconductors.
I-45

Class II FOMC June 20, 2007
Restricted (FR)
OUTLOOK FOR U.S. INTERNATIONAL TRANSACTIONS
___________________________________________________________________________________________________________________________
---------------------- Projected -------------------------
2006 2007 2008
---------------------------- ---------------------------- ---------------------------
Q1 Q2 Q3 Q4 Q1 Q2 Q3 Q4 Q1 Q2 Q3 Q4
___________________________________________________________________________________________________________________________
NIPA REAL EXPORTS and IMPORTS
Percentage point contribution to GDP growth
Net Goods & Services -0.0 0.4 -0.2 1.6 -0.7 1.0 0.3 -0.2 -0.3 0.7 0.1 -0.4
Exports of G&S 1.4 0.7 0.7 1.1 0.1 0.6 0.7 0.7 0.7 0.7 0.7 0.7
Imports of G&S -1.5 -0.2 -0.9 0.5 -0.9 0.4 -0.3 -0.9 -1.0 0.0 -0.6 -1.0
Percentage change from previous period, s.a.a.r.
Exports of G&S 14.0 6.2 6.8 10.6 1.2 5.4 6.2 5.9 5.8 5.7 5.6 5.6
Services 6.7 6.7 0.8 16.3 3.4 6.7 8.0 7.6 6.9 6.4 6.1 5.8
Computers 9.8 12.0 -0.1 11.5 -8.0 0.9 9.5 9.5 9.5 9.5 9.5 9.5
Semiconductors 15.7 29.9 -12.4 -20.8 14.7 -12.3 11.1 11.1 11.1 11.1 11.1 11.1
Core Goods 1/ 17.8 4.4 11.4 10.1 0.0 5.9 5.0 4.8 4.9 4.9 5.0 5.1
Imports of G&S 9.1 1.4 5.6 -2.6 5.4 -2.4 2.1 5.5 5.9 -0.2 3.4 6.0
Services 7.4 9.9 -2.6 6.2 2.8 2.2 2.8 2.3 2.9 3.3 7.9 -0.9
Oil -4.8 -18.3 7.1 -20.2 30.6 -20.3 -7.7 23.7 16.9 -26.2 -11.3 23.6
Natural Gas -22.7 38.7 -26.4 -40.3 11.9 104.2 -25.2 -37.2 23.3 19.8 18.1 -29.4
Computers 34.3 17.0 18.4 -10.1 41.2 -6.3 15.6 15.6 15.6 15.6 15.6 15.6
Semiconductors 3.6 -1.3 21.6 -21.0 4.4 9.5 5.0 5.0 5.0 5.0 5.0 5.0
Core Goods 2/ 12.3 2.5 6.9 1.2 -0.3 -0.9 3.8 3.1 3.3 4.0 4.5 4.8
Billions of Chained 2000 Dollars, s.a.a.r.
Net Goods & Services -636.6 -624.2 -628.8 -582.6 -604.0 -574.5 -563.9 -570.0 -578.5 -557.5 -554.6 -564.4
Exports of G&S 1269.3 1288.5 1310.0 1343.5 1347.4 1365.2 1385.7 1405.8 1425.8 1445.6 1465.5 1485.5
Imports of G&S 1905.9 1912.7 1938.8 1926.1 1951.4 1939.6 1949.6 1975.8 2004.3 2003.1 2020.1 2050.0
___________________________________________________________________________________________________________________________
Billions of dollars, s.a.a.r.
US CURRENT ACCOUNT BALANCE -802.4 -822.4 -869.3 -751.8 -770.3 -815.4 -838.4 -863.2 -908.5 -884.0 -891.5 -923.6
Current Account as % of GDP -6.2 -6.2 -6.5 -5.6 -5.7 -5.9 -6.0 -6.1 -6.4 -6.1 -6.1 -6.3
Net Goods & Services (BOP) -758.8 -770.3 -797.2 -707.7 -707.2 -727.2 -740.4 -754.7 -774.8 -746.8 -743.7 -758.8
Investment Income, Net 48.3 49.2 30.0 45.3 48.1 22.3 12.3 -2.1 -18.3 -29.7 -40.2 -50.2
Direct, Net 168.0 178.6 161.9 188.3 205.3 195.4 205.6 209.4 209.4 213.6 218.0 222.3
Portfolio, Net -119.8 -129.4 -132.0 -143.0 -157.2 -173.0 -193.3 -211.5 -227.7 -243.3 -258.2 -272.5
Other Inc. & Transfers, Net -91.8 -101.2 -102.1 -89.4 -111.3 -110.5 -110.3 -106.4 -115.3 -107.6 -107.6 -114.6
___________________________________________________________________________________________________________________________
1. Merchandise exports excluding computers and semiconductors.
2. Merchandise imports excluding oil, natural gas, computers, and semiconductors.
Last Page
I-46