fomc 20070807 g bpt 120070802
TRANSCRIPT

Content last modified 02/07/2013.
Prefatory Note The attached document represents the most complete and accurate version available based on original files from the FOMC Secretariat at the Board of Governors of the Federal Reserve System. Please note that some material may have been redacted from this document if that material was received on a confidential basis. Redacted material is indicated by occasional gaps in the text or by gray boxes around non-text content. All redacted passages are exempt from disclosure under applicable provisions of the Freedom of Information Act.
Class II FOMC - Restricted (FR)
Part 1 August 2, 2007
CURRENT ECONOMICAND FINANCIAL CONDITIONS
Summary and Outlook
Prepared for the Federal Open Market Committeeby the staff of the Board of Governors of the Federal Reserve System

Class II FOMC - Restricted (FR)
August 2, 2007
Summary and Outlook
Prepared for the Federal Open Market Committeeby the staff of the Board of Governors of the Federal Reserve System
Class II FOMC—Restricted (FR)
Domestic Developments
I-1
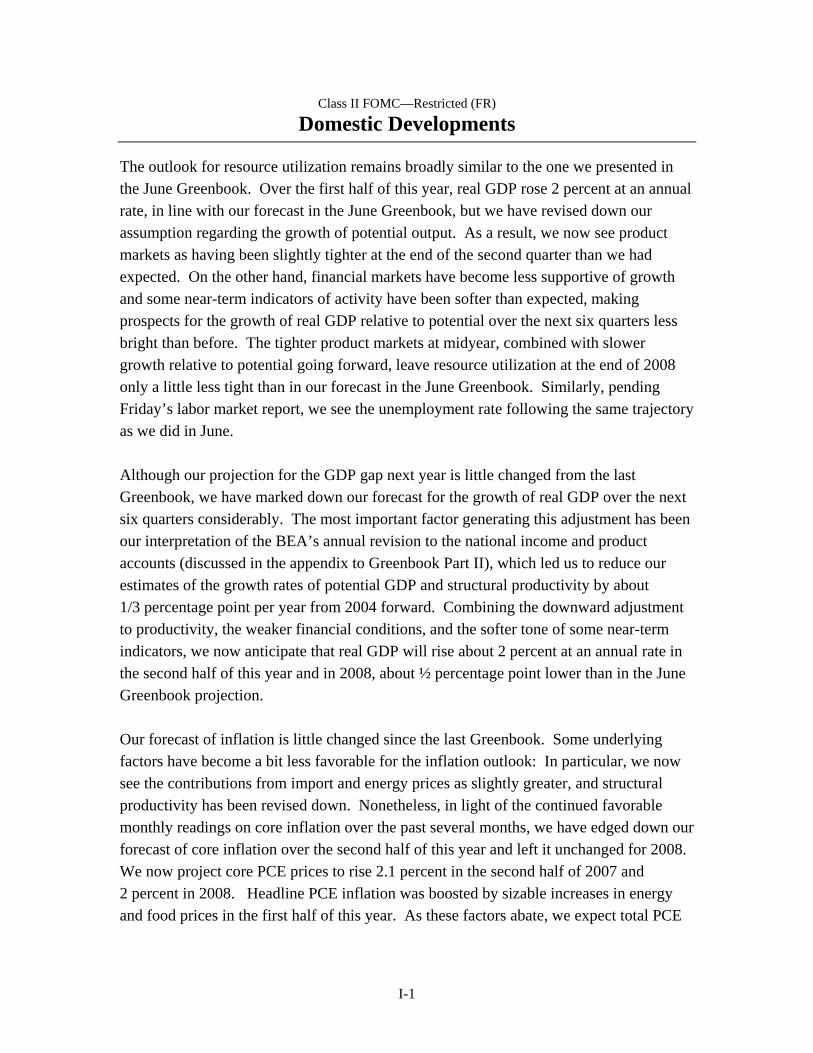
The outlook for resource utilization remains broadly similar to the one we presented in the June Greenbook. Over the first half of this year, real GDP rose 2 percent at an annual rate, in line with our forecast in the June Greenbook, but we have revised down our assumption regarding the growth of potential output. As a result, we now see product markets as having been slightly tighter at the end of the second quarter than we had expected. On the other hand, financial markets have become less supportive of growth and some near-term indicators of activity have been softer than expected, making prospects for the growth of real GDP relative to potential over the next six quarters less bright than before. The tighter product markets at midyear, combined with slower growth relative to potential going forward, leave resource utilization at the end of 2008 only a little less tight than in our forecast in the June Greenbook. Similarly, pending Friday’s labor market report, we see the unemployment rate following the same trajectory as we did in June. Although our projection for the GDP gap next year is little changed from the last Greenbook, we have marked down our forecast for the growth of real GDP over the next six quarters considerably. The most important factor generating this adjustment has been our interpretation of the BEA’s annual revision to the national income and product accounts (discussed in the appendix to Greenbook Part II), which led us to reduce our estimates of the growth rates of potential GDP and structural productivity by about 1/3 percentage point per year from 2004 forward. Combining the downward adjustment to productivity, the weaker financial conditions, and the softer tone of some near-term indicators, we now anticipate that real GDP will rise about 2 percent at an annual rate in the second half of this year and in 2008, about ½ percentage point lower than in the June Greenbook projection. Our forecast of inflation is little changed since the last Greenbook. Some underlying factors have become a bit less favorable for the inflation outlook: In particular, we now see the contributions from import and energy prices as slightly greater, and structural productivity has been revised down. Nonetheless, in light of the continued favorable monthly readings on core inflation over the past several months, we have edged down our forecast of core inflation over the second half of this year and left it unchanged for 2008. We now project core PCE prices to rise 2.1 percent in the second half of 2007 and 2 percent in 2008. Headline PCE inflation was boosted by sizable increases in energy and food prices in the first half of this year. As these factors abate, we expect total PCE

I-2 Class II FOMC—Restricted (FR) Part 1: Summary and Outlook, August 2, 2007
inflation to slow to 2.1 percent at an annual rate in the second half of 2007 and to 1.8 percent in 2008. In putting this projection together, we have factored in our assessment of the implications of the developments in financial markets over the past several weeks. As we spell out in greater detail below, we have adjusted our projection in light of those developments in three key areas: PCE, residential investment, and business investment in equipment and software. However, the combined effect of these adjustments on the average growth rate of real GDP over the forecast period is on the order of just ¼ percentage point at an annual rate (including the usual wealth effects associated with lower equity values). The effects are not larger because the financial condition of most businesses and households remains good; because we expect the current logjam in financing activity to be limited in duration; and because the average cost of credit for businesses and households, while up from the low levels recorded in the past few months, remains relatively favorable. We recognize, however, that the effects of tighter financial conditions could be more far-ranging and deeper than we expect, so in the alternative-simulations section we analyze the downside risk associated with a more severe financial contraction. Key Background Factors Given our current assessment that the recent turmoil in financial markets will have only a limited effect on resource utilization and that underlying inflation pressures will not subside materially, we continue to assume that the Committee will hold the federal funds rate at 5¼ percent through the end of 2008. Market participants, in contrast, have revised down their anticipated path for policy and now expect the federal funds rate to decline to about 4½ percent by the end of next year. This revision in the policy outlook, along with a decline in the term premium driven by a flight to quality, has pushed the ten-year Treasury yield down about 30 basis points since the last Greenbook. We expect the Treasury rate to drift up over the forecast period, on the assumption that as quality concerns abate, the term premium will rise from the low level now prevailing and that, as moderate growth continues and core inflation remains near 2 percent, market expectations for the federal funds rate will move closer to ours. Since we closed the June Greenbook, the fixed mortgage rate for prime borrowers and the Baa corporate bond yield have moved down less than Treasury yields, widening their spreads over Treasuries by about 25 basis points. Meanwhile, spreads for speculative-grade corporate bonds have jumped roughly 130 basis points. We anticipate that much of

Class II FOMC -- Restricted (FR)
Key Background Factors Underlying the Baseline Staff Projection
2003 2004 2005 2006 2007 20080
1
2
3
4
5
6
7
0
1
2
3
4
5
6
7Percent
Federal Funds Rate
Quarterly average
Current (and June)Greenbook
Market forecast
2003 2004 2005 2006 2007 20083
4
5
6
7
8
9
3
4
5
6
7
8
9Percent
Long-Term Interest Rates
Quarterly average
Baa corporate rate
June GB
10-yearTreasury rate
June GB
2003 2004 2005 2006 2007 200890
2302003:Q1=100, ratio scale
90
110
130
150
170
190
210
230Quarter-end
Equity Prices
Wilshire 5000
June GB
2003 2004 2005 2006 2007 200890
1702003:Q1=100, ratio scale
90
110
130
150
170Quarterly
House Prices
OFHEO purchase-only index
June GB
2003 2004 2005 2006 2007 200820
30
40
50
60
70
80
90
20
30
40
50
60
70
80
90Dollars per barrel
Crude Oil Prices
Quarterly average
West Texasintermediate
June GB
2003 2004 2005 2006 2007 200875
80
85
90
95
100
105
75
80
85
90
95
100
1052003:Q1=100
Broad Real Dollar
Quarterly average
June GB
Note. In each panel, shading represents the projection period.
I-3

I-4 Class II FOMC—Restricted (FR) Part 1: Summary and Outlook, August 2, 2007
this repricing of risk will persist throughout the forecast period, even as the current disruption in the flow of financing fades away. Equity prices currently stand a bit more than 5 percent below the level that we expected in the June Greenbook. We have taken this decline on board and, in line with our usual practice, assume that share prices will henceforth increase at a rate of 6½ percent per year, which would roughly maintain risk-adjusted parity with the return on Treasury securities. Regarding house prices, we have lowered our projection in light of the declines indicated by the Case-Shiller index and the weaker trajectory of home sales in this forecast. We now expect that the purchase-only version of the OFHEO price index will edge down at an annual rate of about ½ percent through the end of 2008. Our fiscal assumptions are unchanged from the June Greenbook. We continue to assume that increases in real defense spending will slow a bit next year as outlays for military activities in Iraq and Afghanistan decelerate. This assumption is consistent with the proposals for defense spending in the Administration’s Mid-Session Review. We also continue to assume that nondefense spending will hold steady in real terms throughout the forecast period and that relief from the alternative minimum tax will be extended through calendar 2008. In all, federal fiscal policy is expected to provide an impetus to real GDP growth of roughly 0.2 percentage point in both 2007 and 2008, about the same as in the June Greenbook. We expect that the federal budget will post deficits of $165 billion in fiscal year 2007 and $225 billion in fiscal 2008, both little changed from the last Greenbook. The spot price of West Texas intermediate (WTI) crude oil has moved up to almost $77 per barrel, about $7 per barrel above its level at the time of the June Greenbook. This increase partly reflects supply disruptions in the North Sea as well as the dissipation of some of the idiosyncratic weakness in the spot price of WTI relative to the price of other grades of crude oil. In contrast, futures prices for WTI delivered next year have not changed significantly since the time of the June Greenbook, and our projection for WTI at the end of 2008 remains about $73 per barrel. The foreign exchange value of the dollar has fallen since the last Greenbook, and we have lowered the projected level of the real trade-weighted dollar over the second half of this year by about 1 percent. We continue to assume that the broad real dollar will depreciate at an annual rate of roughly 2 percent over the forecast period. The available data suggest that foreign economic activity was stronger in the second quarter than we had

Domestic Developments Class II FOMC—Restricted (FR) I-5
anticipated, with growth averaging just above 4 percent. However, we continue to expect growth to average 3½ percent through the end of 2008, little changed from last Greenbook. Recent Developments and the Near-Term Outlook We now estimate that real GDP rose at an annual rate of 3.4 percent in the second quarter, almost ½ percentage point faster than we had projected in the June Greenbook. The upside surprise was primarily attributable to higher levels of both residential and business investment than we had anticipated. With other indicators suggesting a continuing deterioration in the housing market and with the incoming data pointing to moderate rates of increase in other components of household and business spending in coming months, we anticipate that real GDP growth will step down to roughly 2¼ percent in the third quarter, about ¼ percentage point below our forecast in the previous Greenbook. Labor demand has continued to run slightly ahead of our expectations, with private nonfarm payrolls up an average of 115,000 per month over the last three months, in line with their first-quarter pace. The limited extent of the decline in construction employment has been particularly surprising given the substantial deterioration in the housing market, but we anticipate that firms in this sector will begin to shed workers more aggressively in coming months. We expect overall gains in private employment this quarter to slow to an average of 70,000 per month. The unemployment rate was 4.5 percent in June, but, as the pace of hiring slows, we expect it to edge up to 4.6 percent in the current quarter. Manufacturing output excluding motor vehicles rose about 2¾ percent at an annual rate in the second quarter after having been flat, on balance, in the previous two quarters. The recent firming in this sector is consistent with our view that the inventory correction that began late last year is largely complete, and we expect manufacturing production excluding motor vehicles to increase faster in the current quarter. In the motor vehicle sector, we project that total assemblies will step up from an annual rate of 11 million units in the second quarter to a rate of 11½ million units in the current quarter, somewhat below current industry schedules. Real consumer spending is estimated to have increased at an annual rate of about 1¼ percent in the second quarter. That lackluster performance was not unexpected given the outsized consumption gains in the preceding two quarters and the second-quarter

I-6 Class II FOMC—Restricted (FR) Part 1: Summary and Outlook, August 2, 2007
Summary of the Near-Term Outlook (Percent change at annual rate except as noted)
2007:Q2 2007:Q3 Measure June
GB August
GB June GB
August GB
Real GDP 3.0 3.4 2.5 2.2 Private domestic final purchases .9 1.5 1.3 .7 Personal consumption expenditures 1.6 1.3 2.3 2.0 Residential investment -12.2 -10.4 -18.3 -19.6 Business fixed investment 2.8 9.6 4.4 2.4 Government outlays for consumption and investment 4.7 4.5 3.4 3.2
Contribution to growth (percentage points)
Inventory investment .3 .2 .3 .4 Net exports 1.0 1.0 .3 .5
surge in energy prices. For the third quarter, we expect the pace of real consumer spending to move up to 2 percent at an annual rate as energy price increases abate and as consumption moves more in line with the underlying fundamentals. Housing demand appears to have deteriorated since the last Greenbook. Sales of new and existing homes were weaker than expected in June—the former especially so—and credit availability in the subprime market has tightened further. Despite the ongoing deterioration in demand, housing starts have changed little in recent months. According to the official tally from the Census Bureau, builders have made no progress in reducing their inventories of unsold new homes,
. Given the supply imbalance and our expectation of continued weakness in demand, we anticipate that builders will soon act to cut production further. In all, we project that residential investment will contract at an annual rate of 20 percent in the third quarter following the surprisingly modest decline of only 10½ percent in the second quarter. Real investment in equipment and software (E&S) rose at an annual rate of 2¾ percent in the second quarter, held down by continued weakness in transportation outlays. Excluding the transportation sector, E&S spending in the second quarter was quite brisk, rising 9½ percent at an annual rate. Much of this increase was attributable to spending on capital goods outside of high-tech; outlays in this category posted large gains after having

Domestic Developments Class II FOMC—Restricted (FR) I-7
fallen over the previous three quarters. Meanwhile, high-tech spending grew at a moderate pace in the second quarter after a robust first quarter. We expect E&S spending in the current quarter to rise 2¾ percent at an annual rate, the same as in the second quarter: Purchases of heavy and medium trucks are projected to recover, and high-tech spending is expected to grow at a moderate rate. However, investment in capital goods outside the high-tech and transportation sectors is expected to level off, reflecting the recent data on orders and shipments and the small negative effects on spending of the recent financial developments. Nonresidential construction surged in the second quarter, rising almost 27 percent at an annual rate. As we had expected on the basis of the available monthly indicators, outlays for the construction of buildings posted a large increase. However, we were surprised by the jump in drilling and mining spending, which increased at an annual rate of 48 percent. For the third quarter, we expect spending on nonresidential structures to be up only 1½ percent at an annual rate, reflecting a partial retrenchment of outlays for drilling and mining structures and a return to moderate growth in outlays for building construction. Real nonfarm inventory investment is currently estimated to have been a roughly neutral influence on GDP growth in the second quarter after having held down GDP growth by an average of 1 percentage point in the previous two quarters. This swing in the contribution of inventories is consistent with our view, noted previously, that firms have largely worked off the excess inventory accumulation that began late last year. In the current quarter, we expect inventory investment to contribute almost ½ percentage point to real GDP growth, reflecting a return of inventory investment to a pace more in line with expected sales. In the government sector, real federal spending rose at an annual rate of 6¾ percent in the second quarter, reflecting a rebound in defense spending from its first-quarter decline and a small increase in nondefense spending. Given the enacted appropriations for defense, we expect real federal spending to rise a further 5¼ percent at an annual rate in the current quarter. In the state and local sector, real spending rose at an annual rate of roughly 3¼ percent in the second quarter, a bit faster than we had expected. In light of the generally tighter state budgets for the 2008 fiscal year, we project real spending in the current quarter to rise at a more moderate annual rate of about 2 percent. We estimate that real net exports contributed 1 percentage point to real GDP growth in the second quarter, as imports contracted and exports accelerated. Although imports are expected to turn up modestly this quarter, strong foreign growth and the depreciation of

I-8 Class II FOMC—Restricted (FR) Part 1: Summary and Outlook, August 2, 2007
the dollar are anticipated to keep exports on a solid upward trajectory. As a result, we have raised our projection of the contribution of net exports in the current quarter to roughly ½ percentage point, about ¼ percentage point above our June Greenbook forecast. After having posted fairly large increases early this year, core PCE prices decelerated to an annual rate of only 1.4 percent in the second quarter. We continue to view the second-quarter slowing as being importantly driven by transitory factors—in particular, low readings both for apparel prices, which tend to be volatile, and for owners’ equivalent rent, which accelerated somewhat toward the end of the quarter. We are thus projecting core inflation to move back up to a 2 percent pace in the current quarter. Soaring energy prices and rising food prices pushed up headline inflation to an annual rate of roughly 4¼ percent in the second quarter. We expect a flattening out of energy prices and a slight deceleration in food prices to bring down overall PCE inflation to an annual rate of about 2¼ percent this quarter. The Longer-Term Outlook Our forecast has real GDP growing at a 2 percent annual rate in the second half of 2007 and in 2008, about ½ percentage point slower than in the June Greenbook. As noted previously, much of this downward revision reflects a reduction in our estimate of the rate of potential GDP growth, although the recent developments in mortgage and other financial markets—partially offset by the depreciation of the dollar—also play an important role. All else equal, the slower projected growth in potential GDP passes roughly one-for-one into our projection for aggregate demand because the less favorable supply conditions imply a correspondingly slower rate of increase in households’ permanent income and firms’ expected profitability. We project core inflation to average 2.1 percent at an annual rate over the second half of this year and 2 percent next year. With energy prices falling and food prices increasing about in line with the core, overall PCE prices rise 1.8 percent next year. Household spending. Real personal consumption expenditures are projected to rise at an annual rate of roughly 2 percent in both the second half of 2007 and in 2008, about ½ percentage point slower on average than in the last Greenbook. This revision largely reflects the decline in the stock market and the downward revision to our assumption about the growth rate of potential GDP (and, hence, of permanent income). As before, we anticipate that the pace of consumer spending will remain a little below the pace of

Domestic Developments Class II FOMC—Restricted (FR) I-9
Projections of Real GDP (Percent change at annual rate from end of
preceding period except as noted)
2007 Measure
H1 H2 2008
Real GDP 2.0 1.9 2.0 Previous 2.0 2.3 2.5
Final sales 2.3 1.5 2.1 Previous 2.3 1.9 2.6
PCE 2.5 2.0 2.0 Previous 3.0 2.3 2.5
Residential investment -13.4 -20.5 -4.0 Previous -14.1 -16.7 -1.3
BFI 5.8 3.4 3.1 Previous 3.1 4.0 4.6
Government purchases 2.0 3.0 1.5 Previous 2.8 3.2 1.9
Exports 3.3 6.2 5.8 Previous 3.3 6.0 5.7
Imports .7 2.7 3.0 Previous 1.4 3.8 3.8
Contribution to growth (percentage points)
Inventory change -.2 .4 -.1 Previous -.3 .5 -.1
Net exports .3 .2 .2 Previous .1 .1 .0
income growth over the forecast period, so that the personal saving rate, which was revised up in the NIPA revisions, moves higher over the forecast period. In this projection, we have factored in an estimate of the effect that developments in the subprime-mortgage market will have on consumption. In particular, most households with variable-rate subprime mortgages will face at least one interest rate reset over the next year and a half and, thus, rising debt-service costs. However, some rough figures

I-10 Class II FOMC—Restricted (FR) Part 1: Summary and Outlook, August 2, 2007
suggest that the cumulative effect of these resets will be to lower the level of consumption by the end of 2008 by less than 0.1 percent.1 We continue to assume that residential investment will weaken through the first half of next year and then begin a gradual recovery in the second half of 2008. Relative to last Greenbook, we have marked down our projection of housing activity to reflect the sharper deterioration in demand evident in the recent data on home sales, the further tightening of credit availability in the subprime-mortgage market, the slightly higher path for prime mortgage rates, and the lack of progress that builders have made thus far in reducing their stocks of unsold homes. In particular, we now project that single-family housing starts will decline from an annual rate of 1.17 million units in the first half of this year to roughly 1 million units at an annual rate in the second half. For 2008, we project that housing starts will hold to that rate in the first half of the year before edging up to a 1.05 million unit pace in the second half. In the multifamily sector, we continue to expect starts to remain at about their recent pace. Consistent with our starts forecast, real residential investment is projected to fall at annual rates of 20 percent in the second half of 2007 and 10 percent in the first half of 2008 before edging up at annual rate of roughly 3 percent over the second half of next year. Business investment. We project that business spending on equipment and software will rise at an annual rate of roughly 4 percent over the projection period. Spending on high-tech equipment is projected to increase at nearly an 8 percent pace, while outlays for motor vehicles are anticipated to pick up from their recent low levels. In contrast, spending on equipment outside of the high-tech and transportation sectors is projected to rise at an annual rate of just ½ percent over the next six quarters, slowed by the deceleration in business output this year. Our projection for the growth in spending on capital goods in this forecast is somewhat lower than that in the previous Greenbook. In the main, this downward adjustment is attributable to the annual NIPA revisions, which reduced E&S spending, business output, and profits from what had been reported
1 We estimate that 4.7 million variable-rate subprime loans are scheduled to face interest rate resets over the next year and a half. The potential cumulative increase in payments associated with these resets is approximately $12 billion over the period. By 2008, this total represents about 0.1 percent of disposable income, but we expect the effect on consumption to be even smaller. Some consumers will still be able to refinance rather than face these resets and others will have the resources to shield consumption from a one-for-one adjustment to the increase in interest payments. In addition, the increased interest payments from these resets raise the incomes of other households, although they may have a lower propensity to spend out of current income.

Domestic Developments Class II FOMC—Restricted (FR) I-11
previously. In addition, as noted earlier, we have built in a small negative effect from the recent developments in financial markets. Real outlays for nonresidential construction are expected to rise at annual rates of 2¼ percent in the second half of this year and 1½ percent in 2008. This step-down in spending growth reflects the partial unwinding of the recent jump in outlays for drilling and mining, the projected deceleration in business output, and our forecast of a slowdown in employment growth. Government spending. Our projection for real government purchases is little changed from that in the previous Greenbook. We expect real defense purchases to increase at an annual rate of 6¾ percent in the second half of this year and then to slow to about 2 percent in 2008 as spending increases for operations in Iraq and Afghanistan decelerate. We continue to assume that real nondefense purchases will be roughly flat over the forecast period. In the state and local sector, spending is projected to increase at an annual rate of about 2 percent in the second half of 2007 and 1½ percent in 2008; this modest decline is consistent with our expectation that revenue growth will slow over the projection period. Net exports. We estimate that real net exports will contribute about ¼ percentage point to the growth of U.S. real GDP over the second half of 2007 and in 2008. This contribution is a bit higher than in the June Greenbook and reflects the recent depreciation of the dollar and the lower path of U.S. GDP growth. (The International Developments section provides more detail on the outlook for the external sector.) Aggregate Supply, the Labor Market, and Inflation As noted previously, the annual NIPA revisions have led us to update our assumptions about aggregate supply. In particular, we have lowered our estimates of the growth rates of both potential GDP and structural productivity by about 1/3 percentage point in each year from 2004 onward. Structural labor productivity is now assumed to increase a little less than 2 percent per year in both 2007 and 2008, and potential GDP is assumed to rise at an annual rate of 2.2 percent. Our estimate of the NAIRU remains at 5 percent. Productivity and the labor market. With both structural and actual productivity revised down by similar amounts, the level of actual productivity continues to be lower than the level of structural productivity. As in previous Greenbooks, we expect this gap to close slowly over time as employment falls back in line with production. We now

I-12 Class II FOMC—Restricted (FR) Part 1: Summary and Outlook, August 2, 2007
Decomposition of Structural Labor Productivity Nonfarm Business Sector
(Percent change, Q4 to Q4, except as noted)
Measure 1974-95
1996-2000
2001-03 2004 2005 2006 2007 2008
Structural labor productivity 1.5 2.5 3.1 2.4 2.0 2.0 1.9 1.8 Previous 1.5 2.5 3.1 2.7 2.3 2.3 2.2 2.1
Contributions1 Capital deepening .7 1.4 .7 .6 .6 .7 .6 .6 Previous .7 1.4 .7 .6 .6 .7 .6 .6 Multifactor productivity .5 .7 2.1 1.5 1.1 1.1 1.1 1.1 Previous .5 .7 2.1 1.8 1.5 1.4 1.4 1.4 Labor composition .3 .3 .3 .3 .3 .2 .2 .2
MEMO Potential GDP 3.0 3.3 3.0 2.3 2.2 2.2 2.2 2.2 Previous 3.0 3.3 3.0 2.6 2.5 2.6 2.6 2.5
NOTE. Components may not sum to totals because of rounding. For multiyear periods, the percent change is the annual average from Q4 of the year preceding the first year shown to Q4 of the last year shown. 1. Percentage points.
The Outlook for the Labor Market
(Percent change, Q4 to Q4, except as noted)
Measure 2005 2006 2007 2008
Output per hour, nonfarm business 2.1 .9 1.7 2.0 Previous 2.1 1.6 2.1 2.5 Nonfarm private payroll employment 2.0 1.8 1.0 .6 Previous 2.0 1.8 1.0 .6 Household survey employment 1.9 2.1 .6 .7 Previous 1.9 2.1 .4 .7 Labor force participation rate1 66.1 66.3 66.0 65.8 Previous 66.1 66.3 65.9 65.8 Civilian unemployment rate1 5.0 4.5 4.7 4.8 Previous 5.0 4.5 4.7 4.8 MEMO GDP gap2 .3 .7 .4 .2 Previous .2 .7 .3 .3
1. Percent, average for the fourth quarter. 2. Actual less potential GDP in the fourth quarter of the year indicated as a percent of potential GDP. A negative number thus indicates that the economy is operating below potential.

Domestic Developments Class II FOMC—Restricted (FR) I-13
Inflation Projections (Percent change, Q4 to Q4, except as noted)
Measure 2006
2007 H1
2007 H2
2008
PCE chain-weighted price index 1.9 3.9 2.1 1.8 Previous 1.9 3.9 1.9 2.0
Food and beverages 2.3 4.7 3.3 2.2 Previous 2.3 4.6 2.6 2.2
Energy -4.0 32.6 -.9 -1.6 Previous -3.7 33.3 -3.3 1.2
Excluding food and energy 2.3 1.9 2.1 2.0 Previous 2.2 1.9 2.2 2.0
Consumer price index 1.9 4.9 2.2 1.9 Previous 1.9 4.9 1.9 2.2
Excluding food and energy 2.7 2.1 2.4 2.2 Previous 2.7 2.1 2.4 2.2
GDP chain-weighted price index 2.7 3.5 1.8 2.2 Previous 2.5 3.5 1.6 2.2
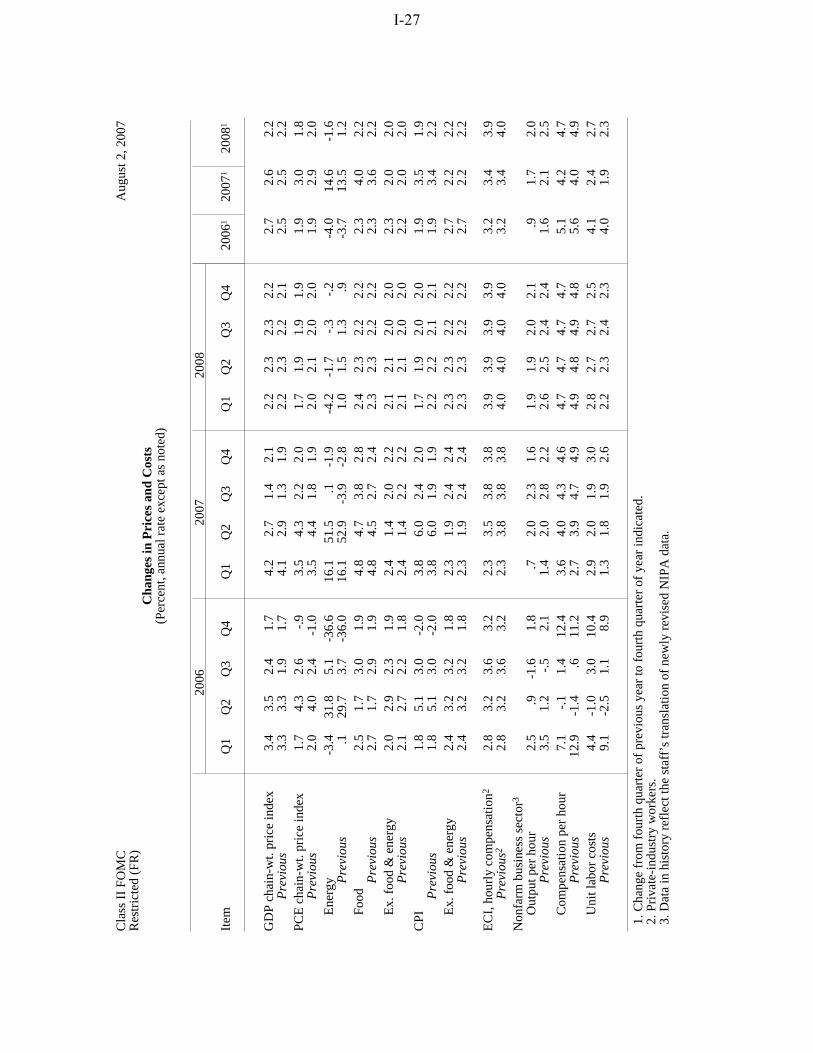
ECI for compensation of private industry workers1 3.2 2.9 3.8 3.9 Previous 3.2 3.1 3.8 4.0
Compensation per hour, nonfarm business sector 5.1 3.8 4.5 4.7 Previous 5.6 3.3 4.8 4.9
Prices of core nonfuel imports 2.4 3.1 3.6 1.6 Previous 2.7 3.7 3.3 1.6
1. December to December. project productivity growth to move up from an annual rate of about 1½ percent in the first half of 2007 to an annual rate of about 2 percent over the next year and a half. We anticipate that increases in private employment will average about [65,000] per month over the forecast period, down from an average of [115,000] per month over the first half of this year. This pace of hiring causes the unemployment rate to edge up over the projection period, reaching 4¾ percent by the end of 2008. Prices and wages. We project core PCE prices to rise to an annual rate of 2.1 percent in the second half of 2007 and 2 percent in 2008. As noted previously, the low readings on core inflation over the past several months have persuaded us to revise down the projection for the second half of this year despite small adverse changes in several

I-14 Class II FOMC—Restricted (FR) Part 1: Summary and Outlook, August 2, 2007
underlying factors—including slightly greater contributions from import and energy prices and the downward revision to structural productivity—that are not significant enough for us to mark up our inflation forecast. Headline PCE inflation is expected to slow from an annual rate of about 4 percent in the first half of this year to an annual rate of 2.1 percent in the second half as food prices decelerate and energy prices flatten out and eventually edge down. In 2008, PCE inflation is projected to move down to 1.8 percent, as energy prices turn down and as food prices rise roughly in line with core prices. Our projection for gains in compensation per hour in the nonfarm business sector rises from 4¼ percent this year to 4¾ percent next year. This year’s increase is held down by the reversal of large bonuses and stock option exercises that BEA estimates to have accrued in late 2006, and we expect hourly compensation gains in 2008 to move up to a pace more in line with what would be expected in light of past headline inflation and productivity gains. Increases in the ECI have been lower than expected, and we project this measure of compensation inflation to step up from 3½ percent this year to 4 percent next year. Financial Flows and Conditions After having risen at an estimated annual rate of 6¾ percent over the first half of this year, domestic nonfinancial debt is projected to decelerate to a 6 percent rate of increase in the second half of this year and to a 5¼ percent rise in 2008, with all sectors except the federal government expected to contribute to the deceleration. Household debt growth has slowed considerably over the past year, reflecting the sharp slowdown in home-price appreciation, reduced residential construction, and higher interest rates. Our forecast calls for a further tapering off of household borrowing, as the housing market remains weak and mortgage rates edge up further. The 4½ percent increase in household debt anticipated for 2008 would be the slowest pace since 1991. Amid a significant rise in delinquency rates on subprime variable-rate mortgages, some large originators of these loans have announced changes to their programs that will likely curtail lending in this market. However, we expect credit to remain available to the large majority of households, whose credit quality has remained strong. All told, we see mortgage debt increasing at an annual rate of 4¾ percent in the second half of this year and 4½ percent next year.

Domestic Developments Class II FOMC—Restricted (FR) I-15
Nonfinancial business debt is estimated to have expanded at a robust annual rate of 10¾ percent in the second quarter as credit spreads narrowed to very low levels and lending terms were attractive. However, debt issuance has slowed considerably in recent weeks because investors have become unwilling to extend credit to risky borrowers on such accommodative terms. We expect that market participants will come to a consensus about risk pricing that will allow issuance to increase gradually from its current low. Nonetheless, we expect debt growth to slow to 6½ percent in 2008 as larger spreads and tighter terms trim corporate borrowing and the pace of mergers, acquisitions, and share repurchases subsides. With the unified budget deficit expected to remain close to recent levels, federal government debt is expected to increase at a moderate pace of about 4½ percent this year and next. Meanwhile, reduced opportunities for advance refunding amid higher interest rates are expected to slow the growth of state and local government debt from an annual rate of 10 percent in the first half of 2007 to 7½ percent in 2008. After having expanded at a robust annual rate of nearly 7 percent in the first half of 2007, M2 growth has slowed markedly in recent weeks and is projected to remain moderate over the second half of 2007. With opportunity costs projected to decline gradually over the projection period, we anticipate growth of M2 in the neighborhood of 4½ percent in 2008—just a bit faster than the pace of nominal GDP. Alternative Simulations In this section, we evaluate alternatives to the staff forecast using simulations of the FRB/US model. The first scenario assumes that the downturn in both prices and production in the housing market will prove more severe than in the baseline and focuses on the implications for aggregate activity from standard wealth and multiplier effects. The next two scenarios build on the first and examine the implications of additional spillovers from the housing contraction to consumer confidence and to perceptions of risk in financial markets. The fourth simulation examines an upside risk to aggregate demand, namely the possibility that we have overestimated the desire of households to build savings. As usual, the changes in aggregate demand in the first four simulations have little effect on inflation over the next year and a half, although, in certain of these simulations, a more substantial effect would emerge in 2009.2 The next two simulations
2 Aggregate demand shocks have little effect on inflation in FRB/US because changes in slack have
only modest price effects in the short run as long as monetary policy responds as it has historically. Such

I-16 Class II FOMC—Restricted (FR) Part 1: Summary and Outlook, August 2, 2007
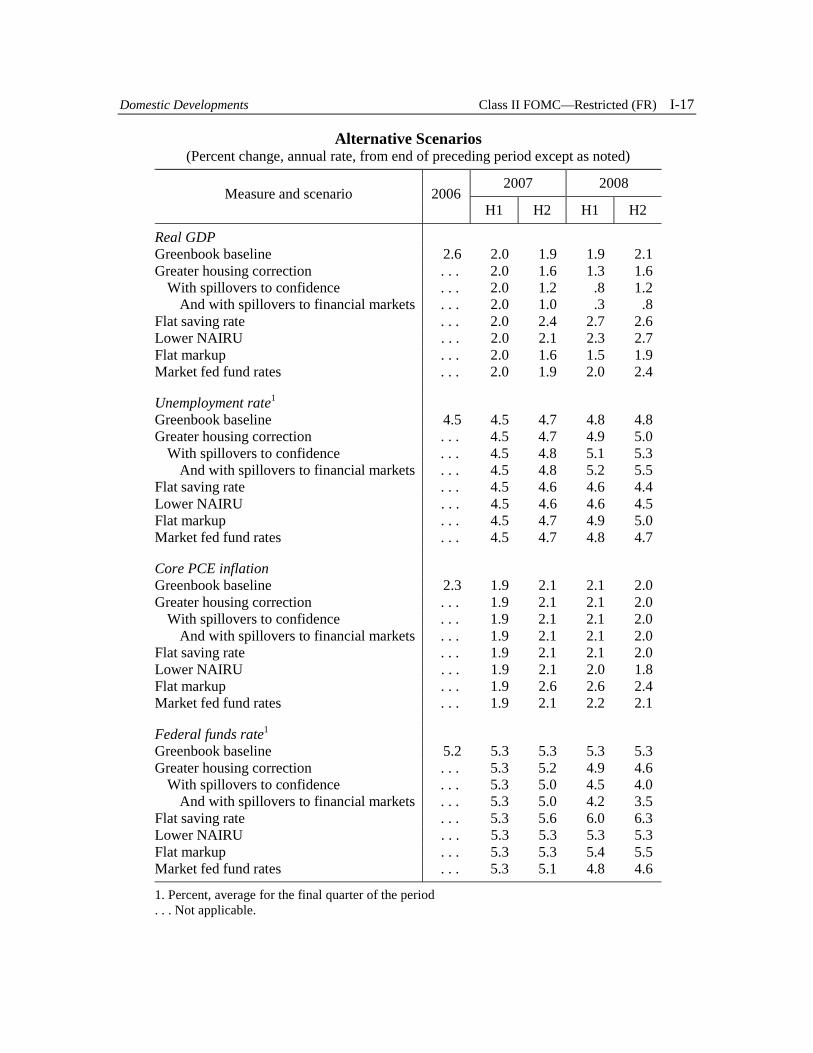
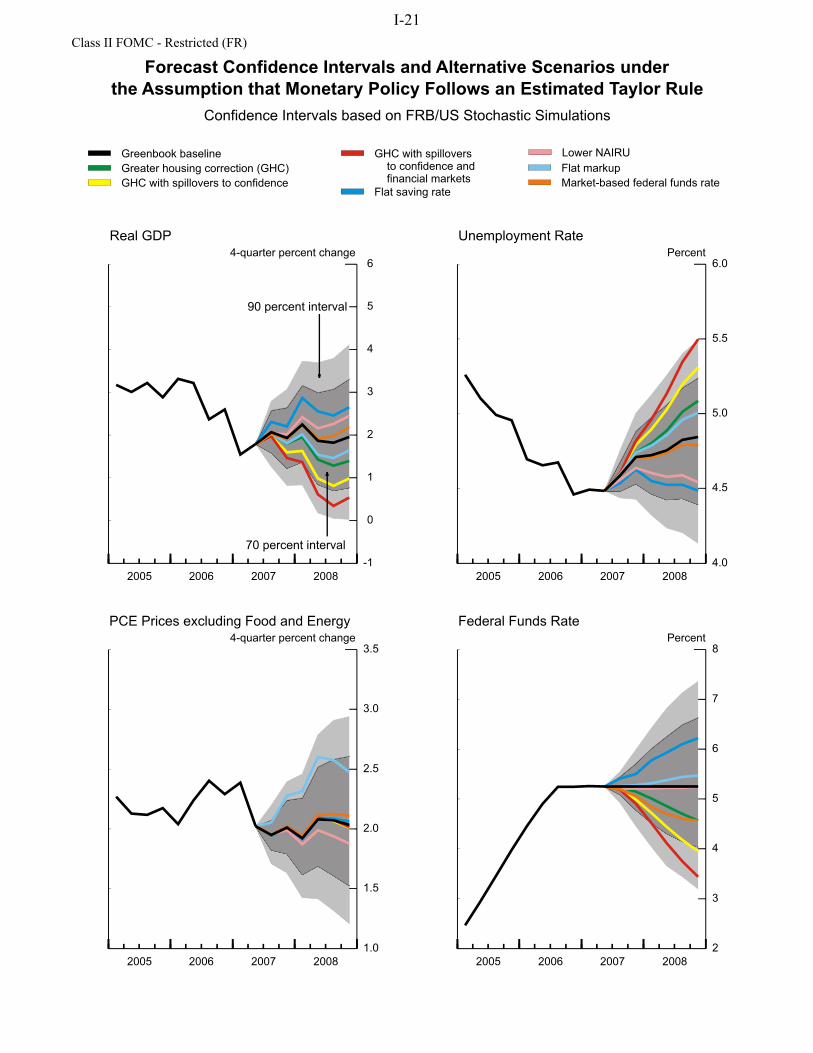
consider two opposing risks to inflation: first, the downside risk from a lower NAIRU; and second, the upside risk from firms attempting to maintain profit margins. In all these scenarios, we assume that monetary policy responds to the change in the outlook as indicated by an estimated version of the Taylor rule. In the final scenario, we assume that monetary policy follows the path implied by quotes from the futures market. Greater housing correction. The baseline forecast for the housing market could be too optimistic: The pace of home sales may fall further, builders may cut back on new construction more than we expect in an attempt to reduce their backlogs more quickly, and home prices may decline appreciably rather than merely edge down as in the baseline forecast. In this scenario, sales fall more and production adjusts more quickly than in the baseline. Thus, the level of real residential investment falls 10 percent below baseline by the middle of 2008. In addition, home prices fall 10 percent in nominal terms both this year and next, lowering household net worth $4 trillion relative to baseline and eliminating most of the current overvaluation in the housing market that is suggested by some of the models we follow. The reductions in employment and income implied by the falloff in construction activity, combined with the loss in wealth, directly damp consumer spending and indirectly depress business investment. As a result, real GDP rises only 1½ percent next year, causing the unemployment rate to move above 5 percent by late 2008; unemployment would rise further in 2009. In response to weaker real activity, the federal funds rate falls to 4½ percent by late next year. Greater housing correction with spillovers to confidence. The previous scenario focuses on the traditional channels to aggregate activity through lower wealth and multiplier effects. However, because of the historically large decline in nominal house prices assumed in the first scenario, consumer confidence may fall by a larger amount than would normally be associated with reductions in income and wealth of this magnitude. This simulation assumes that such a deterioration in consumer sentiment results in a greater reluctance to spend by households and thus induces at least some of the “spillover” that some analysts have been expecting from the housing situation but which has not yet materialized. With the deterioration in confidence, the saving rate rises a bit more than ½ percentage point above baseline by the end of next year. As a result, real GDP increases only 1 percent in 2008, and the unemployment rate rises above 5¼ percent by the end of the same year. Despite monetary policy actions that bring the
policy responses serve to keep inflation expectations well anchored. They also lead to movements in the dollar, and thus in import prices, that help to moderate the overall price response.
Domestic Developments Class II FOMC—Restricted (FR) I-17
Alternative Scenarios (Percent change, annual rate, from end of preceding period except as noted)
2007 2008 Measure and scenario 2006
H1 H2 H1 H2
Real GDP Greenbook baseline 2.6 2.0 1.9 1.9 2.1 Greater housing correction . . . 2.0 1.6 1.3 1.6 With spillovers to confidence . . . 2.0 1.2 .8 1.2 And with spillovers to financial markets . . . 2.0 1.0 .3 .8 Flat saving rate . . . 2.0 2.4 2.7 2.6 Lower NAIRU . . . 2.0 2.1 2.3 2.7 Flat markup . . . 2.0 1.6 1.5 1.9 Market fed fund rates . . . 2.0 1.9 2.0 2.4
Unemployment rate1 Greenbook baseline 4.5 4.5 4.7 4.8 4.8 Greater housing correction . . . 4.5 4.7 4.9 5.0 With spillovers to confidence . . . 4.5 4.8 5.1 5.3 And with spillovers to financial markets . . . 4.5 4.8 5.2 5.5 Flat saving rate . . . 4.5 4.6 4.6 4.4 Lower NAIRU . . . 4.5 4.6 4.6 4.5 Flat markup . . . 4.5 4.7 4.9 5.0 Market fed fund rates . . . 4.5 4.7 4.8 4.7
Core PCE inflation Greenbook baseline 2.3 1.9 2.1 2.1 2.0 Greater housing correction . . . 1.9 2.1 2.1 2.0 With spillovers to confidence . . . 1.9 2.1 2.1 2.0 And with spillovers to financial markets . . . 1.9 2.1 2.1 2.0 Flat saving rate . . . 1.9 2.1 2.1 2.0 Lower NAIRU . . . 1.9 2.1 2.0 1.8 Flat markup . . . 1.9 2.6 2.6 2.4 Market fed fund rates . . . 1.9 2.1 2.2 2.1
Federal funds rate1 Greenbook baseline 5.2 5.3 5.3 5.3 5.3 Greater housing correction . . . 5.3 5.2 4.9 4.6 With spillovers to confidence . . . 5.3 5.0 4.5 4.0 And with spillovers to financial markets . . . 5.3 5.0 4.2 3.5 Flat saving rate . . . 5.3 5.6 6.0 6.3 Lower NAIRU . . . 5.3 5.3 5.3 5.3 Flat markup . . . 5.3 5.3 5.4 5.5 Market fed fund rates . . . 5.3 5.1 4.8 4.6
1. Percent, average for the final quarter of the period . . . Not applicable.

I-18 Class II FOMC—Restricted (FR) Part 1: Summary and Outlook, August 2, 2007
federal funds rate to 4 percent by the end of 2008, the unemployment rate would rise further in 2009. Greater housing correction with spillovers to confidence and financial markets. A greater housing correction could have even more severe effects on the economy if financial market participants become more concerned about the risks associated with bonds and equities, a possibility that appears especially relevant given recent market volatility. This simulation builds on the previous one by assuming that investors respond to the deterioration in macroeconomic performance by boosting risk premiums relative to the Greenbook baseline. This reassessment of risk causes the spread on Baa corporate bonds over comparable Treasury securities to widen 1 percentage point by the end of the summer, an increase over and above the 25 basis points we have built into the baseline since the June Greenbook. In addition, equity prices decline more than 10 percent relative to baseline over the same period. Higher borrowing costs and the reduction in wealth lead to further weakness in aggregate spending. As a result, real GDP growth slows to ½ percent in 2008, and the unemployment rate rises to 5½ percent by late next year. The decline in the federal funds rate, to 3½ percent by late 2008, pulls the yield on the ten-year Treasury about 50 basis points below baseline, tempering the increase in yields on private securities. Nonetheless, the unemployment rate would rise a bit more through 2009. Flat saving rate. The NIPA revision left our estimate of the personal saving rate in the second quarter at just above ½ percent, more than 2 percentage points above the June Greenbook estimate. In the baseline, we continue to assume that households will boost saving over the projection period, albeit by less than previously. In this scenario, we instead assume that households maintain the personal saving rate at its second-quarter level through 2008. The additional spending boosts real GDP growth above 2½ percent in 2008, and the unemployment rate edges below 4½ percent by late next year. The increase in the federal funds rate, to 6¼ percent by late next year, helps to slow real GDP growth to its trend rate of just above 2 percent in 2009. Lower NAIRU. Hourly compensation gains have remained moderate despite high headline inflation and a labor market that, by the staff’s estimate, is fairly tight—raising the possibility that we are overstating the degree of tightness in the labor market. In this scenario, we assume that the NAIRU gradually declined to 4¼ percent over the past few years rather than having held steady at 5 percent as in the baseline. The slack in resource utilization allows core PCE inflation to fall to 1¾ percent by the end of next year. Real

Domestic Developments Class II FOMC—Restricted (FR) I-19
GDP growth picks up to 2½ percent in 2008 as households and firms shift their spending into better alignment with the higher levels of permanent income and potential output implied by a lower NAIRU. The federal funds rate changes little from baseline because policymakers only slowly recognize the lower NAIRU. Flat markup. The downward revision to our estimate of structural productivity growth has led to a more pronounced acceleration in trend unit labor costs and a somewhat more pronounced decline in firms’ markups than previously. However, the markup has been elevated for some time, perhaps reflecting structural factors: For example, structural change in labor markets, perhaps related to the integration of labor-rich countries into the global economy, may result in a persistently lower share of income accruing to labor and, accordingly, a persistently higher markup. In this simulation, we assume that markups remain near recent levels as the structural factors just cited exert downward pressure on wages and upward pressure on prices. Consequently, core inflation exceeds 2½ percent over the next four quarters and remains persistently above baseline throughout 2008. Higher inflation leads to tighter monetary policy; as a result, real activity is weaker next year. Market-based federal funds rate. Quotes from futures markets imply a path for the federal funds rate that is about 20 basis points below the staff’s assumed path at the end of 2007 and nearly 75 basis points below that path at the end of 2008. If the lower path were realized, the increased stimulus would boost real GDP growth to about 2¼ percent in 2008 and cause inflation to be a shade higher than in the baseline.

I-20 Class II FOMC—Restricted (FR) Part 1: Summary and Outlook, August 2, 2007
Selected Greenbook Projections and70 Percent Confidence Intervals Derived from
Historical Forecast Errors and FRB/US Simulations
Measure 2007 2008
Real GDP(percent change, Q4 to Q4)Projection 1.9 2.0Confidence interval
Greenbook forecast errors 1.2–2.7 .4–3.5FRB/US stochastic simulations 1.2–2.6 .8–3.3
Civilian unemployment rate(percent, Q4)Projection 4.7 4.8Confidence interval
Greenbook forecast errors 4.5–4.9 4.1–5.5FRB/US stochastic simulations 4.5–4.9 4.4–5.2
PCE pricesexcluding food and energy(percent change, Q4 to Q4)Projection 2.0 2.0Confidence interval
Greenbook forecast errors 1.7–2.3 1.3–2.7FRB/US stochastic simulations 1.8–2.2 1.5–2.6
Federal funds rate(percent, Q4)Projection 5.3 5.3Confidence interval
FRB/US stochastic simulations 4.8–5.7 4.0–6.6
Note. Shocks underlying FRB/US stochastic simulations arerandomly drawn from the 1986-2005 set of model equation residuals.Intervals derived fromGreenbook forecast errors are based on the1986-2005 set of Greenbook historical errors.
I-21

Class II FOMC - Restricted (FR)
Evolution of the Staff Forecast
1.5
2.0
2.5
3.0
3.5
4.0
1.5
2.0
2.5
3.0
3.5
4.0
Percent, Q4/Q4
1/26 3/16 4/28 6/22 8/4 9/14 10/26 12/7 1/25 3/22 5/3 6/21 8/3 9/13 10/18 12/6 1/24 3/14 5/2 6/20 8/2 9/12 10/24 12/5
2006
2007 2008
Greenbook publication date 2005 2006 2007
Change in Real GDP
4.4
4.6
4.8
5.0
5.2
5.4
5.6
4.4
4.6
4.8
5.0
5.2
5.4
5.6
Percent, fourth quarter
1/26 3/16 4/28 6/22 8/4 9/14 10/26 12/7 1/25 3/22 5/3 6/21 8/3 9/13 10/18 12/6 1/24 3/14 5/2 6/20 8/2 9/12 10/24 12/5
Greenbook publication date 2005 2006 2007
2006 2007
2008
Unemployment Rate
1.0
1.5
2.0
2.5
3.0
1.0
1.5
2.0
2.5
3.0
Percent, Q4/Q4
1/26 3/16 4/28 6/22 8/4 9/14 10/26 12/7 1/25 3/22 5/3 6/21 8/3 9/13 10/18 12/6 1/24 3/14 5/2 6/20 8/2 9/12 10/24 12/5
Greenbook publication date
2005 2006 2007
2006
2007
2008
Change in PCE Prices excluding Food and Energy
I-22

Cla
ss I
I FO
MC
Aug
ust 2
, 200
7R
estr
icte
d (F
R)
Cha
nges
in G
DP
, Pri
ces,
and
Une
mpl
oym
ent
(Per
cent
, ann
ual r
ate
exce
pt a
s no
ted)
Nom
inal
GD
P
R
eal G
DP
PC
E p
rice
inde
x
C
ore
PCE
pri
ce in
dex
Une
mpl
oym
ent r
ate1
Inte
rval
06/2
0/07
08/0
2/07
06/2
0/07
08/0
2/07
06/2
0/07
08/0
2/07
06/2
0/07
08/0
2/07
06/2
0/07
08/0
2/07
Qua
rter
ly20
06:Q
19.
08.
45.
64.
82.
01.
72.
12.
04.
74.
7
Q2
5.9
6.0
2.6
2.4
4.0
4.3
2.7
2.9
4.7
4.7
Q
33.
83.
42.
01.
12.
42.
62.
22.
34.
74.
7
Q4
4.1
3.8
2.5
2.1
-1.0
-.9
1.8
1.9
4.5
4.5
2007
:Q1
5.1
4.9
1.0
.63.
53.
52.
42.
44.
54.
5
Q2
6.0
6.2
3.0
3.4
4.4
4.3
1.4
1.4
4.5
4.5
Q
33.
83.
62.
52.
21.
82.
22.
22.
04.
64.
6
Q4
4.1
3.7
2.2
1.6
1.9
2.0
2.2
2.2
4.7
4.7
2008
:Q1
4.8
4.1
2.5
1.8
2.0
1.7
2.1
2.1
4.7
4.7
Q
24.
94.
22.
51.
92.
11.
92.
12.
14.
84.
8
Q3
4.7
4.3
2.5
2.0
2.0
1.9
2.0
2.0
4.8
4.8
Q
44.
64.
32.
52.
12.
01.
92.
02.
04.
84.
8
Tw
o-qu
arte
r2
2006
:Q2
7.5
7.2
4.1
3.6
3.0
3.0
2.4
2.5
-.3
-.3
Q
44.
03.
62.
21.
6.7
.82.
02.
1-.
2-.
2
2007
:Q2
5.6
5.5
2.0
2.0
3.9
3.9
1.9
1.9
.0.0
Q
44.
03.
72.
31.
91.
92.
12.
22.
1.2
.2
2008
:Q2
4.8
4.2
2.5
1.9
2.0
1.8
2.1
2.1
.1.1
Q
44.
74.
32.
52.
12.
01.
92.
02.
0.0
.0
Fou
r-qu
arte
r3
2005
:Q4
6.4
6.3
3.1
2.9
3.1
3.2
2.1
2.2
-.4
-.4
2006
:Q4
5.7
5.4
3.1
2.6
1.9
1.9
2.2
2.3
-.5
-.5
2007
:Q4
4.8
4.6
2.2
1.9
2.9
3.0
2.0
2.0
.2.2
2008
:Q4
4.8
4.2
2.5
2.0
2.0
1.8
2.0
2.0
.2.1
Ann
ual
2005
6.3
6.4
3.2
3.1
2.9
2.9
2.1
2.2
5.1
5.1
2006
6.3
6.1
3.3
2.9
2.7
2.8
2.2
2.2
4.6
4.6
2007
4.8
4.6
2.1
1.8
2.4
2.5
2.0
2.1
4.6
4.6
2008
4.6
4.2
2.5
2.0
2.1
2.0
2.0
2.0
4.8
4.8
1. L
evel
, exc
ept f
or tw
o-qu
arte
r an
d fo
ur-q
uart
er in
terv
als.
2. P
erce
nt c
hang
e fr
om tw
o qu
arte
rs e
arlie
r; f
or u
nem
ploy
men
t rat
e, c
hang
e is
in p
erce
ntag
e po
ints
. 3
. Per
cent
cha
nge
from
fou
r qu
arte
rs e
arlie
r; f
or u
nem
ploy
men
t rat
e, c
hang
e is
in p
erce
ntag
e po
ints
.
I-23

Cla
ss I
I FO
MC
Aug
ust 2
, 200
7R
estr
icte
d (F
R)
Cha
nges
in R
eal G
ross
Dom
esti
c P
rodu
ct a
nd R
elat
ed I
tem
s(P
erce
nt, a
nnua
l rat
e ex
cept
as
note
d)
2
006
20
07
200
8
Item
Q1
Q2
Q3
Q4
Q1
Q2
Q3
Q4
Q1
Q2
Q3
Q4
2006
1 20
071
2008
1
Rea
l GD
P
4.8
2.4
1.1
2.1
.6
3.4
2.2
1.6
1.
81.
92.
02.
1
2.6
1.9
2.0
Pre
viou
s
5.6
2.6
2.0
2.5
1.
03.
02.
52.
2
2.5
2.5
2.5
2.5
3.
12.
22.
5
Fina
l sal
es
5.4
2.0
1.0
3.5
1.
33.
31.
81.
2
1.3
2.7
2.3
1.9
3.
01.
92.
1P
revi
ous
5.
62.
11.
93.
7
1.9
2.7
2.2
1.6
2.
03.
42.
82.
3
3.3
2.1
2.6
Priv
. dom
. fin
al p
urch
.
5.1
1.6
1.3
1.8
2.
21.
5.7
.9
1.2
1.8
2.2
2.2
2.
41.
31.
9P
revi
ous
5.
51.
82.
11.
6
2.8
.91.
31.
5
2.2
2.6
2.8
2.8
2.
71.
62.
6
Pers
onal
con
s. e
xpen
d.
4.4
2.4
2.8
3.9
3.
71.
32.
01.
9
2.0
2.0
2.0
2.0
3.
42.
22.
0P
revi
ous
4.
82.
62.
84.
2
4.3
1.6
2.3
2.3
2.
52.
52.
62.
5
3.6
2.6
2.5
Dur
able
s
16.6
.85.
63.
9
8.8
1.6
.43.
1
3.3
2.4
2.3
2.4
6.
63.
52.
6N
ondu
rabl
es
4.5
2.3
3.2
4.3
3.
0-.
82.
71.
9
2.1
2.0
2.0
2.0
3.
61.
72.
0Se
rvic
es
2.1
2.7
2.0
3.7
3.
12.
21.
91.
7
1.8
1.9
2.0
2.0
2.
62.
21.
9
Res
iden
tial i
nves
tmen
t
-.7
-11.
7-2
0.4
-17.
2
-16.
3-1
0.4
-19.
6-2
1.3
-1
5.9
-4.5
2.1
3.4
-1
2.8
-17.
0-4
.0P
revi
ous
-.
3-1
1.1
-18.
7-1
9.8
-1
5.8
-12.
2-1
8.3
-15.
0
-9.5
-1.3
2.0
4.1
-1
2.8
-15.
4-1
.3
Bus
ines
s fi
xed
inve
st.
13
.34.
25.
1-1
.4
2.1
9.6
2.4
4.4
3.
33.
13.
13.
0
5.2
4.6
3.1
Pre
viou
s
13.7
4.4
10.0
-3.1
3.
32.
84.
43.
6
5.2
4.8
4.5
3.9
6.
13.
64.
6E
quip
men
t & s
oftw
are
13
.0-.
12.
9-4
.9
.32.
72.
85.
0
4.1
3.7
3.8
3.9
2.
52.
73.
8P
revi
ous
15
.6-1
.47.
7-4
.8
2.8
-.2
5.3
4.0
5.
85.
75.
85.
6
4.0
2.9
5.7
Non
res.
str
uctu
res
15
.016
.410
.87.
4
6.4
26.6
1.4
3.2
1.
61.
81.
51.
1
12.3
9.0
1.5
Pre
viou
s
8.7
20.3
15.7
.8
4.7
10.0
2.6
2.8
3.
82.
91.
7.4
11
.25.
02.
2
Net
exp
orts
2
-640
-627
-634
-597
-6
12-5
81-5
65-5
66
-569
-544
-538
-544
-6
24-5
81-5
49P
revi
ous2
-6
37-6
24-6
29-5
83
-604
-574
-564
-570
-5
79-5
57-5
55-5
64
-618
-578
-564
Exp
orts
11
.55.
75.
714
.3
1.1
5.6
6.3
6.1
5.
95.
85.
75.
6
9.3
4.8
5.8
Impo
rts
6.
9.9
5.4
1.6
3.
9-2
.41.
04.
5
4.8
-.9
2.9
5.4
3.
71.
73.
0
Gov
t. co
ns. &
inve
st.
4.
91.
0.8
3.5
-.
54.
53.
22.
7
1.8
1.7
1.4
1.3
2.
52.
51.
5P
revi
ous
4.
9.8
1.7
3.4
1.
04.
73.
42.
9
2.2
2.1
1.7
1.7
2.
73.
01.
9Fe
dera
l
8.4
-1.6
.97.
3
-6.3
6.7
5.2
4.3
1.
81.
61.
61.
5
3.7
2.3
1.6
Def
ense
6.
82.
3-1
.516
.9
-10.
89.
57.
55.
9
2.7
2.4
2.4
2.1
5.
92.
72.
4N
onde
fens
e
11.9
-8.8
6.0
-10.
0
3.8
1.3
.6.8
.0
.0.0
.1
-.7
1.6
.0St
ate
& lo
cal
2.
92.
5.7
1.3
3.
03.
32.
11.
9
1.8
1.8
1.2
1.2
1.
82.
61.
5
Cha
nge
in b
us. i
nven
tori
es2
38
5154
17
05
1525
41
178
13
4011
20P
revi
ous2
41
5455
22
-26
1632
47
2315
21
4313
27N
onfa
rm2
38
5858
14
-6-1
1424
41
167
12
428
19Fa
rm2
1
-5-3
4
54
11
1
11
1
-13
1
1. C
hang
e fr
om f
ourt
h qu
arte
r of
pre
viou
s ye
ar to
fou
rth
quar
ter
of y
ear
indi
cate
d. 2
. Bill
ions
of
chai
ned
(200
0) d
olla
rs.
I-24

Cla
ss I
I FO
MC
Aug
ust 2
, 200
7R
estr
icte
d (F
R)
Cha
nges
in R
eal G
ross
Dom
esti
c P
rodu
ct a
nd R
elat
ed I
tem
s(P
erce
nt, a
nnua
l rat
e ex
cept
as
note
d)
Item
2000
1
20
011
2002
1
20
031
2004
1
20
051
2006
1
20
071
2008
1
Rea
l GD
P
2.2
.21.
93.
73.
12.
92.
61.
92.
0P
revi
ous
2.
2.2
1.9
3.7
3.4
3.1
3.1
2.2
2.5
Fina
l sal
es
2.9
1.5
.83.
72.
82.
93.
01.
92.
1P
revi
ous
2.
91.
5.8
3.7
3.1
3.2
3.3
2.1
2.6
Priv
. dom
. fin
al p
urch
.
4.3
1.0
1.1
4.1
4.3
3.3
2.4
1.3
1.9
Pre
viou
s
4.3
1.0
1.1
4.1
4.4
3.6
2.7
1.6
2.6
Pers
onal
con
s. e
xpen
d.
4.1
2.8
1.9
3.4
3.7
2.8
3.4
2.2
2.0
Pre
viou
s
4.1
2.8
1.9
3.4
4.0
2.9
3.6
2.6
2.5
Dur
able
s
4.7
10.8
1.2
8.3
5.6
1.2
6.6
3.5
2.6
Non
dura
bles
3.
01.
92.
13.
93.
53.
63.
61.
72.
0Se
rvic
es
4.5
1.6
1.9
2.2
3.3
2.7
2.6
2.2
1.9
Res
iden
tial i
nves
tmen
t
-1.9
1.4
7.0
11.7
6.7
6.4
-12.
8-1
7.0
-4.0
Pre
viou
s
-1.9
1.4
7.0
11.7
6.1
9.0
-12.
8-1
5.4
-1.3
Bus
ines
s fi
xed
inve
st.
7.
8-9
.6-6
.54.
97.
55.
15.
24.
63.
1P
revi
ous
7.
8-9
.6-6
.54.
96.
95.
66.
13.
64.
6E
quip
men
t & s
oftw
are
7.
5-9
.0-3
.46.
69.
47.
12.
52.
73.
8P
revi
ous
7.
5-9
.0-3
.46.
68.
37.
04.
02.
95.
7N
onre
s. s
truc
ture
s
8.8
-11.
1-1
4.9
.22.
3-.
312
.39.
01.
5P
revi
ous
8.
8-1
1.1
-14.
9.2
2.7
1.8
11.2
5.0
2.2
Net
exp
orts
2
-379
-399
-471
-519
-594
-618
-624
-581
-549
Pre
viou
s2
-379
-399
-471
-519
-591
-619
-618
-578
-564
Exp
orts
6.
5-1
1.9
3.8
5.8
7.4
7.0
9.3
4.8
5.8
Impo
rts
11
.2-7
.69.
74.
811
.55.
13.
71.
73.
0
Gov
t. co
ns. &
inve
st.
.4
5.0
4.0
1.7
.7.9
2.5
2.5
1.5
Pre
viou
s
.45.
04.
01.
71.
11.
22.
73.
01.
9Fe
dera
l
-2.2
6.4
7.8
5.5
2.4
1.3
3.7
2.3
1.6
Def
ense
-3
.56.
58.
47.
52.
51.
15.
92.
72.
4N
onde
fens
e
.36.
36.
81.
92.
31.
9-.
71.
6.0
Stat
e &
loca
l
1.7
4.2
2.1
-.4
-.4
.71.
82.
61.
5
Cha
nge
in b
us. i
nven
tori
es2
56
-32
1214
5433
4011
20P
revi
ous2
56
-32
1214
5320
4313
27N
onfa
rm2
58
-32
1514
4834
428
19Fa
rm2
-1
0-2
06
-0-1
31
1. C
hang
e fr
om f
ourt
h qu
arte
r of
pre
viou
s ye
ar to
fou
rth
quar
ter
of y
ear
indi
cate
d. 2
. Bill
ions
of
chai
ned
(200
0) d
olla
rs.
I-25

Cla
ss I
I FO
MC
Aug
ust 2
, 200
7R
estr
icte
d (F
R)
Con
trib
utio
ns t
o C
hang
es in
Rea
l Gro
ss D
omes
tic
Pro
duct
(Per
cent
age
poin
ts, a
nnua
l rat
e ex
cept
as
note
d)
2
006
200
7
20
08
Item
Q1
Q2
Q3
Q4
Q1
Q2
Q3
Q4
Q1
Q2
Q3
Q4
2006
1 20
071
2008
1
Rea
l GD
P
4.8
2.4
1.1
2.1
.6
3.4
2.2
1.6
1.
81.
92.
02.
1
2.6
1.9
2.0
Pre
viou
s
5.6
2.6
2.0
2.5
1.
03.
02.
52.
2
2.5
2.5
2.5
2.5
3.
12.
22.
5
Fina
l sal
es
5.3
2.0
1.0
3.4
1.
33.
31.
81.
2
1.3
2.7
2.3
1.9
2.
91.
92.
1P
revi
ous
5.
62.
11.
93.
6
1.9
2.7
2.2
1.6
2.
03.
42.
82.
3
3.3
2.1
2.6
Priv
. dom
. fin
al p
urch
.
4.4
1.4
1.1
1.5
1.
91.
3.6
.7
1.0
1.5
1.8
1.9
2.
11.
11.
6P
revi
ous
4.
71.
51.
81.
4
2.4
.81.
21.
3
1.9
2.2
2.4
2.4
2.
31.
42.
2
Pers
onal
con
s. e
xpen
d.
3.0
1.6
1.9
2.7
2.
6.9
1.4
1.4
1.
41.
41.
41.
4
2.3
1.6
1.4
Pre
viou
s
3.4
1.8
2.0
2.9
3.
01.
21.
61.
6
1.8
1.8
1.8
1.8
2.
51.
91.
8D
urab
les
1.
2.1
.4.3
.7
.1.0
.2
.2.2
.2.2
.5
.3.2
Non
dura
bles
.9
.5.6
.9
.6-.
2.6
.4
.4.4
.4.4
.7
.3.4
Serv
ices
.9
1.1
.81.
5
1.3
.9.8
.7
.8.8
.8.9
1.
1.9
.8
Res
iden
tial i
nves
tmen
t
-.1
-.8
-1.3
-1.0
-.
9-.
5-1
.0-1
.1
-.7
-.2
.1.1
-.
8-.
9-.
2P
revi
ous
.0
-.7
-1.2
-1.2
-.
9-.
6-1
.0-.
7
-.4
-.1
.1.2
-.
8-.
8-.
1
Bus
ines
s fi
xed
inve
st.
1.
3.4
.5-.
2
.21.
0.3
.5
.3.3
.3.3
.5
.5.3
Pre
viou
s
1.4
.51.
0-.
3
.3.3
.5.4
.5
.5.5
.4
.6.4
.5E
quip
men
t & s
oftw
are
.9
.0.2
-.4
.0
.2.2
.4
.3.3
.3.3
.2
.2.3
Pre
viou
s
1.1
-.1
.6-.
4
.2.0
.4.3
.4
.4.4
.4
.3.2
.4N
onre
s. s
truc
ture
s
.4.5
.3.2
.2
.8.0
.1
.1.1
.1.0
.4
.3.1
Pre
viou
s
.3.6
.5.0
.1
.3.1
.1
.1.1
.1.0
.3
.2.1
Net
exp
orts
.1
.5-.
31.
3
-.5
1.0
.5-.
1
-.1
.8.2
-.2
.4
.3.2
Pre
viou
s
.0.4
-.2
1.6
-.
71.
0.3
-.2
-.
3.7
.1-.
4
.5.1
.0E
xpor
ts
1.2
.6.6
1.5
.1
.6.7
.7
.7.7
.7.7
1.
0.5
.7Im
port
s
-1.1
-.1
-.9
-.3
-.
6.4
-.2
-.8
-.
8.2
-.5
-.9
-.
6-.
3-.
5
Gov
t. co
ns. &
inve
st.
.9
.2.1
.7
-.1
.9.6
.5
.4.3
.3.3
.5
.5.3
Pre
viou
s
.9.2
.3.6
.2
.9.7
.6
.4.4
.3.3
.5
.6.4
Fede
ral
.6
-.1
.1.5
-.
5.5
.4.3
.1
.1.1
.1
.3.2
.1D
efen
se
.3.1
-.1
.7
-.5
.4.3
.3
.1.1
.1.1
.3
.1.1
Non
defe
nse
.3
-.2
.1-.
2
.1.0
.0.0
.0
.0.0
.0
.0.0
.0St
ate
& lo
cal
.4
.3.1
.2
.4.4
.3.2
.2
.2.2
.2
.2.3
.2
Cha
nge
in b
us. i
nven
tori
es
-.5
.5.1
-1.3
-.
7.2
.4.4
.6
-.8
-.3
.2
-.3
.1-.
1P
revi
ous
.0
.4.1
-1.2
-.
9.3
.3.6
.5
-.8
-.3
.2
-.2
.1-.
1N
onfa
rm
-.5
.7.0
-1.6
-.
7.2
.5.4
.6
-.8
-.3
.2
-.3
.1-.
1Fa
rm
.0-.
2.1
.3
.0.0
-.1
.0
.0.0
.0.0
.0
.0.0
1. C
hang
e fr
om f
ourt
h qu
arte
r of
pre
viou
s ye
ar to
fou
rth
quar
ter
of y
ear
indi
cate
d.
I-26
Cla
ss I
I FO
MC
Aug
ust 2
, 200
7R
estr
icte
d (F
R)
Cha
nges
in P
rice
s an
d C
osts
(Per
cent
, ann
ual r
ate
exce
pt a
s no
ted)
2006
200
7
20
08
Item
Q1
Q2
Q3
Q4
Q1
Q2
Q3
Q4
Q1
Q2
Q3
Q4
2006
1 20
071
2008
1
GD
P ch
ain-
wt.
pric
e in
dex
3.4
3.5
2.4
1.7
4.2
2.7
1.4
2.1
2.2
2.3
2.3
2.2
2.7
2.6
2.2
Pre
viou
s3.
33.
31.
91.
74.
12.
91.
31.
92.
22.
32.
22.
12.
52.
52.
2PC
E c
hain
-wt.
pric
e in
dex
1.7
4.3
2.6
-.9
3.5
4.3
2.2
2.0
1.7
1.9
1.9
1.9
1.9
3.0
1.8
Pre
viou
s2.
04.
02.
4-1
.03.
54.
41.
81.
92.
02.
12.
02.
01.
92.
92.
0E
nerg
y-3
.431
.85.
1-3
6.6
16.1
51.5
.1-1
.9-4
.2-1
.7-.
3-.
2-4
.014
.6-1
.6P
revi
ous
.129
.73.
7-3
6.0
16.1
52.9
-3.9
-2.8
1.0
1.5
1.3
.9-3
.713
.51.
2Fo
od2.
51.
73.
01.
94.
84.
73.
82.
82.
42.
32.
22.
22.
34.
02.
2P
revi
ous
2.7
1.7
2.9
1.9
4.8
4.5
2.7
2.4
2.3
2.3
2.2
2.2
2.3
3.6
2.2
Ex.
foo
d &
ene
rgy
2.0
2.9
2.3
1.9
2.4
1.4
2.0
2.2
2.1
2.1
2.0
2.0
2.3
2.0
2.0
Pre
viou
s2.
12.
72.
21.
82.
41.
42.
22.
22.
12.
12.
02.
02.
22.
02.
0C
PI1.
85.
13.
0-2
.03.
86.
02.
42.
01.
71.
92.
02.
01.
93.
51.
9P
revi
ous
1.8
5.1
3.0
-2.0
3.8
6.0
1.9
1.9
2.2
2.2
2.1
2.1
1.9
3.4
2.2
Ex.
foo
d &
ene
rgy
2.4
3.2
3.2
1.8
2.3
1.9
2.4
2.4
2.3
2.3
2.2
2.2
2.7
2.2
2.2
Pre
viou
s2.
43.
23.
21.
82.
31.
92.
42.
42.
32.
32.
22.
22.
72.
22.
2
EC
I, h
ourl
y co
mpe
nsat
ion2
2.8
3.2
3.6
3.2
2.3
3.5
3.8
3.8
3.9
3.9
3.9
3.9
3.2
3.4
3.9
Pre
viou
s22.
83.
23.
63.
22.
33.
83.
83.
84.
04.
04.
04.
03.
23.
44.
0N
onfa
rm b
usin
ess
sect
or3
Out
put p
er h
our
2.5
.9-1
.61.
8.7
2.0
2.3
1.6
1.9
1.9
2.0
2.1
.91.
72.
0P
revi
ous
3.5
1.2
-.5
2.1
1.4
2.0
2.8
2.2
2.6
2.5
2.4
2.4
1.6
2.1
2.5
Com
pens
atio
n pe
r ho
ur7.
1-.
11.
412
.43.
64.
04.
34.
64.
74.
74.
74.
75.
14.
24.
7P
revi
ous
12.9
-1.4
.611
.22.
73.
94.
74.
94.
94.
84.
94.
85.
64.
04.
9U
nit l
abor
cos
ts4.
4-1
.03.
010
.42.
92.
01.
93.
02.
82.
72.
72.
54.
12.
42.
7P
revi
ous
9.1
-2.5
1.1
8.9
1.3
1.8
1.9
2.6
2.2
2.3
2.4
2.3
4.0
1.9
2.3
1. C
hang
e fr
om f
ourt
h qu
arte
r of
pre
viou
s ye
ar to
fou
rth
quar
ter
of y
ear
indi
cate
d. 2
. Pri
vate
-ind
ustr
y w
orke
rs.
3. D
ata
in h
isto
ry r
efle
ct th
e st
aff’
s tr
ansl
atio
n of
new
ly r
evis
ed N
IPA
dat
a.
I-27

Cla
ss I
I FO
MC
Aug
ust 2
, 200
7R
estr
icte
d (F
R)
Oth
er M
acro
econ
omic
Ind
icat
ors
20
06
200
7
200
8
Item
Q1
Q2
Q3
Q4
Q1
Q2
Q3
Q4
Q1
Q2
Q3
Q4
2006
1 20
071
2008
1
Em
ploy
men
t and
pro
duct
ion
Non
farm
pay
roll
empl
oym
ent2
.7.5
.5.5
.5.4
.4.2
.2.2
.3.2
2.3
1.5
.9U
nem
ploy
men
t rat
e34.
74.
74.
74.
54.
54.
54.
64.
74.
74.
84.
84.
84.
54.
74.
8P
revi
ous3
4.7
4.7
4.7
4.5
4.5
4.5
4.6
4.7
4.7
4.8
4.8
4.8
4.5
4.7
4.8
GD
P ga
p4.9
1.0
.7.7
.3.6
.6.4
.3.3
.2.2
.7.4
.2P
revi
ous4
.9.9
.7.7
.3.4
.4.3
.3.3
.3.3
.7.3
.3
Indu
stri
al p
rodu
ctio
n55.
06.
54.
0-1
.51.
12.
92.
92.
22.
32.
02.
53.
93.
52.
32.
7P
revi
ous5
5.0
6.5
4.0
-1.5
.82.
83.
22.
42.
82.
42.
94.
13.
52.
33.
1M
anuf
actu
ring
indu
str.
pro
d.5
5.5
5.5
4.4
-1.7
.83.
44.
41.
31.
72.
12.
73.
73.
42.
42.
5P
revi
ous5
5.5
5.5
4.4
-1.7
.73.
33.
62.
12.
52.
73.
13.
93.
42.
43.
1C
apac
ity u
tiliz
atio
n ra
te -
mfg
.380
.180
.680
.980
.179
.880
.180
.580
.480
.280
.180
.180
.380
.180
.480
.3P
revi
ous3
80.1
80.6
80.9
80.1
79.8
80.1
80.4
80.4
80.3
80.3
80.4
80.6
80.1
80.4
80.6
Hou
sing
sta
rts6
2.1
1.9
1.7
1.6
1.5
1.5
1.3
1.3
1.3
1.3
1.3
1.4
1.8
1.4
1.3
Lig
ht m
otor
veh
icle
sal
es6
16.8
16.4
16.5
16.3
16.4
16.0
15.8
16.1
16.3
16.3
16.3
16.3
16.5
16.1
16.3
Inco
me
and
savi
ngN
omin
al G
DP5
8.4
6.0
3.4
3.8
4.9
6.2
3.6
3.7
4.1
4.2
4.3
4.3
5.4
4.6
4.2
Rea
l dis
posa
ble
pers
. inc
ome5
4.9
.21.
76.
25.
9-.
82.
91.
93.
72.
22.
62.
63.
22.
52.
8P
revi
ous5
4.6
-1.5
3.2
6.4
4.6
-1.1
3.3
3.3
4.6
2.8
3.5
3.3
3.2
2.5
3.5
Pers
onal
sav
ing
rate
3.9
.3.0
.41.
1.6
.8.8
1.2
1.2
1.4
1.5
.4.8
1.5
Pre
viou
s3-.
3-1
.4-1
.4-.
9-.
8-1
.6-1
.4-1
.1-.
6-.
6-.
3-.
1-.
9-1
.1-.
1
Cor
pora
te p
rofi
ts7
32.5
16.8
4.4
-14.
54.
48.
3.0
-.9
-2.8
.21.
91.
18.
42.
9.1
Prof
it sh
are
of G
NP3
11.6
11.9
12.0
11.4
11.4
11.4
11.3
11.2
11.0
10.9
10.9
10.8
11.4
11.2
10.8
Net
fed
eral
sav
ing8
-220
-240
-239
-181
-210
-210
-241
-250
-301
-302
-305
-319
-220
-228
-307
Net
sta
te &
loca
l sav
ing8
3643
128
-67
-18
-22
-31
-25
-37
-40
25-1
0-3
3
Gro
ss n
atio
nal s
avin
g ra
te3
14.4
14.1
13.6
14.2
13.6
13.5
13.3
13.2
13.0
13.1
13.1
13.0
14.2
13.2
13.0
Net
nat
iona
l sav
ing
rate
32.
82.
31.
61.
81.
91.
51.
21.
1.9
.9.9
.91.
81.
1.9
1. C
hang
e fr
om f
ourt
h qu
arte
r of
pre
viou
s ye
ar to
fou
rth
quar
ter
of y
ear
indi
cate
d, u
nles
s ot
herw
ise
indi
cate
d. 2
. Cha
nge,
mill
ions
. 3
. Per
cent
, ann
ual v
alue
s ar
e fo
r th
e fo
urth
qua
rter
of
the
year
indi
cate
d. 4
. Per
cent
dif
fere
nce
betw
een
actu
al a
nd p
oten
tial G
DP;
a n
egat
ive
num
ber
indi
cate
s th
at th
e ec
onom
y is
ope
ratin
g be
low
pot
entia
l. (
In p
revi
ous
Gre
enbo
oks,
we
expr
esse
d th
e G
DP
gap
with
the
oppo
site
sig
n, s
o th
at a
pos
itive
num
ber
indi
cate
d th
at a
ctua
l out
put f
ell s
hort
of
pote
ntia
l.)
A
nnua
l val
ues
are
for
the
four
th q
uart
er o
f th
e ye
ar in
dica
ted.
5. P
erce
nt c
hang
e, a
nnua
l rat
e. 6
. Lev
el, m
illio
ns, a
nnua
l val
ues
are
annu
al a
vera
ges.
7. P
erce
nt c
hang
e, a
nnua
l rat
e, w
ith in
vent
ory
valu
atio
n an
d ca
pita
l con
sum
ptio
n ad
just
men
ts.
8. B
illio
ns o
f do
llars
, ann
ual v
alue
s ar
e an
nual
ave
rage
s.
I-28

Cla
ss I
I F
OM
CA
ugus
t 2,
200
7R
estr
icte
d (F
R)
Staf
f P
roje
ctio
ns o
f F
eder
al S
ecto
r A
ccou
nts
and
Rel
ated
Ite
ms
(Bill
ions
of
dolla
rs e
xcep
t as
note
d)
Fisc
al y
ear
2006
2007
2008
Item
2005
a20
06a
2007
2008
Q1a
Q2a
Q3a
Q4a
Q1a
Q2
Q3
Q4
Q1
Q2
Q3
Q4
Uni
fied
bud
get
Not
sea
sona
lly a
djus
ted
Rec
eipt
s121
5424
0725
6726
70
507
772
597
574
547
824
622
611
556
849
654
642
Out
lays
124
7226
5527
3228
95
691
676
639
654
725
687
665
723
733
723
716
758
Surp
lus/
defi
cit1
-318
-248
-165
-225
-1
8496
-42
-80
-178
137
-44
-112
-177
127
-63
-116
P
revi
ous
-3
18-2
48-1
70-2
29
-184
96-4
2-8
0-1
7813
0-4
2-1
03-2
0813
5-5
2-1
03
On-
budg
et
-494
-435
-355
-431
-2
1611
-60
-135
-212
53-5
9-1
82-2
0333
-78
-191
O
ff-b
udge
t
17
518
619
020
5
3285
1955
3485
1670
2694
1675
Mea
ns o
f fi
nanc
ing
B
orro
win
g
297
237
176
221
15
6-7
543
5915
2-1
1075
9815
2-9
767
111
C
ash
decr
ease
1-1
67
10
28-3
8-6
2125
-19
-20
1620
-26
010
O
ther
221
28-1
8-6
-1
165
01
-8-1
1-2
5-5
-5-5
Cas
h op
erat
ing
bala
nce,
end
of
peri
od
36
5245
35
846
5231
625
4529
935
3525
NIP
A f
eder
al s
ecto
r
Se
ason
ally
adj
uste
d an
nual
rat
es
Rec
eipt
s
21
8224
3726
3527
29
2437
2472
2513
2562
2628
2668
2682
2698
2716
2738
2764
2791
Exp
endi
ture
s
2511
2685
2846
3019
26
5627
1127
5227
4328
3828
7829
2429
4830
1730
4130
6931
10
Con
sum
ptio
n ex
pend
iture
s
759
798
843
898
80
580
781
382
683
085
186
587
889
790
491
292
0
D
efen
se
50
953
357
061
2
536
540
542
562
556
574
587
597
611
617
623
629
Non
defe
nse
25
026
627
328
6
269
267
271
265
274
276
278
280
286
288
289
291
O
ther
spe
ndin
g
1752
1887
2003
2121
18
5119
0519
3919
1720
0820
2720
5920
7021
2021
3621
5721
90C
urre
nt a
ccou
nt s
urpl
us
-3
29-2
48-2
11-2
90
-220
-240
-239
-181
-210
-210
-241
-250
-301
-302
-305
-319
Gro
ss in
vest
men
t
108
117
120
127
11
712
011
912
311
711
912
212
512
612
712
812
9G
ross
sav
ing
less
gro
ss
i
nves
tmen
t3-3
39-2
62-2
22-3
03
-233
-255
-252
-197
-218
-219
-254
-264
-315
-315
-318
-331
Fis
cal i
ndic
ator
s4H
igh-
empl
oym
ent (
HE
B)
sur
plus
/def
icit
-3
37-2
92-2
51-3
19
-268
-296
-284
-232
-242
-249
-283
-286
-332
-329
-328
-340
Cha
nge
in H
EB
, per
cent
of
pote
ntia
l GD
P
-0
.3-0
.5-0
.40.
4
-0.4
0.2
-0.1
-0.4
0.0
0.0
0.2
-0.0
0.3
-0.0
-0.0
0.1
Fisc
al im
petu
s (F
I),
per
cent
of
GD
P
0.
20.
30.
20.
2
0.2
0.0
0.0
0.1
-0.0
0.1
0.1
0.1
0.0
0.0
0.0
0.0
P
revi
ous
0.
20.
30.
20.
2
0.2
-0.0
0.0
0.1
0.0
0.1
0.1
0.1
0.0
0.0
0.0
0.0
1
. Bud
get r
ecei
pts,
out
lays
, and
sur
plus
/def
icit
incl
ude
corr
espo
ndin
g so
cial
sec
urity
(O
ASD
I) c
ateg
orie
s. T
he O
ASD
I su
rplu
s an
d th
e Po
stal
Ser
vice
sur
plus
are
exc
lude
d fr
om th
e on
-bud
get
s
urpl
us a
nd s
how
n se
para
tely
as
off-
budg
et, a
s cl
assi
fied
und
er c
urre
nt la
w.
2
. Oth
er m
eans
of
fina
ncin
g ar
e ch
ecks
issu
ed le
ss c
heck
s pa
id, a
ccru
ed it
ems,
and
cha
nges
in o
ther
fin
anci
al a
sset
s an
d lia
bilit
ies.
3
. Gro
ss s
avin
g is
the
curr
ent a
ccou
nt s
urpl
us p
lus
cons
umpt
ion
of f
ixed
cap
ital o
f th
e ge
nera
l gov
ernm
ent a
s w
ell a
s go
vern
men
t ent
erpr
ises
.
4. H
EB
is g
ross
sav
ing
less
gro
ss in
vest
men
t (N
IPA
) of
the
fede
ral g
over
nmen
t in
curr
ent d
olla
rs, w
ith c
yclic
ally
sen
sitiv
e re
ceip
ts a
nd o
utla
ys a
djus
ted
to th
e st
aff’
s m
easu
re o
f po
tent
ial o
utpu
t and
the
NA
IRU
. Qua
rter
ly f
igur
es f
or c
hang
e in
HE
B a
nd F
I ar
e no
t at a
nnua
l rat
es.
The
sig
n on
Cha
nge
in H
EB
, as
a pe
rcen
t of
nom
inal
pot
entia
l GD
P, is
rev
erse
d. F
I is
the
wei
ghte
d di
ffer
ence
of
disc
retio
nary
chan
ges
in f
eder
al s
pend
ing
and
taxe
s in
cha
ined
(20
00)
dolla
rs, s
cale
d by
rea
l GD
P. T
he a
nnua
l FI
estim
ates
are
on
a ca
lend
ar y
ear
basi
s. A
lso,
for
FI
and
the
chan
ge in
HE
B, p
ositi
ve v
alue
s in
dica
teag
greg
ate
dem
and
stim
ulus
.
a--
Act
ual
I-29

Cla
ss I
I F
OM
CC
hang
e in
Deb
t of
the
Dom
esti
c N
onfi
nanc
ial S
ecto
rsA
ugus
t 2,
200
7 R
estr
icte
d (F
R)
(Per
cent
)
Hou
seho
lds
Mem
o:H
ome
Con
sum
erSt
ate
and
loca
lFe
dera
lN
omin
alPe
riod
1T
otal
Tot
alm
ortg
ages
cred
itB
usin
ess
gove
rnm
ents
gove
rnm
ent
GD
P
Yea
r20
016.
39.
310
.18.
65.
98.
8-.
22.
720
027.
210
.612
.95.
92.
511
.07.
63.
620
038.
211
.614
.45.
22.
68.
310
.95.
920
049.
011
.614
.25.
55.
87.
49.
06.
5
2005
9.4
11.5
13.4
4.2
7.6
10.2
7.0
6.3
2006
8.1
8.7
9.3
4.5
9.6
8.2
3.9
5.4
2007
6.5
5.3
5.3
3.9
8.8
9.3
4.4
4.6
2008
5.3
4.4
4.6
2.8
6.4
7.4
4.6
4.2
Qua
rter
2006
:18.
99.
310
.62.
210
.03.
38.
08.
42
7.5
9.2
9.5
6.0
8.8
6.7
1.0
6.0
36.
97.
98.
65.
47.
08.
23.
63.
44
8.2
7.2
7.3
4.1
11.4
13.6
2.8
3.8
2007
:17.
26.
06.
24.
59.
08.
66.
74.
92
6.3
5.4
5.4
4.1
10.7
11.5
-1.4
6.2
36.
24.
84.
83.
57.
58.
16.
33.
64
5.7
4.6
4.6
3.3
6.7
7.9
5.8
3.7
2008
:15.
24.
44.
53.
06.
37.
44.
04.
12
4.9
4.4
4.5
2.8
6.5
7.2
2.0
4.2
35.
34.
34.
52.
76.
27.
15.
34.
34
5.5
4.3
4.5
2.6
6.1
7.0
6.7
4.3
N
ote.
Qua
rter
ly d
ata
are
at s
easo
nally
adj
uste
d an
nual
rat
es.
1.
Dat
a af
ter
2007
:Q1
are
staf
f pr
ojec
tions
. Cha
nges
are
mea
sure
d fr
om e
nd o
f th
e pr
eced
ing
peri
od to
end
of
peri
od in
dica
ted
exce
pt f
or a
nnua
l nom
inal
GD
P gr
owth
, whi
ch is
cal
cula
ted
from
Q4
to Q
4.
2.6.
3 F
OF
I-30
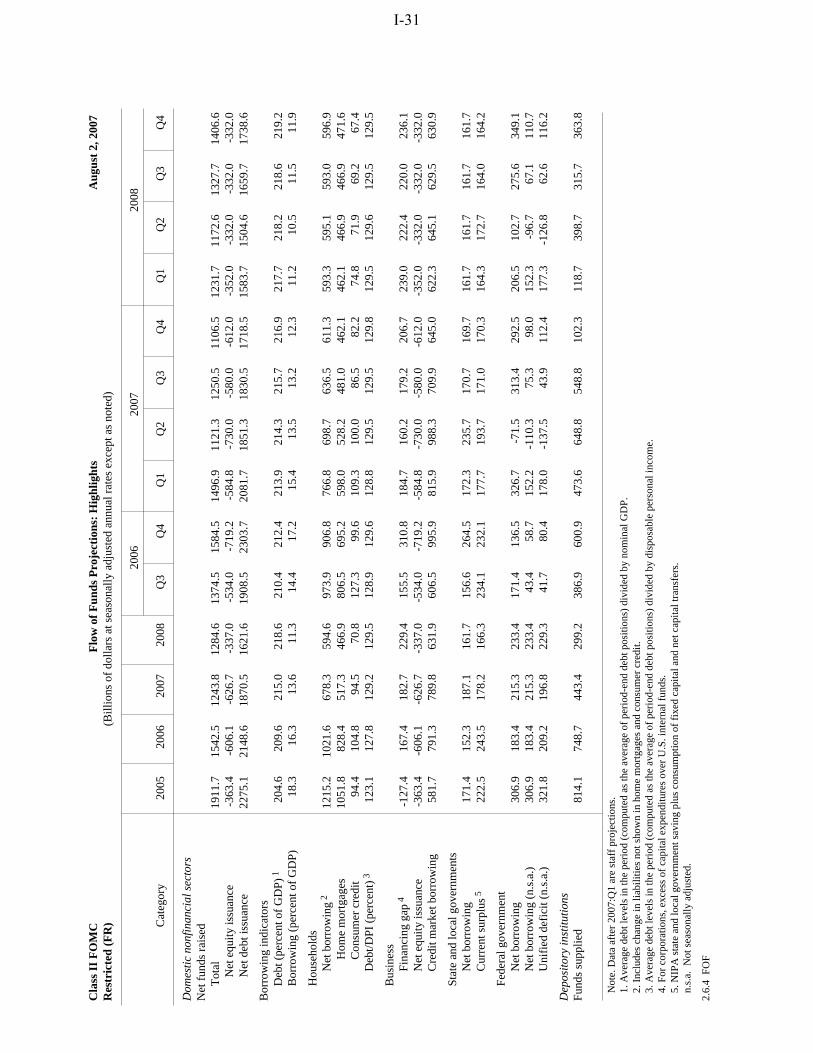
Cla
ss I
I F
OM
CF
low
of
Fun
ds P
roje
ctio
ns:
Hig
hlig
hts
Aug
ust
2, 2
007
Res
tric
ted
(FR
)(B
illio
ns o
f do
llars
at s
easo
nally
adj
uste
d an
nual
rat
es e
xcep
t as
note
d)
2006
2007
2008
Cat
egor
y20
0520
0620
0720
08Q
3 Q
4 Q
1 Q
2 Q
3 Q
4 Q
1 Q
2 Q
3 Q
4
Dom
esti
c no
nfin
anci
al s
ecto
rsN
et f
unds
rai
sed
T
otal
1911
.715
42.5
1243
.812
84.6
1374
.515
84.5
1496
.911
21.3
1250
.511
06.5
1231
.711
72.6
1327
.714
06.6
Net
equ
ity is
suan
ce-3
63.4
-606
.1-6
26.7
-337
.0-5
34.0
-719
.2-5
84.8
-730
.0-5
80.0
-612
.0-3
52.0
-332
.0-3
32.0
-332
.0
N
et d
ebt i
ssua
nce
2275
.121
48.6
1870
.516
21.6
1908
.523
03.7
2081
.718
51.3
1830
.517
18.5
1583
.715
04.6
1659
.717
38.6
Bor
row
ing
indi
cato
rs
Deb
t (pe
rcen
t of
GD
P) 1
204.
620
9.6
215.
021
8.6
210.
421
2.4
213.
921
4.3
215.
721
6.9
217.
721
8.2
218.
621
9.2
B
orro
win
g (p
erce
nt o
f G
DP)
18.3
16.3
13.6
11.3
14.4
17.2
15.4
13.5
13.2
12.3
11.2
10.5
11.5
11.9
H
ouse
hold
s
Net
bor
row
ing
212
15.2
1021
.667
8.3
594.
697
3.9
906.
876
6.8
698.
763
6.5
611.
359
3.3
595.
159
3.0
596.
9
H
ome
mor
tgag
es10
51.8
828.
451
7.3
466.
980
6.5
695.
259
8.0
528.
248
1.0
462.
146
2.1
466.
946
6.9
471.
6
C
onsu
mer
cre
dit
94.4
104.
894
.570
.812
7.3
99.6
109.
310
0.0
86.5
82.2
74.8
71.9
69.2
67.4
D
ebt/D
PI (
perc
ent)
312
3.1
127.
812
9.2
129.
512
8.9
129.
612
8.8
129.
512
9.5
129.
812
9.5
129.
612
9.5
129.
5
B
usin
ess
F
inan
cing
gap
4-1
27.4
167.
418
2.7
229.
415
5.5
310.
818
4.7
160.
217
9.2
206.
723
9.0
222.
422
0.0
236.
1
Net
equ
ity is
suan
ce-3
63.4
-606
.1-6
26.7
-337
.0-5
34.0
-719
.2-5
84.8
-730
.0-5
80.0
-612
.0-3
52.0
-332
.0-3
32.0
-332
.0
Cre
dit m
arke
t bor
row
ing
581.
779
1.3
789.
863
1.9
606.
599
5.9
815.
998
8.3
709.
964
5.0
622.
364
5.1
629.
563
0.9
S
tate
and
loca
l gov
ernm
ents
N
et b
orro
win
g17
1.4
152.
318
7.1
161.
715
6.6
264.
517
2.3
235.
717
0.7
169.
716
1.7
161.
716
1.7
161.
7
Cur
rent
sur
plus
522
2.5
243.
517
8.2
166.
323
4.1
232.
117
7.7
193.
717
1.0
170.
316
4.3
172.
716
4.0
164.
2
F
eder
al g
over
nmen
t
Net
bor
row
ing
306.
918
3.4
215.
323
3.4
171.
413
6.5
326.
7-7
1.5
313.
429
2.5
206.
510
2.7
275.
634
9.1
N
et b
orro
win
g (n
.s.a
.)30
6.9
183.
421
5.3
233.
443
.458
.715
2.2
-110
.375
.398
.015
2.3
-96.
767
.111
0.7
U
nifi
ed d
efic
it (n
.s.a
.)32
1.8
209.
219
6.8
229.
341
.780
.417
8.0
-137
.543
.911
2.4
177.
3-1
26.8
62.6
116.
2
Dep
osit
ory
inst
itut
ions
Fund
s su
pplie
d81
4.1
748.
744
3.4
299.
238
6.9
600.
947
3.6
648.
854
8.8
102.
311
8.7
398.
731
5.7
363.
8
N
ote.
Dat
a af
ter
2007
:Q1
are
staf
f pr
ojec
tions
.
1. A
vera
ge d
ebt l
evel
s in
the
peri
od (
com
pute
d as
the
aver
age
of p
erio
d-en
d de
bt p
ositi
ons)
div
ided
by
nom
inal
GD
P.
2. I
nclu
des
chan
ge in
liab
ilitie
s no
t sho
wn
in h
ome
mor
tgag
es a
nd c
onsu
mer
cre
dit.
3.
Ave
rage
deb
t lev
els
in th
e pe
riod
(co
mpu
ted
as th
e av
erag
e of
per
iod-
end
debt
pos
ition
s) d
ivid
ed b
y di
spos
able
per
sona
l inc
ome.
4.
For
cor
pora
tions
, exc
ess
of c
apita
l exp
endi
ture
s ov
er U
.S. i
nter
nal f
unds
.
5. N
IPA
sta
te a
nd lo
cal g
over
nmen
t sav
ing
plus
con
sum
ptio
n of
fix
ed c
apita
l and
net
cap
ital t
rans
fers
.
n.s.
a. N
ot s
easo
nally
adj
uste
d.
2.6.
4 F
OF
I-31

(This page intentionally blank.)

Class II FOMC—Restricted (FR)
International Developments
I-33
During the intermeeting period, the volatility and reassessment of risk initially associated with U.S. credit markets spread to foreign financial markets. At the same time, however, indicators of foreign economic activity were positive, prompting us to revise up our estimate for foreign output growth in the second quarter. Currently, we are not building into our projection any substantial additional deterioration in financial market conditions, and we have maintained our outlook of solid growth abroad. However, further negative financial market developments would pose a prominent downside risk to our forecast. Since the time of the June Greenbook, WTI oil prices in the spot market have risen almost $7.50 per barrel. However, futures markets are calling for a reversal of this increase over the remainder of the forecast period, and other commodity prices are expected to remain at current elevated levels. Accordingly, we expect inflation abroad to stay contained, as monetary policy continues to tighten in a number of countries. Depreciation of the nominal trade-weighted value of the dollar since the June Greenbook has resulted in a 1¼ percentage point lower starting point for our projection of the broad real dollar. The average rate of depreciation of the dollar going forward is largely unchanged from the previous Greenbook, however, as our expectation of slightly slower depreciation of the dollar against the currencies of the industrial countries is balanced by faster projected dollar declines against the Asian currencies. We estimate that real net exports added 1 percentage point at an annual rate to U.S. GDP growth in the second quarter, as imports contracted and exports accelerated. For the second half of 2007 and for 2008, we project that real net exports will contribute ¼ percentage point to U.S. GDP growth. The forecast is a little more positive than in the last Greenbook in light of the recent depreciation of the dollar and the downward-revised path of U.S. GDP growth. The U.S. current account deficit is expected to widen from an estimated $793 billion in the second quarter to $841 billion by the end of 2008 but to remain about unchanged as a ratio to GDP, at 5¾ percent. For 2008, this ratio is nearly ½ percentage point smaller than in the previous Greenbook, reflecting our projection of a narrower trade deficit and higher net investment income.

I-34 Class II FOMC—Restricted (FR) Part 1: Summary and Outlook, August 2, 2007
Summary of Staff Projections (Percent change from end of previous period except as noted,
s.a.a.r.)
Projection
2007 Indicator 2006 2007: Q1
Q2 H2 2008
Foreign output 3.9 3.9 4.2 3.6 3.4 June GB 3.9 3.7 3.8 3.6 3.5
Foreign CPI 2.1 2.9 3.0 2.7 2.3 June GB 2.1 2.8 2.7 2.5 2.3
Contribution to growth (percentage points)
U.S. net exports .4 -.5 1.0 .2 .2 June GB .5 -.7 1.0 .1 .0
Note. Changes for years measured as Q4/Q4; half-year is measured as Q4/Q2.
Oil Prices The spot price of West Texas intermediate (WTI) crude oil closed at $76.54 on August 1, up sharply from the time of the June Greenbook. Futures prices for delivery of WTI over the near term also rose, but prices further out were little changed compared with those in the June Greenbook. As a result, the futures curve now slopes downward throughout the projection period. Informed by futures prices, we project that the price of imported oil will peak next quarter at $71.57 per barrel and then gradually decline to about $68 by the end of next year. Relative to the June Greenbook, this projection is about $3.50 per barrel higher in the second half of this year but less than $1 lower by the final quarter of 2008. Against the backdrop of continued OPEC supply restraint, the recent rise in near-term prices partly reflects temporary supply disruptions in the North Sea. In addition, as inventories of WTI have run off, the spot price of WTI relative to the price of other grades of crude oil has moved back up. The broader picture continues to be one of a tight market. With global oil demand expected to remain strong in the second half of this year, crude oil inventories could decline rapidly if OPEC does not increase production. The risk of further supply disruptions in Iraq, Iran, Nigeria, and Venezuela also continues to support oil prices.

International Developments Class II FOMC—Restricted (FR) I-35
International Financial Markets During the intermeeting period, investor concerns about credit quality roiled international financial markets. Notable were declines in equity prices and sovereign bond yields in major foreign industrial countries, as well as a widening of sovereign risk spreads in a number of emerging market economies. Measures of volatility in currency, bond, and equity markets have moved up from the time of the last Greenbook, and uncertainty remains high. The nominal trade-weighted exchange value of the dollar against the major foreign currencies, which had fallen steadily over most of the period to a record low, moved back up a bit as financial volatility mounted. On balance, the major currencies index of the dollar has declined 1½ percent since the June FOMC meeting. In contrast, the dollar was little changed, on a trade-weighted basis, against the currencies of our other important trading partners. The dollar continued to depreciate against many Asian currencies, including a decline of almost ¾ percent against the Chinese renminbi, but was up 1¼ percent against the Mexican peso. We expect the index of the nominal currencies of the major industrial countries to depreciate at an annual rate of about 1 percent over the forecast period, a slower rate than in the June Greenbook. Market expectations for longer-term U.S. interest rates have fallen below the staff forecast; we assume that interest rates will increase as market expectations come to be more aligned with the staff outlook, and that this rise will moderate the dollar’s decline. On the other hand, we assume that Chinese authorities will allow a somewhat more rapid rate of appreciation of the renminbi against the dollar and that other Asian currencies will follow suit. Accordingly, after a downward shift to the level of the broad real dollar in the current quarter, the pace of depreciation over the forecast period is roughly unchanged from the previous Greenbook. Euro-area and U.K. long-term sovereign bond yields fell about 20 basis points over the intermeeting period, about 10 basis points less than in the United States, while yields edged down about 10 basis points in Canada and Japan. Yields on inflation-protected government securities also fell over the period, and implied inflation compensation declined slightly in most countries. In contrast, long-term yields denominated in local currencies rose in most emerging market economies, and the aggregate EMBI+ spread increased 50 basis points.

I-36 Class II FOMC—Restricted (FR) Part 1: Summary and Outlook, August 2, 2007
European stock indexes have dropped nearly 4 percent since the June FOMC meeting; financial stocks were especially hard hit. Equity prices in emerging Asian economies rose over most of the period, but many indexes subsequently retraced part of that gain. The Chinese stock market was up 12½ percent, on balance, in part in response to higher-than-expected GDP growth last quarter. In contrast, performance of Latin American equity indexes was more mixed, with Mexican equity prices falling 2½ percent.
. The Desk did not intervene during
the period for the accounts of the System or the Treasury. Advanced Foreign Economies We estimate that real GDP growth in the advanced foreign economies moderated to just below 3 percent at an annual rate in the second quarter. This still-robust pace is consistent with favorable indicators of real activity and labor market conditions. Output growth is expected to moderate further over the forecast period to around 2¼ percent by the end of next year. In Europe and Canada, we expect the deceleration to be concentrated in investment, while, in Japan, the step-down is projected to be more broadly based. Relative to the June Greenbook, the forecast for GDP growth is little changed on average in the near term, with weaker indicators for Japan and Europe offset by stronger-than-expected data in Canada. At this time, we do not anticipate that the recent financial market turmoil will have a significant impact on industrial country output, but it does present a risk to the forecast. The moderation toward trend growth in all the major industrial countries also reflects the assumption of tightening monetary policy. With growth remaining above trend and labor markets tight, we expect that inflation concerns will lead the ECB and Bank of Canada to raise policy rates twice more this year to 4.5 percent and 5 percent, respectively, and the Bank of England to increase its rate this quarter to 6 percent. The Bank of Japan is assumed to gradually tighten policy, bringing its rate to 1.25 percent by the end of 2008. In part in response to tighter monetary policy and to the abatement of recent energy price increases, we project that industrial country inflation, after rising to 2¼ percent (four-quarter rate) in the fourth quarter of this year, will fall to less than 1¾ percent by the end of next year. In contrast to the other industrial economies, in Japan, inflation remains near zero in the near term and rises to about ½ percent next year. For 2007, our overall

International Developments Class II FOMC—Restricted (FR) I-37
forecast is slightly above that in the June Greenbook, reflecting higher oil prices and incoming data for the euro area and Canada. Emerging Market Economies Real GDP in the emerging market economies is estimated to have jumped 6 percent at an annual rate in the second quarter, a 1 percentage point upward revision since the June Greenbook, largely because of surprisingly strong growth in China. As in the previous Greenbook, the pace of expansion is expected to be just under 5 percent in the current quarter and remain at that rate through 2008. The growth of real GDP in emerging Asia is estimated to have stepped up to 8½ percent in the second quarter. Staff calculations from official Chinese data imply that second-quarter real GDP in China soared 14¾ percent. Fixed investment and retail sales were very strong, and net exports reached new heights, boosted by a rush to ship products before the July 1 reduction in VAT rebates. Chinese authorities raised interest rates and reserve requirements in late July and further monetary policy tightening is anticipated. We expect growth to shift down to near 9¾ percent over the forecast period, partly reflecting a moderation in export growth. This forecast is a little higher than in the previous Greenbook. Growth in the rest of Asia also appears to have been solid in the second quarter. In particular, Korean real GDP rose 7 percent, as domestic demand remained strong and net exports rebounded some. Conditional on more-temperate growth in China and Korea, we project regional output growth will stabilize at 6¼ percent for the remainder of the forecast period. In Latin America, indicators for Mexico’s manufacturing and construction industries point to a subdued rebound in the second quarter after weak performance in the previous two quarters. In line with the projected moderate pace of U.S. manufacturing production, Mexican output is expected to grow at roughly a 3¼ percent annual rate through 2008. Boosted by high commodities prices and continued easing in monetary policy, Brazilian output growth is estimated to have picked up to 4¼ percent in the second quarter and is expected to remain at that pace through 2008. Although volatility and credit risk spreads have risen in Latin American markets, we have not importantly altered our output forecast in response to these market developments, but downside risks remain. Four-quarter inflation in the emerging market economies is projected to reach 3½ percent this quarter in response to higher food and energy prices before tapering off to 3 percent by the end of 2008. This pattern is most pronounced in China, where four-quarter

I-38 Class II FOMC—Restricted (FR) Part 1: Summary and Outlook, August 2, 2007
inflation is expected to hit 4½ percent in the current quarter, boosted by a sharp increase in food prices. We assume that Chinese authorities will take action to restrain food price inflation if necessary, possibly including restricting the production of ethanol, which has contributed directly to higher corn prices and indirectly to higher meat prices. Chinese inflation is thus expected to drop to 2¾ percent by the end of 2008. Prices of Internationally Traded Goods Core import price inflation picked up to a 3½ percent annual rate in the second quarter, largely because of an acceleration of prices for imported industrial supplies, particularly metals, and continued increases in the prices of imported food. In the third quarter, we expect core import price inflation to rise further, in part reflecting the recent depreciation of the dollar. Thereafter, core import prices decelerate as commodity prices level off and the pace of dollar depreciation slows. Data for the second quarter came in about 1 percentage point lower than we had expected in the June Greenbook, but our forecast is up ¼ percentage point in the second half of this year owing to the recent depreciation of the dollar.
Staff Projections of Selected Trade Prices (Percent change from end of previous period excepted as noted, s.a.a.r.)
Projection
2007 Indicator 2006 2007: Q1
Q2 H2 2008
Imports Core goods 2.4 2.7 3.6 3.6 1.6 June GB 2.7 2.8 4.5 3.3 1.6 Oil (dollars per barrel) 55.33 54.39 63.78 71.57 68.38 June GB 55.33 54.39 63.24 68.32 68.79
Exports Core goods 4.3 6.0 7.0 3.4 1.5 June GB 4.2 5.9 6.0 3.2 1.2
Note. Prices for core exports exclude computers and semiconductors. Prices for core imports exclude computers, semiconductors, oil, and natural gas. Both price series are on a NIPA chain-weighted basis. The price of imported oil for multiquarter periods is the price for the final quarter of the period. Imported oil includes both crude oil and refined products.

International Developments Class II FOMC—Restricted (FR) I-39
Core export price inflation moved up to an annual rate of 7 percent in the second quarter, as higher inflation for exports of nonagricultural industrial supplies was only partially offset by lower, but still rapid, inflation for exports of agricultural products. Among industrial supplies, prices of exported metals led the way, although there was some deceleration in June; disinflation in the prices of some agricultural products partially offset steeper price increases for grains and meat. Consistent with a projected leveling off of commodity prices, core export price inflation is projected to move down quickly over the next few quarters, falling to 3½ percent in the second half of this year and to 1½ percent next year. Trade in Goods and Services After contributing 1 percentage point at an annual rate to U.S. GDP growth last quarter, real net exports should add ¼ percentage point to U.S. GDP growth for the second half of 2007 and for 2008. The annual revisions to the national income and product accounts included only modest changes to real exports and imports and did not lead us to alter our views of the relationships among trade, GDP, and relative prices. We revised down our forecast for real imports in response to the lower projected path of U.S. GDP growth, but we did not build in any further changes as a result of the annual revisions. After increasing at an annual rate of nearly 4 percent in the first quarter of 2007, real imports of goods and services are estimated to have fallen 2½ percent in the second quarter. A drop in oil imports accounts for much of the decline. However, imported services also fell, and core goods imports were nearly flat after declining in the previous quarter; the monthly nominal data indicate that imports of core goods fell sharply in April and only partially recovered in May. Real imports of high-tech goods in the second quarter were mixed, with imports of semiconductors rising and computer imports falling. In the second half of 2007, we expect real import growth to recover, with oil imports moving up and imports of services and core goods returning to a pace more consistent with moderate U.S. GDP growth. Import growth is expected to strengthen a bit further in 2008 as imports of core goods and services respond to the deceleration of import prices. Imports of computers and semiconductors expand steadily as well, whereas oil imports edge down. For the second half of 2007, the current projection for import growth is 1 percentage point below that in the June Greenbook, reflecting both lower expected growth of oil and natural gas imports as well as the effects of the lower dollar and slower U.S. GDP growth. For 2008, our sizable downward revision to import growth mainly reflects the slower U.S. growth projection.

I-40 Class II FOMC—Restricted (FR) Part 1: Summary and Outlook, August 2, 2007
Staff Projections for Trade in Goods and Services
(Percent change from end of previous period, s.a.a.r.)
Projection
2007 Measure 2006 2007: Q1
Q2 H2 2008
Real imports 3.7 3.9 -2.4 2.7 3.0 June GB 3.3 5.4 -2.4 3.8 3.8
Real exports 9.3 1.1 5.6 6.2 5.8 June GB 9.4 1.2 5.4 6.0 5.7
NOTE. Changes for years are measured as Q4/Q4; half-year is measured as Q4/Q2.
We estimate that real exports of goods and services rose 5½ percent at an annual rate in the second quarter, significantly higher than the 1 percent pace in the first quarter but similar to our projection in the June Greenbook. Exports of both services and core goods accelerated, increasing 7¼ percent and 5 percent respectively. Compared with the depressed rate of growth recorded for both categories in the first quarter, this quicker pace was more in line with foreign activity and relative prices. However, falling real exports of computers held down overall export growth slightly last quarter. Given the recent depreciation of the dollar and our expectations of solid foreign growth, we project that the growth of real exports of goods and services will improve further in the second half of the year, to 6¼ percent. Because services respond rapidly to dollar movements, exports of services are expected to increase 8 percent in the second half of 2007, almost double the first-half pace. In 2008, however, exports of services are anticipated to decelerate as the effect of the recent dollar movement fades. This deceleration will cause total export growth to shift down to 5¾ percent next year, even as favorable relative prices lead core export growth to edge up and overseas sales of high-tech goods expand. Compared with the June Greenbook, the current projection is a touch higher, mostly because of the weaker dollar. Alternative Simulations Our baseline forecast projects a modest depreciation of the broad real dollar, but the dollar’s recent weakness may presage a considerably larger decline. We use the FRB/Global model to examine the effects of a risk-premium shock in the third quarter of 2007 that would generate a 10 percent depreciation of the dollar in the absence of an

International Developments Class II FOMC—Restricted (FR) I-41
endogenous adjustment of domestic or foreign interest rates. In the first simulation, pass-through from the exchange rate to U.S. import prices is set at our benchmark value of about ⅓ in the long run, a rate consistent with substantial empirical evidence that indicates relatively low pass-through since the early 1990s. Nevertheless, import prices might exhibit a considerably stronger reaction. Thus, in a second simulation, we consider a scenario in which pass-through from the exchange rate to import prices is ⅔ in the long-run, which is roughly consistent with estimates of pass-through based on data for years preceding the 1990s. Under our benchmark specification of relatively low pass-through, the decline in the dollar boosts the growth of U.S. real GDP 0.4 percentage point (annual rate) above baseline in the second half of 2007 and about 0.8 percentage point in 2008. Output rises because U.S. exports become more competitive abroad and because U.S. consumers substitute away from imports toward domestically produced goods. Core PCE price inflation increases 0.3 percentage point above baseline in the second half of 2007, mainly because of higher import prices, and about 0.1 percentage point in 2008 in response to higher resource utilization. Given higher activity and prices, the federal funds rate rises 120 basis points above its baseline level by the end of 2008. The nominal trade balance as a percent of GDP exhibits a J-curve effect, initially falling (thereby creating a larger deficit) before increasing 0.4 percentage point above baseline by the end of 2008. In the higher pass-through specification, U.S. real GDP growth is up 0.5 percentage point in the remainder of 2007 and about 0.9 percentage point above baseline throughout 2008. The increase in real activity is more substantial than in the first scenario because the larger rise in the relative price of imported goods induces more substitution toward U.S. goods. Moreover, because import prices increase more sharply, core PCE inflation rises 0.5 percentage point above baseline in the second half of 2007, roughly twice as much as in the low pass-through scenario. Given the heightened response of real activity and prices, the federal funds rate rises 170 basis points above baseline by the end of 2008.

I-42 Class II FOMC—Restricted (FR) Part 1: Summary and Outlook, August 2, 2007
Alternative Simulation: 10 Percent Dollar Depreciation
(Percent change from previous period, annual rate, except as noted)
2007 2008 Indicator and simulation
H1 H2 H1 H2
U.S. real GDP Baseline 2.0 1.9 1.9 2.1 Low pass-through 2.0 2.3 2.8 2.7 High pass-through 2.0 2.4 3.1 2.7
U.S. core PCE inflation Baseline 1.9 2.1 2.1 2.0 Low pass-through 1.9 2.4 2.1 2.1 High pass-through 1.9 2.6 2.2 2.1
U.S. federal funds rate (percent) Baseline 5.3 5.3 5.3 5.3 Low pass-through 5.3 5.5 6.1 6.5 High pass-through 5.3 5.7 6.5 7.0
U.S. trade balance (percent of GDP) Baseline -5.2 -5.3 -5.2 -4.9 Low pass-through -5.2 -5.5 -5.0 -4.5 High pass-through -5.2 -5.8 -5.2 -4.5
NOTE. Half year changes are measured as Q2/Q4 or Q4/Q2. The federal funds rate is the average rate for the final quarter of the period.

Evolution of the Staff Forecast
-8.0
-7.5
-7.0
-6.5
-6.0
-5.5
Class II FOMC -- Restricted (FR)
2006
2007
2008
Greenbook publication date
Current Account BalancePercent of GDP
1/26 3/16 4/28 6/22 8/4 9/14 10/26 12/7 1/25 3/22 5/3 6/21 8/3 9/1310/18 12/6 1/24 3/14 5/2 6/20 8/2 9/12 10/24 12/58/22005 2006 2007
2.5
3.0
3.5
4.0
2006
20072008
Greenbook publication date
Foreign Real GDPPercent change, Q4/Q4
1/26 3/16 4/28 6/22 8/4 9/14 10/26 12/7 1/25 3/22 5/3 6/21 8/3 9/1310/18 12/6 1/24 3/14 5/2 6/20 8/2 9/12 10/24 12/58/22005 2006 2007
-1
0
1
2
3
4
5
2006
2007
2008
Greenbook publication date*Prices for merchandise imports excluding computers, semiconductors, oil, and natural gas.
Core Import Prices*Percent change, Q4/Q4
1/26 3/16 4/28 6/22 8/4 9/14 10/26 12/7 1/25 3/22 5/3 6/21 8/3 9/1310/18 12/6 1/24 3/14 5/2 6/20 8/2 9/12 10/24 12/58/22005 2006 2007
I-43

Class II FOMC August 2, 2007
Restricted (FR)
OUTLOOK FOR FOREIGN REAL GDP AND CONSUMER PRICES: SELECTED COUNTRIES
(Percent, Q4 to Q4)
___________________________________________________________________________________________________
Projected
Measure and country 2000 2001 2002 2003 2004 2005 2006 2007 2008
___________________________________________________________________________________________________
REAL GDP (1)
------------
Total foreign 4.2 0.4 3.1 3.0 3.8 3.8 3.9 3.8 3.4
Advanced Foreign Economies 3.5 0.9 2.5 1.8 2.5 2.7 2.5 3.0 2.4
of which:
Canada 4.1 1.3 3.5 1.5 3.5 3.2 1.9 3.1 2.4
Japan 3.1 -1.7 2.0 2.4 1.1 2.8 2.4 2.3 1.8
United Kingdom 3.1 2.1 2.3 3.4 2.6 1.8 3.1 2.8 2.5
Euro Area (2) 3.2 1.1 1.0 1.1 1.6 1.9 3.3 2.6 2.1
Germany 2.3 1.1 0.0 0.2 0.2 1.7 3.9 2.6 2.1
Emerging Market Economies 5.1 -0.4 4.0 4.8 5.6 5.4 5.7 5.0 4.9
Asia 5.6 1.1 6.4 6.9 5.9 7.5 6.7 6.9 6.3
Korea 4.4 4.7 7.7 4.2 2.9 5.7 4.0 5.0 4.5
China 7.8 7.1 8.5 10.1 9.6 10.0 10.4 11.9 9.7
Latin America 4.5 -1.3 1.6 2.4 5.3 3.1 4.9 3.0 3.5
Mexico 4.8 -1.3 2.0 2.1 4.8 2.5 4.3 2.6 3.2
Brazil 4.4 -0.7 5.0 0.8 5.0 3.1 4.7 3.9 4.2
CONSUMER PRICES (3)
-------------------
Advanced Foreign Economies 1.9 0.9 2.1 1.3 1.8 1.5 1.3 2.2 1.6
of which:
Canada 3.1 1.1 3.8 1.7 2.3 2.2 1.3 3.1 2.0
Japan -0.5 -1.1 -0.5 -0.3 0.5 -1.0 0.3 0.2 0.4
United Kingdom (4) 0.9 1.1 1.5 1.3 1.4 2.1 2.7 2.2 2.0
Euro Area (2) 2.5 2.1 2.3 2.0 2.3 2.3 1.8 2.3 1.9
Germany 1.7 1.5 1.2 1.1 2.1 2.2 1.3 2.4 1.8
Emerging Market Economies 4.1 2.8 2.9 3.1 3.9 3.0 2.9 3.5 3.1
Asia 1.8 1.2 0.8 2.2 3.2 2.6 2.3 3.5 2.8
Korea 2.5 3.3 3.3 3.5 3.4 2.5 2.1 3.5 2.9
China 1.0 -0.1 -0.6 2.7 3.3 1.4 2.1 4.0 2.8
Latin America 8.4 5.3 6.4 4.9 5.7 3.8 4.2 3.7 3.8
Mexico 8.7 5.1 5.2 3.9 5.3 3.1 4.1 3.3 3.5
Brazil 6.4 7.5 10.7 11.5 7.2 6.1 3.2 4.1 3.7
___________________________________________________________________________________________________
1. Foreign GDP aggregates calculated using shares of U.S. exports.
2. Harmonized data for euro area from Eurostat.
3. Foreign CPI aggregates calculated using shares of U.S. non-oil imports.
4. CPI excluding mortgage interest payments, which is the targeted inflation rate.
I-44
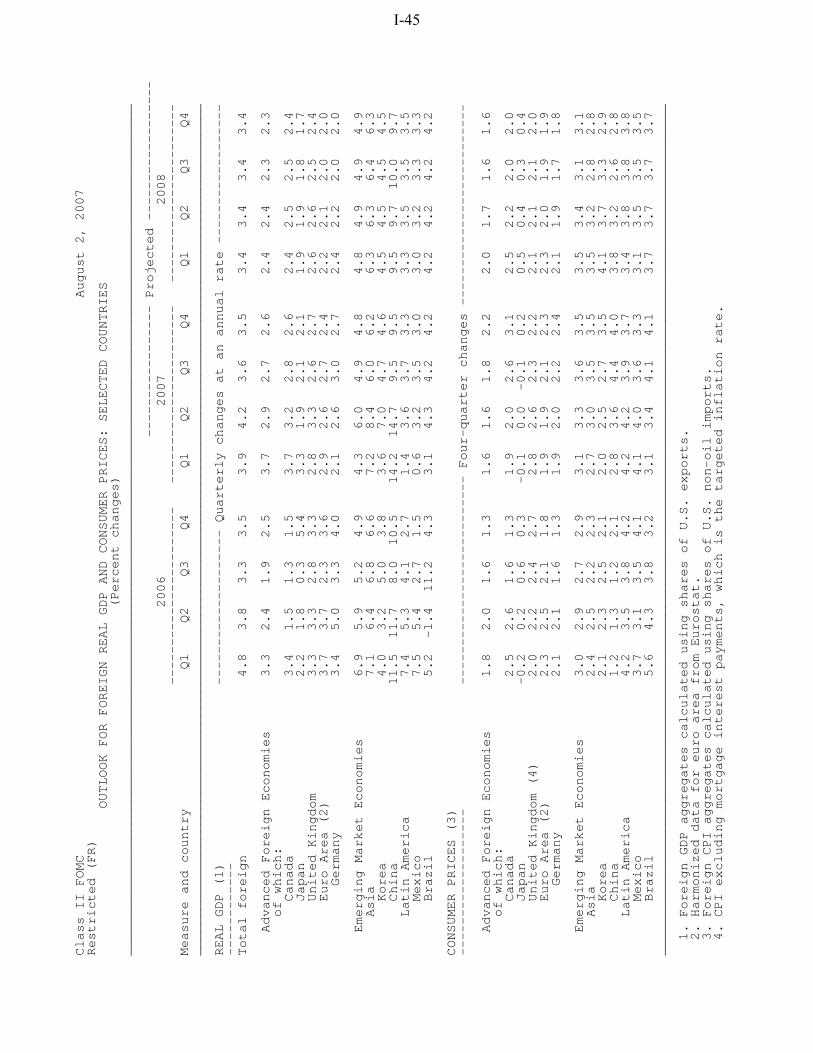
Class II FOMC August 2, 2007
Restricted (FR)
OUTLOOK FOR FOREIGN REAL GDP AND CONSUMER PRICES: SELECTED COUNTRIES
(Percent changes)
______________________________________________________________________________________________________________
----------------- Projected ------------------
2006 2007 2008
----------------------- ----------------------- -----------------------
Measure and country Q1 Q2 Q3 Q4 Q1 Q2 Q3 Q4 Q1 Q2 Q3 Q4
______________________________________________________________________________________________________________
REAL GDP (1) -------------------- Quarterly changes at an annual rate ------------------
------------
Total foreign 4.8 3.8 3.3 3.5 3.9 4.2 3.6 3.5 3.4 3.4 3.4 3.4
Advanced Foreign Economies 3.3 2.4 1.9 2.5 3.7 2.9 2.7 2.6 2.4 2.4 2.3 2.3
of which:
Canada 3.4 1.5 1.3 1.5 3.7 3.2 2.8 2.6 2.4 2.5 2.5 2.4
Japan 2.2 1.8 0.3 5.4 3.3 1.9 2.1 2.1 1.9 1.9 1.8 1.7
United Kingdom 3.3 3.3 2.8 3.3 2.8 3.3 2.6 2.7 2.6 2.6 2.5 2.4
Euro Area (2) 3.7 3.7 2.3 3.6 2.9 2.6 2.7 2.4 2.2 2.1 2.0 2.0
Germany 3.4 5.0 3.3 4.0 2.1 2.6 3.0 2.7 2.4 2.2 2.0 2.0
Emerging Market Economies 6.9 5.9 5.2 4.9 4.3 6.0 4.9 4.8 4.8 4.9 4.9 4.9
Asia 7.1 6.4 6.8 6.6 7.2 8.4 6.0 6.2 6.3 6.3 6.4 6.3
Korea 4.0 3.2 5.0 3.8 3.6 7.0 4.7 4.6 4.5 4.5 4.5 4.5
China 11.5 11.7 8.0 10.5 14.2 14.7 9.5 9.5 9.5 9.7 10.0 9.7
Latin America 7.4 5.3 4.1 2.7 1.4 3.6 3.7 3.3 3.3 3.5 3.5 3.5
Mexico 7.5 5.4 2.7 1.5 0.6 3.2 3.5 3.0 3.0 3.2 3.3 3.3
Brazil 5.2 -1.4 11.2 4.3 3.1 4.3 4.2 4.2 4.2 4.2 4.2 4.2
CONSUMER PRICES (3)
------------------- --------------------------- Four-quarter changes --------------------------
Advanced Foreign Economies 1.8 2.0 1.6 1.3 1.6 1.6 1.8 2.2 2.0 1.7 1.6 1.6
of which:
Canada 2.5 2.6 1.6 1.3 1.9 2.0 2.6 3.1 2.5 2.2 2.0 2.0
Japan -0.2 0.2 0.6 0.3 -0.1 0.0 -0.1 0.2 0.5 0.4 0.3 0.4
United Kingdom (4) 2.0 2.2 2.4 2.7 2.8 2.6 2.3 2.2 2.1 2.1 2.1 2.0
Euro Area (2) 2.3 2.5 2.1 1.8 1.9 1.9 2.1 2.3 2.3 2.0 1.9 1.9
Germany 2.1 2.1 1.6 1.3 1.9 2.0 2.2 2.4 2.1 1.9 1.7 1.8
Emerging Market Economies 3.0 2.9 2.7 2.9 3.1 3.3 3.6 3.5 3.5 3.4 3.1 3.1
Asia 2.4 2.5 2.2 2.3 2.7 3.0 3.5 3.5 3.5 3.2 2.8 2.8
Korea 2.1 2.3 2.5 2.1 2.0 2.5 2.7 3.5 4.1 3.7 3.3 2.9
China 1.2 1.3 1.2 2.1 2.8 3.6 4.4 4.0 3.8 3.2 2.6 2.8
Latin America 4.2 3.5 3.8 4.2 4.2 4.2 3.9 3.7 3.4 3.8 3.8 3.8
Mexico 3.7 3.1 3.5 4.1 4.1 4.0 3.6 3.3 3.1 3.5 3.5 3.5
Brazil 5.6 4.3 3.8 3.2 3.1 3.4 4.1 4.1 3.7 3.7 3.7 3.7
______________________________________________________________________________________________________________
1. Foreign GDP aggregates calculated using shares of U.S. exports.
2. Harmonized data for euro area from Eurostat.
3. Foreign CPI aggregates calculated using shares of U.S. non-oil imports.
4. CPI excluding mortgage interest payments, which is the targeted inflation rate.
I-45
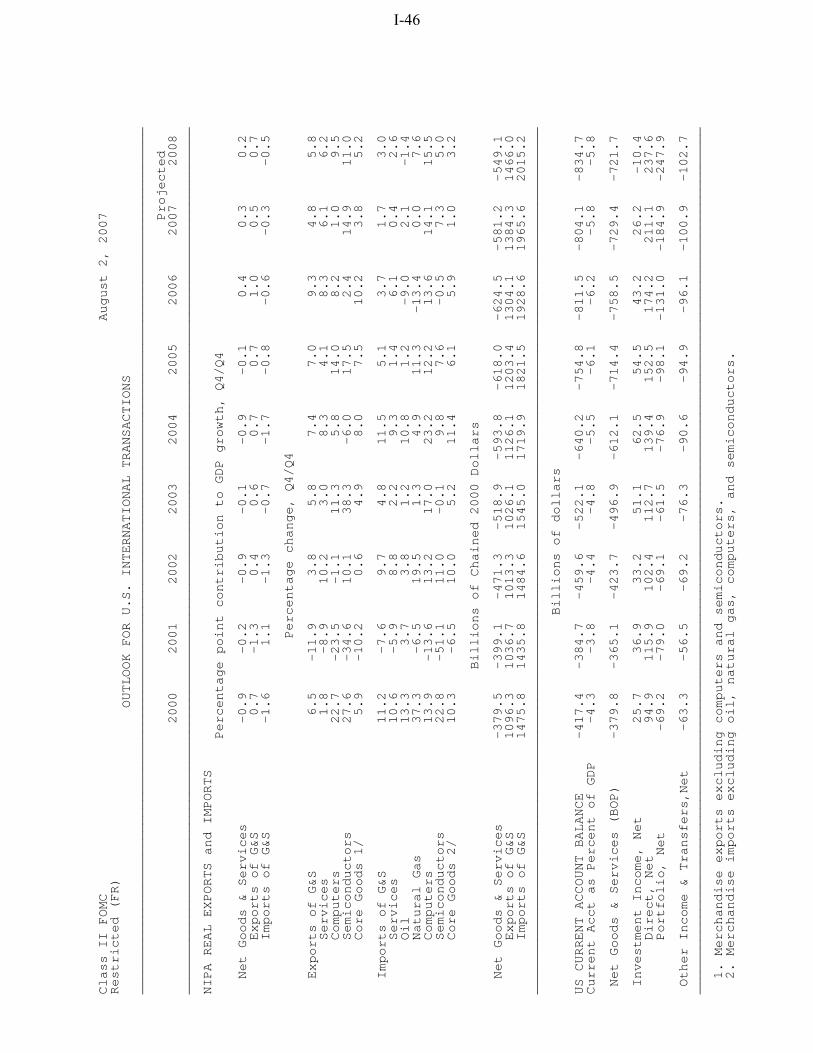
Class II FOMC August 2, 2007
Restricted (FR)
OUTLOOK FOR U.S. INTERNATIONAL TRANSACTIONS
________________________________________________________________________________________________________________
Projected
2000 2001 2002 2003 2004 2005 2006 2007 2008
________________________________________________________________________________________________________________
NIPA REAL EXPORTS and IMPORTS
Percentage point contribution to GDP growth, Q4/Q4
Net Goods & Services -0.9 -0.2 -0.9 -0.1 -0.9 -0.1 0.4 0.3 0.2
Exports of G&S 0.7 -1.3 0.4 0.6 0.7 0.7 1.0 0.5 0.7
Imports of G&S -1.6 1.1 -1.3 -0.7 -1.7 -0.8 -0.6 -0.3 -0.5
Percentage change, Q4/Q4
Exports of G&S 6.5 -11.9 3.8 5.8 7.4 7.0 9.3 4.8 5.8
Services 1.8 -8.9 10.2 3.0 8.3 4.1 8.3 6.1 6.2
Computers 22.7 -23.5 -1.1 11.3 5.8 14.0 8.2 1.0 9.5
Semiconductors 27.6 -34.6 10.1 38.3 -6.0 17.5 2.4 14.9 11.0
Core Goods 1/ 5.9 -10.2 0.6 4.9 8.0 7.5 10.2 3.8 5.2
Imports of G&S 11.2 -7.6 9.7 4.8 11.5 5.1 3.7 1.7 3.0
Services 10.6 -5.9 8.8 2.2 9.3 1.4 6.1 0.4 2.6
Oil 13.3 3.7 3.8 1.2 10.8 1.2 -9.0 2.1 -1.4
Natural Gas 37.3 -6.5 19.5 1.3 4.9 11.3 -13.4 0.0 7.6
Computers 13.9 -13.6 13.2 17.0 23.2 12.2 13.6 14.1 15.5
Semiconductors 22.8 -51.1 11.0 -0.1 9.8 7.6 -0.5 7.3 5.0
Core Goods 2/ 10.3 -6.5 10.0 5.2 11.4 6.1 5.9 1.0 3.2
Billions of Chained 2000 Dollars
Net Goods & Services -379.5 -399.1 -471.3 -518.9 -593.8 -618.0 -624.5 -581.2 -549.1
Exports of G&S 1096.3 1036.7 1013.3 1026.1 1126.1 1203.4 1304.1 1384.3 1466.0
Imports of G&S 1475.8 1435.8 1484.6 1545.0 1719.9 1821.5 1928.6 1965.6 2015.2
________________________________________________________________________________________________________________
Billions of dollars
US CURRENT ACCOUNT BALANCE -417.4 -384.7 -459.6 -522.1 -640.2 -754.8 -811.5 -804.1 -834.7
Current Acct as Percent of GDP -4.3 -3.8 -4.4 -4.8 -5.5 -6.1 -6.2 -5.8 -5.8
Net Goods & Services (BOP) -379.8 -365.1 -423.7 -496.9 -612.1 -714.4 -758.5 -729.4 -721.7
Investment Income, Net 25.7 36.9 33.2 51.1 62.5 54.5 43.2 26.2 -10.4
Direct, Net 94.9 115.9 102.4 112.7 139.4 152.5 174.2 211.1 237.6
Portfolio, Net -69.2 -79.0 -69.1 -61.5 -76.9 -98.1 -131.0 -184.9 -247.9
Other Income & Transfers,Net -63.3 -56.5 -69.2 -76.3 -90.6 -94.9 -96.1 -100.9 -102.7
________________________________________________________________________________________________________________
1. Merchandise exports excluding computers and semiconductors.
2. Merchandise imports excluding oil, natural gas, computers, and semiconductors.
I-46

Class II FOMC August 2, 2007
Restricted (FR)
OUTLOOK FOR U.S. INTERNATIONAL TRANSACTIONS
___________________________________________________________________________________________________________________________
2003 2004 2005
---------------------------- ---------------------------- ---------------------------
Q1 Q2 Q3 Q4 Q1 Q2 Q3 Q4 Q1 Q2 Q3 Q4
___________________________________________________________________________________________________________________________
NIPA REAL EXPORTS and IMPORTS
Percentage point contribution to GDP growth
Net Goods & Services 0.2 -0.7 0.5 -0.5 -0.8 -1.5 -0.4 -1.1 0.3 0.8 -0.1 -1.4
Exports of G&S -0.5 -0.2 1.0 1.8 0.9 0.6 0.3 1.0 0.6 0.9 0.2 1.1
Imports of G&S 0.7 -0.6 -0.5 -2.3 -1.7 -2.1 -0.7 -2.0 -0.3 -0.1 -0.3 -2.5
Percentage change from previous period, s.a.a.r.
Exports of G&S -5.3 -1.7 11.4 20.8 10.0 6.5 3.1 10.0 6.0 9.5 2.1 10.6
Services -20.0 -2.8 17.5 23.1 16.2 5.1 -3.4 16.8 6.5 0.9 2.6 6.3
Computers -2.3 -5.2 34.7 23.2 -7.0 1.7 16.7 13.4 17.4 24.9 12.8 2.0
Semiconductors 37.4 30.9 44.6 40.7 16.7 -13.4 -20.9 -2.4 -1.7 9.3 23.2 43.8
Core Goods 1/ 0.2 -2.9 5.2 18.3 7.8 9.2 7.7 7.4 5.7 13.2 0.2 11.5
Imports of G&S -5.0 4.1 3.8 17.6 12.3 15.2 4.8 13.8 2.1 0.8 2.1 16.2
Services -10.6 -15.7 21.2 19.6 16.5 8.9 1.8 10.5 -3.5 -0.5 0.0 10.3
Oil -9.7 12.4 -6.0 9.9 39.2 -26.3 -7.1 58.3 5.4 -26.2 -14.2 57.1
Natural Gas -45.9 72.5 66.4 -32.1 33.4 43.1 48.5 -57.3 53.9 -4.0 108.6 -50.2
Computers 11.4 10.7 11.1 36.9 20.7 30.1 25.6 17.0 5.7 9.8 17.0 16.6
Semiconductors -6.3 1.1 -4.2 9.7 43.0 18.5 3.9 -17.4 -9.5 7.7 15.7 18.8
Core Goods 2/ -3.1 7.2 -0.1 18.0 6.5 23.0 5.4 11.6 2.2 6.2 3.0 13.5
Billions of Chained 2000 Dollars, s.a.a.r.
Net Goods & Services -507.2 -526.9 -513.8 -527.8 -549.1 -591.1 -602.7 -632.3 -624.4 -601.0 -604.1 -642.6
Exports of G&S 1003.3 999.0 1026.3 1075.8 1101.8 1119.4 1128.0 1155.3 1172.4 1199.3 1205.6 1236.4
Imports of G&S 1510.5 1525.9 1540.0 1603.6 1650.9 1710.5 1730.8 1787.7 1796.8 1800.3 1809.7 1879.0
___________________________________________________________________________________________________________________________
Billions of dollars, s.a.a.r.
US CURRENT ACCOUNT BALANCE -540.4 -520.4 -522.1 -505.5 -559.8 -634.7 -632.3 -733.8 -729.6 -732.9 -693.6 -863.2
Current Account as % of GDP -5.0 -4.8 -4.7 -4.5 -4.9 -5.5 -5.4 -6.1 -6.0 -6.0 -5.5 -6.8
Net Goods & Services (BOP) -498.6 -494.8 -493.4 -500.9 -544.1 -602.4 -626.4 -675.4 -666.6 -682.7 -723.8 -784.4
Investment Income, Net 34.6 47.8 47.8 74.3 82.2 59.4 69.2 39.2 56.2 53.5 72.8 35.3
Direct, Net 97.1 108.2 109.2 136.2 146.2 129.6 143.4 138.4 140.4 147.3 176.1 146.2
Portfolio, Net -62.4 -60.4 -61.4 -62.0 -63.9 -70.3 -74.2 -99.2 -84.3 -93.8 -103.3 -110.9
Other Inc. & Transfers, Net -76.5 -73.4 -76.5 -78.8 -97.8 -91.7 -75.1 -97.6 -119.2 -103.8 -42.6 -114.1
___________________________________________________________________________________________________________________________
1. Merchandise exports excluding computers and semiconductors.
2. Merchandise imports excluding oil, natural gas, computers, and semiconductors.
I-47
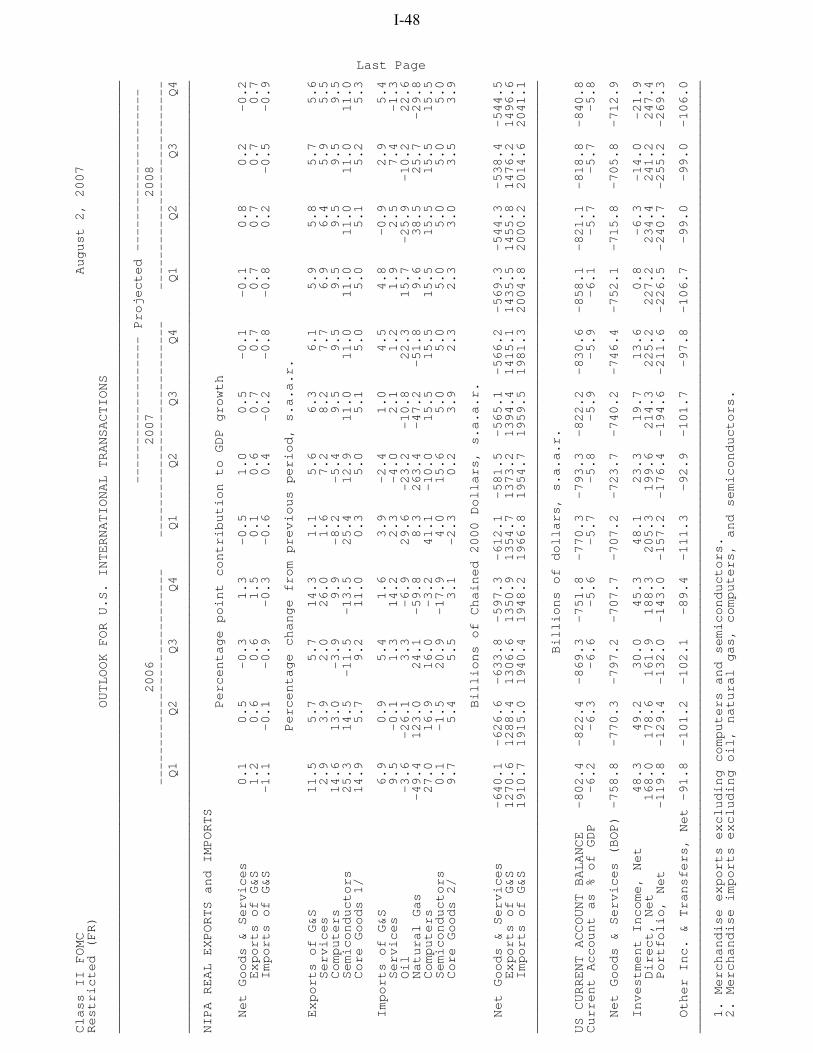
Class II FOMC August 2, 2007
Restricted (FR)
OUTLOOK FOR U.S. INTERNATIONAL TRANSACTIONS
___________________________________________________________________________________________________________________________
------------------- Projected ---------------------
2006 2007 2008
---------------------------- ---------------------------- ---------------------------
Q1 Q2 Q3 Q4 Q1 Q2 Q3 Q4 Q1 Q2 Q3 Q4
___________________________________________________________________________________________________________________________
NIPA REAL EXPORTS and IMPORTS
Percentage point contribution to GDP growth
Net Goods & Services 0.1 0.5 -0.3 1.3 -0.5 1.0 0.5 -0.1 -0.1 0.8 0.2 -0.2
Exports of G&S 1.2 0.6 0.6 1.5 0.1 0.6 0.7 0.7 0.7 0.7 0.7 0.7
Imports of G&S -1.1 -0.1 -0.9 -0.3 -0.6 0.4 -0.2 -0.8 -0.8 0.2 -0.5 -0.9
Percentage change from previous period, s.a.a.r.
Exports of G&S 11.5 5.7 5.7 14.3 1.1 5.6 6.3 6.1 5.9 5.8 5.7 5.6
Services 2.9 3.9 2.0 26.0 1.6 7.2 8.2 7.7 6.9 6.4 5.9 5.5
Computers 14.6 13.0 -3.9 9.9 -8.2 -5.4 9.5 9.5 9.5 9.5 9.5 9.5
Semiconductors 25.3 14.5 -11.5 -13.5 25.4 12.9 11.0 11.0 11.0 11.0 11.0 11.0
Core Goods 1/ 14.9 5.7 9.2 11.0 0.3 5.0 5.1 5.0 5.0 5.1 5.2 5.3
Imports of G&S 6.9 0.9 5.4 1.6 3.9 -2.4 1.0 4.5 4.8 -0.9 2.9 5.4
Services 9.5 -0.1 1.3 14.2 2.3 -4.0 2.1 1.2 1.9 2.5 7.4 -1.3
Oil -3.6 -26.1 3.3 -6.9 29.6 -23.2 -10.8 22.3 15.7 -25.9 -10.2 22.6
Natural Gas -49.4 123.0 24.1 -59.8 8.3 263.4 -47.2 -51.8 9.6 38.5 25.7 -29.8
Computers 27.0 16.9 16.0 -3.2 41.1 -10.0 15.5 15.5 15.5 15.5 15.5 15.5
Semiconductors 0.1 -1.5 20.9 -17.9 4.0 15.6 5.0 5.0 5.0 5.0 5.0 5.0
Core Goods 2/ 9.7 5.4 5.5 3.1 -2.3 0.2 3.9 2.3 2.3 3.0 3.5 3.9
Billions of Chained 2000 Dollars, s.a.a.r.
Net Goods & Services -640.1 -626.6 -633.8 -597.3 -612.1 -581.5 -565.1 -566.2 -569.3 -544.3 -538.4 -544.5
Exports of G&S 1270.6 1288.4 1306.6 1350.9 1354.7 1373.2 1394.4 1415.1 1435.5 1455.8 1476.2 1496.6
Imports of G&S 1910.7 1915.0 1940.4 1948.2 1966.8 1954.7 1959.5 1981.3 2004.8 2000.2 2014.6 2041.1
___________________________________________________________________________________________________________________________
Billions of dollars, s.a.a.r.
US CURRENT ACCOUNT BALANCE -802.4 -822.4 -869.3 -751.8 -770.3 -793.3 -822.2 -830.6 -858.1 -821.1 -818.8 -840.8
Current Account as % of GDP -6.2 -6.3 -6.6 -5.6 -5.7 -5.8 -5.9 -5.9 -6.1 -5.7 -5.7 -5.8
Net Goods & Services (BOP) -758.8 -770.3 -797.2 -707.7 -707.2 -723.7 -740.2 -746.4 -752.1 -715.8 -705.8 -712.9
Investment Income, Net 48.3 49.2 30.0 45.3 48.1 23.3 19.7 13.6 0.8 -6.3 -14.0 -21.9
Direct, Net 168.0 178.6 161.9 188.3 205.3 199.6 214.3 225.2 227.2 234.4 241.2 247.4
Portfolio, Net -119.8 -129.4 -132.0 -143.0 -157.2 -176.4 -194.6 -211.6 -226.5 -240.7 -255.2 -269.3
Other Inc. & Transfers, Net -91.8 -101.2 -102.1 -89.4 -111.3 -92.9 -101.7 -97.8 -106.7 -99.0 -99.0 -106.0
___________________________________________________________________________________________________________________________
1. Merchandise exports excluding computers and semiconductors.
2. Merchandise imports excluding oil, natural gas, computers, and semiconductors.
Last Page
I-48