fonterra dairy for life - · pdf filefonterra dairy for life. fonterra annual review -425 our...
TRANSCRIPT
ANNUAL REVIEW 2015FONTERRA CO-OPERATIVE GROUP LIMITED
FONTERRA DAIRY FOR LIFE
FONTERRA ANNUAL REVIEW 2015
OUR CO-OPERATIVE
A STRONG CO-OPERATIVE 42
SUSTAINABLE DAIRYING 45
OUR CUSTOMERS AND CONSUMERS 49
SUPPORTING COMMUNITIES 50
OUR PEOPLE 54
LETTER FROM THE CHAIRMAN 2
LETTER FROM THE CHIEF EXECUTIVE 10
OUR GLOBAL BRAND FAMILY 14
ANCHOR MAKING US PROUD 20
FINANCIAL HIGHLIGHTS 22
GROUP OVERVIEW 24
INGREDIENTS 28
CONSUMER AND FOODSERVICE 34
INTERNATIONAL FARMING 40
CORPORATE GOVERNANCE 56
BOARD OF DIRECTORS 64
FONTERRA MANAGEMENT TEAM 66
SUMMARY FINANCIAL STATEMENTS 68
INDEPENDENT AUDITORS’ REPORT 88
STATUTORY INFORMATION 89
FIVE YEAR SUMMARY 90
NON-GAAP MEASURES 92
GLOSSARY 93
DIRECTORY 94
THE CONTENTS
OUR PRIORITIES
OUR PERFORMANCE

INTRODUCTION | 1
FONTERRA ANNUAL REVIEW 2015
PAGE 24
PAGE 44
PAGE 2
Normalised EBIT up 94 per cent to $974m with a strong contribution from New Zealand ingredients and Asia/China consumer businesses.
Our farmers have continued to make progress with stock excluded from 98 per cent of defined waterways on mapped farms.
A tough season for farmer shareholders with a $4.65 Cash Payout.
98%
$974M
PAGE 19
Our strength comes from having capable, confident and resilient people on both sides of the farm gate.
PAGE 22
We delivered a strong rebound in profitability and this is expected to continue.
PAGE 50
Supporting communities where we live, work and farm is part of who we are.
$4.65
THE YEAR IN REVIEW
per kgMS

2 | OUR PRIORITIES
FONTERRA ANNUAL REVIEW 2015
We have put in place a strong platform for growth, including a strategic cornerstone in our key market of China, and this has set us up well for a turn in the market. We have seen early returns from this work, with the Co-operative turning in a credible result, despite the challenging environment.
But while we are building a much stronger Co-operative for the future, I am acutely aware this has not translated into financial gains for our farmers this year.
The $4.40 kgMS Farmgate Milk Price reflects market prices which declined 36 per cent this year, largely as a result of the significant imbalance in global supply and demand amid geo-political concerns around the world.
Our good performance this year did not flow into the dividend. The 25 cent dividend reflects higher funding costs we have had because of around $900 million invested primarily in capacity and maintenance to support milk growth here in New Zealand. Added to that are the $364 million invested in completing our farm development in our key market of China, $750 million in our partnership investment with Beingmate to expand into the infant nutrition market in China and finally, the costs of our higher Advance Rate early in the season.
THE YEAR HAS BEEN DIFFICULT BECAUSE GLOBAL PRICES KEPT FALLING IN RESPONSE TO DIMINISHING DEMAND. DEFINING BECAUSE WE ARE ROUNDING OFF ONE OF THE BIGGEST PHASES OF CAPACITY DEVELOPMENT WE HAVE SEEN IN THE CO-OPERATIVE.
LETTER FROM THE CHAIRMANThe 2015 financial year has been difficult for global dairy and defining for our Co-op.
SUPPLY, DEMAND IMBALANCEThe GlobalDairy Trade™ index hit a five-year low.
NET PROFITAFTER TAXOur net profit after tax is 183 per cent higher at $506 million.183% 0
500
1,000
1,500
SEP 15APR 15NOV 14JUN 14JAN 14AUG 13
FONTERRA ANNUAL REVIEW 2015

FONTERRA ANNUAL REVIEW 2015
Maintaining our earlier Advance Rate, set at 64 per cent of our original forecast Farmgate Milk Price of $7.00 per kgMS, meant that at the half year we had effectively paid out 82 per cent of the revised forecast Farmgate Milk Price of $4.70 per kgMS made on 10 December 2014. This added to funding costs due to higher working capital requirements. In total, interest costs on funding were up $95 million to $427 million, with an impact of around six cents per share.
The dividend this year is 65 per cent of our adjusted net profit after tax (NPAT) which is at the lower end of our dividend policy range of 65 to 75 per cent of adjusted NPAT over time. While conditions are challenging, it is important to ensure that we maintain a strong balance sheet and the financial discipline needed to underpin a strong Co-operative.
This is a year where a higher dividend would have been welcomed to help smooth the impact of a lower Farmgate Milk Price and overall reduced farm incomes. However this is a watershed year with significant investments made, including further capacity projects. Strengthening our Co-operative comes with short-term costs which are being felt this year, but there are long-term benefits, some of which will flow in the new season.
There are already positive signs that the investments in our strategy are paying off in our return on capital of 8.9 per cent. Our ingredients return on capital was 9.3 per cent and our consumer and foodservice business achieved a return on capital of 25.5 per cent. These returns were delivered despite the continued challenges we have faced in the Australian market, including the fire at our Stanhope cheese factory which was a defining factor in an adverse product mix, coupled with lower sales of nutritionals. This impacted our performance and improving our business results in Australia is a high priority for management with a clear plan in place.
We are seeing good growth in our consumer and foodservice businesses and the results of a major push in our ingredients business to offset low milk prices with improved margins.
Despite drought in some regions and floods late in the season, our farmer shareholders lifted production season-on-season. Milk collection across New Zealand for the 2014/15 season to 31 May 2015 was 1,614 million kgMS, up two per cent.
We expect the lift in profitability to carry through into the new season. This is factored into our 2016 financial year forecast earnings per share range of 40-50 cents, which will help offset the continued low level of global dairy prices. Our track record this year in growing consumer and foodservice, along with our ingredients margins, make us very confident in our forecast.
OUR PRIORITIES | 3 OU
R P
RIO
RIT
IES
FONTERRA ANNUAL REVIEW 2015

FINAL CASH PAYOUTFor the 2014/15 season we have a final Cash Payout of $4.65 per kgMS for a fully shared-up farmer. This includes the Farmgate Milk Price of $4.40 per kgMS and a 25 cent dividend. As detailed previously, the Farmgate Milk Price reflects market prices and the dividend reflects our higher funding costs, especially in New Zealand where we have a total investment of around $900 million primarily in capacity, as well as maintenance to enable us to process growth in supply. This investment formed part of the $2.1 billion spent since 2013 which expanded our processing capacity and will support a higher return on investment for our farmers’ capital.
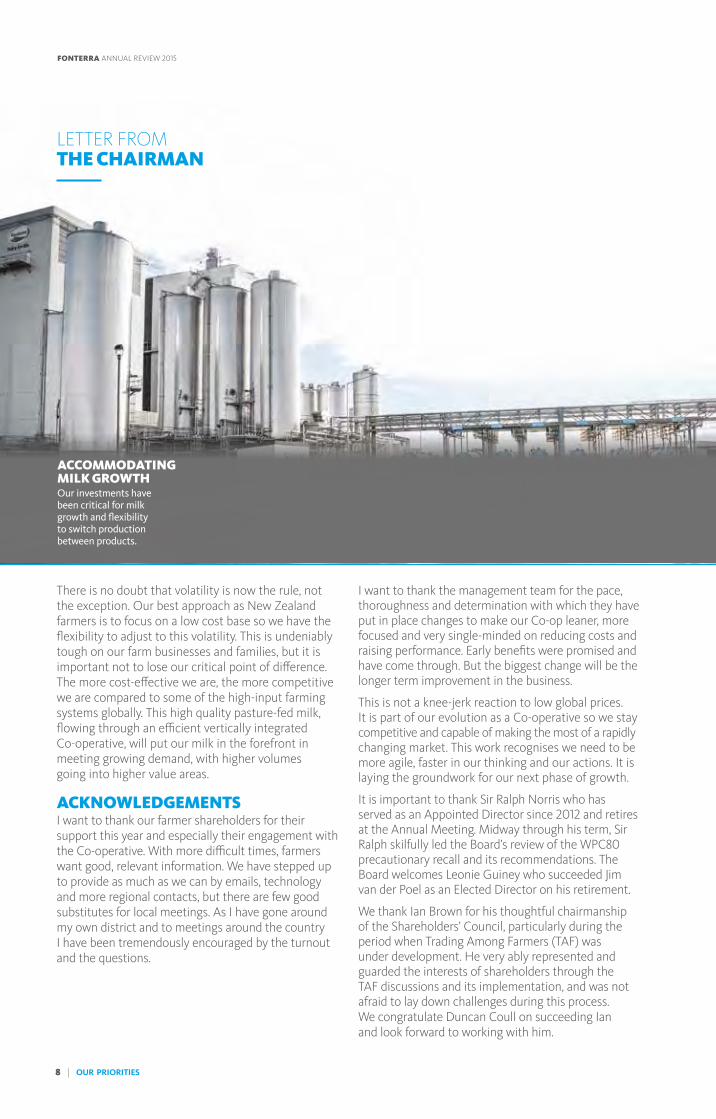
Our investments in New Zealand have been critical to accommodating milk growth of 10 per cent from the 2012/13 season. Building the new plants has also been important for efficiency. We now have far more flexibility to switch production between products in favour of those delivering the best returns in any one season. This overcomes the product mix disadvantages, which have affected earnings in the past and will improve peak costs, which last season were $59 million, or four cents per kgMS.
We have had an intensive period of capacity growth in Canterbury, Southland, Waikato and the lower North Island including both powders and premium products for consumer and foodservice.
Investments in New Zealand this year includes $167 million to complete the Pahiatua dryer and distribution centre, and $132 million for the Anhydrous Milk Fat, Milk Protein Concentrate and reverse osmosis plants at Edendale, all commissioned in 2015. It also includes the $122 million of investment in the dryer at Lichfield due for commissioning in 2016. Combined they represent 8.2 million litres more capacity. With capacity now more in line with current expectations of milk growth, we have reduced the amount of capital expenditure considerably in 2016 to $900 million.
Globally we invested $364 million in farm development and livestock purchases in China as part of our commitment to the Chinese dairy industry and the creation of our own milk supply to support our consumer growth in this market. These are now well-performing farms achieving good levels of on-farm efficiency, but just like here in New Zealand, decisions have been made to lower costs and production at a time of low milk prices.
Now that we are completing the development phase we will move to establish partnerships in them. We also invested $750 million in our global partnership with Beingmate that provides a cornerstone from which to grow in the infant formula market. This partnership brings together specialty ingredients from our European business, nutritionals from our Australian plants and milk from New Zealand, sold through our own Anmum™ brand. Greater China
INFORMATION FASTERWe have made it our mission to get farmers information faster, in formats which are more convenient.
LETTER FROM THE CHAIRMAN
4 | OUR PRIORITIES
FONTERRA ANNUAL REVIEW 2015 FONTERRA ANNUAL REVIEW 2015

is a very important dairy market and we now have investments which link milk from our New Zealand farms to consumers and customers.
In any season, some parts of our Co-operative may perform better than others, depending on global pricing and in-market dynamics. By providing clear reporting on each of our business segments and each of our markets we are ensuring our farmer shareholders can see where we are doing well and clearly see the steps we are taking when performance needs improving.
GENERATING HIGHER VALUEFonterra’s strategy emphasises shifting greater volumes of milk to higher returning products.
In our ingredients business opportunities to achieve higher returns can be influenced by market conditions and prices. The product mix gross margin in our New Zealand ingredients business was up 24 per cent to $1.3 billion, as we successfully adjusted our product mix to take advantage of improved prices for cheese and casein relative to Whole Milk Powder. We also achieved premiums on the sale of specialised ingredients used in dairy applications, sports nutrition and medical applications.
Our consumer and foodservice businesses in Asia and China achieved record performance helped by low milk costs and they maintained their strong
contribution to the Co-operative’s normalised EBIT of $974 million. Consumer and foodservice volumes increased by 27 per cent to 1.7 million metric tonnes (MT) and this contributed to normalised EBIT of $408 million.
This result was helped by finalising the reorganisation of our Dairy Partners Americas (DPA) joint venture with Nestlé which gave us management control of DPA Brazil and the consumer business in Venezuela. Their consolidation into the consumer and foodservice segment contributed an additional 324,650 MT of sales.
DAIRY INDUSTRY RESTRUCTURING ACT REVIEWThe Government is reviewing competition in the New Zealand dairy market and possible changes to the Dairy Industry Restructuring Act (DIRA).
One of the triggers for a review is when the proportion of milk collected by independent processors exceeds 20 per cent. These processors are collecting 22 per cent of farm gate milk supply in the South Island and just over 14 per cent nationally. While they are collecting more volumes it’s important to note that total volumes produced in New Zealand have also grown from 1.2 billion kgMS in the 2001/02 season to 1.9 billion kgMS in the 2014/15 season. Fonterra’s share of this higher total is 85.4 per cent.
FOODSERVICE SUCCESSConsumer and foodservice volumes increased by 27 per cent to 1.7 million MT.
DIRAThe government review of the DIRA is underway and we have made several submissions.
OUR PRIORITIES | 5 OU
R P
RIO
RIT
IES
FONTERRA ANNUAL REVIEW 2015

Our submission to the Commerce Commission says parts of DIRA contribute to a competitive, efficient dairy sector. These include the Milk Price regime and the obligation to supply Goodman Fielder and small niche processors with raw milk.
However, we believe other parts of DIRA are no longer necessary given the competitive market, such as the rule that we have to accept all new milk supply. We believe it is also time to end the requirement to provide milk to large processors establishing a foothold in New Zealand. They no longer need a regulatory leg-up, paid for by our farmers.
STRONGER TOGETHERIn recent years our farmers have made major investments in fencing waterways, nutrient management and compliance and capital works like effluent system upgrades. Farmers support the principle of sustainability and have increasingly embraced it to the point where we are world leading in areas such as managing nutrient impacts. Our farmers need to be applauded for their commitment and their investment which is not only improving the sustainability of their farms but also natural resources in their regions.
This year our Co-operative has stepped up our presence in these regions, providing more local contacts between farmers and their co-operative. We have focused on practical solutions like Fonterra Farm Source™, our comprehensive package of regional
advice, digital tools, competitive discounts on farm necessities and financial options for managing farmers’ businesses. We now have more than 9,000 farmers benefiting from Fonterra Farm Source™ Rewards Dollars, $4 million of which have been accumulated to be redeemed for a range of products or Fonterra Farm Source™ vouchers.
Fonterra Farm Source™ stores market share has increased since launch, which confirms the value farmers place on the competitive discounts provided. Farmers have also commented positively on the stronger regional networks and support being provided to them.
We have moved key people away from head office and into the regions, so farmers can now call on one of seven regional heads who know their area, the conditions, local government requirements and how our Co-op can support them. Having senior eyes and ears on the ground enables our Co-op to get practical things done more quickly, such as rolling out our emergency response team during the lower North Island floods. Regional heads also have the depth of knowledge across our business to answer farmers’ questions and work with them to resolve any problems.
We have also made it our mission to get farmers information faster in formats which are more convenient, such as mobile apps delivering milk data, tanker arrival times and now Fonterra news direct to their smartphone.
FONTERRA FARM SOURCE™ REWARDSThere are more than 9,000 farmers benefiting from Fonterra Farm Source™ Rewards Dollars, $4 million of which have been accumulated to be redeemed for a range of products or vouchers.
LETTER FROM THE CHAIRMAN
MARKET SHARE UPFonterra Farm Source™ market share has increased since launch.
6 | OUR PRIORITIES
FONTERRA ANNUAL REVIEW 2015 FONTERRA ANNUAL REVIEW 2015
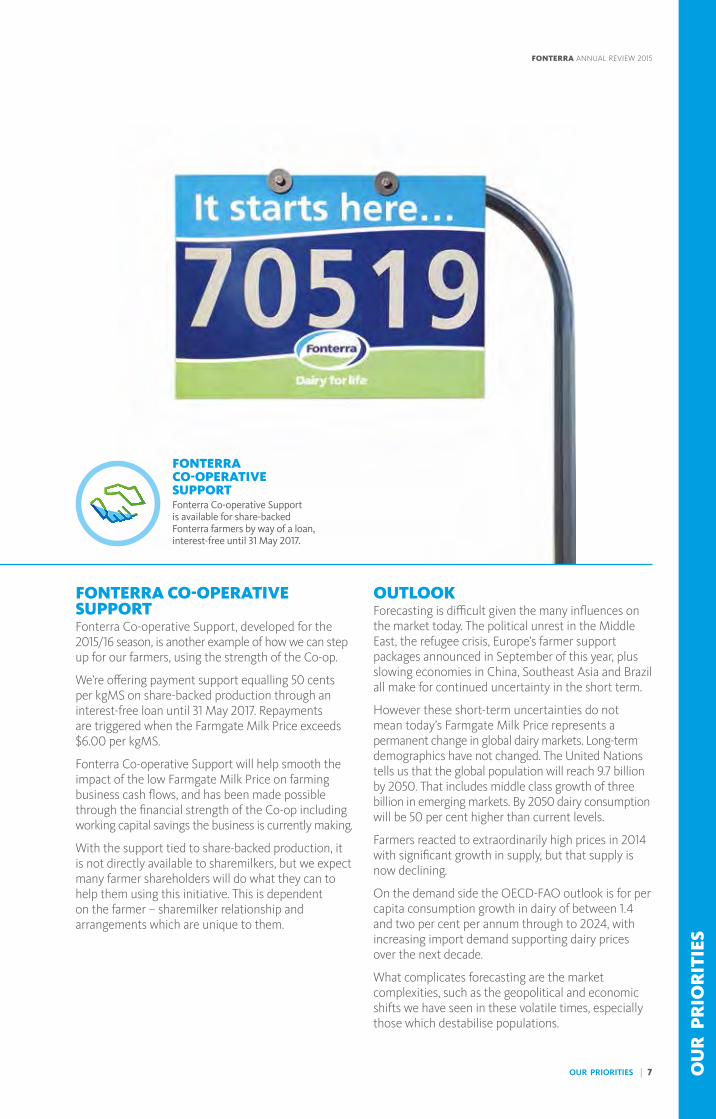
FONTERRA CO-OPERATIVE SUPPORT Fonterra Co-operative Support, developed for the 2015/16 season, is another example of how we can step up for our farmers, using the strength of the Co-op.
We’re offering payment support equalling 50 cents per kgMS on share-backed production through an interest-free loan until 31 May 2017. Repayments are triggered when the Farmgate Milk Price exceeds $6.00 per kgMS.
Fonterra Co-operative Support will help smooth the impact of the low Farmgate Milk Price on farming business cash flows, and has been made possible through the financial strength of the Co-op including working capital savings the business is currently making.
With the support tied to share-backed production, it is not directly available to sharemilkers, but we expect many farmer shareholders will do what they can to help them using this initiative. This is dependent on the farmer – sharemilker relationship and arrangements which are unique to them.
OUTLOOKForecasting is difficult given the many influences on the market today. The political unrest in the Middle East, the refugee crisis, Europe’s farmer support packages announced in September of this year, plus slowing economies in China, Southeast Asia and Brazil all make for continued uncertainty in the short term.
However these short-term uncertainties do not mean today’s Farmgate Milk Price represents a permanent change in global dairy markets. Long-term demographics have not changed. The United Nations tells us that the global population will reach 9.7 billion by 2050. That includes middle class growth of three billion in emerging markets. By 2050 dairy consumption will be 50 per cent higher than current levels.
Farmers reacted to extraordinarily high prices in 2014 with significant growth in supply, but that supply is now declining.
On the demand side the OECD-FAO outlook is for per capita consumption growth in dairy of between 1.4 and two per cent per annum through to 2024, with increasing import demand supporting dairy prices over the next decade.
What complicates forecasting are the market complexities, such as the geopolitical and economic shifts we have seen in these volatile times, especially those which destabilise populations.
FONTERRA CO-OPERATIVE SUPPORTFonterra Co-operative Support is available for share-backed Fonterra farmers by way of a loan, interest-free until 31 May 2017.
OUR PRIORITIES | 7 OU
R P
RIO
RIT
IES
FONTERRA ANNUAL REVIEW 2015
There is no doubt that volatility is now the rule, not the exception. Our best approach as New Zealand farmers is to focus on a low cost base so we have the flexibility to adjust to this volatility. This is undeniably tough on our farm businesses and families, but it is important not to lose our critical point of difference. The more cost-effective we are, the more competitive we are compared to some of the high-input farming systems globally. This high quality pasture-fed milk, flowing through an efficient vertically integrated Co-operative, will put our milk in the forefront in meeting growing demand, with higher volumes going into higher value areas.
ACKNOWLEDGEMENTSI want to thank our farmer shareholders for their support this year and especially their engagement with the Co-operative. With more difficult times, farmers want good, relevant information. We have stepped up to provide as much as we can by emails, technology and more regional contacts, but there are few good substitutes for local meetings. As I have gone around my own district and to meetings around the country I have been tremendously encouraged by the turnout and the questions.
I want to thank the management team for the pace, thoroughness and determination with which they have put in place changes to make our Co-op leaner, more focused and very single-minded on reducing costs and raising performance. Early benefits were promised and have come through. But the biggest change will be the longer term improvement in the business.
This is not a knee-jerk reaction to low global prices. It is part of our evolution as a Co-operative so we stay competitive and capable of making the most of a rapidly changing market. This work recognises we need to be more agile, faster in our thinking and our actions. It is laying the groundwork for our next phase of growth.
It is important to thank Sir Ralph Norris who has served as an Appointed Director since 2012 and retires at the Annual Meeting. Midway through his term, Sir Ralph skilfully led the Board’s review of the WPC80 precautionary recall and its recommendations. The Board welcomes Leonie Guiney who succeeded Jim van der Poel as an Elected Director on his retirement.
We thank Ian Brown for his thoughtful chairmanship of the Shareholders’ Council, particularly during the period when Trading Among Farmers (TAF) was under development. He very ably represented and guarded the interests of shareholders through the TAF discussions and its implementation, and was not afraid to lay down challenges during this process. We congratulate Duncan Coull on succeeding Ian and look forward to working with him.
LETTER FROM THE CHAIRMAN
ACCOMMODATING MILK GROWTHOur investments have been critical for milk growth and flexibility to switch production between products.
8 | OUR PRIORITIES
FONTERRA ANNUAL REVIEW 2015 FONTERRA ANNUAL REVIEW 2015

On a personal noteAll of us face a new season which will present us with some real challenges on our farms, in our finances and even in our families as we try to work through a hard year. It is important we all look beyond the farm gate to recognise the strength of the Co-operative we belong to and also recognise that the fundamentals of our industry have not changed. Dairy remains a great industry and business to be in and I have full confidence that this will not change.
We have a unique strength coming from having a vertically integrated supply chain with scale, that connects high quality milk from pasture raised cows to consumers around the world.
More than ever before, it is critical that we stay on course and maintain our global position. We have a highly capable management team which has the Board’s support and a focused strategy.
Fonterra was formed to set ourselves and our farmers up for the future. We have a vertically integrated Co-operative, operating ably across ingredients, consumer and foodservice and doing this from farm to market. We have built scale and market focus across the world. Now we’re focused on being faster on our feet in a market which can change more rapidly than we have seen before. Our farmers have concentrated on efficiency, quality and competitive costs. As we make even more of our pasture-based model, we can expect to see more gains in productivity. All of these qualities stand us in good stead.
John WilsonChairman
DAIRY REMAINS A GREAT INDUSTRYDairy remains a great business to be in and I have full confidence that this will not change.
OUR PRIORITIES | 9 OU
R P
RIO
RIT
IES
FONTERRA ANNUAL REVIEW 2015
Our response paid off in the second half with a rebound in performance and profitability, although our Farmgate Milk Price remains the outcome of extreme volatility. Even with less demand we lifted total group volumes by nine per cent to 4.3 million MT, with consumer and foodservice volumes up a significant 27 per cent to 1.7 million MT. These volumes contributed to normalised EBIT of $974 million for the group, up 94 per cent.
This year’s market conditions were some of the most difficult I have known. Prices are often cyclical, but it is rare to see a combination of geopolitical turmoil in the Middle East and Russia, serious disease outbreaks such as Ebola in Africa, an economic slowdown in China and the sharp drop in oil and mineral prices all at the same time. These suppressed demand at a time when farmers all around the world had ramped up production in response to previous high prices. This resulted in an inevitable impact on pricing and all of these factors are making it difficult to forecast near-term conditions.
We will be more than ready when the market turns.That’s because we have thoroughly reviewed our execution of strategy, our processes and working practices to embed long-term change.
WITH FARMERS FACING A REDUCED PAYOUT WE HAD TO IMPROVE OUR SALES MIX, ACHIEVE MORE EFFICIENCIES, MAXIMISE OUR GROSS MARGINS AND ACHIEVE OUR STRATEGIC GOALS FASTER.
LETTER FROM THE CHIEF EXECUTIVEWhen the fall-off in global demand and pricing forced us to reduce our Farmgate Milk Price forecast to $4.70 kgMS in December, I sent a clear, strong message to our Co-operative’s senior leaders.
GROUP EBITNormalised EBIT was $974 million for the group, up 94 per cent.
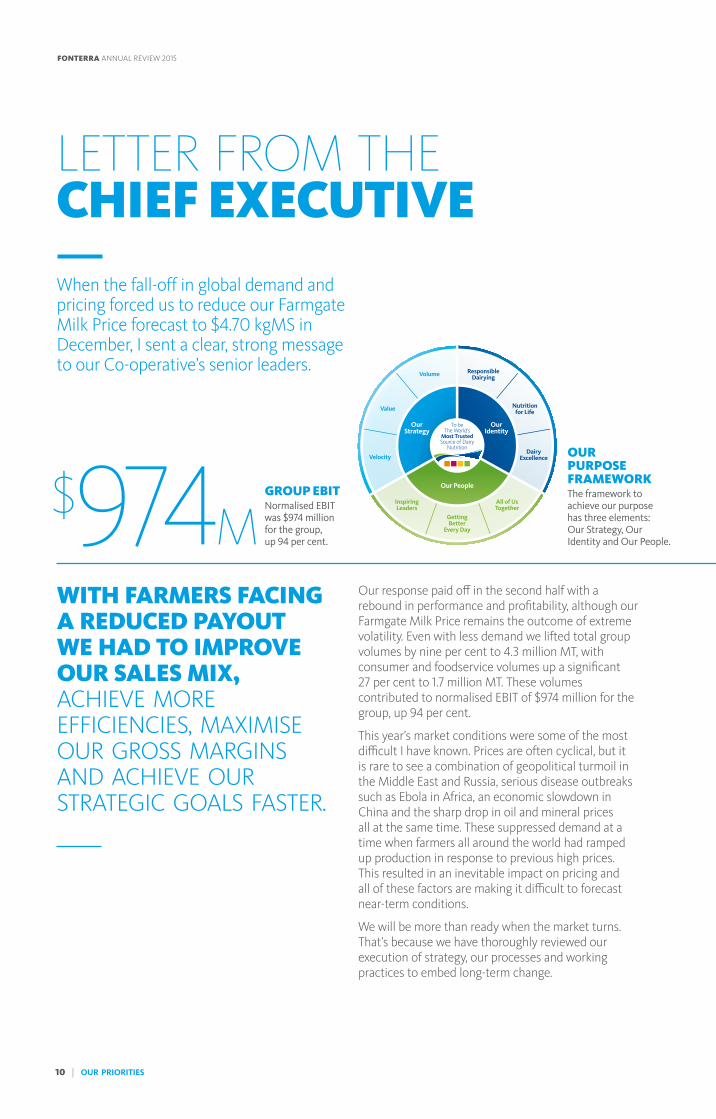
OUR PURPOSE FRAMEWORKThe framework to achieve our purpose has three elements: Our Strategy, Our Identity and Our People.
Volume Responsible Dairying
Value Nutrition for Life
VelocityDairy
Excellence
Inspiring Leaders
GettingBetter
Every Day
All of UsTogether
Our People
OurStrategy
OurIdentity
The V3 strategy is all about driving volume, value and velocity through our seven strategic paths:
• Optimise New Zealand milk.• Build and grow beyond our current consumer positions.• Deliver on Foodservice potential.• Grow our Anlene™ business.• Develop leading positions in paediatrics and maternal nutrition.• Selectively invest in milk pools.• Align our business and organisation to enable the strategy.
OUR STRATEGY
Responsible Dairying• Committed to helping our dairying communities thrive.• Champion of the health of our farms and waterways.
Nutrition for Life• Delivering superior products to improve health at key life stages.• Making dairy nutrition accessible.
Dairy Excellence• Global leader in dairy safety and quality.• Innovation, expertise and openness.
Inspiring Leaders• Trusted leaders inspiring exceptional performance.
Getting Better Every Day• Simplicity, clarity and focus in everything we do.• Capable, passionate people, growing every day.• High performing teams who own our collective success.
All of Us Together• A collaborative and connected culture.• Caring for our people and our consumers.• Accountable to our customers, communities and shareholders.
OUR IDENTITY
OUR PEOPLE
With our purpose, story and values at the heart, our ‘This is Fonterra framework’ brings together our people, identity and strategy commitments to guide us ‘to be the world’s most trusted source of dairy nutrition’.
THIS IS FONTERRAFRAMEWORK
To beThe World’s
Most TrustedSource of Dairy
Nutrition
$974M
10 | OUR PRIORITIES
FONTERRA ANNUAL REVIEW 2015 FONTERRA ANNUAL REVIEW 2015
I was challenged on this change by several of our people, who asked if our payout was higher, would we have done this review. The answer is yes. Progress demands that we are proactive, not reactive. We have a single-minded purpose to be the most trusted source of dairy nutrition.
Our ‘This is Fonterra’ framework has three elements: Our Strategy, Our Identity and Our People. We have made considerable progress with Our Strategy and Our Identity over the past three years, but less with Our People as we have worked our way through a series of challenges. We have a talented workforce but we haven’t always had the right environment to get the best from them.
To perform at their best, people need simplicity, focus and clarity and a collaborative and accountable working culture. Instead we had growing complexity that was beginning to get in the way of quick and clear decisions and actions. This meant opportunities were lost.
By working together with a clear sense of purpose we will be able to move even faster on our volume and value priorities. We have unfortunately lost some good people as we have reduced roles, but this is not about jobs and cost cutting. It is about mindset. It is about focusing all our resources to make us faster, more efficient and more accountable for getting sustainable results.
Everyone with a stake in Fonterra wants to be confident we have actionable plans that will produce results. We do. Post balance date my leadership team signed off on a number of transformation initiatives. We are already well underway and are confident where we are heading, the opportunities available, and our ability to achieve real results and realise our Co-operative’s full potential.
STRONG REBOUND SUPPORTS FUTURE PROGRESSOur results demonstrate the benefits of this continued focus despite the much tougher global market, supported by the valuable contribution made from important capital investments in three crucial areas.
We continued to strengthen our home base, with the added capacity to grow margins for ingredients and market share, volume and value across our consumer and foodservice channels. We invested for the long term in our key market of China, pushing ahead with farm developments and building our Beingmate global partnership. We helped our farmers manage their on-farm costs with Fonterra Farm Source™ discounts and deferred payment terms.
OUR PRIORITIES | 11 OU
R P
RIO
RIT
IES
FONTERRA ANNUAL REVIEW 2015
Our New Zealand ingredients business delivered a solid performance and our consumer and foodservice businesses in Asia and China produced record results, contributing to a net profit after tax of $506 million, up 183 per cent.
Our $2.1 billion investment in growing and updating our capacity and asset base in New Zealand over the past three years is now delivering tangible benefits. Our new plants stand out in terms of efficiency gains and a more flexible product mix. In the second half we made the most of this flexibility, favouring production of products where we could secure higher prices and changing production from powders to cheese and casein to capture shifts in customer demand.
Our $230 million investment in the past two years on capacity to support our consumer and foodservice performance is generating the volume and value growth we want, especially in Asian markets. This progress is further supported by an investment of approximately $30 million in our consumer packing plant in Indonesia. We also invested some $750 million in Beingmate in China to accelerate access to the infant formula market, from our milk pools in New Zealand, Australia and Europe.
STRONG VOLUME AND VALUE GROWTHWe achieved significant progress in our consumer and foodservice strategy, where we are aiming to win hearts, minds and especially market share in our eight strategic markets of New Zealand, Australia, Sri Lanka, Malaysia, Chile, China, Brazil and Indonesia. We already have leadership positions in key dairy categories in New Zealand, Malaysia, Sri Lanka and Chile. In China, Brazil, Australia and Indonesia we are building our market positions and operations to meet our strategic targets.
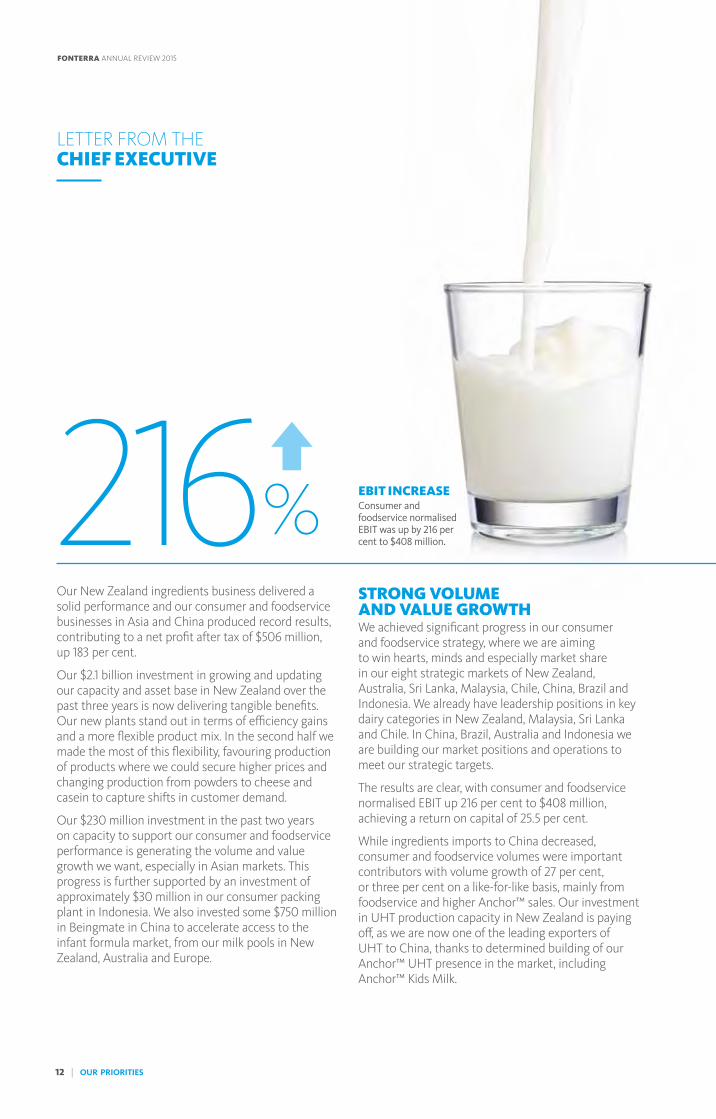
The results are clear, with consumer and foodservice normalised EBIT up 216 per cent to $408 million, achieving a return on capital of 25.5 per cent.
While ingredients imports to China decreased, consumer and foodservice volumes were important contributors with volume growth of 27 per cent, or three per cent on a like-for-like basis, mainly from foodservice and higher Anchor™ sales. Our investment in UHT production capacity in New Zealand is paying off, as we are now one of the leading exporters of UHT to China, thanks to determined building of our Anchor™ UHT presence in the market, including Anchor™ Kids Milk.
216 EBIT INCREASEConsumer and foodservice normalised EBIT was up by 216 per cent to $408 million.
%
LETTER FROM THE CHIEF EXECUTIVE
12 | OUR PRIORITIES
FONTERRA ANNUAL REVIEW 2015 FONTERRA ANNUAL REVIEW 2015

In Asia, strong volume growth was due to a turnaround in Sri Lanka and combined volume growth of 11 per cent in foodservice across the region, which also locked in double digit growth in Indonesia, Malaysia and the Philippines. Consumer volume growth in Indonesia is supported by our capacity investment in West Java.
Our first milk powder manufacturing plant had its first commercial run in June with the capacity to pack and blend 12,000 tonnes of milk powder products annually for the Anlene™, Anmum™ and Anchor™ Boneeto brands.
Innovation and speed to market has helped achieve volume growth in New Zealand with the launch of new products, Anchor Uno™ yoghurt for children and Anchor™ Greek yoghurt into the market.
FOODSERVICE FLOURISHINGWe have always believed in the potential of the foodservice sector and the competitive position we have built in it. This is based on our understanding of dairy and the profit drivers behind commercial kitchens of all scales.
This repeatable model offers a compelling combination of high-performing products and professional menu development support that improves demand and profitability. While markets remain tough, foodservice has made a valuable contribution to volume and value, giving us confidence in our aim to grow it into a $3.4 billion and 3.2 billion LME business by 2020.
Asia is important for foodservice growth and we are winning there with combined volume growth of 11 per cent across the region. But our opportunities are not limited to Asia or Greater China, as Latin America, the United States and closer to home in Australia and New Zealand also offer growth opportunities. In Australia, our domestic foodservice business achieved 10 per cent volume growth compared to the same time last year after five years of flat volume.
In China, the foodservice business was rolled out into 13 new cities, taking the total to 40, and we launched our new foodservice application centre in Shanghai in November.
UHT MARKET GROWTH
Our investment in expanding our UHT
production capacity in New Zealand is paying off,
with Fonterra now one of the leading exporters
of UHT to China.
USEFUL FACTWe have leadership positions in our consumer and foodservice business in key dairy categories in New Zealand, Malaysia, Sri Lanka and Chile.
OUR PRIORITIES | 13 OU
R P
RIO
RIT
IES
FONTERRA ANNUAL REVIEW 2015

OUR GLOBAL BRAND FAMILYWe have a portfolio of world-leading brands with breakthrough products that bring dairy nutrition to life, in new ways, at all life stages.
We are passionate about dairy and what it can do for life. So we work hard to bring superior dairy-based nutrition with a taste advantage that’s more accessible and more engaging for more people – every day.
TOTAL ANCHOR™ PERFORMANCE ACROSS ALL MEASURED CATEGORIES IN WHICH ANCHOR™ PARTICIPATES.
NEW ZEALAND
SRI LANKA
MARKET POSITION IN CATEGORY:
#
#
1
1
14 | OUR PRIORITIES
FONTERRA ANNUAL REVIEW 2015 FONTERRA ANNUAL REVIEW 2015

MARKET POSITION IN CATEGORY:
TOTAL ANMUM™ PERFORMANCE FOR MATERNAL, PREMIUM, AND PREMIUM GUMP.
MALAYSIA
INDONESIA
#
#
2
5
Putting mum at the centre of everything we do, with great products, innovative service/tools,
and the community connections mum needs to raise amazing young minds.
Freedom of movement starts with strong bones and strong bones start with Anlene™.
TOTAL ANLENE™ PERFORMANCE FOR ADULT POWDERS (INCLUDING SUPER BEVERAGES).
MALAYSIA
SRI LANKA
INDONESIA
MARKET POSITION IN CATEGORY:
#
#
#
1
1
1
OUR PRIORITIES | 15 OU
R P
RIO
RIT
IES
FONTERRA ANNUAL REVIEW 2015
STRATEGIC MARKET UPDATE: GREATER CHINAOur growing consumer and foodservice volumes in Greater China continue to highlight the opportunities in our largest market, despite the current softer demand for ingredients and the economic slowdown.
The market access provided through New Zealand’s Free Trade Agreement opened opportunities to build on the years invested in relationships. Even though this is a market with some difficulties today it is important we continue to build here for the future. We remain confident in our long-term potential and ability to grow demand. The volume growth achieved with Anchor™ UHT this year is a good example, especially Anchor™ Kids Milk that reached a 13 per cent market share in June.
Consumer and foodservice growth underlines the importance of our work to create an integrated business in China. Our seven farms in two hubs underpin this work and we now have 25,000 milking cows producing around 12 million kgMS for the year. The farms’ ability to produce safe, high-quality milk will support future growth, but currently International Farming is running at a loss because of low domestic liquid milk prices in the market and farm development costs.
The farms are strategically important but owning them outright is not, so we are pursuing a partnership model. This will enable us to progress our milk pool strategy while recouping establishment and running costs.
We continue to make progress with our global partnership with Beingmate, which puts our Anmum™ brand and our high-quality dairy ingredients in a strong position to meet the needs of China’s growing infant formula market. Our investment in Beingmate has been secured and we are now selling Anmum™ through Beingmate channels in China. The joint venture proposal with Beingmate in relation to Fonterra’s Darnum plant in Australia is also progressing and we anticipate further developments in the 2016 financial year.
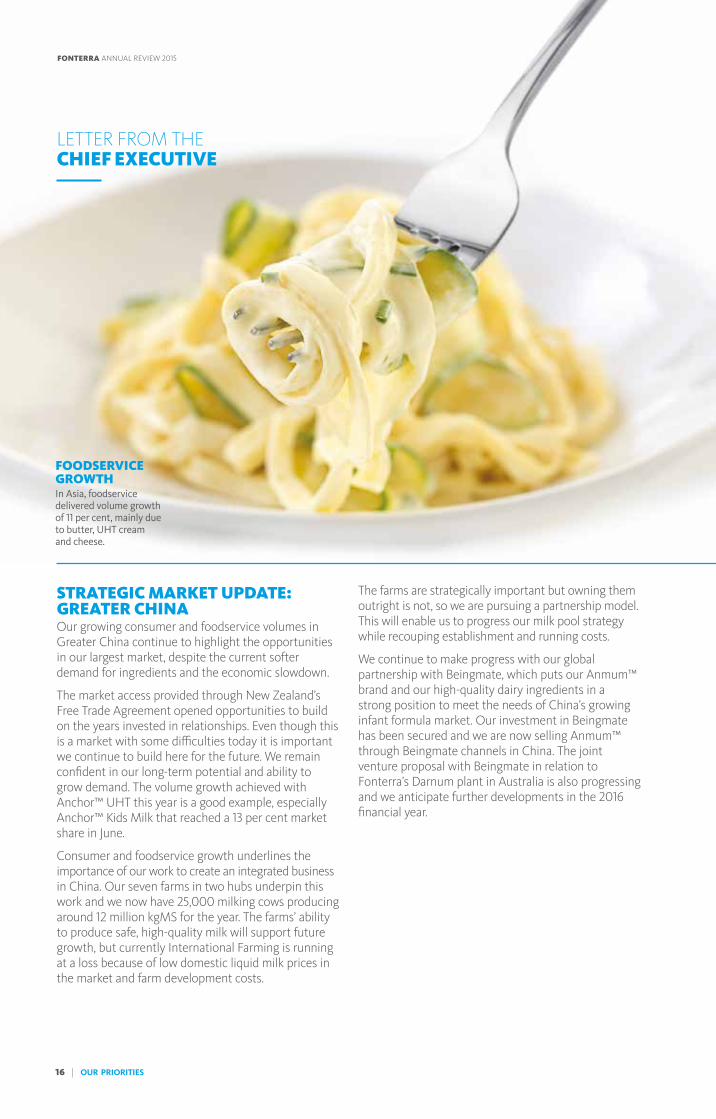
FOODSERVICE GROWTHIn Asia, foodservice delivered volume growth of 11 per cent, mainly due to butter, UHT cream and cheese.
LETTER FROM THE CHIEF EXECUTIVE
16 | OUR PRIORITIES
FONTERRA ANNUAL REVIEW 2015 FONTERRA ANNUAL REVIEW 2015
STRATEGIC MARKET UPDATE: AUSTRALIAAustralia is a tough market. It is highly competitive, margins are squeezed and we have had some setbacks – Darnum is one and our fire at the Stanhope cheese factory is another. But our team is fully committed to progress an integrated model as part of our global multi-hub strategy and they are achieving some wins.
Our Australian team is also concentrating on increasing volumes and revenue in priority areas such as foodservice, while reviewing our options in crowded market areas such as yoghurt and dairy desserts.
We are retaining milk volumes in a competitive market and our 10-year partnership with Woolworths, which gives us certainty in the fresh milk market, is now underway with the successful commissioning of a state-of-the-art beverages plant.
We have a detailed plan to get back to acceptable performance, based on Australia’s important role in our multi-hub strategy. Ultimately the aim is to have Darnum and Dennington as the core of a growing nutritionals business while we improve our capacity in cheese through a potential rebuild of our Stanhope factory. The fire at Stanhope has constrained our cheese performance so we can expect some more short-term pain, but we are determined to move faster on achieving a superior and more profitable product portfolio.
PROFITABLE PARTNERSHIPSChina and Australia are important to our global multi-hub strategy. This is designed to complement New Zealand supply with milk pools offshore, protecting our scale so we remain globally relevant.
Partnerships and joint ventures are important to this strategy. Our A-Ware partnership in the Netherlands is a prime example. Fonterra’s Heerenveen ingredients plant was commissioned in early 2015, producing high-quality whey and lactose ingredients for use in a range of consumer products including paediatrics and sports nutrition. It is adjacent to A-Ware’s new cheese plant on the same site and is part of our fully integrated global supply chain. The plant supports our ability to deliver high-quality, advanced dairy nutrition to meet the needs of our priority markets and global customers. Our plant will produce 5,000 metric tonnes of whey protein plus 25,000 metric tonnes of lactose annually. We are also working towards infant-grade product as well as commissioning Fonterra’s uniquely functional WPC 515, used in sports protein bars.
Also in Europe our exclusive partnership with United Kingdom-based Dairy Crest markets and sells galacto-oligosaccharides and demineralised whey powder for infant formula. We are the exclusive sales channel for Dairy Crest’s product, aligning to our strategy to develop a leading position in infant formula and growing-up milk in China and other international markets.
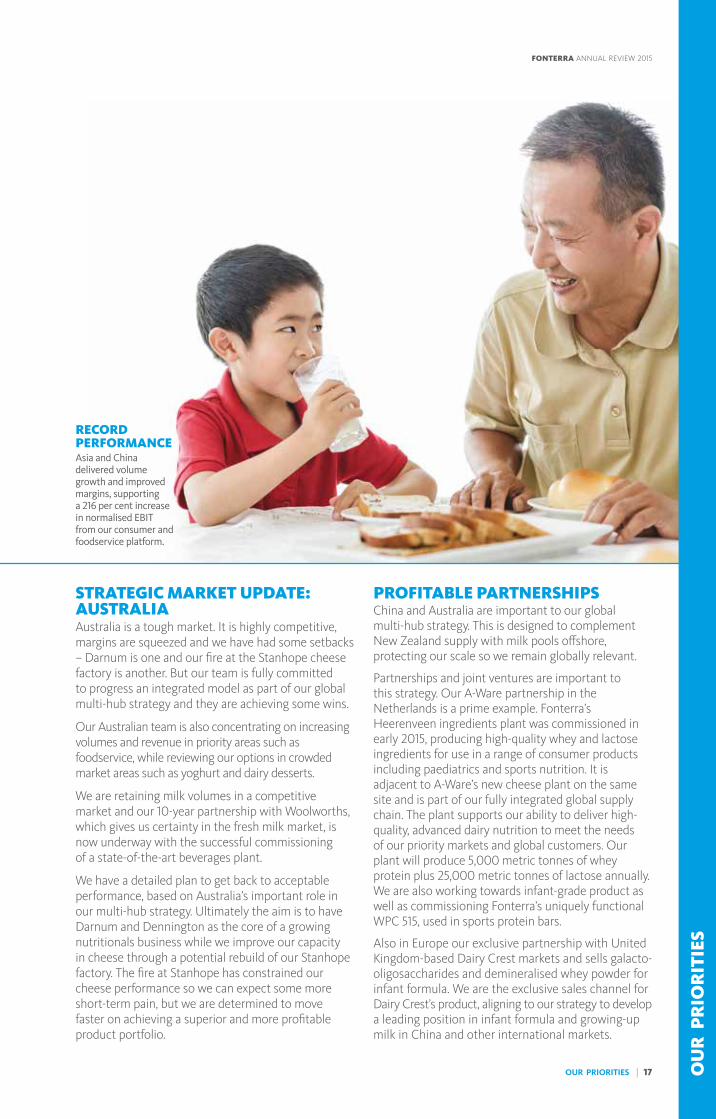
RECORD PERFORMANCEAsia and China delivered volume growth and improved margins, supporting a 216 per cent increase in normalised EBIT from our consumer and foodservice platform.
OUR PRIORITIES | 17 OU
R P
RIO
RIT
IES
FONTERRA ANNUAL REVIEW 2015
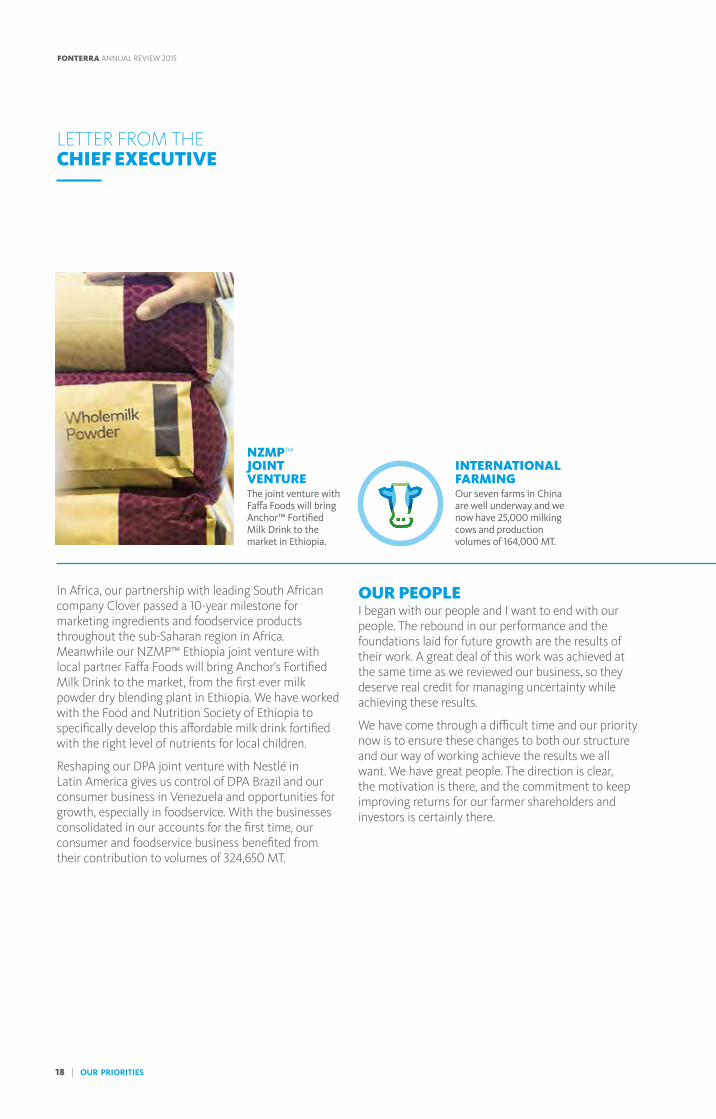
NZMP™ JOINT VENTUREThe joint venture with Faffa Foods will bring Anchor™ Fortified Milk Drink to the market in Ethiopia.
In Africa, our partnership with leading South African company Clover passed a 10-year milestone for marketing ingredients and foodservice products throughout the sub-Saharan region in Africa. Meanwhile our NZMP™ Ethiopia joint venture with local partner Faffa Foods will bring Anchor’s Fortified Milk Drink to the market, from the first ever milk powder dry blending plant in Ethiopia. We have worked with the Food and Nutrition Society of Ethiopia to specifically develop this affordable milk drink fortified with the right level of nutrients for local children.
Reshaping our DPA joint venture with Nestlé in Latin America gives us control of DPA Brazil and our consumer business in Venezuela and opportunities for growth, especially in foodservice. With the businesses consolidated in our accounts for the first time, our consumer and foodservice business benefited from their contribution to volumes of 324,650 MT.
OUR PEOPLEI began with our people and I want to end with our people. The rebound in our performance and the foundations laid for future growth are the results of their work. A great deal of this work was achieved at the same time as we reviewed our business, so they deserve real credit for managing uncertainty while achieving these results.
We have come through a difficult time and our priority now is to ensure these changes to both our structure and our way of working achieve the results we all want. We have great people. The direction is clear, the motivation is there, and the commitment to keep improving returns for our farmer shareholders and investors is certainly there.
INTERNATIONAL FARMINGOur seven farms in China are well underway and we now have 25,000 milking cows and production volumes of 164,000 MT.
LETTER FROM THE CHIEF EXECUTIVE
18 | OUR PRIORITIES
FONTERRA ANNUAL REVIEW 2015 FONTERRA ANNUAL REVIEW 2015
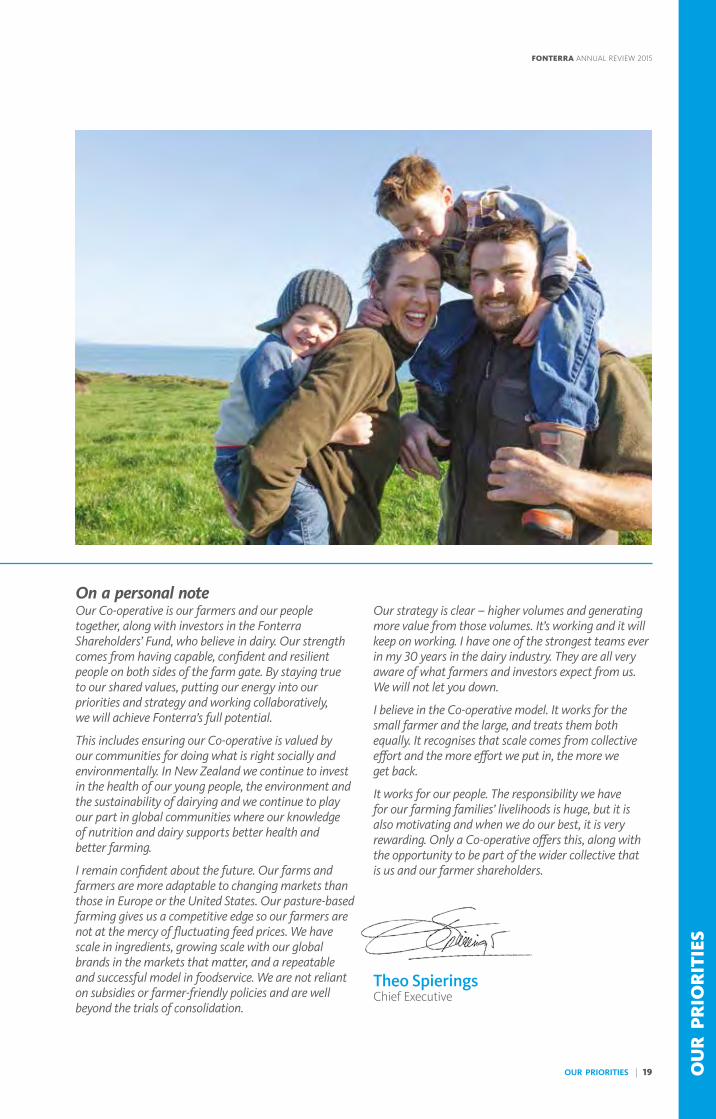
On a personal noteOur Co-operative is our farmers and our people together, along with investors in the Fonterra Shareholders’ Fund, who believe in dairy. Our strength comes from having capable, confident and resilient people on both sides of the farm gate. By staying true to our shared values, putting our energy into our priorities and strategy and working collaboratively, we will achieve Fonterra’s full potential.
This includes ensuring our Co-operative is valued by our communities for doing what is right socially and environmentally. In New Zealand we continue to invest in the health of our young people, the environment and the sustainability of dairying and we continue to play our part in global communities where our knowledge of nutrition and dairy supports better health and better farming.
I remain confident about the future. Our farms and farmers are more adaptable to changing markets than those in Europe or the United States. Our pasture-based farming gives us a competitive edge so our farmers are not at the mercy of fluctuating feed prices. We have scale in ingredients, growing scale with our global brands in the markets that matter, and a repeatable and successful model in foodservice. We are not reliant on subsidies or farmer-friendly policies and are well beyond the trials of consolidation.
Our strategy is clear – higher volumes and generating more value from those volumes. It’s working and it will keep on working. I have one of the strongest teams ever in my 30 years in the dairy industry. They are all very aware of what farmers and investors expect from us. We will not let you down.
I believe in the Co-operative model. It works for the small farmer and the large, and treats them both equally. It recognises that scale comes from collective effort and the more effort we put in, the more we get back.
It works for our people. The responsibility we have for our farming families’ livelihoods is huge, but it is also motivating and when we do our best, it is very rewarding. Only a Co-operative offers this, along with the opportunity to be part of the wider collective that is us and our farmer shareholders.
Theo SpieringsChief Executive
OUR PRIORITIES | 19 OU
R P
RIO
RIT
IES
FONTERRA ANNUAL REVIEW 2015
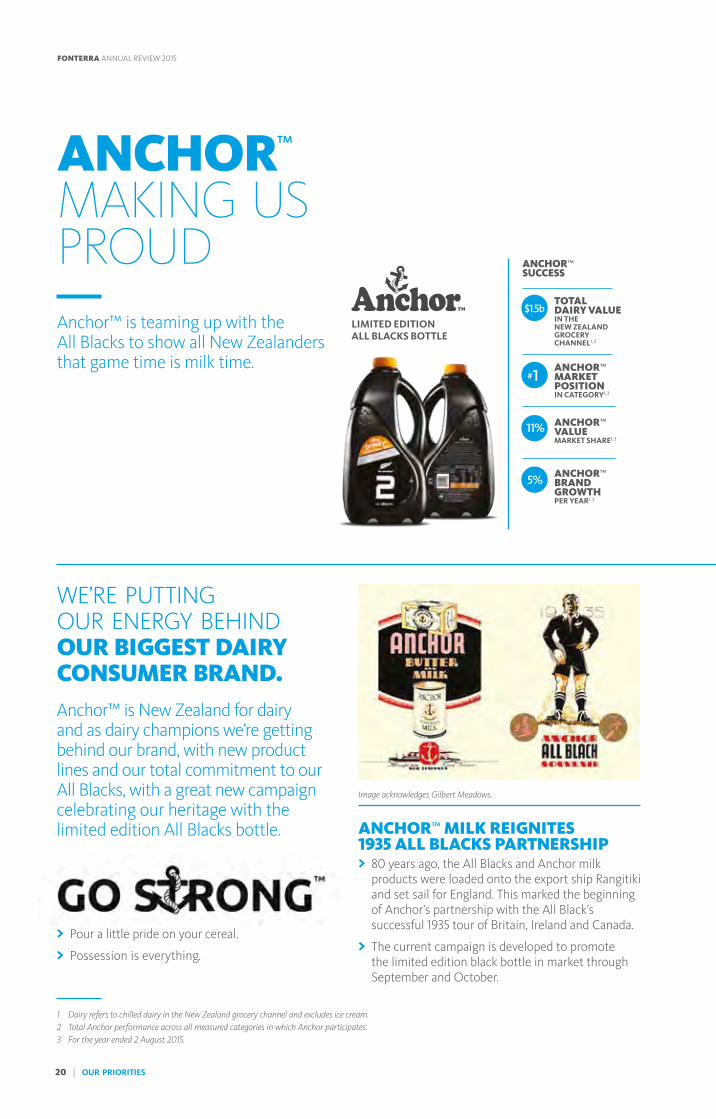
ANCHOR™ MAKING US PROUDAnchor™ is teaming up with the All Blacks to show all New Zealanders that game time is milk time.
WE’RE PUTTING OUR ENERGY BEHIND OUR BIGGEST DAIRY CONSUMER BRAND. Anchor™ is New Zealand for dairy and as dairy champions we’re getting behind our brand, with new product lines and our total commitment to our All Blacks, with a great new campaign celebrating our heritage with the limited edition All Blacks bottle.
> Pour a little pride on your cereal.
> Possession is everything.
ANCHOR™ MILK REIGNITES 1935 ALL BLACKS PARTNERSHIP > 80 years ago, the All Blacks and Anchor milk products were loaded onto the export ship Rangitiki and set sail for England. This marked the beginning of Anchor’s partnership with the All Black’s successful 1935 tour of Britain, Ireland and Canada.
> The current campaign is developed to promote the limited edition black bottle in market through September and October.
ANCHOR™ SUCCESS
TOTAL DAIRY VALUE IN THE NEW ZEALAND GROCERY CHANNEL1, 3
ANCHOR™ MARKET POSITION IN CATEGORY1, 2
#1
$1.5b
11%
5%
LIMITED EDITION ALL BLACKS BOTTLE
1 Dairy refers to chilled dairy in the New Zealand grocery channel and excludes ice cream.2 Total Anchor performance across all measured categories in which Anchor participates.3 For the year ended 2 August 2015.
ANCHOR™ VALUE MARKET SHARE1, 3
ANCHOR™ BRAND GROWTH PER YEAR1, 3
Image acknowledges Gilbert Meadows.
20 | OUR PRIORITIES
FONTERRA ANNUAL REVIEW 2015

#GOSTRONGANCHOR.CO.NZ/GOSTRONG
POSSESSION IS EVERYTHING.
GO STRONG. GO ALL BLACKS.
The goodness in every bottle of Anchor™ milk is the same goodness that nourishes the All Blacks.
OUR PRIORITIES | 21
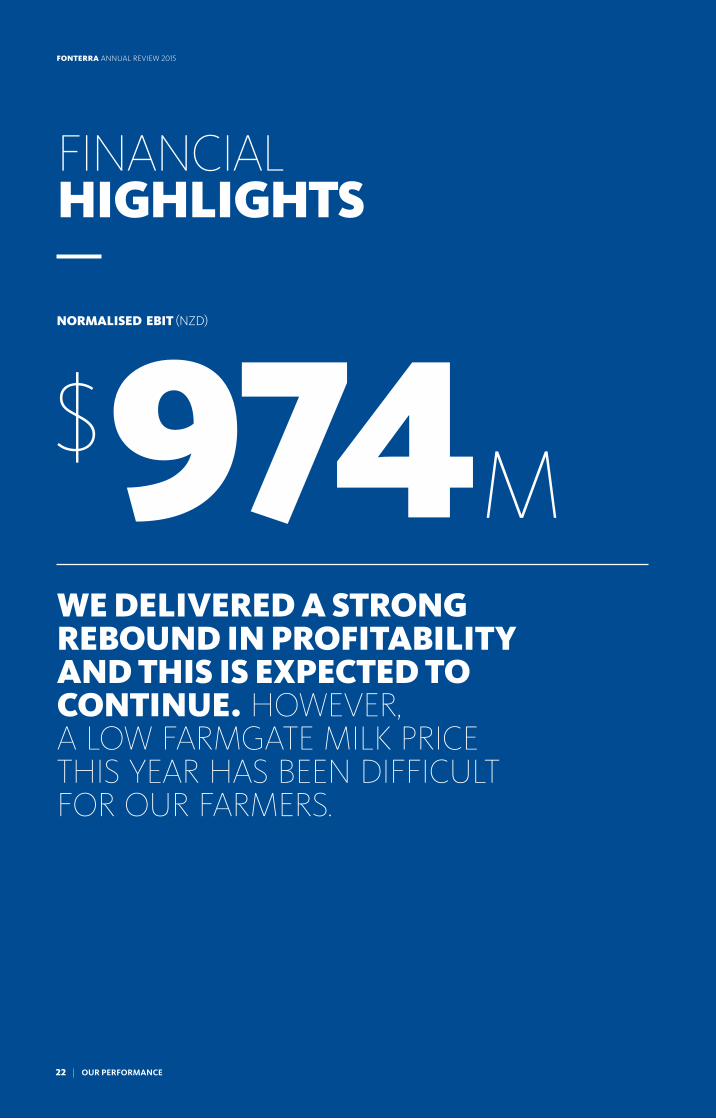
NORMALISED EBIT (NZD)
974$M
WE DELIVERED A STRONG REBOUND IN PROFITABILITY AND THIS IS EXPECTED TO CONTINUE. HOWEVER, A LOW FARMGATE MILK PRICE THIS YEAR HAS BEEN DIFFICULT FOR OUR FARMERS.
22 | OUR PERFORMANCE
FONTERRA ANNUAL REVIEW 2015
FINANCIAL HIGHLIGHTS

FINAL CASH PAYOUT
$4.65VOLUME (’000 MT)
4,303MT
REVENUE (NZD)
$18.8B
NET PROFIT AFTER TAX (NZD)
$506M
MILK COLLECTION
1,614M KGMS
DIVIDEND PER SHARE
25CPS
OUR PERFORMANCE | 23
Fonterra refers to normalised segment earnings, normalised EBIT, EBIT, EBITDA, constant currency variances, normalisation adjustments and payout when discussing financial performance. These are non-GAAP financial measures and are not prepared in accordance with IFRS. Management believes that these measures provide useful information as they provide valuable insight on the underlying performance of the business. They are used internally to evaluate the underlying performance of business
units and to analyse trends. These measures are not uniformly defined or utilised by all companies. Accordingly, these measures may not be comparable with similarly titled measures used by other companies. Non-GAAP financial measures should not be viewed in isolation nor considered as a substitute for measures reported in accordance with IFRS. Please refer to page 92 for the reconciliation of the NZ IFRS measures to the non-GAAP measures and for definitions of the non-GAAP measures used by Fonterra.
OU
R P
ERFO
RM
AN
CE
FONTERRA ANNUAL REVIEW 2015

% $974MNORMALISED EBITNormalised EBIT for the group was $974 million, almost double that of last year.9 RETURN
ON CAPITALThe group return on capital of nine per cent reflects a strong rebound in performance.
OUR STRATEGY OF DELIVERING VOLUME AND VALUE ACROSS OUR LEADERSHIP AND STRATEGIC MARKETS RESULTED IN A STRONG IMPROVEMENT IN PROFITABILITY THIS YEAR.
VOLUMESales volume increased nine per cent compared to last year, mainly as a result of strong volume growth in our consumer and foodservice segment, volume was up four per cent across Asia, up 33 per cent in Greater China and more than double in Latin America. This was offset to some extent by lower volumes in Australian yoghurts and dairy desserts.
The strong volume growth in Greater China was mainly from foodservice and Anchor™ in mainland China with the rollout of foodservice across a number of new cities. In Asia, the strong volume growth was due to a turnaround of business performance in Sri Lanka and combined foodservice growth of 11 per cent across the region. In Latin America the growth was due to the consolidation of DPA Brazil and Venezuela. The growth in consumer and foodservice reflects our strategy of moving more milk into higher value products.
USEFUL FACTLiquid milk equivalent (LME) is an additional measure of performance that allocates an amount of milk to dairy products based on the amount of fat and protein (milk solids) in the product relative to the amount of fat and protein in raw milk. Sales volume increased three per cent on an LME basis from 22.2 billion to 22.8 billion, with our consumer and foodservice segment increasing 15 per cent to 4.5 billion LME.
GROUP OVERVIEWWe delivered a strong rebound in profitability and this is expected to continue.
24 | OUR PERFORMANCE
FONTERRA ANNUAL REVIEW 2015
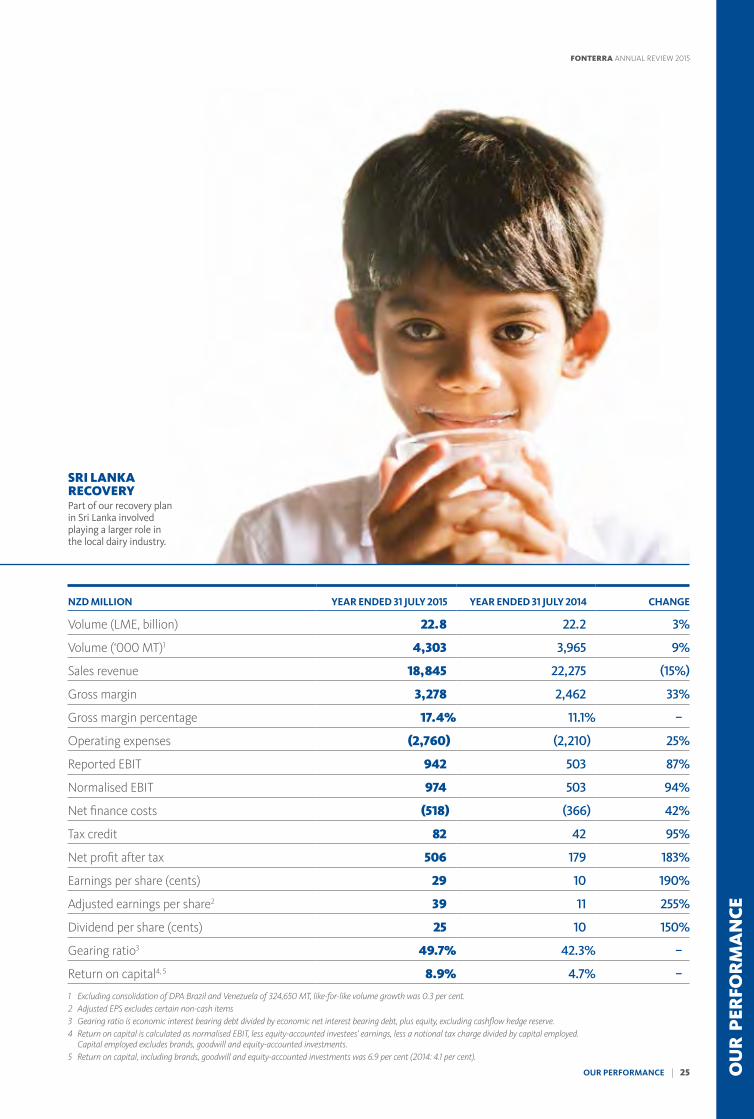
NZD MILLION YEAR ENDED 31 JULY 2015 YEAR ENDED 31 JULY 2014 CHANGE
Volume (LME, billion) 22.8 22.2 3%
Volume (‘000 MT)1 4,303 3,965 9%
Sales revenue 18,845 22,275 (15%)
Gross margin 3,278 2,462 33%
Gross margin percentage 17.4% 11.1% –
Operating expenses (2,760) (2,210) 25%
Reported EBIT 942 503 87%
Normalised EBIT 974 503 94%
Net finance costs (518) (366) 42%
Tax credit 82 42 95%
Net profit after tax 506 179 183%
Earnings per share (cents) 29 10 190%
Adjusted earnings per share2 39 11 255%
Dividend per share (cents) 25 10 150%
Gearing ratio3 49.7% 42.3% –
Return on capital4, 5 8.9% 4.7% –
1 Excluding consolidation of DPA Brazil and Venezuela of 324,650 MT, like-for-like volume growth was 0.3 per cent. 2 Adjusted EPS excludes certain non-cash items3 Gearing ratio is economic interest bearing debt divided by economic net interest bearing debt, plus equity, excluding cashflow hedge reserve.4 Return on capital is calculated as normalised EBIT, less equity-accounted investees’ earnings, less a notional tax charge divided by capital employed.
Capital employed excludes brands, goodwill and equity-accounted investments.5 Return on capital, including brands, goodwill and equity-accounted investments was 6.9 per cent (2014: 4.1 per cent).
SRI LANKA RECOVERYPart of our recovery plan in Sri Lanka involved playing a larger role in the local dairy industry.
OU
R P
ERFO
RM
AN
CE
OUR PERFORMANCE | 25
FONTERRA ANNUAL REVIEW 2015
%
GROUP OVERVIEW
VALUENew Zealand ingredients delivered a solid performance with significantly improved margins as a result of effective optimisation of our mix of products. This resulted in normalised EBIT for the ingredients segment increasing 43 per cent compared to last year1.
A record performance in Asia and China, with volume growth and improved margins, supported a 216 per cent increase in normalised EBIT from our consumer and foodservice segment. We also made good progress on building an integrated dairy business in China with a strong on-farm performance, in a challenging domestic milk price environment.
Performance strengthened in the second half where normalised EBIT was $498 million higher than the second half last year. This resulted in normalised EBIT for the group of $974 million, almost double that of the prior year, and in line with more normal levels.
The group result was impacted by an adverse product mix in our Australian ingredients business and lower returns from our Australian consumer business. However, we made good progress delivering strong volume growth in domestic foodservice and we have implemented a number of initiatives across the Australian business to help improve margins.
Operating expenses were up four per cent on a like-for-like basis, excluding the consolidation of DPA and one-off costs of around $100 million relating to the impairment of assets in Australia and restructuring across the group. The remaining increase was due to the expansion of our China business and investment in brands, growth in China Farms, increased storage and distribution costs in the ingredients business, and higher unallocated group costs required to support the global business.
This was offset to some extent by savings in Australia and most markets across Asia where an increased focus on costs delivered significant reductions in operating expenses. Including the consolidation of the newly acquired businesses in Latin America, group operating expenses were 25 per cent higher.
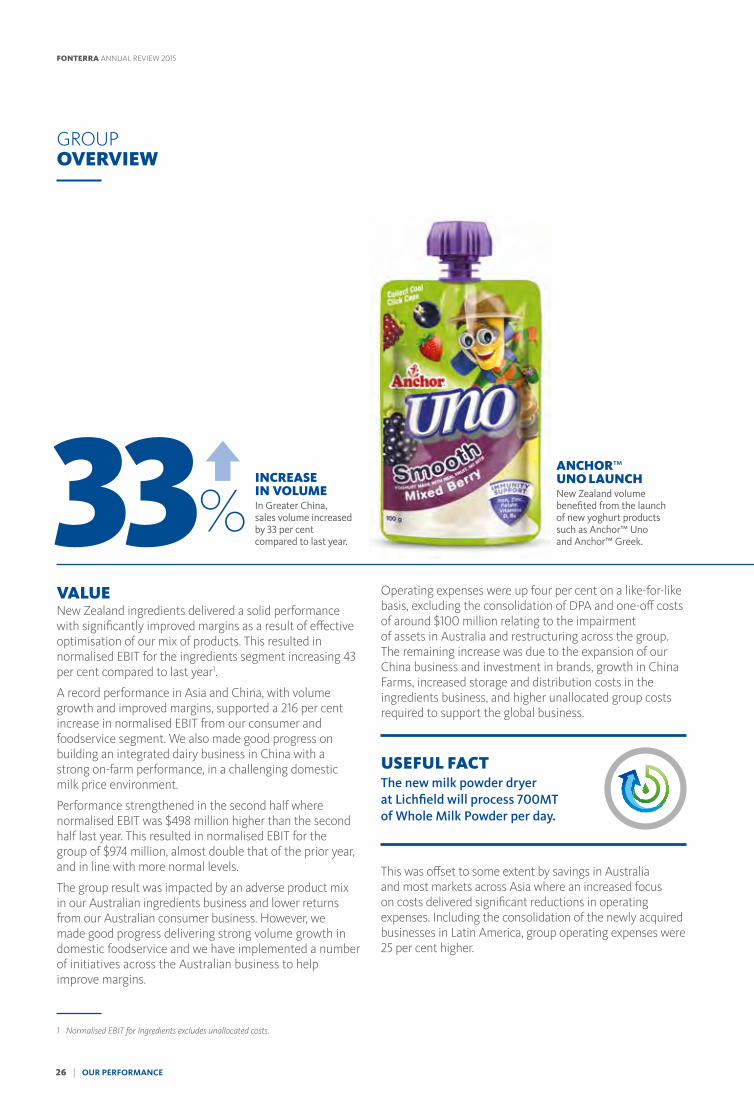
INCREASE IN VOLUMEIn Greater China, sales volume increased by 33 per cent compared to last year.33
1 Normalised EBIT for Ingredients excludes unallocated costs.
ANCHOR™ UNO LAUNCHNew Zealand volume benefited from the launch of new yoghurt products such as Anchor™ Uno and Anchor™ Greek.
USEFUL FACT The new milk powder dryer at Lichfield will process 700MT of Whole Milk Powder per day.
26 | OUR PERFORMANCE
FONTERRA ANNUAL REVIEW 2015

The tax credit was higher than last year mainly due to the tax effect of a higher dividend this year, and also as a result of additional tax credits recognised in Australia.
The group return on capital of 8.9 per cent reflects a strong rebound in performance. Despite the significant volatility in dairy prices, the ingredients business delivered a return on capital of 9.3 per cent. In addition, the consumer and foodservice segment delivered a return on capital of 25.5 per cent. This is well above the ingredients return, reflecting the improved margins this year as well as the strength of our global brands.
Our dividend policy is to pay out 65–75 per cent of adjusted NPAT over time. In the calculation of the dividend, NPAT has been adjusted for certain non-cash items that were included in line with accounting standards. The total dividend payment for the year of 25 cents per share is 65 per cent of adjusted NPAT of $621 million or 39 cents per share.
STRATEGIC INVESTMENTSWe made a number of strategic investments during the year, building capacity in our home base of New Zealand and building a dairy business in China, our key market. These are positioning us well for the future.
Our investments include developing capacity and optionality in our home base with a spend of around $900 million, building an integrated dairy business in China, investing around $750 million in a global partnership with Beingmate and capital expenditure of $364 million for the development of new farms and livestock purchases.
We have also used the underlying strength of the Co-operative to support our farmers during tough times by accelerating the Advance Rate Payments, resulting in a higher proportion of the forecast Farmgate Milk Price being paid out at the balance date.
As a result of the Advance Rate, our debt at balance date was $900 million higher than it would have been and was the main reason for cash interest increasing by $95 million to $427 million. In addition, included in finance costs is a non-cash item relating to hedging interest in future periods.
These initiatives have led to additional funding requirements, resulting in a gearing ratio of 49.7 per cent. This was in line with our expectations. Adjusting for the accelerated Advance Rate, which has only had a temporary impact on the balance sheet, gearing would have been 46.4 per cent.
NZD $ MILLION CENTS
Normalised earnings before interest and tax 974 61
DPA 100 6
Interest (427) (27)
Other (26) (1)
Adjusted net profit after tax (NPAT) 621 39
Financial instruments (non-cash finance costs) (138) (9)
Australian yoghurt and dairy desserts (non-cash impairment) (77) (5)
DPA and hyperinflation 60 4
Profit after tax attributable to equity shareholders 466 29
Minorities (share of earnings) 40 3
Profit after tax attributable to equity shareholders 506 32
Dividend 65% of adjusted NPAT – 25
PROFIT AVAILABLE FOR DISTRIBUTION
Our dividend policy is to pay out 65-75 per cent
of adjusted net profit after tax over time. This is based on
an adjusted earnings per share of 39 cents per share.
OU
R P
ERFO
RM
AN
CE
OUR PERFORMANCE | 27
FONTERRA ANNUAL REVIEW 2015

ADDITIONAL CAPACITYWe have invested our capital prudently, including at our Pahiatua and Edendale plants, both due for completion this year.
OUR NEW ZEALAND INGREDIENTS BUSINESS DELIVERED A SOLID PERFORMANCE. THIS WAS MAINLY DUE TO IMPROVED MARGINS WHICH WERE UP $264 MILLION.
We adjusted our product mix away from reference products such as Whole Milk Powder towards non-reference products such as cheese and casein and took advantage of better pricing opportunities in Japan and the United States.
This, together with our differentiated product and service offerings, resulted in an improved second half and full-year normalised EBIT for the ingredients segment of $973 million, up 43 per cent compared to last year. This was partially offset by an adverse product mix in ingredients manufactured in Australia as a result of lower sales of nutritionals and the fire at our Stanhope cheese factory.
Despite significant volatility in dairy prices, the ingredients segment delivered a return on capital of 9.3 per cent.
MILK COLLECTION Milk collection across New Zealand for the 2014/15 season to 31 May 2015 was 1,614 million kgMS, up two per cent compared to the previous season. New Zealand farmers experienced varied conditions across the country with the mild winter and spring ensuring that the season started well, but the hot summer resulted in a drought being declared in the South Island by mid-February. However, this was followed by rain in March supporting pasture growth ending the season with good growth in milk supply.
Milk collection in Australia, our second largest milk pool, was up five per cent at 127 million kgMS. Tasmanian production grew by four per cent due to strong rainfall through the year and continued structural expansion in new farms and irrigation investment. Market share declined slightly in Northern Victoria as new entrants provided aggressive fixed price offers to suppliers.
INGREDIENTS
The ingredients segment represents the ingredients businesses in New Zealand, Australia and Latin America. This segment also includes Fonterra Farm Source™ (formerly RD1), a rural supplies retailer in New Zealand.
NORMALISED EBITIngredients segment normalised EBIT was up 43 per cent compared to last year.
$973M
28 | OUR PERFORMANCE
FONTERRA ANNUAL REVIEW 2015
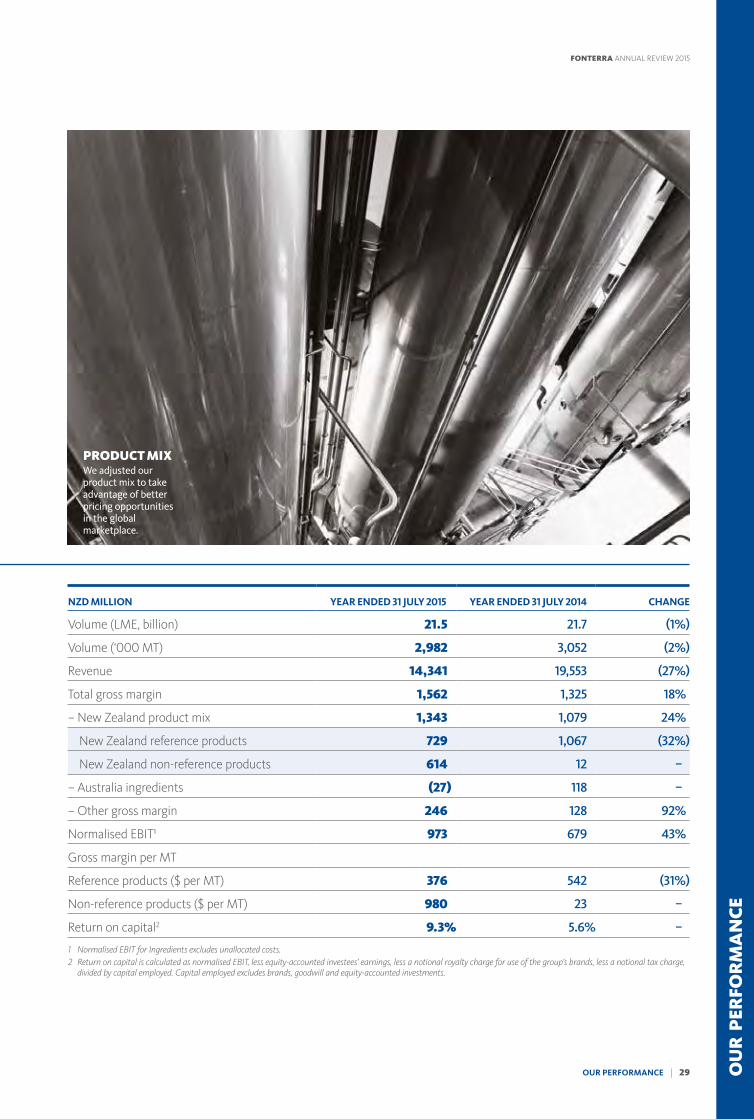
NZD MILLION YEAR ENDED 31 JULY 2015 YEAR ENDED 31 JULY 2014 CHANGE
Volume (LME, billion) 21.5 21.7 (1%)
Volume (‘000 MT) 2,982 3,052 (2%)
Revenue 14,341 19,553 (27%)
Total gross margin 1,562 1,325 18%
– New Zealand product mix 1,343 1,079 24%
New Zealand reference products 729 1,067 (32%)
New Zealand non-reference products 614 12 –
– Australia ingredients (27) 118 –
– Other gross margin 246 128 92%
Normalised EBIT¹ 973 679 43%
Gross margin per MT
Reference products ($ per MT) 376 542 (31%)
Non-reference products ($ per MT) 980 23 –
Return on capital2 9.3% 5.6% –
1 Normalised EBIT for Ingredients excludes unallocated costs.2 Return on capital is calculated as normalised EBIT, less equity-accounted investees’ earnings, less a notional royalty charge for use of the group’s brands, less a notional tax charge,
divided by capital employed. Capital employed excludes brands, goodwill and equity-accounted investments.
PRODUCT MIXWe adjusted our product mix to take advantage of better pricing opportunities in the global marketplace.
OU
R P
ERFO
RM
AN
CE
OUR PERFORMANCE | 29
FONTERRA ANNUAL REVIEW 2015

PERFORMANCEOur New Zealand ingredients business manufactures five commodity products that inform the Farmgate Milk Price. These are referred to as reference products and all other products are referred to as non-reference products. The relative difference between reference product prices and non-reference product prices can impact our gross margin.
Product mix in our New Zealand ingredients business includes the returns from both reference and non-reference products.
The ingredients segment sales volume was two per cent lower at three million MT as a result of lower sales of dairy ingredients to China, largely offset by higher sales in other regions. Revenue was 27 per cent down, reflecting the 36 per cent lower dairy prices compared to last year.
The product mix gross margin in our New Zealand ingredients business was up 24 per cent to $1,343 million, $264 million higher than last year. We successfully optimised our product mix by taking advantage of the change in relative commodity prices and adjusting our product mix away from WMP towards non-reference products such as cheese and casein.
With the change in global demand dynamics, we increased sales to customers outside Greater China. We also successfully grew our volume of offshore government tenders. Gross margin increased, reflecting the value proposition of our ingredients products and services for global customers in various dairy applications.
Reference products delivered a gross margin of $729 million, which compares to $1,067 million in the prior year. Last year, reference product margins benefited significantly from the adjustment to the Farmgate Milk Price and without that, gross margin for reference products would have been higher than last year. In addition, significant falls in dairy prices had a negative impact on early season margins.
Gross margin for non-reference products increased significantly to $614 million compared to $12 million last year. This was mainly due to favourable relative pricing and the change in mix towards non-reference products. Last year, margins for non-reference products were extremely low due to unprecedented relative price movements of reference products compared to non-reference products.
USEFUL FACT With the change in global demand dynamics, we increased sales to customers outside Greater China. We also successfully grew our volume of offshore government tenders.
INGREDIENTS
NEW ZEALAND INGREDIENTS REVENUE AND VOLUME
YEAR ENDED
31 JULY 2015
YEAR ENDED
31 JULY 2014 CHANGE
Sales volume (‘000 MT)
Reference products 1,939 1,970 (2%)
Non-reference products¹ 626 522 20%
Production volume (‘000 MT)
Reference products 2,009 2,037 (1%)
Non-reference products 682 593 15%
Revenue per MT NZD
Reference products 3,826 5,386 (29%)
Non-reference products¹ 5,831 7,064 (17%)
1 Sales volume and revenue excludes bulk liquid milk. The annual bulk milk volume for the 2015 financial year was 67,000 MT.
PRODUCT PERFORMANCEOur New Zealand ingredients business delivered a solid performance.
30 | OUR PERFORMANCE
FONTERRA ANNUAL REVIEW 2015

9.3Ingredients manufactured in Australia returned a gross margin loss of $27 million as a result of an adverse product mix due to lower sales of nutritionals and the fire at our Stanhope cheese factory in December 2014. In addition, the loss of production impacted our ability to match the market price for milk in Australia. The lower revenue was set against a relatively high domestic milk price in Australia, reflecting an intensely competitive market for milk supply.
We are taking steps to address product mix issues, including investigating the rebuilding of the Stanhope cheese facility. Post balance date we also signed a paediatrics supply agreement with a customer for our Darnum plant. Together with our Beingmate partnership, this will ensure Darnum returns to producing higher-value nutritionals.
Other factors influencing gross margin includes liquid milk, global sourcing, Fonterra Farm Source™ stores, Prolesur, global supply chain and peak milk costs. Returns from liquid milk were higher than last year due to quarterly fixed pricing in a falling milk price environment. Strong milk production through the peak collection period, combined with capacity constraints, resulted in some additional transport costs and inefficient processing. However, these peak costs of $59 million were 21 per cent lower than last year as a result of additional investment in plant and operational efficiencies.
Operating expenses in New Zealand ingredients were $46 million higher primarily due to additional storage requirements in New Zealand and offshore. Our factory profit improvement plan in Australia has delivered $31 million in cost savings over the past two years.
CAPITAL EXPENDITUREWe have invested our capital prudently, spending around $900 million in our home base in New Zealand primarily on maintenance, additional capacity and optionality. This includes the Pahiatua powder dryer and the Edendale expansion, which includes a new Milk Protein Concentrate (MPC) plant, a reverse osmosis plant and an Anhydrous Milk Fat plant. Both expansions are due for completion this year. This additional capacity also benefits our consumer and foodservice business with investments in mozzarella at Clandeboye, slice-on-slice cheese at Eltham and ultra-heat treated (UHT) at Waitoa.
USEFUL FACT Our factory profit improvement plan in Australia has delivered $31 million in cost savings over the past two years.
RETURN ON CAPITALThe ingredients segment delivered a return on capital of 9.3 per cent.
%
OU
R P
ERFO
RM
AN
CE
OUR PERFORMANCE | 31
FONTERRA ANNUAL REVIEW 2015

NZMP™ INGREDIENTSLEADERSHIPWe are the world’s largest exporter of dairy ingredients.
NZMP™ IS THE DAIRY INGREDIENTS BRAND OF FONTERRA.
Fonterra is renowned for pure natural goodness, stringent quality assurance systems and world-leading expertise in agri-science.
Using the best of Fonterra know-how and processes, NZMP™ ingredients give our customers a natural advantage.
Trusted globally, NZMP™ ingredients can be found at the heart of some of the world’s most famous food and nutrition brands.
THOUSANDS OF INGREDIENTSNZMP™ has the broadest range in the dairy industry – we provide thousands of solutions to meet the needs of our customers every day.
That range spans from highest-quality core ingredients, such as milk powders and butter through to functional ingredients, like specialised proteins for sports and nutritional products.
32 | OUR PERFORMANCE
FONTERRA ANNUAL REVIEW 2015
PIONEERING PARTNERSNZMP™ captures a pioneering spirit that goes back more than 40 years.
Today, our work with new and long-standing customers sees us export to more than 100 countries.
Our global availability gives customers access to supply security that only comes from partnering with the world’s largest dairy exporter.
Every day, our people, products and innovation combine to take the best of dairy to the world.
OU
R P
ERFO
RM
AN
CE
OUR PERFORMANCE | 33
FONTERRA ANNUAL REVIEW 2015
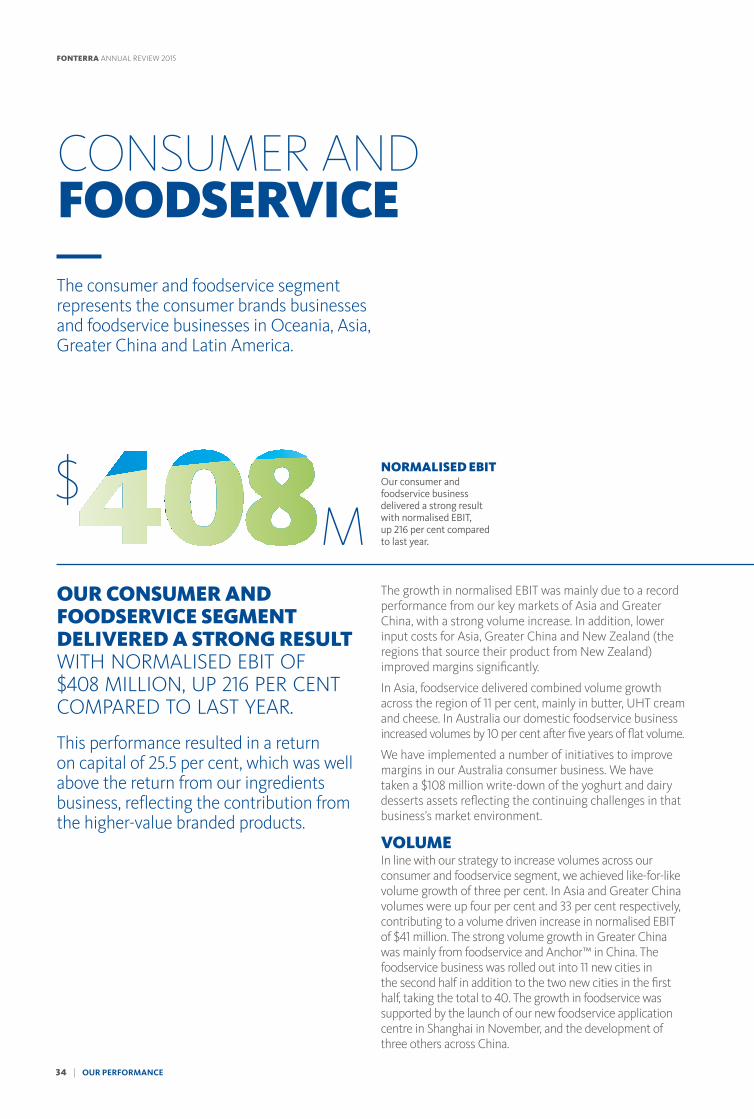
OUR CONSUMER AND FOODSERVICE SEGMENT DELIVERED A STRONG RESULT WITH NORMALISED EBIT OF $408 MILLION, UP 216 PER CENT COMPARED TO LAST YEAR.
This performance resulted in a return on capital of 25.5 per cent, which was well above the return from our ingredients business, reflecting the contribution from the higher-value branded products.
The growth in normalised EBIT was mainly due to a record performance from our key markets of Asia and Greater China, with a strong volume increase. In addition, lower input costs for Asia, Greater China and New Zealand (the regions that source their product from New Zealand) improved margins significantly.
In Asia, foodservice delivered combined volume growth across the region of 11 per cent, mainly in butter, UHT cream and cheese. In Australia our domestic foodservice business increased volumes by 10 per cent after five years of flat volume.
We have implemented a number of initiatives to improve margins in our Australia consumer business. We have taken a $108 million write-down of the yoghurt and dairy desserts assets reflecting the continuing challenges in that business’s market environment.
VOLUMEIn line with our strategy to increase volumes across our consumer and foodservice segment, we achieved like-for-like volume growth of three per cent. In Asia and Greater China volumes were up four per cent and 33 per cent respectively, contributing to a volume driven increase in normalised EBIT of $41 million. The strong volume growth in Greater China was mainly from foodservice and Anchor™ in China. The foodservice business was rolled out into 11 new cities in the second half in addition to the two new cities in the first half, taking the total to 40. The growth in foodservice was supported by the launch of our new foodservice application centre in Shanghai in November, and the development of three others across China.
CONSUMER AND FOODSERVICEThe consumer and foodservice segment represents the consumer brands businesses and foodservice businesses in Oceania, Asia, Greater China and Latin America.
NORMALISED EBITOur consumer and foodservice business delivered a strong result with normalised EBIT, up 216 per cent compared to last year.
$M
34 | OUR PERFORMANCE
FONTERRA ANNUAL REVIEW 2015

FOODSERVICE VOLUME GROWTHIn Asia, foodservice delivered combined volume growth of 11 per cent across the region, mainly in butter, UHT cream and cheese.%11
NZD MILLION YEAR ENDED 31 JULY 2015 YEAR ENDED 31 JULY 2014 CHANGE
Volume (LME, billion) 4.5 3.9 15%
Volume (‘000 MT) 1,685 1,325 27%
Sales revenue 6,701 5,321 26%
Normalised EBIT 408 129 216%
Return on capital1 25.5% 5.9% –
1 Return on capital is calculated as normalised EBIT, less equity-accounted investees’ earnings, less a notional royalty charge for use of the group’s brands, less a notional tax charge, divided by capital employed. Capital employed excludes brands, goodwill and equity-accounted investments.
NORMALISED EBIT: KEY PERFORMANCE DRIVERS1
NZD MILLION NORMALISED EBIT
Normalised EBIT year ended 31 July 2014 129
Volume 41
Price (67)
Cost of goods sold 284
Operating expenses 43
Other (22)
Normalised EBIT year ended 31 July 2015 408
1 The impact on volume and revenue due to the consolidation of DPA Brazil and Venezuela is not included in the price, volume and COGS rows of the table, but is included in ‘other’ to ensure those reflect the underlying performance of the business.
OU
R P
ERFO
RM
AN
CE
OUR PERFORMANCE | 35
FONTERRA ANNUAL REVIEW 2015
CONSUMER AND FOODSERVICE
Volumes for the combined DPA Brazil and Venezuela businesses were 324,650 MT. DPA Brazil and our consumer business in Venezuela have been fully consolidated in our accounts for the first time. This inclusion is a key reason for the increase in volume and revenue compared to the prior period. In total volume was up 27 per cent compared to last year at 1.7 million MT.
Our brands business in China is well-positioned both in-store and in the top e-retailers such as T-mall. The rollout of Anchor™ in China continues with market share growth in the Yangtze River Delta region and in the North. The distribution of Anmum™ infant formula through Beingmate is now underway and the first shipments landed in China in June 2015. Beingmate has an extensive distribution and sales network with significant growth potential and the company continues to pursue a leading position in the China infant formula market.
In Asia, the strong volume growth was due to a turnaround of business performance in Sri Lanka and foodservice growth across all our markets. In key markets such as Indonesia, Middle-East and the Philippines, we achieved double digit growth. This reflects our successful foodservice strategy that is focused on three main channels across our leadership and strategic markets, with particularly strong growth in the Italian kitchen and Asian bakery channels.
This volume growth was offset somewhat by Oceania, with Australia having lower volumes in yoghurt and dairy desserts. Australia delivered some good volume growth in Western Star™ butter, up nine per cent, and Tamar Valley™ yoghurt, up 62 per cent. New Zealand
had domestic volume growth from foodservice and the launch of new yoghurt products such as Anchor Uno™ and Anchor™ Greek.
Our Australian domestic foodservice business achieved 10 per cent volume growth compared to the same time last year, after five years of flat sales. This is a strong result given the market’s maturity and aggressive competitive environment.
Our new beverages plant at Cobden has been commissioned and was officially opened in September.
PERFORMANCENormalised EBIT for the consumer and foodservice segment was up 216 per cent to $408 million.
Our pricing strategy delivered higher margins while maintaining market share. In Latin America we managed price increases in Chile and the Caribbean while increasing volume in Chile and maintaining market share in the Caribbean. In China, trade spend is required to support the consumer business and grow volume and market share as competition increases and this impacted margins to some extent.
The fall in dairy ingredients pricing benefited our consumer and foodservice businesses in Asia and China, where products are sourced from New Zealand. Input costs were significantly lower in these markets and in New Zealand consumer and foodservice, increasing gross margin by $284 million.
This was offset to some extent by milk prices in Chile that were around two per cent higher on average than last year, as movements in raw milk prices in Chile tend to lag global
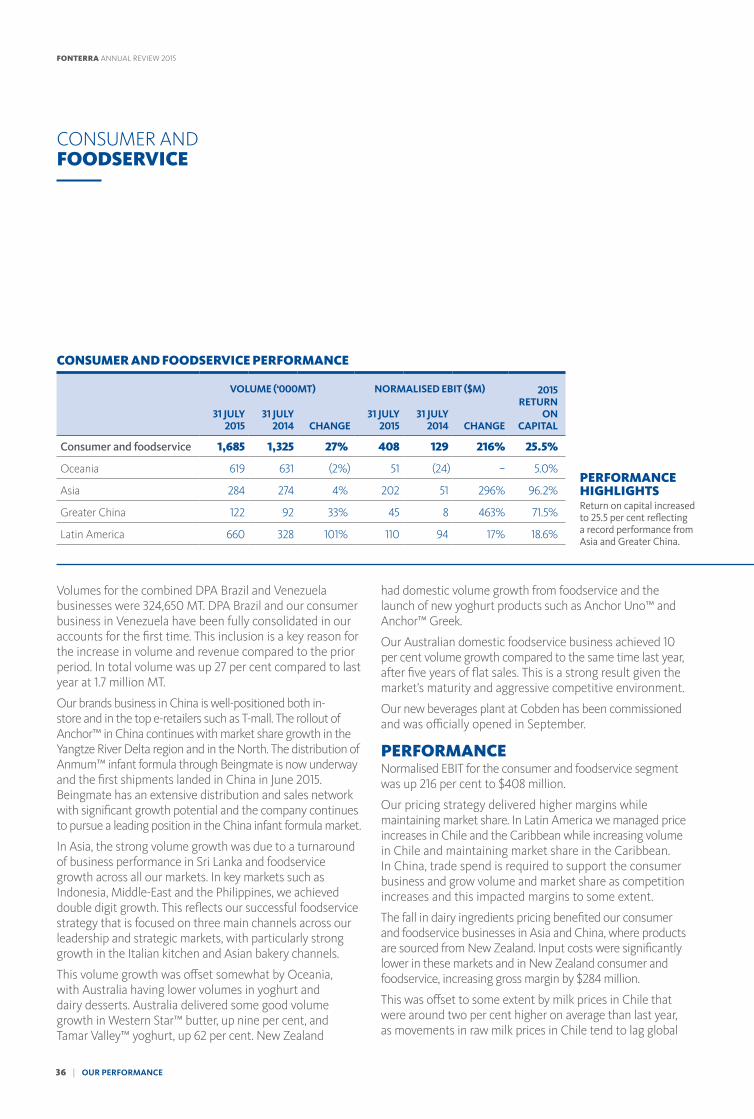
PERFORMANCE HIGHLIGHTSReturn on capital increased to 25.5 per cent reflecting a record performance from Asia and Greater China.
CONSUMER AND FOODSERVICE PERFORMANCE
VOLUME (‘000MT) NORMALISED EBIT ($M) 2015 RETURN
ON CAPITAL
31 JULY 2015
31 JULY 2014 CHANGE
31 JULY 2015
31 JULY 2014 CHANGE
Consumer and foodservice 1,685 1,325 27% 408 129 216% 25.5%
Oceania 619 631 (2%) 51 (24) – 5.0%
Asia 284 274 4% 202 51 296% 96.2%
Greater China 122 92 33% 45 8 463% 71.5%
Latin America 660 328 101% 110 94 17% 18.6%
36 | OUR PERFORMANCE
FONTERRA ANNUAL REVIEW 2015

commodity prices. The local price was also impacted by the drought in the south of the country. Input costs in Latin America increased as a result of the cost of locally sourced products for Soprole, partially offset by the lower cost of New Zealand-sourced products into the Caribbean.
Although milk prices remained high in Australia, on average they were slightly lower than last year. The change in product mix in Australia consumer and foodservice meant that more product was sourced from New Zealand where input costs were more aligned to global dairy prices.
Operating expenses were lower in Asia and Australia, where continued focus on spend led to further reductions in operating costs. This was offset to some extent by increased investment in our China consumer business, due to increased distribution, advertising and promotional spend to support business growth.
In Asia, we made good progress on delivering our strategy. Part of our recovery plan in Sri Lanka involved our commitment to play a larger role in the local dairy industry and in May we launched a new flavoured Anchor™ UHT
milk for children. The launch has been a great success helping us to generate additional volume and value in this growth segment.
In Indonesia the powder blending and packaging plant in West Java was completed with the first commercial run in June 2015. The plant has the capacity to produce more than 100,000 packs per day of Anlene™, Anmum™ and Anchor™ Boneeto, and has the potential to expand to meet the fast-growing demand in Indonesia.
In Latin America a number of initiatives were implemented in Soprole to offset the negative impact of the economic environment in Chile. We also delivered ongoing cost reductions and expense control. In Brazil, we launched a number of new products including Chandelle Chantilly – Brazilian market innovation, Greek yoghurt unitary pots, and products within the children’s category. The launch was supported by a successful trade marketing roadshow.
In Australia, we continued to improve on delivery to customers. A significant achievement was Fonterra being named the number one preferred supplier to Coles, climbing from a ranking of 33 last year. Australia foodservice was also rated as the top dairy supplier for one of our major customers. These were achieved as a result of improved cross-function collaboration resulting in improvements across key metrics such as delivered in full, on time, forecasting accuracy, reduction in days cover and sales growth.
ITALIAN KITCHENOur successful foodservice strategy is focused on three main channels across our leadership and strategic markets, with particularly strong growth in the Italian kitchen channel.
USEFUL FACT In Australia, Fonterra was named #1 preferred supplier to Coles, climbing from 33.
OU
R P
ERFO
RM
AN
CE
OUR PERFORMANCE | 37
FONTERRA ANNUAL REVIEW 2015
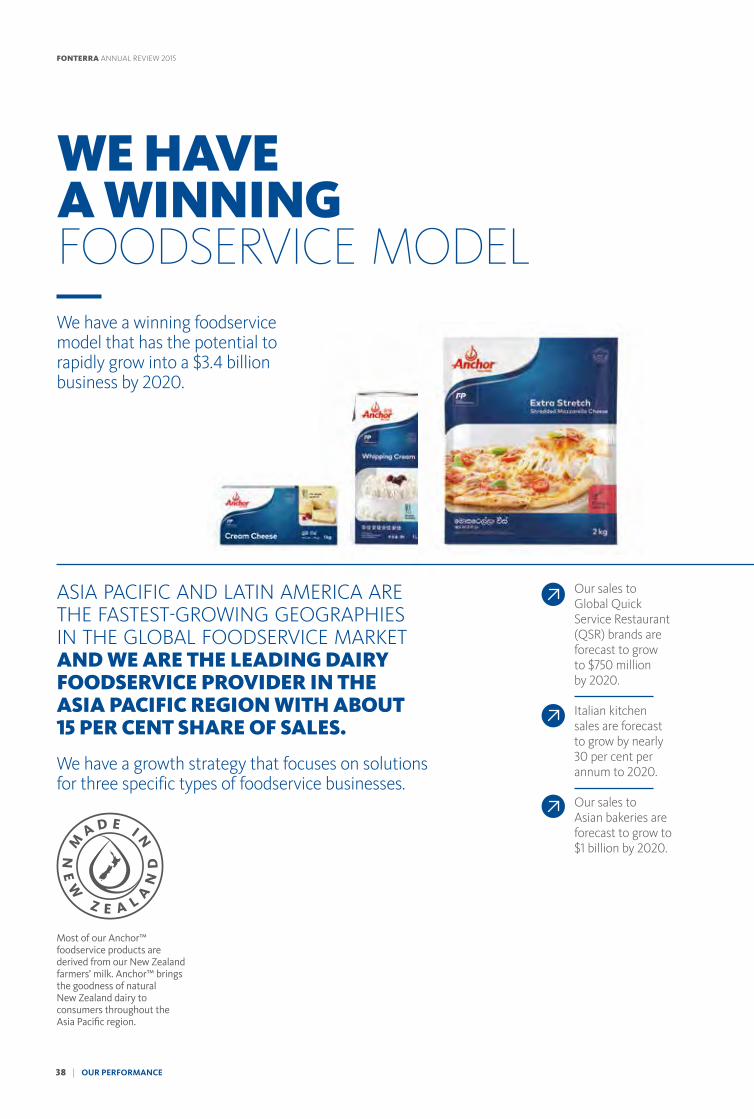
WE HAVE A WINNING FOODSERVICE MODELWe have a winning foodservice model that has the potential to rapidly grow into a $3.4 billion business by 2020.
ASIA PACIFIC AND LATIN AMERICA ARE THE FASTEST-GROWING GEOGRAPHIES IN THE GLOBAL FOODSERVICE MARKET AND WE ARE THE LEADING DAIRY FOODSERVICE PROVIDER IN THE ASIA PACIFIC REGION WITH ABOUT 15 PER CENT SHARE OF SALES.
We have a growth strategy that focuses on solutions for three specific types of foodservice businesses.
Most of our Anchor™ foodservice products are derived from our New Zealand farmers’ milk. Anchor™ brings the goodness of natural New Zealand dairy to consumers throughout the Asia Pacific region.
Our sales to Global Quick Service Restaurant (QSR) brands are forecast to grow to $750 million by 2020.
Italian kitchen sales are forecast to grow by nearly 30 per cent per annum to 2020.
Our sales to Asian bakeries are forecast to grow to $1 billion by 2020.
38 | OUR PERFORMANCE
FONTERRA ANNUAL REVIEW 2015

ASIAN BAKERY
> Our products such as Anchor™ Bakery Butters, Anchor™ Cream Cheese and Anchor™ Extra Whip Cream are used in croissants, pastries, cheesecakes and cream cakes, which are core offerings in nearly every bakery in Asia.
> Asian bakeries are the largest dairy foodservice channel in Asia.
> Fonterra dairy solutions deliver benefits including superior texture and improved taste in cheesecakes, cream cakes and pastries and higher whipping yields in cream cakes.
ITALIAN KITCHEN
> Our products including Anchor™ Extra Yield Culinary Cream and Anchor™ Extra Stretch Mozzarella Cheese are used in pasta and pizzas, which are the core offerings in most Italian-style restaurants.
> Pizza/pasta is the fastest growing western-style dining concept in Asia.
> Our dairy solutions for Italian kitchen save operators’ time, and reduce wastage and variability during the cooking process.
GLOBAL QUICK SERVICE RESTAURANTS
> Our dairy solutions are used in burgers, pizzas, soft-serve ice creams, frappes/smoothies and coffee beverages for some of the leading global QSR brands.
> These brands are benefiting from the growth in western-style dining across the emerging markets in Asia. We are the largest supplier of shredded mozzarella cheese and slice-on-slice processed cheese to global QSR brands in the Asia Pacific region.
TAKING OUR BEST TO THE WORLD
More than $150 billion of dairy products are purchased by foodservice businesses every year and with annual growth of six per cent it is growing faster than the overall food industry.
OU
R P
ERFO
RM
AN
CE
OUR PERFORMANCE | 39
FONTERRA ANNUAL REVIEW 2015

MILK VOLUMESales volume for the year increased by 64 per cent.
FARMING HUBS ARE A KEY COMPONENT TO OUR STRATEGY TO BECOME A MORE INTEGRATED BUSINESS IN CHINA.
China is a key strategic market for Fonterra and we are committed to participating in the development of the local dairy industry.
We have two farming hubs with a total of seven farms producing safe, high-quality raw milk. A typical hub accommodates approximately 16,000 milking cows, consisting of three to five farms in one region. A single farm can accommodate up to 3,500 milking cows while a double farm has capacity of up to 7,000 milking cows. In total we have 25,000 milking cows, as well as 29,000 heifers and calves across all our farms in China, supporting our growth.
USEFUL FACT At full capacity the Ying hub and Yutian hub can each produce 200 million litres per annum.
Sales volume of raw milk for the year increased to 164,000 MT largely due to additional capacity coming online. This equates to 12 million kgMS of milk produced for the year.
INTERNATIONAL FARMINGInternational Farming represents the international farming operations in China.
164,000MT
40 | OUR PERFORMANCE
FONTERRA ANNUAL REVIEW 2015

FARMING HUBSWe have made good progress in building an integrated dairy business in China.
The current result reflects both the development phase and adverse market conditions in the latter half of the financial year, with a normalised EBIT loss of $44 million. The main contributing factors were farm development costs, the fall in the milk price in China and a decrease in fair valuation in livestock, partially offset by significant operational efficiencies. As we develop farming hubs we benefit from economies of scale through purchasing of feed and staffing, both administration and farm management.
We are in a position where we can optimise our on-farm production. We are managing our farms to maximise profitability in the low milk price environment.
In the prior period the livestock values saw a significant uplift reflecting milk price and the herd profile assumptions at the time. The revaluation gain in the prior period was not repeated this year. For the full year, there was a revaluation loss of $3 million.
Future investments in China farms may include funding from strategic partners as well as Fonterra, enabling future and continued integration.
In total, capital expenditure for the year was $364 million. These funds were used for the expansion of Fonterra’s Ying and Yutian Hubs in addition to the ongoing construction of the farm effluent treatment systems. The total spend includes the purchase of livestock.
NZD MILLION
YEAR ENDED
31 JULY 2015
YEAR ENDED
31 JULY 2014 CHANGE
Volume (LME, billion) 0.2 0.1 100%
Volume (‘000 MT) 164 100 64%
Sales revenue 141 103 37%
Normalised EBIT (44) 21 –O
UR
PER
FOR
MA
NC
E
OUR PERFORMANCE | 41
FONTERRA ANNUAL REVIEW 2015

42 | OUR CO-OPERATIVE
FONTERRA ANNUAL REVIEW 2015
A STRONG CO-OPERATIVEThroughout the year, our farmers have made the most of the unity and strength of our Co-op.
Our aim was to help farmers take their farming business from strength to strength, to give them the benefit of local ears and eyes in their region and access to practical benefits, such as discounts on farming basics and access to group buying benefits. This is all about solutions, not problems, using the strength of the Co-operative to do more for our farmers.
At another level, we worked hard to simplify our farmers’ dealings with us. These include sharing-up options which give more time to back milk with shares, and a dividend reinvestment plan.
CONNECTING FARMERSWe have seven regional heads providing farmers with easy connections to their Co-operative.
We developed our Fonterra Co-operative Support package, which enables farmer shareholders to apply for an interest-free loan of 50 cents for every share-backed kgMS produced from 1 June to 31 December 2015. The loan will be interest-free until 31 May 2017, after which Fonterra may charge interest. The loan will be repayable directly from milk payments, and automatic repayments will occur when Total Advance Rate Payments exceed $6.00.
WE DEVELOPED AND ROLLED OUT FONTERRA FARM SOURCE™ THIS YEAR TO PROVIDE NEW LEVELS OF REWARDS, SERVICE, INFORMATION, FINANCIAL OPTIONS AND LOCAL SUPPORT FOR OUR FARMERS.
FONTERRA FARM SOURCE™ REWARDS DOLLARSCurrently, over 9,000 farmers have generated $4 million Fonterra Farm Source™ Rewards Dollars.
CO-OPERATIVE SUPPORT Fonterra Co-operative Support provides 50 cents for every share-backed kgMS produced.
$M

SENIOR SUPPORT IN THE REGIONS > We have seven regional heads in place, working with farmers to provide accurate information on the Co-op and speeding up the decision-making process for our farmers.
> These are senior people with extensive experience in the Co-operative and the skills to provide our farmers with the advice they need at a local level.
> They lead the many people we have working with farmers from Area Managers, Service Centres, and the Vat Assets team, to staff in our stores and our Sustainable Dairying Advisors.
> Feedback from farmers is that they value the new levels of support and advice the regional heads are providing.
INFORMATION AT FARMERS’ FINGERTIPS > Insights from the regions are helping us advance our digital strategy, so farmers can expect more facts, figures and useful information from us, direct to their smartphones.
> Our Fonterra Farm Source™ app gives farmers easy access to farm production data, tanker arrival estimates, farm supply deals and Co-op updates.
> We already have approximately 7,500 users.
> We also rolled out our My Co-op app, which gives farmers instant access to Fonterra news via their mobile.
$4 MILLION IN REWARDS DOLLARS > Our Fonterra Farm Source™ store network has grown market share by offering very competitive terms on farming necessities and reward purchases.
> Currently, over 9,000 farmers have generated $4 million Fonterra Farm Source™ Rewards Dollars, which can be redeemed for a range of products or Fonterra Farm Source™ vouchers.
> Fonterra Farm Source’s ability to respond to farmer needs was stepped up as the payout declined, with support including interest-free extended credit on farm basics and concessions on feed contracts.
MYMILK™ – MORE MILK > The MyMilk™ initiative offers farmers the opportunity to supply Fonterra for up to five seasons before having the option to share up.
> MyMilk™ is delivering on target.
> Suppliers can shift to share ownership and full membership of the Co-op.
THE FONTERRA FARM SOURCE™ APPOur app gives 7,500 farmers information at their fingertips.
OUR CO-OPERATIVE | 43 OU
R C
O-O
PER
ATI
VE
FONTERRA ANNUAL REVIEW 2015
SUSTAINABILITY AND SOCIALRESPONSIBILITYFor Fonterra and our farmers, operating responsibly means taking ownership for the impacts of our decisions on society and the environment.
Global demand for food is set to grow as the population is estimated to reach 9.7 billion by 20501. This demand growth must be met against a backdrop of limited resources, climate-related changes to global ecosystems, and consumers who are increasingly interested in the way their food is produced.
EMBEDDING A RESPONSIBLE AND SUSTAINABLE APPROACHDuring the past year we have further embedded our approach to monitoring our sustainability performance globally.
This has reinforced a range of topics that matter both to our stakeholders and our Co-operative success, including water, nutrition, food safety, climate change, efficient use of natural resources, and biosecurity.
We found many areas where we’re already performing well, or where improvement plans are in place. In other areas we now have an enhanced register of target improvements. Times are tough, but operating responsibly and sustainably is a necessity. We may need to adjust the pace of investment and change, but our commitment is clear – our responsibilities must be embedded in the way we do things.
IT’S ABOUT BEHAVING TRANSPARENTLY, ETHICALLY, AND THINKING FOR THE LONG TERM. IT’S ALSO ABOUT RESPECTING THE DIFFERENT PERSPECTIVES OF EVERYONE WHO HAS A LINK TO OUR CO-OPERATIVE, AND THE COMMUNITIES WHERE WE LIVE, WORK AND FARM.
STOCK EXCLUSION98 per cent of defined waterways on mapped farms were stock-excluded, up from 95 per cent reported last year.
%
1 United Nations World Population Prospects, 2015.2 This includes approximately 535km of waterways and 35 stock crossing points
with dispensations, primarily due to management plans achieving stock exclusion through a temporary or natural barrier. Taranaki farms are excluded from these statistics as they are covered by the Regional Council programme. 99 per cent of all other farms have been mapped.
3 OVERSEER® is owned by the Ministry for Primary Industries, the Fertiliser Association and AgResearch.
44 | OUR CO-OPERATIVE
FONTERRA ANNUAL REVIEW 2015

The Accord has targets for effluent management, nutrient management, water use efficiency and waterway management, including stock exclusion and riparian management.
Our farmers have continued to make progress towards the commitment to have stock excluded from 100 per cent of all defined waterways by 31 May 2017. At the end of July 2015, 98 per cent (24,352 kilometres) of defined waterways on mapped farms were stock-excluded2, up from 95 per cent reported last year. In addition, 99.4 per cent of regular water crossings have now been bridged or culverted.
Nitrogen ManagementNitrogen Management aims to reduce the impact of dairying on ground and surface water. In the past year our farmers have taken the time to record detailed information that allows us to produce farm reports for them using the OVERSEER® nutrient management tool3. These reports detail nitrogen leaching risk, nitrogen conversion efficiency and let farmers compare their performance to other farms in the region.
We have seen strong participation from our farmers, with 76 per cent completing an assessment in the past year, up from 59 per cent in the 2013/14 season. Our farmers continue to demonstrate leadership and their commitment in this area. While behind the target timeline, our Sustainable Dairying Advisors have provided an enhanced service this year to help with the process. This includes identifying potential efficiency gains and scenario analysis to predict the positive impact of farmer-driven changes on nitrogen loss, helping the environment and saving on-farm costs.
SUSTAINABLE DAIRYINGNew ZealandOur farmers are committed to building an industry that’s sustainable and resilient, particularly when faced with challenges. Together, we continue to use New Zealand’s dairy expertise and natural resources to produce dairy products that are trusted around the world. This will benefit our farmers and the Co-operative, and deliver an industry that is an asset to New Zealand and the countries in which we farm.
Supply FonterraWe are supporting our farmers’ sustainable farming practices with our Supply Fonterra programme. It supports farmers in future-proofing their farming operations by helping them to meet regulatory requirements and achieve environmental, food safety and animal welfare expectations.
Annual Farm Dairy and Environmental Assessments measure each farm’s sustainability performance. These demonstrate the real progress and investment made by our farmers. In some cases, where further improvements are needed, plans are developed with our farmers to help them get there.
Over the 2014/15 season, our farmers continued to make clear progress and total identified risks reduced by nine per cent.
Waterway ManagementWe are signatories to the Sustainable Dairying: Water Accord, an industry-wide commitment to a set of national benchmarks aimed at lifting environmental performance on dairy farms.
PARTICIPATION76 per cent of our farmers participated in nutrient management assessment.
SUSTAINABLE SUPPORTWe’re actively supporting our farmers’ sustainable farming practices with our Supply Fonterra programme.
76%
OUR CO-OPERATIVE | 45 OU
R C
O-O
PER
ATI
VE
FONTERRA ANNUAL REVIEW 2015
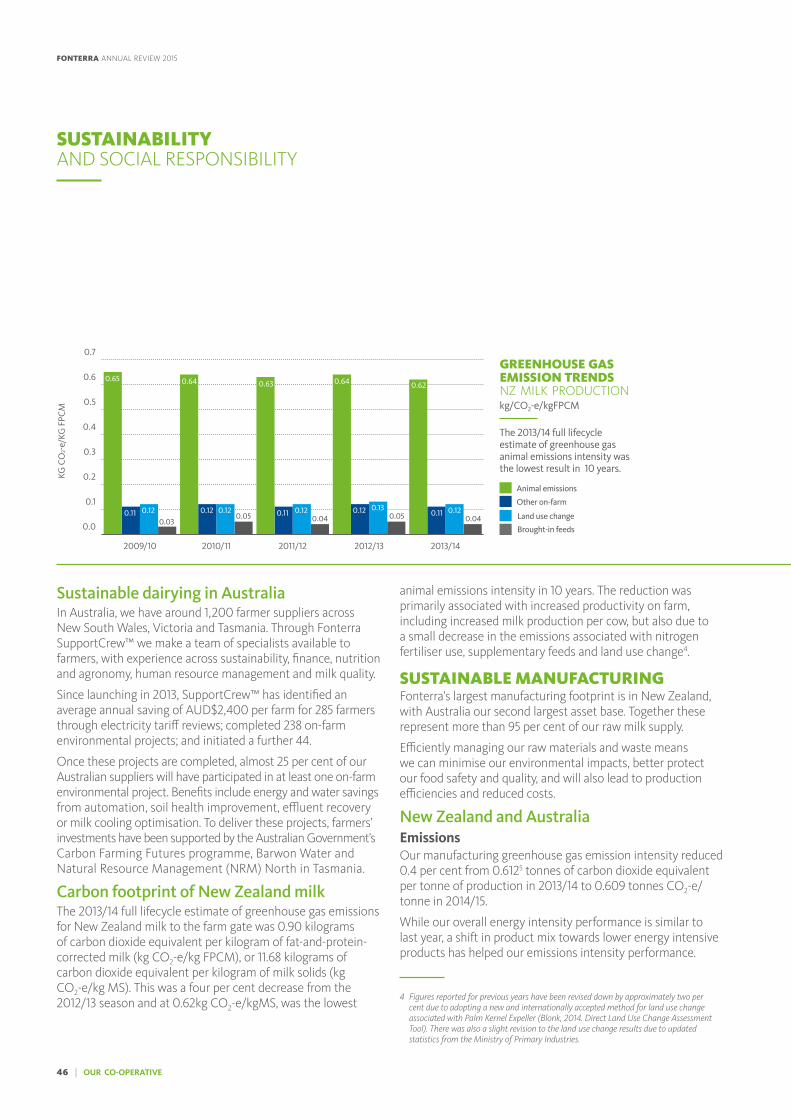
Sustainable dairying in AustraliaIn Australia, we have around 1,200 farmer suppliers across New South Wales, Victoria and Tasmania. Through Fonterra SupportCrew™ we make a team of specialists available to farmers, with experience across sustainability, finance, nutrition and agronomy, human resource management and milk quality.
Since launching in 2013, SupportCrew™ has identified an average annual saving of AUD$2,400 per farm for 285 farmers through electricity tariff reviews; completed 238 on-farm environmental projects; and initiated a further 44.
Once these projects are completed, almost 25 per cent of our Australian suppliers will have participated in at least one on-farm environmental project. Benefits include energy and water savings from automation, soil health improvement, effluent recovery or milk cooling optimisation. To deliver these projects, farmers’ investments have been supported by the Australian Government’s Carbon Farming Futures programme, Barwon Water and Natural Resource Management (NRM) North in Tasmania.
Carbon footprint of New Zealand milkThe 2013/14 full lifecycle estimate of greenhouse gas emissions for New Zealand milk to the farm gate was 0.90 kilograms of carbon dioxide equivalent per kilogram of fat-and-protein-corrected milk (kg CO2-e/kg FPCM), or 11.68 kilograms of carbon dioxide equivalent per kilogram of milk solids (kg CO2-e/kg MS). This was a four per cent decrease from the 2012/13 season and at 0.62kg CO2-e/kgMS, was the lowest
animal emissions intensity in 10 years. The reduction was primarily associated with increased productivity on farm, including increased milk production per cow, but also due to a small decrease in the emissions associated with nitrogen fertiliser use, supplementary feeds and land use change4.
SUSTAINABLE MANUFACTURINGFonterra’s largest manufacturing footprint is in New Zealand, with Australia our second largest asset base. Together these represent more than 95 per cent of our raw milk supply.
Efficiently managing our raw materials and waste means we can minimise our environmental impacts, better protect our food safety and quality, and will also lead to production efficiencies and reduced costs.
New Zealand and AustraliaEmissionsOur manufacturing greenhouse gas emission intensity reduced 0.4 per cent from 0.6125 tonnes of carbon dioxide equivalent per tonne of production in 2013/14 to 0.609 tonnes CO2-e/tonne in 2014/15.
While our overall energy intensity performance is similar to last year, a shift in product mix towards lower energy intensive products has helped our emissions intensity performance.
SUSTAINABILITY AND SOCIAL RESPONSIBILITY
4 Figures reported for previous years have been revised down by approximately two per cent due to adopting a new and internationally accepted method for land use change associated with Palm Kernel Expeller (Blonk, 2014. Direct Land Use Change Assessment Tool). There was also a slight revision to the land use change results due to updated statistics from the Ministry of Primary Industries.
0.0
0.1
0.2
0.3
0.4
0.5
0.6
0.7
2013/142012/132011/122010/112009/10
Brought-in feeds
Land use change
Other on-farm
Animal emissions
KG C
O2-
e/KG
FPC
M
0.65 0.64 0.640.63 0.62
0.11 0.12 0.12 0.12 0.13 0.120.11 0.110.120.12
0.030.05 0.04 0.05 0.04
GREENHOUSE GAS EMISSION TRENDS NZ MILK PRODUCTIONkg/CO2-e/kgFPCM
The 2013/14 full lifecycle estimate of greenhouse gas animal emissions intensity was the lowest result in 10 years.
46 | OUR CO-OPERATIVE
FONTERRA ANNUAL REVIEW 2015
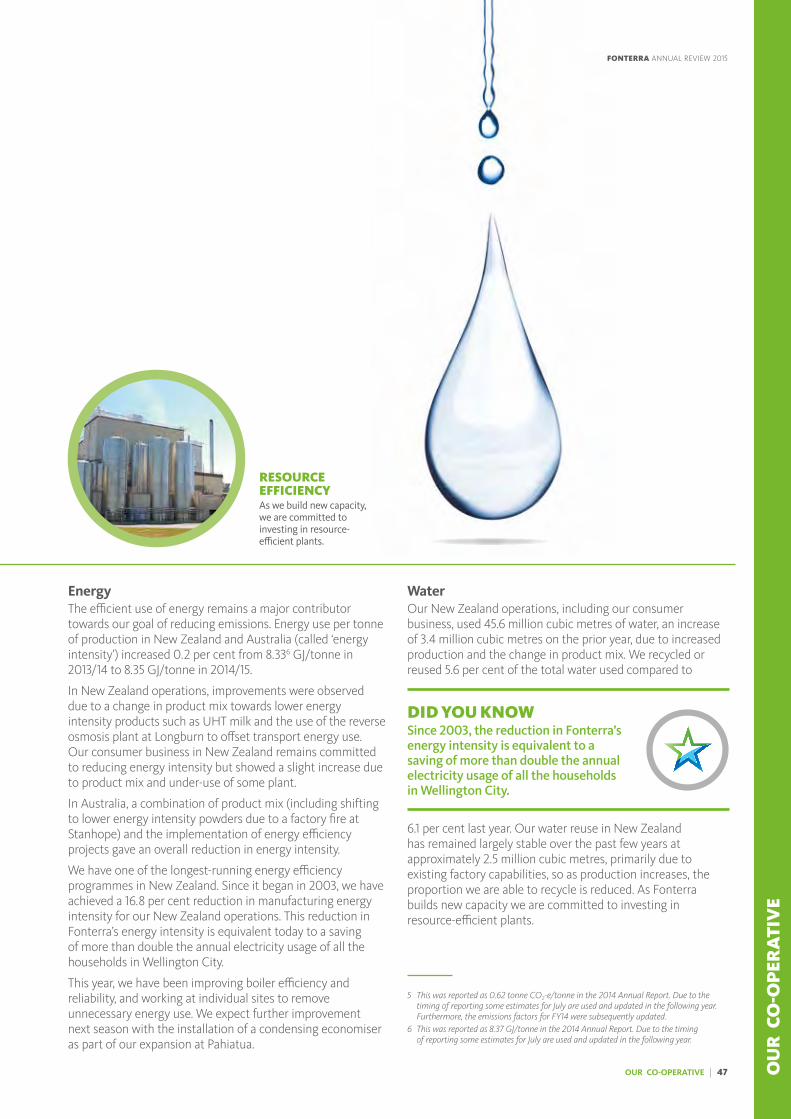
EnergyThe efficient use of energy remains a major contributor towards our goal of reducing emissions. Energy use per tonne of production in New Zealand and Australia (called ‘energy intensity’) increased 0.2 per cent from 8.336 GJ/tonne in 2013/14 to 8.35 GJ/tonne in 2014/15.
In New Zealand operations, improvements were observed due to a change in product mix towards lower energy intensity products such as UHT milk and the use of the reverse osmosis plant at Longburn to offset transport energy use. Our consumer business in New Zealand remains committed to reducing energy intensity but showed a slight increase due to product mix and under-use of some plant.
In Australia, a combination of product mix (including shifting to lower energy intensity powders due to a factory fire at Stanhope) and the implementation of energy efficiency projects gave an overall reduction in energy intensity.
We have one of the longest-running energy efficiency programmes in New Zealand. Since it began in 2003, we have achieved a 16.8 per cent reduction in manufacturing energy intensity for our New Zealand operations. This reduction in Fonterra’s energy intensity is equivalent today to a saving of more than double the annual electricity usage of all the households in Wellington City.
This year, we have been improving boiler efficiency and reliability, and working at individual sites to remove unnecessary energy use. We expect further improvement next season with the installation of a condensing economiser as part of our expansion at Pahiatua.
WaterOur New Zealand operations, including our consumer business, used 45.6 million cubic metres of water, an increase of 3.4 million cubic metres on the prior year, due to increased production and the change in product mix. We recycled or reused 5.6 per cent of the total water used compared to
6.1 per cent last year. Our water reuse in New Zealand has remained largely stable over the past few years at approximately 2.5 million cubic metres, primarily due to existing factory capabilities, so as production increases, the proportion we are able to recycle is reduced. As Fonterra builds new capacity we are committed to investing in resource-efficient plants.
5 This was reported as 0.62 tonne CO2-e/tonne in the 2014 Annual Report. Due to the timing of reporting some estimates for July are used and updated in the following year. Furthermore, the emissions factors for FY14 were subsequently updated.
6 This was reported as 8.37 GJ/tonne in the 2014 Annual Report. Due to the timing of reporting some estimates for July are used and updated in the following year.
RESOURCE EFFICIENCYAs we build new capacity, we are committed to investing in resource-efficient plants.
DID YOU KNOW Since 2003, the reduction in Fonterra’s energy intensity is equivalent to a saving of more than double the annual electricity usage of all the households in Wellington City.
OUR CO-OPERATIVE | 47 OU
R C
O-O
PER
ATI
VE
FONTERRA ANNUAL REVIEW 2015

As the expansion at Pahiatua goes live this season we expect to see a significant improvement there, as the site allows all evaporator condensate from the new drier to be reused.
Our Australian operations used 2.9 million cubic metres of water in the period 1 July 2014 to 30 June 2015, compared to 3.2 million cubic metres of water in the prior period. This reduction in water use has seen the water intensity (the amount of water used per tonne of production) reduce by 4.8 per cent, primarily due to changes in product mix.
WasteIn our New Zealand operations, including our consumer businesses, we reused or recycled 94 per cent of the solid waste. For the fifth consecutive year we have surpassed our target to reuse or recycle at least 90 per cent of our solid waste.
In the past year, in association with ecostore, we launched two portable consumer recycling stations as part of a recycling trial. Throughout the trial, stations have been moved between Auckland, Whangarei and Tauranga, and positioned in schools, community centres and businesses. The stations provide a drop off location for selected Fonterra and ecostore products.
The aim of the recycling stations is to encourage recycling and collect a clean stream of packaging that can be recycled locally into new products. If the trial is successful, Fonterra will look to work with other companies, councils and community groups to broaden the approach and create more drop-off locations for other products.
TRUST IN SOURCEOur Fonterra Food Safety and Quality System ensures that we have a clear and consistent framework to deliver safe, quality products and services all over the world. It enables oversight of product quality from farm to customer, including rigorous testing, verification and auditing regimes that starts on farm and run through the supply chain. In addition to our own testing, independent and external tests provide further reassurance on the quality and safety of our products.
2015 performance achievementsWe have conducted comprehensive food safety and quality audits of every Fonterra manufacturing site globally to identify any food safety risks to our business. These audits were completed in December 2014 and we have action plans in progress to make further improvements.
Our Food Safety and Quality System is also subject to regular scrutiny from third-party audits by regulators, key account customers and certification bodies. This year we have started the process to certify all Fonterra manufacturing plants against the latest globally recognised standards: FSSC22000 or BRC7. These standards are considered global benchmarks in food safety and quality management. All New Zealand ingredient sites achieved FSSC22000 certification this year.
Over the past year we have deployed a new tamper-evident solution for Anmum™ infant milk formula to give families added confidence across South East Asia and China. It gives
7 FSSC is Food Safety System Certification; BRC is the British Retailer Consortium.
FOOD SAFETY AND QUALITYWe have conducted comprehensive food safety and quality audits of every Fonterra manufacturing site globally.
SUSTAINABILITY AND SOCIAL RESPONSIBILITY
48 | OUR CO-OPERATIVE
FONTERRA ANNUAL REVIEW 2015
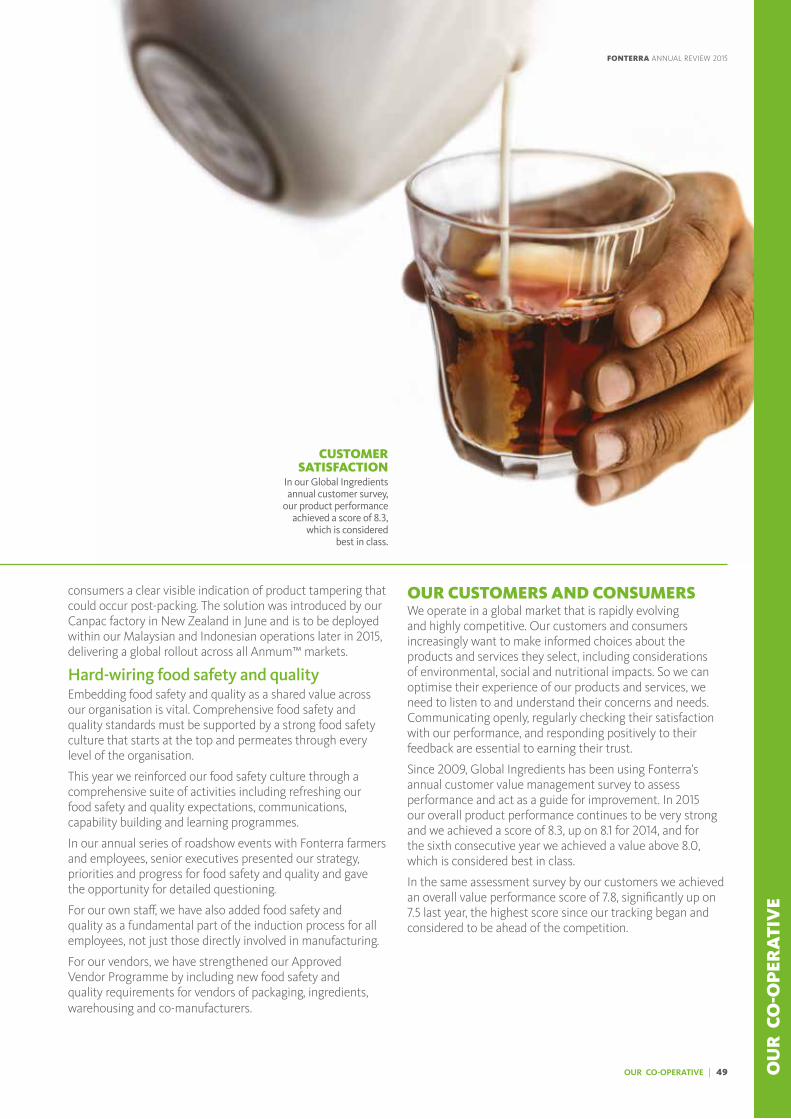
OU
R C
O-O
PER
ATI
VE
consumers a clear visible indication of product tampering that could occur post-packing. The solution was introduced by our Canpac factory in New Zealand in June and is to be deployed within our Malaysian and Indonesian operations later in 2015, delivering a global rollout across all Anmum™ markets.
Hard-wiring food safety and qualityEmbedding food safety and quality as a shared value across our organisation is vital. Comprehensive food safety and quality standards must be supported by a strong food safety culture that starts at the top and permeates through every level of the organisation.
This year we reinforced our food safety culture through a comprehensive suite of activities including refreshing our food safety and quality expectations, communications, capability building and learning programmes.
In our annual series of roadshow events with Fonterra farmers and employees, senior executives presented our strategy, priorities and progress for food safety and quality and gave the opportunity for detailed questioning.
For our own staff, we have also added food safety and quality as a fundamental part of the induction process for all employees, not just those directly involved in manufacturing.
For our vendors, we have strengthened our Approved Vendor Programme by including new food safety and quality requirements for vendors of packaging, ingredients, warehousing and co-manufacturers.
OUR CUSTOMERS AND CONSUMERSWe operate in a global market that is rapidly evolving and highly competitive. Our customers and consumers increasingly want to make informed choices about the products and services they select, including considerations of environmental, social and nutritional impacts. So we can optimise their experience of our products and services, we need to listen to and understand their concerns and needs. Communicating openly, regularly checking their satisfaction with our performance, and responding positively to their feedback are essential to earning their trust.
Since 2009, Global Ingredients has been using Fonterra’s annual customer value management survey to assess performance and act as a guide for improvement. In 2015 our overall product performance continues to be very strong and we achieved a score of 8.3, up on 8.1 for 2014, and for the sixth consecutive year we achieved a value above 8.0, which is considered best in class.
In the same assessment survey by our customers we achieved an overall value performance score of 7.8, significantly up on 7.5 last year, the highest score since our tracking began and considered to be ahead of the competition.
CUSTOMER SATISFACTION
In our Global Ingredients annual customer survey,
our product performance achieved a score of 8.3,
which is considered best in class.
OUR CO-OPERATIVE | 49
FONTERRA ANNUAL REVIEW 2015

Case study – Forging long-term partnerships through innovative solutionsThe Operations Master Plan is a joint initiative between Nestlé and Fonterra that was kicked off two years ago to grow our relationship with a focus on product quality, operational performance and customer service. Nestlé demands compliance to exacting product quality standards and business ways of working from all its suppliers.
Working together over the past two years, we have introduced improvements such as warehouse hubs in key regions to improve our service delivery and overall we have seen a lift in our delivery performance. In line with our own Trust In Source programme, our New Zealand supplying farms and manufacturing facilities have successfully passed the stringent responsible sourcing requirements set by Nestlé. In addition, our customer service team has focused on providing prompt resolutions to any issues that have been raised. All of these improvements have resulted in a substantial lift in customer satisfaction.
USEFUL FACT More than 1,490 schools are participating in our Fonterra Milk for Schools programme, which means approximately 170,000 primary-aged school children are able to drink milk every school day.
SUPPORTING COMMUNITIESSupporting the communities where we live, work and farm is part of who we are. We aim to improve livelihoods and support thriving communities by understanding their needs and expectations.
At the heart of our commitment to our communities is our desire to share what we do best: our excellence in dairy.
Fonterra Milk for SchoolsOur Fonterra Milk for Schools programme contributes to the health of future generations of New Zealanders and this year marks its first full year of national operation.
Participation remains strong, with more than 1,490 schools involved, which means approximately 170,000 primary-aged school children are able to drink milk every school day.
Preliminary results from two research projects suggests that it’s already having a positive impact on the dairy consumption of children and supporting healthy growth and development.
The programme is also building a connection between school children and the dairy farms where the milk comes from through visits from schools to farms, and visits to schools by our farmers and tankers.
SUSTAINABILITY AND SOCIAL RESPONSIBILITY
FONTERRA MILK FOR SCHOOLSPreliminary results from two research projects suggests that it’s already having a positive impact on the dairy consumption of children and supporting healthy growth and development.
50 | OUR CO-OPERATIVE
FONTERRA ANNUAL REVIEW 2015
KickStart BreakfastThe KickStart Breakfast programme provides a healthy breakfast of Weet-Bix and Anchor™ milk to New Zealand school children. Started in 2009 as a partnership between Fonterra and Sanitarium, it was expanded in 2013 from two days to five when the New Zealand Ministry of Social Development joined as a partner.
In the past year, we welcomed new schools, with more than 800 KickStart Breakfast clubs, run by volunteers, now active across the country, serving more than 100,000 breakfasts per week.
Living Water Partnership with the Department of ConservationLiving Water is a 10-year, $20 million partnership with the Department of Conservation. Established in 2013, Living Water is focused on five sensitive water bodies: Kaipara Harbour, Tı-kapa Moana/Firth of Thames, and three Waikato peat lakes, Te Waihora/Lake Ellesmere and Awarua/Waituna Lagoon.
The vision for the partnership is for a sustainable dairy industry as part of healthy functioning ecosystems that together enrich the lives of all New Zealanders. Over the past year we have been working to bring this vision to life through a number of start-up projects, and through working collaboratively with our communities to put three-year strategic plans in place.
Key achievements of the programme this year included field days to demonstrate how to build low-cost wetlands on farm, trialling passive filter systems, re-vegetation at all sites, drain rehabilitation, and completing baseline assessments of freshwater quality and biodiversity.
Sustainable Business CouncilWe are an active member of the Sustainable Business Council in New Zealand, a Global Network Partner of the World Business Council for Sustainable Development. This year, we have led a working group to improve business engagement on water in New Zealand and completed a pilot ecosystem services review project.
Fonterra ChinaIncreasing understanding of the dairy sector and encouraging the development of young talent in agriculture is an important aspect of our community involvement in China. This year we have hosted a series of activities for students from Beijing Guang’ai School, a charitable school for disadvantaged children, including donating Anchor™ milk and school stationery. For World Milk Day and International Children’s Day this year, winners of a painting competition at the school, themed ‘Farm in my heart’, were invited to visit one of our farms in China and experience life on a real working farm.
This year, we have also started a project at the Shandan Bailie school. This school was founded by the New Zealander Rewi Alley and has trained many professionals in the field of animal husbandry and agricultural science, and played a key role in promoting the development of local economy. In partnership with the Chinese People’s Association for Friendship with Foreign Countries (CPAFFC), we have set up scholarships for students from poverty-stricken areas.
LIVING WATERKey achievements of the programme this year included field days to demonstrate how to build low-cost wetlands on farm, trialling passive filter systems, re-vegetation at all sites and drain rehabilitation.
OUR CO-OPERATIVE | 51 OU
R C
O-O
PER
ATI
VE
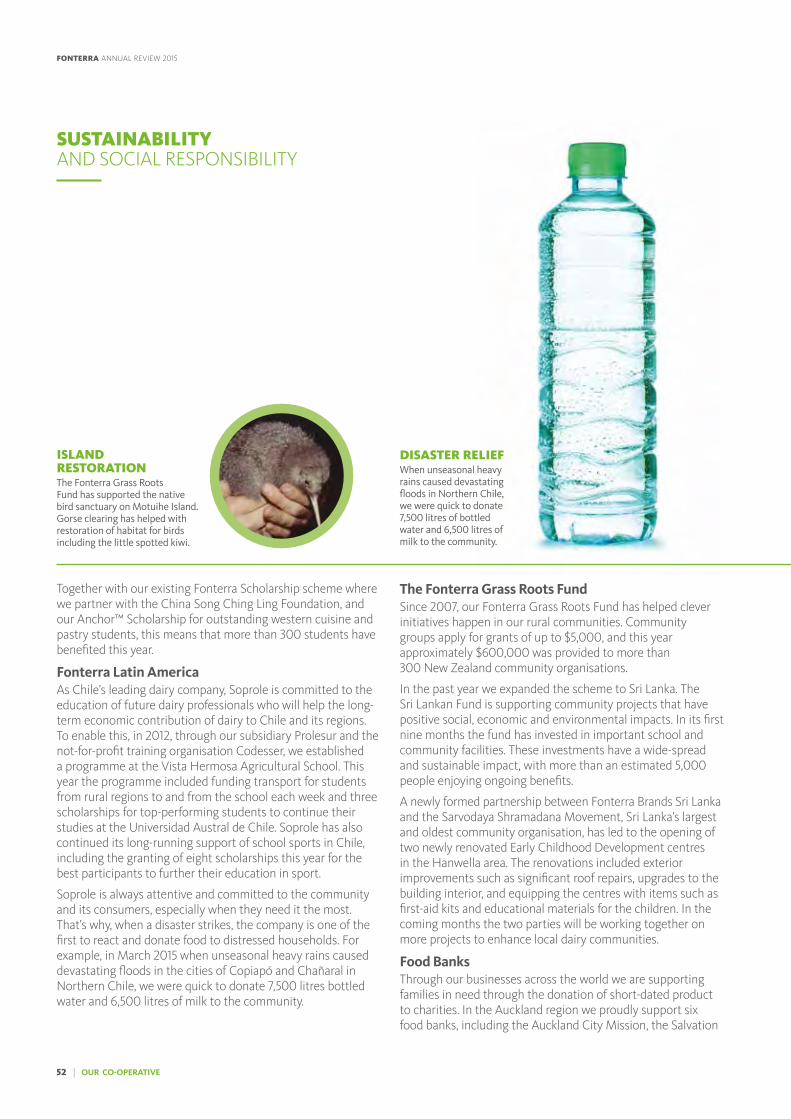
Together with our existing Fonterra Scholarship scheme where we partner with the China Song Ching Ling Foundation, and our Anchor™ Scholarship for outstanding western cuisine and pastry students, this means that more than 300 students have benefited this year.
Fonterra Latin AmericaAs Chile’s leading dairy company, Soprole is committed to the education of future dairy professionals who will help the long-term economic contribution of dairy to Chile and its regions. To enable this, in 2012, through our subsidiary Prolesur and the not-for-profit training organisation Codesser, we established a programme at the Vista Hermosa Agricultural School. This year the programme included funding transport for students from rural regions to and from the school each week and three scholarships for top-performing students to continue their studies at the Universidad Austral de Chile. Soprole has also continued its long-running support of school sports in Chile, including the granting of eight scholarships this year for the best participants to further their education in sport.
Soprole is always attentive and committed to the community and its consumers, especially when they need it the most. That’s why, when a disaster strikes, the company is one of the first to react and donate food to distressed households. For example, in March 2015 when unseasonal heavy rains caused devastating floods in the cities of Copiapó and Chañaral in Northern Chile, we were quick to donate 7,500 litres bottled water and 6,500 litres of milk to the community.
The Fonterra Grass Roots FundSince 2007, our Fonterra Grass Roots Fund has helped clever initiatives happen in our rural communities. Community groups apply for grants of up to $5,000, and this year approximately $600,000 was provided to more than 300 New Zealand community organisations.
In the past year we expanded the scheme to Sri Lanka. The Sri Lankan Fund is supporting community projects that have positive social, economic and environmental impacts. In its first nine months the fund has invested in important school and community facilities. These investments have a wide-spread and sustainable impact, with more than an estimated 5,000 people enjoying ongoing benefits.
A newly formed partnership between Fonterra Brands Sri Lanka and the Sarvodaya Shramadana Movement, Sri Lanka’s largest and oldest community organisation, has led to the opening of two newly renovated Early Childhood Development centres in the Hanwella area. The renovations included exterior improvements such as significant roof repairs, upgrades to the building interior, and equipping the centres with items such as first-aid kits and educational materials for the children. In the coming months the two parties will be working together on more projects to enhance local dairy communities.
Food BanksThrough our businesses across the world we are supporting families in need through the donation of short-dated product to charities. In the Auckland region we proudly support six food banks, including the Auckland City Mission, the Salvation
SUSTAINABILITY AND SOCIAL RESPONSIBILITY
ISLAND RESTORATIONThe Fonterra Grass Roots Fund has supported the native bird sanctuary on Motuihe Island. Gorse clearing has helped with restoration of habitat for birds including the little spotted kiwi.
DISASTER RELIEFWhen unseasonal heavy rains caused devastating floods in Northern Chile, we were quick to donate 7,500 litres of bottled water and 6,500 litres of milk to the community.
52 | OUR CO-OPERATIVE
FONTERRA ANNUAL REVIEW 2015

Army and Presbyterian Support and in the past year donated more than 80 tonnes of product. In Australia, we are a provider to Foodbank’s Milk programme, and in 2014–15, helped deliver 2.5 million litres of milk to Australians in need. In Chile, Soprole has been in partnership with ‘Red de Alimentos’ since 2011, supporting multiple charities to reduce hunger and improve Chilean’s nutrition.
Dairy DevelopmentThrough Dairy Development we aim to make a tangible difference to people’s livelihoods by improving milk productivity, quality and income. Building on our history of working with local communities and stakeholders around the world, we are committed not only to ensuring sustainable returns for our farmers, but also to contributing responsibly to key markets where we operate such as China, Sri Lanka, Indonesia and Malaysia.
We employ different models that reflect local operations and dairy development needs. For example, in Indonesia, we work in partnership with the Government and other partners on the Fonterra Dairy Scholarship programme for dairy farmers, dairy extension officers and dairy service providers to enable them to improve their dairy knowledge.
In China, our largest export market, we run farms with 25,000 milking cows employing about 1,000 locally recruited and trained staff.
We also support training programmes with the Ministry of Agriculture, the China-New Zealand Dairy Exchange
Centre and the China National Research Institute of Food & Fermentation Industries under the Ministry of Industry & Information Technology in Beijing to develop the skills of local dairy practitioners and promote Dairy Development. These programmes have trained nearly 3,000 farmers and processing workers in two years.
Case study – Dairy Development in Sri LankaFonterra has supported the development of the Sri Lankan dairy industry since 1997. We buy milk from several thousand local farmers, for sale under Fonterra brands, including Anchor™ Newdale.
In the past year, we have significantly expanded local milk sourcing and the level of our commitment to working with local farmers. The local Dairy Development team has been strengthened to include six Supplier Relationship Officers who share knowledge and expertise with the farmers. We began construction of our first Demonstration Farm and Training Centre at Pannalla, and added three further Fonterra-operated Milk Collection Centres to our network.
USEFUL FACT In the Auckland region alone this year, we have donated more than 80 tonnes of product to food banks.
MAKING A DIFFERENCEThrough Dairy Development we aim to make a tangible difference to people’s livelihoods by improving milk productivity, quality and income.
FONTERRA GRASS ROOTS FUNDThe Fonterra Grass Roots Fund has helped more than 300 New Zealand community organisations, including providing essential equipment for Land Search and Rescue (LSAR).
OUR CO-OPERATIVE | 53 OU
R C
O-O
PER
ATI
VE
FONTERRA ANNUAL REVIEW 2015
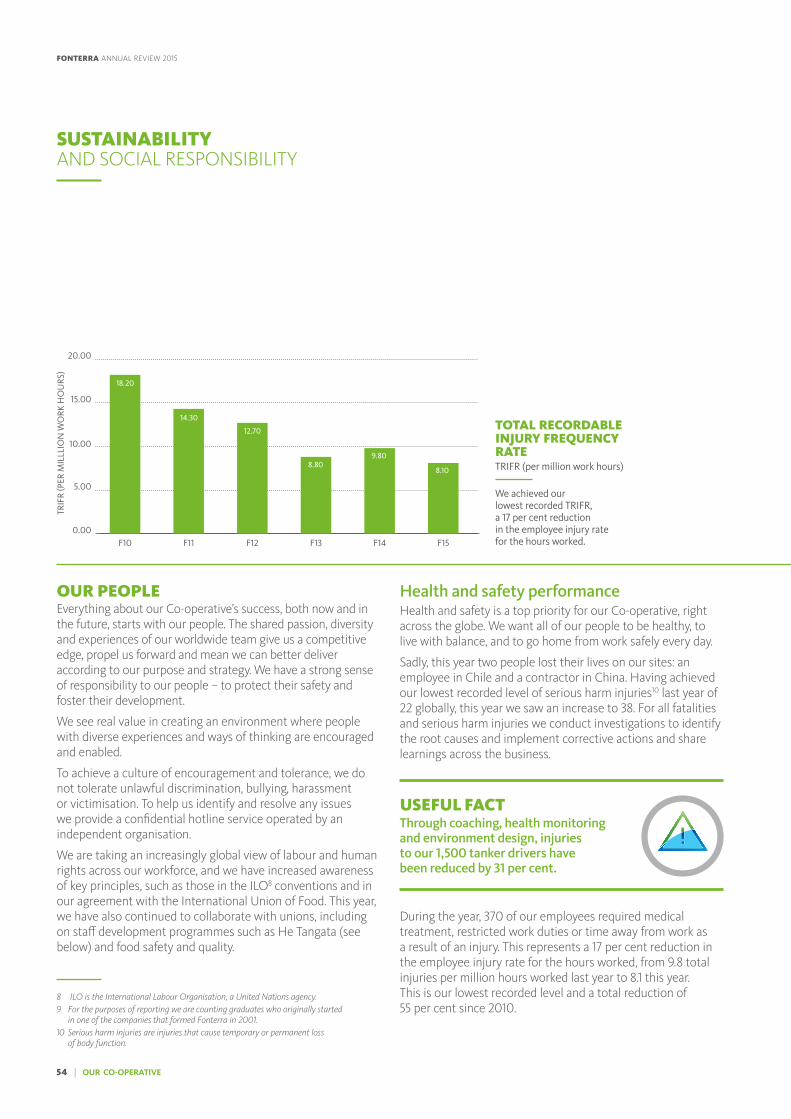
Health and safety performanceHealth and safety is a top priority for our Co-operative, right across the globe. We want all of our people to be healthy, to live with balance, and to go home from work safely every day.
Sadly, this year two people lost their lives on our sites: an employee in Chile and a contractor in China. Having achieved our lowest recorded level of serious harm injuries10 last year of 22 globally, this year we saw an increase to 38. For all fatalities and serious harm injuries we conduct investigations to identify the root causes and implement corrective actions and share learnings across the business.
USEFUL FACT Through coaching, health monitoring and environment design, injuries to our 1,500 tanker drivers have been reduced by 31 per cent.
During the year, 370 of our employees required medical treatment, restricted work duties or time away from work as a result of an injury. This represents a 17 per cent reduction in the employee injury rate for the hours worked, from 9.8 total injuries per million hours worked last year to 8.1 this year. This is our lowest recorded level and a total reduction of 55 per cent since 2010.
OUR PEOPLEEverything about our Co-operative’s success, both now and in the future, starts with our people. The shared passion, diversity and experiences of our worldwide team give us a competitive edge, propel us forward and mean we can better deliver according to our purpose and strategy. We have a strong sense of responsibility to our people – to protect their safety and foster their development.
We see real value in creating an environment where people with diverse experiences and ways of thinking are encouraged and enabled.
To achieve a culture of encouragement and tolerance, we do not tolerate unlawful discrimination, bullying, harassment or victimisation. To help us identify and resolve any issues we provide a confidential hotline service operated by an independent organisation.
We are taking an increasingly global view of labour and human rights across our workforce, and we have increased awareness of key principles, such as those in the ILO8 conventions and in our agreement with the International Union of Food. This year, we have also continued to collaborate with unions, including on staff development programmes such as He Tangata (see below) and food safety and quality.
8 ILO is the International Labour Organisation, a United Nations agency.9 For the purposes of reporting we are counting graduates who originally started
in one of the companies that formed Fonterra in 2001.10 Serious harm injuries are injuries that cause temporary or permanent loss
of body function.
0.00
5.00
10.00
15.00
20.00
F15F14F13F12F11F10
18.20
14.30
12.70
8.809.80
8.10
TRIF
R (P
ER M
ILLL
ION
WO
RK H
OU
RS)
SUSTAINABILITY AND SOCIAL RESPONSIBILITY
TOTAL RECORDABLE INJURY FREQUENCY RATETRIFR (per million work hours)
We achieved our lowest recorded TRIFR, a 17 per cent reduction in the employee injury rate for the hours worked.
54 | OUR CO-OPERATIVE
FONTERRA ANNUAL REVIEW 2015
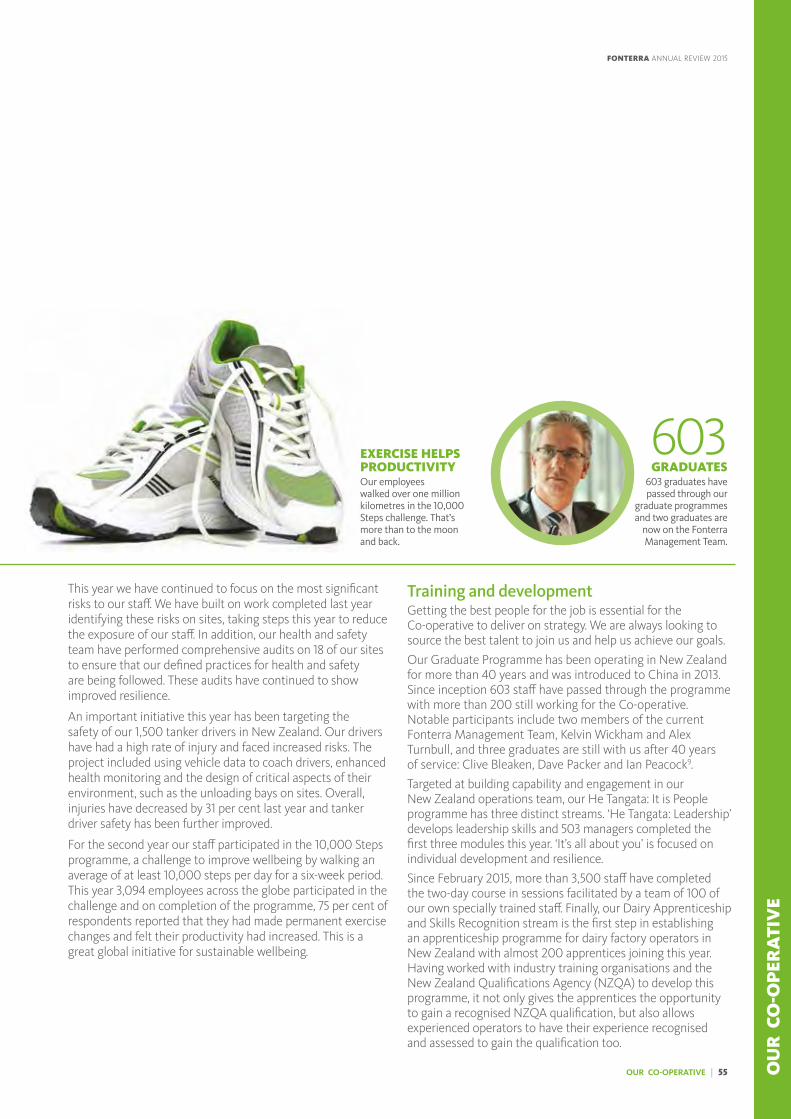
This year we have continued to focus on the most significant risks to our staff. We have built on work completed last year identifying these risks on sites, taking steps this year to reduce the exposure of our staff. In addition, our health and safety team have performed comprehensive audits on 18 of our sites to ensure that our defined practices for health and safety are being followed. These audits have continued to show improved resilience.
An important initiative this year has been targeting the safety of our 1,500 tanker drivers in New Zealand. Our drivers have had a high rate of injury and faced increased risks. The project included using vehicle data to coach drivers, enhanced health monitoring and the design of critical aspects of their environment, such as the unloading bays on sites. Overall, injuries have decreased by 31 per cent last year and tanker driver safety has been further improved.
For the second year our staff participated in the 10,000 Steps programme, a challenge to improve wellbeing by walking an average of at least 10,000 steps per day for a six-week period. This year 3,094 employees across the globe participated in the challenge and on completion of the programme, 75 per cent of respondents reported that they had made permanent exercise changes and felt their productivity had increased. This is a great global initiative for sustainable wellbeing.
Training and developmentGetting the best people for the job is essential for the Co-operative to deliver on strategy. We are always looking to source the best talent to join us and help us achieve our goals.
Our Graduate Programme has been operating in New Zealand for more than 40 years and was introduced to China in 2013. Since inception 603 staff have passed through the programme with more than 200 still working for the Co-operative. Notable participants include two members of the current Fonterra Management Team, Kelvin Wickham and Alex Turnbull, and three graduates are still with us after 40 years of service: Clive Bleaken, Dave Packer and Ian Peacock9.
Targeted at building capability and engagement in our New Zealand operations team, our He Tangata: It is People programme has three distinct streams. ‘He Tangata: Leadership’ develops leadership skills and 503 managers completed the first three modules this year. ‘It’s all about you’ is focused on individual development and resilience.
Since February 2015, more than 3,500 staff have completed the two-day course in sessions facilitated by a team of 100 of our own specially trained staff. Finally, our Dairy Apprenticeship and Skills Recognition stream is the first step in establishing an apprenticeship programme for dairy factory operators in New Zealand with almost 200 apprentices joining this year. Having worked with industry training organisations and the New Zealand Qualifications Agency (NZQA) to develop this programme, it not only gives the apprentices the opportunity to gain a recognised NZQA qualification, but also allows experienced operators to have their experience recognised and assessed to gain the qualification too.
603GRADUATES
603 graduates have passed through our
graduate programmes and two graduates are
now on the Fonterra Management Team.
EXERCISE HELPS PRODUCTIVITYOur employees walked over one million kilometres in the 10,000 Steps challenge. That’s more than to the moon and back.
OUR CO-OPERATIVE | 55 OU
R C
O-O
PER
ATI
VE
FONTERRA ANNUAL REVIEW 2015
CORPORATE GOVERNANCE
CONTENTS
CORPORATE GOVERNANCE 57
BOARD OF DIRECTORS 64
FONTERRA MANAGEMENT TEAM 66
56 | CORPORATE GOVERNANCE
FONTERRA ANNUAL REVIEW 2015

CORPORATE GOVERNANCEThe Board and Management of Fonterra are committed to achieving the highest standard of corporate governance and leadership.To support our role as a Board, we have developed governance systems that reflect Fonterra’s unique characteristics and requirements as a significant New Zealand-based co-operative competing in the global dairy market.
CHANGES TO THE FONTERRA BOARDThere were changes to the Fonterra Board during the financial year ending 31 July 2015. In November 2014, Jim van der Poel retired as a Farmer Director following 12 years of service and Leonie Guiney was elected as a Farmer Director. In May 2015 Sir Ralph Norris, an Independent Director, indicated he will not seek to continue his term on the Board following the Annual Meeting on 25 November 2015.
COMPLIANCE WITH BEST PRACTICE GOVERNANCE STANDARDSThe Fonterra Board’s governance framework takes into consideration contemporary standards in New Zealand and Australia, incorporating the Corporate Governance in New Zealand Principles and Guidelines issued by the Financial Markets Authority in December 2014, the Corporate Governance Best Practice Code issued by NZX Limited (NZX) for the Fonterra Shareholders’ Market (FSM) and the third edition of the ASX Limited (ASX) Corporate Governance Council Principles and Recommendations (ASX Principles). These are guidelines designed to maximise company performance and accountability in the interests of farmer shareholders, unitholders and the broader community.
Fonterra complies with the Fonterra Shareholders’ Market Corporate Governance Best Practice Code.
We focus on governance in a way that promotes: > the interests of our farmer shareholders and other key stakeholders
> Fonterra’s Co-operative philosophy, which is largely expressed through our Co-operative principles
> transparency, giving our farmer shareholders, Fonterra Shareholders’ Fund (FSF) unitholders and other stakeholders the information they need to assess our performance
> effective risk management to ensure that Fonterra meets its business objectives and all legal requirements
> an appropriate balance between the roles and functions of the Board and Management
> communication with important stakeholder groups, including farmer shareholders, employees, customers, unitholders, debt investors, governments and the communities Fonterra works in.
CORPORATE GOVERNANCE | 57
FONTERRA ANNUAL REVIEW 2015
Principle 1: Ethical Standards Ethics frameworkFonterra expects its Directors, officers and employees to maintain high ethical standards. The Board is committed to maintaining high ethical standards across the group, in all aspects of the business in all parts of the world. The Group Ethical Behaviour Policy and the Board Charter set out these standards. These documents are reviewed and approved annually.
Fonterra’s Code of Business Conduct – The Way We Work – provides practical guidelines on how to apply Fonterra’s values in everyday work situations and when working with customers, farmer shareholders, suppliers and the wider community.
The Way We Work is available in several languages, to facilitate its accessibility to Fonterra’s global employee base. The document has been written in simple, straightforward language. An independently run telephone, email and web-based Hotline provides individuals with a confidential channel to raise ethical issues. In the 2015 financial year, 31 calls were raised globally with the Hotline.
All were fully investigated and appropriate action taken, including managing issues through other HR processes.
Employee training is provided on both the Group Ethical Behaviour Policy and The Way We Work. Individuals are assessed to ensure understanding of group policies and an annual compliance certification process promotes compliance.
Principle 2: Board Composition and PerformanceOur BoardThe Constitution of Fonterra provides for not more than 13 directors and sets out how they are appointed.
In accordance with the Constitution, not more than nine directors are elected by farmer shareholders from the shareholder base, and not more than four directors are appointed by the Board. The People, Culture and Safety Committee oversees the process for identifying and recommending potential appointees, and makes appropriate recommendations to the Board. The Board of the Fonterra Shareholders’ Fund is also consulted in relation to the appointment of Appointed Directors.
The Appointed Directors are selected to enable the Board to access a full complement of skills and competencies needed to lead an enterprise of Fonterra’s size, sophistication and complexity. They bring to the Board perspectives, experience and skills to augment the direct industry knowledge and other expertise provided by the Farmer Directors.
Farmer Directors must be qualified as farmer shareholders under section 12.3 of the Constitution and are therefore not considered Independent Directors.
Director independenceThe rules of the Fonterra Shareholders’ Market require Fonterra to have a minimum of two Independent Directors.
In order to be an Independent Director, a Director must not be an executive officer of Fonterra, or have a disqualifying relationship.
A Director has a disqualifying relationship where he or she has a direct or indirect interest or relationship that could reasonably influence, in a material way, the Director’s decisions in relation to Fonterra. The FSM Rules contain specific examples of what may give rise to a disqualifying relationship. Appointed Directors cannot be shareholders and are expected to maintain independence for the length of their term.
At 31 July 2015, Simon Israel, David Jackson, Sir Ralph Norris and John Waller each did not have (and continue not to have) any disqualifying relationship in relation to Fonterra and are therefore Independent Directors.
The Board has determined that Simon Israel, David Jackson, Sir Ralph Norris and John Waller (being the Directors appointed by the Board in accordance with Fonterra’s Constitution) are Independent Directors under the FSM Rules as at 31 July 2015.
John Wilson, who is a Farmer Director, is the Board-elected Chairperson. Following good governance, the Chairperson and Chief Executive roles at Fonterra are not exercised by the same individual.
Board Charter The Board Charter, which sets out the responsibilities, roles and obligations of the Board and Directors is reviewed annually and was last approved by the Board in December 2014. The Board Charter and the Charters of the Board Committees are available on fonterra.com. The Board considers it important that there is a good balance of experience on the Board. To help achieve this, the Board Charter prescribes the qualifications and skills required of Directors, and contains principles in relation to the tenure of Directors. The Board Charter also contains details of the delegation of authority to management, the Board’s procedures, the training provided to Directors and the process for assessing the Board’s performance.
Board meetingsThe Board meets formally at least seven times a year and has regular and ad hoc teleconferences to ensure the Board is kept informed, and to deal with specific issues as they arise. Between full Board meetings, the Board uses committees to advance its work programme and to enhance the efficiency and effectiveness of its decision making.
CORPORATE GOVERNANCE
58 | CORPORATE GOVERNANCE
FONTERRA ANNUAL REVIEW 2015

Information for the BoardIt is important that all members of the Board are appropriately informed of the group’s activities.
Directors are supplied with detailed monthly performance reports and analysis in advance of all Board meetings, together with papers on any significant commercial initiatives, and information on the group’s competitive position, industry updates and general economic indicators.
The Directors also make a point of meeting away from head office on a semi-regular basis so that they can broaden their understanding of the business through direct contact with managers and customers. Directors regularly visit key markets to gain a better understanding of the global dairy market.
Director trainingFollowing appointment to the Board, Directors undertake an induction programme to familiarise themselves with the group. Areas covered include:
• business strategy and planning
• an overview of key financial metrics to monitor business performance
• an overview of material areas of the Fonterra business, including through meetings with key executives
• the Fonterra Constitution and other governance systems.
Directors are expected to keep themselves abreast of changes and trends in the business and in Fonterra’s environment and markets, and trends in the economic, political, social and legal climate generally. As a group the Board holds several workshops on relevant subjects each year, and Directors are also expected to keep up to date with governance issues.
Nomination CommitteeThe People, Culture and Safety Committee oversees the process for appointments to the Board. To the extent the Board is responsible for appointing Directors, the People, Culture and Safety Committee satisfies the role of a nomination committee.
Performance assessmentDirectors formally assess the performance of the Board as a whole each year. A regular programme of peer review of individual Directors also occurs. The Shareholders’ Council reviews the Board’s Statement of Intentions against the performance and operation of the group and reports on this to farmer shareholders annually. The Board is responsible for reviewing the Chief Executive’s performance.
Independent professional adviceAny Director of the Board is entitled to seek independent professional advice relating to the affairs of Fonterra or to his or her other responsibilities as a Director. Fonterra will pay the reasonable cost of independent professional advice.
Diversity and Inclusion PolicyFonterra has a Board-approved People Policy that encompasses the Group’s policy on diversity and inclusion. Fonterra is committed to creating and maintaining an environment where people with diverse experiences and ways of thinking are encouraged and enabled. Fonterra recognises that diversity is not solely a matter of compliance; it means respecting differences and making those differences count. The People Policy requires that all policies, standards and guidelines support the intent of diversity and inclusion. Fonterra proactively identifies and maximises local talent pools to improve participation. This includes increasing gender ratios in leadership, and access for people with disabilities, and those representing different cultures and ethnicities. To give effect to our People Policy, Fonterra is looking to develop targets to enable diversity and inclusion to be appropriately monitored.
As at 31 July 2015, the gender composition of the Board comprised 11 male Directors and two female Directors (2014: 1 of 13). The nine Farmer Directors on the Fonterra Board are elected by postal ballot of the farmer shareholders conducted by the Shareholders’ Council, and the four Appointed Directors are appointed by the Board and ratified by farmer shareholders. Of 16 officers who reported directly to the Chief Executive at 31 July 2015, four were female (2014: 3 of 12).
CORPORATE GOVERNANCE | 59
FONTERRA ANNUAL REVIEW 2015

Principle 3: Board CommitteesFonterra has a number of permanent Board Committees, as detailed in the table below. Additional Board Committees will be formed when it is efficient or necessary to facilitate efficient decision-making by providing for a sub-group of Directors to focus on particular areas or issues and to develop recommendations to the full Board.
The Fonterra Board Committees have a standard Terms of Reference and each committee has a charter, which defines the scope and responsibilities of that committee and is approved by the Board annually. The minutes for each of the Board Committees’ meetings are supplied to the Board for review.
CORPORATE GOVERNANCE
COMMITTEE OR GROUP MEMBERSHIP AS AT 31 JULY 2015 PURPOSE
Audit and Finance Committee
David Jackson (Chair)Ian FarrellyLeonie Guiney
Michael SpaansNicola ShadboltJohn Waller
To assist the Board in fulfilling its governance responsibilities in relation to Fonterra’s financial reporting, audit activities, Treasury matters, financial risk management and internal control frameworks.
People, Culture and Safety Committee
John Wilson (Chair)Ian FarrellyJohn Monaghan
Simon IsraelSir Ralph NorrisDavid Jackson (observer)
To assist the Board in fulfilling its governance responsibilities in relation to the recruitment, retention, remuneration and development of Directors, executives and other employees, and to promote a safe and healthy working environment.
Co-operative Relations Committee
John Monaghan (Chair)Malcolm BaileyDavid MacLeod
Ian (Blue) ReadMichael Spaans
To assist the Board in fulfilling its governance responsibilities in relation to the supply of milk from Fonterra suppliers, and to seek to resolve supplier complaints before reference to the Milk Commissioner.
Risk Committee Malcolm Bailey (Chair)David JacksonIan Farrelly
Leonie GuineyIan (Blue) ReadJohn Waller
To assist the Board in fulfilling its corporate governance responsibilities relating to Fonterra’s management of key enterprise-wide risks. This includes strategic and operational risks, through Fonterra’s enterprise-wide risk management framework, the behaviours required of its people and its guidelines, policies and processes for monitoring and mitigating enterprise-wide risks.
Board and Committee attendance
BOARD REGULAR
AFC PCS CRC RC
John Wilson 10/10 – 6/6 – –
Malcolm Bailey 10/10 – – 5/6 3/3
Ian Farrelly 10/10 7/7 6/6 – 1/3¹
Leonie Guiney (elected 12 November 2014 – 7 meetings) 7/7 4/7¹ – – 0/3¹
Simon Israel 10/10 – 6/6 – –
David Jackson 10/10 7/7 6/6 – 3/3
David MacLeod 10/10 3/7¹ – 6/6 –
John Monaghan 10/10 – 6/6 6/6 2/3
Sir Ralph Norris 9/10 3/7¹ 4/6 – 1/3¹
Blue Read 10/10 – – 5/6 1/3¹
Nicola Shadbolt 10/10 7/7 – – –
Michael Spaans 10/10 4/7¹ – 4/6 –
Jim van der Poel (retired 12 November 2014 – 3 meetings) 3/3 – – – 2/3
John Waller² 7/7 5/5 – – 2/2
TOTAL MEETINGS 10 7 6 6 3
1 Committee memberships were reviewed in February 2015 and memberships changed. Directors’ attendances may reflect serving on committees for only part of the year.2 Mr Waller was on a leave of absence for part of the financial year.
60 | CORPORATE GOVERNANCE
FONTERRA ANNUAL REVIEW 2015

Audit and Finance CommitteeThere is an established Audit and Finance Committee as described on the previous page.
The Audit and Finance Committee comprises two Appointed Directors and four Farmer Directors. The committee is chaired by David Jackson, who is an Independent Director and a Fellow of the New Zealand Institute of Chartered Accountants.
Principle 4: Reporting and DisclosureFonterra is committed to high standards of reporting and disclosure. The Board has overall responsibility for the financial statements and the Audit and Finance Committee, as described on the previous page, plays an important role in overseeing the financial reporting processes used by management.
Financial reporting The Audit and Finance Committee reviews the financial statements and recommends approval of the financial statements to the Board. The committee considers whether the financial statements are complete, whether they reflect appropriate accounting policies, any major judgement areas, any legal matters that may significantly impact the financial statements and any complex transactions.
The CEO and CFO provide the Board with management representations that the Fonterra financial statements give a true and fair view, in all material respects, of Fonterra’s financial position and financial performance for each financial reporting period.
The Audit and Finance Committee oversees the Internal Assurance function and reviews the annual Internal Audit work plan. Internal audits provide assurance to the Board and management that the internal control framework is operating effectively.
Milk Price PanelThe Board has created the Milk Price Panel for the purpose of providing assurances as to the governance of the Farmgate Milk Price and the proper application of the Farmgate Milk Price Manual and the Milk Price Principles.
The Panel does not determine the Farmgate Milk Price, as this is a decision for the Board.
The Dairy Industry Restructuring Act 2001 (New Zealand) requires that the Chair and a majority of the members of the Panel (including the Chair) are independent. The Panel consists of two Appointed Directors, one Farmer Director and two appropriately qualified persons nominated by the Shareholders’ Council, at least one of whom must be independent. The Chair must be one of the Appointed Director members. The Panel is currently chaired by John Waller. Other Board members are David Jackson and Michael Spaans. The Shareholders’ Council appointees are Patrick Boyle and Bill Donaldson. The Board confirms that at 31 July 2015, John Waller, David Jackson and Patrick Boyle are considered to be Independent Members of this panel.
Continuous Disclosure Regime Fonterra is committed to promoting a well-informed and efficient market in its shares, units issued by the Fonterra Shareholders’ Fund and debt securities. The Board has approved a Group Disclosure Policy to ensure compliance with the FSM, the NZX Main Board and ASX listing rules regarding disclosure. The Group Disclosure Policy governs Fonterra’s communications with investors and market participants, and the disclosure of information relevant to Fonterra.
Fonterra has established a Disclosure Committee that holds regular and ad hoc meetings to oversee Fonterra’s continuous disclosure obligations. The Disclosure Committee has overall responsibility for reviewing, monitoring and implementing the Group Disclosure Policy.
Fonterra and the Manager of the Fonterra Shareholders’ Fund have entered into an arrangement to co-operate with each other and take all steps reasonably required to ensure that information to be disclosed by either of them under the listing rules of the FSM, the NZX Main Board or the ASX (as the case may be) is disclosed simultaneously to the Fonterra Shareholders’ Market, the NZX Main Board and the ASX. It is intended that where NZX, as market operator of the Fonterra Shareholders’ Market, receives information provided by Fonterra for release under the Fonterra Shareholders’ Market, NZX will simultaneously release the information under the code relating to the Fund. This process is intended to be automatic. Fonterra simultaneously discloses relevant information on ASX.
Securities trading policyFonterra has adopted a Securities Trading Policy that details the rules for trading in units and/or shares. The policy applies to Directors, officers, employees and contractors of Fonterra and members of the Shareholders’ Council and Milk Price Panel, and is additional to legal prohibitions on insider trading in New Zealand and Australia. All Directors comply with the legislative requirements for disclosing interests and with the Securities Trading Policy, which regulates both Directors and management in their personal dealings with Fonterra securities and those of related companies.
Principle 5: RemunerationFonterra’s remuneration framework is designed to attract, retain and motivate high-quality Directors and senior management.
The Constitution modifies the discretion of the Board to set remuneration of Directors. In accordance with the Constitution, farmer shareholders elect an independent committee of six farmer shareholders to consider and make recommendations to the Annual Meeting on Farmer Director remuneration.
CORPORATE GOVERNANCE | 61
FONTERRA ANNUAL REVIEW 2015
The members of the Directors’ Remuneration Committee as at 31 July 2015 were Rodney Wilson (Chair), David Gasquoine, Murray Holdaway, Scott Montgomerie, Philip Wilson and Gerard Wolvers.
The Board has full discretion over the remuneration of Appointed Directors. The details of the Directors’ remuneration are contained on page 57 of the Annual Financial Results document.
The remuneration framework for management is outlined on page 50 of the Annual Financial Results document.
Principle 6: Risk ManagementRisk managementThere is an established Risk Committee as described previously. The Audit and Finance Committee oversees financial risk management and the Risk Committee covers all other aspects of risk including ensuring a strong risk management culture in Fonterra.
The Risk Committee comprises two Appointed Directors and three Farmer Directors. The Committee is chaired by Malcolm Bailey, who is a Farmer Director. It is a requirement that the Chairman of the Audit and Finance Committee is also a member of the Risk Committee.
Fonterra has a global Risk Management Policy, the purpose of which is to embed an enterprise-wide risk management capability within Fonterra to provide a consistent method for the identification, assessment, control, monitoring and reporting of risks faced by the organisation. The policy recognises that risk represents both opportunity and threat and that risk is an integral part of business.
Fonterra’s tolerance for risk is defined in the Risk Management Framework, which requires the reporting of material risks as appropriate to the Fonterra Management Team, the Risk Committee and the Board.
Fonterra’s Risk Management Policy was reviewed by the Board in June 2015 and is aligned with the ISO31000 Risk Management Standard. The Policy is supported by a detailed Group Risk Management Standard and Guidelines that define the mandatory requirements relating to risk management for businesses. The Risk Management Policy provides a consistent methodology and approach for the execution of these mandatory requirements by specifying processes for:
• identifying existing and potential risks that may impact upon business objectives
• assessing the consequence and likelihood of risks identified
• identifying key controls in place to address risks
• evaluating the design and operating effectiveness of controls in mitigating risks to an acceptable level
• generating action plans to improve controls where required
• regularly monitoring risks and tracking progress against action plans.
Risk reporting to the Board for review occurs on a regular basis. This includes Fonterra’s top 20 risks, and changes in risks and emerging risk areas. This process is supported by a formal annual evaluation of the top risks by all material business units along with a six-monthly review and update of this risk assessment material. The six-monthly review process also includes management’s self-assessment of the effectiveness of key controls relied upon to manage the top risks. A summary of the results of this assessment is reported to the Risk Committee.
Fonterra’s Internal Audit function is accountable for formally reviewing the effectiveness of the group’s risk management processes, including using the outputs of risk assessments to compile its audit plan and performing independent validation of the control environment.
Principle 7: Auditors The Audit and Finance Committee is responsible for making recommendations to the Board regarding the appointment of the external auditor. The auditor is appointed by the shareholders at the Annual Meeting.
The Audit and Finance Committee reviews the independence of the auditor and reviews the external audit fees, the terms of engagement and annual audit plan.
Fonterra encourages the rotation of the lead external audit partner in the relationship in accordance with best practice. Fonterra has a Group Audit Independence Policy, for certain activities the auditor may undertake for the group. This policy is prescriptive as to the types of activities that the auditor may undertake, those the auditor may only undertake with the approval of the Audit and Finance Committee, and the types of activities that are not permitted. The Audit and Finance Committee will not approve the auditor performing any tasks that have the potential to create a conflict except in exceptional circumstances and then only if appropriate safeguards are in place.
The Audit and Finance Committee Chairman communicates regularly with the external auditor and the Audit and Finance Committee meet with the external auditor without management at least annually.
Principle 8: Shareholder RelationsShareholders’ CouncilOne of the Board’s most important relationships is with the Shareholders’ Council. The Council, which is established under the Fonterra Constitution, is independent of the Board and comprises 35 farmer shareholders elected as councillors, representing 35 wards across New Zealand. The functions of the Council are set out in the Constitution. The Council reviews the Board’s statement of intentions for the performance and operations of the group and publishes an annual report, commenting on these matters. The Council and the Board meet regularly, as do the Chairs of the Board and the Council and the Chairs of their respective committees.
CORPORATE GOVERNANCE
62 | CORPORATE GOVERNANCE
FONTERRA ANNUAL REVIEW 2015
Farmer communicationsFonterra is committed to maintaining and improving dialogue with our farmer shareholder base to ensure that the objectives of both the group and farmer shareholders are understood. An extensive farmer shareholder and supplier relations programme is managed by the Group Director Co-operative Affairs. Channels for electronic communication are provided through the fonterra.com and Fonterra Farm Source™ websites and the My Co-op smartphone app introduced this year.
Fonterra’s communications with farmer shareholders include regular face-to-face meetings, Sky broadcasts, the Global Dairy Update, Farm Source publication and a regular Chairman’s email. As described above, Fonterra releases to the relevant stock exchanges all material information, and will comply with the Fonterra Shareholders’ Market, NZX Main Board and ASX Listing Rules with respect to shareholder communications.
Farmer meetingsA schedule of regular meetings with farmer shareholders, sharemilkers and farm workers is held across the country at least twice a year. Often these are run in conjunction with the Shareholders’ Council, Area Managers and the Fonterra Farmer Network.
Directors also regularly attend other farmer meetings during the year on specific topics.
In addition, the Board consults with farmer shareholders on specific issues as they arise.
Fonterra.com and Fonterra Farm Source™ websitePresentations on the development of the business are available on the fonterra.com website. The group also uses email alerts, including regular updates from the Chairman and regular farmer shareholder updates.
The Fonterra Farm Source™ website enables Fonterra shareholders, their employees and business partners to transact online with Fonterra and access information and tools on milk production and quality, online statements and up-to-the-minute news and weather. This site is also used to provide information on the business to farmer shareholders.
Annual MeetingThe Board views the Annual Meeting of farmer shareholders, which is held at a different venue around New Zealand each year, as an opportunity to communicate directly with farmer shareholders and ensures that adequate time is provided at these meetings for farmer shareholders to raise issues or ask questions from the floor.
Notices of meetings will be sent to farmer shareholders at least 10 working days before the meeting.
The Constitution describes the process whereby a farmer shareholder can raise a proposal for discussion or resolution at the next meeting of farmer shareholders at which the farmer shareholder is entitled to vote.
Annual ReportThe group’s Annual Report including financial statements and an annual review, together with the half-year reports and other material announcements, are designed to present a balanced and clear view of Fonterra’s activities and prospects and are available on fonterra.com.
Other disclosuresInformation on the group’s performance, annual and half-year financial results, Director changes, and other significant matters, is advised to the market through the NZX and ASX in accordance with the Disclosure Policy. Farmer shareholders and other stakeholders receive regular updates on these and other issues relevant to them.
Principle 9: Stakeholder InterestsThe Board has policies in place for the governance and management of Fonterra’s relationships with key stakeholders. The Co-operative Relations Committee (CRC) of the Board specifically provides governance oversight of the management of Fonterra’s relationships with key external stakeholders in New Zealand and all other key markets, including, but not limited to, its government, non-government (NGO) and community relationships. This includes oversight of Fonterra’s community initiatives in support of its social responsibility and identity objectives. Examples of this activity are detailed in the social responsibility reporting section of this report. Of particular significance are the approaches to relationships with the Shareholder’s Council, farmer shareholders and farmer suppliers. These approaches are detailed at Principle 8.
CORPORATE GOVERNANCE BEST PRACTICE CODEThe Board has also reviewed compliance with Appendix 5 to the FSM Rules Corporate Governance Best Practice Code. While the Board believes it complies with the Code, there is a point of divergence from specific principles.
Audit Committee membership (Principle 3.1). The majority of members are not independent, due to the proportion of Farmer Directors on the Board.
FSM waiversThere have been no FSM waivers granted.
CORPORATE GOVERNANCE | 63
FONTERRA ANNUAL REVIEW 2015

BOARD OF DIRECTORS
1. JOHN WILSON2. MALCOLM BAILEY3. IAN FARRELLY4. LEONIE GUINEY 5. SIMON ISRAEL6. DAVID JACKSON7. DAVID MACLEOD8. JOHN MONAGHAN9. SIR RALPH NORRIS KNZM
10. BLUE READ
11. NICOLA SHADBOLT12. MICHAEL SPAANS
13. JOHN WALLER
1 6
2
3
5
11
12
9
10
8
7
13
4
1. JOHN WILSONBOARD RESPONSIBILITIES Chairman, and Chair of the People, Culture and Safety CommitteeTERM OF OFFICE Elected 2003, last re-elected 2012
John Wilson was elected to the Fonterra Board in 2003 and became Chairman in 2012. Previously he served as the inaugural Chairman of the Fonterra Shareholders’ Council. John is a Director of Turners & Growers Limited and he serves on the Executive Board of the New Zealand China Council. He is a chartered member of the Institute of Directors in New Zealand. John lives on his dairy farm near Te Awamutu and jointly owns a dairy farming business based near Geraldine, South Canterbury.
B.Agr.Sc
2. MALCOLM BAILEYBOARD RESPONSIBILITIES Farmer-elected Director, Chair of the Risk Committee and Member of the Co-operative Relations CommitteeTERM OF OFFICE Elected 2004, last re-elected 2013
Malcolm Bailey was elected to the Fonterra Board in 2004. Malcolm represents Fonterra on the Dairy Companies Association of New Zealand. He is a Director of Westpac New Zealand Limited, Hopkins Farming Group Limited and Gleneig Holdings Limited. He is also the Independent Chair of the Red Meat Profit Partnership. Malcolm’s dairy farming interests are as a shareholder in Hopkins Farming Group Limited.
B.Agr.Econ
3. IAN FARRELLYBOARD RESPONSIBILITIES Farmer-elected Director, Member of the Audit and Finance Committee, the People, Culture and Safety Committee and the Risk CommitteeTERM OF OFFICE Elected 2007, last re-elected 2013
Ian Farrelly was elected to the Fonterra Board in 2007. Ian had a 20-year career in the banking industry including 15 years as head of ASB’s Rural Division. Ian is also a Director of First Mortgage Managers Limited, Spectrum Dairies Limited, Fortuna Group Limited and is an Advisor to Waikato Stud. He owns and runs a 400-hectare 10,000 animal calf rearing farm in Te Awamutu, and has ownership interests in dairy farms in Canterbury and the Waikato.
B.Agr.
64 | CORPORATE GOVERNANCE
FONTERRA ANNUAL REVIEW 2015
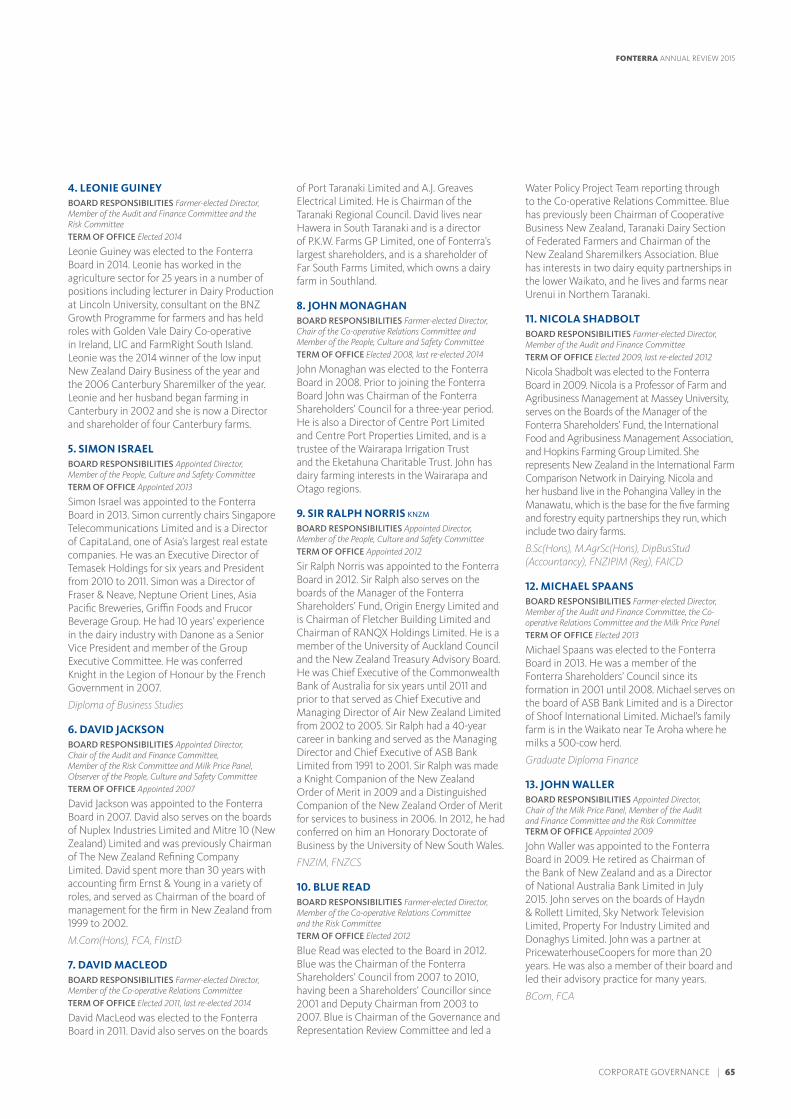
4. LEONIE GUINEY BOARD RESPONSIBILITIES Farmer-elected Director, Member of the Audit and Finance Committee and the Risk CommitteeTERM OF OFFICE Elected 2014
Leonie Guiney was elected to the Fonterra Board in 2014. Leonie has worked in the agriculture sector for 25 years in a number of positions including lecturer in Dairy Production at Lincoln University, consultant on the BNZ Growth Programme for farmers and has held roles with Golden Vale Dairy Co-operative in Ireland, LIC and FarmRight South Island. Leonie was the 2014 winner of the low input New Zealand Dairy Business of the year and the 2006 Canterbury Sharemilker of the year. Leonie and her husband began farming in Canterbury in 2002 and she is now a Director and shareholder of four Canterbury farms.
5. SIMON ISRAELBOARD RESPONSIBILITIES Appointed Director, Member of the People, Culture and Safety CommitteeTERM OF OFFICE Appointed 2013
Simon Israel was appointed to the Fonterra Board in 2013. Simon currently chairs Singapore Telecommunications Limited and is a Director of CapitaLand, one of Asia’s largest real estate companies. He was an Executive Director of Temasek Holdings for six years and President from 2010 to 2011. Simon was a Director of Fraser & Neave, Neptune Orient Lines, Asia Pacific Breweries, Griffin Foods and Frucor Beverage Group. He had 10 years’ experience in the dairy industry with Danone as a Senior Vice President and member of the Group Executive Committee. He was conferred Knight in the Legion of Honour by the French Government in 2007.
Diploma of Business Studies
6. DAVID JACKSONBOARD RESPONSIBILITIES Appointed Director, Chair of the Audit and Finance Committee, Member of the Risk Committee and Milk Price Panel, Observer of the People, Culture and Safety CommitteeTERM OF OFFICE Appointed 2007
David Jackson was appointed to the Fonterra Board in 2007. David also serves on the boards of Nuplex Industries Limited and Mitre 10 (New Zealand) Limited and was previously Chairman of The New Zealand Refining Company Limited. David spent more than 30 years with accounting firm Ernst & Young in a variety of roles, and served as Chairman of the board of management for the firm in New Zealand from 1999 to 2002.
M.Com(Hons), FCA, FInstD
7. DAVID MACLEODBOARD RESPONSIBILITIES Farmer-elected Director, Member of the Co-operative Relations CommitteeTERM OF OFFICE Elected 2011, last re-elected 2014
David MacLeod was elected to the Fonterra Board in 2011. David also serves on the boards
of Port Taranaki Limited and A.J. Greaves Electrical Limited. He is Chairman of the Taranaki Regional Council. David lives near Hawera in South Taranaki and is a director of P.K.W. Farms GP Limited, one of Fonterra’s largest shareholders, and is a shareholder of Far South Farms Limited, which owns a dairy farm in Southland.
8. JOHN MONAGHANBOARD RESPONSIBILITIES Farmer-elected Director, Chair of the Co-operative Relations Committee and Member of the People, Culture and Safety CommitteeTERM OF OFFICE Elected 2008, last re-elected 2014
John Monaghan was elected to the Fonterra Board in 2008. Prior to joining the Fonterra Board John was Chairman of the Fonterra Shareholders’ Council for a three-year period. He is also a Director of Centre Port Limited and Centre Port Properties Limited, and is a trustee of the Wairarapa Irrigation Trust and the Eketahuna Charitable Trust. John has dairy farming interests in the Wairarapa and Otago regions.
9. SIR RALPH NORRIS KNZM
BOARD RESPONSIBILITIES Appointed Director, Member of the People, Culture and Safety CommitteeTERM OF OFFICE Appointed 2012
Sir Ralph Norris was appointed to the Fonterra Board in 2012. Sir Ralph also serves on the boards of the Manager of the Fonterra Shareholders’ Fund, Origin Energy Limited and is Chairman of Fletcher Building Limited and Chairman of RANQX Holdings Limited. He is a member of the University of Auckland Council and the New Zealand Treasury Advisory Board. He was Chief Executive of the Commonwealth Bank of Australia for six years until 2011 and prior to that served as Chief Executive and Managing Director of Air New Zealand Limited from 2002 to 2005. Sir Ralph had a 40-year career in banking and served as the Managing Director and Chief Executive of ASB Bank Limited from 1991 to 2001. Sir Ralph was made a Knight Companion of the New Zealand Order of Merit in 2009 and a Distinguished Companion of the New Zealand Order of Merit for services to business in 2006. In 2012, he had conferred on him an Honorary Doctorate of Business by the University of New South Wales.
FNZIM, FNZCS
10. BLUE READBOARD RESPONSIBILITIES Farmer-elected Director, Member of the Co-operative Relations Committee and the Risk CommitteeTERM OF OFFICE Elected 2012
Blue Read was elected to the Board in 2012. Blue was the Chairman of the Fonterra Shareholders’ Council from 2007 to 2010, having been a Shareholders’ Councillor since 2001 and Deputy Chairman from 2003 to 2007. Blue is Chairman of the Governance and Representation Review Committee and led a
Water Policy Project Team reporting through to the Co-operative Relations Committee. Blue has previously been Chairman of Cooperative Business New Zealand, Taranaki Dairy Section of Federated Farmers and Chairman of the New Zealand Sharemilkers Association. Blue has interests in two dairy equity partnerships in the lower Waikato, and he lives and farms near Urenui in Northern Taranaki.
11. NICOLA SHADBOLTBOARD RESPONSIBILITIES Farmer-elected Director, Member of the Audit and Finance CommitteeTERM OF OFFICE Elected 2009, last re-elected 2012
Nicola Shadbolt was elected to the Fonterra Board in 2009. Nicola is a Professor of Farm and Agribusiness Management at Massey University, serves on the Boards of the Manager of the Fonterra Shareholders’ Fund, the International Food and Agribusiness Management Association, and Hopkins Farming Group Limited. She represents New Zealand in the International Farm Comparison Network in Dairying. Nicola and her husband live in the Pohangina Valley in the Manawatu, which is the base for the five farming and forestry equity partnerships they run, which include two dairy farms.
B.Sc(Hons), M.AgrSc(Hons), DipBusStud (Accountancy), FNZIPIM (Reg), FAICD
12. MICHAEL SPAANSBOARD RESPONSIBILITIES Farmer-elected Director, Member of the Audit and Finance Committee, the Co-operative Relations Committee and the Milk Price PanelTERM OF OFFICE Elected 2013
Michael Spaans was elected to the Fonterra Board in 2013. He was a member of the Fonterra Shareholders’ Council since its formation in 2001 until 2008. Michael serves on the board of ASB Bank Limited and is a Director of Shoof International Limited. Michael’s family farm is in the Waikato near Te Aroha where he milks a 500-cow herd.
Graduate Diploma Finance
13. JOHN WALLER BOARD RESPONSIBILITIES Appointed Director, Chair of the Milk Price Panel, Member of the Audit and Finance Committee and the Risk Committee TERM OF OFFICE Appointed 2009
John Waller was appointed to the Fonterra Board in 2009. He retired as Chairman of the Bank of New Zealand and as a Director of National Australia Bank Limited in July 2015. John serves on the boards of Haydn & Rollett Limited, Sky Network Television Limited, Property For Industry Limited and Donaghys Limited. John was a partner at PricewaterhouseCoopers for more than 20 years. He was also a member of their board and led their advisory practice for many years.
BCom, FCA
CORPORATE GOVERNANCE | 65
FONTERRA ANNUAL REVIEW 2015

1. THEO SPIERINGS
2. LUKAS PARAVICINI
3. JACQUELINE CHOW
4. MAURY LEYLAND
5. JOHAN PRIEM
6. ROBERT SPURWAY
7. ALEX TURNBULL
8. KELVIN WICKHAM
2
1 5
6
4
3 7
8
FONTERRA MANAGEMENT TEAM
1. THEO SPIERINGSChief Executive
Theo Spierings sets Fonterra’s overall direction and leads the Fonterra Management Team. He is focused on building on Fonterra’s strengths and securing future growth for the Co-operative. Theo joined Fonterra in 2011, bringing with him extensive experience from across the dairy industry, particularly in Asia, Latin America, Africa, the Middle East and Europe. Theo has 30 years’ experience in the global dairy industry in a variety of roles including general management, operations and supply chain, and sales and marketing positions. He was previously the acting CEO of Royal Friesland Foods, a Dutch dairy co-operative and, in 2008, led the Dutch dairy co-operative through a merger with Campina. Before taking up his leadership role at Fonterra, Theo ran his own company in the Netherlands focusing on corporate strategy, and mergers and acquisitions, in Fast-Moving Consumer Goods (FMCG). Theo has a Bachelor of Arts in Food Technology/Biotechnology and a Master of Business Administration.
2. LUKAS PARAVICINIChief Financial Officer
Lukas Paravicini joined Fonterra as CFO in 2013 after 22 years with Nestlé. Most recently Lukas was General Manager for Nestlé Professional Europe. Before this role he held a number of senior finance positions including CFO of Nestlé Brazil, Nestlé’s fourth largest market, Vice President of Global Business Services and CFO of Nestlé Professional, and Nestlé’s globally managed Out-of-Home business. He has an in-depth understanding of dairy and has lived and worked in some of Fonterra’s most strategically important markets. Lukas holds a Business and Administration degree from the University of Zurich, Switzerland, and speaks five languages.
66 | CORPORATE GOVERNANCE
FONTERRA ANNUAL REVIEW 2015
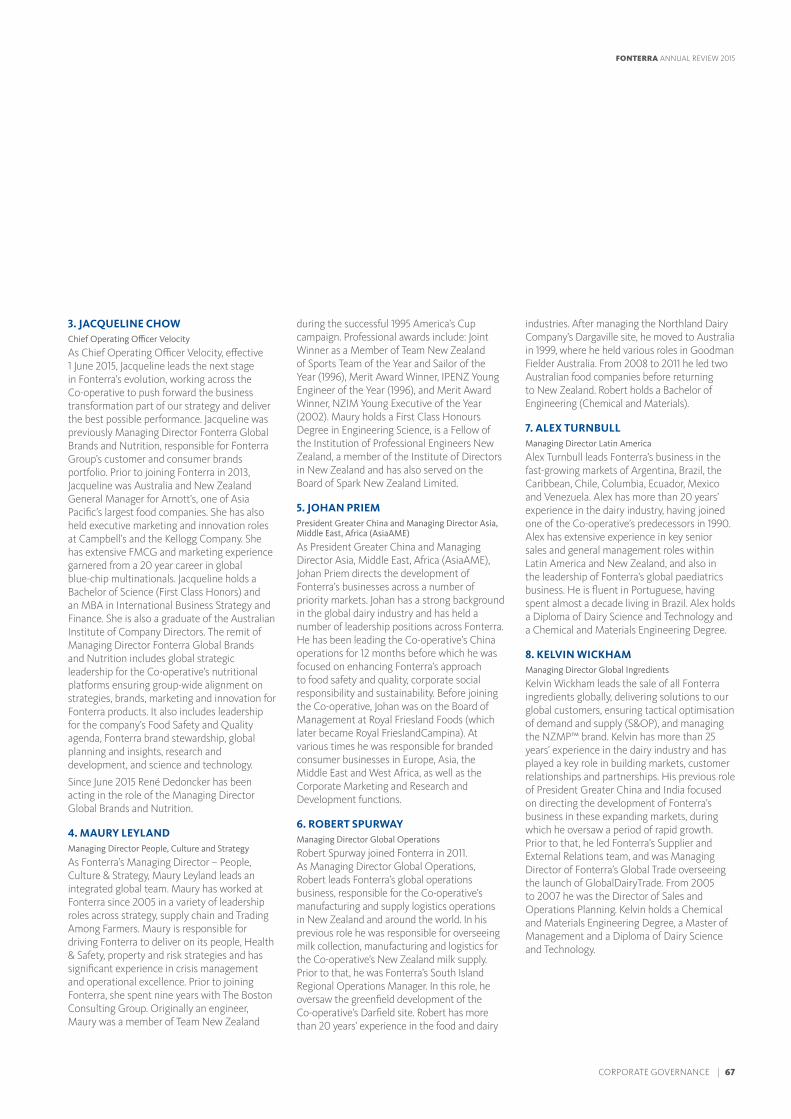
3. JACQUELINE CHOWChief Operating Officer Velocity
As Chief Operating Officer Velocity, effective 1 June 2015, Jacqueline leads the next stage in Fonterra’s evolution, working across the Co-operative to push forward the business transformation part of our strategy and deliver the best possible performance. Jacqueline was previously Managing Director Fonterra Global Brands and Nutrition, responsible for Fonterra Group’s customer and consumer brands portfolio. Prior to joining Fonterra in 2013, Jacqueline was Australia and New Zealand General Manager for Arnott’s, one of Asia Pacific’s largest food companies. She has also held executive marketing and innovation roles at Campbell’s and the Kellogg Company. She has extensive FMCG and marketing experience garnered from a 20 year career in global blue-chip multinationals. Jacqueline holds a Bachelor of Science (First Class Honors) and an MBA in International Business Strategy and Finance. She is also a graduate of the Australian Institute of Company Directors. The remit of Managing Director Fonterra Global Brands and Nutrition includes global strategic leadership for the Co-operative’s nutritional platforms ensuring group-wide alignment on strategies, brands, marketing and innovation for Fonterra products. It also includes leadership for the company’s Food Safety and Quality agenda, Fonterra brand stewardship, global planning and insights, research and development, and science and technology.
Since June 2015 René Dedoncker has been acting in the role of the Managing Director Global Brands and Nutrition.
4. MAURY LEYLANDManaging Director People, Culture and Strategy
As Fonterra’s Managing Director – People, Culture & Strategy, Maury Leyland leads an integrated global team. Maury has worked at Fonterra since 2005 in a variety of leadership roles across strategy, supply chain and Trading Among Farmers. Maury is responsible for driving Fonterra to deliver on its people, Health & Safety, property and risk strategies and has significant experience in crisis management and operational excellence. Prior to joining Fonterra, she spent nine years with The Boston Consulting Group. Originally an engineer, Maury was a member of Team New Zealand
during the successful 1995 America’s Cup campaign. Professional awards include: Joint Winner as a Member of Team New Zealand of Sports Team of the Year and Sailor of the Year (1996), Merit Award Winner, IPENZ Young Engineer of the Year (1996), and Merit Award Winner, NZIM Young Executive of the Year (2002). Maury holds a First Class Honours Degree in Engineering Science, is a Fellow of the Institution of Professional Engineers New Zealand, a member of the Institute of Directors in New Zealand and has also served on the Board of Spark New Zealand Limited.
5. JOHAN PRIEMPresident Greater China and Managing Director Asia, Middle East, Africa (AsiaAME)
As President Greater China and Managing Director Asia, Middle East, Africa (AsiaAME), Johan Priem directs the development of Fonterra’s businesses across a number of priority markets. Johan has a strong background in the global dairy industry and has held a number of leadership positions across Fonterra. He has been leading the Co-operative’s China operations for 12 months before which he was focused on enhancing Fonterra’s approach to food safety and quality, corporate social responsibility and sustainability. Before joining the Co-operative, Johan was on the Board of Management at Royal Friesland Foods (which later became Royal FrieslandCampina). At various times he was responsible for branded consumer businesses in Europe, Asia, the Middle East and West Africa, as well as the Corporate Marketing and Research and Development functions.
6. ROBERT SPURWAYManaging Director Global Operations
Robert Spurway joined Fonterra in 2011. As Managing Director Global Operations, Robert leads Fonterra’s global operations business, responsible for the Co-operative’s manufacturing and supply logistics operations in New Zealand and around the world. In his previous role he was responsible for overseeing milk collection, manufacturing and logistics for the Co-operative’s New Zealand milk supply. Prior to that, he was Fonterra’s South Island Regional Operations Manager. In this role, he oversaw the greenfield development of the Co-operative’s Darfield site. Robert has more than 20 years’ experience in the food and dairy
industries. After managing the Northland Dairy Company’s Dargaville site, he moved to Australia in 1999, where he held various roles in Goodman Fielder Australia. From 2008 to 2011 he led two Australian food companies before returning to New Zealand. Robert holds a Bachelor of Engineering (Chemical and Materials).
7. ALEX TURNBULLManaging Director Latin America
Alex Turnbull leads Fonterra’s business in the fast-growing markets of Argentina, Brazil, the Caribbean, Chile, Columbia, Ecuador, Mexico and Venezuela. Alex has more than 20 years’ experience in the dairy industry, having joined one of the Co-operative’s predecessors in 1990. Alex has extensive experience in key senior sales and general management roles within Latin America and New Zealand, and also in the leadership of Fonterra’s global paediatrics business. He is fluent in Portuguese, having spent almost a decade living in Brazil. Alex holds a Diploma of Dairy Science and Technology and a Chemical and Materials Engineering Degree.
8. KELVIN WICKHAMManaging Director Global Ingredients
Kelvin Wickham leads the sale of all Fonterra ingredients globally, delivering solutions to our global customers, ensuring tactical optimisation of demand and supply (S&OP), and managing the NZMP™ brand. Kelvin has more than 25 years’ experience in the dairy industry and has played a key role in building markets, customer relationships and partnerships. His previous role of President Greater China and India focused on directing the development of Fonterra’s business in these expanding markets, during which he oversaw a period of rapid growth. Prior to that, he led Fonterra’s Supplier and External Relations team, and was Managing Director of Fonterra’s Global Trade overseeing the launch of GlobalDairyTrade. From 2005 to 2007 he was the Director of Sales and Operations Planning. Kelvin holds a Chemical and Materials Engineering Degree, a Master of Management and a Diploma of Dairy Science and Technology.
CORPORATE GOVERNANCE | 67
FONTERRA ANNUAL REVIEW 2015
SUMMARY FINANCIAL STATEMENTSFor the year ended 31 July 2015
CONTENTS
DIRECTORS’ STATEMENT 69
INCOME STATEMENT 70
STATEMENT OF COMPREHENSIVE INCOME 71
STATEMENT OF FINANCIAL POSITION 72
STATEMENT OF CHANGES IN EQUITY 73
CASH FLOW STATEMENT 74
NOTES TO THE SUMMARY FINANCIAL STATEMENTS 75
INDEPENDENT AUDITORS’ REPORT 88
68 | SUMMARY FINANCIAL STATEMENTS
FONTERRA ANNUAL REVIEW 2015

DIRECTORS’ STATEMENT FOR THE YEAR ENDED 31 JULY 2015
The Directors hereby approve and authorise for issue the summary financial statements for the year ended 31 July 2015 presented on pages 70 to 87. For and on behalf of the Board:
JOHN WILSON DAVID JACKSONCHAIRMAN DIRECTOR
23 September 2015 23 September 2015
Fonterra Co-operative Group Limited (Fonterra or the Co-operative) is a co-operative company incorporated and domiciled in New Zealand. Fonterra is registered under the Companies Act 1993 and the Co-operative Companies Act 1996, and is an FMC Reporting Entity under the Financial Markets Conduct Act 2013. Fonterra is also required to comply with the Dairy Industry Restructuring Act 2001.
These summary financial statements are those of Fonterra and its subsidiaries (together referred to as the Group) and include the Group’s interest in its equity accounted investees. They have been prepared in accordance with Financial Reporting Standard No. 43: Summary Financial Statements and have been extracted from the Group’s full financial statements. The Group’s full financial statements comply with International Financial Reporting Standards. They also comply with New Zealand Equivalents to International Financial Reporting Standards and have been prepared in accordance with New Zealand Generally Accepted Accounting Practice.
The Board has elected to present summary financial statements for the year ended 31 July 2015 as part of the Annual Review sent to Shareholders. These summary financial statements include notes setting out key information.
These summary financial statements are presented for the year ended 31 July 2015. The comparative information is for the year ended 31 July 2014. These summary financial statements of the Group have been prepared using the same accounting policies and measurement basis as the Group’s full financial statements for the year ended 31 July 2015.
The full financial statements for the year ended 31 July 2015, approved and authorised for issue by the Board on 23 September 2015, have been audited by PricewaterhouseCoopers and given an unqualified opinion.
The Group is primarily involved in the collection, manufacture and sale of milk and milk derived products and is a profit-oriented entity. These summary financial statements are presented in New Zealand Dollars ($ or NZD), which is Fonterra’s functional and presentation currency, and rounded to the nearest million, except where otherwise stated.
The summary financial statements cannot be expected to provide as complete an understanding of the financial affairs of the Group as the full financial statements, which are available from Fonterra’s registered office at 9 Princes Street, Auckland, New Zealand or on Fonterra’s website, www2.fonterra.com.
SUMMARY FINANCIAL STATEMENTS | 69
FONTERRA ANNUAL REVIEW 2015

The accompanying notes form part of these summary financial statements.
INCOME STATEMENTFOR THE YEAR ENDED 31 JULY 2015
GROUP $ MILLION
NOTES 31 JULY 2015 31 JULY 2014
Revenue from sale of goods 18,845 22,275
Cost of goods sold 2 (15,567) (19,813)
Gross profit 3,278 2,462
Other operating income 288 139
Selling and marketing expenses (693) (593)
Distribution expenses (700) (499)
Administrative expenses (874) (762)
Other operating expenses (493) (356)
Net foreign exchange gains 70 39
Share of profit of equity accounted investees 66 73
Profit before net finance costs and tax 942 503
Finance income 39 13
Finance costs (557) (379)
Net finance costs (518) (366)
Profit before tax 424 137
Tax credit 11 82 42
Profit after tax 506 179
Profit after tax is attributable to:
Equity holders of the Co-operative 466 157
Non-controlling interests 40 22
Profit after tax 506 179
GROUP $
31 JULY 2015 31 JULY 2014
Earnings per share:
Basic and diluted earnings per share 0.29 0.10
70 | SUMMARY FINANCIAL STATEMENTS
FONTERRA ANNUAL REVIEW 2015

STATEMENT OF COMPREHENSIVE INCOMEFOR THE YEAR ENDED 31 JULY 2015
The accompanying notes form part of these summary financial statements.
GROUP $ MILLION
31 JULY 2015 31 JULY 2014
Profit after tax 506 179
Items that may be reclassified subsequently to profit or loss:
Cash flow hedges:
– Net fair value (losses)/gains (1,361) 732
– Transferred and reported in revenue from sale of goods 501 (505)
– Tax credit/(expense) on cash flow hedges 241 (63)
Net investment hedges:
– Net fair value (losses)/gains on hedging instruments (164) 25
– Tax credit/(expense) on net investment hedges 46 (7)
Available-for-sale investments:
– Net fair value (losses) on available-for-sale investments (2) (1)
Foreign currency translation gains/(losses) attributable to equity holders 385 (207)
Foreign currency translation reserve transferred to income statement 78 –
Hyperinflation movements attributable to equity holders 20 –
Share of equity accounted investees’ movements in reserves 4 (11)
Total items that may be reclassified subsequently to profit or loss (252) (37)
Items that will not be reclassified subsequently to profit or loss:
Foreign currency translation (losses) attributable to non-controlling interests (6) (4)
Hyperinflation movements attributable to non-controlling interests 13 –
Total items that will not be reclassified subsequently to profit or loss 7 (4)
Total other comprehensive (expense) recognised directly in equity (245) (41)
Total comprehensive income 261 138
Total comprehensive income is attributable to:
Equity holders of the Co-operative 214 120
Non-controlling interests 47 18
Total comprehensive income 261 138
SUMMARY FINANCIAL STATEMENTS | 71
FONTERRA ANNUAL REVIEW 2015
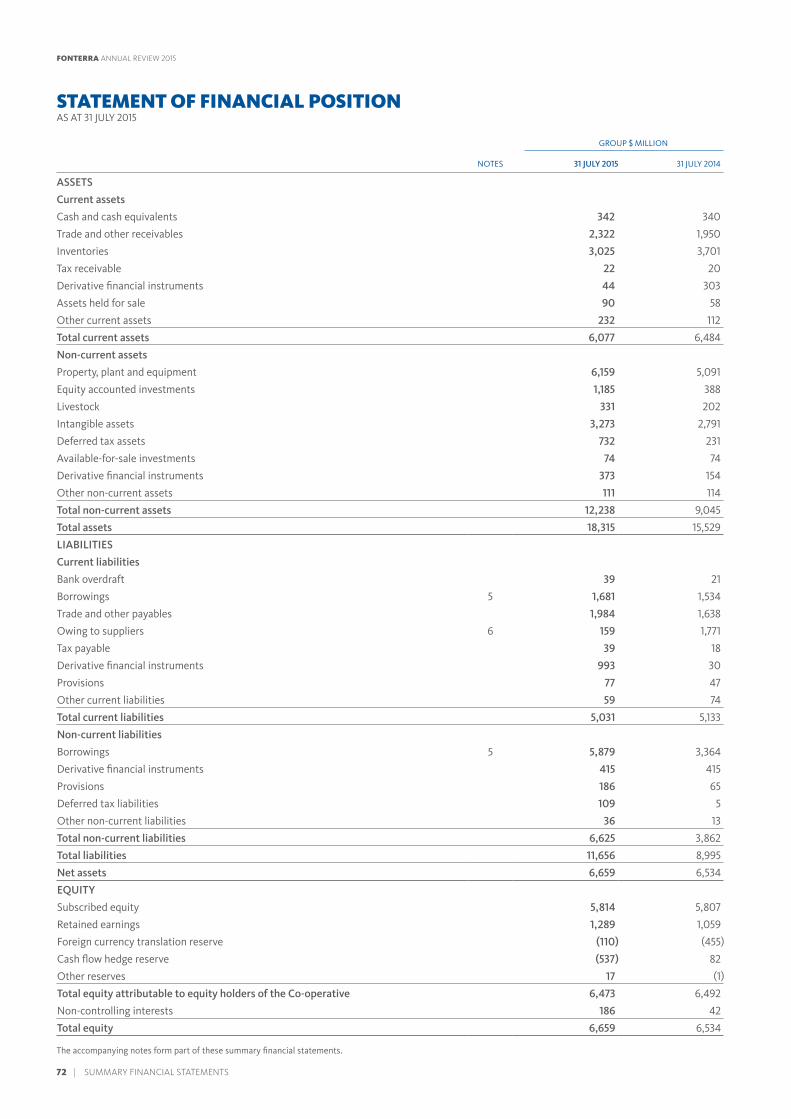
STATEMENT OF FINANCIAL POSITIONAS AT 31 JULY 2015
GROUP $ MILLION
NOTES 31 JULY 2015 31 JULY 2014
ASSETS
Current assets
Cash and cash equivalents 342 340
Trade and other receivables 2,322 1,950
Inventories 3,025 3,701
Tax receivable 22 20
Derivative financial instruments 44 303
Assets held for sale 90 58
Other current assets 232 112
Total current assets 6,077 6,484
Non-current assets
Property, plant and equipment 6,159 5,091
Equity accounted investments 1,185 388
Livestock 331 202
Intangible assets 3,273 2,791
Deferred tax assets 732 231
Available-for-sale investments 74 74
Derivative financial instruments 373 154
Other non-current assets 111 114
Total non-current assets 12,238 9,045
Total assets 18,315 15,529
LIABILITIES
Current liabilities
Bank overdraft 39 21
Borrowings 5 1,681 1,534
Trade and other payables 1,984 1,638
Owing to suppliers 6 159 1,771
Tax payable 39 18
Derivative financial instruments 993 30
Provisions 77 47
Other current liabilities 59 74
Total current liabilities 5,031 5,133
Non-current liabilities
Borrowings 5 5,879 3,364
Derivative financial instruments 415 415
Provisions 186 65
Deferred tax liabilities 109 5
Other non-current liabilities 36 13
Total non-current liabilities 6,625 3,862
Total liabilities 11,656 8,995
Net assets 6,659 6,534
EQUITY
Subscribed equity 5,814 5,807
Retained earnings 1,289 1,059
Foreign currency translation reserve (110) (455)
Cash flow hedge reserve (537) 82
Other reserves 17 (1)
Total equity attributable to equity holders of the Co-operative 6,473 6,492
Non-controlling interests 186 42
Total equity 6,659 6,534
The accompanying notes form part of these summary financial statements.
72 | SUMMARY FINANCIAL STATEMENTS
FONTERRA ANNUAL REVIEW 2015

STATEMENT OF CHANGES IN EQUITYFOR THE YEAR ENDED 31 JULY 2015
ATTRIBUTABLE TO EQUITY HOLDERS OF THE CO-OPERATIVE
GROUP $ MILLIONSUBSCRIBED
EQUITYRETAINED
EARNINGS
FOREIGN CURRENCY
TRANSLATION RESERVE
CASH FLOW HEDGE
RESERVEOTHER
RESERVES TOTAL
NON-CONTROLLING
INTERESTSTOTAL
EQUITY
As at 1 August 2014 5,807 1,059 (455) 82 (1) 6,492 42 6,534
Profit after tax – 466 – – – 466 40 506
Other comprehensive income/(expense) – 4 345 (619) 18 (252) 7 (245)
Total comprehensive income/(expense) – 470 345 (619) 18 214 47 261
Transactions with equity holders in their capacity as equity holders:
Dividend paid to equity holders of the Co-operative – (240) – – – (240) – (240)
Acquisition of subsidiaries – – – – – – 120 120
Equity instruments issued 7 – – – – 7 – 7
Dividend paid to non-controlling interests – – – – – – (23) (23)
As at 31 July 2015 5,814 1,289 (110) (537) 17 6,473 186 6,659
As at 1 August 2013 5,807 1,249 (266) (82) – 6,708 40 6,748
Profit after tax – 157 – – – 157 22 179
Other comprehensive (expense)/income – (11) (189) 164 (1) (37) (4) (41)
Total comprehensive income/(expense) – 146 (189) 164 (1) 120 18 138
Transactions with equity holders in their capacity as equity holders:
Dividend paid to equity holders of the Co-operative – (336) – – – (336) – (336)
Dividend paid to non-controlling interests – – – – – – (16) (16)
As at 31 July 2014 5,807 1,059 (455) 82 (1) 6,492 42 6,534
The accompanying notes form part of these summary financial statements.
SUMMARY FINANCIAL STATEMENTS | 73
FONTERRA ANNUAL REVIEW 2015

The accompanying notes form part of these summary financial statements.
CASH FLOW STATEMENTFOR THE YEAR ENDED 31 JULY 2015
GROUP $ MILLION
31 JULY 2015 31 JULY 2014
Cash flows from operating activities
Profit before net finance costs and tax 942 503
Adjustments for:
Foreign exchange (gains)/losses (70) 11
Depreciation and amortisation 561 538
Movement in provisions (157) 132
Other (63) (41)
271 640
Decrease/(increase) in working capital:
Inventories 809 (757)
Trade and other receivables 182 (111)
Amounts owing to suppliers (1,612) 1,060
Payables and accruals 104 111
Other movements 27 (28)
Total (490) 275
Cash generated from operations 723 1,418
Net taxes paid (55) (51)
Net cash flows from operating activities 668 1,367
Cash flows from investing activities
Cash was provided from:
– Proceeds from sale of business operations 62 46
– Proceeds from disposal of property, plant and equipment 20 12
– Proceeds from sale of livestock 30 13
– Other cash inflows 36 8
Cash was applied to:
– Acquisition of business operations (771) (18)
– Acquisition of available-for-sale investments – (78)
– Acquisition of property, plant and equipment (1,189) (791)
– Acquisition of livestock (121) (88)
– Acquisition of intangible assets (104) (102)
– Other cash outflows (3) (11)
Net cash flows from investing activities (2,040) (1,009)
Cash flows from financing activities
Cash was provided from:
– Proceeds from borrowings 7,470 4,241
– Interest received 8 13
– Other cash inflows – 8
Cash was applied to:
– Interest paid (427) (332)
– Repayment of borrowings (5,443) (3,894)
– Settlement of borrowing derivatives – (24)
– Dividends paid to non-controlling interests (23) (16)
– Dividends paid to equity holders of the Co-operative (233) (336)
Net cash flows from financing activities 1,352 (340)
Net (decrease)/increase in cash and cash equivalents (20) 18
Cash and cash equivalents at the beginning of the year 319 329
Effect of exchange rate changes on cash balances 4 (28)
Cash and cash equivalents at the end of the year 303 319
Reconciliation of closing cash balances to the statement of financial position:
Cash and cash equivalents 342 340
Bank overdraft (39) (21)
Closing cash balances 303 319
74 | SUMMARY FINANCIAL STATEMENTS
FONTERRA ANNUAL REVIEW 2015

SUMMARY FINANCIAL STATEMENTS PRESENTATION
Fonterra is pleased to present a new structure for our summary financial statements. The new structure has been designed to improve the clarity and usefulness of this report. The report has been structured under the following categories:
• Performance
• Debt and equity
• Working capital
• Investments
• Financial risk management
• Other
PERFORMANCE
1 SEGMENT REPORTING
a) Operating segmentsThe Group has five reportable segments that reflect the Group’s management and reporting structure as viewed by the Fonterra Management Team.
During the year ended 31 July 2014, transactions between segments were based on estimated market prices adjusted for the difference between the Farmgate Milk Price calculated in accordance with the Farmgate Milk Price Manual and that determined by the Board. During the year ended 31 July 2015, transactions between segments were based on estimated market prices.
REPORTABLE SEGMENT DESCRIPTION
Global Ingredients and Operations (formerly New Zealand Milk Products (NZMP))
Represents the collection, processing and distribution of New Zealand milk, global sales and marketing of New Zealand and non-New Zealand milk products (including North Asia), Global Brands and Nutrition, Co-operative Affairs and Group Services.
Oceania Represents Fast Moving Consumer Goods (FMCG) businesses in New Zealand (including export to the Pacific Islands) and all FMCG and ingredients businesses in Australia (including Milk Supply and Manufacturing). It includes foodservice sales in Australia and New Zealand, and Fonterra Farm Source stores.
Asia Represents FMCG and foodservice businesses in Asia (excluding North Asia and Greater China), Africa and the Middle East.
Greater China Represents FMCG, foodservice and farming businesses in Greater China.
Latin America Represents FMCG and ingredients businesses in South America and the Caribbean.
From 1 August 2014, Greater China has been reported separately from Asia. In addition, Fonterra’s organisational structure was realigned and as a result the Taiwanese ingredients business has moved out of Greater China into Global Ingredients and Operations. Comparatives have been restated to reflect these changes.
NOTES TO THE SUMMARY FINANCIAL STATEMENTS FOR THE YEAR ENDED 31 JULY 2015
SUMMARY FINANCIAL STATEMENTS | 75
FONTERRA ANNUAL REVIEW 2015
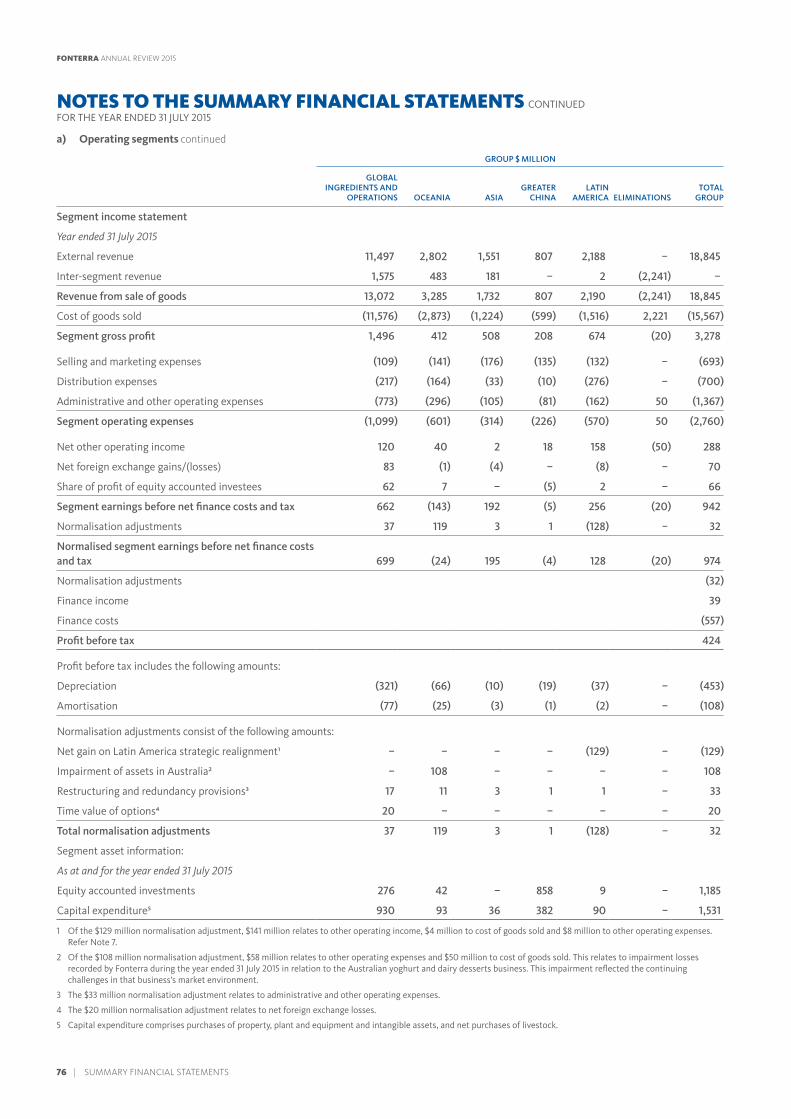
a) Operating segments continued
GROUP $ MILLION
GLOBAL INGREDIENTS AND
OPERATIONS OCEANIA ASIAGREATER
CHINALATIN
AMERICA ELIMINATIONSTOTAL
GROUP
Segment income statement
Year ended 31 July 2015
External revenue 11,497 2,802 1,551 807 2,188 – 18,845
Inter-segment revenue 1,575 483 181 – 2 (2,241) –
Revenue from sale of goods 13,072 3,285 1,732 807 2,190 (2,241) 18,845
Cost of goods sold (11,576) (2,873) (1,224) (599) (1,516) 2,221 (15,567)
Segment gross profit 1,496 412 508 208 674 (20) 3,278
Selling and marketing expenses (109) (141) (176) (135) (132) – (693)
Distribution expenses (217) (164) (33) (10) (276) – (700)
Administrative and other operating expenses (773) (296) (105) (81) (162) 50 (1,367)
Segment operating expenses (1,099) (601) (314) (226) (570) 50 (2,760)
Net other operating income 120 40 2 18 158 (50) 288
Net foreign exchange gains/(losses) 83 (1) (4) – (8) – 70
Share of profit of equity accounted investees 62 7 – (5) 2 – 66
Segment earnings before net finance costs and tax 662 (143) 192 (5) 256 (20) 942
Normalisation adjustments 37 119 3 1 (128) – 32
Normalised segment earnings before net finance costs and tax 699 (24) 195 (4) 128 (20) 974
Normalisation adjustments (32)
Finance income 39
Finance costs (557)
Profit before tax 424
Profit before tax includes the following amounts:
Depreciation (321) (66) (10) (19) (37) – (453)
Amortisation (77) (25) (3) (1) (2) – (108)
Normalisation adjustments consist of the following amounts:
Net gain on Latin America strategic realignment¹ – – – – (129) – (129)
Impairment of assets in Australia² – 108 – – – – 108
Restructuring and redundancy provisions³ 17 11 3 1 1 – 33
Time value of options⁴ 20 – – – – – 20
Total normalisation adjustments 37 119 3 1 (128) – 32
Segment asset information:
As at and for the year ended 31 July 2015
Equity accounted investments 276 42 – 858 9 – 1,185
Capital expenditure⁵ 930 93 36 382 90 – 1,531
1 Of the $129 million normalisation adjustment, $141 million relates to other operating income, $4 million to cost of goods sold and $8 million to other operating expenses. Refer Note 7.
2 Of the $108 million normalisation adjustment, $58 million relates to other operating expenses and $50 million to cost of goods sold. This relates to impairment losses recorded by Fonterra during the year ended 31 July 2015 in relation to the Australian yoghurt and dairy desserts business. This impairment reflected the continuing challenges in that business’s market environment.
3 The $33 million normalisation adjustment relates to administrative and other operating expenses.
4 The $20 million normalisation adjustment relates to net foreign exchange losses.
5 Capital expenditure comprises purchases of property, plant and equipment and intangible assets, and net purchases of livestock.
NOTES TO THE SUMMARY FINANCIAL STATEMENTS CONTINUEDFOR THE YEAR ENDED 31 JULY 2015
76 | SUMMARY FINANCIAL STATEMENTS
FONTERRA ANNUAL REVIEW 2015

a) Operating segments continued
GROUP $ MILLION
GLOBAL INGREDIENTS AND
OPERATIONS OCEANIA ASIAGREATER
CHINALATIN
AMERICA ELIMINATIONSTOTAL
GROUP
Segment income statement
Year ended 31 July 2014
External revenue 16,160 2,979 1,415 618 1,103 – 22,275
Inter-segment revenue 1,915 621 195 – 58 (2,789) –
Revenue from sale of goods 18,075 3,600 1,610 618 1,161 (2,789) 22,275
Cost of goods sold (17,032) (3,017) (1,224) (436) (894) 2,790 (19,813)
Segment gross profit 1,043 583 386 182 267 1 2,462
Selling and marketing expenses (106) (137) (187) (111) (52) – (593)
Distribution expenses (184) (182) (31) (7) (95) – (499)
Administrative and other operating expenses (673) (255) (110) (56) (51) 27 (1,118)
Segment operating expenses (963) (574) (328) (174) (198) 27 (2,210)
Net other operating income 96 18 4 22 26 (27) 139
Net foreign exchange gains/(losses) 50 (1) (12) – 2 – 39
Share of profit of equity accounted investees 54 5 – – 14 – 73
Segment earnings before net finance costs and tax 280 31 50 30 111 1 503
Finance income 13
Finance costs (379)
Profit before tax 137
Profit before tax includes the following amounts:
Depreciation (323) (72) (8) (8) (26) – (437)
Amortisation (75) (22) (3) – (1) – (101)
Segment asset information:
As at and for the year ended 31 July 2014
Equity accounted investments 218 36 – – 134 – 388
Capital expenditure¹ 602 93 32 198 44 – 969
1 Capital expenditure comprises purchases of property, plant and equipment and intangible assets, and net purchases of livestock.
There were no normalisation adjustments for the year ended 31 July 2014.
SUMMARY FINANCIAL STATEMENTS | 77
FONTERRA ANNUAL REVIEW 2015

b) Strategic platformsThe Group also presents financial information that reflects Fonterra’s strategic platforms. These strategic platforms are organised on a different basis than the Group’s operating segments presented in section a) of this note. The basis of presentation is explained in the table below.
Fonterra considers this information is useful as it provides more clarity on the financial performance of the ingredients, consumer and foodservice, and international farming businesses.
PLATFORM DESCRIPTION
Ingredients Represents the Global Ingredients and Operations reportable segment, the ingredients businesses in Australia and South America, and Fonterra Farm Source stores, and excludes the foodservice businesses in Asia and Greater China and unallocated costs.
Consumer and foodservice
– Oceania
Represents the Oceania reportable segment, excluding the ingredients business in Australia and Fonterra Farm Source stores.
– Asia Represents the Asia reportable segment and the Asia foodservice business reported in Global Ingredients and Operations.
– Greater China Represents the Greater China reportable segment, excluding International Farming and including the foodservice business in Greater China reported in Global Ingredients and Operations.
– Latin America Represents the Latin America reportable segment excluding the ingredients businesses in South America.
International Farming Represents China farming operations.
GROUP
31 JULY 2015
INGREDIENTS CONSUMER AND FOODSERVICEINTERNATIONAL
FARMING
UNALLOCATED COSTS AND
ELIMINATIONS TOTAL
OCEANIA ASIAGREATER
CHINALATIN
AMERICA TOTAL
Volume1 (liquid milk equivalents, billion) 21.5 1.7 1.6 0.6 0.6 4.5 0.2 (3.4) 22.8
Volume1 (metric tonnes, thousand) 2,982 619 284 122 660 1,685 164 (528) 4,303
Sales revenue1 ($ million) 14,341 2,021 1,918 729 2,033 6,701 141 (2,338) 18,845
Normalised EBIT ($ million) 973 51 202 45 110 408 (44) (363) 974
Capital employed2 ($ million) 8,592 465 145 45 403 1,058 594 (757) 9,487
Return on capital3 (%) 9.3% 5.0% 96.2% 71.5% 18.6% 25.5% (7.3)% 8.9%
For the year ended 31 July 2015 the Group’s return on capital including intangible assets, goodwill and equity accounted investments, was 6.9 per cent.
GROUP
31 JULY 2014
INGREDIENTS CONSUMER AND FOODSERVICEINTERNATIONAL
FARMING
UNALLOCATED COSTS AND
ELIMINATIONS TOTAL
OCEANIA ASIAGREATER
CHINALATIN
AMERICA TOTAL
Volume1 (liquid milk equivalents, billion) 21.7 1.8 1.2 0.4 0.5 3.9 0.1 (3.5) 22.2
Volume1 (metric tonnes, thousand) 3,052 631 274 92 328 1,325 100 (512) 3,965
Sales revenue1 ($ million) 19,553 2,102 1,811 560 848 5,321 103 (2,702) 22,275
Normalised EBIT ($ million) 679 (24) 51 8 94 129 21 (326) 503
Capital employed2 ($ million) 9,403 294 154 (23) 220 645 288 (1,843) 8,493
Return on capital3 (%) 5.6% (15.0)% 17.0% N/A 24.6% 5.9% 7.1% 4.7%
For the year ended 31 July 2014 the Group’s return on capital including intangible assets, goodwill and equity accounted investments, was 4.1 per cent.
1 Includes sales to other strategic platforms. Total column represents total external sales.
2 Capital employed excludes brands, goodwill and equity accounted investments.
3 Return on capital is calculated as normalised EBIT, less equity accounted investees’ earnings, less a notional royalty charge for use of the Group’s brands, less a notional tax charge, divided by capital employed.
NOTES TO THE SUMMARY FINANCIAL STATEMENTS CONTINUEDFOR THE YEAR ENDED 31 JULY 2015
78 | SUMMARY FINANCIAL STATEMENTS
FONTERRA ANNUAL REVIEW 2015

c) Geographical revenue
GROUP $ MILLION
CHINAREST OF
ASIA AUSTRALIANEW
ZEALAND USA EUROPELATIN
AMERICAREST OF WORLD TOTAL
Geographical segment external revenue:
Year ended 31 July 2015 2,111 5,222 1,560 1,882 1,198 725 3,113 3,034 18,845
Year ended 31 July 2014 5,537 5,787 1,666 2,162 1,014 946 1,802 3,361 22,275
Revenue is allocated to geographical segments on the basis of the destination of the goods sold.
d) Non-current assets
GROUP $ MILLION
GLOBAL INGREDIENTS AND OPERATIONS OCEANIA ASIA
GREATER CHINA
LATIN AMERICA
TOTAL GROUP
NEW ZEALAND
REST OF WORLD
NEW ZEALAND AUSTRALIA
Geographical segment reportable non-current assets:
As at 31 July 2015 4,783 464 1,394 814 822 1,751 1,105 11,133
As at 31 July 2014 4,300 391 1,387 1,022 705 410 445 8,660
GROUP $ MILLION
AS AT31 JULY 2015
AS AT31 JULY 2014
Reconciliation of geographical segment non-current assets to total non-current assets:
Geographical segment non-current assets 11,133 8,660
Deferred tax assets 732 231
Derivative financial instruments 373 154
Total non-current assets 12,238 9,045
2 COST OF GOODS SOLD
GROUP $ MILLION
31 JULY 2015 31 JULY 2014
Opening inventory 3,701 3,078
Cost of Milk:
– New Zealand sourced 7,121 13,226
– Non-New Zealand sourced 1,151 1,192
Other purchases 6,619 6,018
Closing inventory (3,025) (3,701)
Total cost of goods sold 15,567 19,813
SUMMARY FINANCIAL STATEMENTS | 79
FONTERRA ANNUAL REVIEW 2015

DEBT AND EQUITY
3 SUBSCRIBED EQUITY INSTRUMENTS
Co-operative shares, including shares held within the GroupCo-operative shares may only be held by a shareholder supplying milk to the Company (farmer shareholder), by former farmer shareholders for up to three seasons after cessation of milk supply, or by Fonterra Farmer Custodian Limited (the Custodian). Voting rights in the Company are dependent on milk supply supported by Co-operative shares¹.
CO-OPERATIVE SHARES (THOUSANDS)
Balance at 1 August 2014 1,597,834
Shares issued² 1,260
Shares surrendered –
Balance at 31 July 2015 1,599,094
1 These rights are also attached to vouchers when backed by milk supply (subject to limits).
2 1,260,116 shares with a total value of $7 million were issued under the Dividend Reinvestment Plan during the year ended 31 July 2015.
No shares were issued or surrendered during the year ended 31 July 2014.
The rights attaching to Co-operative shares are set out in Fonterra’s Constitution, available in the ‘About/Our Governance’ section of Fonterra’s website.
Units in the Fonterra Shareholders’ Fund The Custodian holds legal title of Co-operative shares of which the Economic Rights have been sold to the Fund on trust for the benefit of the Fund. At 31 July 2015, 105,480,366 Co-operative shares (31 July 2014: 109,777,717) were legally owned by the Custodian, on trust for the benefit of the Fund.
UNITS (THOUSANDS)
Balance at 1 August 2014 109,778
Units issued 21,906
Units surrendered (26,204)
Balance at 31 July 2015 105,480
Balance at 1 August 2013 107,969
Units issued 13,116
Units surrendered (11,307)
Balance at 31 July 2014 109,778
The rights attaching to units are set out in the Trust Deed constituting the Fonterra Shareholders’ Fund, available in the ‘Financial/Trading Among Farmers’ section of Fonterra’s website.
Capital management and structureThe Board’s objective is to maximise equity holder returns over time by maintaining an optimal capital structure. As part of the key financial risk management activities undertaken by the Group, Trading Among Farmers (TAF) was launched in November 2012 to support the establishment of the Fonterra Shareholders’ Market. The establishment of the Fonterra Shareholders’ Market eliminates redemption risk and provides a permanent capital base for the Co-operative.
The Group provides returns to farmer shareholders through a milk price, and to equity holders through dividends and changes in the Company’s share price.
The Fund is subject to the issue and redemption of units at the discretion of Fonterra and Fonterra’s farmer shareholders. Fonterra has an interest in ensuring the stability of the Fund and has established a Fund Size Risk Management Policy, which requires that the number of units on issue remain within specified limits and that within these limits, the number of units is managed appropriately. Fonterra may use a range of measures to ensure the Fund size remains within the specified limits, including introducing or cancelling a dividend reinvestment plan, operating a unit and/or share repurchase programme and issuing new shares.
NOTES TO THE SUMMARY FINANCIAL STATEMENTS CONTINUEDFOR THE YEAR ENDED 31 JULY 2015
80 | SUMMARY FINANCIAL STATEMENTS
FONTERRA ANNUAL REVIEW 2015
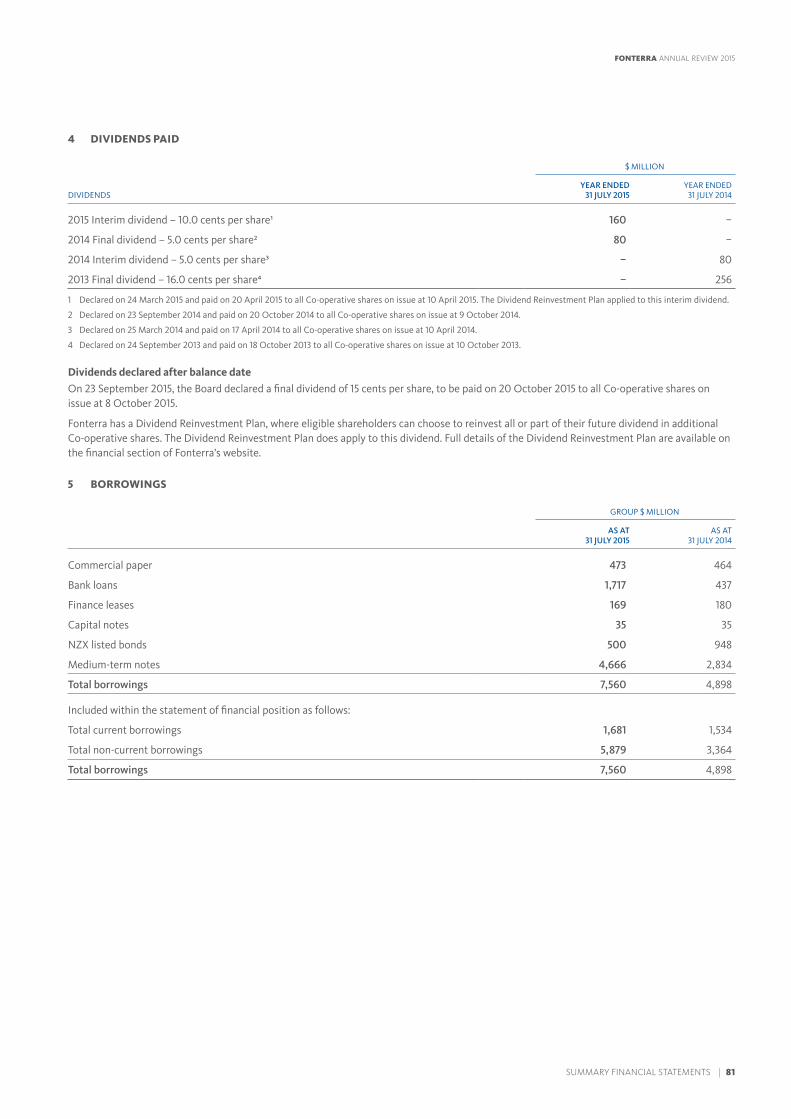
4 DIVIDENDS PAID
$ MILLION
DIVIDENDSYEAR ENDED
31 JULY 2015YEAR ENDED
31 JULY 2014
2015 Interim dividend – 10.0 cents per share¹ 160 –
2014 Final dividend – 5.0 cents per share² 80 –
2014 Interim dividend – 5.0 cents per share³ – 80
2013 Final dividend – 16.0 cents per share⁴ – 256
1 Declared on 24 March 2015 and paid on 20 April 2015 to all Co-operative shares on issue at 10 April 2015. The Dividend Reinvestment Plan applied to this interim dividend.
2 Declared on 23 September 2014 and paid on 20 October 2014 to all Co-operative shares on issue at 9 October 2014.
3 Declared on 25 March 2014 and paid on 17 April 2014 to all Co-operative shares on issue at 10 April 2014.
4 Declared on 24 September 2013 and paid on 18 October 2013 to all Co-operative shares on issue at 10 October 2013.
Dividends declared after balance dateOn 23 September 2015, the Board declared a final dividend of 15 cents per share, to be paid on 20 October 2015 to all Co-operative shares on issue at 8 October 2015.
Fonterra has a Dividend Reinvestment Plan, where eligible shareholders can choose to reinvest all or part of their future dividend in additional Co-operative shares. The Dividend Reinvestment Plan does apply to this dividend. Full details of the Dividend Reinvestment Plan are available on the financial section of Fonterra’s website.
5 BORROWINGS
GROUP $ MILLION
AS AT 31 JULY 2015
AS AT 31 JULY 2014
Commercial paper 473 464
Bank loans 1,717 437
Finance leases 169 180
Capital notes 35 35
NZX listed bonds 500 948
Medium-term notes 4,666 2,834
Total borrowings 7,560 4,898
Included within the statement of financial position as follows:
Total current borrowings 1,681 1,534
Total non-current borrowings 5,879 3,364
Total borrowings 7,560 4,898
SUMMARY FINANCIAL STATEMENTS | 81
FONTERRA ANNUAL REVIEW 2015

5 BORROWINGS CONTINUED
Leverage ratiosThe Board closely monitors the Group’s leverage ratios, which include the gearing ratio and debt coverage ratios (debt payback and interest coverage ratios). The primary debt payback ratios comprise funds from operations divided by economic net interest bearing debt, and economic net interest bearing debt divided by EBITDA. The gearing ratio is calculated as economic net interest bearing debt divided by total capital. Economic net interest bearing debt is calculated in the table below. Total capital is calculated as equity, as presented in the statement of financial position (excluding the cash flow hedge reserve), plus economic net interest bearing debt. The gearing ratio as at 31 July 2015 was 49.7 per cent (31 July 2014: 42.3 per cent). The Group is not subject to externally imposed capital requirements.
Economic net interest bearing debtEconomic net interest bearing debt reflects the effect of debt hedging in place at balance date.
GROUP $ MILLION
AS AT 31 JULY 2015
AS AT 31 JULY 2014
Net interest bearing debt position
Total borrowings 7,560 4,898
Cash and cash equivalents (342) (340)
Interest bearing advances included in other non-current assets (65) (81)
Bank overdraft 39 21
Net interest bearing debt 7,192 4,498
Value of derivatives used to manage changes in hedged risks and other foreign exchange movements on debt (72) 234
Economic net interest bearing debt 7,120 4,732
Liquidity riskThe Group manages its liquidity by retaining cash and marketable securities, the availability of funding from an adequate amount of committed credit facilities and the ability to close out market positions. Fonterra’s funding facilities are reviewed at least annually, which is one of the key financial risk management activities undertaken by the Group to ensure an appropriate maturity profile given the nature of the Group’s business. At balance date the Group had undrawn lines of credit totalling $2,520 million (31 July 2014: $3,215 million).
WORKING CAPITAL
6 OWING TO SUPPLIERS
The Board uses its discretion in establishing the rate at which Fonterra will pay suppliers for the milk supplied over the season. This is referred to as the advance rate. The following table provides a breakdown of the advance payments made to suppliers:
AS AT 31 JULY 2015
AS AT 31 JULY 2014
Final milk price for the season $4.40 $8.40
Of this amount:
– Total advance payments made during the year $4.33 $7.30
– Total owing as at 31 July $0.07 $1.10
Amount advanced during the year as a percentage of the milk price for the season ended 31 May 98% 87%
The total amount owing to suppliers at 31 July 2015 is $159 million (31 July 2014: $1,771 million).
NOTES TO THE SUMMARY FINANCIAL STATEMENTS CONTINUEDFOR THE YEAR ENDED 31 JULY 2015
82 | SUMMARY FINANCIAL STATEMENTS
FONTERRA ANNUAL REVIEW 2015

INVESTMENTS
7 BUSINESS COMBINATIONS
On 1 August 2014, the Group acquired additional voting shares in DPA Brazil (Dairy Partners Americas Brasil Limitada – from 50 per cent to 51 per cent, with Nestlé holding the balance) and DPA Venezuela (Lacven Corporation – 25 per cent to 60 per cent, with a local partner holding the balance). These equity accounted investments became consolidated subsidiaries from that date.
On 1 October 2014, the Group’s equity accounted investments in Ecuador (Ecuajugos S.A.) and DPA’s milk powder manufacturing business (DPA Manufacturing Holdings Limited) were sold to Nestlé.
The fair value of consideration transferred at the acquisition date is:
GROUP $ MILLION
BRAZIL VENEZUELA TOTAL
Carrying value of existing interest 106 23 129
Gain/(loss) on remeasuring to fair value¹ 165 (6) 159
Fair value of existing interest 271 17 288
Cash paid 2 – 2
Fair value of consideration transferred 273 17 290
Represented by:
Share of identifiable acquired net assets 97 41 138
Goodwill on acquisition 176 – 176
Gain on bargain purchase² – (24) (24)
Total 273 17 290
1 The gain/(loss) on remeasuring the previous equity accounted interests is determined with reference to the fair value determined by independent experts.
2 Gain on bargain purchase arises on the consolidation of Venezuela into the Group. The business was no longer a strategic fit for another owner, and therefore the Group was able to negotiate a favourable purchase price for the additional 35 per cent.
The cash inflow on acquisition is:
GROUP $ MILLION
BRAZIL VENEZUELA TOTAL
Net cash acquired with subsidiary 9 17 26
Cash paid (2) – (2)
Net consolidated inflow on acquisition 7 17 24
The contribution of the acquired entities to the Group’s revenue and profit for the year ended 31 July 2015 is:
GROUP $ MILLION
BRAZIL VENEZUELA TOTAL
Revenue 495 673 1,168
Profit after tax 4 45 49
The Group has recorded a one-off gain relating to the business combinations, sale of equity accounted investments and the settlement of other relationships with the parties.
GROUP $ MILLION
BRAZIL VENEZUELA OTHER TOTAL
Fair value gain/(loss) revaluing existing interest 165 (6) – 159
Foreign currency translation reserve transferred to income statement (39) (15) (24) (78)
Gain on bargain purchase – 24 – 24
Gain on sale of equity accounted investment – – 5 5
Other items – – 19 19
Total gain¹ 126 3 – 129
1 The gain is included in other operating income ($141 million), cost of goods sold ($4 million expense) and other operating expenses ($8 million expense).
SUMMARY FINANCIAL STATEMENTS | 83
FONTERRA ANNUAL REVIEW 2015

7 BUSINESS COMBINATIONS CONTINUED
The fair values of the major classes of identifiable assets acquired and liabilities assumed at the acquisition date are:
GROUP $ MILLION
BRAZIL VENEZUELA TOTAL
Trade and other receivables 159 64 223
Property, plant and equipment 111 83 194
Intangible assets 328 12 340
Other assets 115 59 174
Total assets 713 218 931
Trade and other payables (119) (95) (214)
Borrowings (193) (37) (230)
Deferred tax liabilities (112) (6) (118)
Other liabilities¹ (101) (10) (111)
Total liabilities (525) (148) (673)
Fair value of identifiable net assets 188 70 258
1 Provisions of $80 million have been recognised for contingencies relating to tax and legal matters arising in the normal course of business. The timing and amount of the future obligations are uncertain, as they are contingent on the outcome of a number of administrative and judicial proceedings. The amount recognised has been based on management’s best estimate of the amount that will be required to settle the obligations. The outcome of most of the obligations is not expected to be determined within the next year and therefore the provisions are classified as non-current.
8 ASSETS HELD FOR SALE
Darnum manufacturing plant – AustraliaOn 16 March 2015, Fonterra acquired an 18.8 per cent shareholding in Beingmate Baby & Child Food Co., Ltd. (Beingmate). In conjunction with this investment, Fonterra and Beingmate confirmed their intention to establish a partnership to purchase the Darnum manufacturing plant in Australia. The sale of the plant to the partnership is subject to regulatory approvals and is expected to complete within one year of balance date. Accordingly the Darnum manufacturing plant is classified as held for sale at 31 July 2015.
9 EQUITY ACCOUNTED INVESTMENTS
The Group’s significant equity accounted investments are listed below. The ownership interest in these entities is 50 per cent or less and the Group is not considered to exercise a controlling interest.
OWNERSHIP INTERESTS (%)
EQUITY ACCOUNTED INVESTEE NAME¹ COUNTRY OF INCORPORATION²AS AT
31 JULY 2015AS AT
31 JULY 2014
DMV Fonterra Excipients GmbH & Co KG Germany 50 50
Dairy Industries (Jamaica) Limited Jamaica 50 50
DairiConcepts, L.P. USA 50 50
DairiConcepts Management, L.L.C. USA 50 50
Dairy Partners Americas Brasil Limitada3 Brazil – 50
Lacven Corporation3 Barbados – 25
Beingmate Baby & Child Food Co., Ltd China 18.8 –
International Nutritionals Limited New Zealand 50 50
1 Except for International Nutritionals Limited, all investees have balance dates of 31 December. International Nutritionals Limited has the same balance date as the Group.2 This is also the principle place of business.3 On 1 August 2014, the Group purchased additional voting equity interests in DPA Brazil (Dairy Partners Americas Brasil Limitada) and DPA Venezuela (Lacven Corporation).
These entities became consolidated subsidiaries from that date. Please refer to Note 7 for further information.
NOTES TO THE SUMMARY FINANCIAL STATEMENTS CONTINUEDFOR THE YEAR ENDED 31 JULY 2015
84 | SUMMARY FINANCIAL STATEMENTS
FONTERRA ANNUAL REVIEW 2015

FINANCIAL RISK MANAGEMENT
10 FINANCIAL RISK MANAGEMENT
OverviewGlobal financial and commodity markets remain volatile. The nature of Fonterra’s business is such that managing risks in the foreign exchange, interest rate, commodity, credit and liquidity markets is critical to minimising the volatility in returns to equity holders.
The Board has overall responsibility for the establishment and oversight of the Group’s financial risk management framework. The Board:
– has established financial risk management policies and procedures to identify, analyse and, where appropriate, manage the financial risks faced by the Group;
– has approved a Treasury Policy that covers appropriate financial risk limits and controls (including, but not limited to, delegated authority levels and authorised use of various financial instruments); and
– monitors financial risks and adherence to approved limits.
The Group’s overall financial risk management programme focuses primarily on maintaining a prudent financial risk profile that provides flexibility to implement the Group’s strategies, while ensuring the optimisation of the return on assets. Financial risk management is centralised, which supports compliance with the financial risk management policies and procedures set by the Board. Fonterra manages financial risk, including foreign exchange risk, interest rate risk, credit risk, liquidity risk and commodity price risk.
Key financial risk management activities
Capital structure The Board’s objective is to maximise equity holder returns over time by maintaining an optimal capital structure. For further detail refer to Note 3.
Bank facility renewal Fonterra’s banking facilities are reviewed at least annually, which is one of the key financial risk management activities undertaken by the Group to ensure an appropriate maturity profile. For further detail refer to Note 5.
Leverage ratiosThe Board closely monitors the Group’s leverage ratios, which include the gearing ratio and debt coverage ratios (debt payback and interest coverage ratios). For further detail refer to Note 5.
OTHER
11 TAXATION
Taxation – income statementThe total taxation credit in the income statement is summarised as follows:
GROUP $ MILLION
31 JULY 2015 31 JULY 2014
Current tax expense 97 54
Prior period adjustments to current tax – (2)
Deferred tax movements:
– Origination and reversal of temporary differences (179) (94)
Tax credit (82) (42)
SUMMARY FINANCIAL STATEMENTS | 85
FONTERRA ANNUAL REVIEW 2015

11 TAXATION CONTINUED
The taxation charge that would arise at the standard rate of corporation tax in New Zealand is reconciled to the tax expense/(credit) as follows:
GROUP $ MILLION
31 JULY 2015 31 JULY 2014
Profit before tax 424 137
Prima facie tax expense at 28% 119 38
Add/(deduct) tax effect of:
– Effect of tax rates in foreign jurisdictions (31) (13)
– Non-deductible expenses/additional assessable income 44 31
– Non-assessable income/additional deductible expenses (71) (36)
– Prior year over provision – (2)
Tax expense before distributions and deferred tax 61 18
Effective tax rate before distributions and deferred tax¹ 14.4% 13.1%
Tax effect of distributions to farmer shareholders (107) (38)
Tax credit before deferred tax (46) (20)
Effective tax rate before deferred tax¹ (10.8)% (14.6)%
Add/(deduct) tax effect of:
– Origination and reversal of other temporary differences 2 (45)
– Losses of overseas Group entities (recognised)/not recognised (38) 23
Tax credit (82) (42)
Effective tax rate1 (19.3)% (30.7)%
Imputation credits
Imputation credits available for use in subsequent reporting periods 20 20
Tax losses
Gross tax losses available for which no deferred tax asset has been recognised 55 201
1 The effective tax rate is the tax charge on the face of the income statement expressed as a percentage of the profit before tax.
12 CONTINGENT LIABILITIES, PROVISIONS AND COMMITMENTS
Contingent liabilitiesIn the normal course of business, Fonterra, its subsidiaries and equity accounted investees, are exposed to claims and legal proceedings that may in some cases result in costs to the Group.
In early August 2013, Fonterra publicly announced a potential food safety issue with three batches of Whey Protein Concentrate (WPC80) produced at the Hautapu manufacturing site and initiated a precautionary product recall.
In late August 2013, the New Zealand Government confirmed that the Clostridium samples found in WPC80 were not Clostridium botulinum and were not toxigenic, meaning the consumers of products containing the relevant batches of WPC80 were never in danger from Clostridium botulinum.
In January 2014, Danone formally initiated legal proceedings against Fonterra in the High Court of New Zealand and separate Singapore arbitration proceedings against Fonterra in relation to the WPC80 precautionary recall. The New Zealand High Court proceedings have been stayed pending completion of the Singapore arbitration. The hearing of the arbitration is scheduled to occur in February 2016.
Based on current information available and the claims made to date in both proceedings, Fonterra will vigorously defend its position in these proceedings. Uncertainty exists regarding the outcome of the proceedings. Fonterra has provided $11 million (31 July 2014: $11 million) in respect of the Danone claims, which represents the maximum contractual liability to Danone.
The Directors believe that these proceedings have been adequately provided for and disclosed by the Group and that there are no additional claims or legal proceedings in respect of this matter that are pending at the date of these financial statements that require provision or disclosure.
The Group has no other contingent liabilities as at 31 July 2015 (31 July 2014: nil).
NOTES TO THE SUMMARY FINANCIAL STATEMENTS CONTINUEDFOR THE YEAR ENDED 31 JULY 2015
86 | SUMMARY FINANCIAL STATEMENTS
FONTERRA ANNUAL REVIEW 2015

13 NET TANGIBLE ASSETS PER SECURITY
GROUP
AS AT 31 JULY 2015
AS AT 31 JULY 2014
Net tangible assets per security¹
$ per listed debt security on issue 5.62 3.55
$ per equity instrument on issue 2.12 2.34
Listed debt securities on issue (million) 603 1,053
Equity instruments on issue (million) 1,599 1,598
1 Net tangible assets represents total assets less total liabilities less intangible assets.
SUMMARY FINANCIAL STATEMENTS | 87
FONTERRA ANNUAL REVIEW 2015

88 | INDEPENDENT AUDITORS’ REPORT
TO THE SHAREHOLDERS OF FONTERRA CO-OPERATIVE GROUP LIMITED
REPORT ON THE SUMMARY FINANCIAL STATEMENTS
We have audited the accompanying Group summary financial statements of Fonterra Co-operative Group Limited (“the Company”) on pages 70 to 87 which comprise the statement of financial position as at 31 July 2015, the income statement, statement of comprehensive income, statement of changes in equity and cash flow statement for the year then ended, and the notes to the financial statements, which are derived from the audited financial statements of the Group for the year ended 31 July 2015. The Group comprises the Company and the entities it controlled at 31 July 2015 or from time to time during the financial year.
The summary financial statements do not contain all the disclosures required for full financial statements under generally accepted accounting practice in New Zealand. Reading the summary financial statements, therefore, is not a substitute for reading the audited financial statements of Fonterra Co-operative Group Limited.
Directors’ Responsibility for the Summary Financial Statements
The Directors are responsible on behalf of the Company for the preparation of the summary financial statements in accordance with FRS-43: Summary Financial Statements (“FRS-43”).
Auditors’ Responsibility
Our responsibility is to express an opinion on the summary financial statements based on our procedures, which were conducted in accordance with International Standard on Auditing (New Zealand) 810: Engagements to Report on Summary Financial Statements.
Our firm carries out other assignments for the Group in relation to other advisory, other assurance and attestation services. Partners and employees of our firm may deal with the Group on normal terms within the ordinary course of trading activities of the Group. These matters have not impaired our independence as auditors of the Group.
Opinion on the Group’s Financial Statements
Our audit of the financial statements for the year ended 31 July 2015 was completed on 23 September 2015 and our unmodified opinion was issued on that date.
Opinion on the Summary Financial Statements
In our opinion, the summary financial statements have been correctly derived from the audited financial statements of Fonterra Co-operative Group Limited for the year ended 31 July 2015 and are consistent, in all material respects, with those financial statements, in accordance with FRS-43.
RESTRICTION ON DISTRIBUTION OR USE
This report has been prepared for inclusion in the Fonterra Annual Review report. We disclaim any responsibility for reliance on this report or the amounts included in the summary financial statements, for any purpose other than that for which they were prepared.
Chartered AccountantsAuckland 23 September 2015
INDEPENDENT AUDITORS’ REPORT FOR THE YEAR ENDED 31 JULY 2015
FONTERRA ANNUAL REVIEW 2015

STATUTORY INFORMATION | 89
STATUTORY INFORMATION FOR THE YEAR ENDED 31 JULY 2015
CURRENT CREDIT RATING STATUS
Standard & Poor’s long term rating for Fonterra is A with a rating outlook of CreditWatch negative. Fitch’s long and short term default rating is AA- with a rating outlook of stable. Retail Bonds have been rated the same as the Company’s long term rating by both Standard & Poor’s and Fitch. Capital Notes which are subordinate to other Fonterra debt issued are rated A- by Standard & Poor’s and A+ by Fitch.
EXCHANGE RULINGS AND WAIVERS
NZX Limited (NZX) has ruled that Capital Notes do not constitute “equity securities” under the NZX Main Board/Debt Markets Listing Rules (Rules). This means that where Capital Notes are quoted on NZX’s Debt Market (NZDX), the Company is not required to comply with certain Rules which apply to an issuer of quoted equity securities.
NZX has granted waivers from NZDX Rule 11.1.1 to enable Fonterra to decline to accept or register transfers of Capital Notes or Retail Bonds (NZDX listed debt securities FCGHA, FCG020 and FCG030) if such transfer would result in the transferor holding or continuing to hold Capital Notes or Retail Bonds with a face value or principal amount of less than $5,000 or if such transfer is for an amount of less than $1,000 or not a multiple thereof. The effect of these waivers is that the minimum holding amount in respect of the Capital Notes and Retail Bonds will at all times be $5,000 in aggregate and that Retail Bonds can only be transferred in multiples of $1,000.
NZX has also granted a waiver from NZDX Rule 5.2.3 in respect of Retail Bonds FCG020 and FCG030 to enable these Retail Bonds to be quoted on the NZDX market even though they did not meet the requirement that at least 500 members of the public held at least 25 per cent of the Retail Bonds being issued.
NZX TRADING HALTS
On 10 March 2015, NZX Regulation (NZXR) placed a trading halt on the following Fonterra Co-operative Group Limited securities: FCG, FCG010, FCG020 and FCGHA. This halt was part of an industry-wide action taken by NZXR to place all listed issuers within the dairy industry on a trading halt as a result of the infant formula contamination threat. Following the public release of a Ministry for Primary Industries announcement regarding the contamination threat, NZXR then lifted the trading halt on Fonterra Co-operative Group Limited and other industry participants’ securities. The trading halt was in place between 3.21pm and 4.17pm on 10 March 2015.
FONTERRA ANNUAL REVIEW 2015

90 | FIVE YEAR SUMMARY
FIVE YEAR SUMMARYFOR THE YEAR ENDED 31 JULY 2015
JULY 2015 JULY 2014 JULY 2013 JULY 2012 JULY 2011
SHAREHOLDER SUPPLIER RETURNS
Payout
Farmgate Milk Price (per kgMS)1 4.40 8.40 5.84 6.08 7.60
Dividend (per share) 0.25 0.10 0.32 0.32 0.30
Cash payout2 4.65 8.50 6.16 6.40 7.90
Retentions (per share)3 0.04 – 0.14 0.10 0.25
OPERATING PERFORMANCE
Average commodity prices (US$ per MT FOB)
Whole Milk Powder4 2,639 4,824 3,394 3,359 3,606
Skim Milk Powder4 2,552 4,504 3,625 3,285 3,321
Butter4 3,027 3,920 3,550 3,546 4,344
Cheese5 3,477 4,706 4,124 3,498 4,285
Average NZD/USD spot exchange rate applying throughout the year6 0.76 0.84 0.82 0.80 0.77
Fonterra’s average NZD/USD conversion rate7 0.79 0.81 0.80 0.77 0.72
Revenue ($ million)
Ingredients and other revenue 12,144 17,748 13,926 14,824 14,623
Consumer revenue 6,701 4,527 4,717 4,945 5,248
Total revenue 18,845 22,275 18,643 19,769 19,871
Dairy ingredients manufactured in New Zealand (000s MT) 2,753 2,519 2,312 2,353 2,143
Total ingredients sales volume (000s MT)8 2,982 3,052 2,765 2,660 2,486
Segment earnings ($ million)9
Global Ingredients and Operations 662 280 480 477 419
Oceania (143) 31 93 218 278
Asia 192 50 207 182 193
Greater China (5) 30 – – –
Latin America 256 111 137 124 121
Eliminations (20) 1 20 (14) 17
Segment earnings 942 503 937 987 1,028
Normalisation adjustments 32 – 65 41 (23)
Normalised segment earnings 974 503 1,002 1,028 1,005
Profit after tax attributable to shareholders ($ million) 466 157 718 609 754
Earnings per share10 0.29 0.10 0.44 0.41 0.53
1 From the beginning of the 2009 season the Farmgate Milk Price has been determined by the Board. In making that determination, the Board takes into account the Farmgate Milk Price calculated in accordance with the principles set out in the Farmgate Milk Price Manual which is independently audited.
2 Average Payout for a 100 per cent share-backed supplier.3 Retentions are calculated as net profit after tax attributable to Co-operative shareholders at 31 July divided by the number of shares at 31 May, less dividend per share.4 Source: Fonterra Farmgate Milk Price Statement representing the weighted-average United States Dollars (USD) contract prices of Reference Commodity Products.5 Source: Oceania Export Series, Agricultural Marketing Service, US Department of Agriculture.6 Average spot exchange rate is the average of the daily spot rates for the financial period.7 Fonterra’s average conversion rate is the rate that Fonterra has converted net United States dollar receipts into New Zealand dollars based on the hedge cover in place.8 For the year ended 31 July 2014, the total ingredients sales volume has been restated to reflect Fonterra’s strategic platforms. Figures for the years ended 31 July 2013 and
earlier have not been restated.9 Represents segment earnings before unallocated finance income, finance costs and tax. For the years ended 31 July 2015 and 2014, Greater China has been disclosed
separately in alignment with the disclosures in the segment note. For the years ended 31 July 2013 and earlier, Greater China was part of Asia. The year ended 31 July 2014 has been restated to reflect changes to the organisation of business units that occurred in the year ended 31 July 2015. The year ended 31 July 2012 has been restated to reflect changes to the organisation of business units within reported segments which occurred in the year ended 31 July 2013. The year ended 31 July 2011 has been restated to reflect changes to the organisation of business units within reported segments which occurred in the year ended 31 July 2012.
10 On 27 February 2013, Fonterra announced a non-cash bonus issue of one share for every 40 shares held. The bonus issue increased the number of shares on issue by 40.4 million. The record date for the bonus issue was 12 April 2013 and the issue date was 24 April 2013. Earnings per share for the years ended 31 July 2012 and 31 July 2011 have been restated as if the bonus issue was effective at the beginning of the periods presented.
FONTERRA ANNUAL REVIEW 2015

FIVE YEAR SUMMARY | 91
JULY 2015 JULY 2014 JULY 2013 JULY 2012 JULY 2011
CAPITAL EMPLOYED ($ million)
Total assets employed 18,315 15,529 14,373 15,117 15,530
Average net assets11 12,918 10,860 11,135 10,900 10,772
Total equity 6,659 6,534 6,748 6,655 6,541
Equity excluding cash flow hedge reserve 7,196 6,452 6,830 6,592 6,025
Net interest bearing debt 7,192 4,498 4,227 3,833 3,766
Economic net interest bearing debt12 7,120 4,732 4,467 4,229 4,331
Return on net assets11 7.5% 4.6% 9.0% 9.4% 9.3%
Headline debt to debt plus equity ratio13 50.0% 41.1% 38.2% 36.8% 38.5%
Economic debt to debt plus equity ratio13 49.7% 42.3% 39.6% 39.1% 41.8%
JULY 2015 JULY 2014 JULY 2013 JULY 2012 JULY 2011
STAFF EMPLOYED
Total staff employed (000s, permanent full time equivalents) 22.0 18.2 17.5 17.3 16.8
New Zealand 11.9 11.4 11.2 11.0 10.8
Overseas 10.1 6.8 6.3 6.3 6.0
JULY 2015 JULY 2014 JULY 2013 JULY 2012 JULY 2011
SEASON STATISTICS14
Total NZ milk collected (million litres) 18,143 17,932 16,673 16,951 15,427
Highest daily volume collected (million litres) 89.7 87.1 84.8 81.2 76.8
NZ shareholder supply milk solids collected (million kgMS) 1,520 1,533 1,424 1,463 1,320
NZ contract supply milk solids collected (million kgMS) 94 51 39 30 26
NZ milk solids collected (million kgMS) 1,614 1,584 1,463 1,493 1,346
Total number of shareholders at 31 May 10,753 10,721 10,668 10,578 10,485
Total number of sharemilkers at 31 May 3,379 3,398 3,449 3,595 3,928
Total number of shares at 31 May (million) 1,599 1,598 1,598 1,433 1,377
11 Return on net assets (RONA) is derived by dividing normalised EBIT (as reported in financial statements) by 13 month average net assets (excluding net debt and deferred tax).
12 Economic net interest bearing debt reflects the effect of debt hedging in place at balance date.
13 Headline debt to debt plus equity ratio is before taking account of the effect of debt hedging. Economic debt to debt plus equity includes the effect of debt hedging.
14 All season statistics are based on the 12 month milk season of 1 June–31 May.
FONTERRA ANNUAL REVIEW 2015

92 | NON-GAAP MEASURES
NON-GAAP MEASURES
Fonterra uses several non-GAAP measures when discussing financial performance. For further details and definitions of non-GAAP measures used by Fonterra, refer to the glossary on page 93. These are non-GAAP measures and are not prepared in accordance with NZ IFRS.
Management believes that these measures provide useful information as they provide valuable insight on the underlying performance of the business. They may be used internally to evaluate the underlying performance of business units and to analyse trends. These measures are not uniformly defined or utilised by all companies. Accordingly, these measures may not be comparable with similarly titled measures used by other companies. Non-GAAP financial measures should not be viewed in isolation nor considered as a substitute for measures reported in accordance with NZ IFRS.
Reconciliations for the NZ IFRS measures to certain non-GAAP measures referred to by Fonterra are detailed below.
Reconciliation from the NZ IFRS measure of profit for the period to Fonterra’s normalised EBITDA
GROUP $ MILLION
31 JULY 2015 31 JULY 2014
Profit for the period 506 179
Add: Depreciation 453 437
Add: Amortisation 108 101
Add: Net finance costs 518 366
Less: Taxation credit (82) (42)
Total EBITDA 1,503 1,041
Add: Impairment of assets in Australia 108 –
Add: Restructuring and redundancy provisions 33 –
Add: Time value of options 20 –
Less: Gain on Latin America realignment (129) –
Total normalisation adjustments 32 –
Normalised EBITDA 1,535 1,041
Reconciliation from the NZ IFRS measure of profit for the period to Fonterra’s normalised EBIT
GROUP $ MILLION
31 JULY 2015 31 JULY 2014
Profit for the period 506 179
Add: Net finance costs 518 366
Less: Taxation credit (82) (42)
Total EBIT 942 503
Add: Normalisation adjustments (as detailed above) 32 –
Total normalised EBIT 974 503
Reconciliation from the NZ IFRS measure of profit for the period to Fonterra’s normalised earnings per share
GROUP $ MILLION
31 JULY 2015 31 JULY 2014
Profit for the period 506 179
Add: Normalisation adjustments (as detailed above) 32 –
Less: Tax on normalisation adjustments (42) –
Total normalised earnings 496 179
Less: Share attributable to non-controlling interests (40) (22)
Net normalised earnings attributable to equity holders of the Parent 456 157
Weighted average number of shares (thousands of shares) 1,598,464 1,597,834
Normalised earnings per share ($) 0.29 0.10
FONTERRA ANNUAL REVIEW 2015
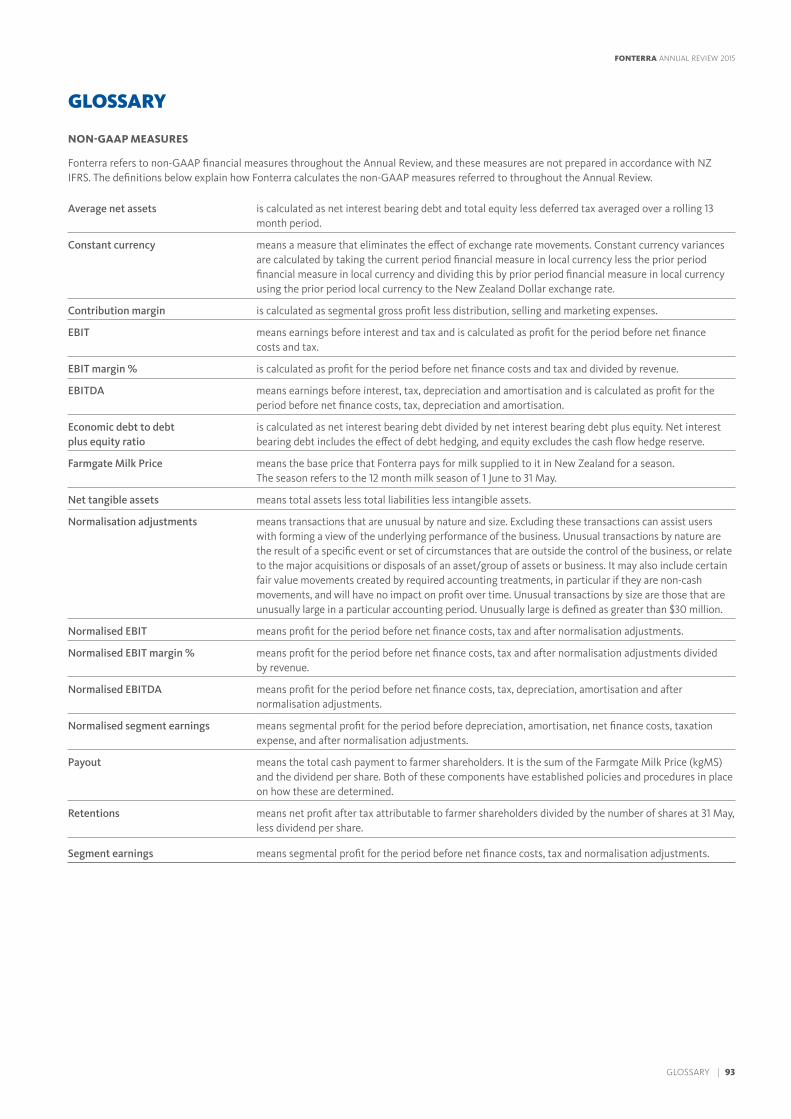
GLOSSARY | 93
GLOSSARY
NON-GAAP MEASURES
Fonterra refers to non-GAAP financial measures throughout the Annual Review, and these measures are not prepared in accordance with NZ IFRS. The definitions below explain how Fonterra calculates the non-GAAP measures referred to throughout the Annual Review.
Average net assets is calculated as net interest bearing debt and total equity less deferred tax averaged over a rolling 13 month period.
Constant currency means a measure that eliminates the effect of exchange rate movements. Constant currency variances are calculated by taking the current period financial measure in local currency less the prior period financial measure in local currency and dividing this by prior period financial measure in local currency using the prior period local currency to the New Zealand Dollar exchange rate.
Contribution margin is calculated as segmental gross profit less distribution, selling and marketing expenses.
EBIT means earnings before interest and tax and is calculated as profit for the period before net finance costs and tax.
EBIT margin % is calculated as profit for the period before net finance costs and tax and divided by revenue.
EBITDA means earnings before interest, tax, depreciation and amortisation and is calculated as profit for the period before net finance costs, tax, depreciation and amortisation.
Economic debt to debt plus equity ratio
is calculated as net interest bearing debt divided by net interest bearing debt plus equity. Net interest bearing debt includes the effect of debt hedging, and equity excludes the cash flow hedge reserve.
Farmgate Milk Price means the base price that Fonterra pays for milk supplied to it in New Zealand for a season. The season refers to the 12 month milk season of 1 June to 31 May.
Net tangible assets means total assets less total liabilities less intangible assets.
Normalisation adjustments means transactions that are unusual by nature and size. Excluding these transactions can assist users with forming a view of the underlying performance of the business. Unusual transactions by nature are the result of a specific event or set of circumstances that are outside the control of the business, or relate to the major acquisitions or disposals of an asset/group of assets or business. It may also include certain fair value movements created by required accounting treatments, in particular if they are non-cash movements, and will have no impact on profit over time. Unusual transactions by size are those that are unusually large in a particular accounting period. Unusually large is defined as greater than $30 million.
Normalised EBIT means profit for the period before net finance costs, tax and after normalisation adjustments.
Normalised EBIT margin % means profit for the period before net finance costs, tax and after normalisation adjustments divided by revenue.
Normalised EBITDA means profit for the period before net finance costs, tax, depreciation, amortisation and after normalisation adjustments.
Normalised segment earnings means segmental profit for the period before depreciation, amortisation, net finance costs, taxation expense, and after normalisation adjustments.
Payout means the total cash payment to farmer shareholders. It is the sum of the Farmgate Milk Price (kgMS) and the dividend per share. Both of these components have established policies and procedures in place on how these are determined.
Retentions means net profit after tax attributable to farmer shareholders divided by the number of shares at 31 May, less dividend per share.
Segment earnings means segmental profit for the period before net finance costs, tax and normalisation adjustments.
FONTERRA ANNUAL REVIEW 2015
94 | DIRECTORY
FONTERRA BOARD OF DIRECTORS
John Wilson
Malcolm Bailey
Ian Farrelly
Leonie Guiney
Simon Israel
David Jackson
David MacLeod
John Monaghan
Sir Ralph Norris
Blue Read
Nicola Shadbolt
Michael Spaans
John Waller
FONTERRA MANAGEMENT TEAM
Theo Spierings
Lukas Paravicini
Jacqueline Chow
Maury Leyland
Johan Priem
Robert Spurway
Alex Turnbull
Kelvin Wickham
REGISTERED OFFICE
Fonterra Co-operative Group Limited Private Bag 92032 Auckland 1010 New Zealand
Fonterra Centre 9 Princes Street Auckland Central Auckland 1010 New Zealand
Phone +64 9 374 9000 Fax +64 9 374 9001
AUDITORS
PricewaterhouseCoopers Level 22, PwC Tower 188 Quay Street Auckland 1142 New Zealand
FARMER SHAREHOLDER AND SUPPLIER SERVICES
Freephone 0800 65 65 68
DIRECTORY
FONTERRA SHARES AND FSF UNITS REGISTRY
Computershare Investor Services Limited Private Bag 92119 Auckland 1142 New Zealand
Level 2, 159 Hurstmere Road Takapuna Auckland 0622 New Zealand
CAPITAL NOTES REGISTRY
Link Market Services Limited PO Box 91976 Auckland 1142 New Zealand
Level 7, Zurich House 21 Queen Street Auckland Central 1010 New Zealand
INVESTOR RELATIONS ENQUIRIES
Phone +64 9 374 9000 [email protected]
www.fonterra.com
FONTERRA ANNUAL REVIEW 2015


This document is printed on an environmentally responsible paper produced using elemental chlorine free (ECF)FSC® certified mixed source pulp, sourced from well managed and legally harvested forests, and manufactured under the strict ISO14001 environmental management system.